


Abstract
As a key tectonic zone formed by the India–Eurasia collision, the eastern Tibetan Plateau has complex crustal structures and intense tectonic activity. Its crustal stability is closely linked to regional geohazards and the safety of major engineering projects. This study assessed crustal stability using nine multi-source datasets, including terrestrial gravity, Bouguer gravity anomalies, seismic data, active faults, terrain indicators, and annual precipitation. A hybrid weighting framework coupling the Analytic Hierarchy Process (AHP) and CRITIC method was established, and factor analysis was further adopted to cross-verify the rationality of index weights. Moderately unstable and unstable zones appear as alternating bands with distinct linear extensions. These unstable areas are mainly distributed around Jiuquan–Zhangye–Wuwei, Xining–Haidong, Yushu–Garzê, Mianyang, and Chengdu. Statistically, stable, moderately stable, moderately unstable, and unstable zones account for 20.74%, 35.47%, 28.78%, and 15.01%, respectively. The results provide a scientific reference for regional planning and infrastructure site selection in tectonically active regions.
1. Introduction
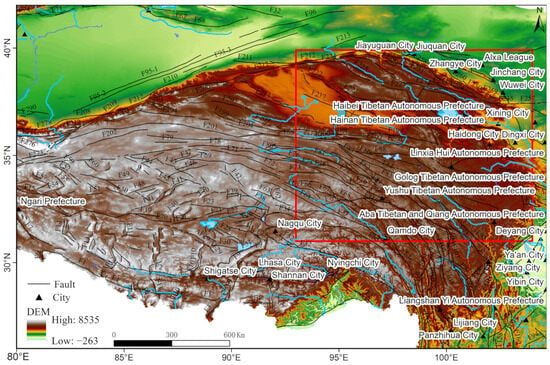
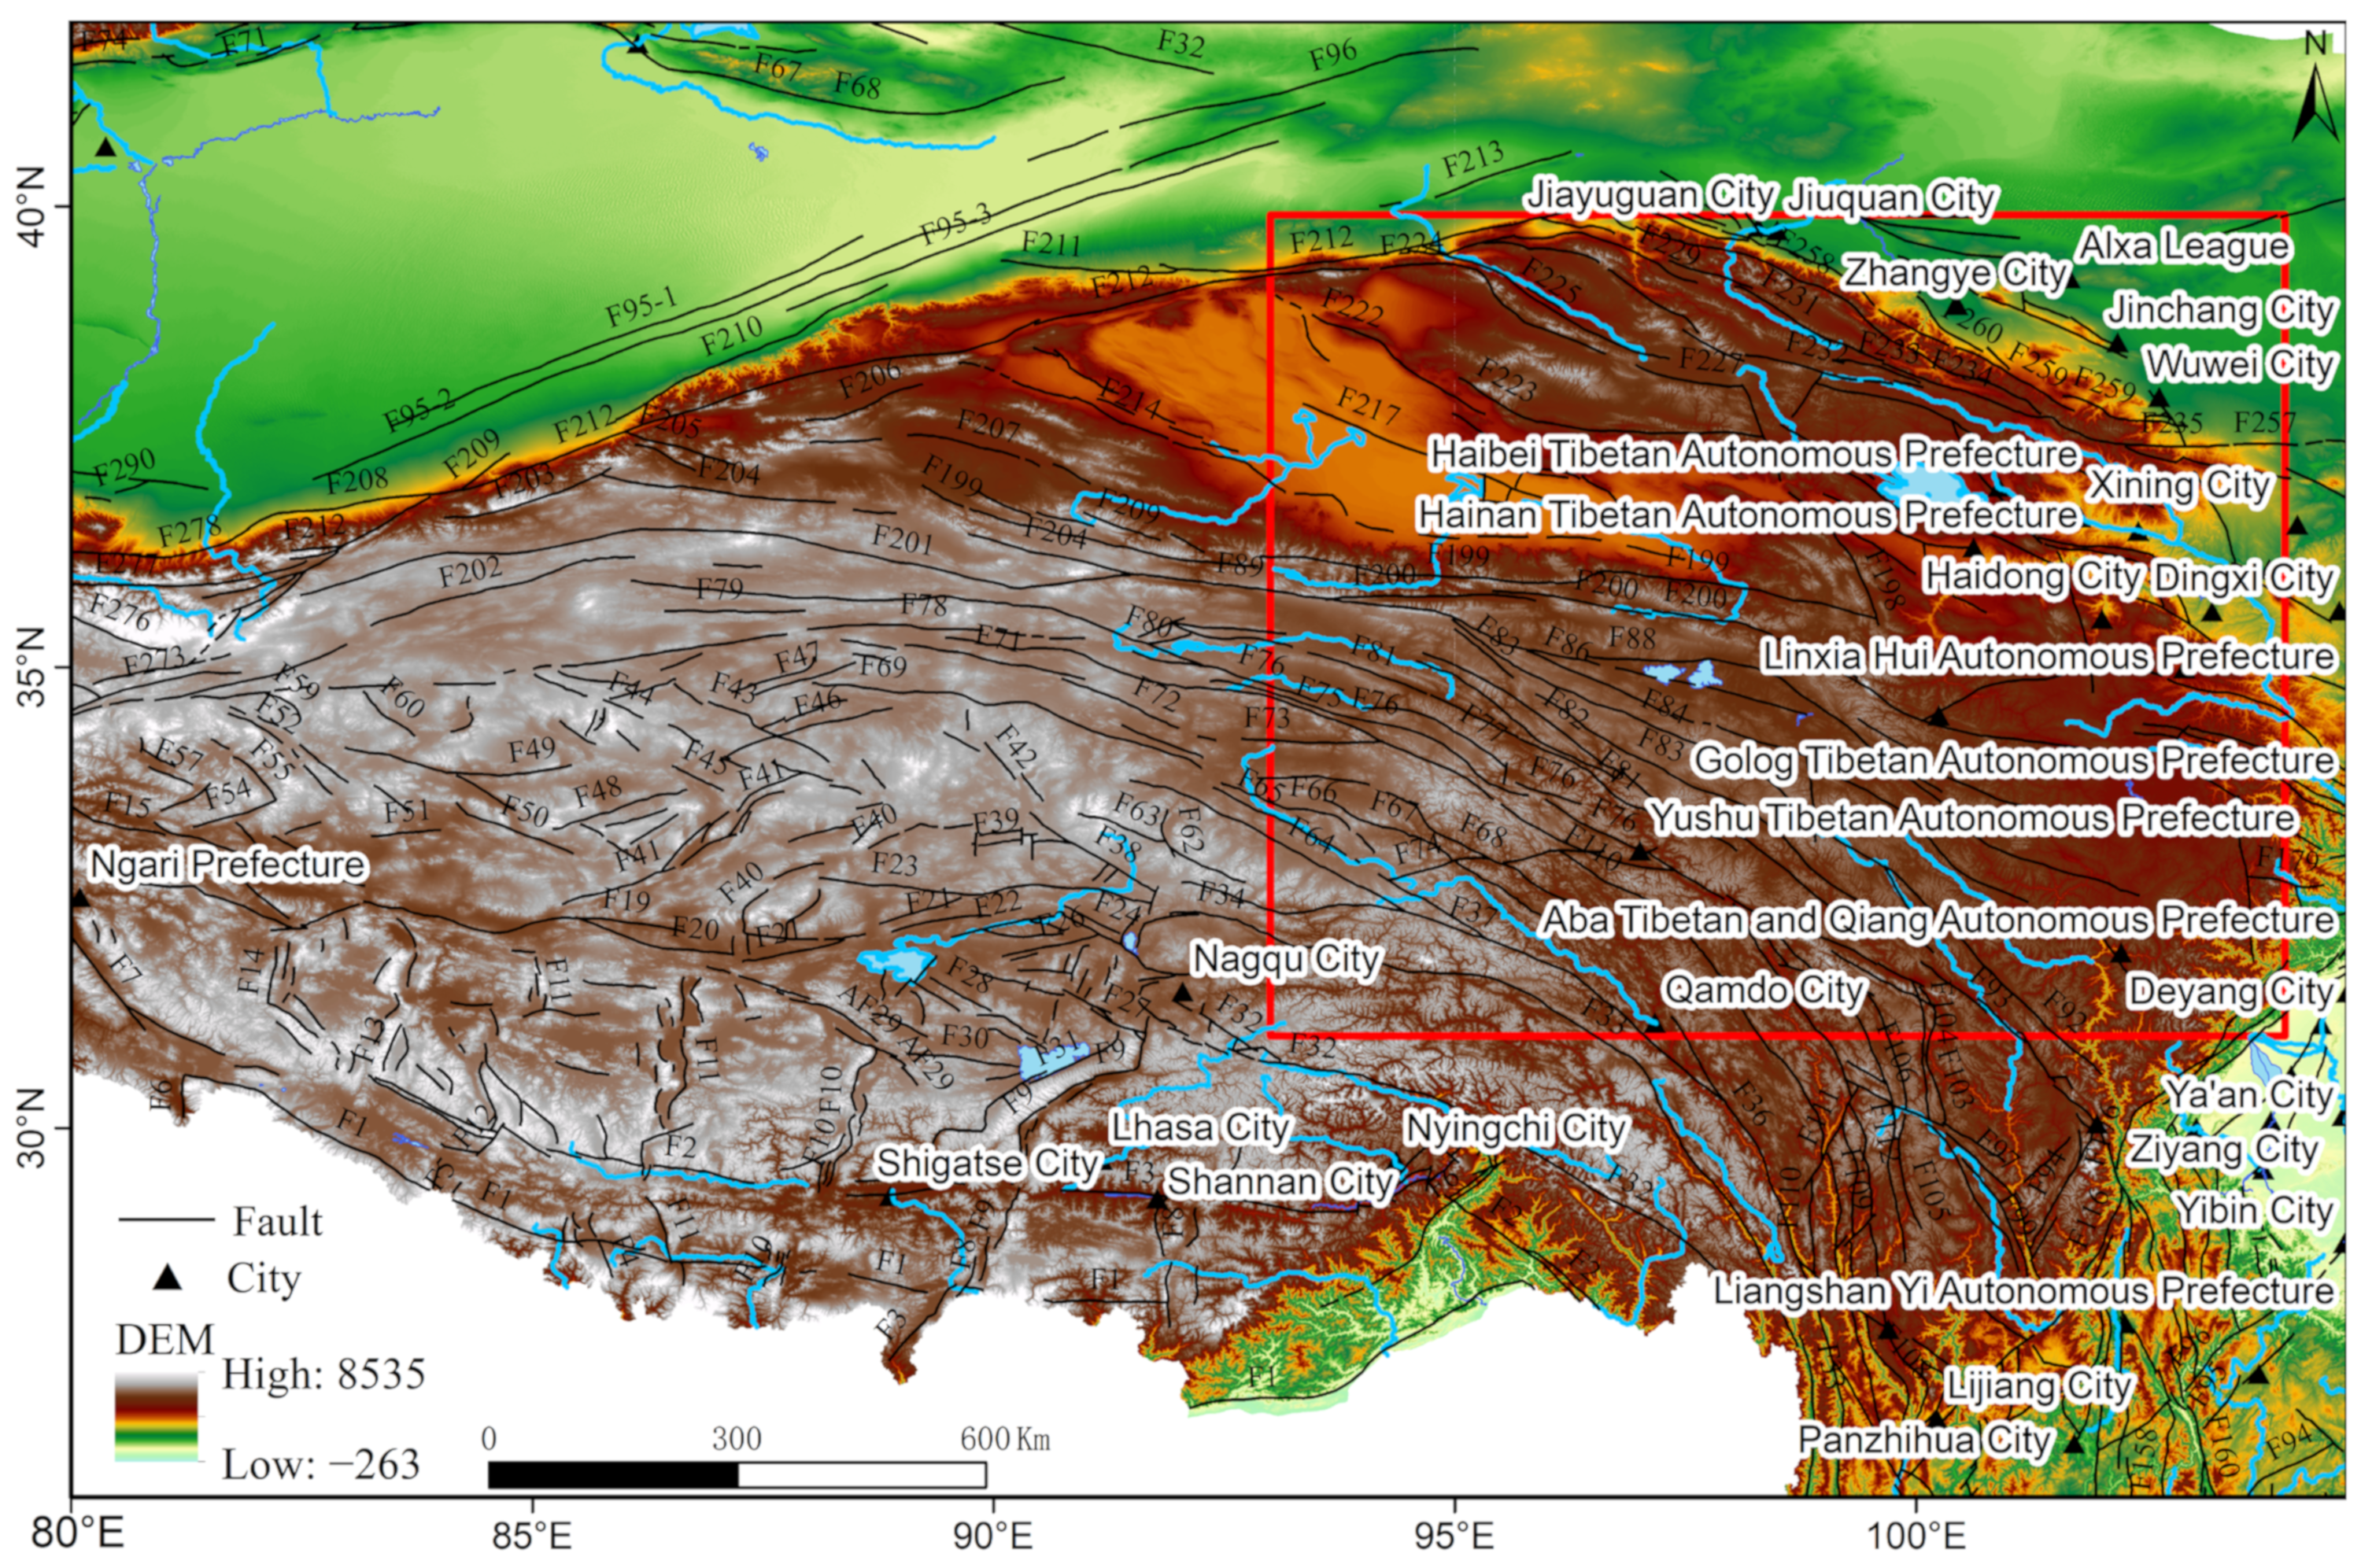
The eastern Tibetan Plateau is situated in a key tectonic transition zone formed by the collision between the Indian and Eurasian plates (Figure 1). Since the Cenozoic, this region has undergone significant crustal thickening, active faulting, and block movements, resulting in intense tectonic deformation. Driven by continuous tectonic activity, the region experiences a high frequency of geological hazards, including earthquakes, landslides, and debris flows [1,2,3]. The complex tectonic background leads to pronounced spatial variations in regional crustal stability. This stability status is directly linked to regional ecological security, the layout of major engineering projects, and the prevention and control of geohazard risks [4,5,6,7]. Therefore, it is of great significance to conduct a comprehensive crustal stability assessment in the eastern Tibetan Plateau.
Figure 1.
Topographic map of the study area. The blue box denotes the scope of the study area.
Monitoring and assessing crustal stability is a continuously evolving field in Earth sciences. This evaluation process requires the integration of multidisciplinary and multi-type data. Traditionally, regional crustal stability assessments have incorporated various factors, including geological structures, geophysical characteristics, geochemical indicators, hydrogeological conditions, geomorphological forms, seismicity, crustal deformation, and environmental geology [5,8,9,10]. In recent years, spatial surveying and satellite geodetic technologies have undergone transformative development. Modern spatial observation methods, such as GNSS positioning and satellite gravimetry, have matured significantly. Leveraging their advantages of all-weather capability, global coverage, high precision, and high spatiotemporal resolution, these techniques have produced a wealth of high-quality modern geodetic results [6,11,12,13,14,15]. The massive multi-source datasets generated from long-term continuous observations can finely capture surface deformation processes, the spatiotemporal evolution of regional gravity fields, and gravity/deformation anomaly signals related to crustal stress adjustments. These datasets provide critical data and technical support for regional seismic monitoring and early warning, crustal stability evaluation, and seismic hazard analysis [16,17,18,19].
Accordingly, this study integrates long-term geological, seismic, and geodetic data, adopts a hybrid subjective–objective weighting approach, establishes a multidimensional monitoring and evaluation framework, and quantitatively assesses crustal stability in the eastern Tibetan Plateau. Due to the unique environmental conditions of the plateau, satellite gravimetry is effectively applied at regional scales but remains limited in capturing localized tectonic details. In contrast, terrestrial gravity directly reflects the crustal density structure with higher spatial resolution and observational accuracy, which enables the precise detection of subtle deformations along local fault zones and effectively compensates for the limitations of satellite gravimetry in small-scale monitoring [20,21,22,23,24,25,26,27,28]. By introducing terrestrial gravity as an evaluation factor, this study not only addresses previous issues of missing local tectonic information and data homogeneity but also enhances the precision and timeliness of surface change monitoring, resulting in a more refined stability assessment. Restricted by the acquisition conditions of multi-source observational datasets, various types of monitoring data generally face the inherent difficulty in fully unifying their spatial resolutions and observation time scales, which constitutes an unavoidable data interference factor in current quantitative regional stability assessments. Consequently, this systematic evaluation of crustal stability in the eastern Tibetan Plateau provides a scientific basis for regional development, engineering planning, and the site selection of major infrastructure projects.
2. Materials and Methods
2.1. Study Data
This study selects the eastern region of the Tibetan Plateau as the assessment area for crustal stability. Nine evaluation indicators were incorporated: terrestrial gravity, earthquake magnitude, peak ground acceleration (PGA), Bouguer gravity anomalies, active faults, river systems, slope gradient, and average annual precipitation.
The Bouguer gravity anomaly data were obtained from the 1:4,000,000-scale National Bouguer Gravity Anomaly Map of China, compiled by the China Earthquake Administration in 2011. The earthquake catalog data of seismic magnitudes, covering the period from 1900 to 2024, were obtained from the China Earthquake Networks Center (https://www.cenc.ac.cn/). The dataset of the tectonic uplift rate field for the Qinghai–Xizang Plateau was derived from the National Tibetan Plateau Data Center (https://data.tpdc.ac.cn/). PGA values were extracted and vectorized from the China Seismic Ground Motion Parameter Zoning Map (1:4,000,000) using the ArcGIS Desktop 10.8 (Esri, Redlands, CA, USA) platform. Terrestrial gravity data were sourced from the Xi’an Earthquake Administration. Active fault data were derived from the foundational datasets of the Fifth Generation Seismic Zoning Map (1:2,500,000). Precipitation data were integrated from the 1 km resolution monthly precipitation dataset of China (1901–2022) provided by the Loess Plateau Subcenter, National Earth System Science Data Center, National Science & Technology Infrastructure of China (http://loess.geodata.cn). Specifically, this study adopted annual precipitation data for the period 2018–2022. Furthermore, the degree of river system development was processed using Euclidean distance buffer analysis. The areas were classified and assigned values based on their vertical distance from the water systems. For this study, river data of fourth-order and above were selected for analysis.
2.2. Evaluation Methods
2.2.1. Factor Analysis
To accurately evaluate regional crustal stability, it is essential to consider multiple factors to ensure reliable and comprehensive results. This study employs statistical analysis to determine the weights of various factors while minimizing inter-factor correlations. Subsequently, a multi-factor weighted overlay approach is utilized to assess crustal stability across the study area. Furthermore, this study integrates the CRITIC and the subjective weighting method for evaluation, with results cross-validated against those derived from the factor analysis method.
The evaluation process begins by classifying influencing factors, grouping highly correlated and closely related factors into the same category while maintaining a low correlation between different categories. Each category functions as a common factor, enabling the quantitative evaluation of regional geological stability by expressing the total influence as the sum of linear functions of common and specific factors [9]. Let all observed variables be defined as , where represents the total number of variables, and the following relationship holds:
where
- represents the mean of ;
- represents the common factors, where m is the total number of factors;
- is the specific factor;
- denotes the correlation coefficient between and
Then we standardize such that it has a mean of 0 and variance of 1.
The next step is to generate the correlation matrix. We define A as as the factor-loading matrix with dimension , = [], where i = 1, 2, …, p, j = 1, 2, …, m. The correlation matrix R can be expressed as
We calculate the eigenvalues and their corresponding standardized orthogonal eigenvectors of the correlation matrix , are solved to determine the common factors. The factor loadings between the observed variable and the common factor can be calculated using the principal component method:
Once are obtained, the factor loading matrix can be constructed.
The factor-score coefficients are calculated by the regression method, in which the factor-loading matrix is substituted to solve the factor score coefficient matrix
Compute the factor scores using the following formula:
2.2.2. CRITIC Weighting Method
The CRITIC weighting method is an objective weighting technique. It simultaneously takes into account the contrast intensity of each indicator and the conflict degree between different indicators, comprehensively revealing the interrelations among evaluation factors. Accordingly, this method is applicable to weight quantification of multiple influencing factors for crustal stability assessment. The detailed calculation steps of the CRITIC method are given as follows:
The original matrix A is standardized:
For negative indicators, the min–max normalization formula is written as
For positive indicators, the normalization is
where and denote the standardized value of positive and negative evaluation indicators; is the raw value of sample for indicator . Max() and min() represent the maximum and minimum values of the -th indicator across all samples.
Calculate the variability of each evaluation indicator:
where denotes the standard deviation of the -th evaluation indicator; represents the mean value of the -th indicator.
The Pearson correlation coefficient between conflicting indicators is calculated as
Quantify the inter-criteria conflict coefficient using the correlation coefficients:
where is the correlation coefficient between the -th and -th evaluation indicators; stands for the conflict degree of the -th indicator.
Compute the objective weight of each indicator. First, the comprehensive information content of the -th indicator is defined as
Then the objective weight is obtained via normalization:
where is the objective weight of the -th evaluation indicator; represents the comprehensive information content of the -th indicator.
To integrate expert geological knowledge with data-driven objectivity, a hybrid weighting framework combining the Analytical Hierarchy Process (AHP) and CRITIC is proposed. Evaluation indicators are divided into two subsets for targeted weighting:
Prioritized Indicators: Key indicators with dominant tectonic significance (e.g., fault activity, peak ground acceleration, tectonic velocity, seismic activity density) are assigned subjective weights via AHP, reflecting expert consensus and emphasizing their critical role in crustal stability assessment.
Residual Indicators: For the remaining indicators, objective weights are derived using the CRITIC to eliminate subjective bias and leverage the inherent information dispersion within the datasets.
To reconcile the two weighting schemes, a proportional correction is applied:
Let denote the sum of subjective weights assigned to prioritized indicators via AHP.
Let represent the sum of objective weights of residual indicators calculated by the CRITIC.
A correction coefficient is defined as
The final combined weight of each indicator is obtained by scaling the CRITIC-derived weight with :
3. Results
3.1. Spatial Distribution Characteristics of Multi-Source Geospatial Indicators
3.1.1. Deep Geophysical Features
Deep-seated geophysical fields, including gravity anomalies, deep faults, and crustal structures, are critical factors governing crustal stability. Regional Bouguer gravity anomalies arise from variations in underground rock density, geological structures, and morphological changes, reflecting the integrated effects of subsurface materials.
Densely spaced Bouguer gravity contour zones represent sharp horizontal gravity gradient belts, which serve as the primary indicator for identifying deep-seated faults. In deep fault zones, these contours form dense, band-like patterns. Conversely, regions with gentle gradients indicate poorly developed deep crustal fractures. Consequently, gravity gradient zones are closely associated with deep faults and seismic belts. Generally, regions with higher gravity anomaly gradients experience more intense endogenic geological activity, which corresponds to poorer crustal stability.
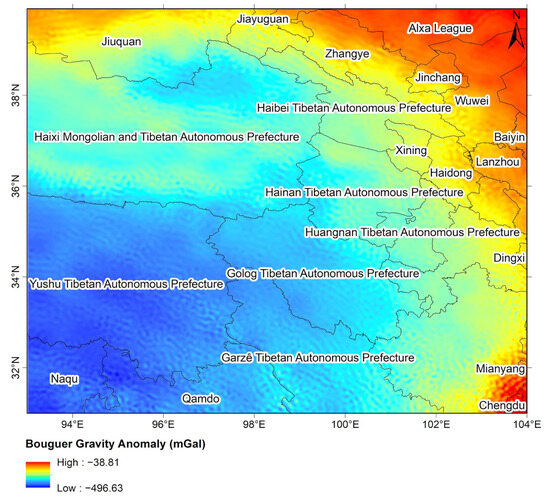
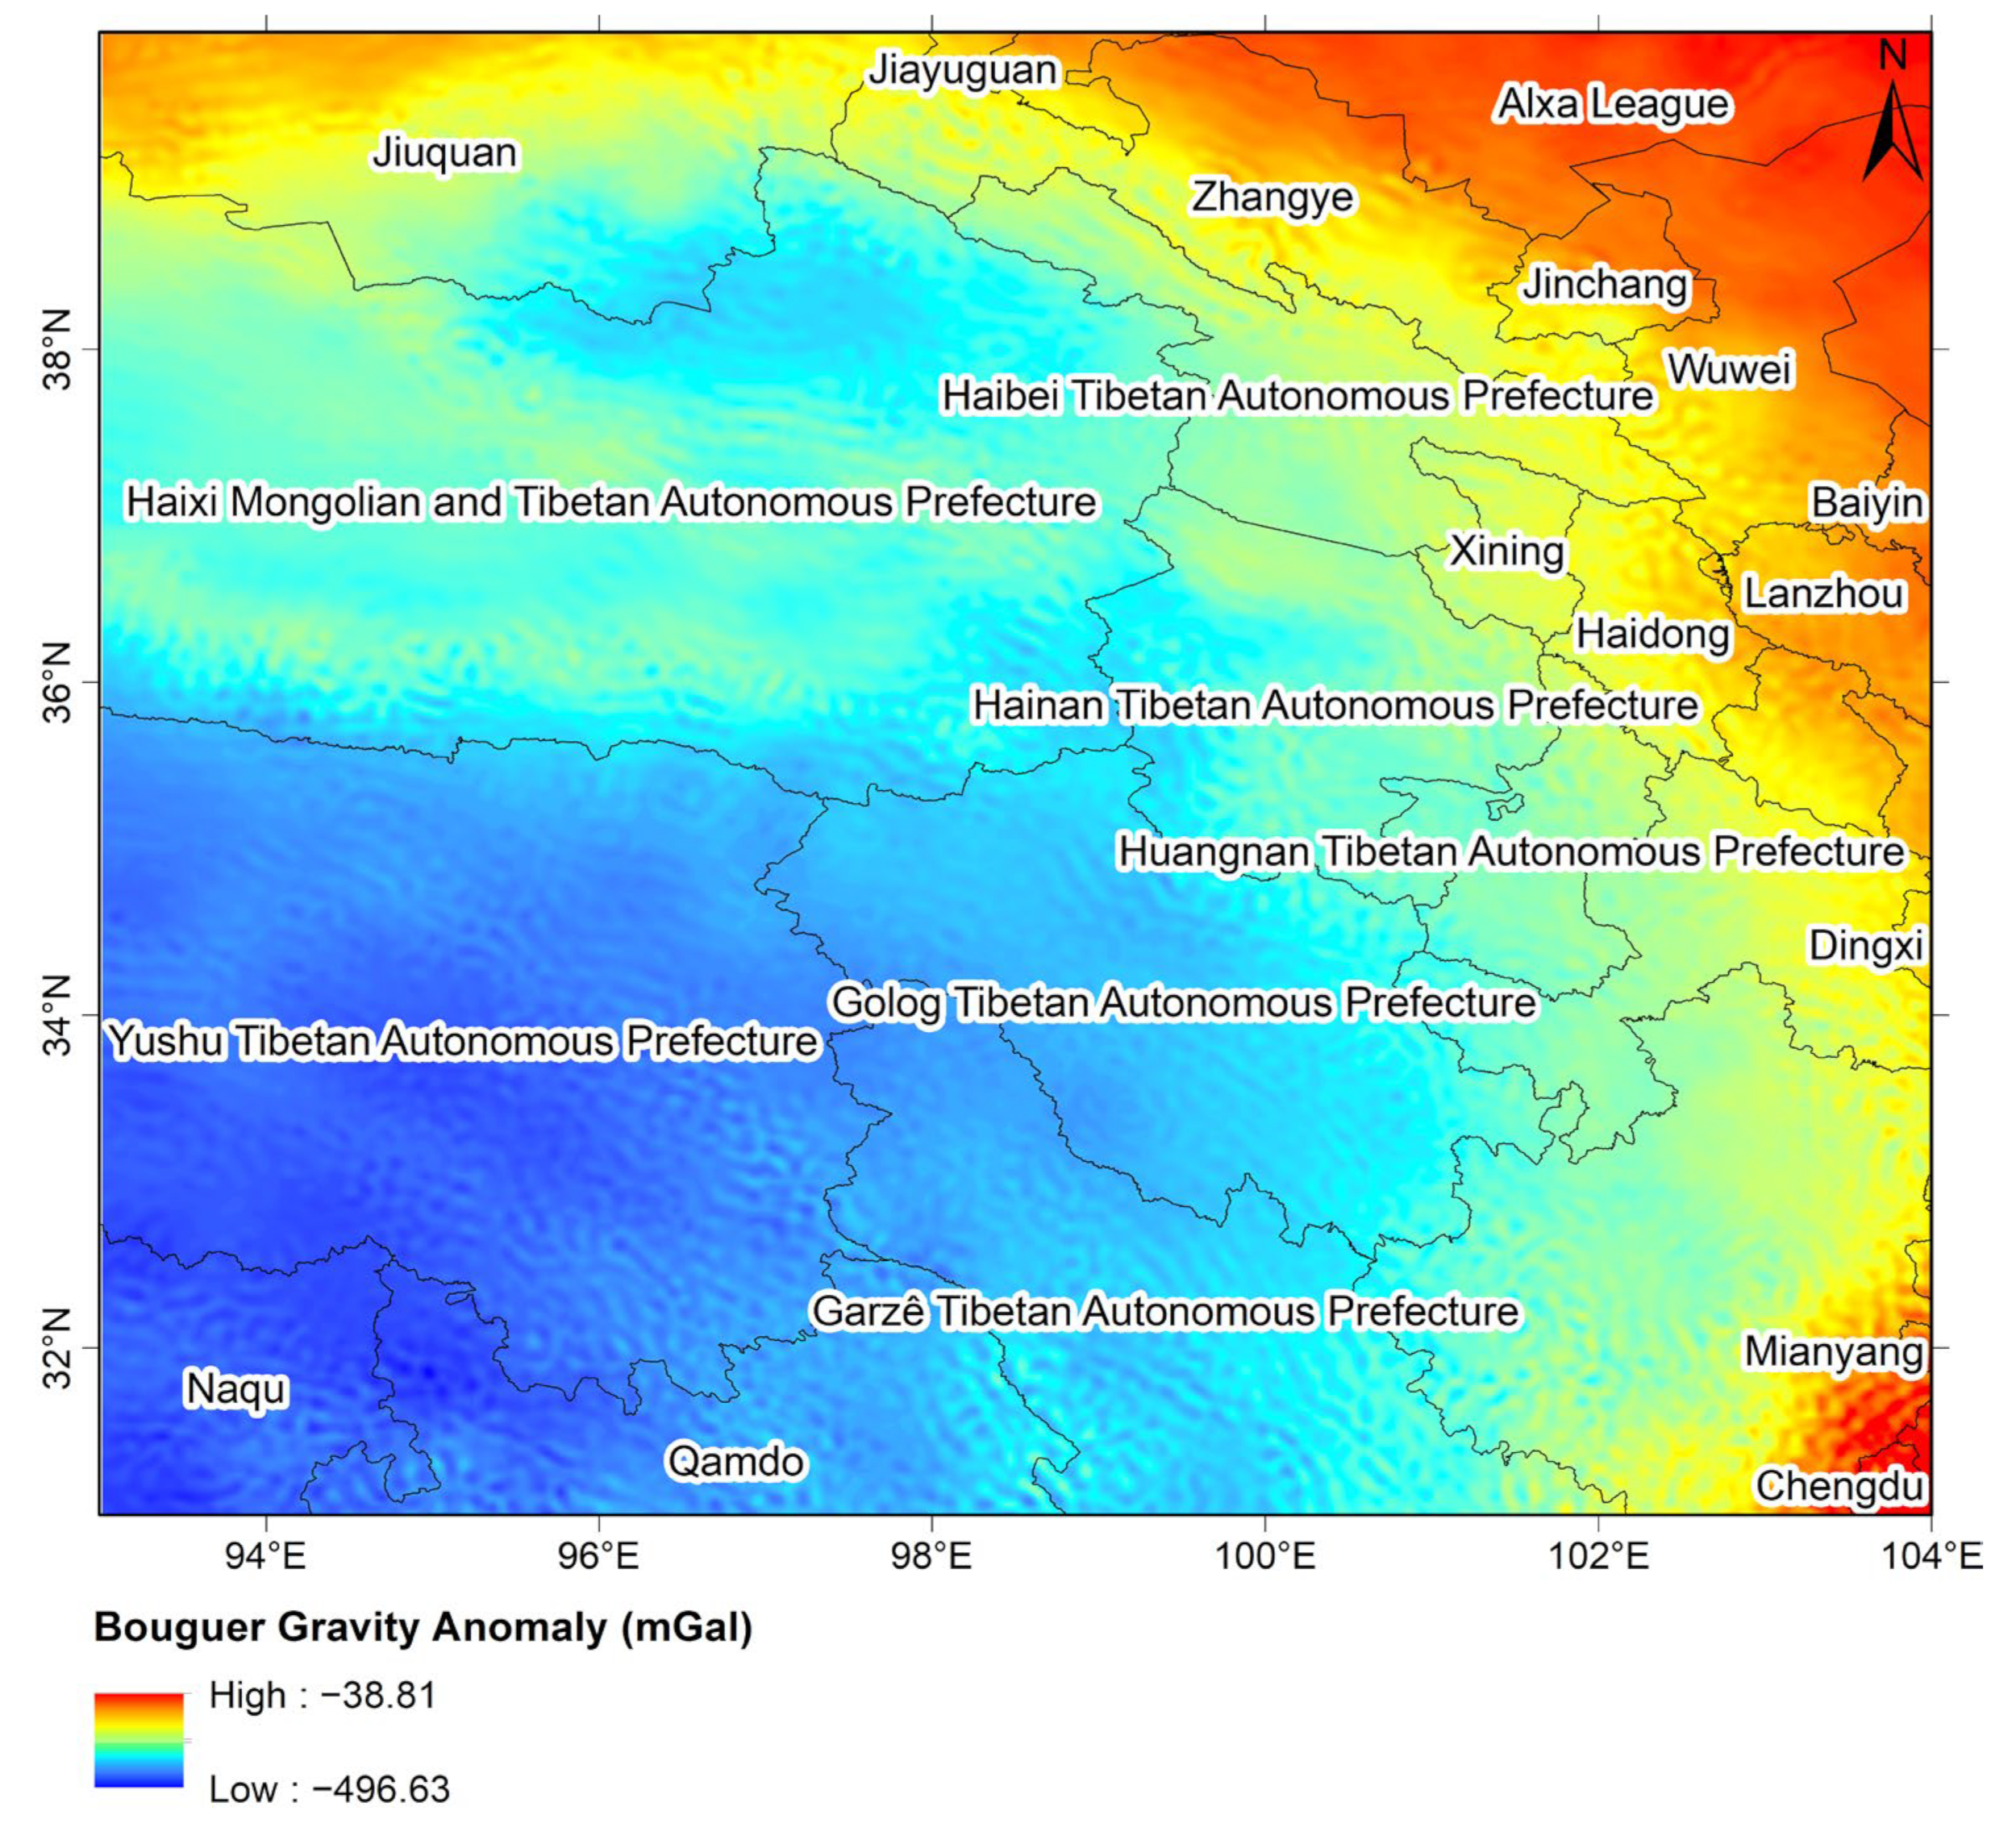
The distribution map of Bouguer gravity anomalies in the northeastern Tibetan Plateau shows values ranging from −496.63 to −38.81 mGal (Figure 2). Spatially, the anomalies exhibit a “high in the north, low in the south” characteristic.
Figure 2.
Spatial distribution of Bouguer gravity anomalies in the northeastern Tibetan Plateau. Gravity values are measured in mGal, and continuous-gradient colors are applied with red for high-gravity areas and blue for low-gravity areas.
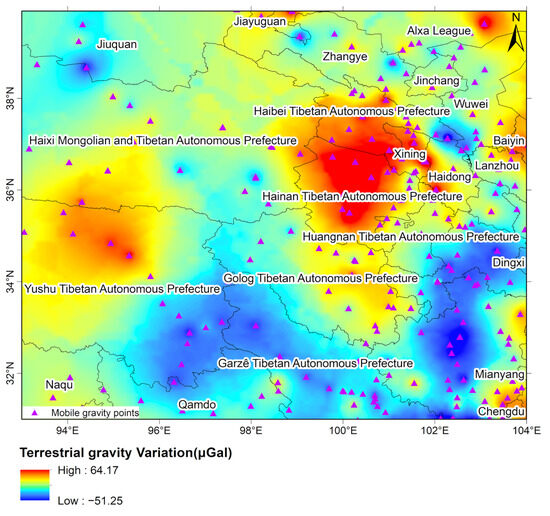
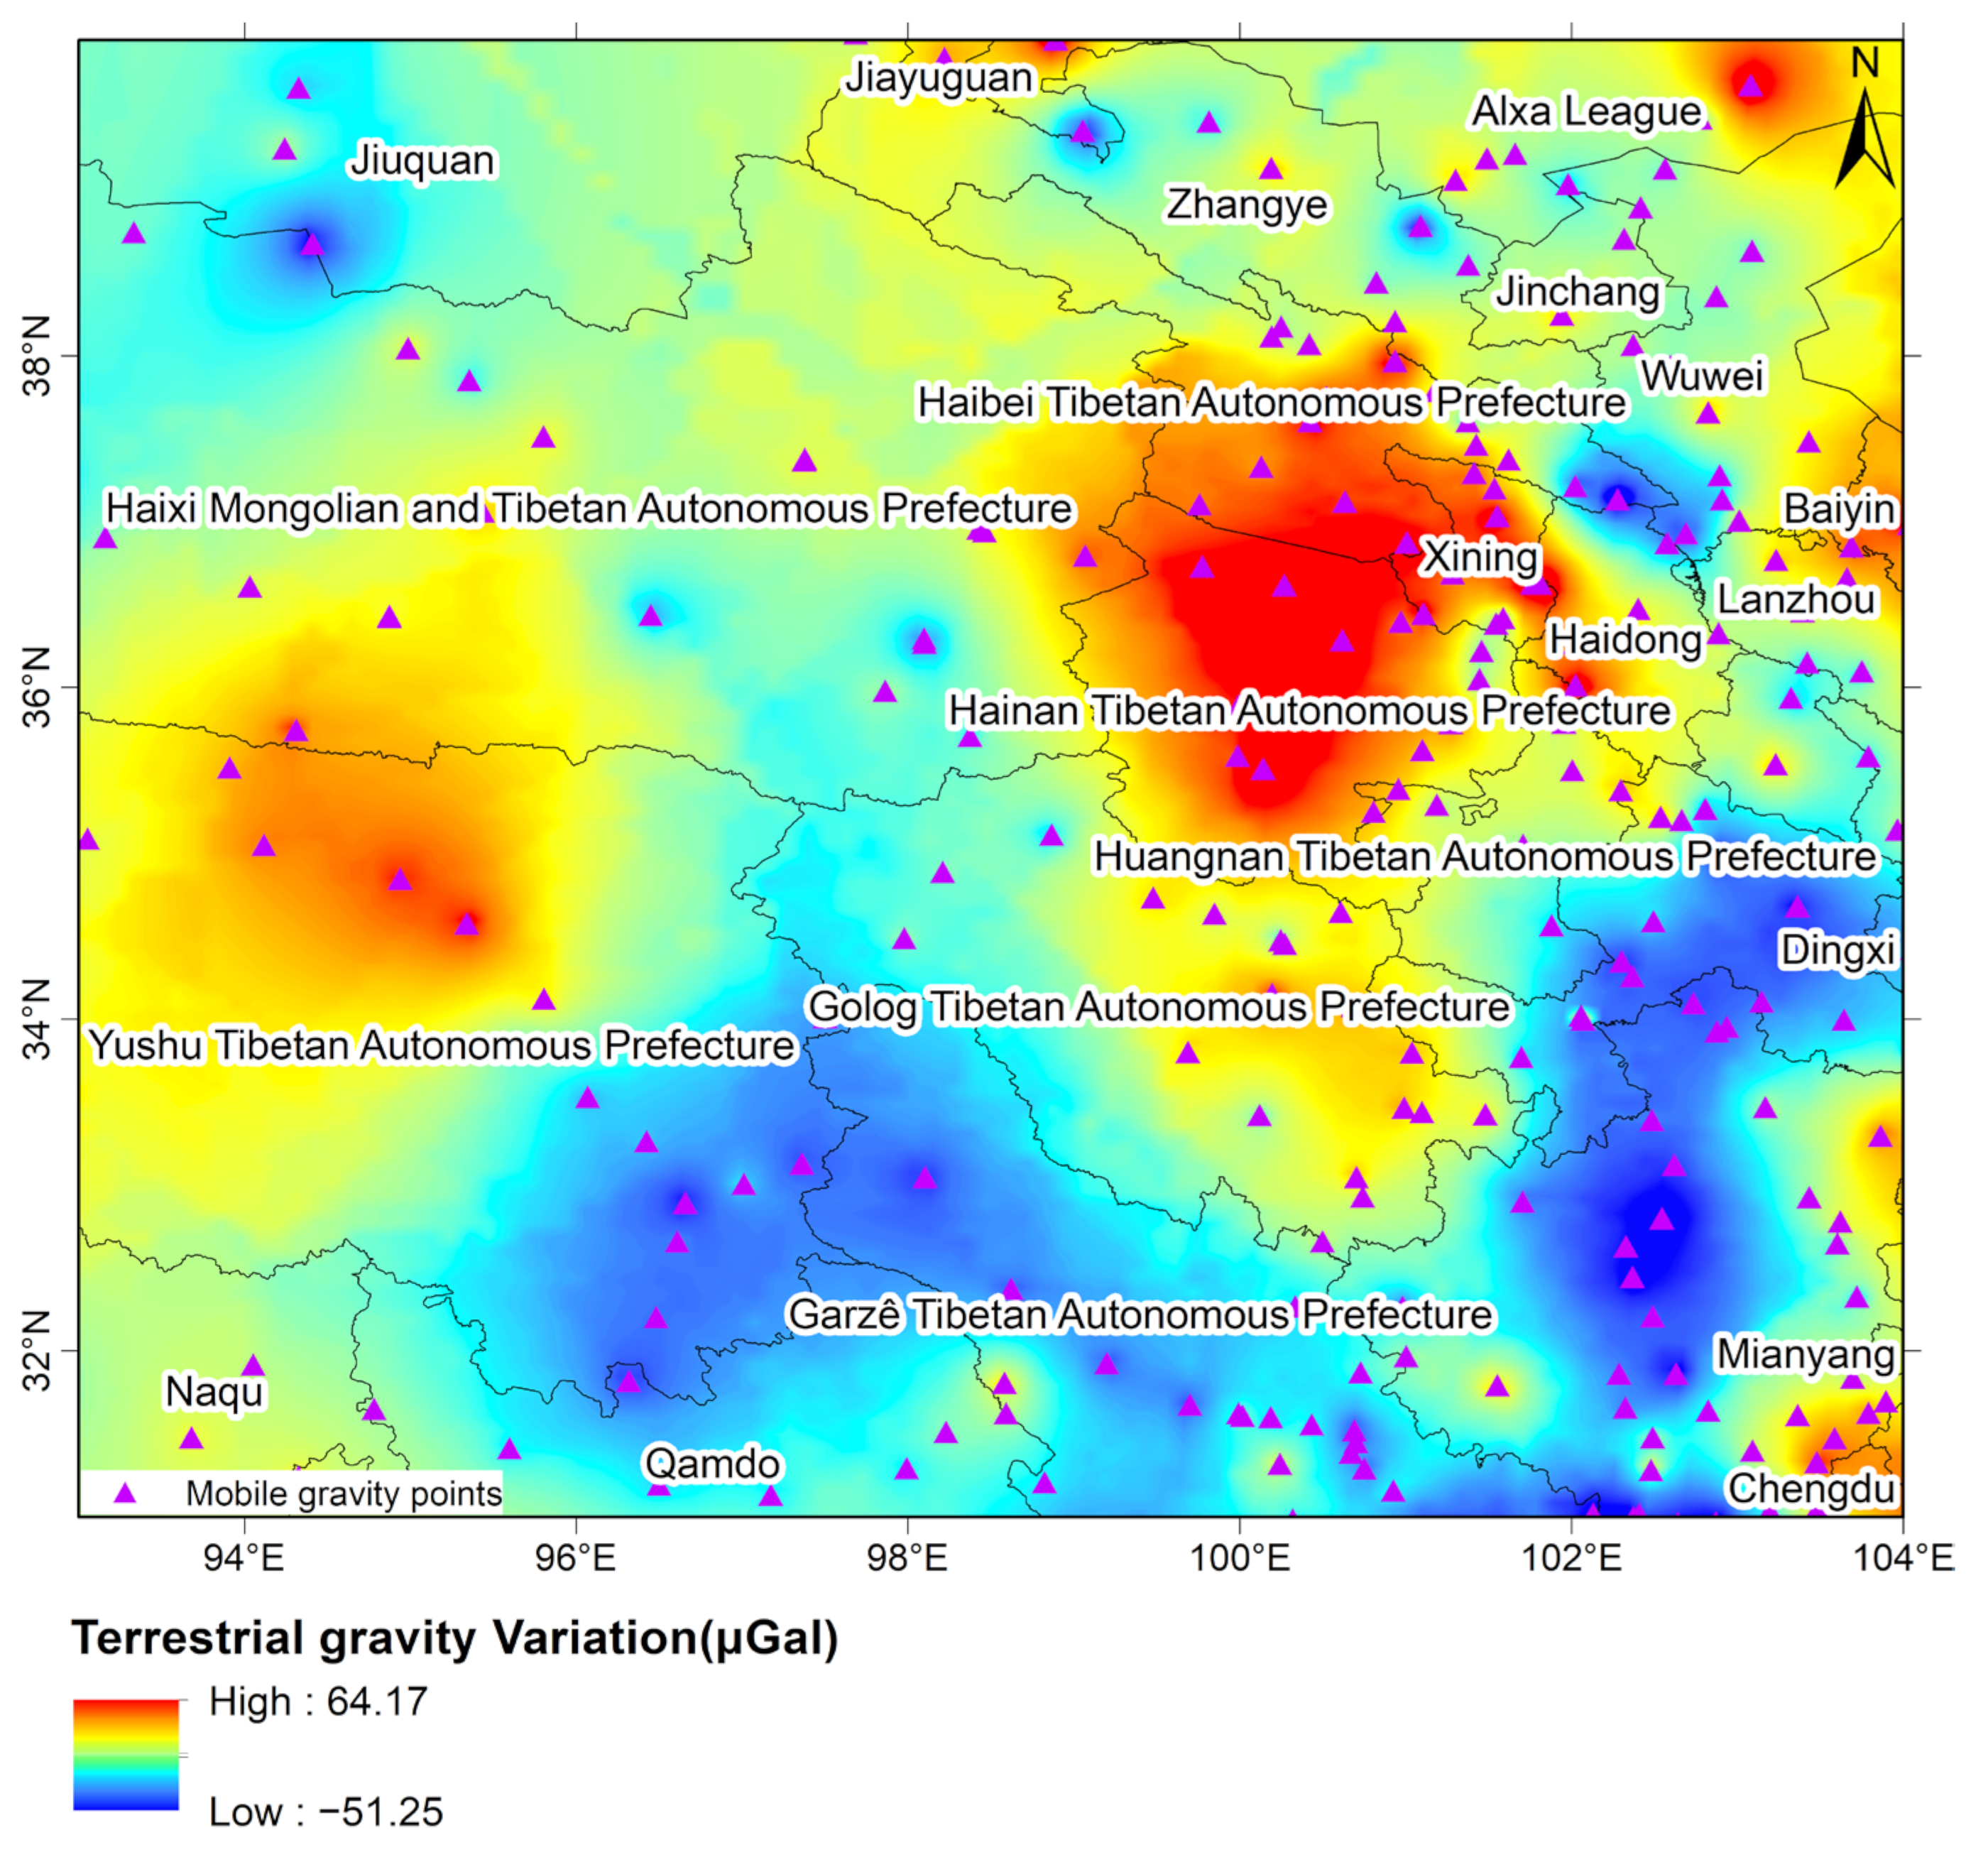
Due to topography and other factors [20], the gravity measurement points in the study area are generally sparse in the west and dense in the east (Figure 3). Raw relative gravity readings are scaled and corrected for tidal, atmospheric, instrumental height, and drift errors. Least-squares adjustment constrained by absolute gravity benchmarks yields multi-temporal terrestrial gravity variations.
Figure 3.
Spatial distribution of terrestrial gravity differences from 2024 to 2025 in the northeastern Tibetan Plateau. Gravity values take μGal as the measurement unit.
The 2024–2025 relative gravity data reveal significant spatial heterogeneity in the regional gravity-change field. Large-scale negative gravity variations dominate the southern sectors, spanning from the Garzê and Golog regions to Mianyang. In contrast, the eastern central region, encompassing Xining, Hainan, and Haibei, exhibits a closed, intense positive gravity variation. These distinct zones are separated by a narrow belt of transitional gravity values. Furthermore, a localized positive gravity variation is observed in the Yushu region, while the northwestern areas, including Jiuquan and its vicinity, are characterized by widespread relative stability.
3.1.2. Exogenic Features
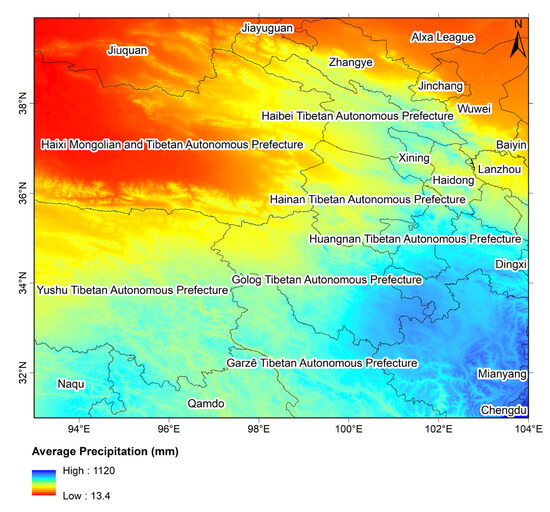
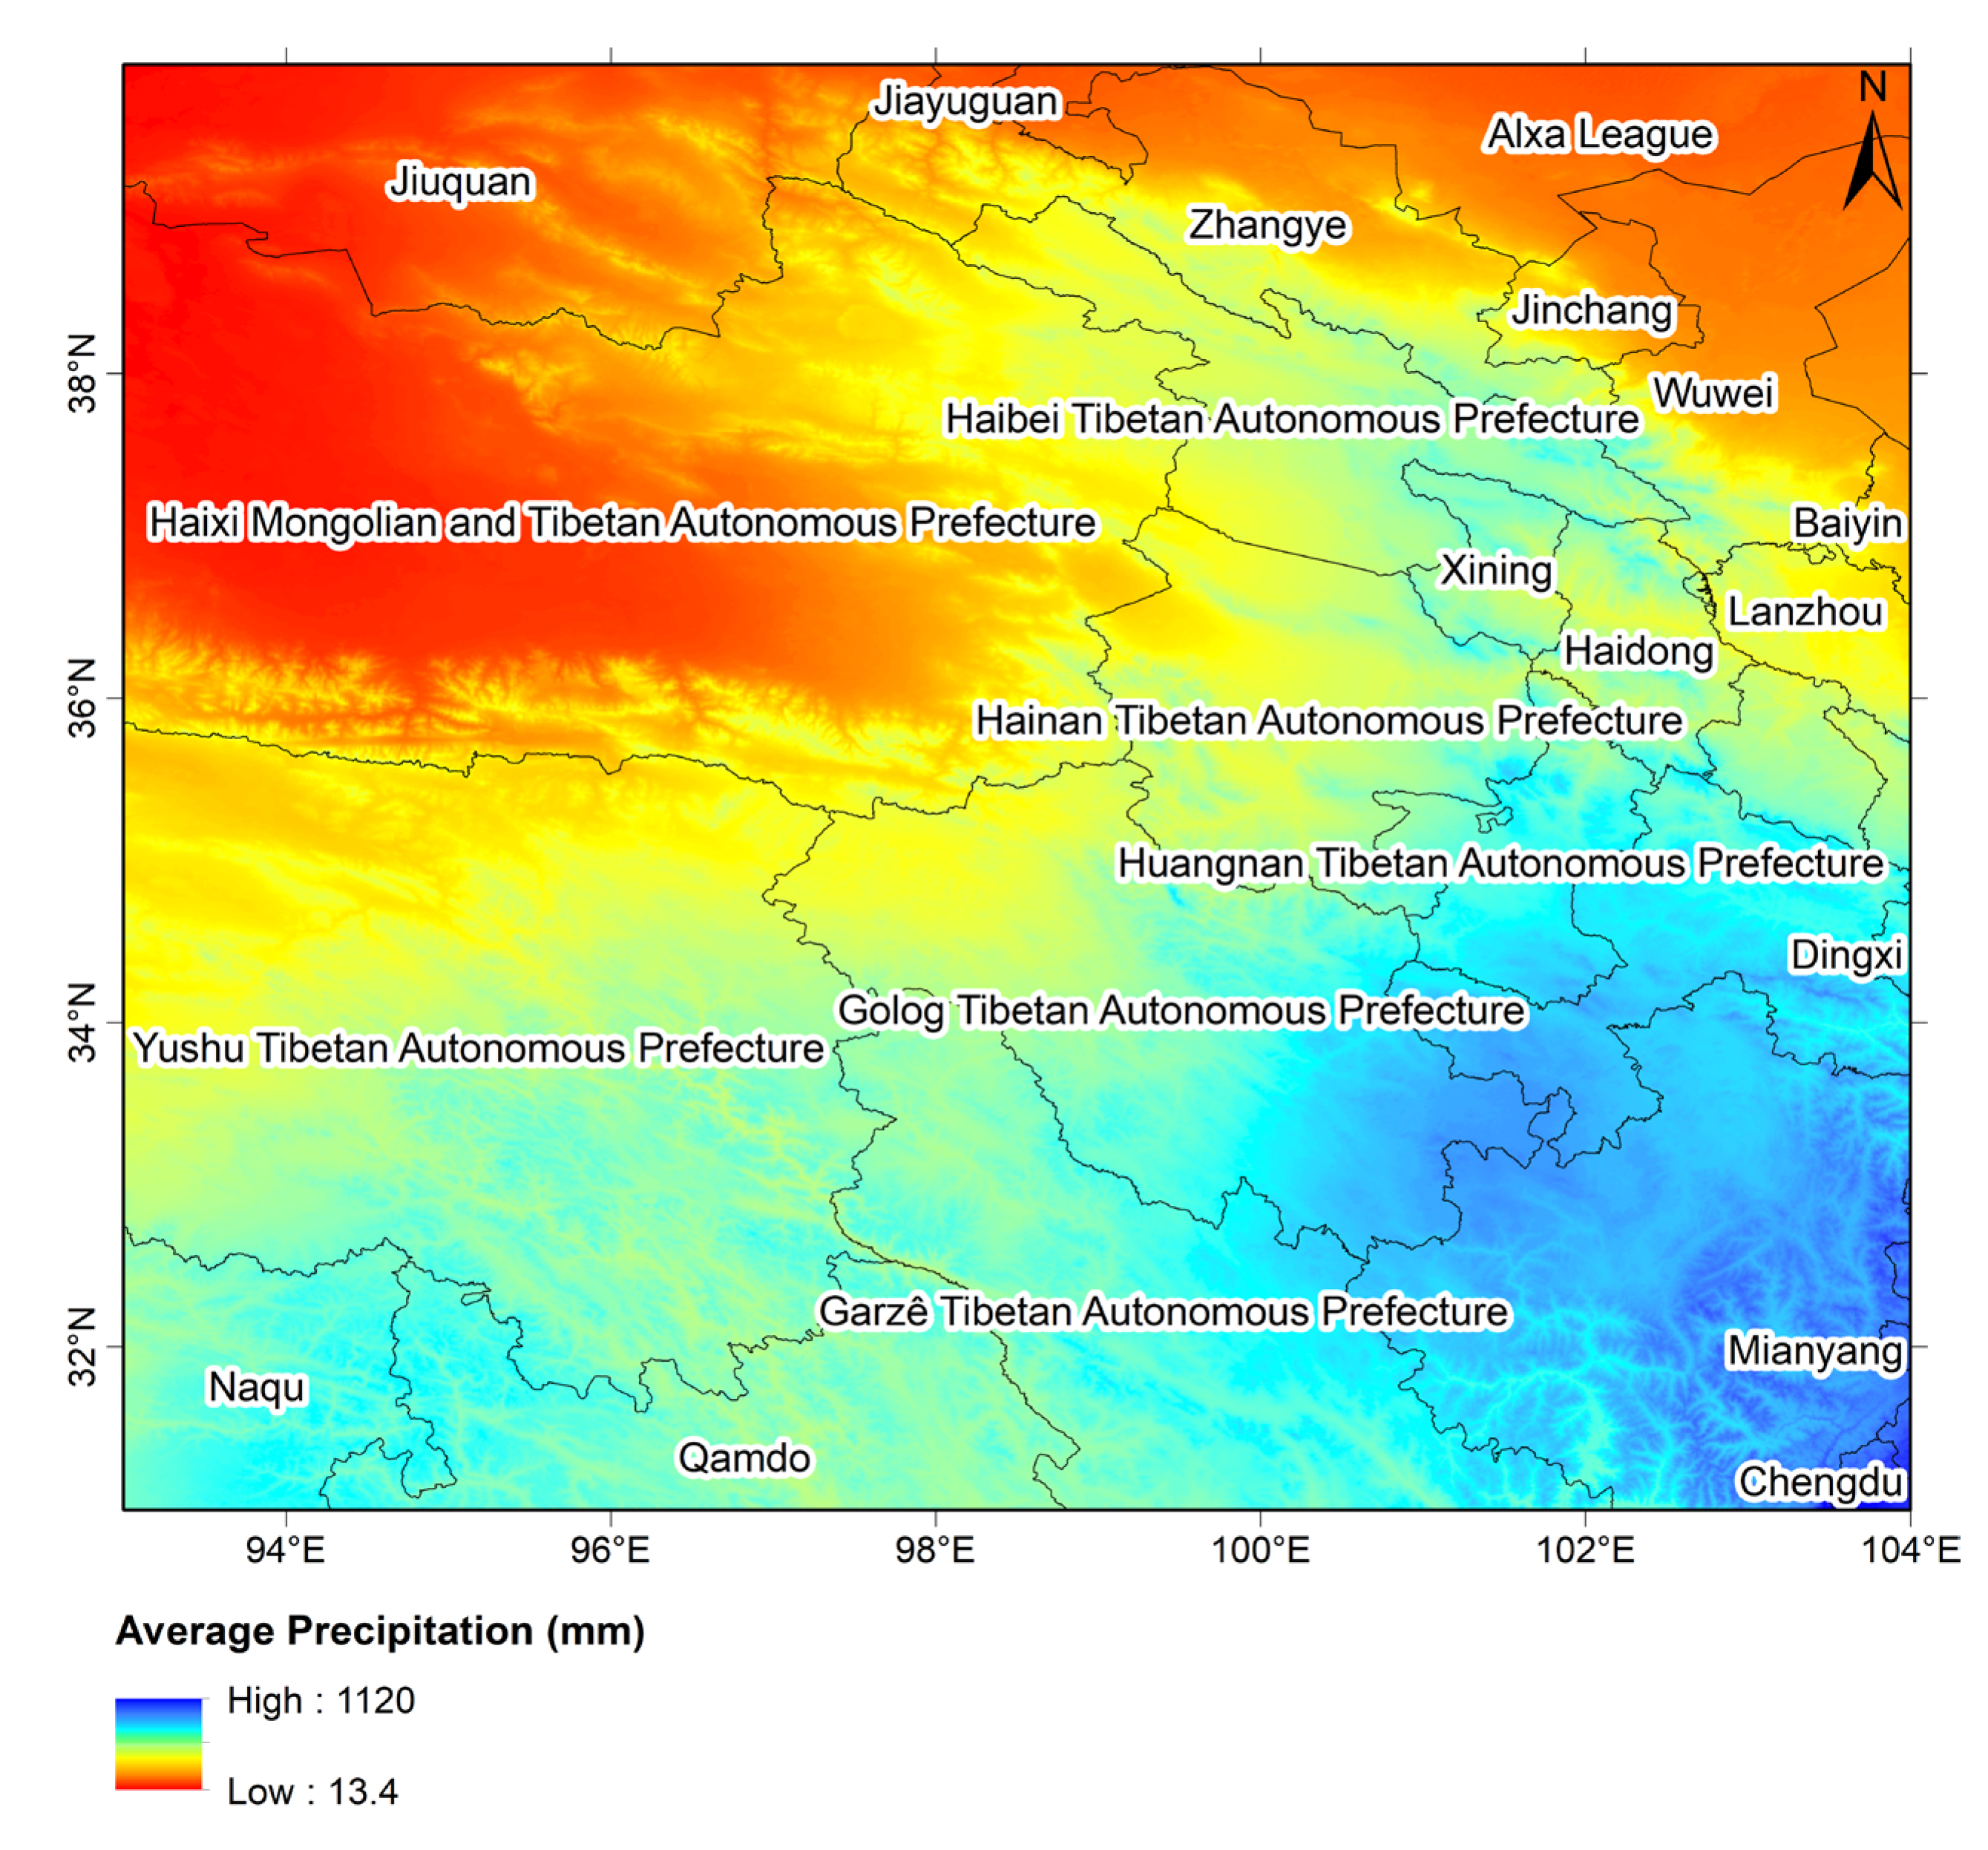
Precipitation distribution in the northeastern region of the Tibetan Plateau: The values range from 13.49 mm to 1120 mm, exhibiting a pronounced southeastern-to-northwestern decreasing gradient. Precipitation exceeds 1000 mm in the southeastern part and gradually diminishes toward the northwest, where it falls below 20 mm (Figure 4).
Figure 4.
Average precipitation.
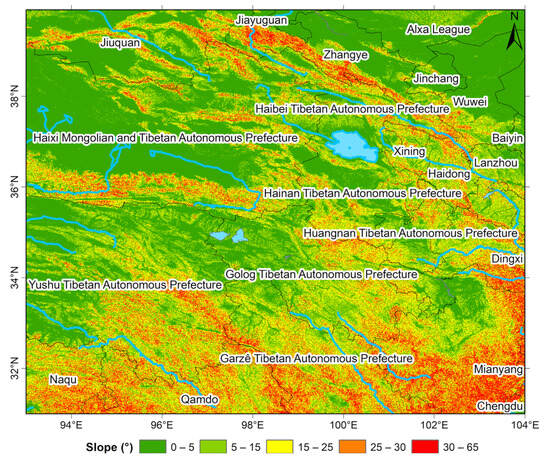
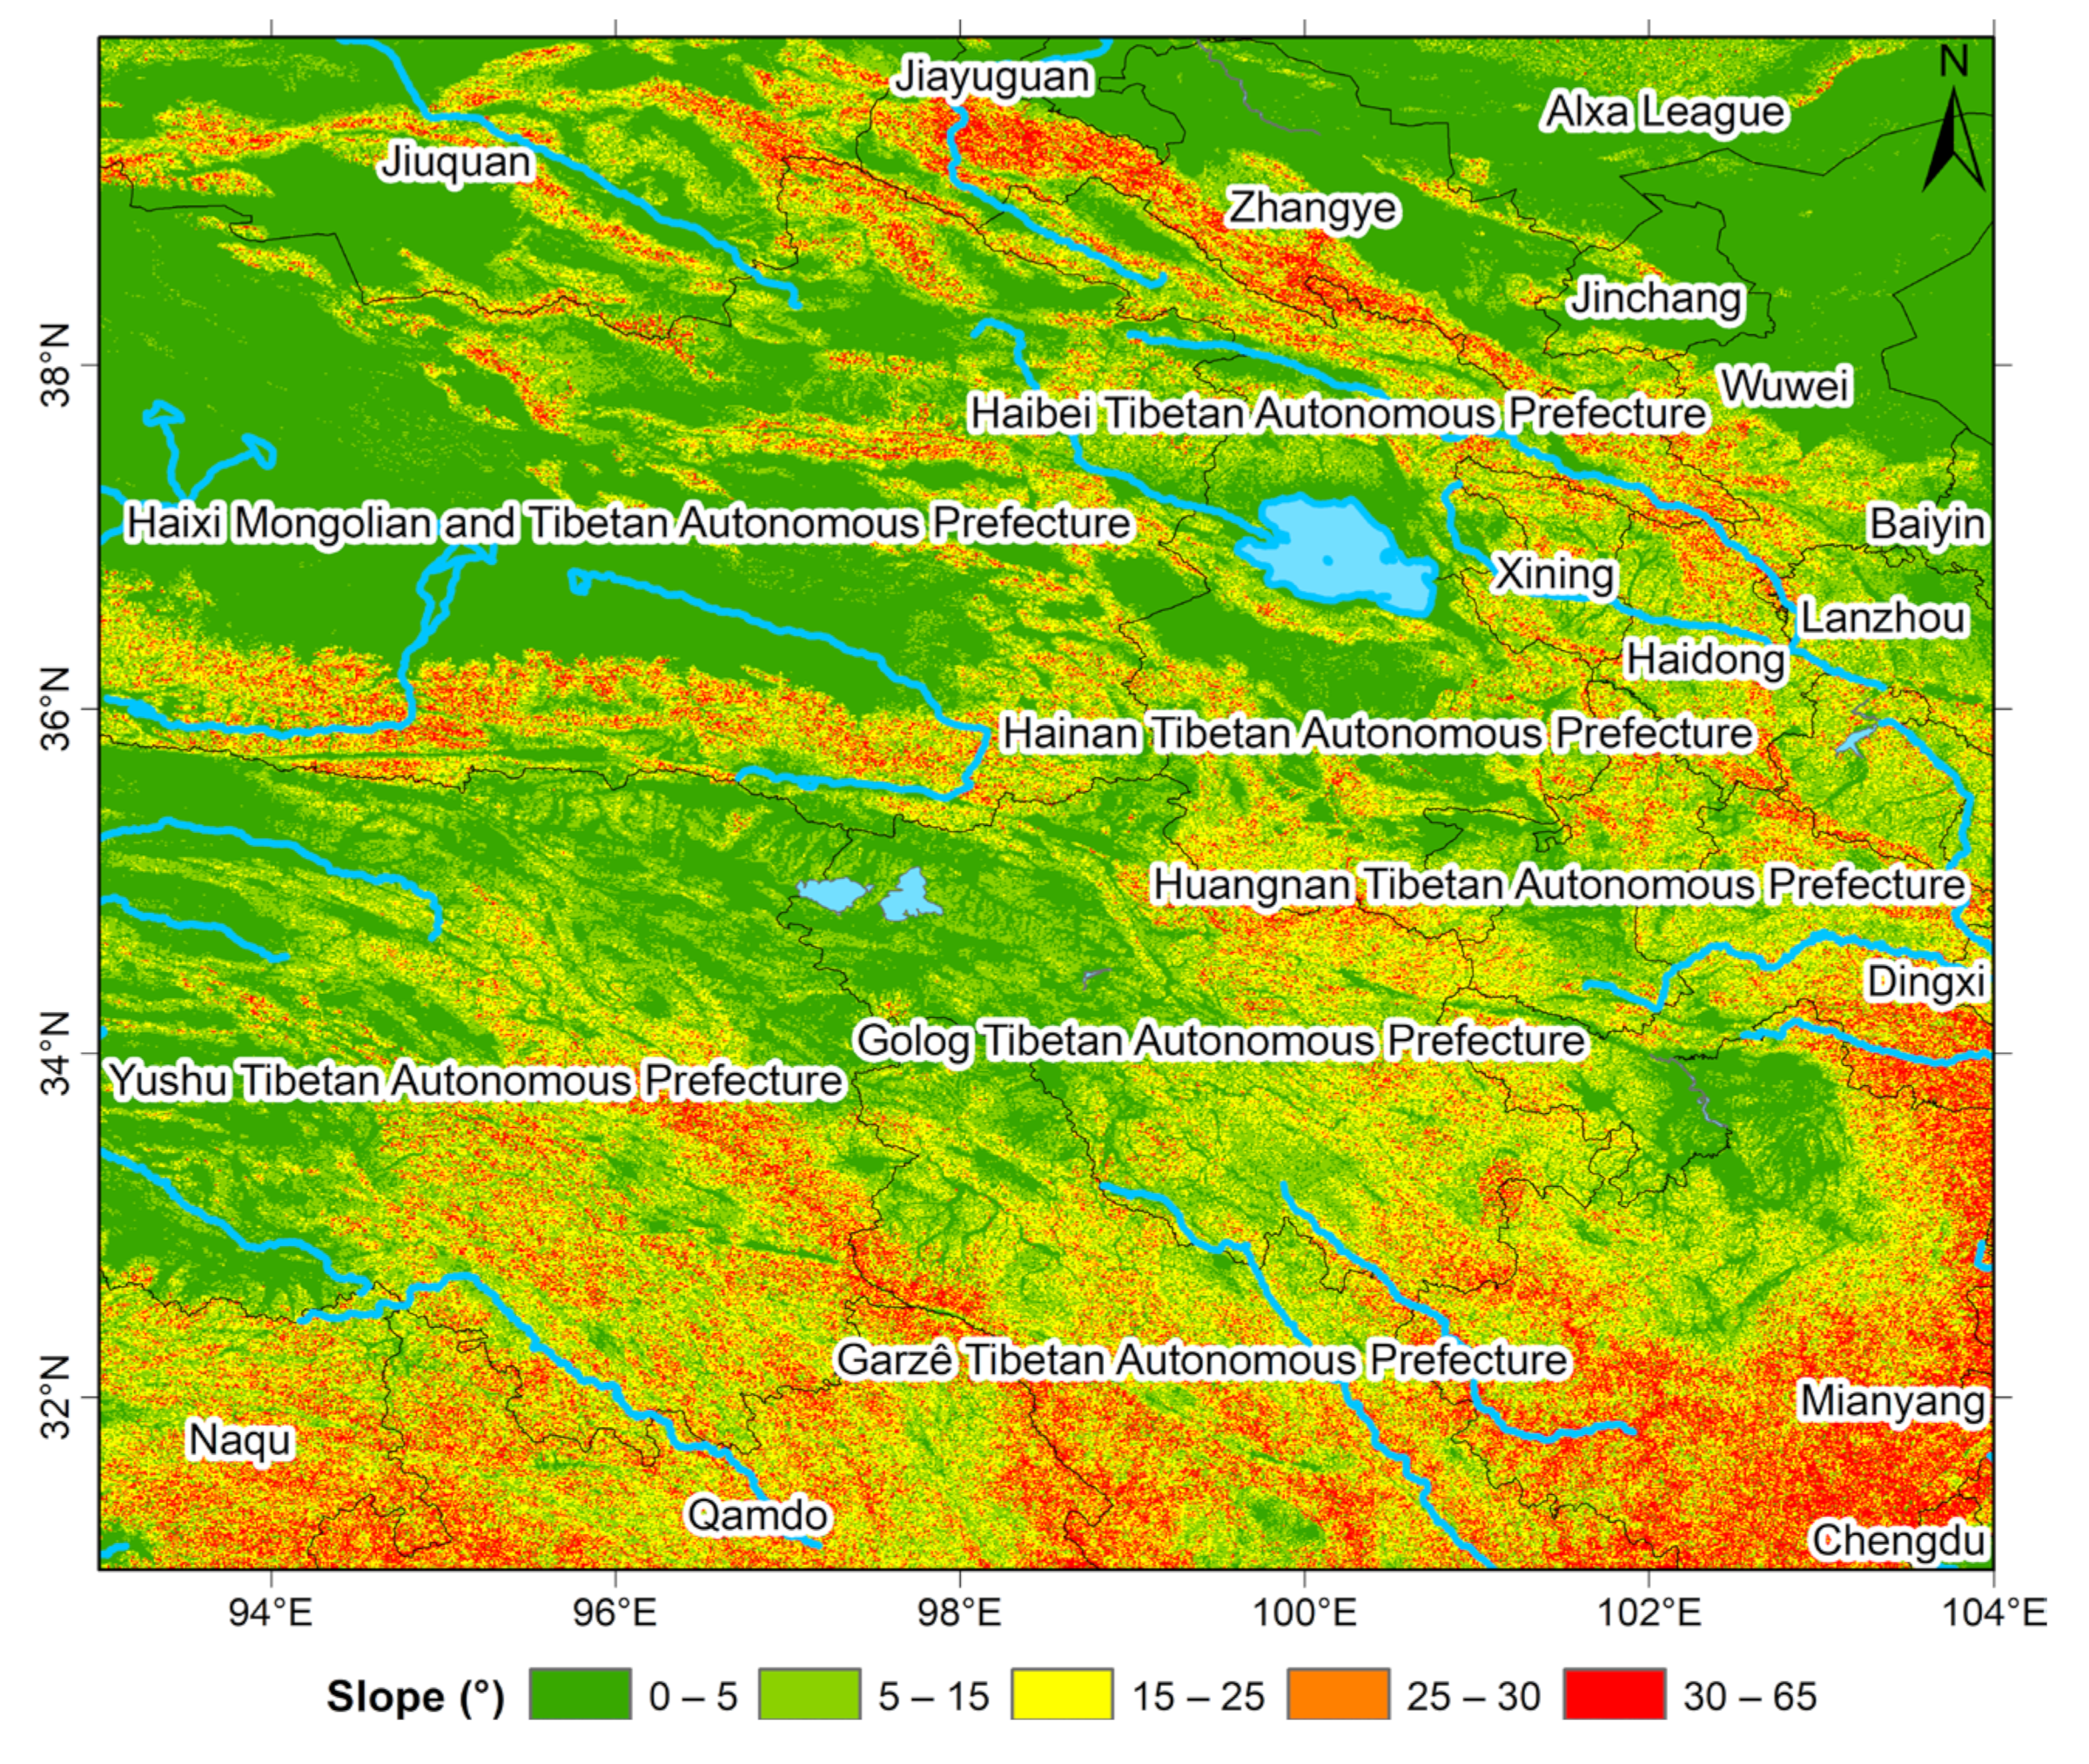
The slope gradient distribution map of the northeastern Tibetan Plateau shows values ranging from 0° to 69.5° (Figure 5). A color scheme transition from green to yellow to orange-red is used to distinguish the values, where green corresponds to low slopes and orange-red represents high slopes. Spatially, the region exhibits a distinct “northwest-low, southeast-high” pattern. The northwestern part consists predominantly of green-coded low-slope areas, indicating relatively flat terrain. Conversely, the topography transitions toward the southeast into yellow and orange-red high-slope zones, reflecting intense topographic relief and rugged terrain. The areas were classified and assigned values based on their vertical distance from the water systems (Figure 5).
Figure 5.
Slope overview of the study area.
3.1.3. Crustal Deformation
Based on GNSS observations, this dataset employs the global terrestrial water storage change field derived from integrated satellite observations and hydrological models to replace GRACE data for calculating and removing hydrological loading deformation effects. The vertical tectonic uplift field of the Tibetan Plateau is then constructed by incorporating the spatial structure function [29,30].
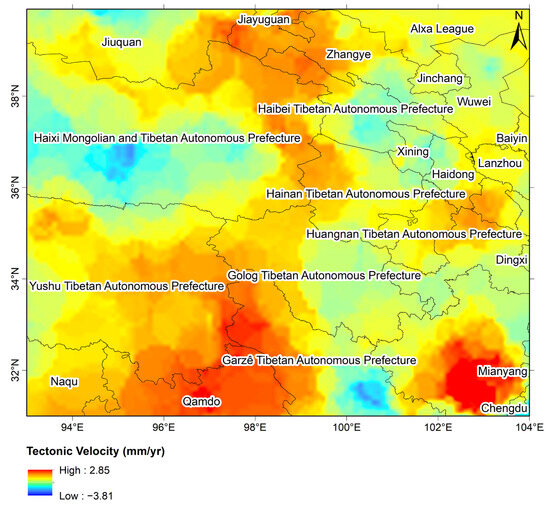
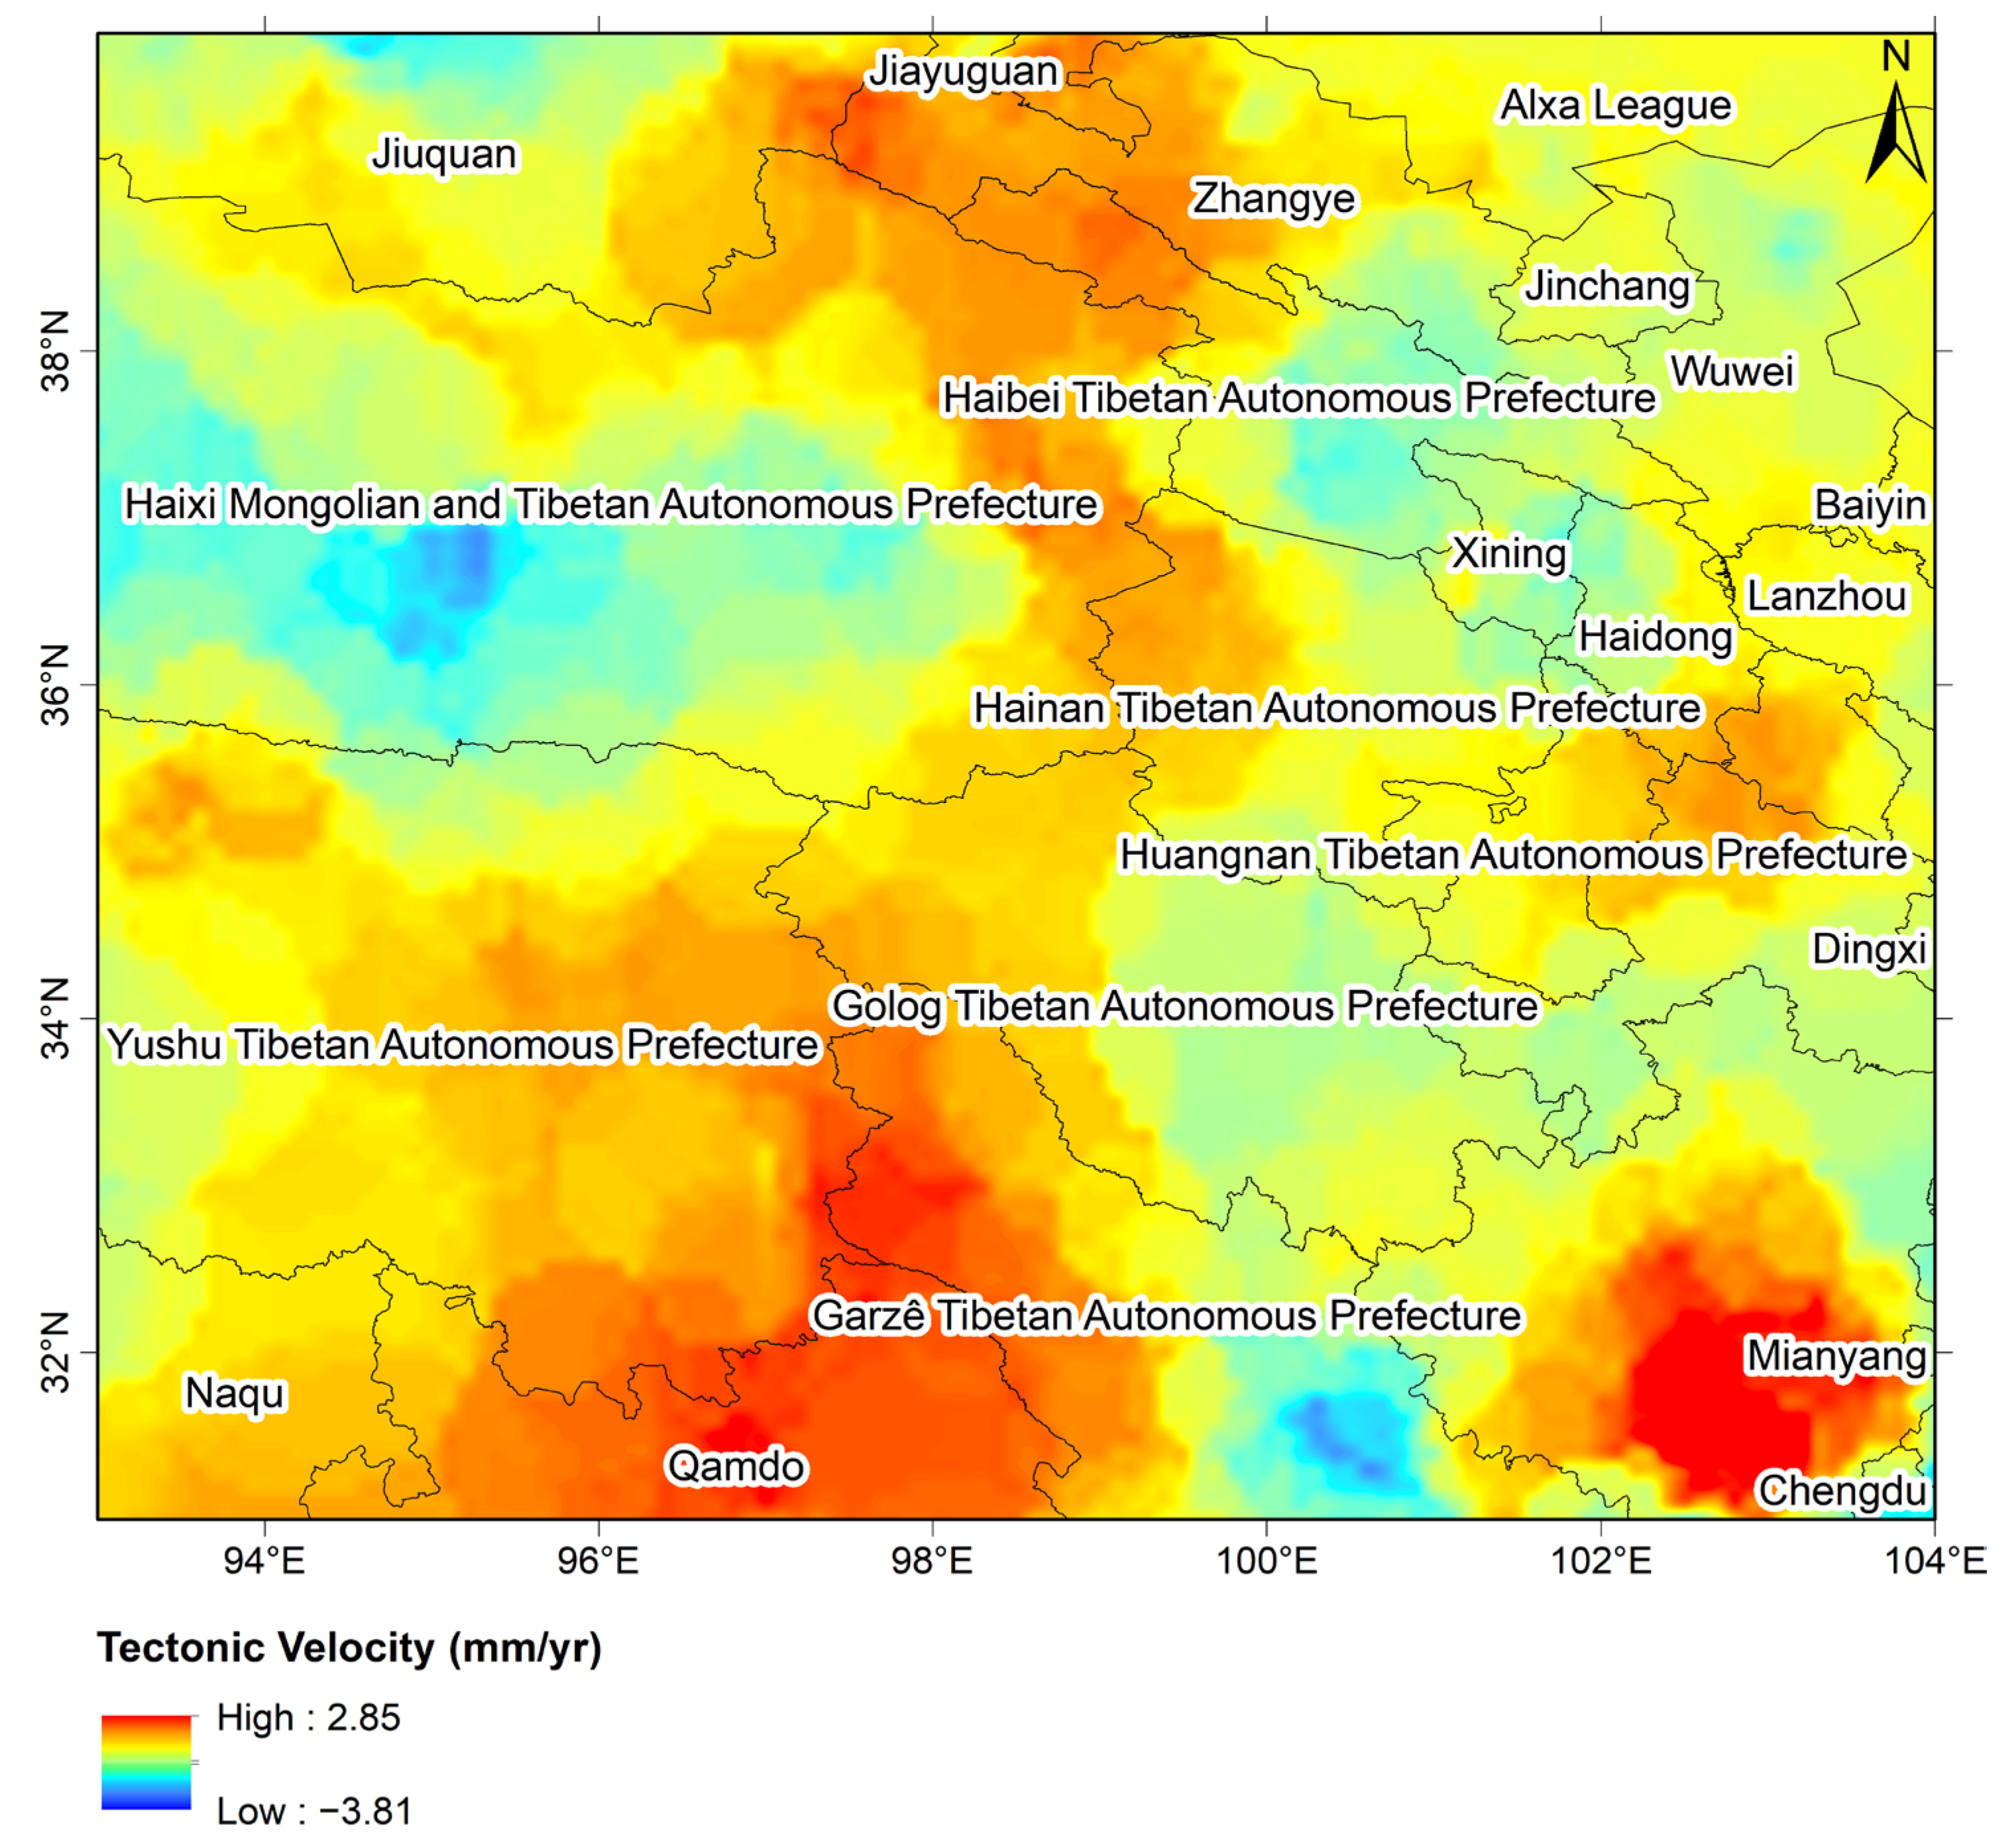
Tectonic velocity shows obvious spatial discrepancy over the research zone, ranging from −3.81 to 2.85 mm/yr (Figure 6). Positive values correspond to crustal uplift, and negative values indicate subsidence. High-uplift red-colored zones are mainly located in the southeastern study area near Mianyang and the Garzê region. Moderate-velocity yellow regions widely cover Yushu and Golog. Low-speed subsidence-related blue areas are distributed over the western Haixi and the area east of Golog. The uneven spatial feature of the tectonic-movement rate supplies quantitative support for the following crustal stability evaluation.
Figure 6.
Spatial distribution of vertical tectonic uplift velocity in the study area.
3.1.4. Seismic Activity and Fault
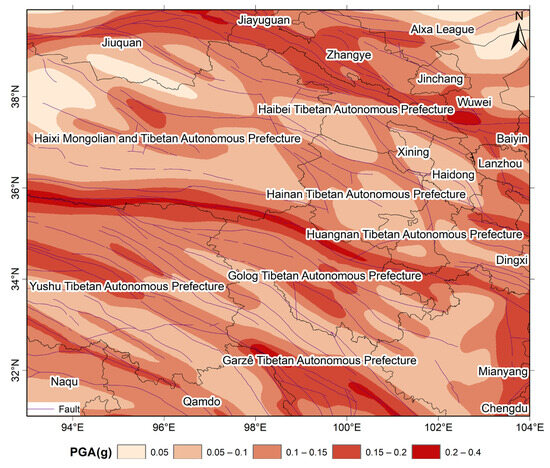
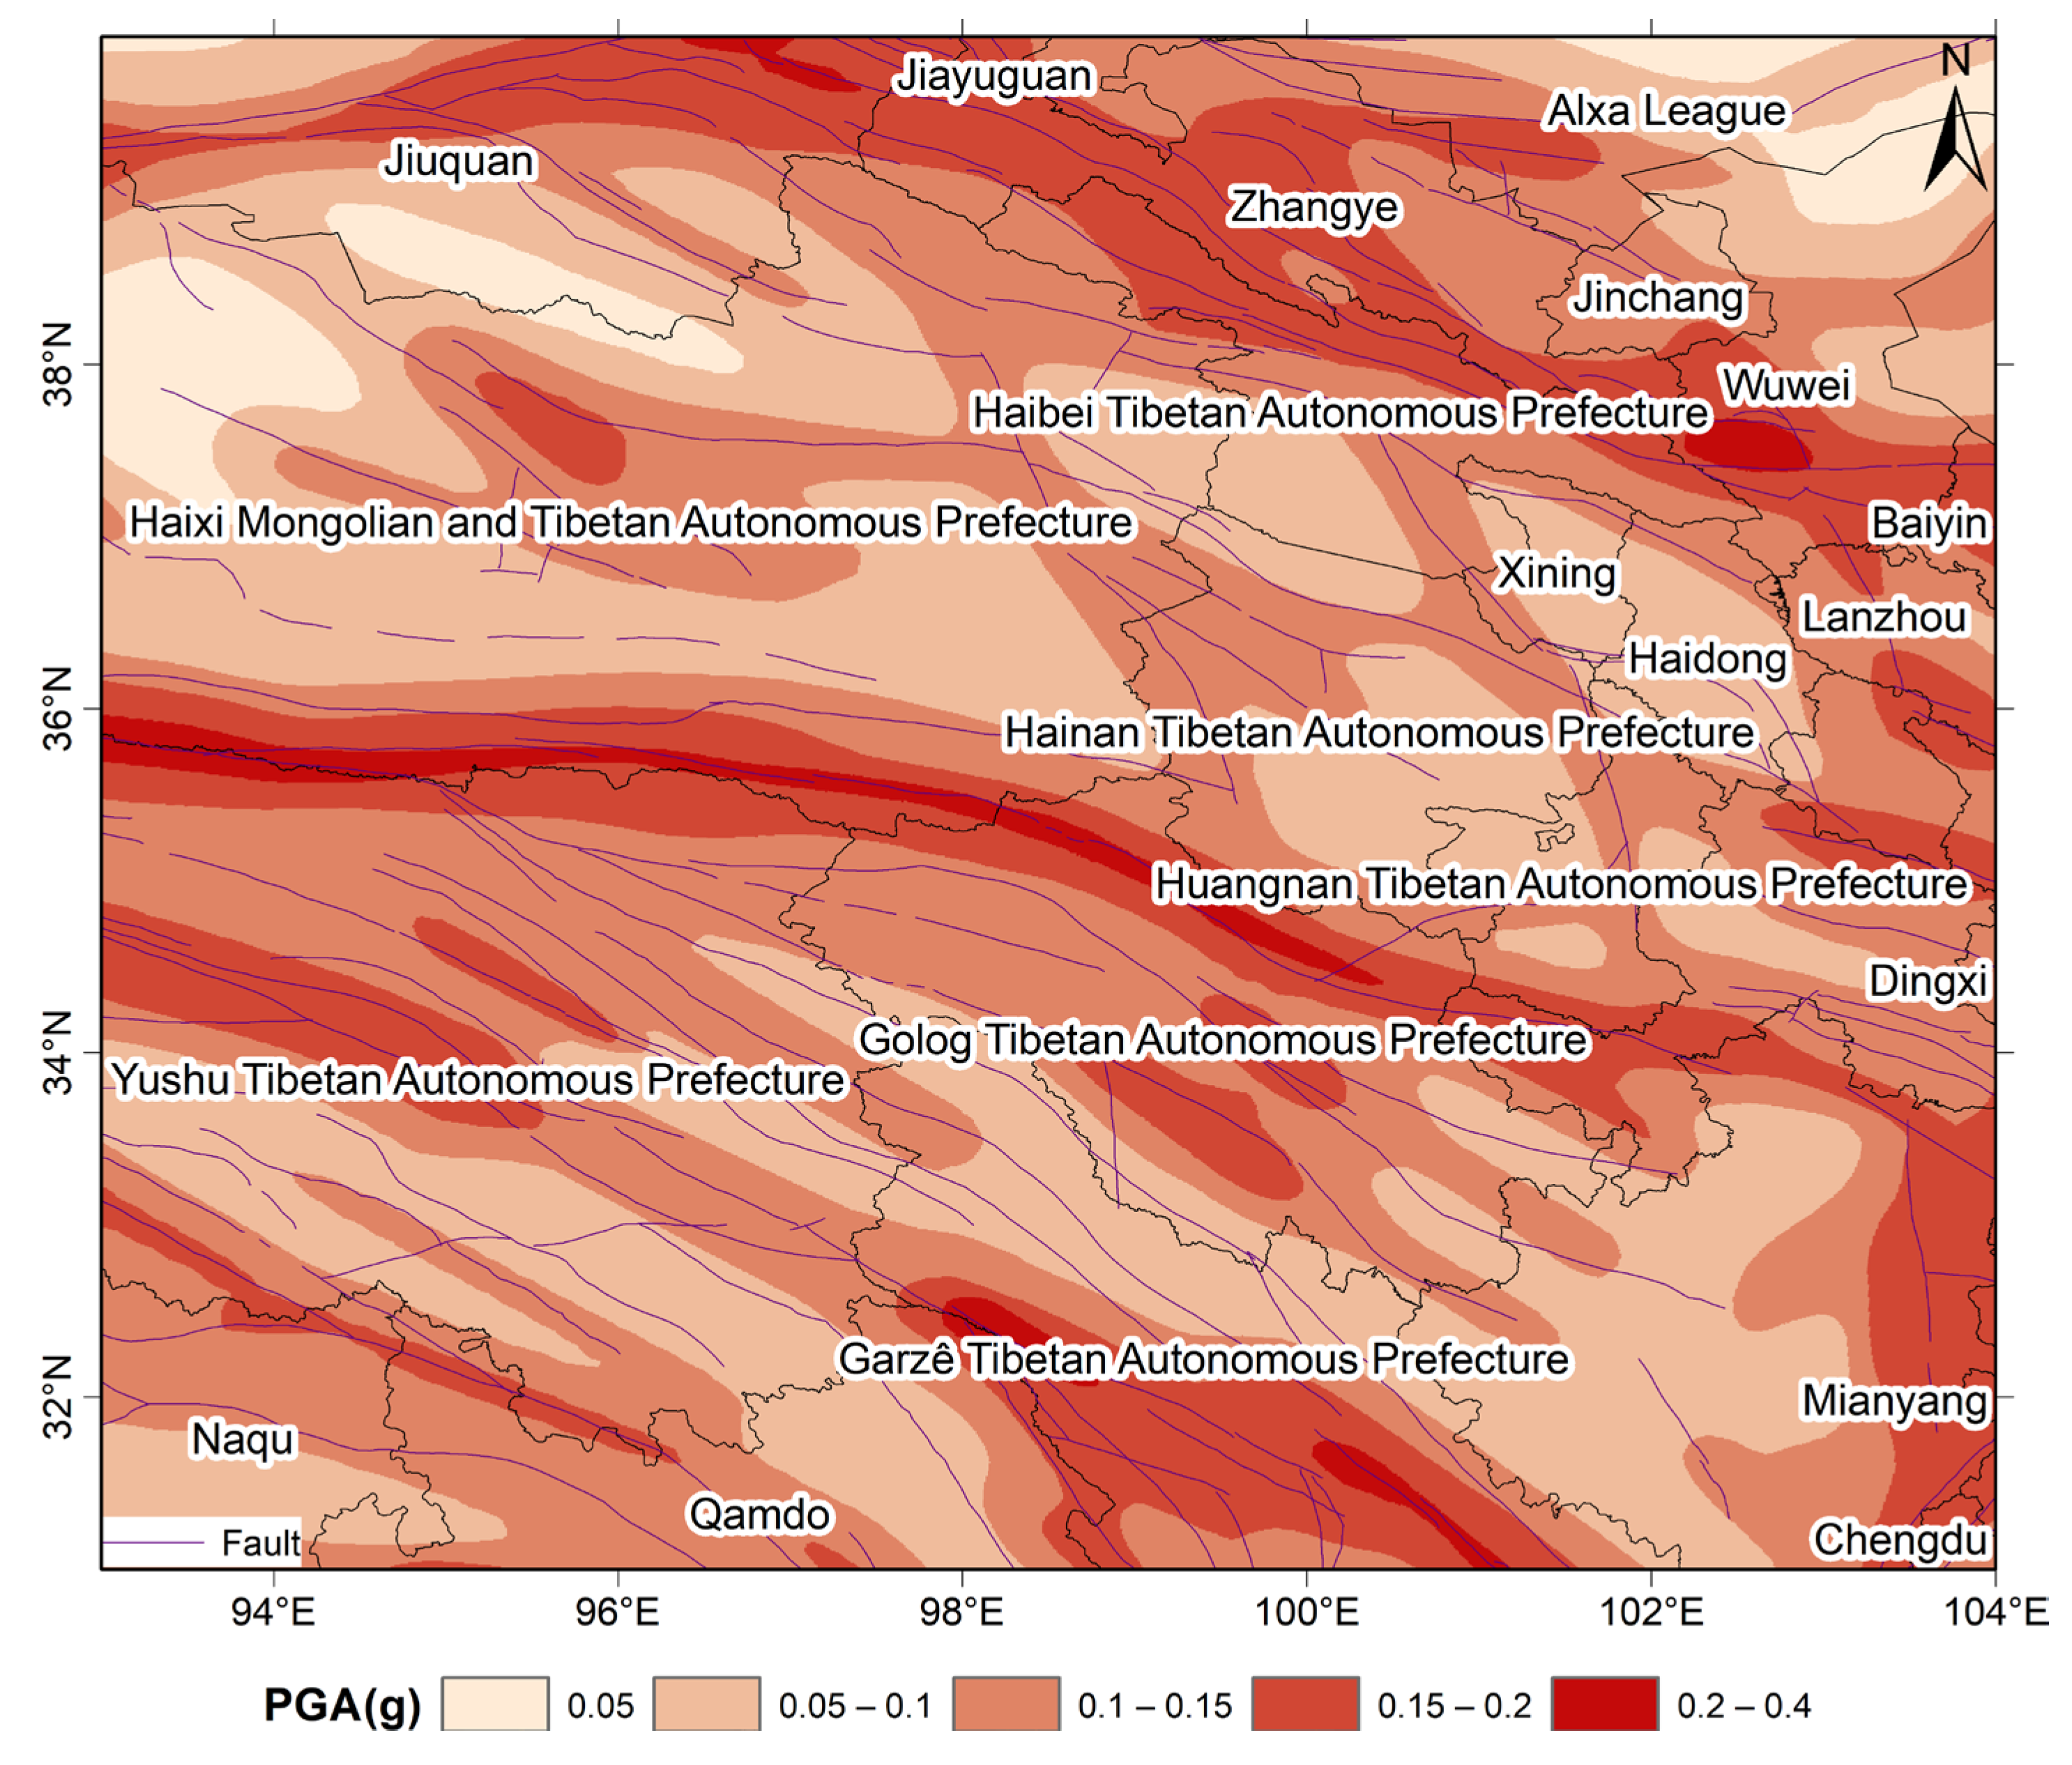
Peak ground acceleration (PGA) refers to the maximum instantaneous acceleration recorded at the ground surface during an earthquake and is a critical indicator for characterizing ground motion intensity. PGA reflects the dynamic effects of seismic waves on the surface, and its magnitude is closely related to factors such as focal characteristics, propagation paths, and site conditions. Generally, a higher PGA value indicates stronger ground motion intensity and a more significant impact on surface structures and the geological environment. Consequently, it is widely utilized in seismic hazard analysis and regional crustal stability assessments. The PGA values in the northeastern region of the Tibetan Plateau generally range from 0.05 g to 0.4 g (Figure 7). High PGA values, typically exceeding 0.2 g and reaching up to 0.4 g in localized areas, are concentrated near active fault zones with intense tectonic activity. The majority of the study area is characterized by moderate values ranging from 0.1 g to 0.2 g, while only a few regions with weaker tectonic activity exhibit PGA values below 0.1 g.
Figure 7.
Spatial distribution of peak ground acceleration across the northeastern Tibetan Plateau. Acceleration results adopt g as the measurement unit.
Based on the newly compiled data of active structures across China [31], we acquire the spatial distribution of faults within the eastern Tibetan Plateau and summarize basic properties of major active faults. Relevant results are listed in Table 1.
Table 1.
Major active faults in the study region.
In assessing regional crustal stability, the primary controlling factors generally encompass endogenic processes, exogenic processes, and medium conditions. This study incorporates five primary indicators for this assessment, each of which is further subdivided into several secondary indicators.
In this study, the classification of crustal stability evaluation indicators is established by integrating empirical knowledge with the Jenks Natural Breaks classification [32,33,34]. This combined approach ensures that the threshold settings for each stability level are both geologically reasonable and statistically robust, reflecting the intrinsic spatial distribution of the data.
The weights for each evaluation index are presented in Table 2. Active faults and seismic activity density hold the highest weights at 0.20 each, followed by peak ground acceleration and tectonic velocity at 0.15 and 0.10, respectively. Two distinct gravity-related indicators are adopted in this work: Bouguer gravity anomaly and terrestrial gravity variation (time-lapse gravity difference derived from multi-period repeated observations). Their corresponding weights are 0.09 and 0.08. Annual average precipitation, slope gradient, and river system development have weights of 0.08, 0.06, and 0.04, respectively.
Table 2.
Crustal stability evaluation grading criteria.
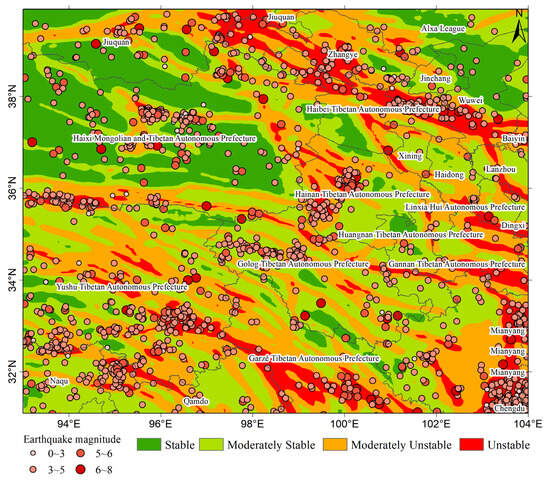
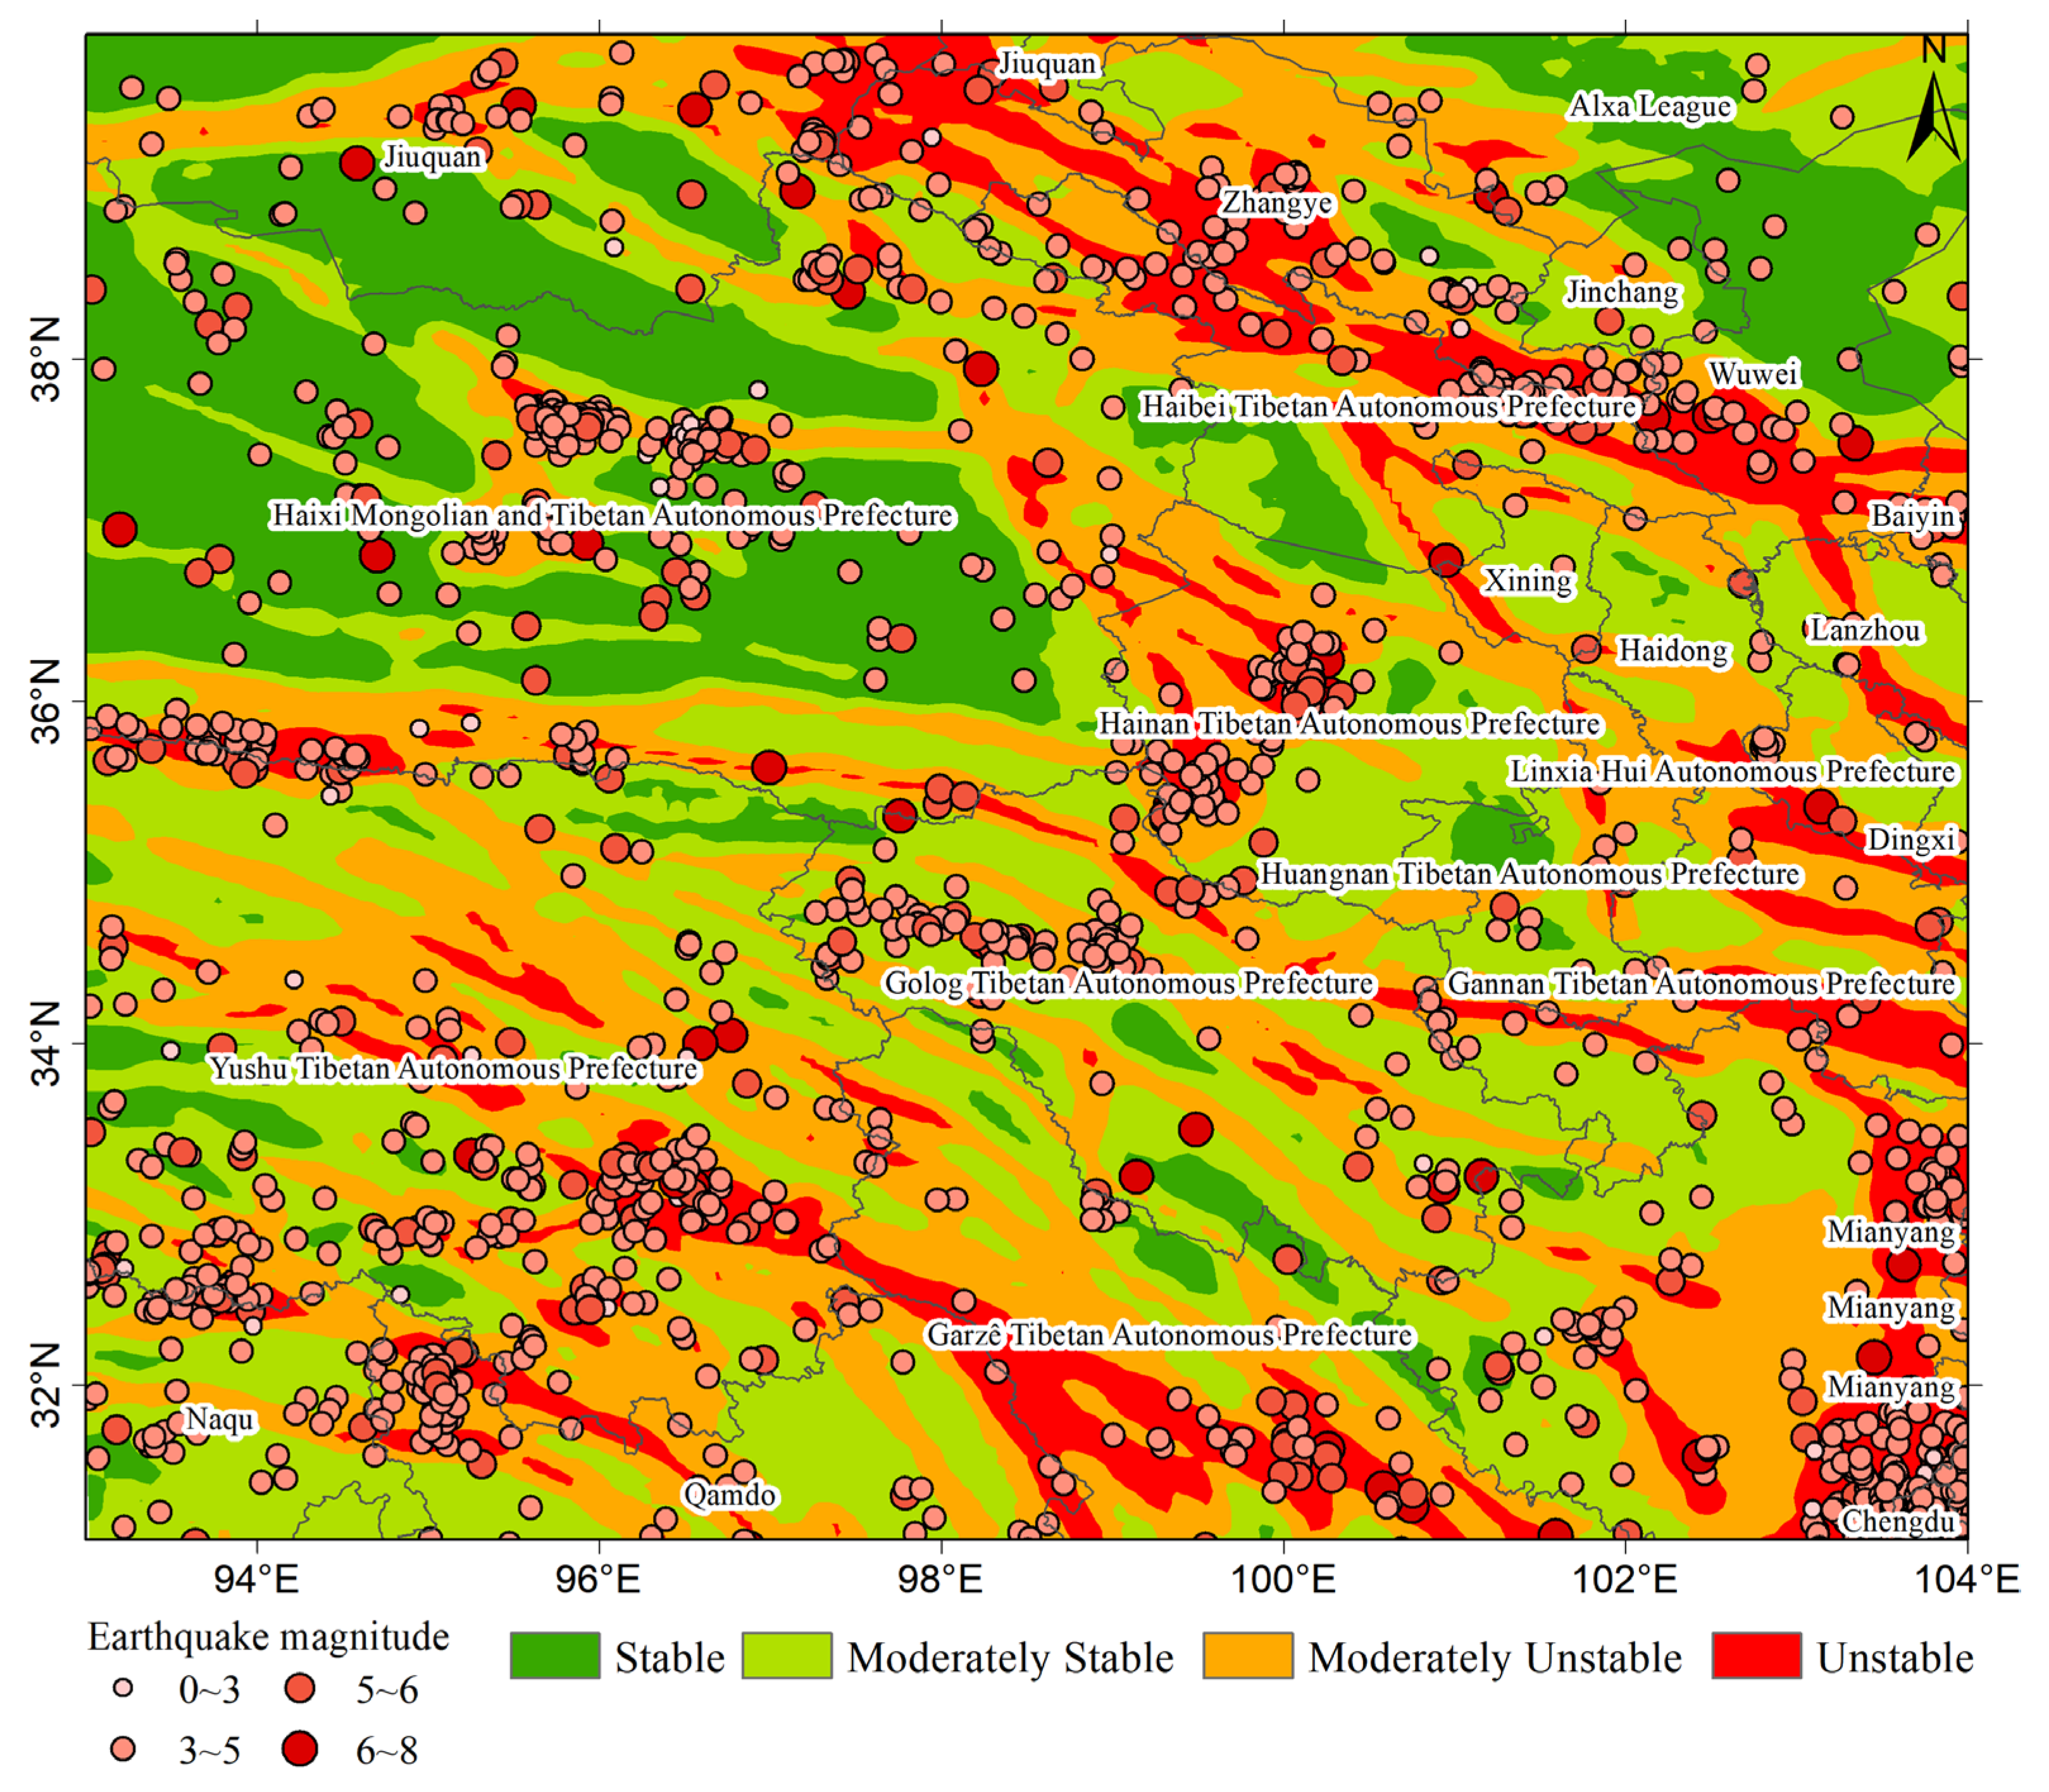
As shown in Figure 8, the spatial pattern of unstable areas is closely controlled by fault zones. Combined with records of historical earthquakes, elongated red zones representing highly unstable conditions are distributed across the Mianyang area and the belt from Jiuquan to Wuwei. In addition, areas classified as moderately unstable and unstable occupy a large proportion in Yushu and Garzê [2,15,35,36,37,38]. These regions require particular attention in geological hazard prevention. Statistically, stable areas account for 20.74% of the total study area, moderately stable areas for 35.47%, moderately unstable areas for 28.78%, and unstable areas for 15.01% (Table 3).
Figure 8.
Spatial distribution of crustal stability grades and historical earthquake epicenters in the study area.
Table 3.
Area statistics of crustal stability zones.
The study area has recorded 1618 earthquakes with magnitude three and above. This group consists of 49 strong events between magnitude six and eight, 306 moderate events between magnitude five and six, and 1263 minor events between magnitude three and five. Seismic activity is unevenly distributed in space and largely aligns with regional fault structures. Dense earthquake clusters appear in tectonically active zones, and their distribution conforms to the strike of these fault structures. In terms of the proportional distribution of seismic events in different tectonic stability zones, earthquakes with magnitudes ranging from six to eight account for 56.6% of all seismic events within the unstable zones of the study area, while earthquakes with magnitudes ranging from five to six make up approximately 61.2% of all seismic events in unstable zones. When unstable zones and moderately unstable zones are combined for comprehensive statistics, seismic events with magnitudes ranging from zero to five occupy roughly 72.92% of all recorded earthquakes distributed in these two types of tectonic zones.
The weights derived from the CRITIC and factor analysis were compared with the results of this study, as presented in Table 4: Robustness check of indicator weights using different objective weighting methods. The results indicate that the CRITIC and factor analysis yield consistent weight distributions for several influencing factors and demonstrate a strong capability to identify key drivers with known direct impacts on crustal stability, such as active faults and peak ground acceleration. However, relying solely on objective weighting methods cannot accurately reflect crustal stability, as subjective expert judgment exerts a significant influence on the evaluation. Therefore, while objective weighting methodologies are essential for weight calculation, integrating subjective expert knowledge for critical influencing factors is equally vital.
Table 4.
Robustness check of indicator weights using different objective weighting methodologies.
4. Discussion
(1) Crustal stability evaluation is a continuously developing research field in geoscience, which comprehensively involves endogenic and exogenic geological processes, multi-source monitoring data, and quantitative evaluation models. The multi-source datasets adopted in most existing studies have inconsistent spatial resolutions, which introduce extra errors to the integrated assessment. Although high-precision geodetic data can effectively improve assessment accuracy, current evaluation systems still have certain limitations. Most existing studies treat different influencing factors independently and ignore their complex coupling relationships. Furthermore, prevailing evaluations rely primarily on static data with incomplete time-series information, which may cause analytical deviations and fail to reflect dynamic crustal evolution or respond to sudden geological events. Future research will further enrich data sources, unify data resolution standards, optimize indicator systems, and improve data fusion methods to enhance the reliability of quantitative stability assessment.
(2) The unstable areas in the eastern Tibetan Plateau exhibit distinct zonal and linear distribution characteristics, mainly concentrated in the Jiuquan–Zhangye–Wuwei belt in the north, the Xining–Haidong area in the central region, the Yushu–Garzê tectonic belt in the south, and the Mianyang–Chengdu area in the southeast. The spatial distribution of instability is highly consistent with active faults and historical seismicity, indicating that tectonic activity and fault development dominate crustal destabilization. Regional tectonic compression and fault movement control the overall stability pattern, while surface factors including slope, river networks, and precipitation further aggravate geological instability in tectonically weak zones.
From the regional geotectonic view, the study area is mainly situated in the Bayan–Har (Songpan–Ganzi) active block. Under the continuous collision of the Indian and Eurasian plates, crustal materials inside the Bayan Har block extrude toward the northeast. Its east-trending migration is blocked by the rigid Sichuan Basin. Stress then builds up on four major boundary fault zones around the block, namely the East Kunlun Fault, Garzê–Yushu–Xianshuihe fault zone, and the Longmenshan thrust belt [38,39].
(3) The hybrid subjective–objective weighting method presents obvious advantages over single weighting approaches. Pure objective weighting cannot fully reflect geological mechanisms, while purely subjective weighting is susceptible to artificial empirical bias. The combined method realizes balanced weighting of multiple indicators and improves the rationality and reliability of comprehensive crustal stability evaluation in tectonically complex regions.
(4) Terrestrial gravity data significantly enhance the identification capability of subtle tectonic features. Traditional studies relying solely on Bouguer gravity anomalies fail to capture near-surface microstructures. The combination of terrestrial and Bouguer gravity data enables effective identification of concealed structures, optimizes zoning boundaries, and supports refined evaluation of regional crustal stability.
5. Conclusions
This study constructed a multi-factor evaluation framework for crustal stability across the tectonically active eastern Tibetan Plateau, incorporating nine geophysical, seismic, tectonic, and surface environmental indicators. A hybrid weighting strategy combining subjective weighting and the CRITIC method was adopted; factor analysis was used to verify weight rationality, and Jenks Natural Breaks Classification was applied to partition four stability levels. Quantitatively, stable, moderately stable, moderately unstable, and unstable regions account for 20.74%, 35.47%, 28.78%, and 15.01% of the total study area, respectively. Unstable domains show prominent linear zonal patterns and are tightly spatially coupled with active fault traces and historical earthquake epicenters in northern Jiuquan–Zhangye–Wuwei, central Xining–Haidong, southern Yushu–Garzê, and southeastern Mianyang–Chengdu. The integrated subjective–objective weighting outperforms standalone weighting approaches, and terrestrial gravity observations greatly improve the ability to identify subtle local tectonic variations. The established evaluation system and zoning results provide reliable scientific support for territorial planning, major infrastructure site selection, and geological disaster mitigation within high-seismic-risk orogens.
Author Contributions
Conceptualization, J.L.; methodology, Z.G. and S.W.; data curation and pre-processing, Z.G.; investigation, S.K.; formal analysis, S.K.; validation, S.K. and S.W.; visualization, C.L.; resources and reference collation, J.C.; writing—original draft preparation, S.K.; writing—review and editing, Z.G., S.W., C.L. and J.C.; project administration, J.L.; supervision, J.L. All authors have read and agreed to the published version of the manuscript.
Funding
This research was supported by the National Natural Science Foundation of China (Grant Nos. 41671507 and 42474039); the Natural Science Foundation project of Henan Province (252300420282); Project of Creating a “Double First Class” Discipline of Geomatics Science and Technology (BZCG202301); Postgraduate Education Reform and Quality Improvement Project of Henan Province (YJS2026AL032).
Institutional Review Board Statement
Not applicable, as this study did not involve humans or animals.
Informed Consent Statement
Not applicable.
Data Availability Statement
Tectonic uplift rate datasets for the Qinghai–Xizang Plateau were obtained from the National Tibetan Plateau Data Center (https://data.tpdc.ac.cn). Annual precipitation data (2018–2022) with a 1 km resolution were sourced from the Loess Plateau Subcenter, National Earth System Science Data Center (http://loess.geodata.cn). Relevant research data can be obtained from the corresponding author upon request.
Conflicts of Interest
The authors declare no conflicts of interest.
Abbreviations
The following abbreviations are used in this manuscript:
| PGA | Peak Ground Acceleration |
| AHP | Analytical Hierarchy Process |
References
- Jin, R.; Shen, X.; Zhang, Y.; Deng, Y.; Wang, W.; Cheng, S.; Liu, K.; Huang, H.; Jing, H.; Zhang, P. Crustal differential thickening and incomplete mechanical decoupling in the eastern Qilian Shan, NE Tibetan Plateau: Insights from a dense seismic profile. Earth Planet. Sci. Lett. 2026, 684, 120032. [Google Scholar] [CrossRef] [Scilit]
- Qi, T.J.; Meng, X.M.; Chang, J.; Yue, D.X.; Wang, Y.B.; Chen, G. Landslide Utilization and Driving Mechanisms in Alpine Gorge Areas of the Eastern Qinghai–Tibet Plateau. Catena 2025, 249, 10867. [Google Scholar] [CrossRef] [Scilit]
- Dal Zilio, L.; Hetényi, G.; Hubbard, J.; Bollinger, L. Building the Himalaya from tectonic to earthquake scales. Nat. Rev. Earth Environ. 2021, 2, 251–268. [Google Scholar] [CrossRef] [Scilit]
- Liu, J.; Kong, S.; Jin, S.; Zhang, Y.; Liu, X.; Nie, S.; Xu, K. Crustal stability and hazard assessment along the Xinjiang-Tibet Railway by GNSS and gravity data. Adv. Space Res. 2025, 76, 718–733. [Google Scholar] [CrossRef] [Scilit]
- Li, Z.H.; Zhang, C.L.; Yu, C.; Ding, M.T.; Zhu, W.; Hoey, T.B.; Chen, B.; Du, J.T.; Li, X.L.; Peng, J.B. Comprehensive Geohazard Detection along the Qinghai-Tibet Plateau Transportation Corridor Based on Multi-Sourced Earth Observations. Int. J. Appl. Earth Obs. Geoinf. 2025, 143, 104811. [Google Scholar] [CrossRef] [Scilit]
- Li, T.T.; Liu, W.H.; Li, Q.; Liu, Y.B.; Liu, H.R.; Li, Q.; Luo, B.N.; Zhang, J.Q.; He, R.J.; Yang, H.M. Large-scale Surface Subsidence Monitoring for Permafrost Degradation along the Qinghai-Tibet Highway Corridor Using SBAS-InSAR and Machine Learning. Res. Cold Arid. Reg. 2025. [Google Scholar] [CrossRef] [Scilit]
- Sun, Y.H.; Wang, Y.B.; Liao, K.D.; Jin, G.; Yue, D.X.; Guo, J.J. Potential Ecological Risk Assessment of Proposed Transportation Infrastructure on the Qinghai-Tibet Plateau. Transp. Res. Part D Transp. Environ. 2026, 151, 105164. [Google Scholar] [CrossRef] [Scilit]
- Chen, L.; Mei, L.; Zeng, B.; Yin, K.; Shrestha, D.P.; Du, J. Failure probability assessment of landslides triggered by earthquakes and rainfall: A case study in Yadong County, Tibet, China. Sci. Rep. 2020, 10, 16531. [Google Scholar] [CrossRef] [Scilit] [PubMed]
- Dang, Y.M.; Yang, Q.; Wang, W. Geodetic monitoring methods and applications for regional geological environment stability. Acta Geod. Cartogr. Sin. 2017, 46, 1336–1345. (In Chinese) [Google Scholar]
- Sun, X.Y.; Zhang, R.J.; Huang, W.; Sun, A.; Lin, L.J.; Xu, H.G.; Jiang, D.C. The Response between Glacier Evolution and Eco-Geological Environment on the Qinghai-Tibet Plateau. China Geol. 2019, 2, 1–7. [Google Scholar] [CrossRef] [Scilit]
- Fuchs, M.J.; Rexer, M.; Schaider, F. Detection and Analysis of Seismic Induced GNSS Station Motion in a North American Network Following the 2017 Chiapas Earthquake. J. Geodyn. 2022, 149, 101881. [Google Scholar] [CrossRef] [Scilit]
- Weng, B.S.; Xia, K.B.; Gong, X.Y.; Xu, P. Groundwater Storage Change and Its Response to Climate Warming in Qinghai-Tibet Plateau. J. Hydrol. 2025, 662B, 134045. [Google Scholar] [CrossRef] [Scilit]
- Mei, S.; Chu, H.-X.; Dong, L.-Y.; Fang, Z.-H.; Li, P.-F.; Zhang, F.-F.; Shan, R.; Zhao, T.-H. Influencing factors and evaluation application of regional crustal stability in the Bohai Strait. China Geol. 2019, 2, 354–363. [Google Scholar] [CrossRef] [Scilit]
- Song, S.Y.; Li, S.P.; Chen, G.; Tao, T.Y.; Li, J.C.; Zhu, Y.C.; Qu, X.C.; Li, Z.X. GNSS Imaging of Vertical Crustal Deformation in Chinese Mainland Derived from Decade-Long Continuous GNSS Measurements. Geod. Geodyn. 2026, 17, 82–94. [Google Scholar] [CrossRef] [Scilit]
- Yang, D.; Su, X.N.; Huang, J.L.; Yang, W.F. Revealing Crustal Deformation and Fault Slip Behavior of the Northern Qaidam-West Qinling Tectonic Belt Using Integrated GNSS/InSAR Observations. Adv. Space Res. 2026, 77, 4376–4396. [Google Scholar] [CrossRef] [Scilit]
- Xu, W.; Chen, S.; Li, Y.; Huang, J.; Zheng, B.; Han, Y.; Chen, Z.; Zheng, Q.; Lu, H.; Wang, L.; et al. Quantifying of Spatio-Temporal Variations in the Regional Gravity Field and the Effectiveness of Earthquake Prediction: A Case Study of MS ≥ 5.0 Earthquakes in the Sichuan-Yunnan Region during 2021–2024. Earthq. Sci. 2025, 38, 375–390. [Google Scholar] [CrossRef] [Scilit]
- Zhu, Y.; Liu, F.; Zhang, G.; Xu, Y. Development and prospect of mobile gravity monitoring and earthquake forecasting in recent ten years. Geod. Geodyn. 2019, 10, 485–491. [Google Scholar] [CrossRef] [Scilit]
- Li, S.; Zhu, C.; Zhu, Y.; Jia, Y.; Zhang, Q.; Lu, H.; Zhang, G. Study on non-tectonic gravity effects in western Shandong. Sci. Rep. 2025, 15, 42485. [Google Scholar] [CrossRef] [Scilit] [PubMed]
- Zhan, W.; Tian, Y.; Zhang, Z.; Zhu, C.; Wang, Y. Seasonal patterns of 3D crustal motions across the seismically active southeastern Tibetan Plateau. J. Asian Earth Sci. 2020, 192, 104274. [Google Scholar] [CrossRef] [Scilit]
- Hu, M.Z.; Chen, S.; Zhu, Y.Q.; Xu, X.Y.; Zhou, J.C.; Hao, H.T.; Huang, J.P.; Xu, D. Review of earthquake mobile gravity observation and research in Mainland China. J. Seismol. Res. 2025, 48, 531–549. (In Chinese) [Google Scholar] [CrossRef]
- Liang, X.; Chen, S.; Chu, F.; Xu, R.; Sun, H.; Xiao, W.; Song, H.; Li, S. Resolution analysis of the gravity survey network in the middle and south sections of Tan-Lu fault and recent changes in the gravity field. Geod. Geodyn. 2025, 16, 241–250. [Google Scholar] [CrossRef] [Scilit]
- Yang, X.; Zhu, Y.Q.; Zhao, Y.F.; Wei, S.C. Relationship between Gravity Change and Yangbi MS6.4 Earthquake. Geod. Geodyn. 2023, 14, 321–330. [Google Scholar] [CrossRef] [Scilit]
- Zhu, Y.; Liu, F.; You, X.; Liang, W.; Zhao, Y.; Liu, L. Earthquake prediction from China’s mobile gravity data. Geod. Geodyn. 2015, 6, 81–90. [Google Scholar] [CrossRef] [Scilit][Green Version]
- Jia, L.; Chen, S.; Wang, L.; Lu, H.; Liu, M.; Xu, W.; He, Z.; Chen, Z.; Han, J. New evidence from hybrid ground-based gravity observations of a regional gravity increase in southern Tibet before 2015. Tectonophysics 2026, 925, 231096. [Google Scholar] [CrossRef] [Scilit]
- Greco, F.; Riguzzi, F.; Berrino, G. Insights into seismogenetic areas in central Italy from combined absolute gravity and GNSS measurements. Remote Sens. 2021, 13, 4649. [Google Scholar] [CrossRef] [Scilit]
- Liu, F.; Wang, Y.W.; Liang, W.F. Field Source Characteristic of Gravity Variation in Hexi Region before Menyuan Ms6.4 Earthquake. Geod. Geodyn. 2016, 7, 317–322. [Google Scholar] [CrossRef] [Scilit]
- Zhao, C.; Li, J.; Song, Y.Z.; Li, J.; Chen, J.L. On the Feasibility of Detecting Coseismic Gravity-Change Signals of the 2023 Turkey Double Earthquakes from Satellite Gravimetry. Geod. Geodyn. 2026. [Google Scholar] [CrossRef] [Scilit]
- Tang, H.; Sun, W.K. Theories and Applications of Earthquake-Induced Gravity Variation: Advances and Perspectives. Earthq. Sci. 2023, 36, 376–415. [Google Scholar] [CrossRef] [Scilit]
- Rao, W.; Liu, B.; Feng, T.; Wang, Q.; Tang, H. What is the present-day tectonic uplift rate of the Tibetan Plateau? Earth Planet. Sci. Lett. 2025, 662, 119389. [Google Scholar] [CrossRef] [Scilit]
- Rao, W.L.; Sun, W.K. Uplift of the Tibetan Plateau: How to accurately compute the hydrological load effect? J. Geophys. Res. Solid Earth 2022, 127, e2021JB022475. [Google Scholar] [CrossRef] [Scilit]
- Deng, Q. New active tectonic map of China. In Proceedings of the 8th Academic Conference of the Chinese Seismological Society, Beijing, China, 4–8 August 2000; p. 65. (In Chinese) [Google Scholar]
- Zhang, L.; Sun, D.X.; Li, X.; Hu, J.; Xu, D.G. Regional crustal stability evaluation of Zhuhai City based on GIS platform. Geol. Bull. China 2026, 1–28. Available online: https://link.cnki.net/urlid/11.4648.P.20260411.0927.002 (accessed on 17 August 2026). (In Chinese)
- Zhang, C.S.; Zhang, S.X.; Yang, W.M.; Meng, H.J.; Lyu, J.J.; Zhang, T.T.; Wu, J.H.; Guo, H. Regional crustal stability evaluation of Shenfu New Area, Liaoning Province. J. Geomech. 2021, 27, 453–462. (In Chinese) [Google Scholar]
- Zheng, C.H.; Qian, J.Z.; Hou, X.L. Regional crustal stability evaluation of the Anhui section of the Tanlu Fault Zone. J. Hefei Univ. Technol. (Nat. Sci.) 2020, 43, 1398–1403. (In Chinese) [Google Scholar]
- Yang, D.; Su, X. Crustal deformation pattern of the Laji Shan–Jishi Shan Tectonic Belt from integrated GNSS and InSAR observations. Geophys. J. Int. 2026, 246, ggag233. [Google Scholar] [CrossRef] [Scilit]
- Wei, T.; Xia, M.Y.; Zhang, X.X.; Qi, S.J. Investigating the Reactivation of Historical Landslides during the 2022 Luding MS6.8 Earthquake. Earthq. Sci. 2024, 37, 200–209. [Google Scholar] [CrossRef] [Scilit]
- Guo, S.; Li, J.; Qi, S.; Zheng, B.; Zhang, Y.; Zou, Y.; Zhu, W.; Waqar, F.M.; Zada, K. Stress disturbance around Xianshuihe fault zone in the eastern Qinghai–Tibet Plateau and implication for fault stability. Front. Earth Sci. 2024, 12, 1373353. [Google Scholar] [CrossRef] [Scilit]
- Zheng, W.J.; Sun, X.; Yuan, D.Y.; Pan, J.; Wang, H.; Wu, C.; Zhang, Z.; Hao, M.; He, X.; Liu, B.; et al. Active faults, seismic activity, and seismotectonic environments in the Tibetan Plateau and its adjacent regions. J. Geomech. 2025, 31, 1006–1029. (In Chinese) [Google Scholar] [CrossRef]
- Li, P.G.; Liao, L.; Feng, J.Z. The Relationship between Stress Changes and Strong Earthquakes since 1900 around the Bayan Har Block in Northern Tibet, China. J. Asian Earth Sci. 2019, 184, 103974. [Google Scholar] [CrossRef] [Scilit]

Disclaimer/Publisher’s Note: The statements, opinions and data contained in all publications are solely those of the individual author(s) and contributor(s) and not of MDPI and/or the editor(s). MDPI and/or the editor(s) disclaim responsibility for any injury to people or property resulting from any ideas, methods, instructions or products referred to in the content. |
© 2026 by the authors. Licensee MDPI, Basel, Switzerland. This article is an open access article distributed under the terms and conditions of the Creative Commons Attribution (CC BY) license.