


Abstract
Determining the shear strength parameters of granular materials in high waste rock dump slopes is essential for reliable slope stability analysis. In this study, dump materials were sampled from six benches (elevations 2800–2950 m) of an open-pit mine dump slope, and in situ density tests, gradation analyses, and large-scale consolidated drained (CD) triaxial tests were performed. Two PFC2D slope models—one with uniform (spatially averaged) parameters and one with elevation-dependent (layered) parameters—were then established to quantify how spatial heterogeneity affects stability predictions. The results show pronounced vertical heterogeneity: density, porosity, gradation, and shear strength parameters vary systematically among benches, reflecting the combined effects of compaction history and particle segregation during dumping. All specimens exhibited strain hardening and continuous shear contraction, and specimens with a denser, better-graded structure showed higher strength and lower compressibility. The layered model yields a higher factor of safety and shallower, bench-scale slip surfaces, whereas the uniform model underestimates stability and misplaces the critical slip zones. These findings demonstrate that elevation-dependent parameter assignment better represents the heterogeneous failure mechanism of high dump slopes and should be preferred over uniform parameterization in stability analyses of similar waste rock dumps.
1. Introduction
Open-pit mine dump slopes are artificial slopes formed by the accumulation of stripped waste rocks. They are characterized by large accumulation heights, complex material compositions, and strong spatial heterogeneity. Slope instability poses a significant threat to the safety of mine production. The physical and mechanical parameters of the granular materials in dump slopes, particularly the shear strength and compressive deformation parameters, are the fundamental basis for slope stability evaluation and numerical simulation analysis. However, because dumped materials typically possess characteristics such as a wide range of particle sizes, complex gradations, and obvious differences in accumulation states, their mechanical properties often exhibit significant non-uniformity and scale effects, leading to considerable uncertainties in parameter determination.
Currently, scholars worldwide have conducted systematic research from multiple perspectives. Regarding the relationship between the gradation characteristics and mechanical properties of granular materials, Zhang et al. [1] proposed a new gradation equation for coarse-grained soils, and Wu et al. [2] established a single-parameter gradation equation, providing mathematical tools for quantifying the impact of gradation on mechanical performance. Zhang et al. [3] proposed a nonlinear failure strength criterion based on the rock block proportion (RBP). Yang et al. [4] demonstrated through large-scale triaxial tests that a reasonable continuous gradation can form a stable coarse-particle skeleton, thereby improving the overall compactness and strength of the material.
In terms of experimental research methods, large-scale triaxial tests and direct shear tests have become the basis for obtaining macroscopic mechanical parameters due to the presence of large-sized rock blocks in granular materials. Zou et al. [5] investigated the scale effect on the dynamic characteristics of rockfill materials using an ultra-large triaxial apparatus. Qi et al. [6] found through cyclic direct shear tests that the RBP significantly affects the peak shear stress at the geogrid–SRM interface. Wen et al. [7] revealed the softening effect of moisture content on shear strength and the influence of shear rate on strain hardening. Yang et al. [8] showed via large-scale triaxial shear tests that RBP and confining pressure are the core factors affecting the stress–strain relationship, shear strength parameters, and stiffness; as the RBP increases, the internal friction angle increases significantly, while the change in cohesion depends on the compaction degree and moisture content of the fine-grained soil [9]. Furthermore, freeze–thaw cycles can weaken the inter-particle cementation, reducing the overall shear strength [10]. The discrete element method (DEM) has become a crucial tool for studying the meso-mechanical mechanisms of SRMs. Yang et al. [11] simulated large-scale direct shear tests based on PFC3D and analyzed the contributions of particle breakage and rearrangement to macroscopic shear strength. Liu [12] used PFC2D to simulate the evolution of shear strength in coal gangue SRMs under wetting–drying cycles. In recent years, digital image processing technology has been utilized to construct more realistic three-dimensional microstructural models [13]. The force-chain network formed by particle interlocking is the primary mechanism for resisting external loads [14], and irregularly shaped rock blocks can provide stronger interfacial interlocking forces [15].
Density, void ratio, and moisture state exert a significant controlling effect on the compressive and shear deformation characteristics of granular materials. The deformation mechanism of SRMs depends on the complex coupling effects between the rock block skeleton and the fine-grained matrix [16,17]. Under high-density states, compressive deformation mainly originates from the elastic compression and local breakage of particles [18]; when the RBP exceeds approximately 70%, the compressibility is extremely sensitive to changes in the void ratio [19]. The properties of the fine-grained soil are equally critical: in a low-plasticity matrix, compressibility is limited by particle rearrangement, whereas in high-plasticity clay, creep can lead to significant volumetric shrinkage [20]. Regarding the moisture state, matric suction in the unsaturated state enhances shear strength [21,22], and cohesion decreases significantly with increasing moisture content [23]. Wetting–drying cycles can weaken interfacial cementation, leading to long-term strength degradation [24]. Under drained conditions, the moisture content primarily causes a slight reduction in the internal friction angle [25,26]. High-density SRMs have poor pore connectivity and are prone to forming local weak planes [27,28]; low-density SRMs are more susceptible to overall volumetric compression when moisture content increases [29].
In the context of dump slope stability analysis, dump slopes are complex geological bodies formed by the natural accumulation of rock–soil mixtures with varying particle sizes and mineral compositions, and their shear strength parameters exhibit significant spatial variability [30,31]. This heterogeneity is profoundly reflected in the stress dependency and particle gradation reconstruction effects that occur in the vertical direction as the accumulation elevation increases [32]. With the increase in accumulation height, the normal stress of the bottom dumped materials increases, leading to an increase in cohesion and a decrease in the internal friction angle; thus, adopting uniform strength parameters will introduce considerable errors [33]. The particle size segregation effect, caused by particle rolling along the slope surface, results in completely different mechanical responses between surficial and deep materials, with the critical height typically controlled at 60–70 m [34]. Such heterogeneity causes deviations between the uniform sliding surface assumed in traditional limit equilibrium methods and the actual failure mechanisms, thereby potentially underestimating the risk of instability in high and steep slopes..
The geotechnical characterization of mine waste rock dumps has received sustained attention. Igwe and Chukwu [35,36] evaluated the mechanical properties and stability of mine waste dumps and tailings in southeastern Nigeria, demonstrating systematic variations in shear strength with material composition. Kainthola et al. [37] analyzed the stability of a coal mine dump in India, highlighting the controlling role of dump material strength on the failure mode. Poulsen et al. [38] documented a mine overburden dump failure, and Hawley and Cunning [39] synthesized international practice for waste dump design, both emphasizing the heterogeneity of dumped materials. Zhang et al. [40] investigated the mechanical properties and slope stability of a copper mine waste dump, showing that bench-scale heterogeneity governs local failure. Collectively, these studies establish that dumped waste rock is a heterogeneous, broadly graded material whose properties vary with elevation, dumping history, and particle segregation. However, the vertical variability of measured strength parameters within a single dump is rarely quantified with large-scale multi-bench testing, and the error introduced by adopting uniform strength parameters in stability analyses—relative to elevation-dependent assignment—has not been systematically evaluated.
In summary, existing studies are mostly based on indoor single-factor controlled tests. There is still a relative lack of systematic research on the natural differences in materials across different elevations and platforms of dump slopes formed by rapid on-site accumulation, as well as the impact of these differences on mechanical parameters. Furthermore, a unified consensus on how to rationally select calculation parameters that reflect the actual heterogeneity is still lacking. Based on this, taking a specific mine dump slope as the research object, combined with in situ density measurements and indoor large-scale triaxial tests, this paper systematically analyzes the gradation characteristics, compression behavior, and shear strength parameters of broadly graded SRMs. By utilizing PFC2D discrete element simulations, the impacts of uniform parameter assignment versus elevation-specific assignment on the slope’s factor of safety (FOS) and sliding surface displacement are compared. This study aims to provide a basis for engineering parameter selection and stability analysis in similar dump slopes.
2. Experimental Study on Strength and Deformation Characteristics of Granular Materials
2.1. Experimental Materials
2.1.1. Material Source
The experimental materials were collected from a specific mine dump slope at various elevations: 2950 m (1#), 2920 m (2#), 2890 m (3#), 2860 m (4#), 2830 m (5#), and 2800 m (6#). Six sampling sites were selected, located specifically at the top and bottom regions of the benches.
The in situ density, moisture content, and porosity of the granular materials at each elevation were measured through a series of field tests, including in situ density tests and moisture content determinations. The results are summarized in Table 1.
Table 1.
Physical parameters of granular materials at different elevations.
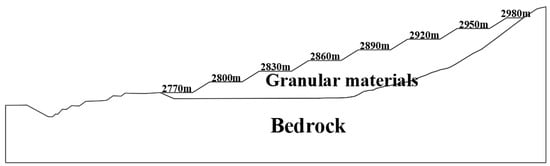
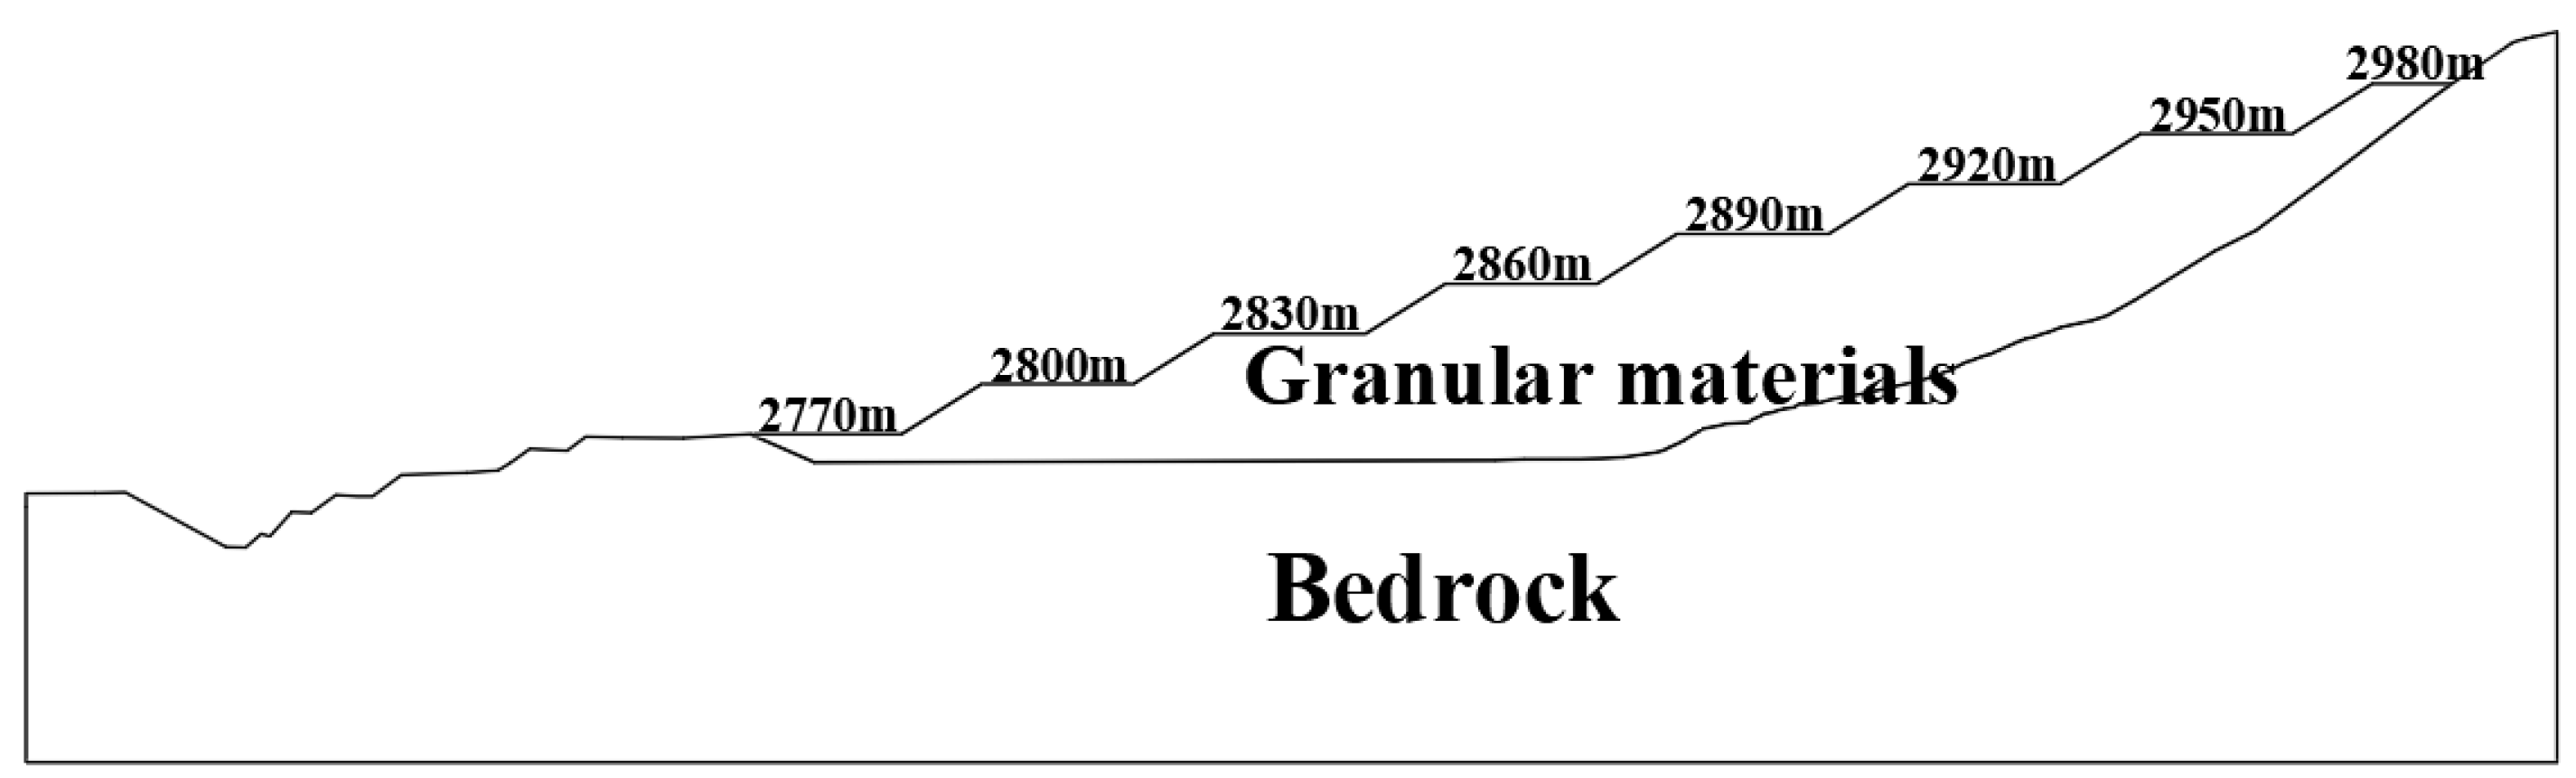
The dump slope was formed by bench-wise dumping, and each bench platform is accessible through the haul-road network; therefore, sampling did not require work on the slope face. At each of the six elevations, two sampling points were established—one near the platform crest and one near the platform toe—to represent the corresponding bench. At each point, in situ density was measured using the water-replacement (water-bag) method in accordance with GB/T 50123-2019 [41]. A test pit of approximately 0.5 m × 0.5 m × 0.5 m was excavated mechanically and trimmed manually; all excavated material was collected and weighed, and the pit volume was determined from the mass of water required to fill the pit through a flexible membrane. Representative bulk samples of approximately 500 kg per elevation were obtained from the excavated material by quartering for gradation analysis and specimen preparation. Natural moisture content was determined by oven-drying at 105–110 °C using subsamples sealed in the field immediately after excavation, and porosity was calculated from the measured dry density and particle specific gravity. All fieldwork was conducted on the flat bench platforms under the supervision of the mine safety officer. The dump consists of seven benches, each 30 m high, with bench-face angles of 35° and an overall slope angle of 13° (Figure 1, drawn to scale).
Figure 1.
Geometric model of the dump slope (drawn to scale; seven 30 m high benches with face angles of 35° and an overall slope angle of 13°).
2.1.2. Gradation Characteristics of Granular Materials
Since the maximum allowable particle size for the large-scale laboratory testing apparatus is 60 mm, the prototype gradation must be scaled. In this study, the equal-replacement method was adopted. The mass of the oversize particles (larger than 60 mm) was proportionally distributed within the size range of 5 mm to 60 mm. This procedure was implemented to maintain the original ratio between coarse and fine particles, ensuring that the scaled specimens retain structural characteristics similar to those of the prototype gradation. The scaled gradations were used for the preparation of specimens for large-scale triaxial tests. The resulting scaled gradations are presented in Table 2. Because all six specimens were scaled using the same procedure, any residual scaling effect should influence the groups in a similar manner, preserving the relative comparison among elevations. The equal-replacement method was selected after the available scaling techniques were compared. Recent work has shown that the parallel-gradation technique may not reproduce a truly parallel particle size distribution and may provide unreliable estimates of the field friction angle, whereas scalping has been validated for large-scale direct shear testing of rockfill and waste rock [42]. The equal-replacement scaling technique is a practical compromise imposed by the limitations of the laboratory apparatus, rather than a theoretically perfect equivalence. The maximum particle size is reduced from the prototype (≈600 mm) to the laboratory scale (60 mm), and this reduction inevitably introduces systematic biases in absolute strength values.
Table 2.
Scaled gradation results of granular materials at different elevations.
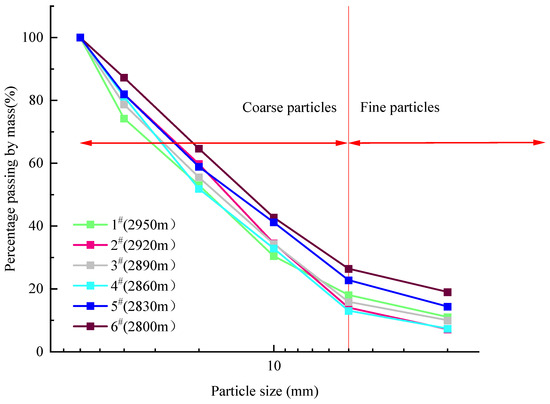
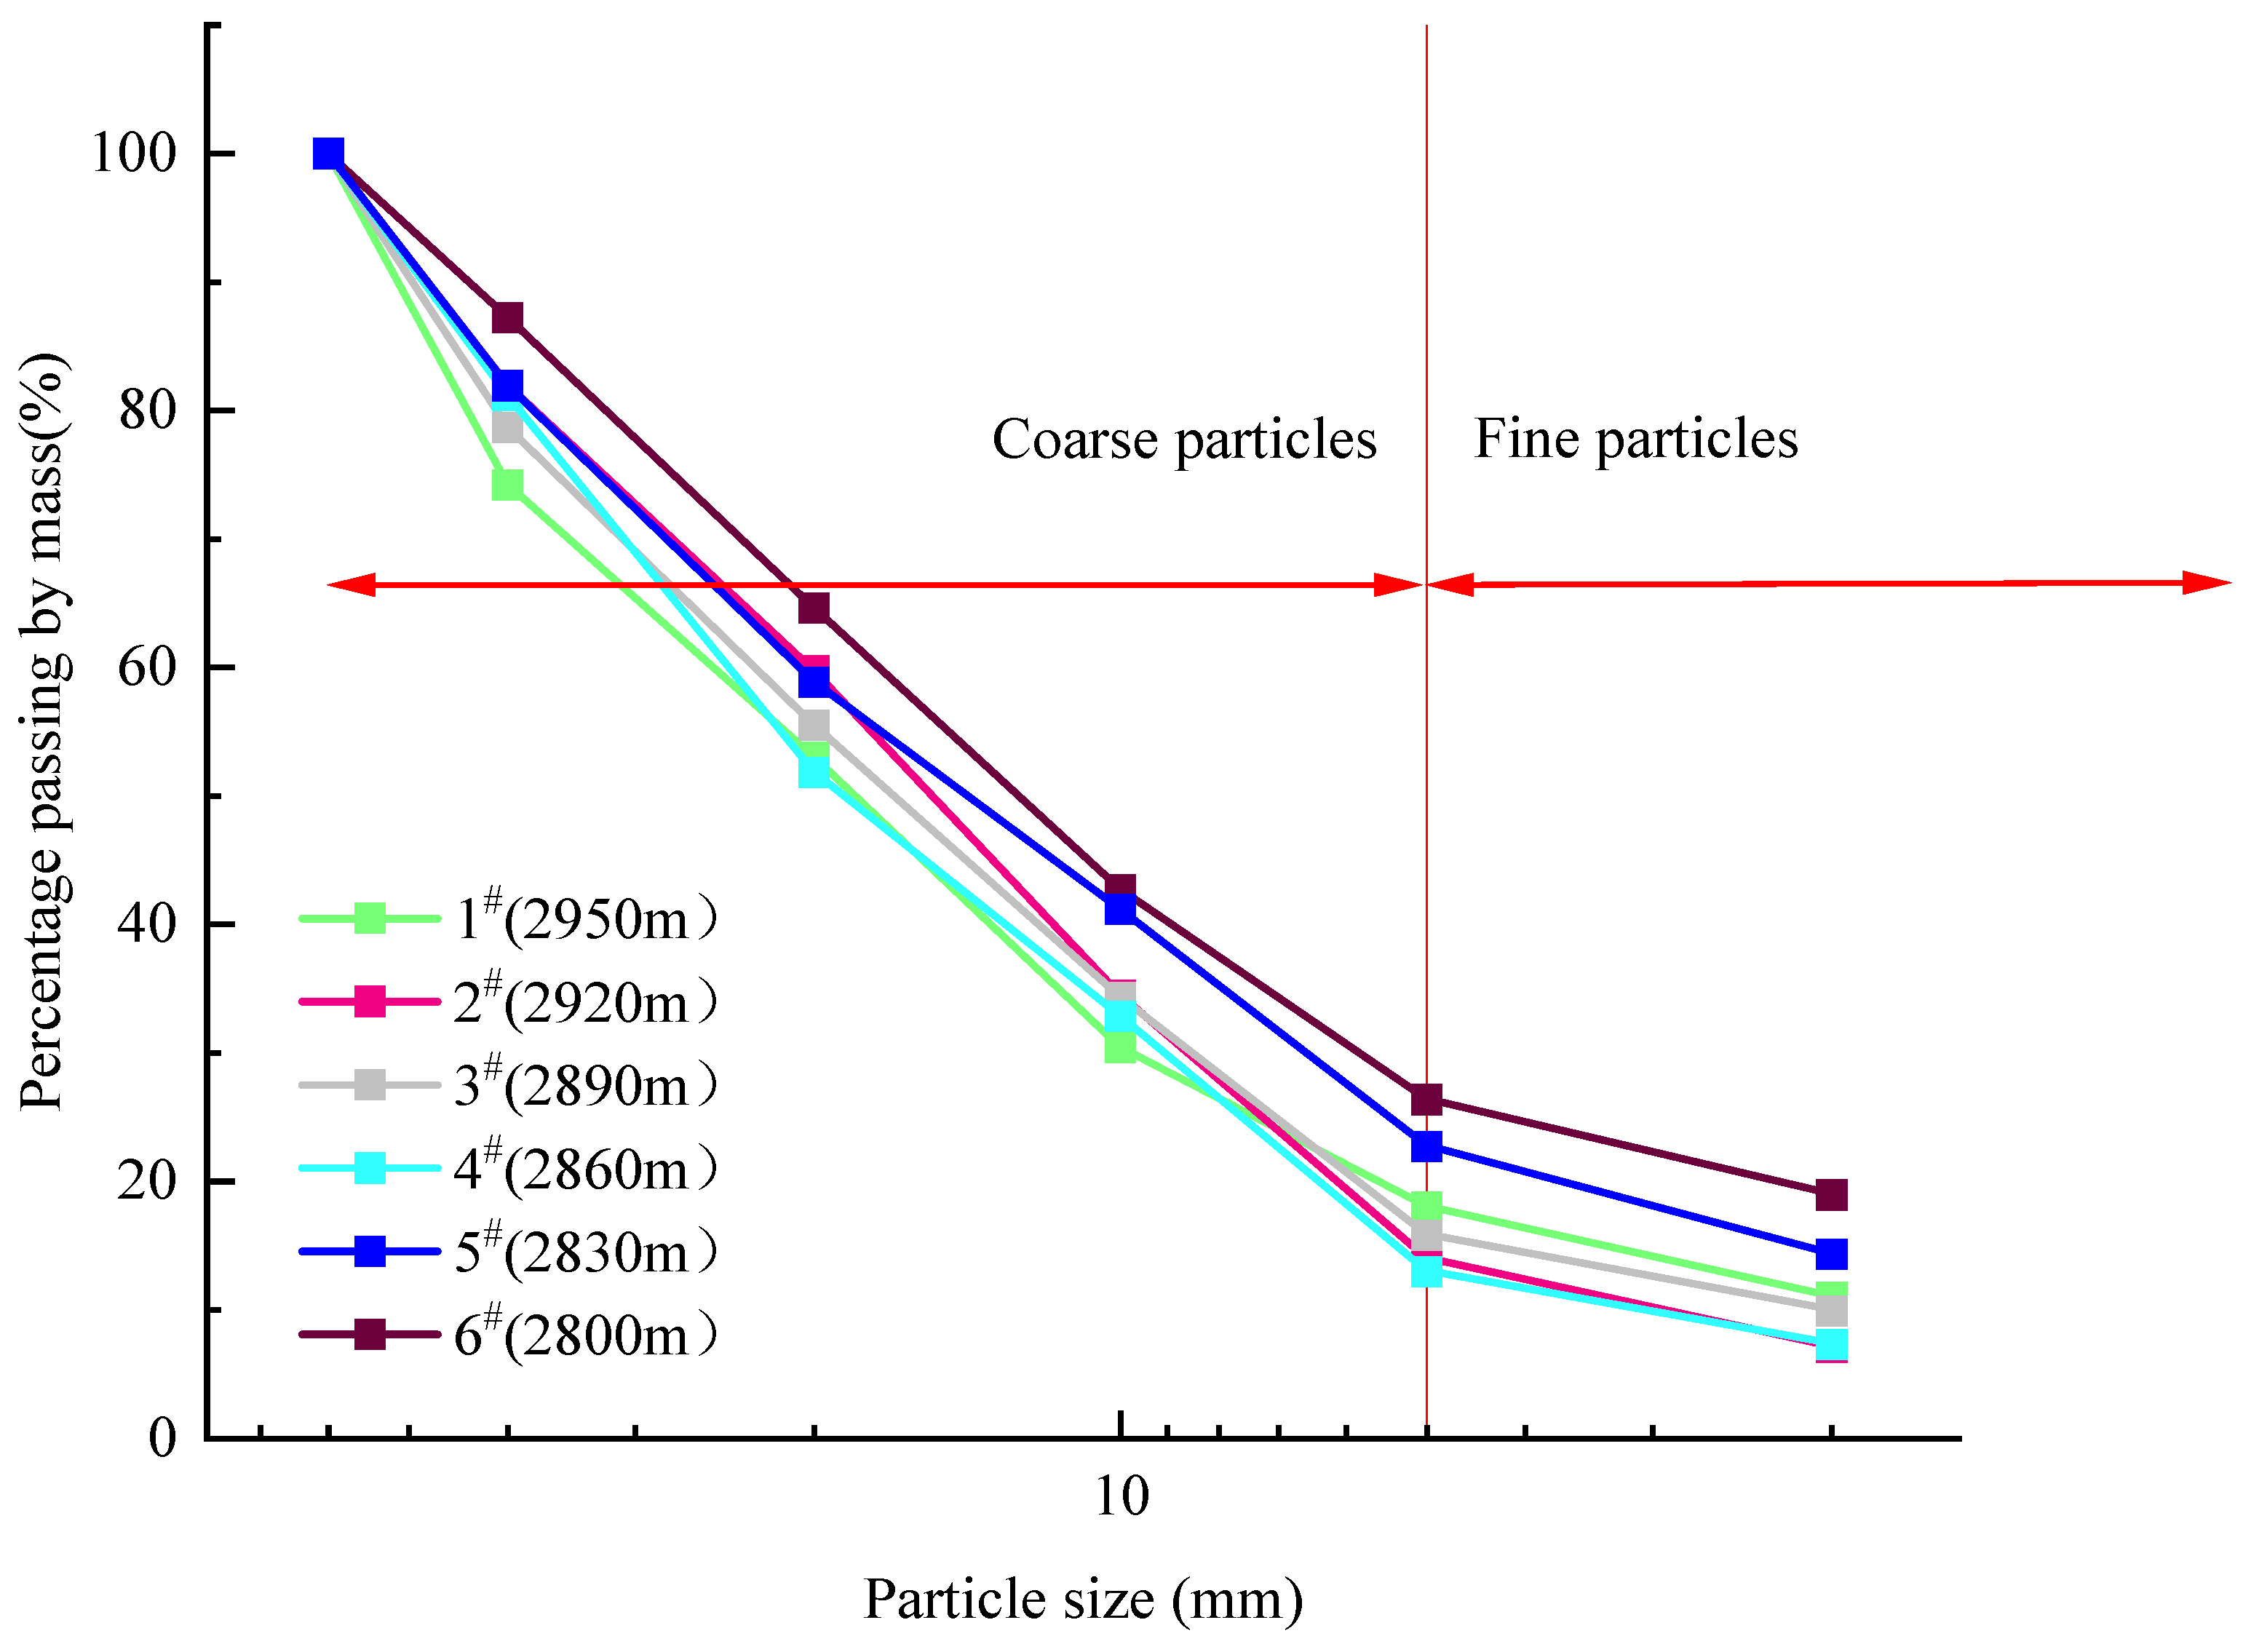
Based on the sieve analysis results, the cumulative particle size distribution curves were plotted for the materials from each elevation, as shown in Figure 2. The resulting gradation parameters are presented in Table 3. The coefficients of uniformity (Cu) are greater than 5 at all elevations, indicating broadly graded particle size distributions with a marked contrast between coarse and fine fractions. The coefficients of curvature (Cc) for specimens 2# and 5# fall outside the range 1–3, indicating gap-graded distributions. Except for these two specimens, the materials are classified as well-graded granular materials. In this study, the fine/coarse boundary is defined at 5 mm according to the P5 convention for coarse-grained soils in GB/T 50123-2019 [41], rather than the 4.75 mm sand–gravel boundary used in ASTM/USCS practice.
Figure 2.
Gradation cumulative curves of granular materials at different elevations. The red line denotes the boundary between coarse and fine particles, and the arrows indicate the demar-cated ranges of coarse and fine particles.
Table 3.
Statistical particle size characteristics of the scaled gradations of the test specimens at different elevations.
2.2. Experimental Equipment
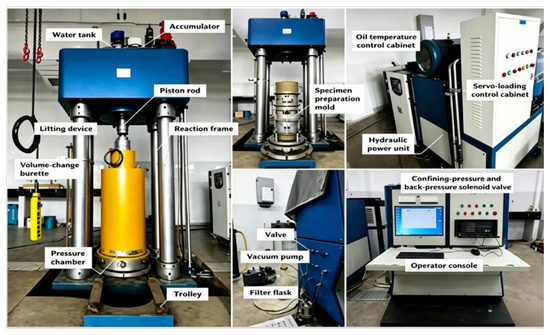
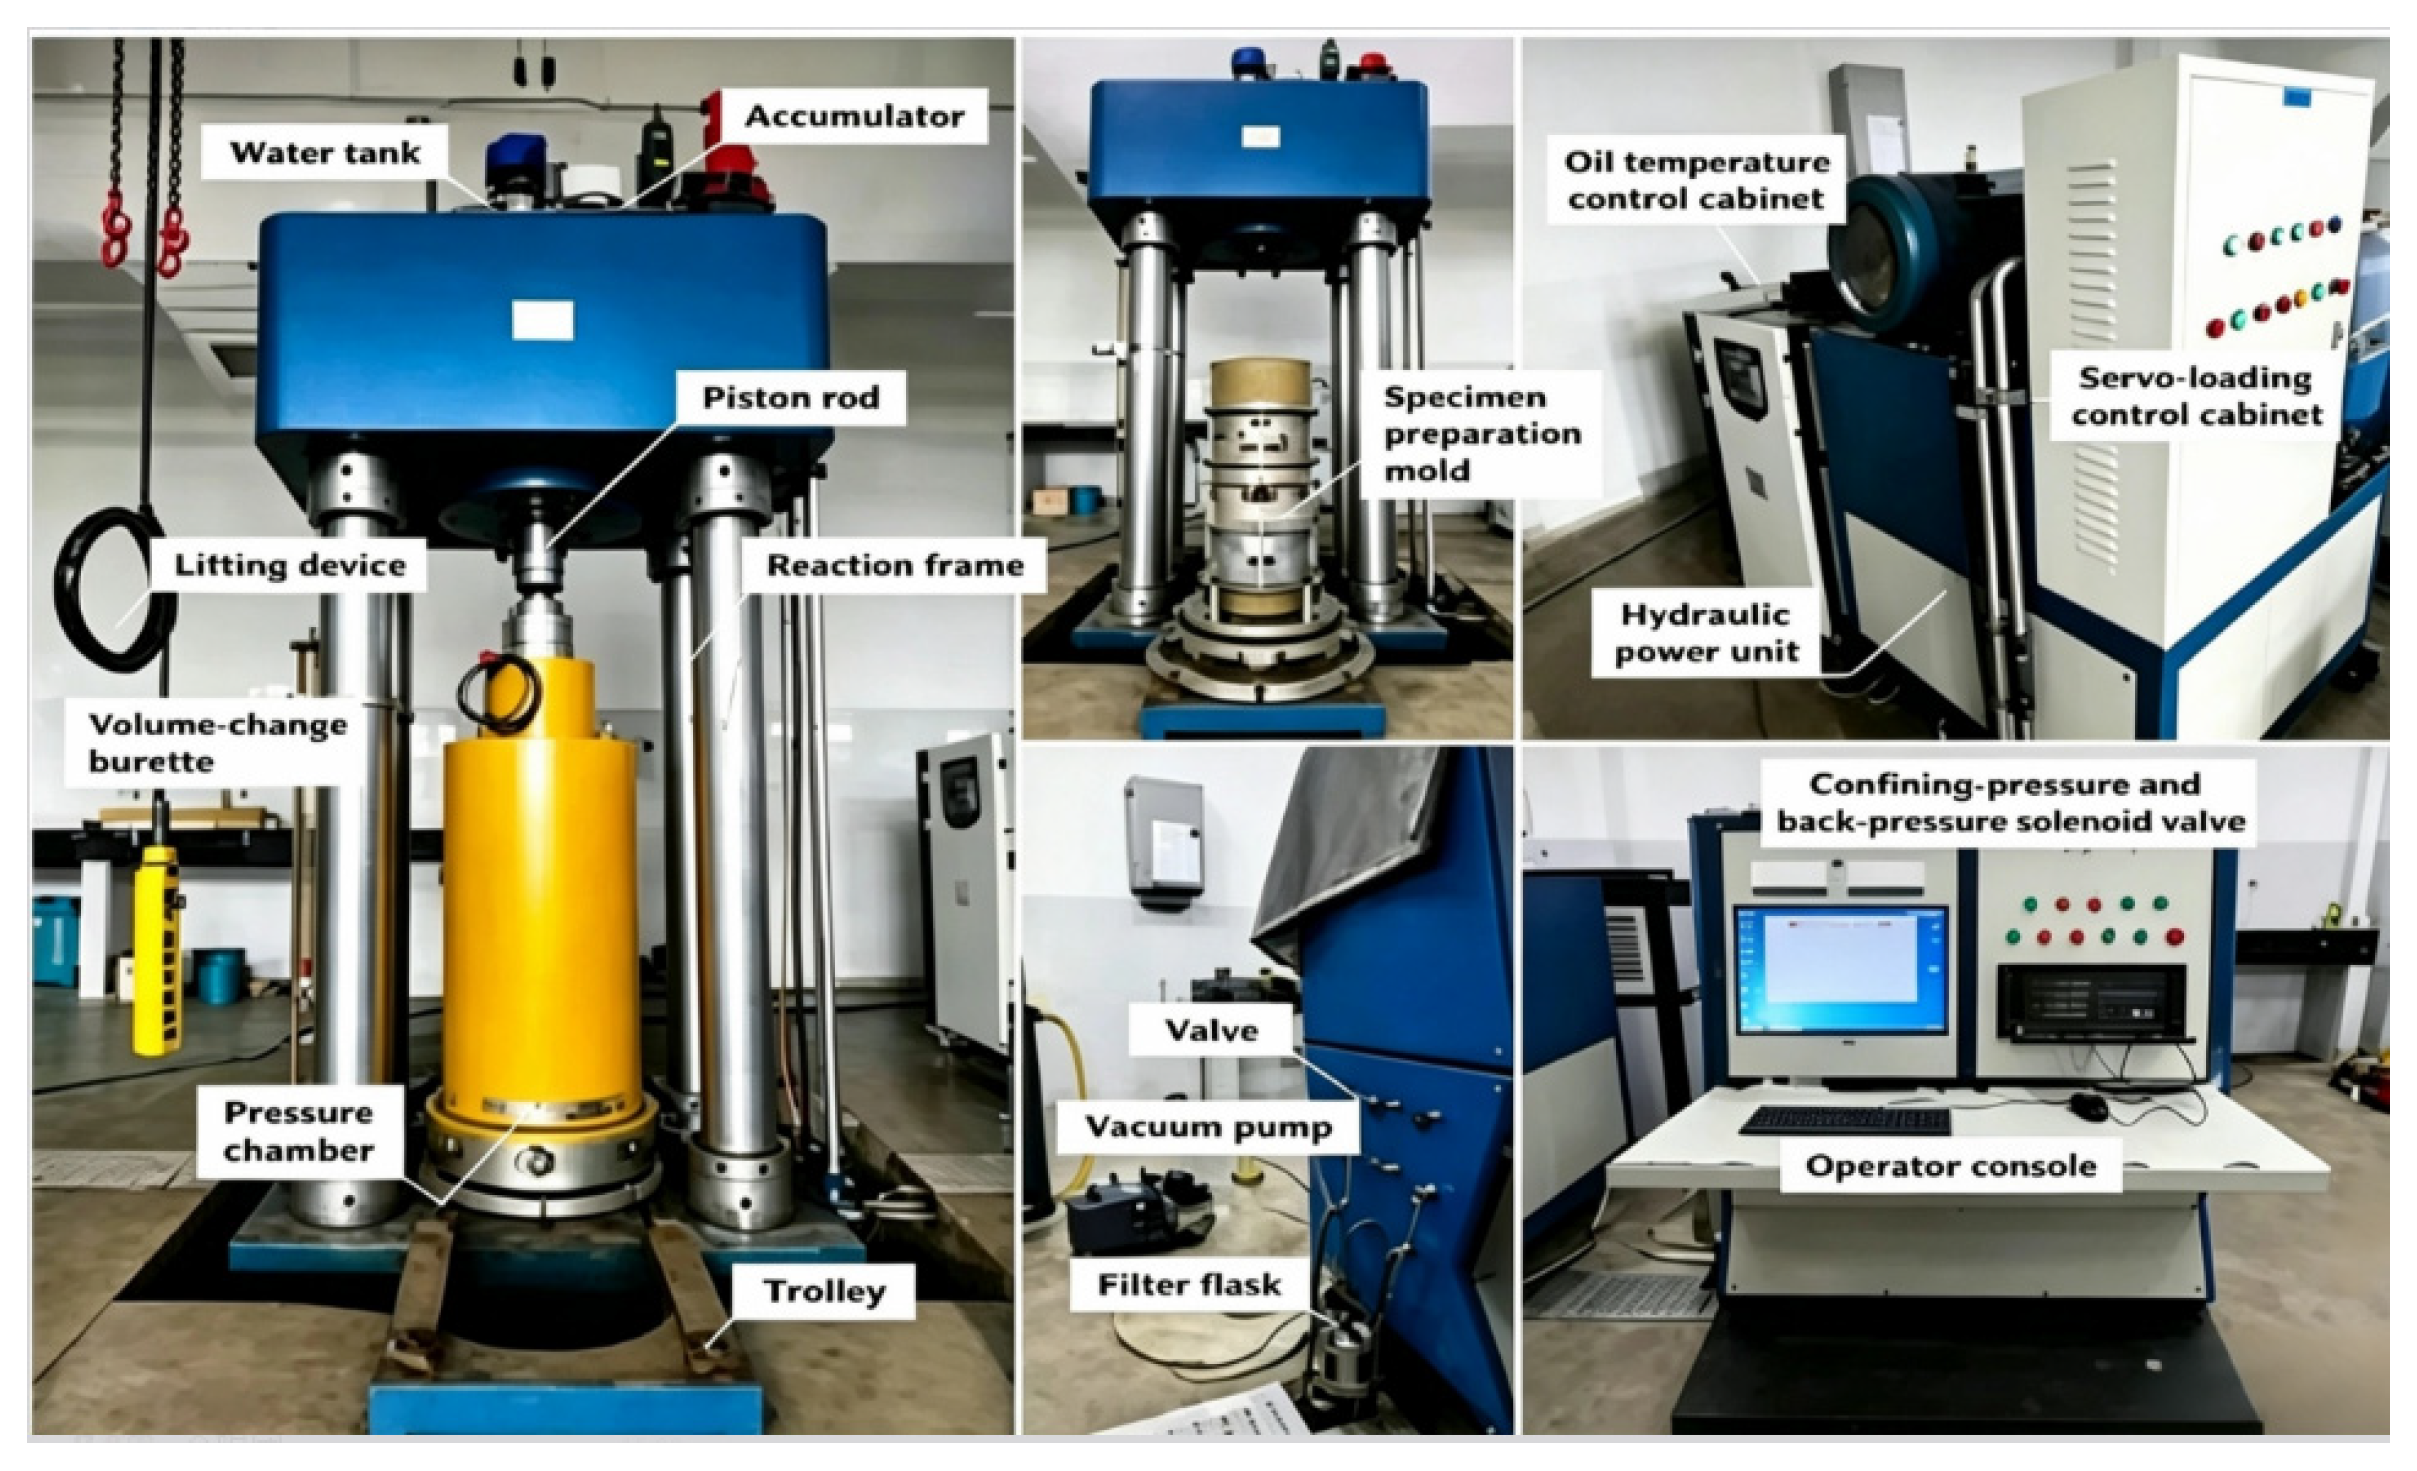
A DJSZ-150 large-scale dynamic–static triaxial testing system for coarse-grained soil was used to perform consolidated drained (CD) triaxial compression tests, with specimen dimensions of 300 mm × 600 mm (Figure 3). The specimen-diameter-to-maximum-particle-size ratio is 5 (D = 300 mm, dmax = 60 mm), which satisfies the requirement of D/dmax ≥ 5 for large-scale triaxial tests on coarse-grained soils in GB/T 50123-2019 [41]. Available experimental evidence indicates that the specimen size effects on the measured strength of broadly graded coarse materials becomes limited once this ratio is reached [43]. Since all specimens were tested at the identical ratio, the relative comparison among elevations is unaffected. The specimens were prepared using the layered compaction method. After vacuum saturation, the specimens were isotropically consolidated under confining pressures of 200 kPa, 400 kPa, and 600 kPa. These pressures were selected to bracket the in situ stress range relevant to bench-scale stability: with a bulk unit weight of 18.3–23.0 kN/m3, they correspond to overburden depths of approximately 9–33 m, covering the stress levels acting on potential slip surfaces within the 30 m high benches. Upon completion of consolidation, drained shearing was conducted at a shear rate of 1 mm/min with the drainage valves open throughout. Failure at 15% axial strain of the 600 mm high specimens required approximately 90 min, and the pore-water pressure measured at the specimen base remained within −3.8 kPa to +2.7 kPa (within ±2% of the confining pressure) throughout shearing, supporting the assumption of fully drained conditions.
Figure 3.
DJSZ-150 large-scale dynamic and static triaxial testing machine for coarse-grained soil.
2.3. Test Results and Analysis
Triaxial compression tests were conducted on the granular materials from different elevations under confining pressures of 200 kPa, 400 kPa, and 600 kPa.
2.3.1. Analysis of Deviatoric Stress–Axial Strain Curves
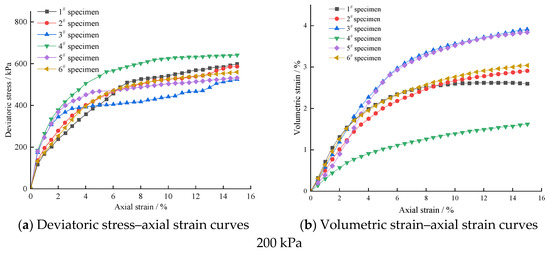
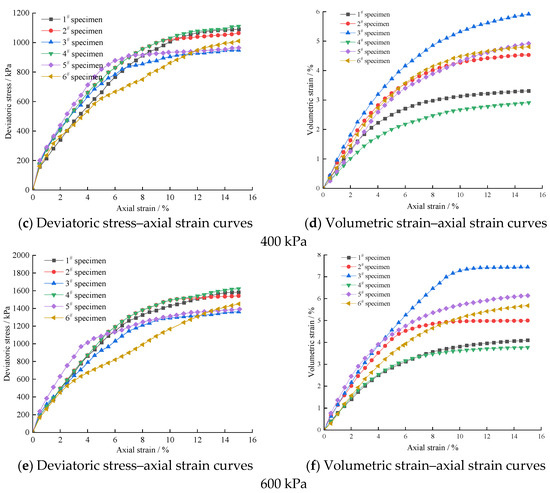
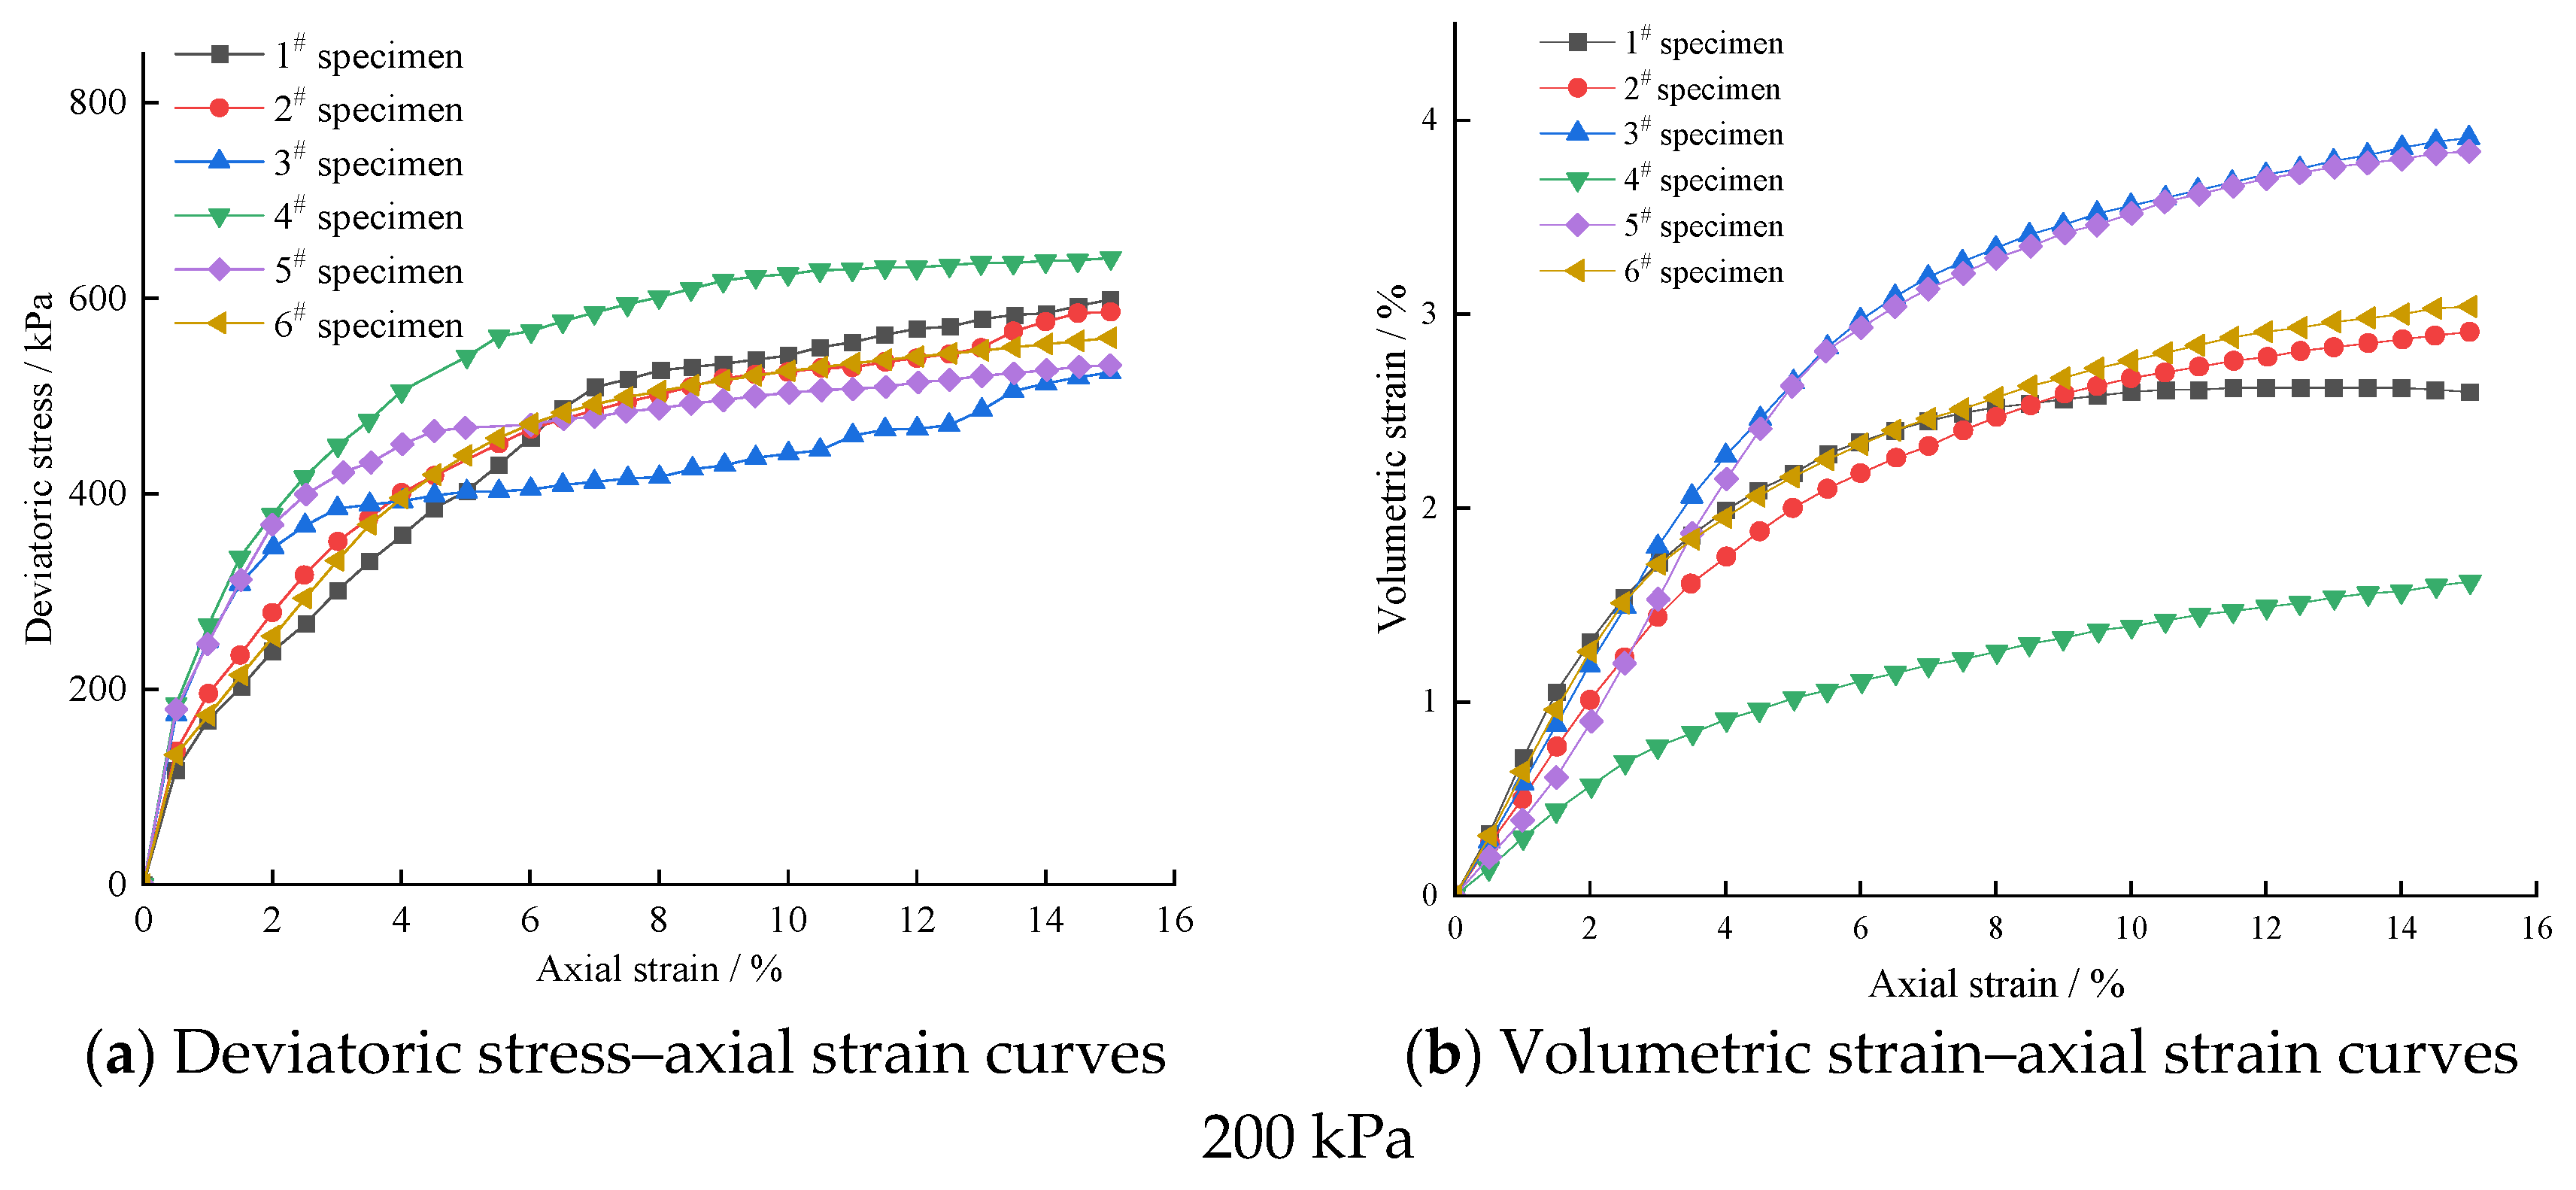
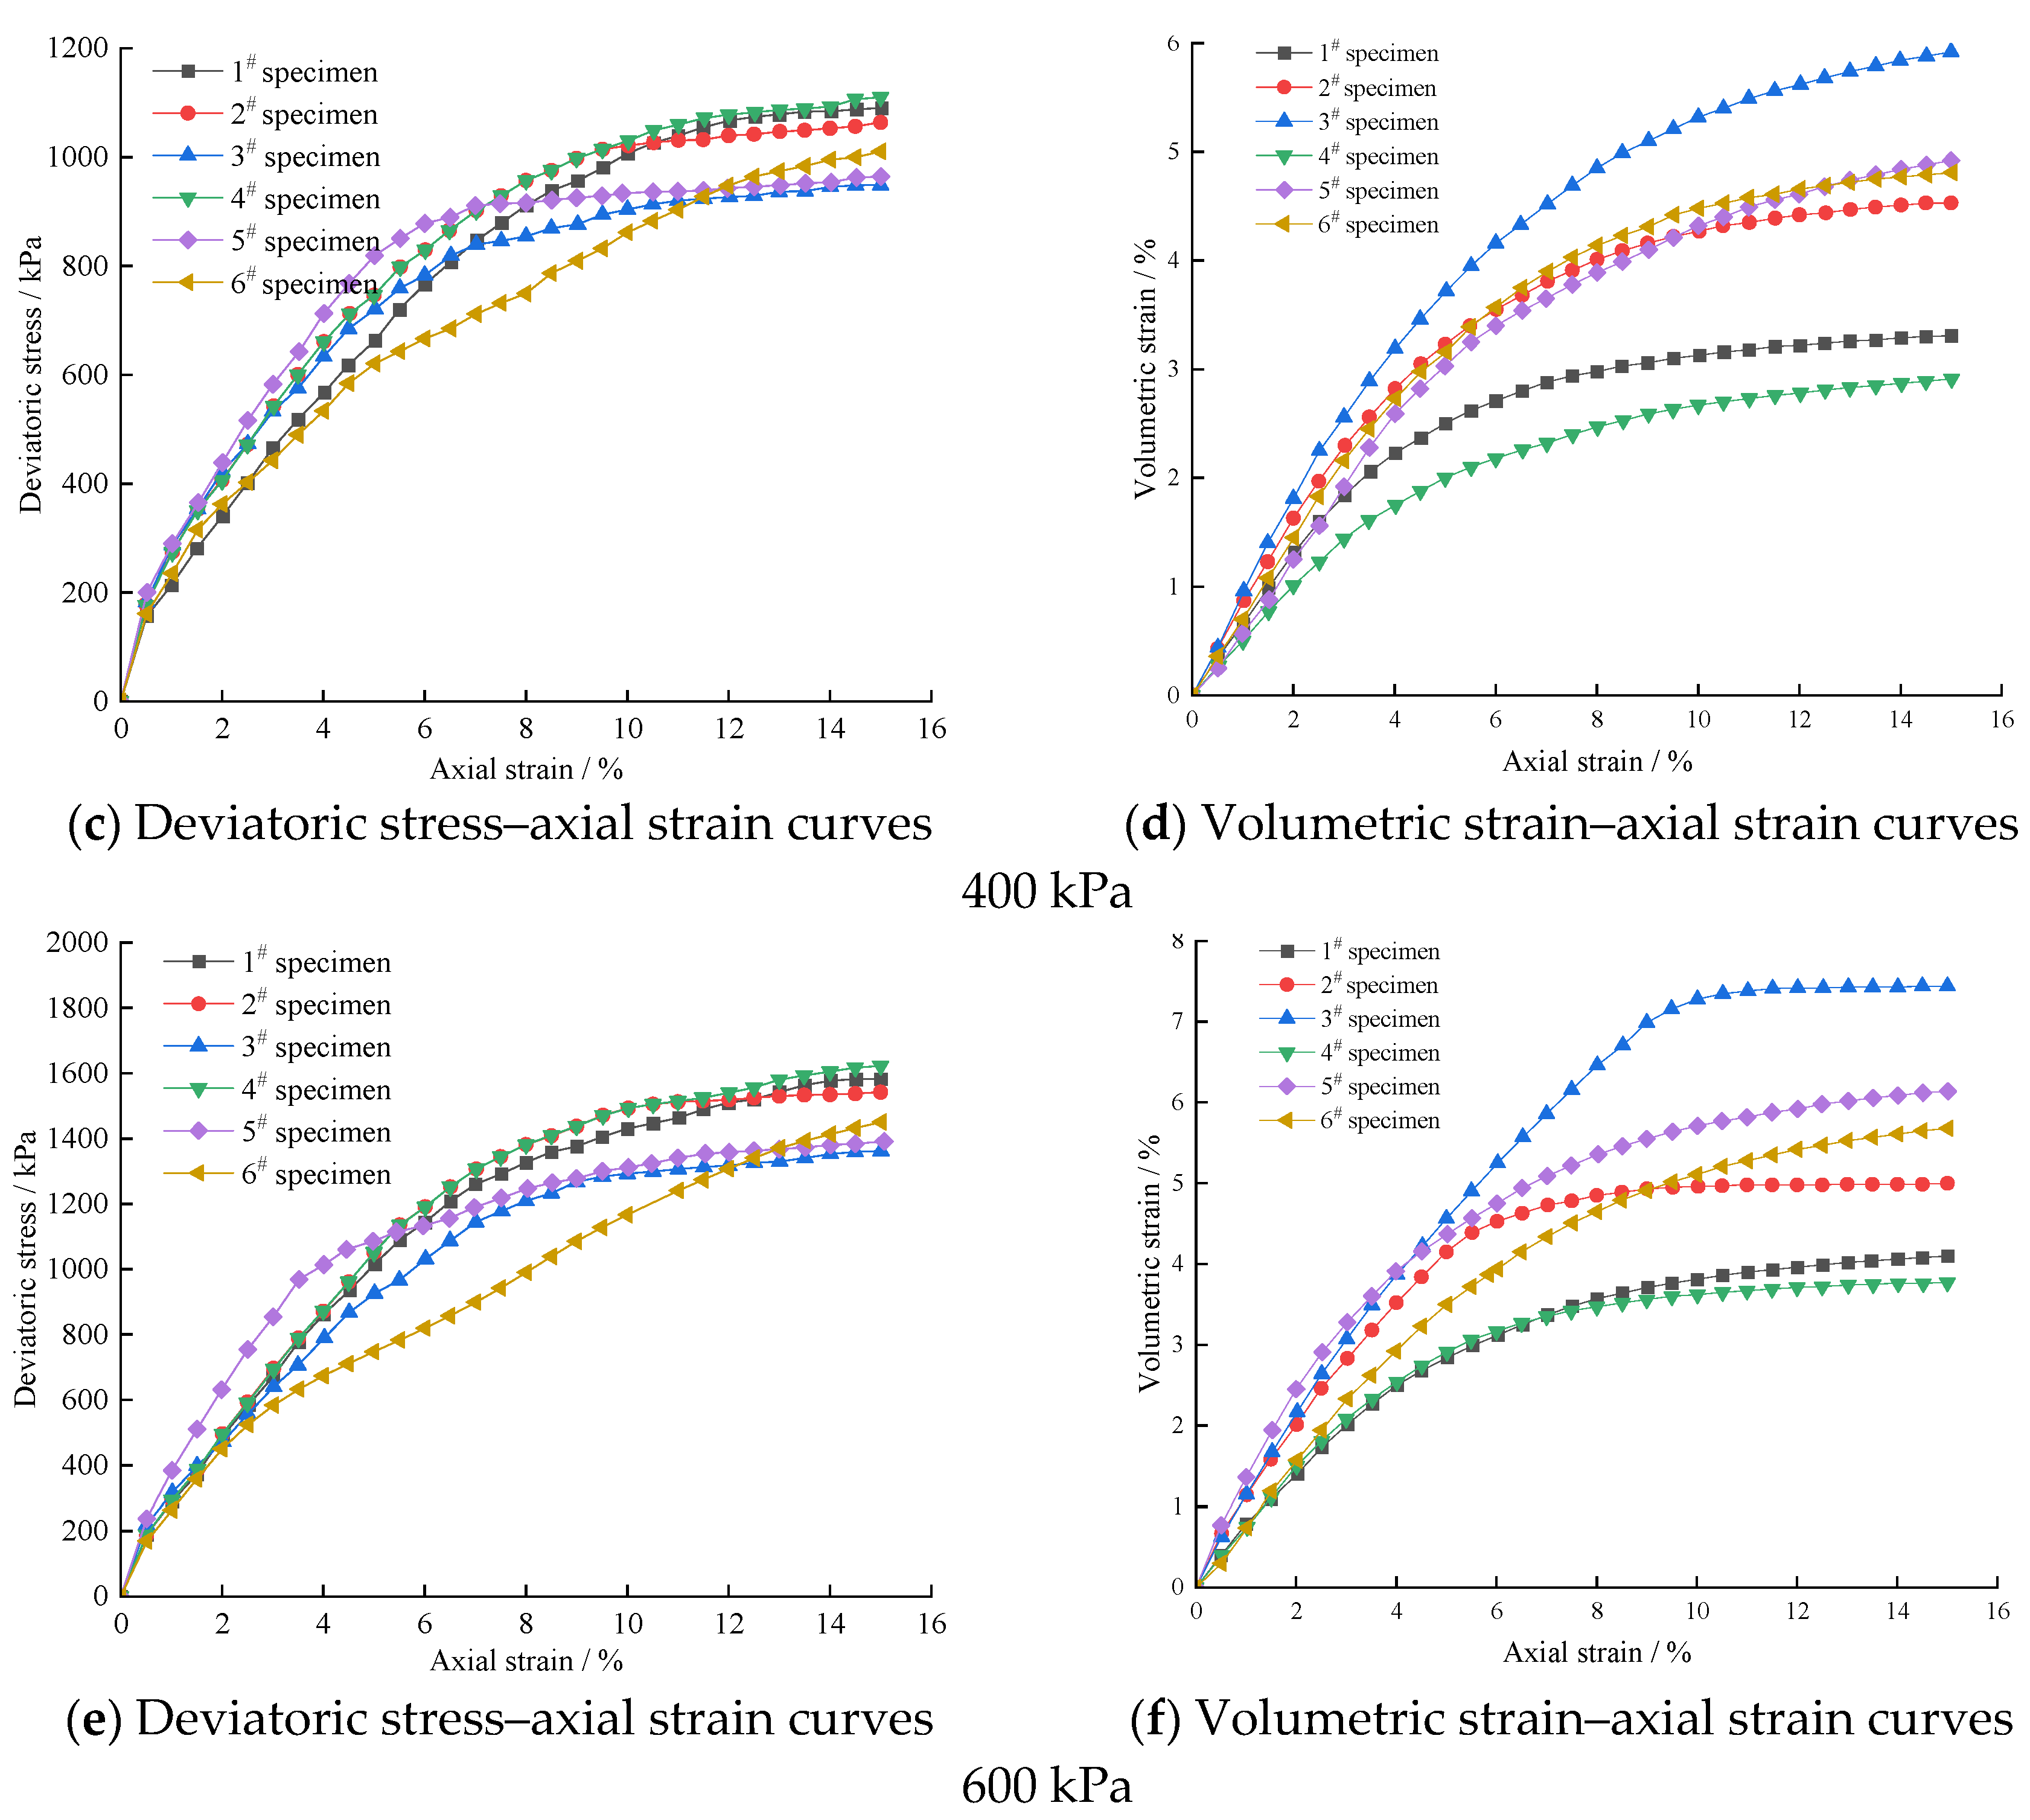
Figure 4a,c,e presents the deviatoric stress–axial strain curves of the specimens from different elevations under various confining pressures. The continuous strain hardening observed for all specimens can be attributed to the behavior of broadly graded, densely interlocked granular assemblies: as axial strain increases, particles progressively rearrange, coarse particles rotate and climb into a denser interlocking configuration, and an increasing number of contacts participate in the force-chain network, so that the mobilized shear resistance keeps growing without reaching a critical state within the tested strain range. The systematic increase in peak deviatoric stress with confining pressure (from 200 kPa to 400 kPa and 600 kPa) reflects the stress dependence of frictional resistance and the suppression of particle rolling and sliding under larger normal contact forces.
Figure 4.
Test curves of specimens at different elevations.
Noticeable differences in deviatoric stress levels are observed among the specimens from different elevations, and these differences are particularly prominent under identical confining pressure conditions. Under a confining pressure of 600 kPa, specimen 4# reaches the highest peak deviatoric stress of 1622 kPa, whereas specimen 3# exhibits the lowest peak deviatoric stress of approximately 1361 kPa, resulting in a difference of 261 kPa. Regarding their physical parameters, specimen 4# has the highest density (2.30 g/cm3) and the lowest porosity (0.171) among all the specimens. Conversely, the density (2.03 g/cm3) and porosity (0.269) of specimen 3# are at intermediate levels. Consequently, it can be inferred that the high deviatoric stress of specimen 4# is primarily attributed to its highly dense state. In contrast, the low deviatoric stress of specimen 3# suggests that a moderate density alone is insufficient to achieve optimal shear performance, and other factors, such as particle size distribution (gradation), may play a more critical role.
The faster initial stress growth of specimen 4# (axial strain < 2%) relative to specimen 3# (≈3%) indicates that a dense, well-graded initial fabric mobilizes its load-bearing skeleton almost immediately, whereas a looser or less continuous fabric must first undergo a compaction-dominated stage—consistent with the larger volumetric contraction of specimen 3# (Section 2.3.2)—before an efficient force-chain network is established. This interpretation also explains the inverse relationship between peak deviatoric stress and volumetric strain: specimens that contract less appear to have a more competent initial skeleton and therefore mobilize greater resistance at smaller strains.
2.3.2. Analysis of Volumetric Strain–Axial Strain Curves
There are significant differences in the degree of shear contraction among the soil specimens from different elevations, which further reveals variations in their initial structural states. Figure 4b,d,f illustrates the volumetric strain–axial strain curves of the specimens from different elevations under various confining pressures. During the drained shearing process, all specimens exhibit contractive behavior (shear contraction); that is, the volumetric strain increases with the axial strain without any occurrence of dilatancy (shear dilation). This indicates that pore compression and particle rearrangement dominate under the current test conditions.
Under identical confining pressures, the volumetric strain values of the specimens from different elevations vary significantly. Corresponding to the deviatoric stress response, the volumetric strains of the specimens exhibit an opposite trend: a specimen with a higher peak deviatoric stress demonstrates a smaller volumetric strain. Taking the confining pressure of 600 kPa as an example, specimen 4#, which has the highest peak deviatoric stress, yields a volumetric strain of only 3.77%, whereas specimen 3#, with the lowest peak deviatoric stress, produces a volumetric strain of 7.44%. This demonstrates a positive correlation between the specimen’s resistance to compression and its shear strength. A specimen with a more intact particle skeleton and tighter inter-particle contacts possesses a stronger capacity to resist volumetric compression during shearing, resulting in a smaller volumetric strain. Conversely, a specimen with a loose structure and an incomplete skeleton is more susceptible to pore compression and particle rearrangement during the shearing process, leading to a larger volumetric strain.
The variations in volumetric strain among the specimens from different elevations further indicate that the shear deformability of the specimens from different benches of the dump slope is inconsistent. The fundamental cause of this discrepancy lies not merely in the particle size, but rather in the internal structural state, which is jointly determined by the particle size distribution (gradation), degree of compaction, and dumping history.
2.3.3. Analysis of Shear Strength Parameters of Granular Materials
Based on the triaxial test results, Mohr circles were plotted and strength envelopes were fitted to obtain the cohesion (c) and internal friction angle (φ) of each specimen, as presented in Table 4. The strength parameters of the specimens from different elevations exhibit significant differences. The highest cohesion is observed in specimen 4# (34.48 kPa), while the lowest is in specimen 1# (26.92 kPa), yielding a range of 7.56 kPa. The highest internal friction angle is found in specimen 4# (33.46°), and the lowest in specimen 3# (31.01°), resulting in a difference of 2.45°.
Table 4.
Statistical results of shear strength parameters from triaxial compression tests.
Comparing the aforementioned ranking of deviatoric stresses reveals that specimen 4# has the highest deviatoric stress, the highest cohesion, and the highest internal friction angle; the synergy of these three indicators optimizes its mechanical performance. Specimen 1# ranks second in deviatoric stress and has the second-highest internal friction angle (33.16°), but its cohesion is the lowest (26.92 kPa). This indicates that its shear resistance primarily relies on the friction and interlocking among coarse particles, rather than the cohesion effect of fine particles.
The internal friction angle mainly reflects the friction and interlocking effects between particles. The highest internal friction angle of specimen 4# corresponds to its highest density (2.30 g/cm3) and lowest porosity (0.171), indicating tight particle contacts and a stable skeleton. Specimen 3# has the lowest internal friction angle. Although its density (2.03 g/cm3) and porosity (0.269) are at intermediate levels, its shear strength is relatively low. It is inferred that local voids (or bridging) exist within its coarse-particle skeleton, preventing the inter-particle interlocking effect from being fully mobilized. This suggests that the contribution of gradation to skeleton integrity may, in some cases, surpass that of the degree of compaction itself.
Cohesion reflects the apparent cohesion effect generated after fine particles fill the pores within the coarse particles. Specimen 4# exhibits the highest cohesion, and its moderate fines content (12.97%) can effectively fill the voids in the coarse-particle skeleton without excessively separating the skeleton. Specimen 1# yields the lowest cohesion; although its fines content (11%) is not low, the fine particles struggle to exert an effective filling and stabilizing role due to the low overall density and loose skeleton.
The above differences indicate that the shear strength parameters of the materials from different benches of the dump slope are jointly controlled by the dumping history, degree of compaction, gradation, and fine particle filling effect, exhibiting significant spatial variability.
3. Stability Analysis of the Dump Slope Based on the Discrete Element Method
3.1. Numerical Models and Parameter Calibration
Two numerical models are established in this study using PFC2D: a biaxial calibration model for calibrating micro-parameters against the laboratory triaxial compression tests, and a slope-scale model for analyzing the stability of the waste rock dump. The two models differ in their dimensions, particle size ranges, and particle numbers, but share the same calibrated contact parameters.
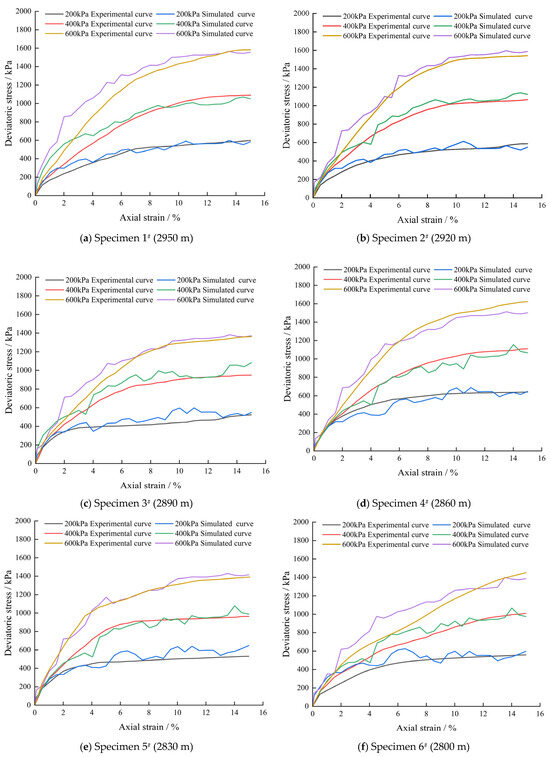
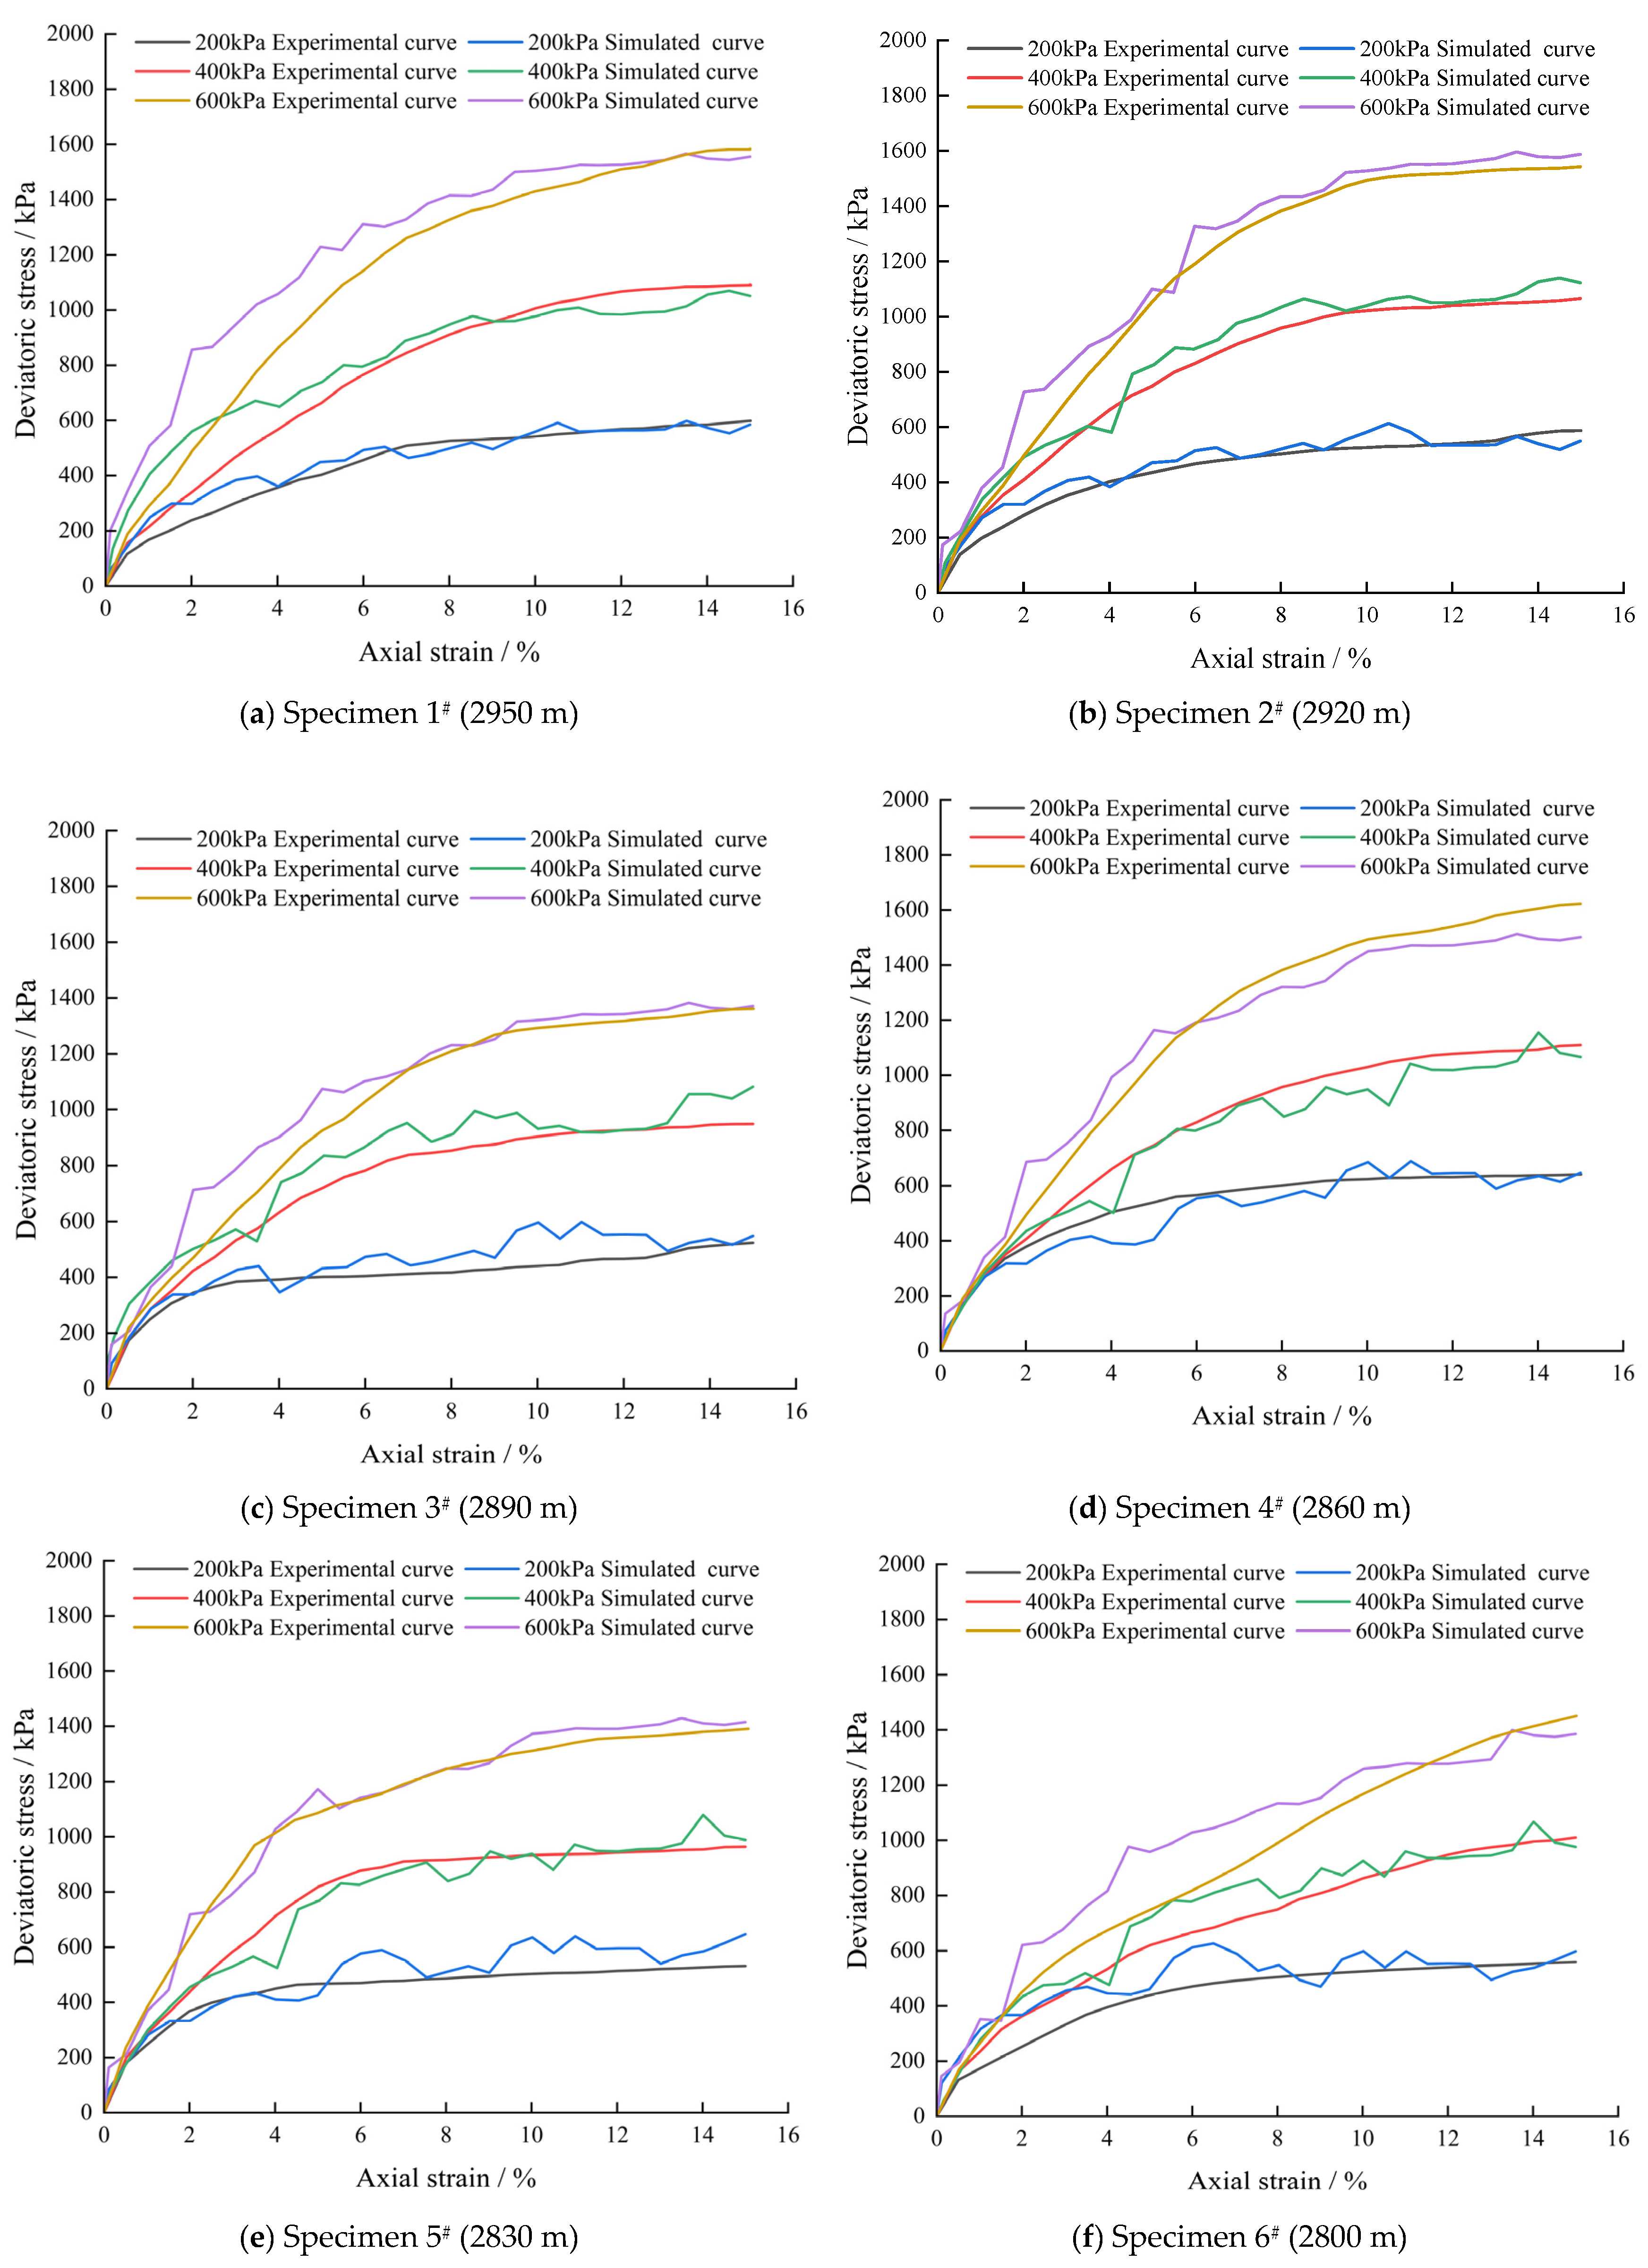
To ensure that the micro-parameters accurately reflect the mechanical properties of the materials, they were calibrated against the triaxial test results. For each specimen, a numerical triaxial sample with the same upscaled particle size distribution as the slope model was assembled and sheared under confining pressures of 200 kPa, 400 kPa, and 600 kPa, and the micro-parameters were adjusted until the simulated deviatoric stress–axial strain curves and the Mohr–Coulomb strength envelopes matched the laboratory results. The calibration of six specimens are illustrated in Figure 5; the simulated curves agree well with the experimental curves for all six specimens. It should be emphasized that the calibrated micro-parameters are effective parameters of the numerical assembly at the particle scale used in this study, rather than intrinsic grain-scale properties. Because the calibration specimens share the same particle sizes as the slope model, no scale transfer is introduced between the calibration and the application, and scale-dependent numerical artifacts are avoided by construction. The parallel bond does not represent chemical cementation between grains; it is a numerical device that reproduces, at the assembly scale, the apparent cohesion measured in the triaxial tests. Because the specimens were vacuum-saturated before shearing, matric suction is not a valid explanation. The nonzero intercept may instead reflect angular-particle interlocking, fines wedging and filling within the coarse skeleton, and linear fitting over the tested confining-pressure range.
Figure 5.
Comparison between test curve and simulated curve.
The calibration model is a plane-strain (biaxial) numerical specimen with dimensions of 300 mm × 600 mm (width × height), representing the 300 mm × 600 mm laboratory triaxial specimen under plane-strain equivalence. The particle radius range is 1 mm to 30 mm, with the particle size distribution faithfully reproducing the scaled gradation reported in Table 2 for each elevation. The specimen contains approximately 4000–5000 particles, depending on the gradation. Four rigid frictionless walls serve as the top, bottom, left, and right boundaries. The specimen is isotropically consolidated under confining pressures of 200 kPa, 400 kPa, and 600 kPa, and then sheared under drained conditions at a constant strain rate until 15% axial strain is reached. The micro-parameters are iteratively adjusted until the simulated deviatoric stress–axial strain curves and volumetric strain–axial strain curves match the laboratory results. The calibrated micro-parameters for all six specimens are summarized in Table 5.
Table 5.
Summary table of calibrated particle mesoscopic parameters.
3.2. Model Establishment
The slope-scale model is established based on the engineered profile of the dump (Figure 1), with a slope height of 210 m, seven 30 m high benches with face angles of 35°, and an overall slope angle of 13°. The calibrated micro-parameters presented in Table 5 were directly used as input for both the uniform and layered slope models. No additional calibration was performed for the slope model; the same contact parameters (friction coefficient, stiffness, and cohesion) were applied.
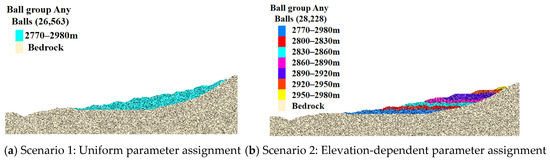
The particle size distribution of the model is a geometrically upscaled version of the scaled laboratory gradation (Table 2), preserving the relative proportions of the size fractions, with particle radii ranging from 1 m to 3 m [43,44,45]. The selection of this range was based on computational feasibility: simulating a 210 m high dump grain-by-grain would require on the order of 107–108 particles, which is computationally unfeasible. The 1–3 m range reduces the particle count to approximately 26,000–28,000 particles (26,563 for the uniform model and 28,228 for the layered model), making the simulation tractable while preserving the relative proportions among the coarse fractions. The upper bound of 3 m corresponds to the maximum particle size in the prototype gradation after geometric upscaling, while the lower bound of 1 m was chosen to maintain a reasonable particle number for computational efficiency.
The rationale for particle upscaling is as follows. In a granular assembly, the macroscopic shear strength is governed by the inter-particle friction coefficient, contact stiffness, and porosity, rather than by the absolute particle size, provided that the ratio of particle size to the characteristic length (slope height) remains sufficiently small. The upscaling does not aim to replicate the contact mechanics of individual rock blocks, but rather to capture the bulk flow and failure mechanism of the slope as a continuum-equivalent assembly.
It is acknowledged that the 1–3 m range represents only the coarse skeleton of the waste rock and neglects the fine matrix (<1 m). The model therefore represents a skeleton-dominated scenario, which is a reasonable approximation for waste rock dumps in hard-rock open-pit mines where failure is primarily controlled by the interlocking, rotation, and sliding of large blocks. However, this simplification neglects the contribution of fines to density and potential cohesion. The results should therefore be interpreted as indicative of bench-scale failure mechanisms and relative differences between uniform and layered parameter assignment, rather than as exact quantitative predictions of in situ behavior.
The base and lateral boundaries of the model are fixed rigid walls representing the bedrock and the far-field confinement, while the slope surface and bench platforms are free surfaces. Based on this geometric model, the numerical slope models for the two scenarios are constructed, as depicted in Figure 6.
Figure 6.
Numerical model of the dump slope.
3.3. Analysis of Simulation Results
3.3.1. Particle Displacement Analysis of the Models
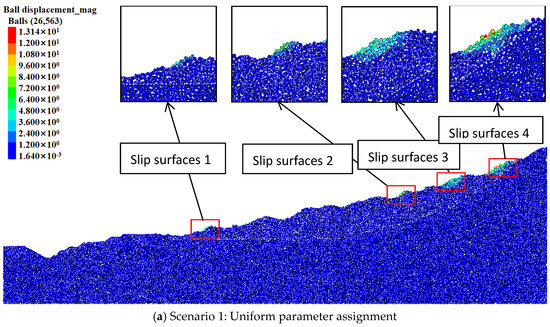
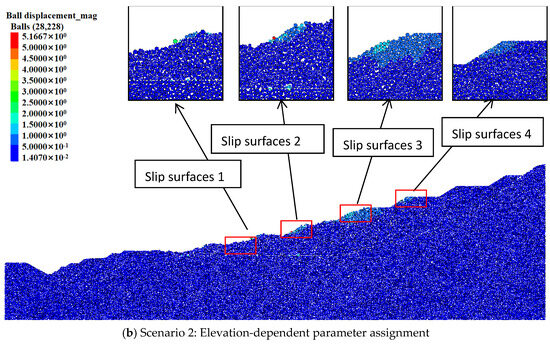
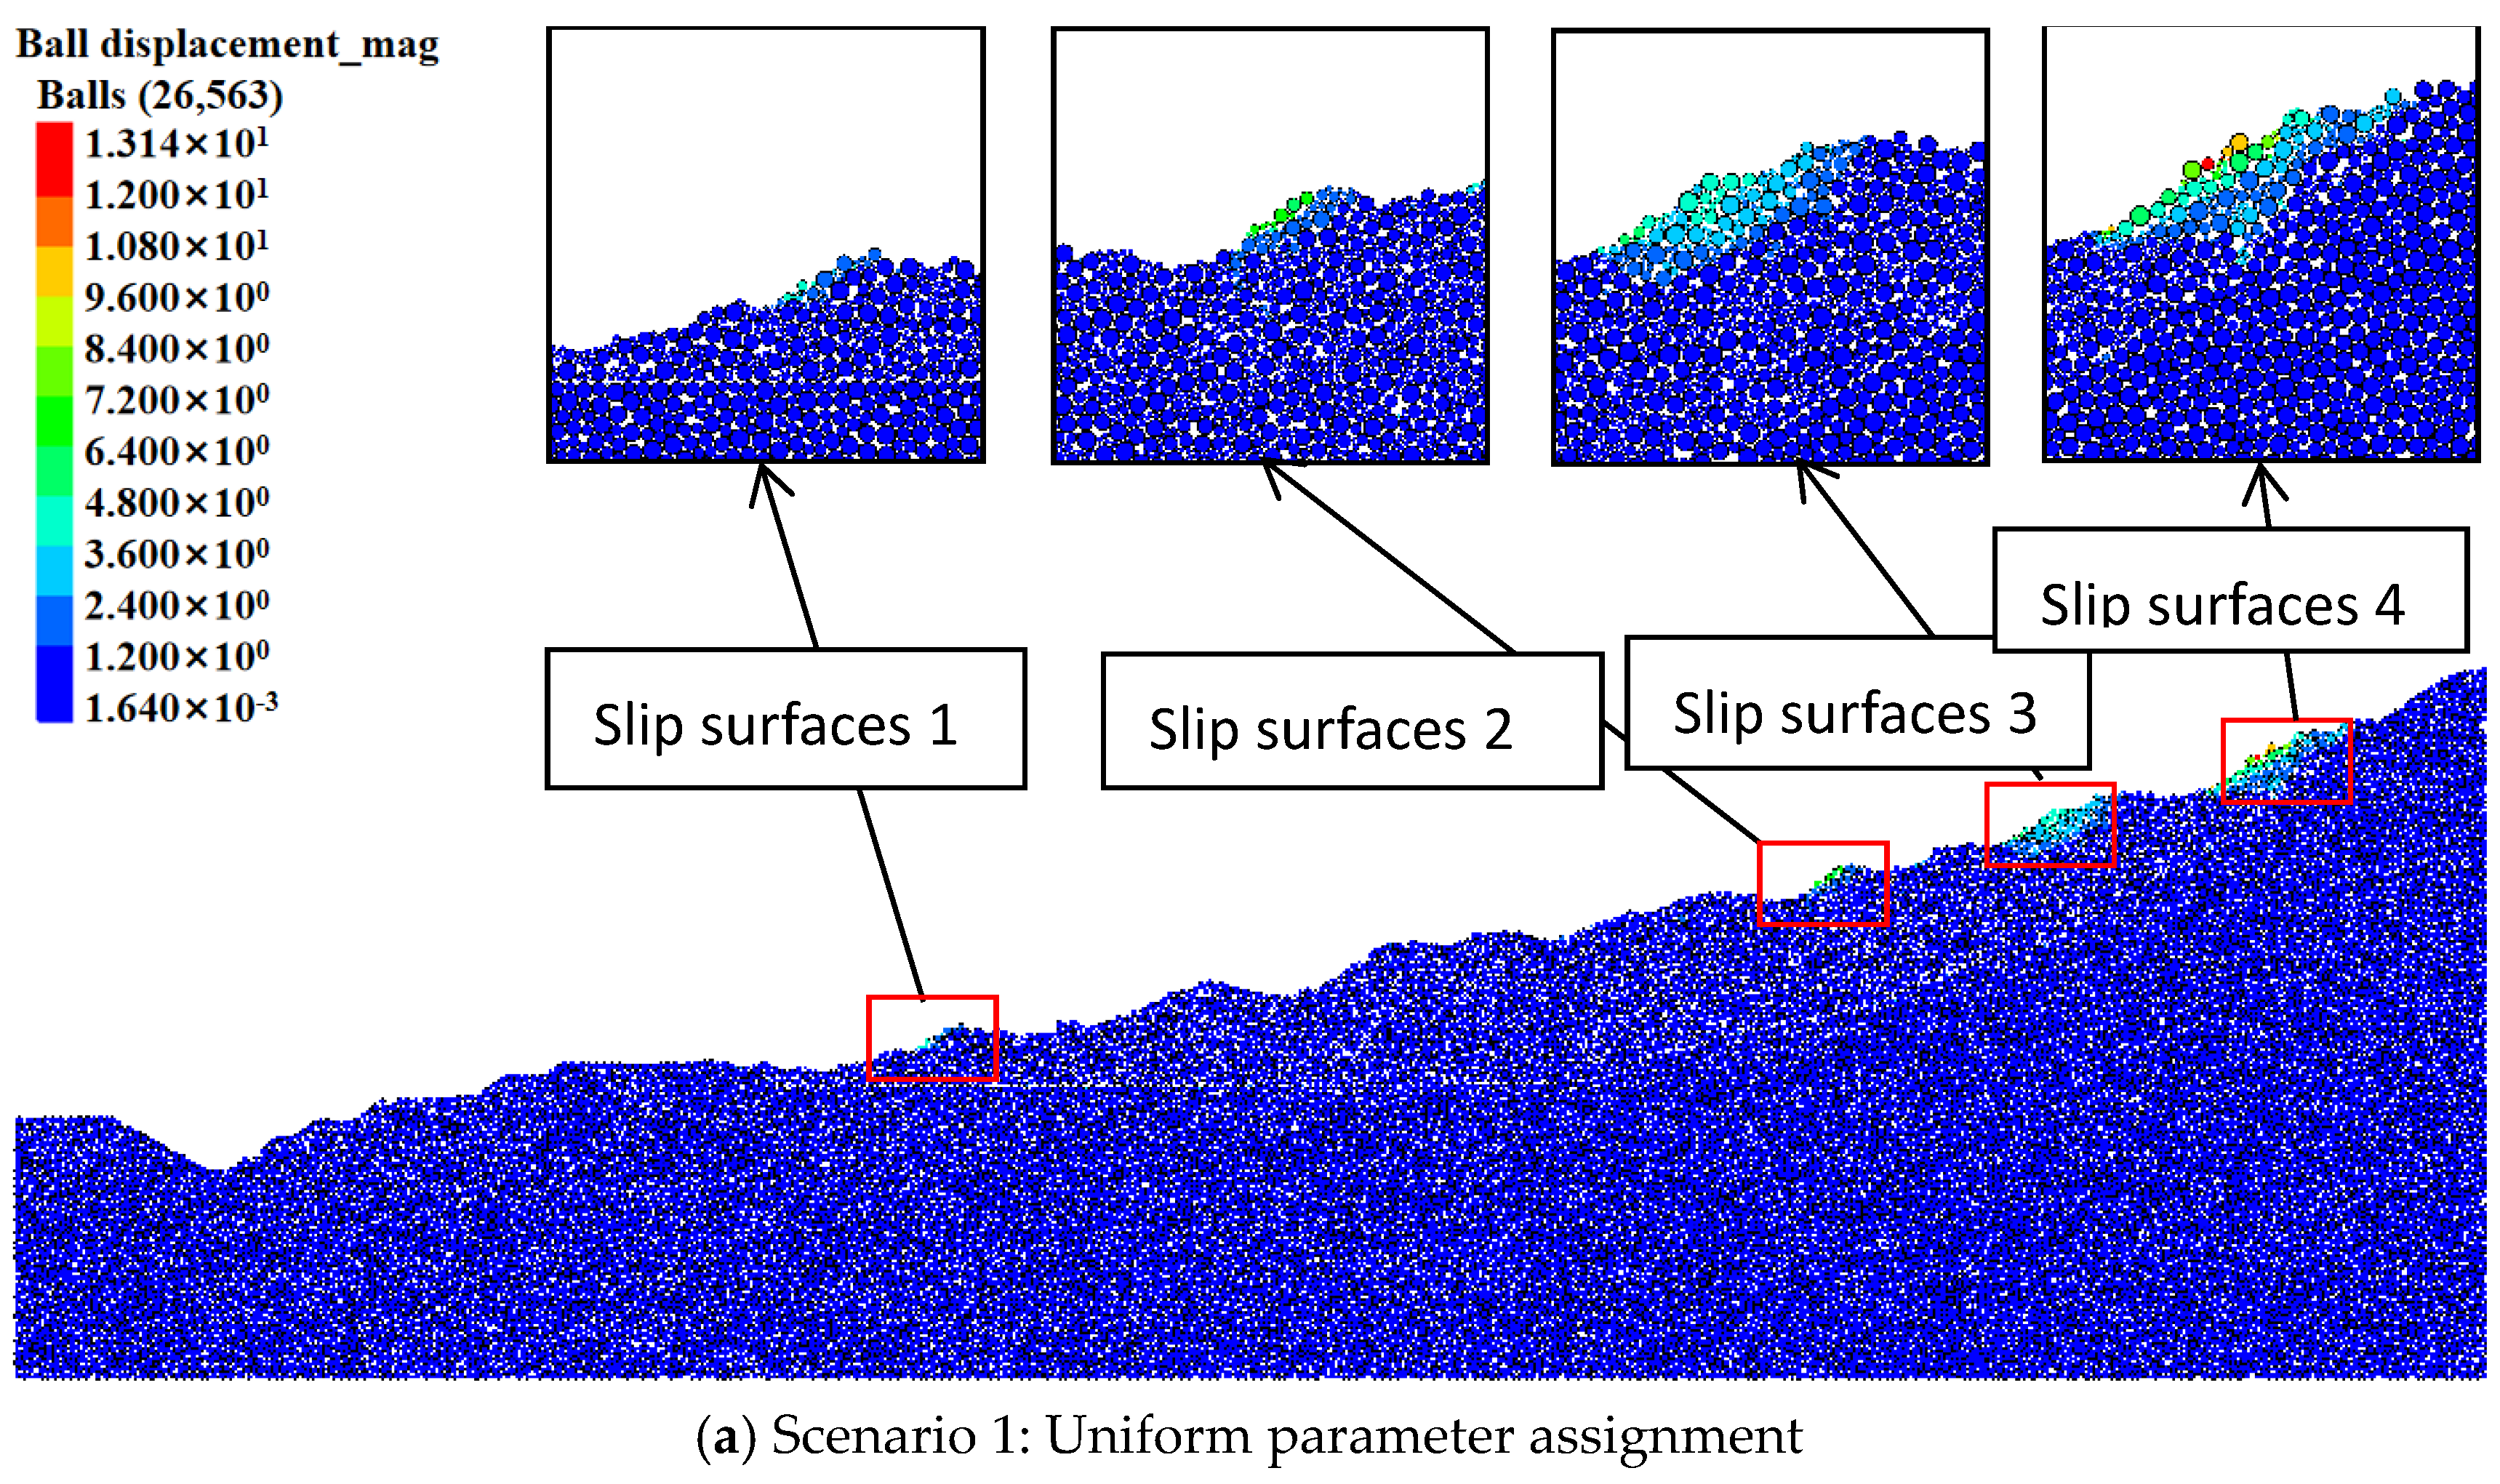
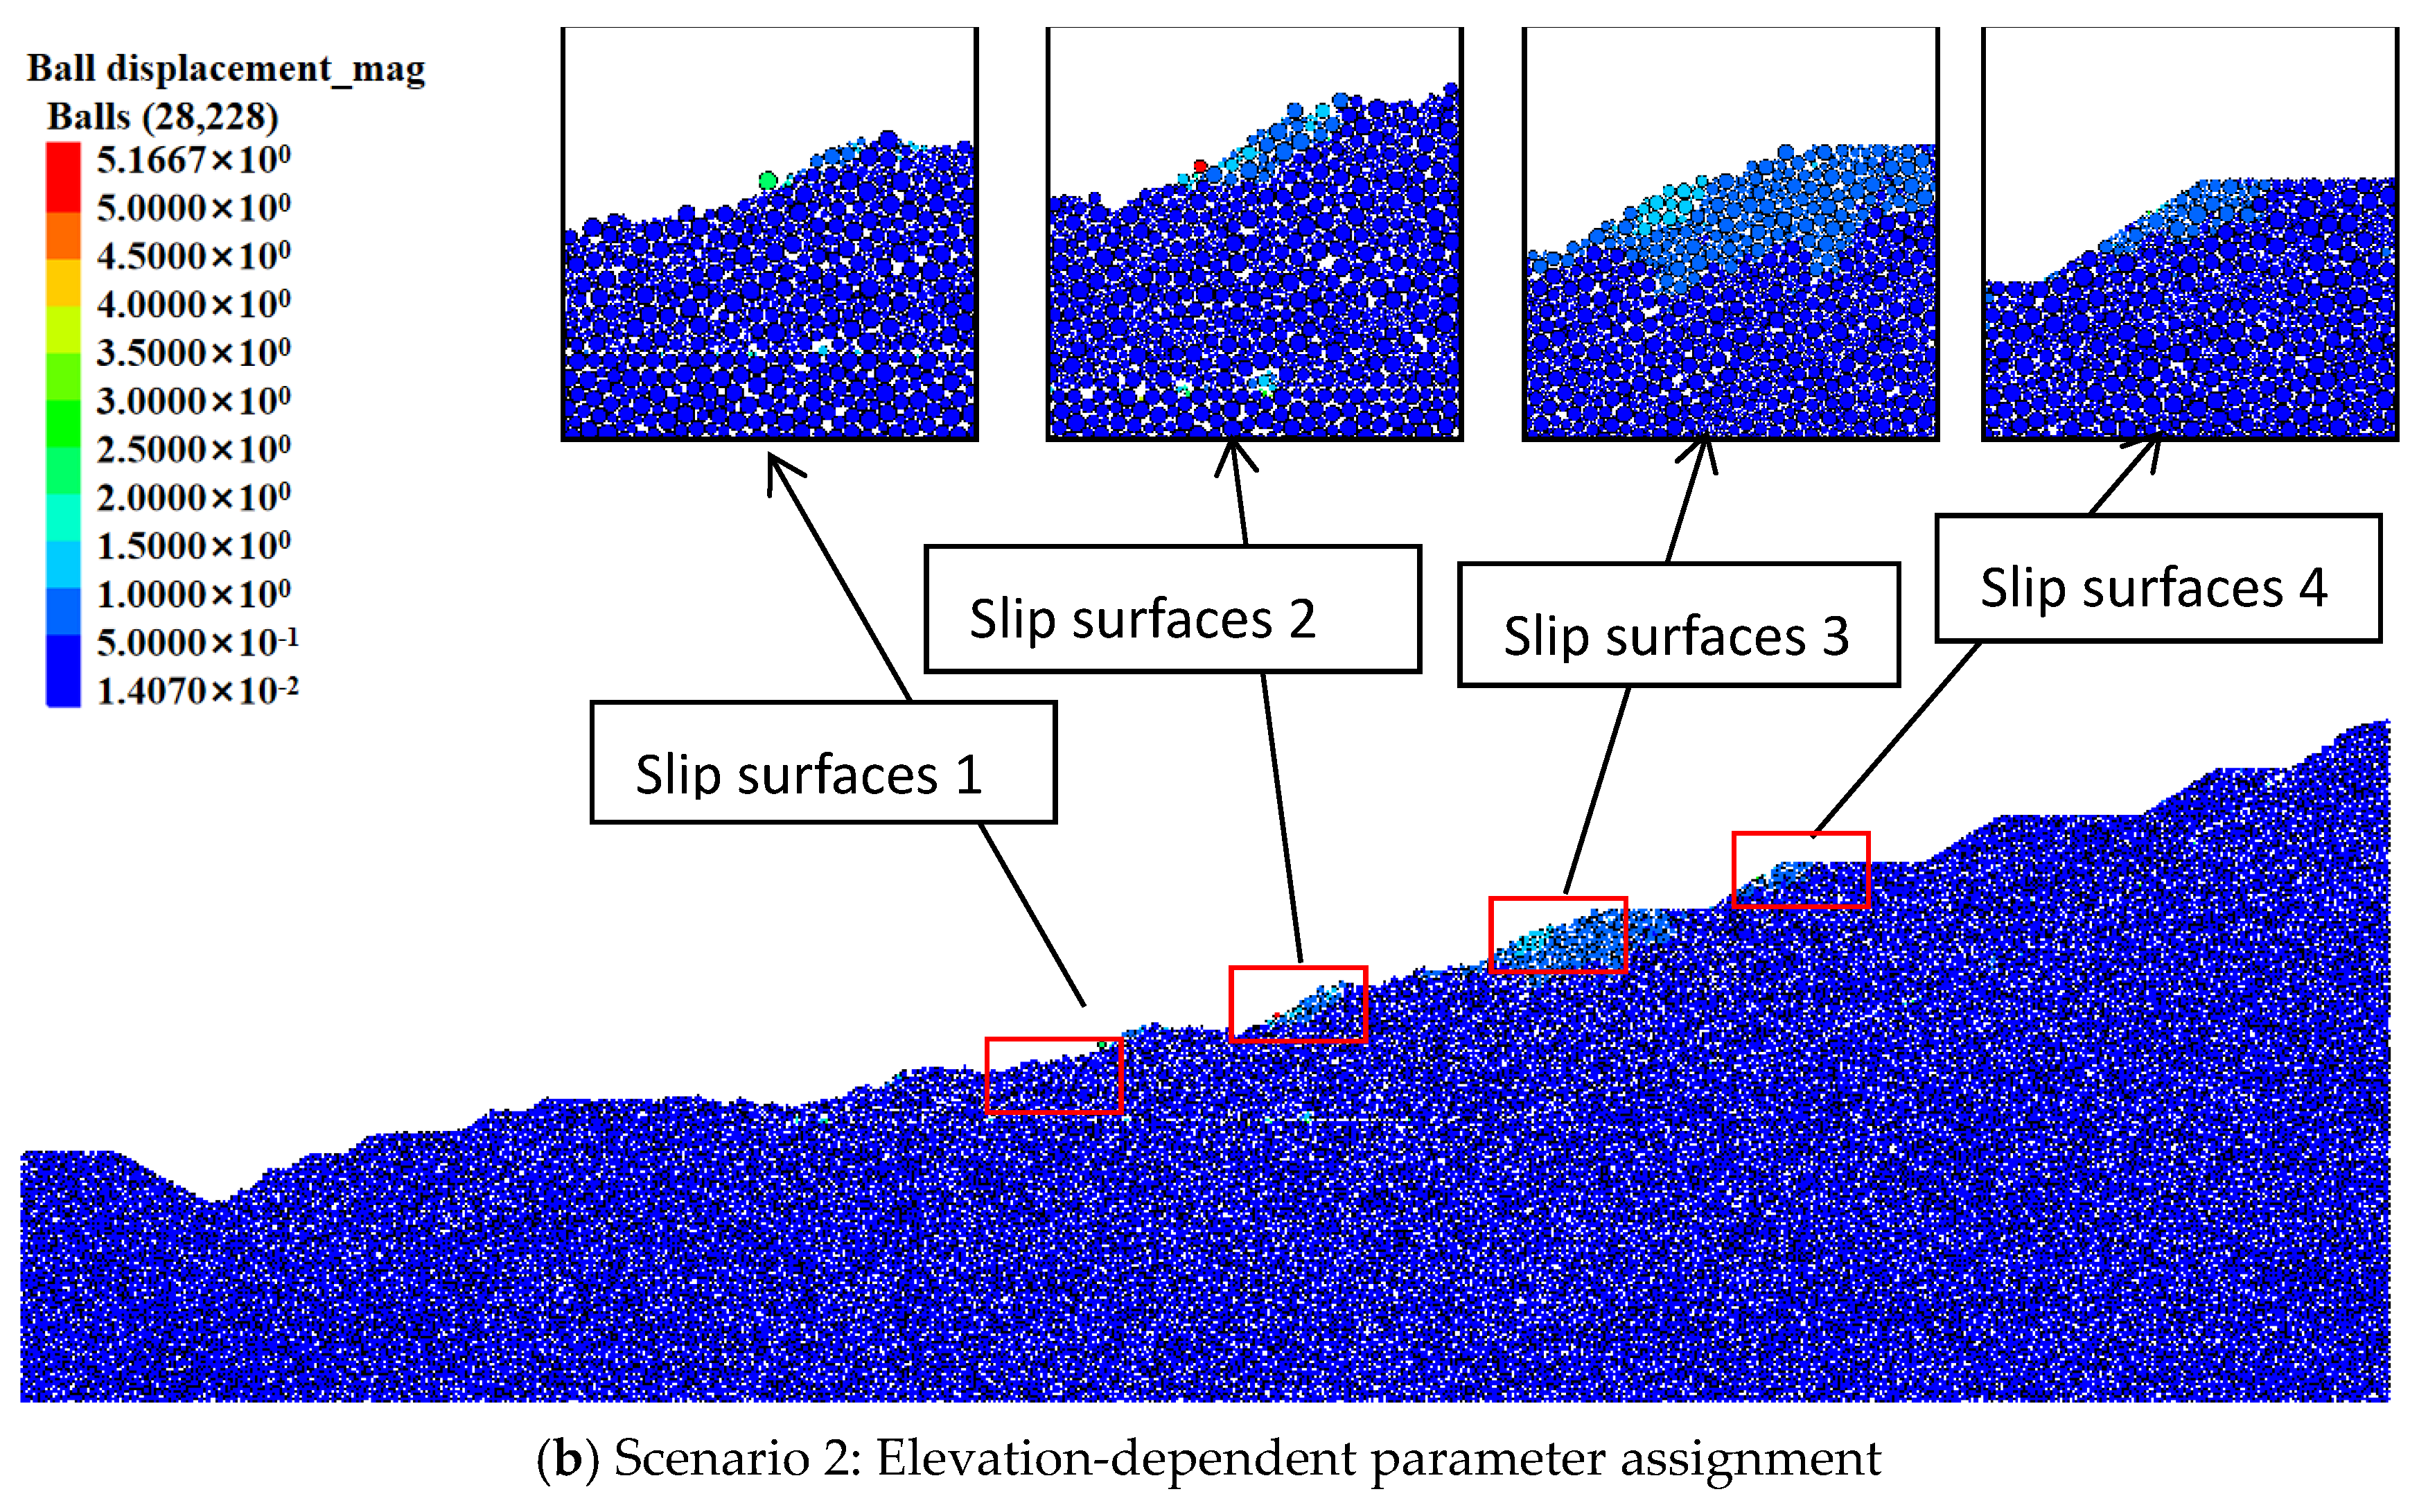
The displacement contours for the two scenarios under natural conditions are shown in Figure 7. As can be seen from the figure, four obvious slip surfaces appear in both Scenario 1 and Scenario 2. However, the locations of these slip surfaces differ between the two scenarios. In Scenario 1, slip surface 1 occurs at the elevation of 2770–2800 m, slip surface 2 at 2890–2920 m, slip surface 3 at 2920–2950 m, and slip surface 4 at 2950–2980 m. The maximum particle displacement appears at slip surface 4, reaching 13.14 cm. For the model in Scenario 2, slip surface 1 is located at 2800–2830 m, slip surface 2 at 2830–2860 m, slip surface 3 at 2860–2890 m, and slip surface 4 at 2890–2920 m. The maximum particle displacement occurs at slip surface 2, with a value of 5.1667 cm. Overall, the particle displacements on the slip surfaces in Scenario 1 are significantly larger, whereas those in Scenario 2 are much smaller. The difference in the maximum particle displacement between the two scenarios reaches 7.9733 cm.
Figure 7.
Particle displacement cloud diagram of the model.
3.3.2. Analysis of the Model Factor of Safety
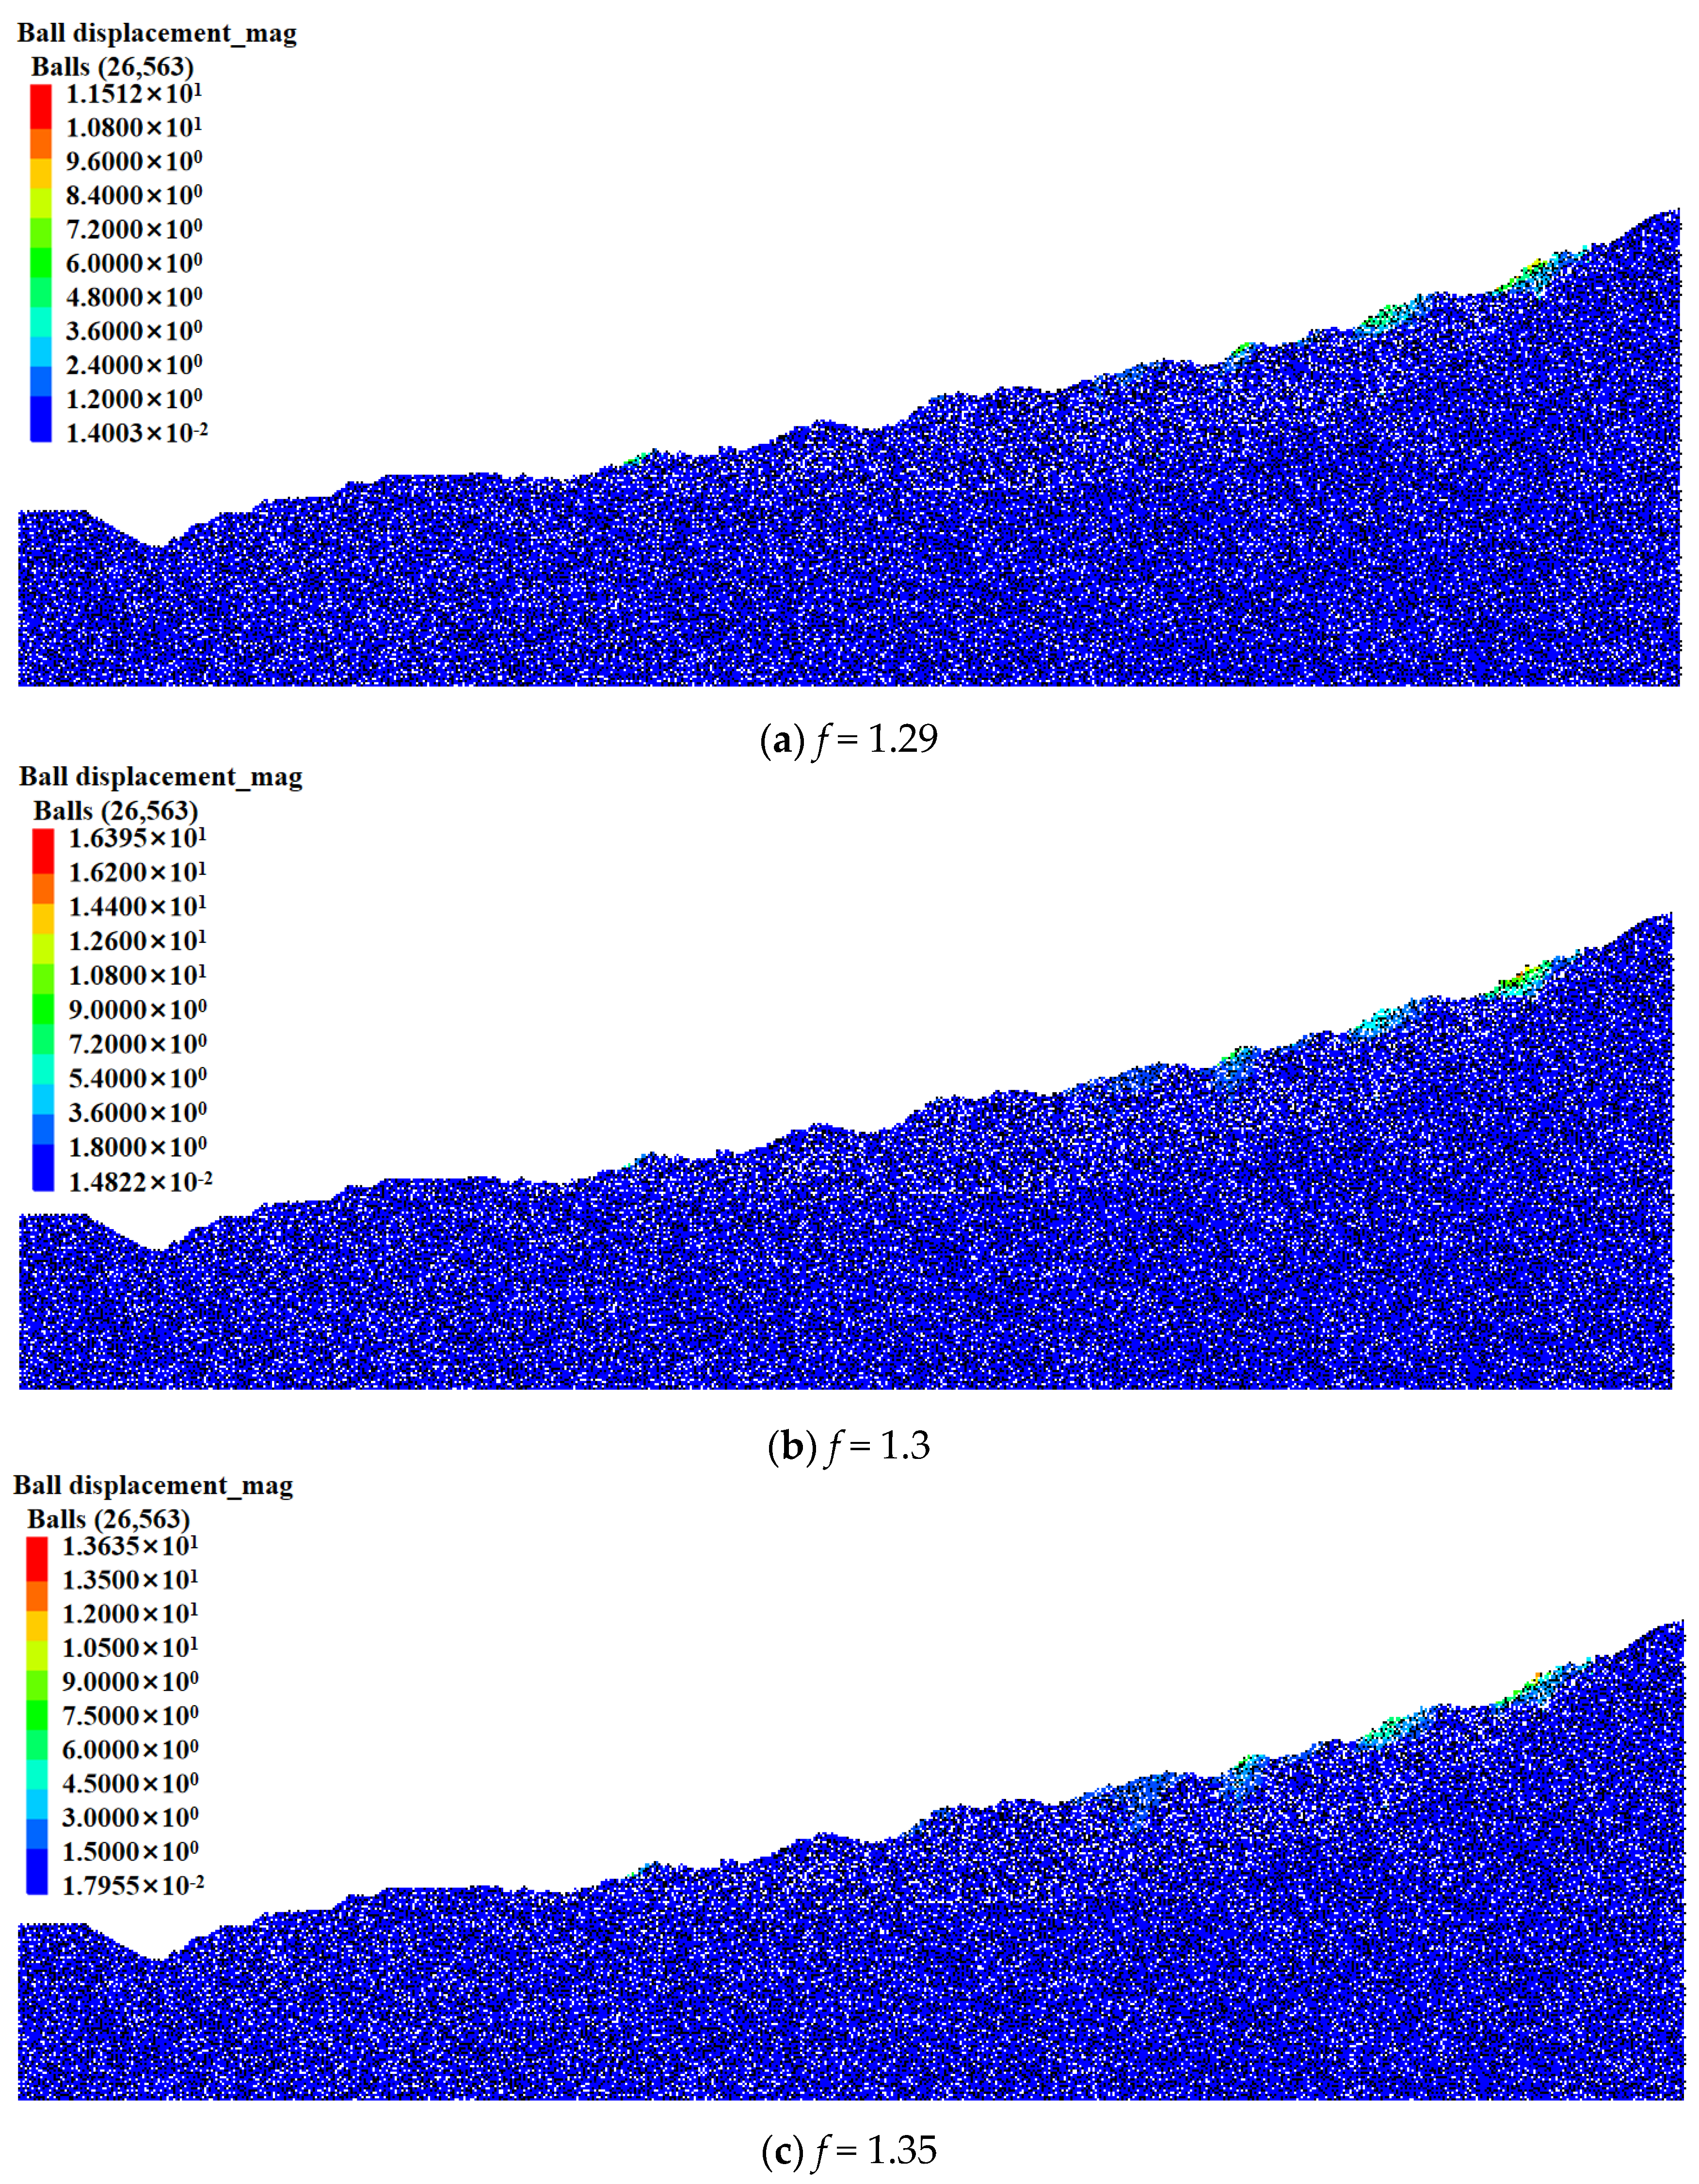
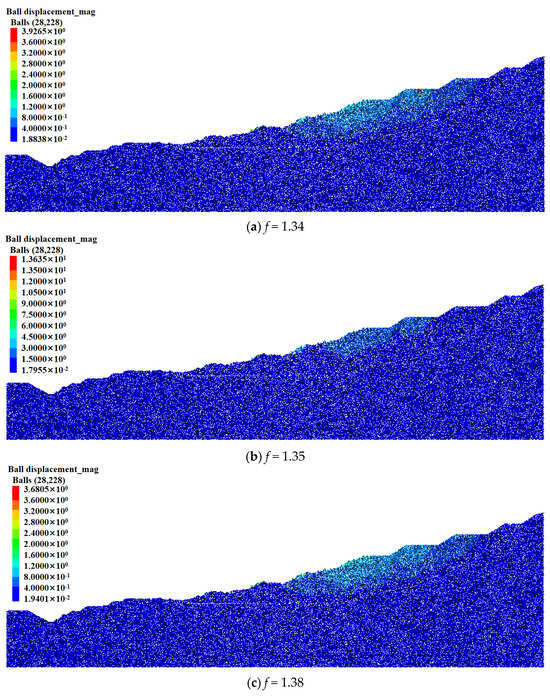
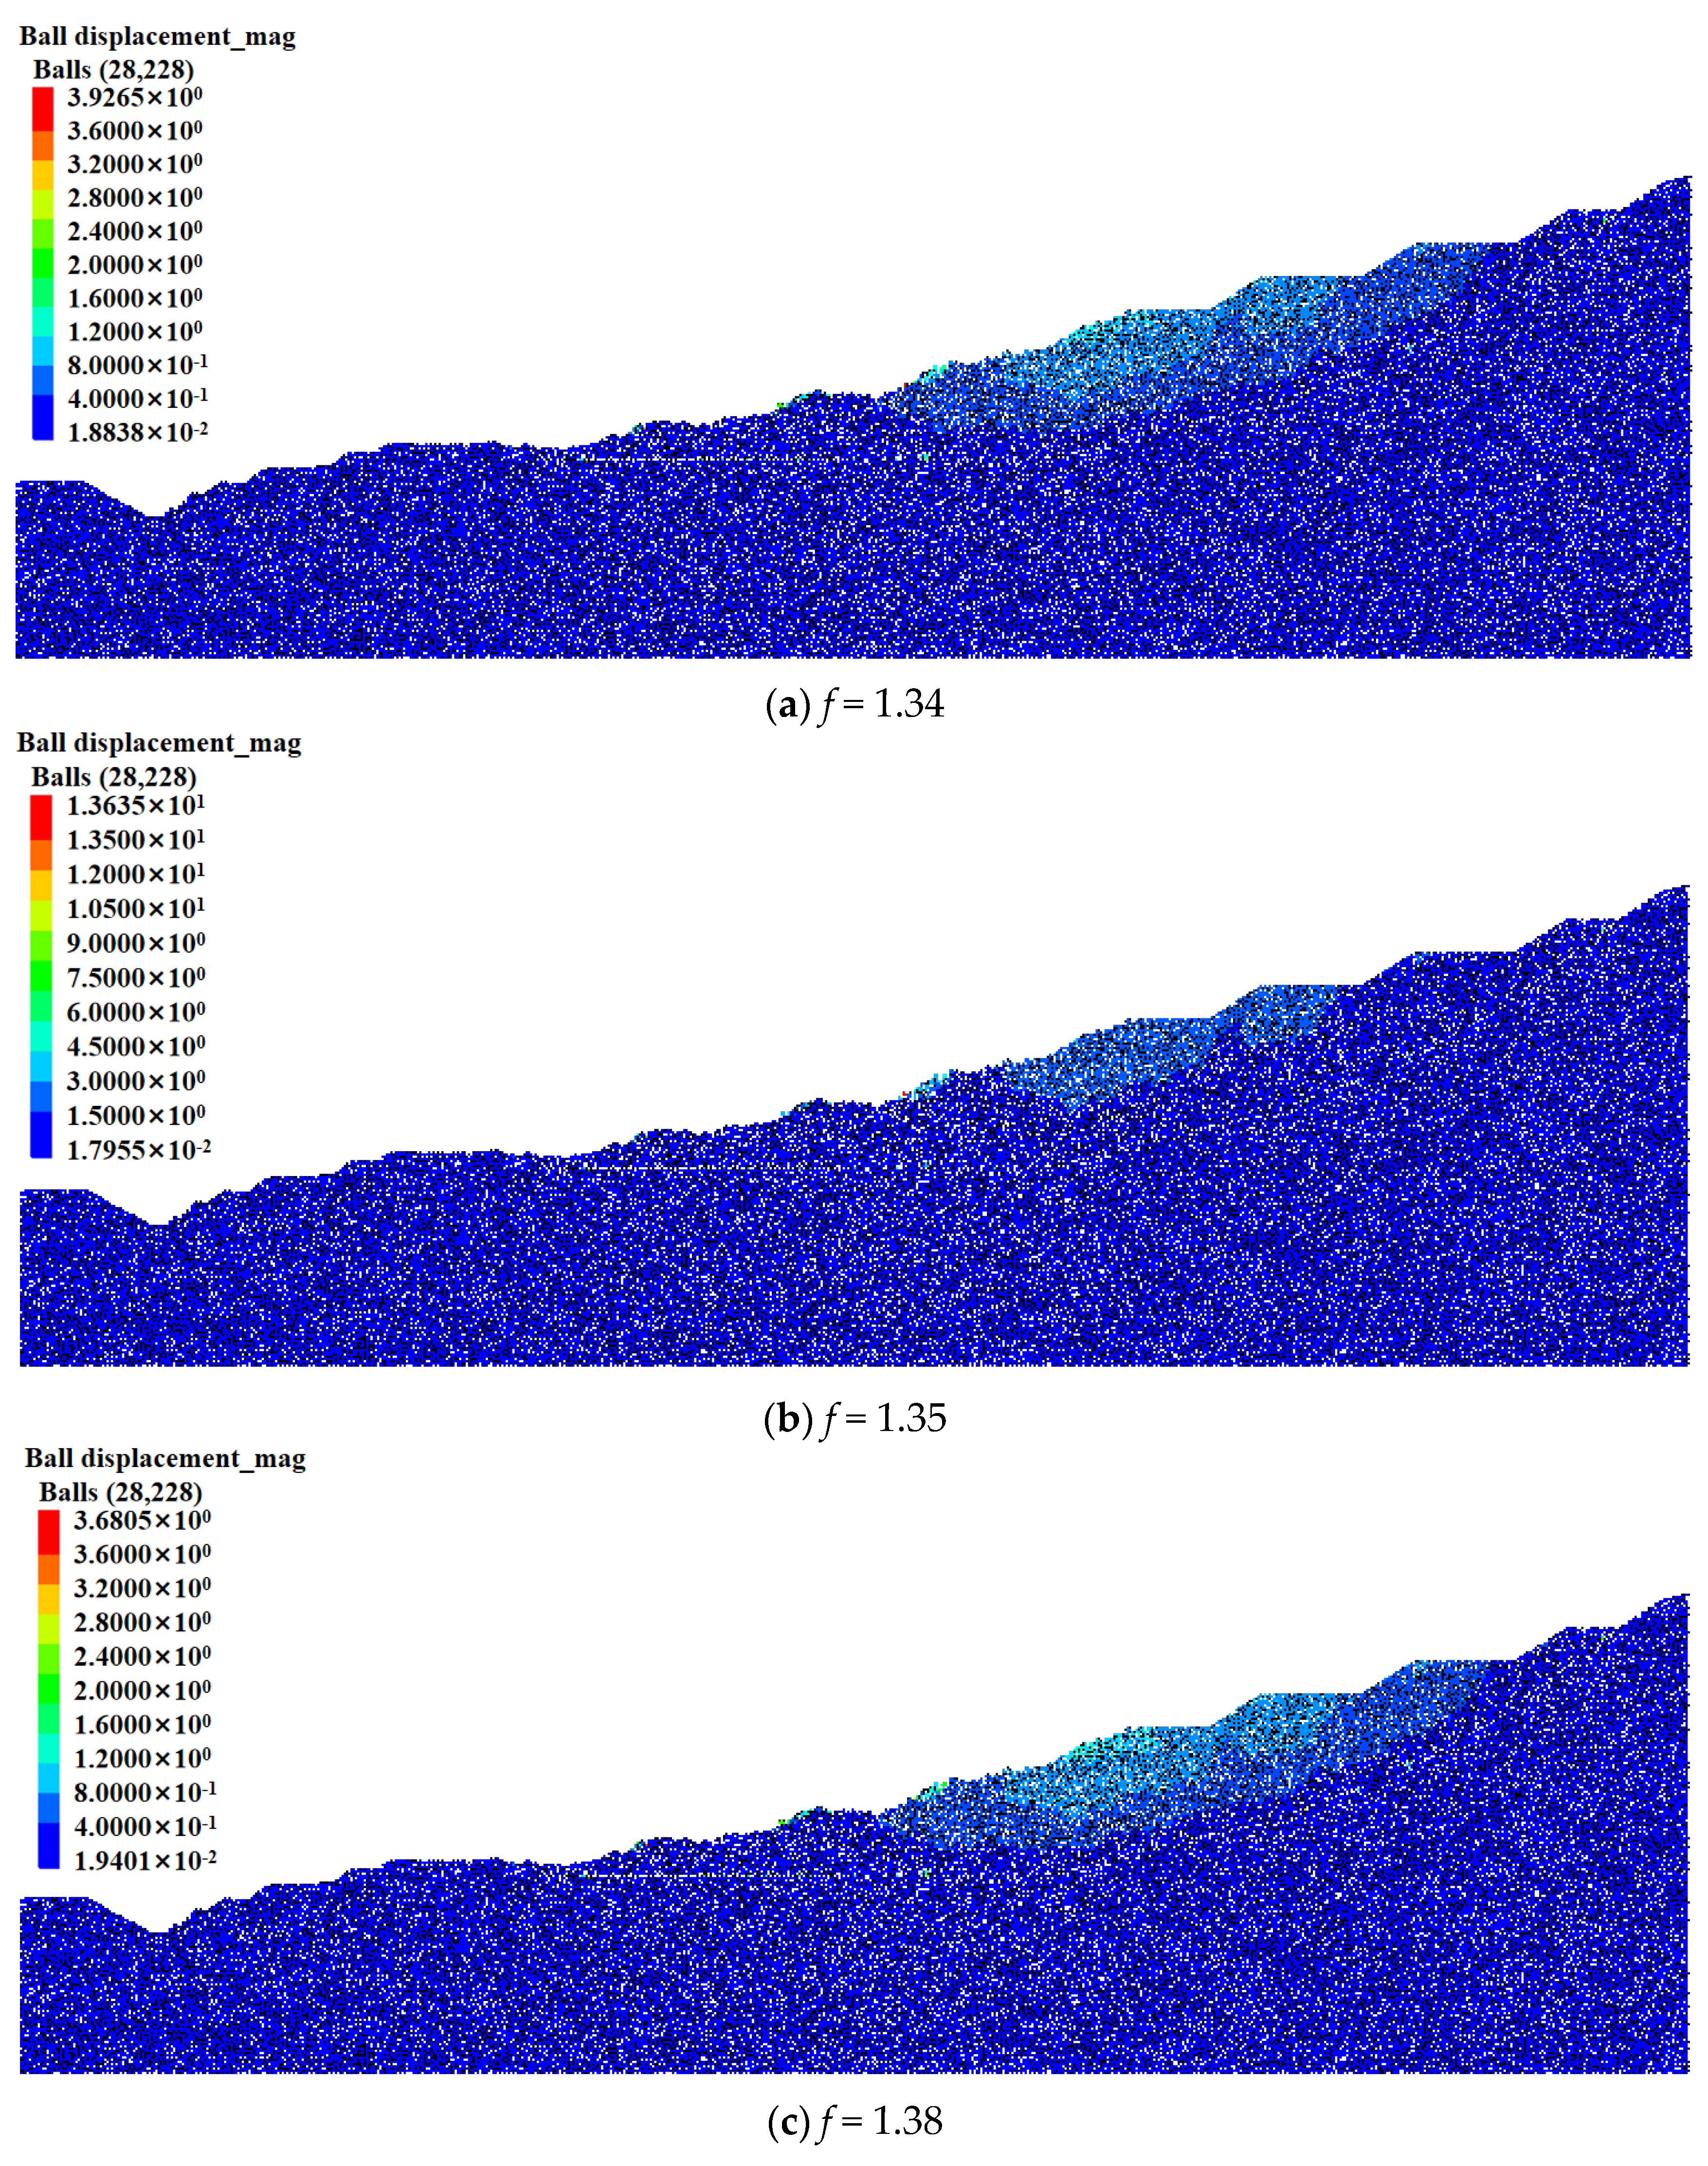
This study adopts the gravity increase method to calculate the factors of safety for the models in the two scenarios. In this method, while keeping the particle micro-parameters constant, the gravitational acceleration is multiplied by a coefficient f that gradually increases from 1.0. When the particle displacement reaches its maximum and a distinct slip surface is formed, the corresponding coefficient f represents the factor of safety determined by the gravity increase method [46]. The GIM was selected for three reasons. First, in a DEM model, reducing the contact strength (as required by the shear strength reduction technique, SSR) modifies the contact network itself, whereas increasing gravity preserves the calibrated contact network and scales the driving stress in a physically transparent way. Second, for the present material, the resistance is overwhelmingly frictional at the stress levels of a 210 m high dump: the apparent cohesion (27–34 kPa) is negligible compared with the normal stress acting on potential slip surfaces. For a friction-dominated material, the GIM and the SSR are formally equivalent, because both the driving stress and the frictional resistance scale linearly with the self-weight stress, and the small apparent cohesion makes the GIM marginally conservative relative to the SSR [47]. Third, the GIM has been widely used and validated for DEM slope stability analysis [46]. The factor of safety f thus obtained is a capacity-to-demand ratio: it equals the factor by which the available frictional resistance exceeds the gravity-driven demand at the limit state. The processes for determining the factors of safety for the two scenario models under natural conditions are illustrated in Figure 8 and Figure 9. As can be seen from Figure 8, when the increase coefficient is 1.30, the particle displacement in the Scenario 1 model reaches its maximum; thus, the coefficient 1.30 is the factor of safety for this model. Similarly, the factor of safety for the Scenario 2 model is determined to be 1.35. Since the factor of safety for a dump slope under natural conditions must not be lower than 1.35, it can be concluded that the models under both parameter assignment methods are in a stable state. However, the factor of safety obtained through uniform parameter assignment is 3.7% lower. Therefore, if a single set of parameters is uniformly applied during the parameter assignment stage, the stability of the dump slope will be underestimated, leading to overly conservative results. It should be noted that all identified slip surfaces develop within individual benches (bench-face angle 35°); the reported factors of safety therefore characterize the local, bench-scale stability of the dump rather than the global stability of the 13° overall profile, which is considerably higher and is not the subject of the present comparative analysis.
Figure 8.
Determination of safety factor for the model under Scenario 1.
Figure 9.
Determination of safety factor for the model under Scenario 2.
4. Discussion
4.1. Controlling Factors of Strength and Deformation Characteristics
The strength and deformation characteristics of granular materials are jointly controlled by grading, compaction state, and moisture condition, with coupling effects existing among the three.
Grading determines the basic skeleton structure of the material. When the coarse particle content is high (e.g., soil specimen 4#, P5 = 87.03%), particles can directly contact each other to form a stable skeleton, resulting in a higher internal friction angle. However, if the grading is poor (e.g., soil specimen 2#, Cc = 3.26), prominent void spaces appear within the coarse-particle skeleton (skeleton void effect), and some pores cannot be effectively filled, which instead reduces the strength. The role of fine particles is dual-sided: an appropriate number of fine particles (e.g., soil specimen 4# with a fine particle content of 12.93%) can fill the voids, increase contact points, and improve cohesion; conversely, excessive fine particles (e.g., soil specimen 6# with 18.95%) may separate coarse particles, weakening their direct interlocking effect. Overall, the soil specimen with continuous grading and a reasonable combination of coarse and fine particles (soil specimen 4#) exhibits the optimal mechanical properties.
The compaction state determines the particle contact status and the integrity of the force-chain network. Density shows a significant positive correlation with shear strength: soil specimen 4# has the highest density (2.30 g/cm3) and the highest strength parameters, whereas soil specimen 1# has the lowest density (1.83 g/cm3) and the lowest strength. It is worth noting that the strength-enhancing effect of density requires a reasonable grading as a prerequisite; when the grading is poor, even if the density is high, defects may still exist in the particle contact network.
The regulating role of the moisture condition is relatively limited but cannot be ignored. In this study, there is no obvious linear relationship between the natural moisture content (2.07–5.05%) and the strength parameters, indicating that moisture content is a secondary controlling factor in dump materials dominated by coarse particles. However, it should be noted that when the fine particle content is high or extreme rainfall occurs, an increase in moisture content may still affect stability through lubrication effects and cohesion deterioration.
The cohesion values obtained from the triaxial tests (26.92–34.48 kPa) should be interpreted as apparent Mohr–Coulomb intercepts over the tested stress range, rather than as permanent cementation of the waste rock. Because the triaxial specimens were vacuum-saturated before shearing, matric suction was not used to explain these values. The nonzero intercept may reflect the combined effects of angular-particle interlocking, fines wedging and filling within the coarse skeleton, and fitting a linear strength envelope over a limited confining-pressure range. Accordingly, the fitted cohesion should be used cautiously in engineering design. Long-term and wet-condition assessments should include sensitivity analyses with reduced cohesion, including c = 0 where appropriate, while retaining the measured friction angle.
4.2. Causes of Spatial Heterogeneity in the Dump
The differences in strength parameters revealed by the triaxial tests essentially reflect the spatial heterogeneity inside the dump, which is primarily influenced by the following aspects.
First is the difference in compaction degree caused by the dumping sequence. The lower materials have borne the overlying load for a longer period and are fully compacted (e.g., soil specimen 4# has a density of 2.30 g/cm3 and a porosity of 0.171), whereas the upper materials have a shorter compaction time and a looser structure (e.g., soil specimen 1# has a density of 1.83 g/cm3 and a porosity of 0.351). Second is the grading difference caused by particle segregation. During the transportation and dumping processes, large particles tend to roll down to the lower part or the edges of the slope, while small particles mostly remain in the upper part or the interior. This segregation effect causes systematic differences in the grading characteristics across different benches. Third is the uneven distribution of dumping operations and compaction energy. In actual construction, different compaction standards may be applied to different regions, further exacerbating the heterogeneity.
4.3. Influence of Parameter Assignment Methods on Stability Analysis
The PFC2D-based numerical simulations compared two parameter assignment methods (uniform parameters vs. layered parameters). The results indicate that there are significant differences in the model displacement, slip surface distribution, and factor of safety between the two scenarios. The uniform-parameter model fails to accurately reflect the actual failure mechanism.
The uniform-parameter model shows a tendency to systematically underestimate stability. This is because slope stability is most sensitive to the strength of the region where the potential slip surface is located, whereas uniform parameters (usually taken as average values) cannot accurately represent the true strength of these critical regions. If the factor of safety obtained by the uniform-parameter model is close to the code-specified limits, the actual factor of safety might still be adequate. This discrepancy will lead to overly conservative designs and unnecessary engineering reinforcement.
Although demonstrated on an existing dump, the proposed workflow is equally applicable at the design stage of new waste rock dumps. At the design stage, representative samples of the waste rock to be dumped can be obtained from exploration trenches, borrow pits, or trial dumping cells; the same procedure—density estimation for the planned compaction standard, gradation analysis, scaling, large-scale triaxial testing, and DEM calibration—then yields the parameter sets. The vertical heterogeneity of a future dump can be predicted from the dumping plan: the dumping sequence defines the compaction age and overburden of each future bench, and the expected particle segregation can be estimated from the planned dumping method and bench height [42]. Layered parameter assignment based on these predictions allows the stability of alternative dump geometries (bench height, bench-face angle, berm width) to be compared before construction, providing a quantitative basis for optimizing the dumping plan. The present case study illustrates the magnitude of the error (approximately 4% in the factor of safety, plus mislocated critical benches) that would result from using uniform parameters at the design stage.
4.4. Research Limitations
This study has the following limitations, which need to be improved in future research: (1) Scaling of particle size distribution. The equal-replacement scaling technique reduced the maximum particle size from the prototype (approximately 600 mm) to the laboratory scale (60 mm). Although the D/dmax ratio of 5 meets the requirement of GB/T 50123-2019 [44], recent evidence suggests that ratios greater than 12 are required to fully eliminate size effects. The measured strength parameters may therefore overestimate the true in situ strength. In this study, the laboratory-derived parameters were used primarily for relative comparisons among elevations rather than as absolute in situ values. For engineering design, a calibration factor derived from in situ shear tests or back-analysis of existing slope performance would be required. (2) Plane-strain versus three-dimensional effects. The PFC2D model assumes plane-strain conditions, which neglects out-of-plane arching and three-dimensional force-chain distributions. For a dump that extends several hundred meters along strike, plane-strain is a reasonable first-order approximation for the central cross-section. However, at slope corners, at localized topographic irregularities, or when analyzing global stability, three-dimensional effects may become significant. (3) Representation of the particle size distribution in the slope model. The upscaled particle radius range (1–3 m) neglects fine fractions (<1 m). This simplification may overestimate porosity and underestimate the contribution of fines to density and potential cohesion. The model is therefore more representative of a block-dominated waste rock than a well-graded soil–rock mixture. This limitation is acceptable for the comparative analysis because both scenario models use the same particle size distribution, but for quantitative predictions, multi-scale approaches or GPU-accelerated DEM are recommended.
5. Conclusions
In this study, the mechanical properties of granular materials at different elevations were revealed through triaxial tests. Subsequently, two PFC2D models were established under different conditions—uniform parameterization and elevation-dependent parameterization—to explore the differences between these two methods in terms of particle displacement and the factor of safety. The following primary conclusions were drawn:
- (1)
- The physical properties and gradation composition of the granular materials vary systematically among the elevation benches of the dump: the density ranges from 1.83 g/cm3 to 2.30 g/cm3, the porosity from 0.171 to 0.351, and the coarse particle content from 73.66% to 87.03%, and the gradations of specimens 2# and 5# are discontinuous. These differences reflect pronounced spatial heterogeneity governed by compaction history and particle segregation during bench-wise dumping.
- (2)
- All specimens exhibit strain hardening and continuous shear contraction under confining pressures of 200–600 kPa. Denser, better-graded materials mobilize their load-bearing skeleton earlier and show higher peak deviatoric stress and lower volumetric strain; the inverse correlation between peak deviatoric stress and volumetric strain confirms the coupling between compression resistance and shear strength.
- (3)
- The shear strength parameters vary among benches (cohesion 26.92–34.48 kPa; internal friction angle 31.01–33.46°) and are jointly influenced by compaction state, gradation, and the filling effect of fines. The fitted cohesion is an apparent Mohr–Coulomb intercept over the tested stress range and should be used cautiously in engineering design.
- (4)
- The elevation-dependent (layered) model yields a factor of safety of 1.35 with shallow, bench-scale slip surfaces, whereas the uniform-parameter model gives 1.30—3.7% lower—and places the critical slip zones differently. Stability analyses of high dump slopes should therefore consider zone-specific parameter assignment based on measured spatial variability rather than relying only on spatially averaged parameters.
Author Contributions
Conceptualization, J.M. and H.Z.; methodology, J.L. and K.L.; software, J.M. and T.Z.; validation, H.Z., J.L. and J.M.; formal analysis, K.L.; investigation, J.M. and T.Z.; resources, J.M.; data curation, J.M. and T.Z.; writing—original draft preparation, J.M.; writing—review and editing, J.M.; visualization, J.M.; supervision, H.Z., J.L. and K.L.; project administration, J.L. All authors have read and agreed to the published version of the manuscript.
Funding
This research received no external funding.
Data Availability Statement
Data are contained within the article.
Conflicts of Interest
Author Jian Meng was employed by the company Kunming Engineering & Research Institute of Nonferrous Metallurgy Co., Ltd. And author Han Zhou was employed by the company Kunming Engineering & Research Institute of Nonferrous Metallurgy Co., Ltd.; Kunming Metallurgical Research Institute Co., Ltd., Kunming, China. The remaining authors declare that the research was conducted in the absence of any commercial or financial relationships that could be construed as a potential conflict of interest.
References
- Zhang, Z.-T.; Wang, Y.-H.; Zhang, J.-Q.; Liu, Z.; Gao, W.-H. A new gradation equation for coarse-grained subgrade fillers and its applicability based on the fractal theory. Geomech. Geophys. Geo-Energy Geo-Resour. 2025, 11, 20. [Google Scholar] [CrossRef] [Scilit]
- Wu, E.; Zhu, J.; Chen, G.; Bao, M.; Guo, W. Gradation equation of coarse-grained soil and its applicability. J. Cent. South Univ. 2020, 27, 911–919. [Google Scholar] [CrossRef] [Scilit]
- Zhang, Z.P.; Fu, X.D.; Sheng, Q.; Yin, D.; Song, D.; Du, Y. A non-linear ultimate strength criterion for soil-rock mixture based on rock block proportion. Chin. J. Rock Mech. Eng. 2021, 40, 1672–1686. [Google Scholar]
- Yang, Z.; Zhang, D.; Li, A.; Zhang, C.; Gong, J.; Li, Z. Gradation effect and improved Duncan-Chang model of dense skeleton structure soil rock mixture. Int. J. Pavement Eng. 2025, 26, 2510554. [Google Scholar] [CrossRef] [Scilit]
- Zou, D.G.; Ning, F.W.; Liu, J.M.; Cui, G.Y.; Kong, X.J. Study on scale effect of dynamic characteristics of rockfill materials based on ultra-large-scale triaxial apparatus. Shuili Xuebao 2024, 55, 528–536. [Google Scholar]
- Qi, T.; Kong, J.J.; Liu, F.Y. Effect of cyclic shear on interface characteristics of geogrid-soil-gravel mixture. Rock Soil Mech. 2023, 44, 2593–2602. [Google Scholar]
- Wen, S.J.; Mi, T.Y.; Yuan, X.A.; Xiao, H.; Xie, Z.H. Research on shear properties of overconsolidated red sandstone coarse grained soil under different water content and shear rate. Jiangxi Metall. 2023, 43, 432–438. [Google Scholar]
- Song, Y.; Sun, H.-Y.; Wang, Q.-Z.; Sun, W.-J.; Wang, L.; Zhang, Z.-B. Mechanical properties test and constitutive model of discontinuous graded soil-rock mixture. J. Chang. Univ. (Nat. Sci. Ed.) 2023, 2, 35–44. [Google Scholar]
- Zhang, Y.; Lu, J.; Han, W.; Xiong, Y.; Qian, J. Effects of Moisture and Stone Content on the Shear Strength Characteristics of Soil-Rock Mixture. Materials 2023, 16, 567. [Google Scholar] [CrossRef] [Scilit] [PubMed]
- Zhou, Z.; Li, F.; Yang, H.; Gao, W.; Miao, L. Orthogonal experimental study of soil–rock mixtures under the freeze–thaw cycle environment. Int. J. Pavement Eng. 2019, 22, 1376–1388. [Google Scholar] [CrossRef] [Scilit]
- Yang, S.; Li, X.Q. Simulation Analysis of Large Direct Shear Test of Soil and Rock Mixture Based on PFC3D. Adv. Eng. Sci. 2020, 52, 78–85. [Google Scholar]
- Liu, Z.Q. Numerical simulation analysis of shear strength of coal gangue soil-stone mixtures under wetting-drying cycle based on PFC2D. Fujian Constr. Sci. Technol. 2025, 4, 58–61. [Google Scholar]
- Tu, Y.; Long, H.; Fang, Z.; Chai, H.; Liu, X.; Zhang, L.; Yang, W. A new numerical method for constructing the three-dimensional microstructure of S-RM using digital image processing technology. Granul. Matter 2024, 26, 24. [Google Scholar] [CrossRef] [Scilit]
- Lu, R.; Luo, Q.; Wang, T.; Connolly, D.P.; Xie, T. A combined experimental and DEM investigation of grain interlocking in sheared granular assemblies. Particuology 2024, 90, 436–451. [Google Scholar] [CrossRef] [Scilit]
- Sun, Y.; Li, X.; Wang, G. Influence of Stone Shape Factor on the Pull-Out Resistance of Geogrid in the Soil-Rock Mixture. Adv. Mater. Sci. Eng. 2022, 2022, 4975059. [Google Scholar] [CrossRef] [Scilit]
- Gong, J.; Wang, J.; Zhang, S.; Xing, Y.; Deng, L.; Long, Z.; Pang, X.; Jiang, M. Impact of rock content and fine-grained soil properties on the compressive deformation behavior of soil-rock mixtures. Front. Earth Sci. 2025, 13, 1558854. [Google Scholar] [CrossRef] [Scilit]
- Zhang, Z.; Fu, X.; Sheng, Q.; Wang, S.; Fang, Y. Experimental and Numerical Simulations on the Mechanical Characteristics of Soil–Rock Mixture in Uniaxial Compression. Appl. Sci. 2024, 14, 10485. [Google Scholar] [CrossRef] [Scilit]
- Chen, H.; Zhao, C.; Zhang, R.; Huang, L.; Pan, H.; Qian, Y.; Yang, H. Micromechanics-based model of rock considering compaction deformation: Analysis of microcrack influence from discrete and continuous perspectives. Comput. Geotech. 2023, 164, 105766. [Google Scholar] [CrossRef] [Scilit]
- Zhang, H.; Lei, M.; Wang, L.; Cao, M.; Huang, W.; Ding, S. Multiscale numerical investigation into the effects of rock content and rock particle size on the macroscopic and mesoscopic mechanical characteristics of soil rock mixture. Sci. Rep. 2025, 15, 7336. [Google Scholar] [CrossRef] [Scilit] [PubMed]
- Berli, M.; Casini, F.; Attinger, W.; Schulin, R.; Springman, S.; Kirby, J. Compressibility of Undisturbed Silt Loam Soil—Measurements and Simulations. Vadose Zone J. 2015, 14, 1–11. [Google Scholar] [CrossRef] [Scilit]
- Wang, K.; Xia, Z.; Li, X. Matrix Suction Evaluation of Soil-Rock Mixture Based on Electrical Resistivity. Water 2021, 13, 2937. [Google Scholar] [CrossRef] [Scilit]
- Tian, W.T.; Dong, J.H.; Sun, J.J.; Yang, B. Experimental Study on Main Physical Parameters Controlling Shear Strength of Unsaturated Loess. Adv. Civ. Eng. 2021, 2021, 6652210. [Google Scholar] [CrossRef] [Scilit]
- Wang, J.; Jiang, Y.; Tang, X.; Wang, Y.; Zhao, Z.; Jin, B.; Yu, H.; Liao, S. Impact of Water Content and Stone Content on the Shear Strength of Soil–Rock Mixtures: An Experimental Study. Buildings 2025, 15, 4119. [Google Scholar] [CrossRef] [Scilit]
- Wang, J.Y.; Cao, W.G.; Zhai, Y.C. Horizontal push-shear test of soil-rock mixture filled foundation under different water environments. J. Cent. South Univ. (Sci. Technol.) 2016, 47, 615–620. [Google Scholar]
- Li, B. Study on Shear Properties of the Soil-rock Mixture. E3S Web Conf. 2020, 165, 04079. [Google Scholar] [CrossRef] [Scilit]
- Jiang, Q.Q.; Xu, Y.Q.; Wang, H. Research on shear deformation characteristics of soil-rock mixtures under different stone contents. J. Eng. Geol. 2020, 28, 951–958. [Google Scholar]
- Du, Y.; Fu, X.; Sheng, Q.; Zhang, Z.; Du, W.; Ding, H.; Liu, T. A quantitative description method for the mechanical behavior of soil-rock mixture as affected by water content. Front. Ecol. Evol. 2023, 11, 1249657. [Google Scholar] [CrossRef] [Scilit]
- Lv, X.-L.; Cheng, B.-W.; Zhang, J.-F.; Yan, Y.-B.; Xu, K.-F.; Zhu, C.-G. Experimental study on the influence of moisture content on the mechanical properties of soil-rock mixture. J. Ground Improv. 2023, 5, 97–104. [Google Scholar]
- Yan, X.; Zhan, W.; Hu, Z.; Yu, Y.; Xiao, D. Experimental Study on the Effect of Compaction Work and Defect on the Strength of Soil-Rock Mixture Subgrade. Adv. Mater. Sci. Eng. 2021, 2021, 5533590. [Google Scholar] [CrossRef] [Scilit]
- Keskin, M.S.; Kezer, S. Stability of MSW Landfill Slopes Reinforced with Geogrids. Appl. Sci. 2022, 12, 11866. [Google Scholar] [CrossRef] [Scilit]
- Kumar, A.; Das, S.K.; Nainegali, L.; Raviteja, K.V.N.S.; Reddy, K.R. Probabilistic Slope Stability Analysis of Coal Mine Waste Rock Dump. Geotech. Geol. Eng. 2023, 41, 4707–4724. [Google Scholar] [CrossRef] [Scilit]
- Tian, Y.; Zhou, W.; Jiskani, I.M.; Cai, Q.; Li, Z.; Lu, X. Stability analysis of varying height waste dump in open-pit mine under particle size gradation and reconstruction effect of waste materials. Int. J. Min. Reclam. Environ. 2022, 36, 587–604. [Google Scholar] [CrossRef] [Scilit]
- Rudra, E.S.C.K.; Pradhan, B.B.; Rai, R.; Ray, A. Numerical study of the effect of overburden pressure on the stability of mine dump slope. Sādhanā 2024, 49, 247. [Google Scholar] [CrossRef] [Scilit]
- Ai, X.; Chen, Y.; Huang, Y. Stability evaluation of high-bench dumps considering the effects of disordered particle arrangements. Sci. Rep. 2025, 16, 2388. [Google Scholar] [CrossRef] [Scilit] [PubMed]
- Igwe, O.; Chukwu, C. Slope stability analysis of mine waste dumps at a mine site in Southeastern Nigeria. Bull. Eng. Geol. Environ. 2019, 78, 2503–2517. [Google Scholar] [CrossRef] [Scilit]
- Igwe, O.; Chukwu, C. Evaluation of the mechanical properties and critical slope parameters of mine tailings at Enyigba, South eastern, Nigeria. Int. J. Geo-Eng. 2018, 9, 7. [Google Scholar] [CrossRef] [Scilit]
- Kainthola, A.; Verma, D.; Gupte, S.S.; Singh, T.N. A coal mine dump stability analysis—A case study. Geomaterials 2011, 1, 1–13. [Google Scholar]
- Poulsen, B.; Khanal, M.; Rao, A.M.; Adhikary, D.; Balusu, R. Mine overburden dump failure: A case study. Geotech. Geol. Eng. 2014, 32, 297–309. [Google Scholar] [CrossRef] [Scilit]
- Cunning, H.M. Guidelines for Mine Waste Dump and Stockpile Design; CSIRO Publishing: Clayton, VC, Australia, 2017. [Google Scholar]
- Zhang, Z.; Ma, Z.; Huang, B.; Zhu, H.; Zhao, X.; Yang, G. Mechanical properties and slope stability of a copper mine waste dump in China. Sci. Rep. 2026, 16, 20471. [Google Scholar] [CrossRef] [Scilit] [PubMed]
- GB/T 50123-2019; Standard for Geotechnical Testing Methods. China Planning Press: Beijing, China, 2019.
- Deiminiat, A.; Li, L. Experimental Study on the Reliability of Scaling Down Techniques Used in Direct Shear Tests to Determine the Shear Strength of Rockfill and Waste Rocks. CivilEng 2022, 3, 35–50. [Google Scholar] [CrossRef] [Scilit]
- Li, Y.; She, C. Numerical simulation of effect of size oncrushing strength of rockfill grains using particle flow code. Rock Soil Mech. 2018, 39, 2951–2959+2976. [Google Scholar]
- Luo, H.; Huo, Y.; Ju, N.; Lai, R.; Xie, M.; Duan, L. A study of the particle size distribution characteristics and instability mechanism of the slope of an abandoned slag yard. Hydrogeol. Eng. Geol. 2020, 47, 69–79. [Google Scholar]
- Cai, P.; Mao, X.; He, P.; Zheng, S.; Yun, Z. Particle flow simulation of slope soil spalling induced by rainfall inshallow permafrost zone: Taking the subgrade slope of typical frozen soil area of G214 line as an example. Sci. Technol. Eng. 2024, 24, 11423–11431. [Google Scholar]
- Xu, G.-J.; Zhong, K.-Z.; Fan, J.-W.; Zhu, Y.-J.; Zhang, Y.-Q. Stability analysis of cohesive soil embankment slope based on discrete element method. J. Cent. South Univ. 2020, 27, 1981–1991. [Google Scholar] [CrossRef] [Scilit]
- Dawson, E.M.; Roth, W.H.; Drescher, A. Slope stability analysis by strength reduction. Géotechnique 1999, 49, 835–840. [Google Scholar] [CrossRef] [Scilit]

Disclaimer/Publisher’s Note: The statements, opinions and data contained in all publications are solely those of the individual author(s) and contributor(s) and not of MDPI and/or the editor(s). MDPI and/or the editor(s) disclaim responsibility for any injury to people or property resulting from any ideas, methods, instructions or products referred to in the content. |
© 2026 by the authors. Licensee MDPI, Basel, Switzerland. This article is an open access article distributed under the terms and conditions of the Creative Commons Attribution (CC BY) license.