


Abstract
This study examines why ice covers on the Churchill River in Labrador crack during winter and how weather, river flow, freezing conditions, and riverbed features contribute to these events. Using data from 2010 to 2025 and satellite imagery, the study shows that cracks most often occur in December to February when heavy snow, rapid flow changes, or long cold periods place stress on the ice. Cracking also frequently starts near sandbars where the ice is weaker. The results highlight that no single factor causes cracking. Instead, a combination of snow load, temperature, flow variability, and local river conditions determines when and where cracks form. There is also a disconnect from flow regulation since cracks also formed in 2012 before the construction of the dam began in 2015. A field survey was also carried out employing a combination of borehole jack (BHJ) testing and ground-penetrating radar (GPR) surveys to quantify spatial variations in ice strength and thickness across a portion of the lower Churchill River across two sandbars. In situ BHJ measurements were conducted at multiple sites to determine confined compressive ice strength under both floating and grounded conditions, revealing substantial local variability linked to differences in ice support and the presence of white versus black ice. Complementary GPR transects using 500 MHz and 1000 MHz systems provided high-resolution profiles of ice thickness and internal structure, enabling identification of transitions between grounded and floating ice. The integrated BHJ–GPR approach allowed direct comparison between point-scale strength measurements and spatially continuous thickness and grounding patterns, demonstrating that grounded ice and ice containing higher proportions of white ice exhibited more complex stress states and greater variability in mechanical response. Together, these measurements highlight the importance of combining geophysical surveying with in situ mechanical testing to better understand how environmental conditions control ice integrity and potentially influence ice-jam lodgement propensity along regulated subarctic rivers.
Keywords:
borehole jack; ground-penetrating radar (GPR); cumulative degree-days of freezing (CDDF); ice-cover cracking; hydropeaking and flow variability; river ice dynamics and cold-region hydrology; sandbars and geomorphological triggers; snow accumulation and load; synthetic aperture radar (SAR); thermal and compressive stress 1. Introduction
Ice-cover formation is a central process in cold-region hydrology, particularly on northern rivers such as the Churchill River in Labrador, Canada. Cracks can arise in these ice covers during the course of winter from coupled thermal, mechanical, and hydrodynamic forcing of the ice sheet [1,2,3] for the Qu’Appelle, Slave and Churchill rivers. Each winter, subzero temperatures produce an extensive ice cover on the Churchill River, establishing the conditions for these interactions among hydrometeorology, river hydraulics, and ice mechanics. These winter ice covers also function as critical infrastructure for transportation (crossing to remote communities) and resource access across subarctic rivers [4]. Cracking events on the Churchill are most common from December to February, coinciding with extreme cold and variable snow accumulation [5]. Climate change may intensify these dynamics since rising winter temperatures shorten the ice season and heighten precipitation variability to concentrate heavy snowfall into shorter periods [6], contributing to declining ice duration and potentially increasing ice-related hazards at high latitudes [7]. In addition to atmospheric and flow-related stresses, geomorphological controls such as sandbars are increasingly recognized as potential initiation sites for ice-cover fractures.
In order to promote reducing operational risk and enhance safety in remote environments, this study seeks to enhance our understanding of how hydrometeorological drivers such as river-flow dynamics, cumulative degree-days of freezing (CDDF), snow-load thresholds, and sandbars as crack nucleation points impact ice cracking, ice-jam lodgement propensity, ice-jam flood hazard, and predictive capability. The occurrence of cracking on ice covers has been documented for other river systems. For example, on the Slave River in the Northwest Territories, Lindenschmidt et al. [2] showed that changes in flow during freeze-up and mid-winter can lead to fluctuations in the river water levels. These fluctuations can lead to elevated hydrostatic pressure that uplifts and fractures the ice cover and, in some cases, produces surface flooding. More broadly, the initial rise in water level during ice formation can induce upward stress and early fracturing that later propagates under snow loading or flow-induced bending [8]. Hydropeaking and discharge variability further modulate ice integrity by imposing both vertical and horizontal stresses. Because the Churchill River is regulated by upstream hydroelectric facilities at Churchill Falls and Muskrat Falls, rapid flow fluctuations may occur even during freeze-up. Reductions in outflow in early spring may have contributed to grounded ice and cracking on sandbars, while rapid mid-winter discharge increases and rising backwater stages highlighted the sensitivity of the ice cover to regulated flow pulses [9]. Consistent with observations across Canada, unexpected mid-winter flow increases often trigger hydraulic fracturing, whereas low-flow intervals can cause slumping and fracture as ice loses support [10].
Mechanistically, ice-cover cracking reflects both thermal stresses (from rapid temperature changes) and mechanical stresses (from external loads and flow variations) [11]. The CDDF, computed as the sum of daily mean temperatures below 0 °C over a specified period, quantifies the accumulated cold energy available for ice growth, thereby shaping the rate and thickness of formation and the evolving stress state of the cover [11,12]. In cold-region rivers such as the Churchill, CDDF can be used as a predictor for modelling ice thickness and anticipating stress accumulation within the cover [13]. In similar boreal systems, increased under-ice pressures during freeze-up have been shown to fracture the cover and permit water to flood the surface, a process documented on the Slave River [2] and detected on the Churchill River with radar imagery [5]. Even without major flow changes, extreme cold during freeze-up can generate longitudinal and transverse cracking through thermally induced stresses [14].
Snow can impact both the mechanical strength and the thermal regime of river ice. Heavy snowfall adds vertical load, and in locations where ice is insufficiently thick, that load can promote cracking and allow water to rise through fractures onto the surface [15]. On the Churchill River, Yeboah [5] identified a critical snow-depth threshold of approximately 127 cm above which transverse cracks across the channel become markedly more likely. Snow simultaneously insulates the ice and suppresses thickening, thereby increasing vulnerability to deformation and rupture [14]. Comparable patterns are reported across northern boreal rivers where greater snow accumulation delays freeze-up and yields thinner, more failure-prone ice [16]. Remote sensing has shown that anomalously high snow-load years correlate with surface flooding and mid-winter cracking [17].
Emerging evidence also links the spatial distribution of cracks to shallow geomorphic features. On the Churchill River, sandbars may act as pinch points where ice can ground during low flows, promoting hinging and flexural failure. Remote sensing provides essential observational capacity for river ice through high-resolution optical and synthetic aperture radar (SAR) data [18]. SAR and optical imagery reveal frequent overlap between sandbar locations and observed fractures, suggesting sandbars perturb under-ice flow and local stress, even if not strictly causal [19]. Leveraging these tools, Gomez et al. [19] examined the link between fractures and ice-jam formation during the 2018–2019 winter breakups using SAR and the RIVICE model, indicating that mapping fracture locations can improve ice-jam forecasting and flood-risk assessment [18,19].
Another objective of this study was to use the borehole jack (BHJ) to measure in situ confined compressive stresses within the ice cover spanning the Churchill River between a set of sandbars, in order to better understand how spatial variations in ice strength may influence the formation and persistence of cracks in this river system. By conducting BHJ tests across the channel, we aimed to characterize how the mechanical behaviour of the ice changes where it transitions from floating ice to grounded ice, since this transition alters the degree of confinement and therefore the measured strength of the ice sheet. A previous BHJ study at Vee Lake and Blackstrap Lake [20] demonstrated that grounded ice can be significantly stronger than floating ice when the underlying subgrade is stiff, as observed in Blackstrap Lake, but that this strength advantage disappears when the subgrade is soft, silty, or water-saturated, as was the case at Vee Lake where grounded and floating ice exhibited stresses that were statistically indistinguishable.
These contrasting results indicate that subgrade conditions exert a strong control on the mechanical response of the ice [21,22] and this is directly relevant to our investigation of the Churchill River, where sandbars create abrupt changes in both ice thickness and ice support conditions. Our interest in these variations stems from long-term observations of cracking along the Churchill River ice cover, where only about half of the ice seasons examined showed visible cracks; this does not preclude the cracks being present when they cannot be detected, as it is possible that snow or wet-snow conditions inhibited their detection in the satellite imagery. Understanding whether grounded or partially grounded ice near the bars acts as a zone of weakness or strength is essential because prior analyses suggest that weak points, particularly where white, flooded, and refrozen ice accumulates, may govern where cracks initiate and propagate.
By combining BHJ-derived compressive strength measurements with existing crack-mapping records and GPR-derived thickness profiles, this study investigated whether the mechanical contrasts across the sandbar transitions correspond to observed cracking behaviour.
2. Study Site Description
The Churchill River in Labrador, Canada, flows through a cold subarctic region shaped by dense boreal forest and rugged, rocky terrain. The landscape is mainly covered with spruce and fir trees, along with rocky outcrops and wet peatlands containing bogs and fens. Hard ancient rocks create a varied river shape with narrow gorges, steep banks, and shallow sandbars, which affect how water flows and cause ice to crack and deform in winter. The soils are mostly acidic forest soils, with organic-rich soils in wetter lowlands, and small areas of permafrost in colder or poorly drained spots influence freezing and thawing processes. Human activity in the region is mainly focused on hydropower, Indigenous subsistence use, and limited forestry, mining, and tourism.
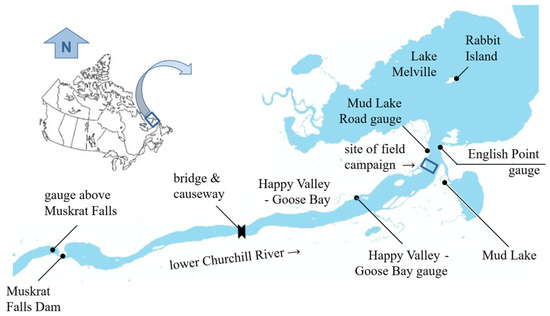
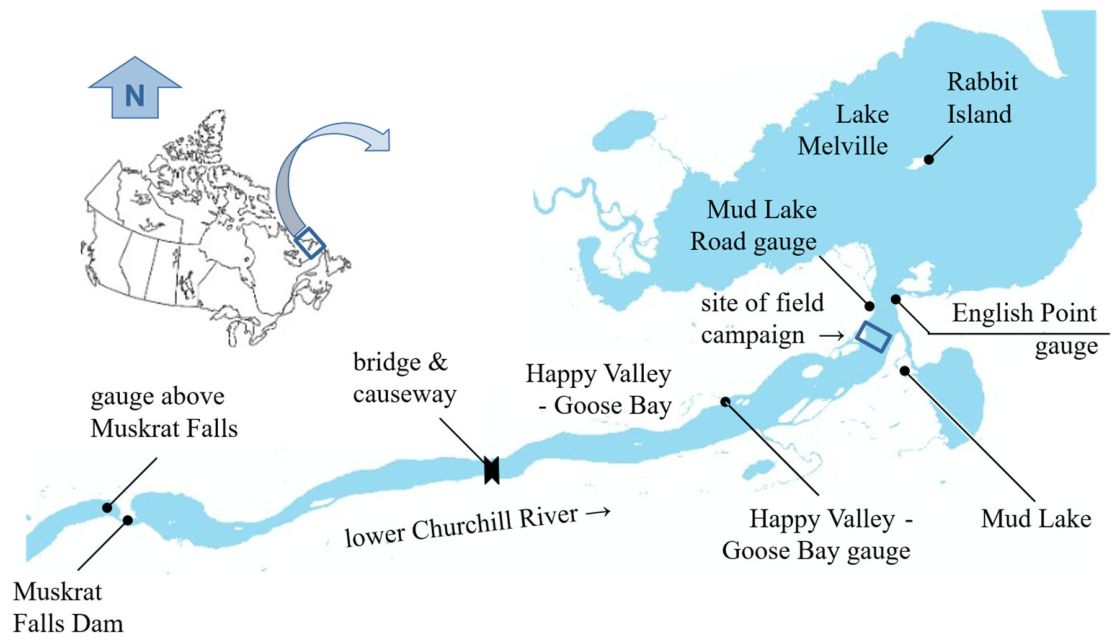
The Churchill River watershed covers approximately 80,000 km2 and is characterized by a rapid, high-energy flow regime typical of subarctic rivers. Many nearby lakes are elongated along the same axis as the dominant flow direction of the last continental ice sheet, reflecting the strong glacial imprint on regional geomorphology. River discharge within the study area is regulated by two major hydroelectric installations: Churchill Falls, which controls the headwaters and upstream reservoir operations, and Muskrat Falls, which marks the upstream limit of the lower-river reach analyzed in this study. The linear distance between these two facilities is approximately 280 km. Downstream of Muskrat Falls, the river flows roughly 48 km before entering the brackish estuary of Lake Melville. A geospatial overview of this section of the lower Churchill River is provided in Figure 1.
Figure 1.
Lower Churchill River from Muskrat Falls to Lake Melville (adapted from Lindenschmidt et al. [9].
Winter air temperatures in the region commonly fall below −20 °C, allowing the formation of a thick ice cover by mid-December. The ice thickness often exceeds one metre by the end of winter. The combination of regulated discharge, spatially variable channel geometry, and naturally occurring sandbars creates a heterogeneous ice environment in which grounding, flexural deformation, and mid-winter cracking occur at specific, recurring locations. Historical observations indicate that several sections of the lower river, particularly those influenced by shallow sandbars or abrupt channel transitions, experience cyclic cracking events linked to hydraulic fluctuations and snow-induced loading.
Field measurements for this study were collected along the river corridor between Muskrat Falls and Happy Valley–Goose Bay, where long-term hydrometric and meteorological stations provide continuous records of discharge, snow load, and air temperature. These data, combined with remotely sensed ice-crack observations, allow for an integrated assessment of ice-cover response to regional hydrometeorological conditions.
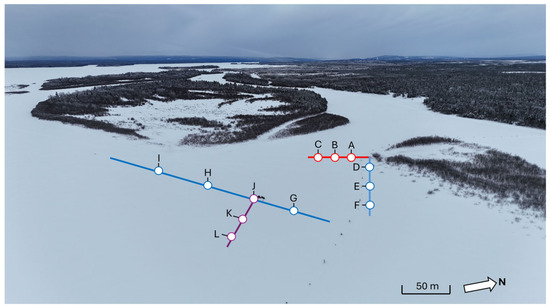
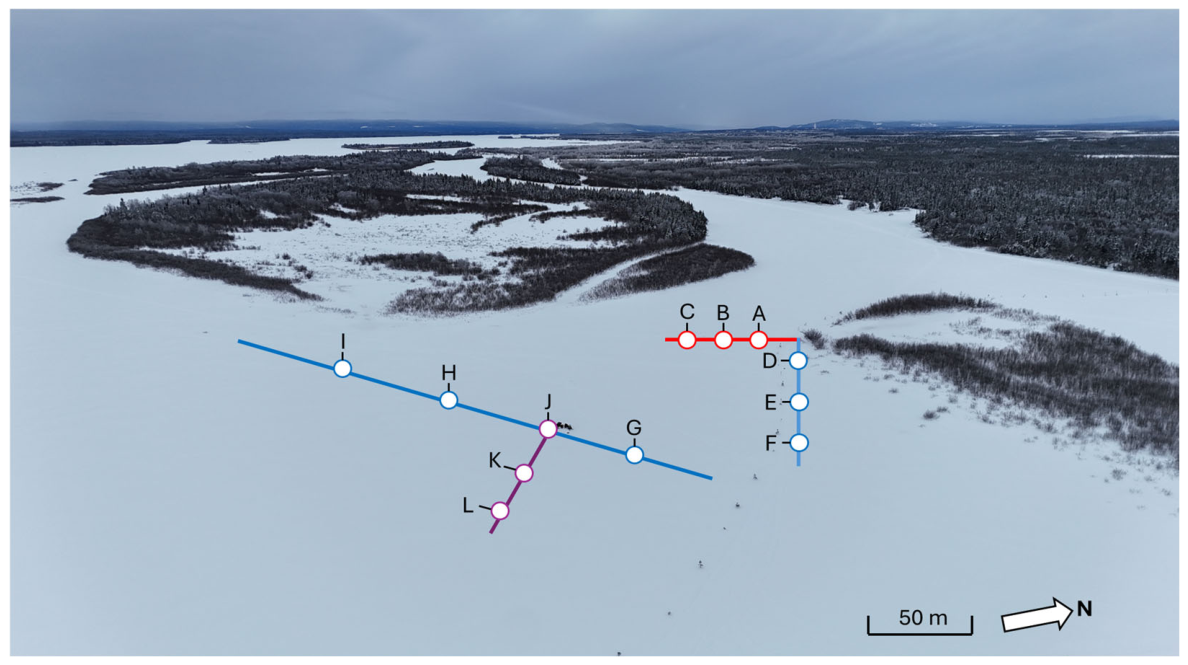
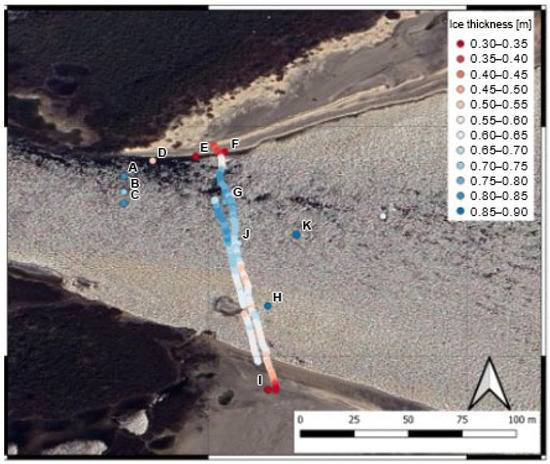
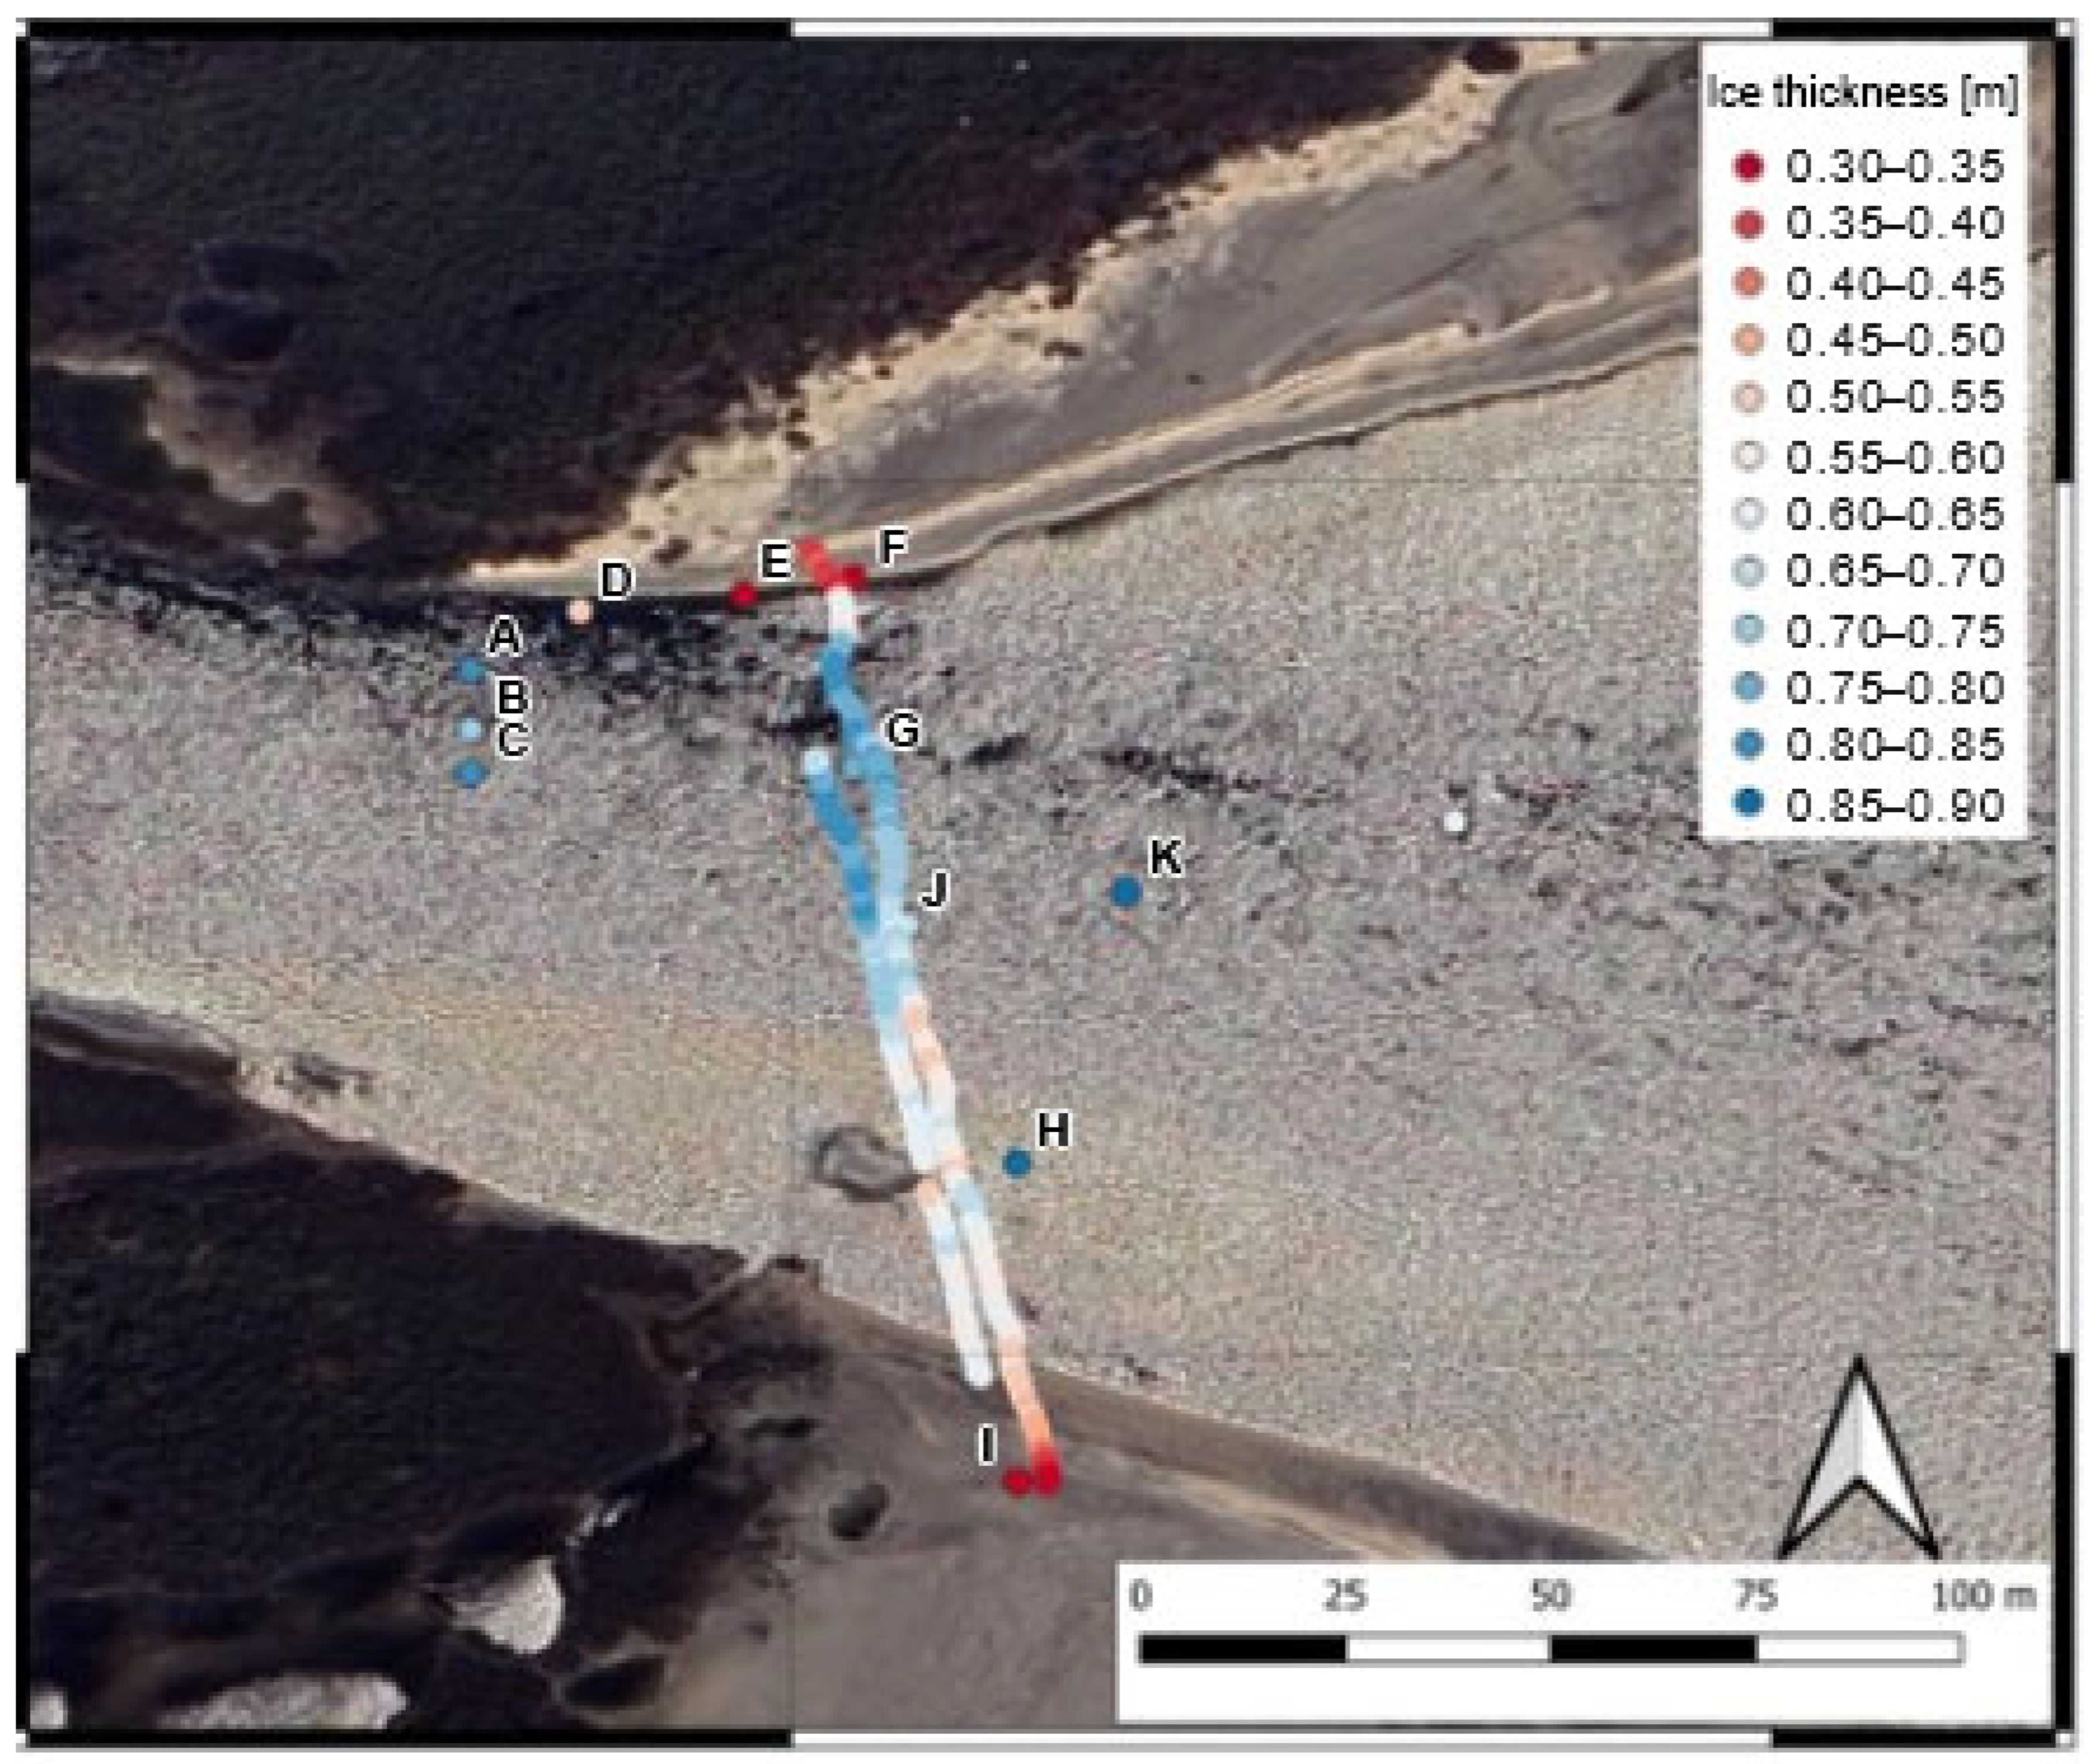
At the beginning of February 2026, an extensive ice survey was carried out along the Churchill River, during which measurements of ice thickness, snow depth, water depth, and in situ ice strength were collected as part of a coordinated assessment of both floating and grounded ice conditions. Over three days, 35 BHJ tests were completed, with 14 of these conducted on grounded ice and 21 on floating ice, enabling a direct comparison of strength characteristics across different support conditions that are known to influence stress distribution and the likelihood of crack initiation. All tests were carried out at depths between 27 cm and 30 cm below the ice surface to ensure methodological consistency and comparability across sampling sites. A spatial overview of the testing locations is shown in Figure 2, which illustrates the distribution of sites across multiple transects and highlights how measurements were strategically positioned to capture variability associated with sandbars, shoreline proximity, and mid-channel ice conditions. At each site, measurements were taken in triplicate to improve statistical reliability. However, site “I” includes only two measurements due to time and logistical constraints encountered in the field.
Figure 2.
Aerial photograph, looking upstream, of approximate site locations. The GPR surveys were along the I to G transect.
3. Materials and Methods
3.1. Hydrometeorological Analysis
All datasets used in this study were obtained from Environment and Climate Change Canada (ECCC) and satellite-derived synthetic aperture radar (SAR) imagery provided by C-CORE. The full dataset spans fifteen winter seasons, from December 2010 through February 2025, encompassing the primary freeze-up and mid-winter months during which ice cover instability and cracking are most likely to occur. The analysis focused specifically on December, January, and February, which represent the coldest period in the lower Churchill River Basin and the interval during which thermal and mechanical stresses on the ice cover are most pronounced. Ice-cracking months for the period 2012–2025 were identified through systematic SAR interpretation.
Discharge data for the Churchill River were sourced from ECCC hydrometric stations located at Upper and Lower Muskrat Falls. These stations provided average daily discharge (m3/s) for the winter months between January 2012 and February 2022, except for a missing data interval between December 2017 and February 2018. To assess the relationship between hydraulic variability and ice-crack occurrence, winter discharge records were aggregated by year and month and visualized using box-and-whisker plots. Each boxplot depicted the monthly median discharge, interquartile range (IQR), and the full range of observed values, with statistical outliers identified according to standard whisker definitions. To allow direct comparison between crack and non-crack periods of discharge characteristics, such as median values and intra-month variability, months in which SAR detected cracking were marked using red arrows.
Winter precipitation and snow-load conditions were evaluated using daily snowfall and snow-on-ground measurements from the Happy Valley–Goose Bay Meteorological Station. Two snow metrics were derived for each winter month from 2010 to 2025. Monthly total snowfall (cm) was calculated as the sum of all recorded daily snowfall events and was plotted using clustered column charts to compare crack and non-crack months across the full study period. Monthly snow-on-ground (cm) was taken as the maximum recorded snow depth within each month and used as a proxy for accumulated snow load acting on the ice cover. These values were similarly plotted and statistically contrasted between months with and without cracking.
To evaluate thermal forcing on the ice cover, daily mean air temperatures were obtained from ECCC’s Happy Valley–Goose Bay station for winter months from 2010 to 2025. These data were used to compute monthly cumulative degree-days of freezing (CDDF) by summing, for each day in a month, the magnitude of the mean temperature below 0 °C. Monthly CDDF values provide an index of cumulative cold energy available for ice thickening and thermal stress development. CDDF values were plotted in clustered formats with months of observed cracking indicated using crescent symbols to highlight potential thresholds and temporal alignments between thermal conditions and crack formation.
A threshold-exceedance assessment was performed using previously established values, including the 127 cm snow-depth criterion, to evaluate whether crack formation tended to coincide with critical loading or thermal conditions. The integration of SAR-based crack identification, hydrometric discharge variability, snowfall and snow-load metrics, and cumulative freezing indices enabled a multivariate examination of the hydrometeorological conditions associated with ice-cover cracking on the lower Churchill River. Collectively, these methods provided a robust framework for isolating the relative influence of hydraulic, thermal, and snow-load drivers on observed ice-failure events.
3.2. Space-Borne Remote Sensing
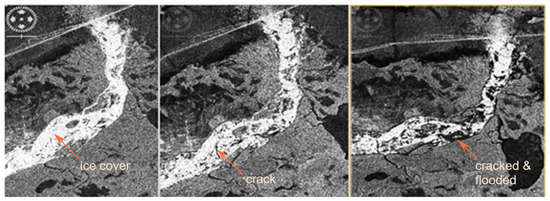
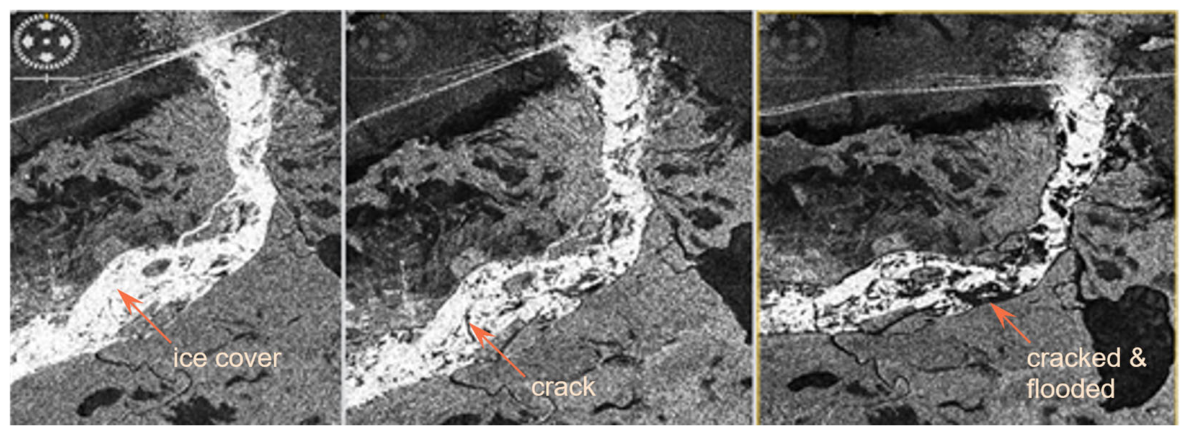
Ice-crack detection along the lower Churchill River was carried out using space-borne SAR imagery acquired from Sentinel-1, RADARSAT-1, ENVISAT, and RADARSAT Constellation Mission (RCM), with all image processing and interpretation completed by C-CORE. The SAR datasets provided high-resolution coverage, with spatial resolutions of 30 m or better, enabling detailed observation of the river ice surface under all weather and illumination conditions. Imagery was obtained for the core winter period, December through February, of each year from 2011 to 2024, ensuring representation of both early-winter freeze-up and mid-winter stability phases when cracking is most likely. Cracks were detected using a combination of interferometric coherence loss, which signals abrupt changes in surface structure, and manual interpretation of textural discontinuities and radar-backscatter anomalies indicative of ice deformation, open or refrozen fractures, and grounded-ice transitions. An example is shown in Figure 3. Together, these methods provided a robust, multi-sensor framework for identifying spatial and temporal patterns of ice cracking across the lower Churchill River.
Figure 3.
RADARSAT-1 images showing detection of ice cover cracks and widening of the cracks on 3, 10 and 20 January 2012 (left to right).
3.3. Borehole Jack Measurements
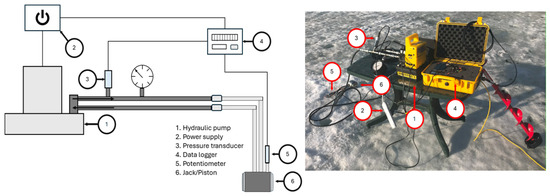
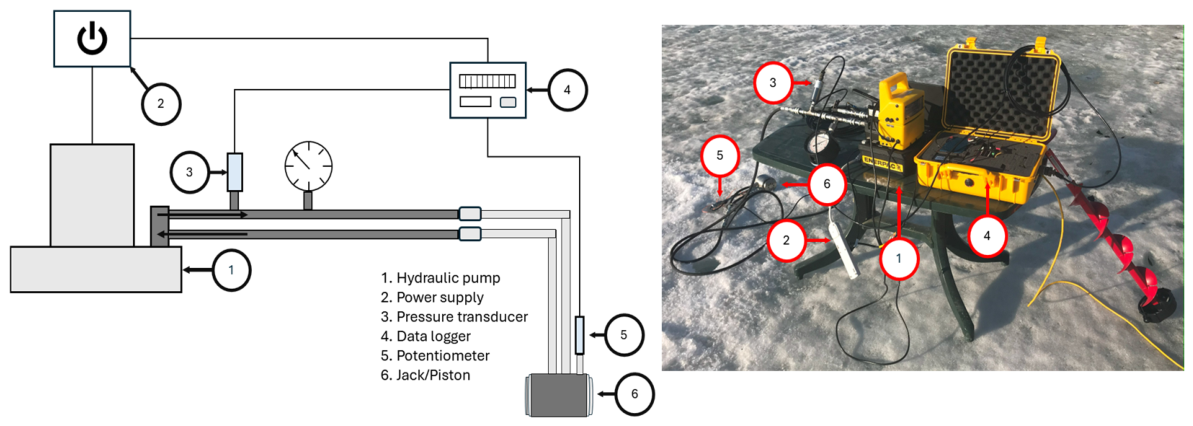
To measure the in situ strength of the river ice, a borehole jack (BHJ) system was used (see Figure 4), consisting of a stainless-steel hydraulic cylinder equipped with an indenter and a reaction plate specifically designed to operate within a 6-inch-diameter borehole, allowing controlled loading of the surrounding ice. During each test, a hydraulically driven piston applied pressure simultaneously to the front and rear plates, forcing the indenter outward to generate a localized deformation within the ice sheet. The associated hydraulic pressure was continuously recorded by a pressure transducer, and the displacement was measured using a linear potentiometer to capture the ice’s response. The BHJ system is engineered to operate at pressures up to 34,500 kPa supplied by a generator-powered hydraulic pump and is portable enough to be deployed from the back of a truck or, in this study, from a snowmobile toboggan transported across the ice surface.
Figure 4.
Borehole jack setup (from Rafat et al. [20]).
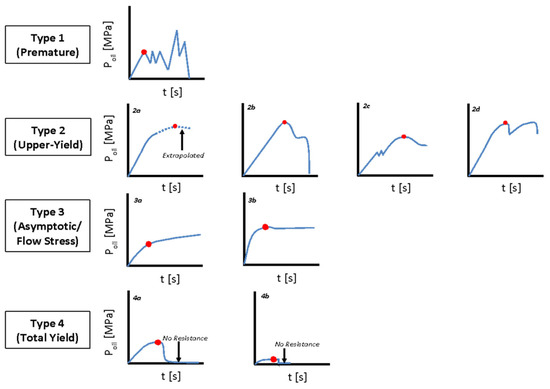
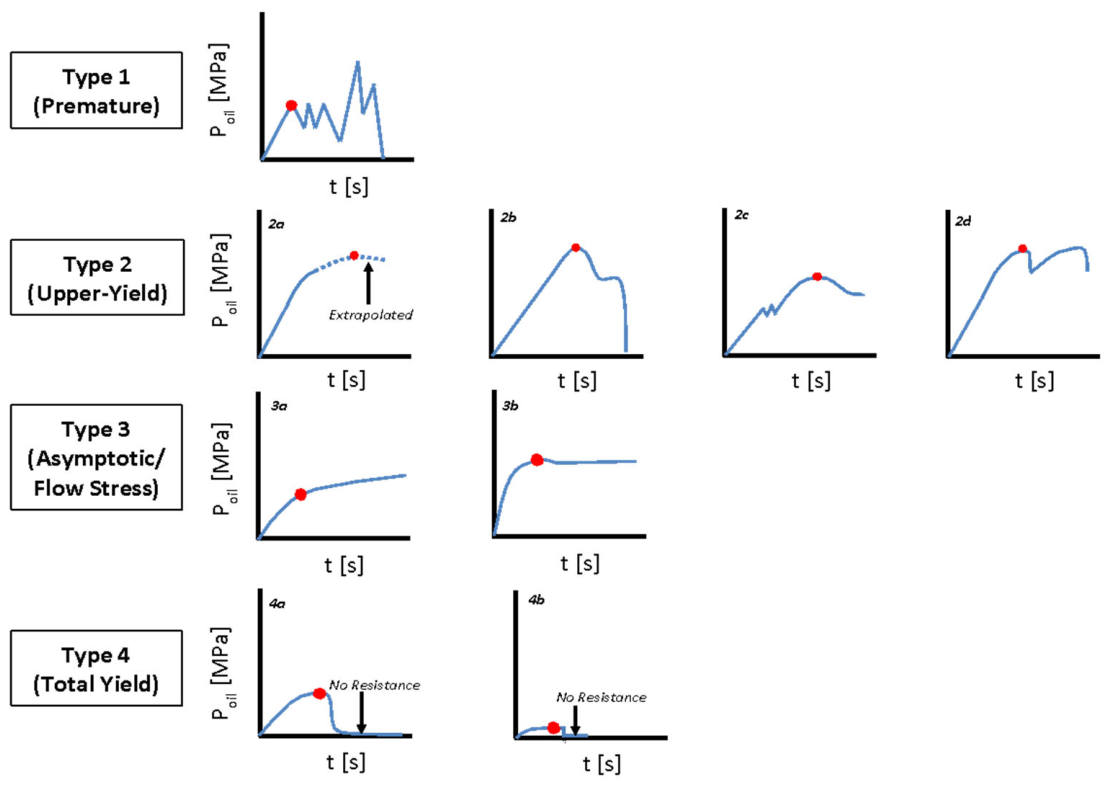
Ice strength () was derived by interpreting the pressure-versus-time curves obtained during each borehole jack test, which were categorized into four distinct failure types based on the characteristic shape and behaviour of the response curve, shown in Figure 5. Type 1 failures display a pronounced sawtooth pattern associated with repeated incremental fracture events as the indenter advances, indicating brittle, episodic cracking within the ice structure. Type 2 failures represent upper-yield behaviour, in which the ice exhibits a well-defined peak followed by a gradual decrease in resistance, reflecting controlled plastic deformation prior to failure. Type 3 failures correspond to tests where the yield point is poorly defined or ambiguous, suggesting a heterogeneous internal structure or transitional behaviour between elastic, plastic, and brittle regimes. Type 4 failures signify a complete loss of resistance following the onset of yielding, indicating that the indenter encountered minimal structural support typically associated with weak, highly porous, or heavily deteriorated ice layers.
Figure 5.
The pressure-versus-time curves obtained from the borehole jack tests were classified according to the framework established by Rafat et al. [20], which follows the original failure-mode definitions introduced by Johnson [23]. Red circles denote the BHJ-derived failure stresses associated with each identified failure type.
3.4. Ice-Thickness Measurements
Profiles of ice thickness and snow depth were obtained between the two sandbars at the study site to help explain observed variability between grounded and floating ice and to provide potential linkages between point-scale mechanical tests using the BHJ and river-scale ice processes such as cracking. To efficiently obtain ice-thickness information over large spatial extents, ground-penetrating radar (GPR) was used, as it provides rapid, non-destructive measurements along a continuous transect. The GPR methodology is based on transmitting short electromagnetic pulses in the radar (microwave) frequency range from a transducer placed on the ice-cover surface, where the initial pulse is recorded at the moment of emission and then propagates downward through the snow and ice cover [13]. When this electromagnetic wave encounters the contrast between ice and underlying water at the ice–water interface, a portion of the signal is reflected back towards the surface and received by the same transducer after a measurable travel-time delay relative to the initial pulse. By knowing the velocity of electromagnetic wave propagation through the ice, the ice thickness can be calculated.
Both 500 MHz and 1000 MHz radar systems were used in this study. For the 500 MHz profile, an electromagnetic wave propagation velocity of 0.16 m/ns was used. For the 1000 MHz profile, a slightly higher-than-typical value of 0.18 m/ns was selected to achieve better agreement with ice thicknesses and snow depths measured at the borehole jack sites. Field conditions also contributed to this choice, as the snow cover was deep and at times wet, and the basal ice occasionally contained sandy material, both of which could influence the effective velocity. A single representative velocity was applied rather than assigning different values for white and black ice.
4. Results and Discussion
4.1. Ice Cover Cracking Years
Cracks in the Churchill River ice cover were documented in the winter seasons beginning in 2011, 2012, 2018, and 2020 (satellite imagery only obtained until December 2022), with each occurrence taking place during the months of December, January, or February, which consistently represent the coldest period of the winter season. Analysis of SAR imagery from Sentinel-1, the RCM, and RADARSAT-1 verified the development and progression of these fractures, showing that they were most frequently initiated in shallow areas and around sandbars where the ice tends to ground, deform, and experience elevated mechanical stress.
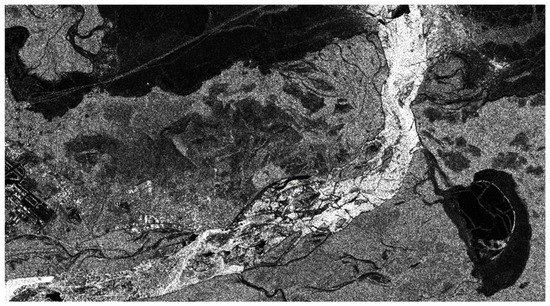
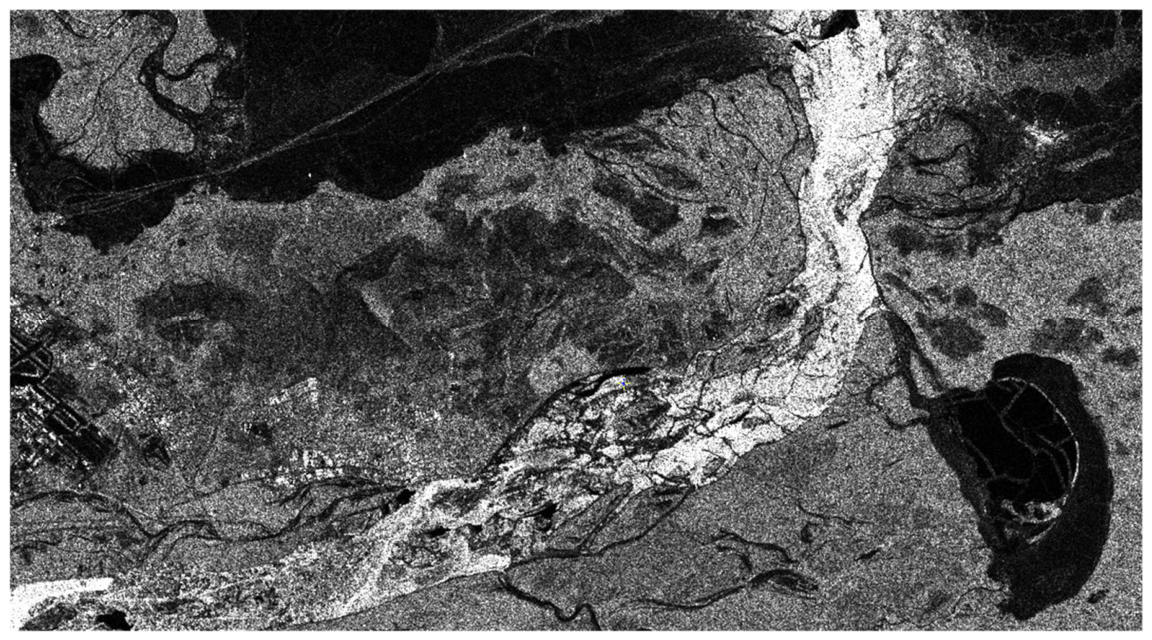
Figure 6 displays a SAR image that depicts the development of ice-cover cracking along the lower Churchill River, where bright radar returns represent intact ice surfaces and the dark, narrow linear features correspond to fractures, since the radar signal scatters away from the sensor when it encounters the smooth water or thin, water-saturated ice exposed along the cracks, resulting in low backscatter and a darker appearance in the images.
Figure 6.
Sentinel-1 image from 18 December 2020 showing cracks within the ice cover.
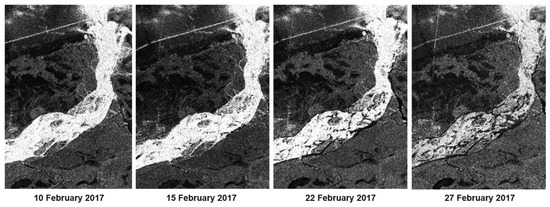
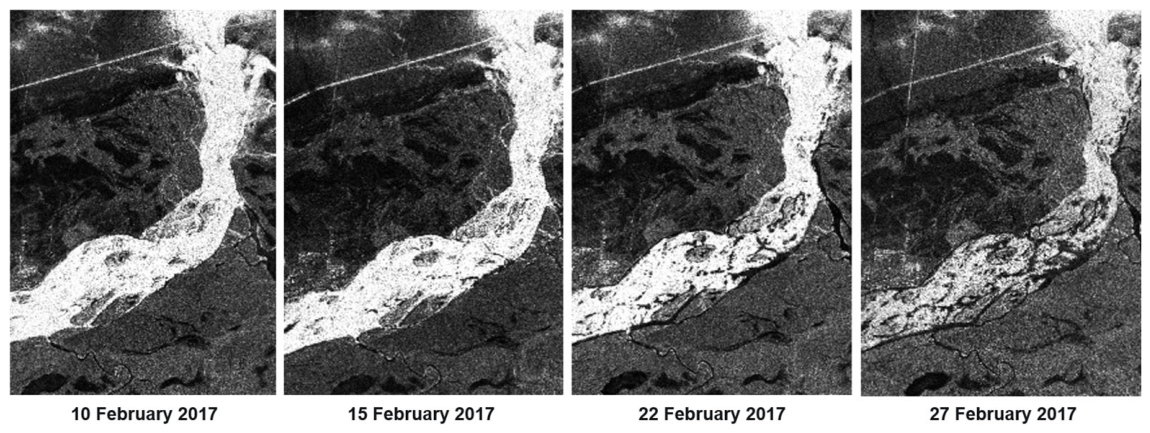
Referring to Figure 7, on 10 February, the ice cover appears largely intact, and the limited cracking observed was consistent with the presence of a thin, still-developing sheet that had not yet accumulated sufficient internal stress to fail extensively. However, by 15 February, the SAR imagery reveals subtle but increasing textural changes, indicating the onset of more significant crack development as the ice thickened and began to experience more mechanical and thermal stresses. By 22 February and again on 27 February 2017, multiple cracks were clearly visible across the surface, with several dark, elongated patterns appearing over the 17-day interval, reflecting widespread fracture propagation throughout the ice cover. This progression is consistent with field-based observations reported by Beltaos [8], who demonstrated that areas where ice grounds on sandbars tend to become preferential crack-initiation zones due to abrupt imbalances in vertical loading and spatial variations in ice thickness, both of which promote differential stresses that can trigger fracture.
Figure 7.
Satellite imagery of ice-cover cracks along the lower Churchill River in February 2017.
The recurrence of mid-winter cracking across these specific years corresponds closely with the conclusions of Yeboah [5] and Gomez et al. [19], who demonstrated that ice cover failure on the Churchill River is predominantly a mid-winter process driven by the interaction of several simultaneous stress forces. These include the increasing weight and insulating effects of accumulated snow, the thermal and mechanical stresses associated with progressive ice thickening, and the buildup of hydraulic pressure beneath the ice, all of which combine to create conditions conducive to widespread fracture formation.
4.2. River Discharges
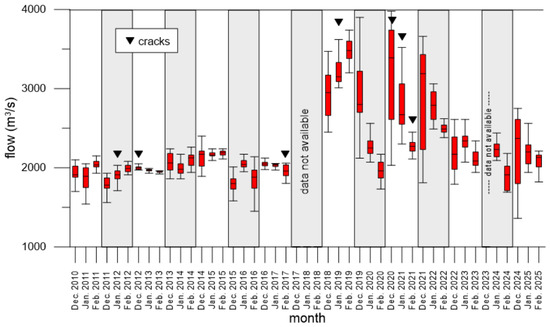
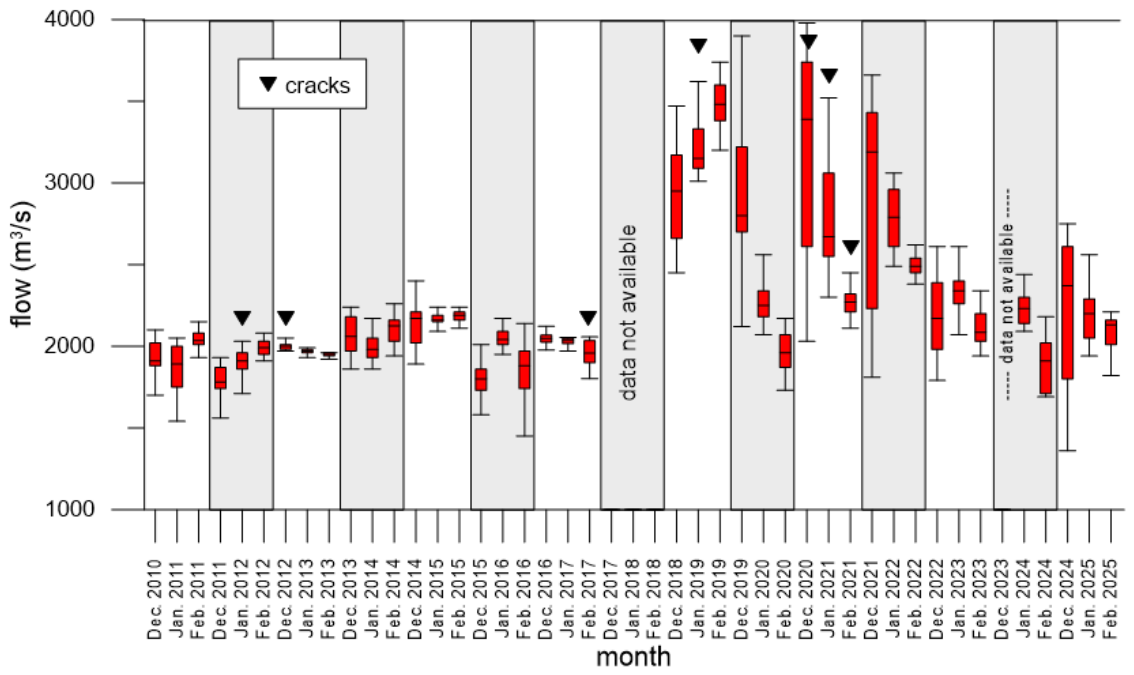
Figure 8 depicts how monthly winter discharges (December–February) relate to observed ice-cover cracking at the Muskrat Falls stations over 2010–2025 by juxtaposing crack months, marked by black triangles, against boxplots of flow distributions, thereby allowing the median, variability as represented by the interquartile range, and the spread to extremes as indicated by the whiskers to be interpreted in the context of years with cracking and years without. In January 2012, discharges clustered around a median of approximately 1900 m3/s with notably compact distributions implying relatively stable hydraulic conditions. Despite this stability, cracking was recorded and is most plausibly attributed not to discharge-driven mechanical forcing but to thermodynamic processes, particularly thermal contraction amplified by early-season snow accumulation (high snowfall and snow-on-ground discussed in the next subsections) that weighed down on the insulated ice cover to promote brittle failure [5,24]. February 2017, also a crack month, exhibited a median near 1950 m3/s and low variability, yet fractures developed, reinforcing a thermodynamic control consistent with elevated cumulative degree-days of freezing (CDDF; see Section 4.5) but with lower snowfall and snow-on-ground depths, which increase ice stiffness and brittleness and reduce its tolerance to strain, thereby lowering the threshold for fracture initiation under modest mechanical perturbations [12,14].
Figure 8.
Churchill River flows from 2012 to 2022 winter seasons and crack months.
By contrast, the 2020–2021 winter season was characterized by substantially more variable flows and elevated medians, with December 2020 peaking near 4000 m3/s and showing wide interquartile ranges and long whiskers indicative of pronounced day-to-day fluctuations consistent with hydropeaking. Such variability is known to induce cyclic uplift and grounding, flexure, and shear along the ice-bed and ice-bank interfaces, all of which elevate the likelihood of mechanical cracking [1,2,10]. Once dam operation commenced, cracking occurred in the ice cover in January 2019.
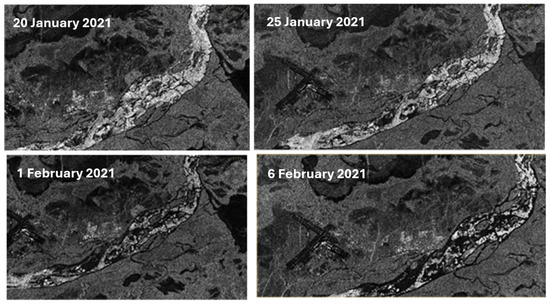
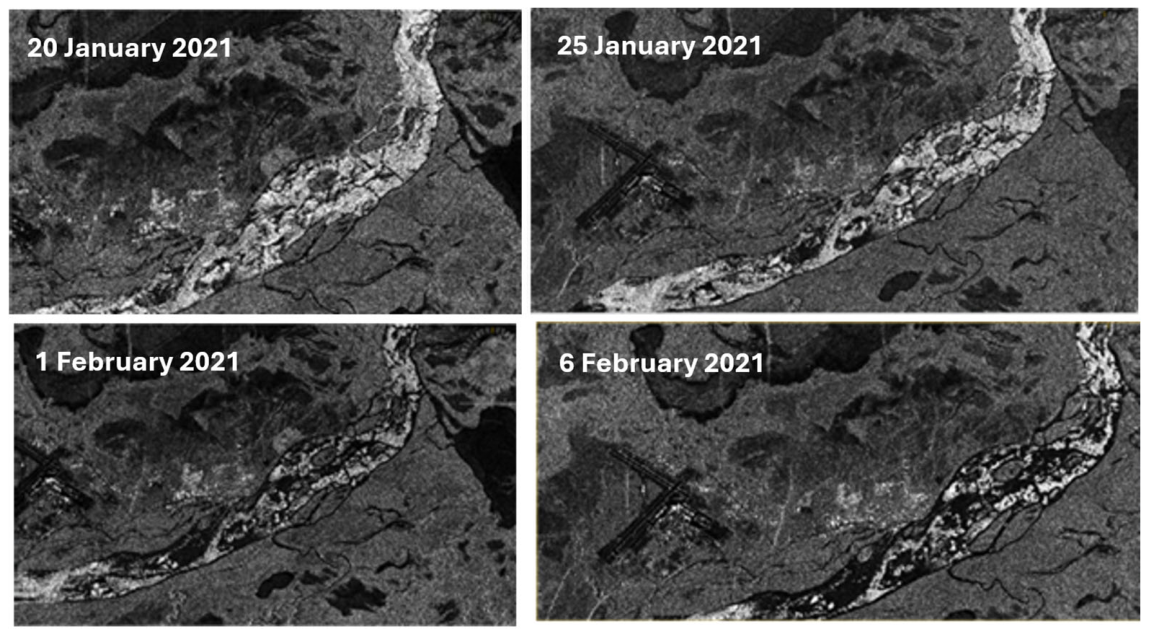
Cracking also occurred in December 2020, followed by confirmed cracking in January and February 2021, when medians exceeded roughly 2200 m3/s, although February displayed only mild variability. These hydrological patterns, corroborated by SAR evidence (see Figure 9), align with the interpretation that unstable flows during freeze-up can weaken inter-floe bonding and reduce cover cohesion, thereby preconditioning the ice for subsequent fracture under additional loading from snow or thermally induced strain. Although both December 2020 and December 2021 registered high-flow and high-flow variability periods, only within the former period did cracking occur. The rate of freezing (see CDDF below) was approximately the same for both months; however, the amount of snowfall and snow depths (see subsections below on snowfall and snow-on-ground) were nearly double during the month with cracking.
Figure 9.
Satellite imagery of ice cover cracks from January and February 2021.
Non-crack months spanning from January 2013 through to January 2017 were generally associated with lower medians on the order of 1600 to 2200 m3/s and relatively short whiskers with narrow interquartile ranges, a signature of stable, gradual discharge regimes that favour uniform congelation growth, minimize differential movement, and reduce stress gradients within the cover. In such regimes, cohesive bonding tends to be stronger and large-scale fracture less likely, whereas rapid stage changes and hydropeaking can lead to slumping, uplift, and shear that precipitate cracking [10]. Consistent with this, albeit in the context of glacial ice movement, McColl and Davies [25] documented how rapid rises or recessions destabilize ice sheets via differential motion that either lifts them off the bed or forces grounding, generating tensile and shear concentrations, particularly at morphological discontinuities such as bends, point bars, and sandbars where grounding and drag can localize strain. Collectively, the record demonstrates that both high-flow and moderate-flow months experienced cracking, indicating that discharge magnitude by itself is an insufficient predictor. Instead, crack initiation reflects the interaction among discharge dynamics and their timing relative to freeze-up, snow load and distribution, the seasonal evolution of ice thickness and mechanical properties as modulated by CDDF, and the antecedent structural state of the cover, with multi-factor preconditioning and climatic variability jointly governing whether a given month’s hydrograph translates into fracture [26].
4.3. Snowfall
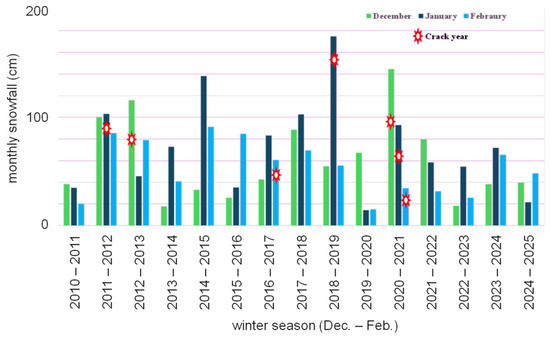
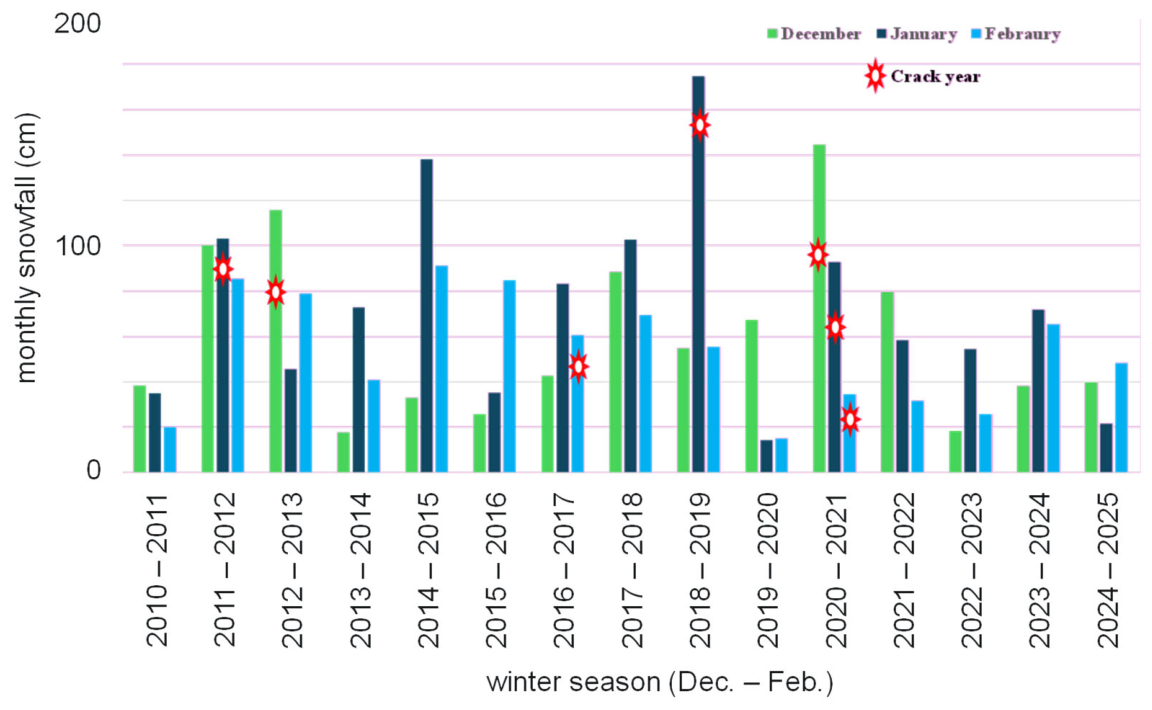
Figure 10 illustrates the monthly total snowfall for December, January, and February from 2010 to 2025 at Happy Valley–Goose Bay and compares these values with documented mid-winter ice-cover cracking events on the Churchill River, with crack years marked by red asterisks.
Figure 10.
Monthly total snowfall for the winters from 2010 to 2025 on the Churchill River (Goose Bay) with indications of crack months.
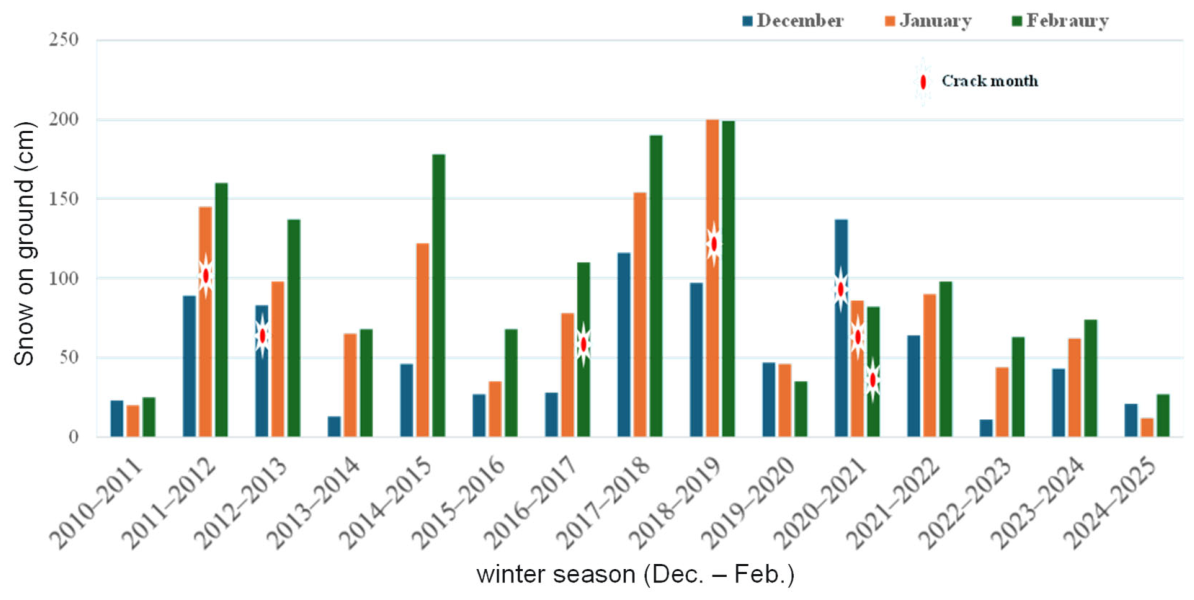
January 2012 received 103 cm of snowfall, an amount approaching the 127 cm critical threshold identified for heightened cracking likelihood, and, when combined with the cumulative snow load of 145 cm that month (see Figure 11), the resulting vertical stress likely exceeded the developing ice cover’s structural capacity, producing the cracking observed during this period. In December 2012, the total of 116 cm of snowfall imposed substantial early-season loading on a relatively thin, still-forming ice sheet, thereby increasing mechanical stress and contributing to subsequent fracture initiation in a manner consistent with effects of snow-induced overburden during freeze-up. Although February 2017 experienced comparatively low monthly snowfall, cumulative seasonal snow depths slightly above 100 cm, together with elevated CDDF (see Figure 12), likely increased ice stiffness and brittleness, enabling cracking even in the absence of large snowfall events that month. January 2019 stands out as the snowiest month in the dataset, with 175 cm of snowfall and more than 200 cm of cumulative monthly accumulation (Figure 11). Together with flows exceeding 3000 m3/s and CDDF values surpassing 1000 °C–days, the combination of heavy surface loading, hydraulic forcing, and thermal contraction would have strongly favoured ice-cover fracture. December 2020 similarly saw extreme snowfall of 145 cm, the second-highest value recorded, along with median flows just above 2000 m3/s and pronounced day-to-day discharge fluctuations that likely produced uplift, flexure, and propagation of cracks beneath the snowpack. In contrast, January and February 2021 were relatively warm and received reduced snowfall, yet cracking still occurred, likely because stresses accumulated earlier in the winter from heavy snow and shifting thermal conditions continued to weaken the ice cover’s structural coherence. Across non-crack years, snowfall generally remained below the 127 cm threshold, with only January 2015 and January 2018 slightly exceeding 100 cm.
Figure 11.
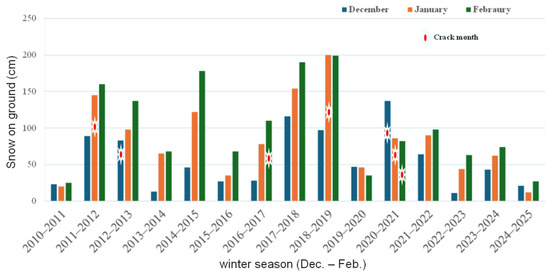
Total snow on the ground at the end of December, January and February for the winter seasons from 2010 to 2025.
Figure 12.
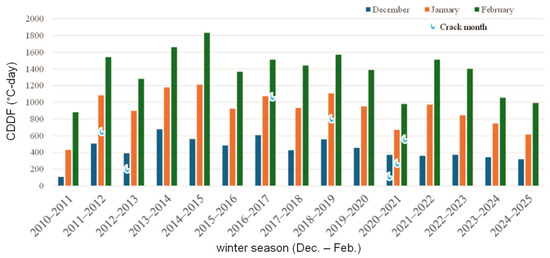
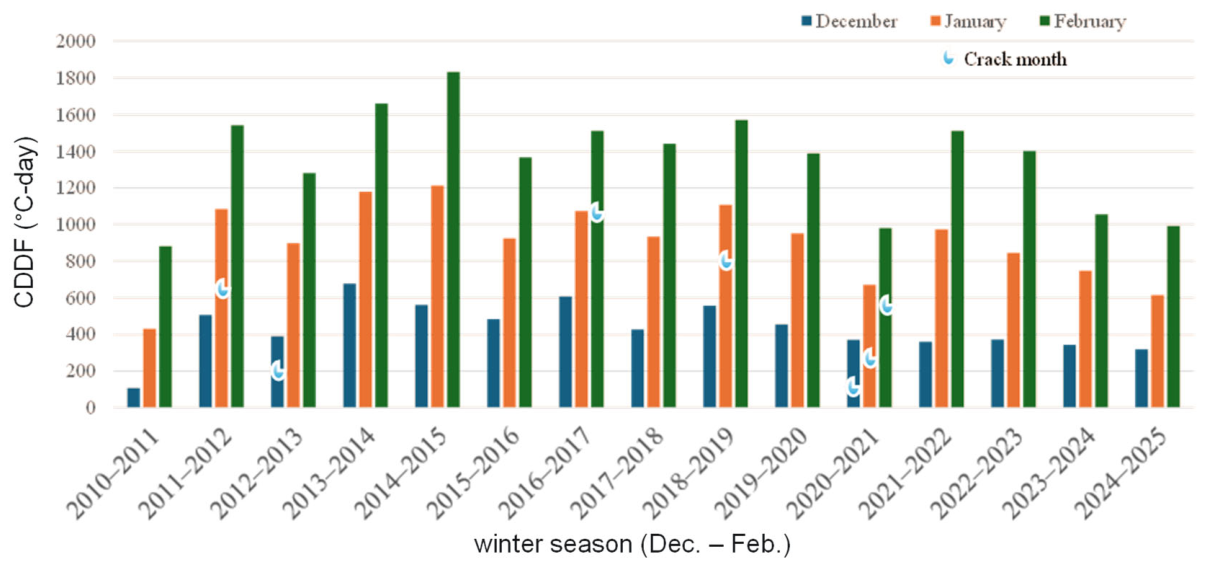
End-of-month CDDF for December, January and February of the winter seasons between 2010 and 2025.
4.4. Snow-on-Ground
Snow-on-ground data shown in Figure 11 indicate that January 2012, January 2019, and December 2020 accumulated 145 cm, 200 cm, and 137 cm of snow, respectively, and these totals correspond closely with documented cracking events along the Churchill River, reinforcing the threshold proposed by Yeboah [5], which suggests that accumulations exceeding 127 cm substantially elevate the risk of ice-cover fracture. In contrast, December 2012 exhibited visible cracking despite relatively low snow accumulation, a pattern likely attributable to the additional load placed on a relatively thinner, early-season ice cover, a mechanism consistent with Sopper et al. [24], who found that early snow loading inhibits ice growth and can induce structural failure well before mid-winter. February 2017 similarly experienced cracking even though snow accumulation reached only 116 cm, below the critical threshold, an outcome best explained by the markedly high CDDF observed that winter (see Figure 12), which would have increased ice brittleness and reduced its capacity to flex under stress, thereby favouring thermally induced fractures as supported by Huokuna et al. [27] and Gomez et al. [19]. Cracking also occurred during January and February 2021, despite sub-threshold snow accumulations, and was likely driven by unseasonably warm conditions (lower CDDF indicated in Figure 11) that weakened the ice structure. Such thermally induced reductions in ice strength align with Lindenschmidt [13], who emphasizes that warm winter temperatures accelerate thermal degradation and heighten susceptibility to mid-winter breakup even in the absence of heavy snow loading.
Conversely, several months, including February 2012, December 2013, February 2015, January 2018, February 2018, and February 2019, recorded snow depths exceeding 127 cm yet no cracking was directly observed in those specific months. However, this absence is unlikely to indicate truly crack-free conditions. In some cases, such as February 2012 and February 2019, cracking had already occurred earlier in the season (January 2012 and January 2019), and subsequent surface flooding or wet snow conditions may have obscured visible fracture signatures in SAR imagery. In other non-crack months, stable flow regimes, lower CDDF values, or gradually accumulating snow loads may have allowed the ice cover to deform more slowly and maintain structural integrity without generating new cracks, illustrating that the combination and sequencing of thermal, hydraulic, and mechanical drivers, rather than snow depth alone, govern the onset of cracking on the Churchill River. These patterns support the multi-variable threshold framework outlined by Yeboah [5], reinforcing the interpretation that the formation of mid-winter cracks on the Churchill River arises from the combined effects of snow load, hydraulic forcing, and thermally driven changes in ice properties, rather than any single factor acting in isolation.
4.5. Cumulative Degree-Days of Freezing (CDDF)
Figure 12 presents the cumulative degree-days of freezing (CDDF) for Happy Valley–Goose Bay, which serves as a fundamental thermal metric for evaluating ice strength, stiffness, and brittleness throughout the winter, since CDDF quantifies the total duration and intensity of temperatures below 0 °C and thereby governs both ice-growth rates and the evolution of internal thermal stress within the ice sheet. Among the months in which cracking was documented, only January 2012, February 2017, January 2019, and February 2021 exhibited high CDDF values exceeding 980 °C-days, indicating that prolonged cold conditions intensified thermal contraction stresses that contributed to crack initiation. In contrast, several other crack months, including January 2012, December 2020, and January 2021, showed moderate to low CDDF values, implying that the cracking observed during these periods was driven by alternative mechanisms such as early-season snow loading over thin, freeze-up ice covers. December 2020 is particularly notable because its relatively low CDDF value of roughly 370 °C-days coincided with strongly variable and elevated flows approaching 4000 m3/s, suggesting that cracking during this month may have been caused by mechanical stress from hydropeaking combined with overlying snow load rather than thermal contraction. By January 2021, CDDF increased to about 671 °C-days, which likely further weakened the existing ice cover and allowed earlier fractures to propagate under continued snow loading and residual hydraulic stress, while in February 2021, CDDF exceeded 980 °C-days, creating extreme thermal contraction that likely induced brittle failure within an already stressed and structurally compromised ice sheet. The sequence of events across these winter months underscores that cracking arises through cumulative and interacting thermal, hydraulic, and mechanical stresses rather than from any single forcing alone.
At the same time, several months with high CDDF values did not exhibit cracking, demonstrating that intense freezing alone cannot reliably predict fracture occurrence and reinforcing that cracking on the Churchill River is governed by the combined action of CDDF-driven stiffening, dynamic discharge variations, snow-load thresholds, and the timing of freeze-up. These observations collectively highlight that CDDF plays a central but not exclusive role in shaping ice brittleness and contraction stress, and that only when high CDDF coincides with other destabilizing factors, such as substantial snow loading, abrupt stage changes, or incomplete freeze-up consolidation, the likelihood of mechanical failure significantly increases.
We recognize that ice thickness is a key factor governing ice cover strength and susceptibility to cracking. However, direct, multi-year measurements of ice thickness were not available for the study reach and period, which limited our ability to include it explicitly in the analysis. As a result, CDDF was used as a proxy variable to represent ice growth and overall ice cover development. While CDDF is a simplified indicator and does not explicitly account for the insulating effects of snow cover or spatial variability in ice formation, it remains a commonly used surrogate in data-sparse environments to approximate ice thickness evolution. We acknowledge that snow accumulation can significantly influence the ice growth rate and decouple the relationship between air temperature and ice thickness, which introduces additional uncertainty when using CDDF alone.
4.6. In Situ Strength Measurements
The field measurements were used as a process-based snapshot to interpret mechanisms of crack initiation and propagation, rather than as a direct representation of long-term variability. The sandbar locations investigated during the field survey correspond to features that have been consistently identified in the satellite imagery as zones of reoccurring cracking, which supports their relevance as representative locations for studying crack initiation processes. While cracks were not systematically mapped during the field campaign itself, the field measurements provide evidence of mechanical and structural conditions (e.g., thinner ice, floating-to-grounding ice transitions, higher white-ice content, and increased strength variability) that are consistent with conditions expected to promote cracking. The BHJ tests capture localized variability across key morphological settings and therefore serve to provide insight into dominant processes rather than statistically representative coverage of the entire lower Churchill River.
All 35 borehole jack (BHJ) tests conducted during the field campaign resulted in upper-yield failure modes classified as Type 2 failures (see Figure 5), indicating that the ice at every site exhibited a pronounced yield phase prior to structural collapse. Of these tests, 32 displayed a well-defined yield point corresponding to a Type 2b response, meaning that despite visible cracking at several sites, the mechanical behaviour still aligned with an identifiable upper-yield pattern. When all measurements were averaged, the resulting BHJ-derived failure stress across the study area was 15.5 ± 2.2 MPa (1σ), reflecting the combined response of both floating and grounded ice. Floating ice exhibited slightly higher strength, with an average failure stress of 15.6 ± 2.2 MPa (1σ), compared to grounded ice, which failed at an average of 15.3 ± 2.6 MPa (1σ). While average strengths are similar, grounded ice shows a wider range of values, including some of the lowest measured strengths, indicating localized mechanical weakness.
Significant spatial variability was observed in the BHJ results, with floating-ice failure strengths ranging from a minimum of 10.7 MPa to a maximum of 16.7 MPa, while grounded-ice values spanned an even wider range, from 8.76 MPa at the lower end to 18.9 MPa at the upper limit, indicating that local conditions exert a strong influence on ice mechanical properties. Much of the variability within grounded-ice sites is attributed to the presence and thickness of granular, white ice, which failed at lower stresses when its proportion to columnar, black ice relative to the testing depth was high, consistent with the known weakness of refrozen, snow-ice layers that form through flooding or consolidation processes. Table 1 provides a summary of the BHJ results for each site. Also notable is that the thicknesses of floating ice (median = 80 cm) are greater than those of grounded ice (median = 34 cm).
Table 1.
Summary of site-averaged maximum ice strength, indentations at failure, stress rates to failure, and indentation rates to failure.
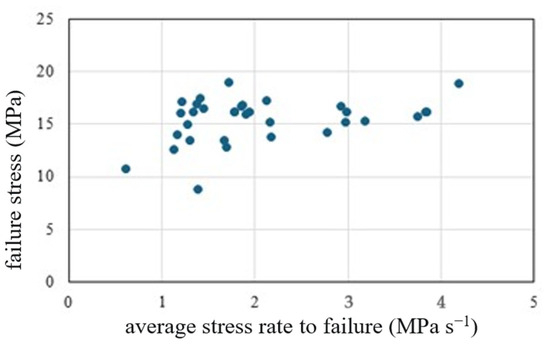
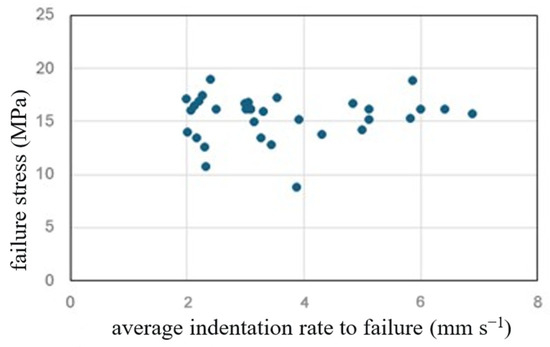
Clear stress-rate effects were evident in the borehole jack test results, as higher stress rates consistently corresponded to higher measured failure stresses (), indicating that ice subjected to more rapid loading tended to exhibit greater apparent strength, as shown in Figure 13. In contrast, no systematic relationship emerged between indentation rate and , suggesting that while the rate at which force is applied influences failure strength, the speed of indenter movement alone does not reliably predict mechanical response, as illustrated in Figure 14. Two tests, however, stood out as clear outliers. Test C1 involved relatively weak ice, with a failure stress of 13.8 MPa, yet failure occurred extremely quickly (within 1.5 s) at an indentation depth of 28.3 mm. The corresponding stress-rate and indentation-rate values were 9.2 MPa/s and 18.9 mm/s, both far above the overall average stress rate of 2.52 MPa/s and average indentation rate of 4.38 mm/s across all tests. Test C3 produced a similarly rapid failure, occurring in 1.8 s but at a substantially higher failure stress of 19.6 MPa, with associated stress-rate and indentation-rate values of 10.9 MPa/s and 14.9 mm/s, further highlighting the sensitivity of failure behaviour under unusually rapid loading conditions. Because these two tests exhibited unusually high loading rates and did not follow the general trend observed in the broader dataset, they were excluded from the stress-rate and indentation-rate trend plots.
Figure 13.
Effect of stress rates on observed failure stresses.
Figure 14.
Effects of indentation rates on observed failure stresses.
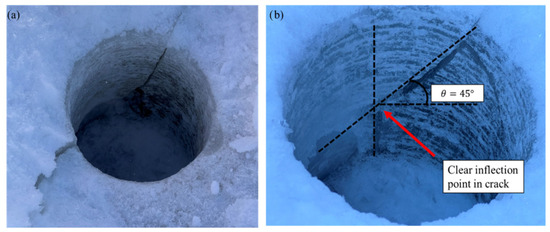
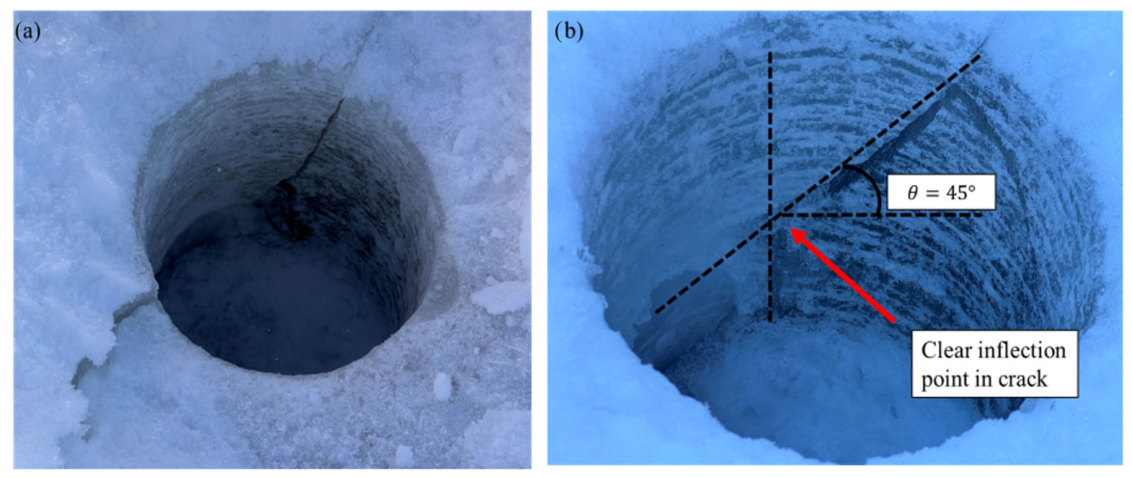
Unique cracking behaviour was observed during BHJ testing in locations where the ice sheet consisted of a combination of white ice (granular) and black (columnar) ice, the former stemming from consolidated frazil that formed during freeze-up and subsequently pushed into the shore zones to freeze into a mechanically weaker, more porous layer. During these tests, cracks commonly initiated along 45-degree shear planes, a characteristic indicator of shear-dominated failure under biaxial or triaxial loading. Several tests also exhibited out-of-plane shear fractures, revealing that the ice was experiencing a fully three-dimensional stress state (see Figure 15) rather than simple lateral loading. Out-of-plane failures occurred most frequently at grounded-ice sites where the ice was partially supported by the riverbed and thus subjected to complex confinement conditions. However, they were not exclusive to these locations, indicating that the interaction between layered ice structure and local stress fields can induce multidirectional cracking even in floating ice under certain circumstances.
Figure 15.
(a) out-of-plane shear failure with (b) 45° shear plane connected to a vertical crack at Site A.
4.7. In Situ Ice-Thickness and Snow-Depth Measurements
Ground-penetrating radar (GPR) transects were collected across the two sandbars using both 500 MHz and 1000 MHz sensors and Software Noggin systems (Ekko Project V5 R3) (Figure 16) to characterize spatial variations in ice thickness and grounding conditions, with the two frequencies providing complementary resolution and penetration depth for distinguishing between floating and grounded ice.
Figure 16.
Ice-thickness data at the borehole sites and from two transects collected by 1000 MHz GPR. The 500 MHz GPR transect extended from G to H. River flow is from left to right.
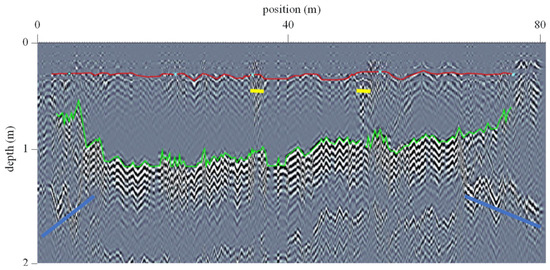
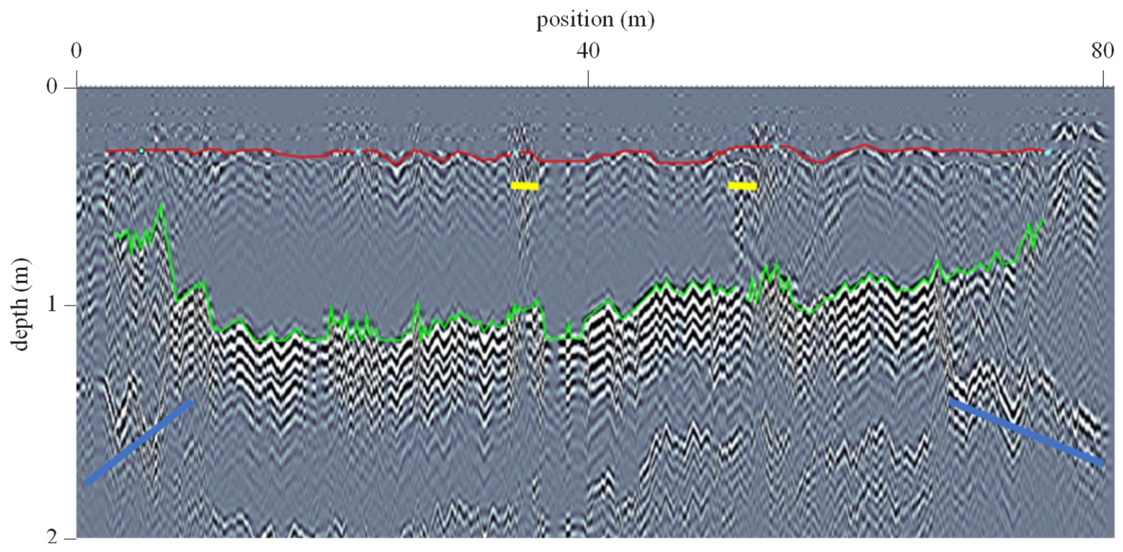
Figure 17 presents the 1000 MHz downstream radargram, which traverses directly over several BHJ test sites and provides high-resolution imagery of near-surface ice structure and thickness variations. Within this transect, the blue-marked zones likely represent transitions from grounded ice near the shore to fully floating ice towards the channel interior, where the basal reflector becomes more continuous and the ice–water interface is more clearly defined. The yellow-marked zones may also indicate white ice layers within the floating ice. In grounded ice zones, the radar signal commonly exhibits disrupted or attenuated basal reflections due to partial contact with the riverbed and increased scattering, whereas floating ice typically produces a stronger, more coherent basal reflection associated with a well-defined ice–water interface. Differences in signal velocities between black and white ice are noted in Lindenschmidt [13].
Figure 17.
1000 MHz radargram of downstream transect (from left to right: F,G,H,J,I). Green is the interpreted bottom of the ice, red the top of the ice/bottom of the snow. The cyan dots on the red lines are the approximate locations of the borehole sites.
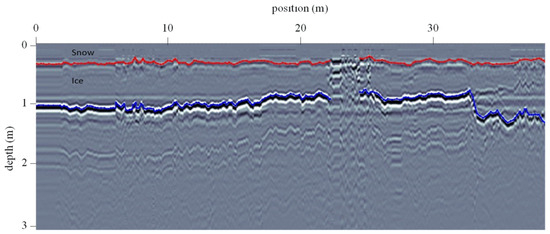
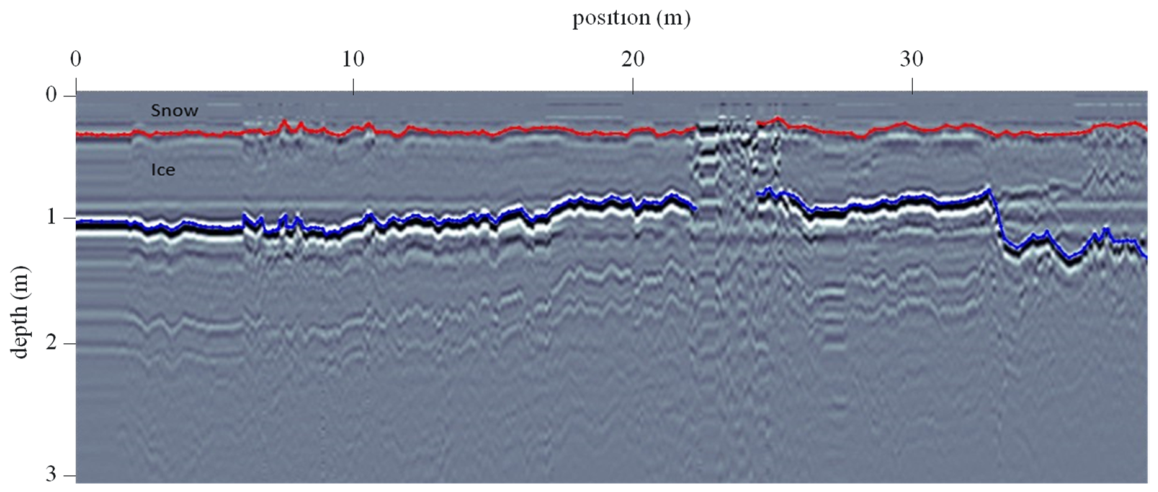
Figure 18 shows the 500 MHz radargram (only from floating ice) where the lower frequency allows deeper penetration and improved imaging of the full ice thickness, albeit with reduced vertical resolution compared to the 1000 MHz system.
Figure 18.
Ice-thickness data at the borehole sites from one transect collected by 500 MHz GPR extending from G to H. River flow is from left to right. Blue is the interpreted bottom of the ice and red is the top of the ice/bottom of the snow.
Differences between black ice and white ice are evident in the 1000 MHz GPR response and the BHJ results, as black ice generally appears as a more homogeneous, high-velocity medium with clearer internal and basal reflections, while white ice tends to produce more diffuse reflections due to its higher porosity, greater air content, and internal heterogeneity. These contrasts are especially important in grounded ice zones, where white ice was more frequently observed and where complex stress states arise from partial bed support, leading to greater variability in both radar signatures and measured mechanical strength.
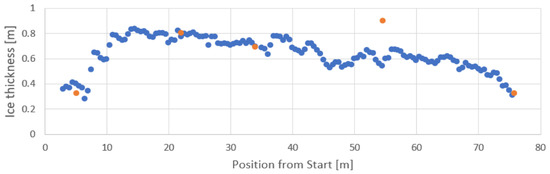
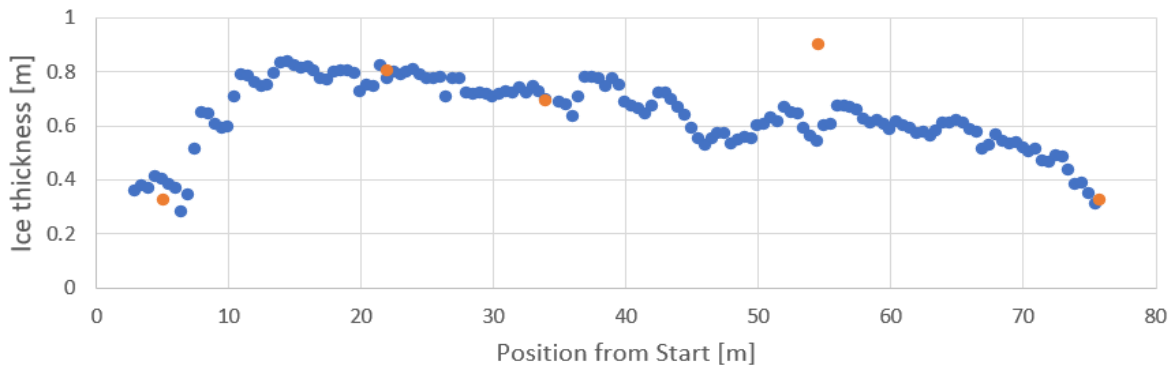
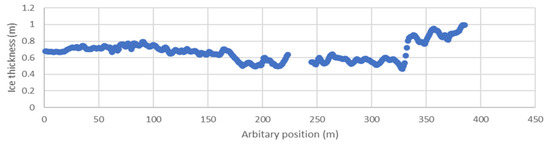
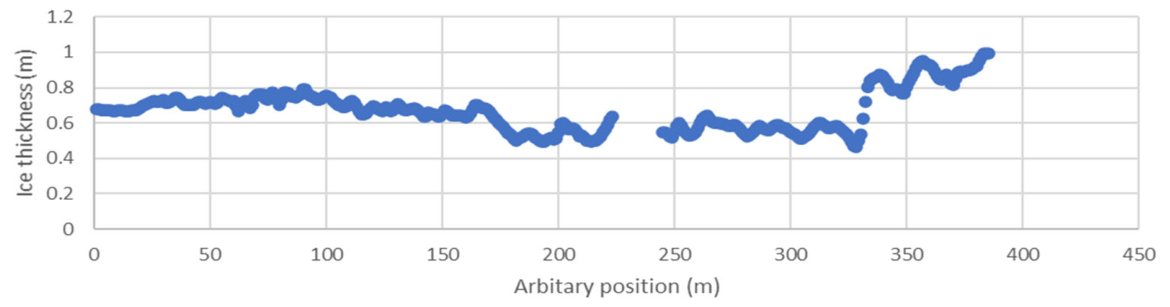
Figure 19 combines the 1000 MHz radar-derived thickness profile with borehole-measured ice thicknesses, allowing direct validation of the GPR interpretations and highlighting areas where discrepancies may arise due to changes in electromagnetic wave velocity, and hence changes in the layered ice structure (different proportions of black-ice to white-ice layering), or the 1000 MHz being more sensitive to the snow dielectric properties. The corresponding ice-thickness estimates derived from the 500 MHz data are shown in Figure 20.
Figure 19.
Ice-thickness data (blue) from 1000 MHz GPR (velocity = 0.18 m/ns). The orange markers are the thickness from the borehole measurements (F,G,H,J,I).
Figure 20.
Ice-thickness data from 500 MHz (velocity = 0.16 m/ns). The transect was started at Site G and finished at Site H.
Compressive ice strength is primarily governed by stress or strain rate rather than indentation rate, a dependency that becomes most pronounced near the ductile–brittle transition. In this study, the applied stress rates during BHJ testing were relatively limited in range and likely did not approach the ductile–brittle transition regime for freshwater ice, which explains the relatively weak sensitivity of failure strength to stress rate and the lack of correlation with indentation rate. These observations are consistent with established ice mechanics.
The available field observations from the combined GPR and BHJ datasets suggest that cracking may initiate near sandbars where the ice is thinner and weaker. The GPR transects show clear spatial variability in ice thickness across the water channel between the sandbars, with transitions from thicker floating ice to thinner, often grounded ice near the bars, creating gradients in structural support and stress distribution. These thickness variations coincide with zones where grounding occurs, which disrupts the continuity of the ice cover and promotes localized stress concentrations. At the same time, the BHJ measurements reveal substantial variability in ice strength between and within grounded and floating zones, with grounded ice near sandbars often exhibiting lower strength where higher proportions of white ice are present, consisting of more heterogeneous ice with variable strength due to complex confinement.
Cracks may also preferentially initiate near sandbars where ice transitions from floating to grounded ice, when ice becomes thinner, weaker and more heterogeneous in its composition. Moreover, the observed transition zones between floating and grounded ice act as mechanical discontinuities where stress gradients can be maximized, facilitating both crack initiation and subsequent propagation. Hence, sandbars are not only geometrical features influencing hydraulics but are also critical controls on ice mechanical integrity and crack development through their combined effects on ice thickness and strength variability.
Overall, the combined use of GPR surveys, borehole thickness measurements, and BHJ testing provides a useful framework for distinguishing floating from grounded ice. The spatial distributions of ice strength and thickness are important for understanding ice cracking, but directly linking these measurements to cracking locations was difficult due to field safety constraints. Areas where cracks typically form were often unsafe to access because of unstable ice, active cracking, and flowing water beneath thin ice, so measurements had to be taken in safer locations instead. This meant the ice strength and thickness data were not well aligned with cracking observations, limiting detailed analysis and making the datasets appear disconnected. Future work should aim to safely collect measurements closer to active cracking zones to better establish these relationships.
5. Conclusions
The combined analysis of discharge, snowfall, snow-on-ground, cumulative degree-days of freezing (CDDF), and the February 2026 field surveys using borehole jack (BHJ) testing and ground-penetrating radar (GPR) provides a framework for evaluating whether ice-cover cracks represent zones of higher or lower propensity for ice-jam lodgement on the lower Churchill River. The long-term hydrometeorological comparisons show that cracking does not occur under a single set of conditions but rather emerges when multiple stressors coincide, such as heavy snow accumulation, rapid or highly variable discharge, and periods of intense or prolonged freezing, all of which contribute to heterogeneous ice thickness, internal stress gradients, and partial grounding near sandbars. Snowfall and snow-on-ground analyses further refine this interpretation by demonstrating that high snow loads, particularly when exceeding the identified threshold of approximately 127 cm, impose substantial vertical stress while simultaneously insulating the ice and suppressing thickening, resulting in thinner, weaker ice that is more susceptible to cracking and flooding through fractures. A logical next step would be to carry out multi-linear regressions with the various parameters for crack/no-crack years.
The field survey revealed that grounded ice along the sandbar banks had a higher proportion of white ice to black ice. An example of such is shown in Figure 21 from the outlet of Barrier Lake, Alberta, where the snow cover was melted from the ice cover to reveal this pattern, a photo which was not possible to capture at the Churchill River field site due to the presence of deep snow. During freeze-up, frazil ice (white ice) will have pushed into and grounded in the shore zones, whereas columnar ice (black ice) will form and float between these two areas at the channel centre. The grounded ice is weaker, forming a stress gradient with the floating ice where cracks can potentially form and propagate. These grounded zones experience more complex, three-dimensional stress states, as evidenced by frequent shear failure modes, indicating a weaker ice compared to the floating ice. GPR transects complement these findings by mapping transitions from floating to grounded ice and identifying spatial variations in ice thickness. Together, the BHJ and GPR data indicate that cracks associated with grounded ice and heterogeneous layering are more likely to correspond to mechanically weak segments of the ice cover that may act as preferential ice-cover breakage areas and ice-jam lodgement points.
Figure 21.
An example of clear separation of white ice (formed from granular frazil ice) along the shoreline and black ice (columnar ice) in the channel centre at the outlet of Barrier Lake, Kananaskis, Alberta.
Taken collectively, the comparison of hydrometeorological records with in situ mechanical and geophysical measurements shows that ice-cover cracks may be indicative of elevated ice-jam lodgement propensity when they coincide with cracks propagating from zones of ice grounding, high snow load, significant white-ice formation, and flow variability that promotes repeated stress cycling. The integrated approach used in the study demonstrates that cracks may not be uniformly hazardous, but when embedded within a broader context of mechanical weakness identified by BHJ testing and GPR mapping, they provide valuable indicators of where ice jams are most likely to initiate and lodge along the Churchill River.
Author Contributions
Conceptualization, K.-E.L., A.R., M.L. and R.B.; methodology, K.-E.L., A.R., M.L. and S.G.; formal analysis, K.-E.L., A.R., D.A.Y., J.L., M.L. and R.B.; investigation, K.-E.L., A.R., D.A.Y., J.L., M.L. and R.B.; resources, K.-E.L.; data curation, K.-E.L., A.R., D.A.Y., J.L., M.L. and R.B.; writing—original draft preparation, K.-E.L., A.R., D.A.Y., J.L., M.L. and R.B.; writing—review and editing, K.-E.L., A.R., M.L., R.B. and S.G.; visualization, K.-E.L., A.R., D.A.Y., J.L., M.L. and R.B.; supervision, K.-E.L.; project administration, K.-E.L., A.R. and R.B.; funding acquisition, K.-E.L., A.R. and R.B. All authors have read and agreed to the published version of the manuscript.
Funding
Funding for this research was provided by the National Research Council’s Climate Resilient Built Environment Initiative, in support of delivering the Government of Canada’s Adaptation Action Plan, and towards achieving commitments under the National Adaptation Strategy; fund number: 1-429895-1323-8000.
Data Availability Statement
The original contributions presented in this study are included in the article. Further inquiries can be directed to the corresponding author.
Acknowledgments
As well as collecting the 500 MHz GPR data, Jacob Westcott (C-CORE) provided critical logistical support and a taxi service to prepare for the fieldwork. Jamie Penney of Northern Latitude Adventures provided invaluable local knowledge about safe and dangerous ice conditions on the Churchill River in the days prior and whilst we were there. The fieldwork would have been less productive without them. The authors have reviewed and edited the output and take full responsibility for the content of this publication.
Conflicts of Interest
Author Michael Lynch was employed by the company C-CORE, St. John’s, Canada. The remaining authors declare that the research was conducted in the absence of any commercial or financial relationships that could be construed as a potential conflict of interest.
References
- Lindenschmidt, K.-E.; Davies, J.-M. Winter flow testing of the Upper Qu’Appelle River. In Proceedings of the 17th Workshop on the Hydraulics of Ice Covered Rivers, Edmonton, AB, Canada, 21–24 July 2013; pp. 312–328. Available online: https://cripe.ca/fr/publications/proceedings/workshop-17 (accessed on 12 March 2026).
- Lindenschmidt, K.-E.; Das, A.; Chu, T. Air pockets and water lenses in the ice cover of the Slave River. Cold Reg. Sci. Technol. 2017, 136, 72–80. [Google Scholar] [CrossRef] [Scilit]
- Jordaan, I.J. Mechanics of ice–structure interaction. Eng. Fract. Mech. 2001, 68, 1923–1960. [Google Scholar] [CrossRef] [Scilit]
- Burrell, B.C.; Turcotte, B.; Comfort, G.; Groeneveld, J. Infrastructure and river ice: An overview. In Proceedings of the 21st Workshop on the Hydraulics of Ice Covered Rivers, Saskatoon, SK, Canada, 29 August–2 September 2021; Available online: https://cripe.ca/files/proceedings/21/Burrell-et-al-2021.pdf (accessed on 12 March 2026).
- Yeboah, D.A. Threshold Snow Depth and Flows for Ice Cover Cracking Along the Churchill River. Master’s Thesis, University of Saskatchewan, Saskatoon, SK, Canada, 2024. [Google Scholar]
- Feng, S.; Hu, Q. Changes in winter snowfall/precipitation ratio in the contiguous United States. J. Geophys. Res. Atmos. 2007, 112, D15109. [Google Scholar] [CrossRef] [Scilit]
- Shijin, W.; Yuande, Y.; Yanjun, C. Global snow-and ice-related disaster risk: A review. Nat. Hazards Rev. 2022, 23, 03122002. [Google Scholar] [CrossRef] [Scilit]
- Beltaos, S. River Ice Breakup; Water Resources Publications, LLC: Lone Tree, CO, USA, 2008. [Google Scholar]
- Lindenschmidt, K.-E.; Briggs, R.; Khan, A.A.; Puestow, T. Elements and Processes Required for the Development of a Spring-Breakup Ice-Jam Flood Forecasting System (Churchill River, Atlantic Canada). Water 2024, 16, 1557. [Google Scholar] [CrossRef] [Scilit]
- Beltaos, S.; Prowse, T. River-ice hydrology in a changing climate. Hydrol. Process. 2009, 23, 122–144. [Google Scholar] [CrossRef] [Scilit]
- Ashton, G.D. River and Lake Ice Engineering; Water Resources Publications, LLC: Lone Tree, CO, USA, 1986. [Google Scholar]
- Graf, R.; Tomczyk, A.M. The impact of cumulative negative air temperature degree days on the appearance of ice cover on a river in relation to atmospheric circulation. Atmosphere 2018, 9, 204. [Google Scholar] [CrossRef] [Scilit]
- Lindenschmidt, K.-E. River Ice Processes and Ice Flood Forecasting—A Guide for Practitioners and Students, 2nd ed.; Springer Nature: Cham, Switzerland, 2024. [Google Scholar] [CrossRef] [Scilit]
- Leppäranta, M. Freezing of Lakes and the Evolution of Their Ice Cover; Springer: Berlin/Heidelberg, Germany, 2015; pp. 203–222. [Google Scholar]
- Lynch, M.; Briggs, R.; English, J.; Khan, A.A.; Khan, H.; Puestow, T. Operational Monitoring of River Ice on the Churchill River, Labrador. In Proceedings of the 21st CRIPE Workshop on the Hydraulics of Ice-Covered Rivers, Saskatoon, SK, Canada, 29 August–1 September 2021. [Google Scholar]
- Brown, L.C.; Duguay, C.R. The response and role of ice cover in lake-climate interactions. Prog. Phys. Geogr. 2011, 35, 671–704. [Google Scholar]
- Aalstad, K.; Westermann, S.; Bertino, L. Evaluating satellite retrieved fractional snow-covered area at a high-Arctic site using terrestrial photography. Remote Sens. Environ. 2020, 239, 111618. [Google Scholar] [CrossRef] [Scilit]
- Jawak, S.D.; Kulkarni, K.; Luis, A.J. A review on extraction of lakes from remotely sensed optical satellite data with a special focus on cryospheric lakes. Adv. Remote Sens. 2015, 4, 196–213. [Google Scholar]
- Gomez, S.; Lindenschmidt, K.-E.; Lynch, M.; Nicholson, K.; Antle, R. Correlating ice-jam formation with ice-cover cracks using space-borne radar imagery for the lower Churchill River (Labrador). In Proceedings of the 27th IAHR International Symposium on Ice, Gdansk, Poland, 9–13 June 2024; Available online: https://www.iahr.org/library/infor?pid=30366 (accessed on 12 March 2026).
- Rafat, A.; Lindenschmidt, K.-E.; Strandberg, A.; Kheyrollah Pour, H. In-situ compressive strengths of floating and grounded lake ice. In Proceedings of the 23rd Workshop on the Hydraulics of Ice-Covered Rivers, St. John’s, NL, Canada, 9–12 June 2025; Available online: https://virtual.oxfordabstracts.com/event/73894/submission/73 (accessed on 12 March 2026).
- Masterson, D.M. State of the art of ice bearing capacity and ice construction. Cold Reg. Sci. Technol. 2009, 58, 99–112. [Google Scholar] [CrossRef] [Scilit]
- Masterson, D.M.; Graham, W.P.; Jones, S.J.; Childs, G.R. A comparison of uniaxial and borehole jack tests at Fort Providence ice crossing, 1995. Can. Geotech. J. 1997, 34, 471–475. [Google Scholar] [CrossRef] [Scilit]
- Johnston, M. A decade of probing the depths of thick multi-year ice to measure its borehole strength. Cold Reg. Sci. Technol. 2014, 99, 46–65. [Google Scholar] [CrossRef] [Scilit]
- Sopper, R.; Daley, C.; Colbourne, B.; Bruneau, S. The influence of water, snow and granular ice on ice failure processes, ice load magnitude and process pressure. Cold Reg. Sci. Technol. 2017, 139, 51–64. [Google Scholar] [CrossRef] [Scilit]
- McColl, S.T.; Davies, T.R.H. Large ice-contact slope movements: Glacial buttressing, deformation and erosion. Earth Surf. Process. Landf. 2013, 38, 1102–1115. [Google Scholar]
- Wazney, L. Investigation of River Ice Cover Formation Processes at Freeze-Up. Ph.D. Thesis, Department of Civil Engineering, University of Manitoba, Winnipeg, MB, Canada, 2019. Available online: http://hdl.handle.net/1993/33817 (accessed on 12 March 2026).
- Huokuna, M.; Aaltonen, J.; Veijalainen, N. Frazil ice problems in changing climate conditions. In Proceedings of the 15th Workshop on River Ice, St John’s, NL, Canada, 15–17 June 2009. [Google Scholar]

Disclaimer/Publisher’s Note: The statements, opinions and data contained in all publications are solely those of the individual author(s) and contributor(s) and not of MDPI and/or the editor(s). MDPI and/or the editor(s) disclaim responsibility for any injury to people or property resulting from any ideas, methods, instructions or products referred to in the content. |
© 2026 by the authors. Licensee MDPI, Basel, Switzerland. This article is an open access article distributed under the terms and conditions of the Creative Commons Attribution (CC BY) license.