


Abstract
Radon has long been investigated as a potential earthquake precursor, yet its interpretation remains challenged by meteorological, hydrological, and instrumental variability that can generate apparent departures unrelated to tectonic processes. This review synthesises how artificial intelligence is being applied in radon-based earthquake precursor research, with particular emphasis on anomaly detection and the evaluation of radon seismicity associations. Following a PRISMA-guided workflow, Scopus and the Web of Science Core Collection are searched and screened for eligibility, yielding 26 journal articles, most of which are concentrated in a limited number of tectonically active regions. Across the reviewed literature, a consistent pattern emerges: AI is used primarily to model the expected radon background, while candidate precursors are identified mainly through threshold-based indices derived from residuals or concentration ratios rather than through explicit earthquake-probability outputs. Although pre-seismic departures are reported repeatedly, this review shows that the evidence base remains constrained by heterogeneous operational definitions of anomaly, strong methodological variation across studies, a predominant emphasis on background goodness-of-fit instead of alarm-level performance, and limited use of time-ordered validation. These findings highlight both the promise and the current limitations of AI-enabled radon analysis. The main contribution of the field so far is not direct earthquake prediction but a more structured framework for separating potential tectonic signals from non-seismic variability. In this sense, the review provides an important methodological synthesis for future research and shows that more reproducible and operationally useful radon monitoring will depend on clearer anomaly definitions, stronger confounder control, more rigorous temporal validation, and more standardised performance reporting.
1. Introduction
Reliable earthquake forecasting remains a major challenge in the geosciences, particularly in regions where instrumental coverage is sparse and seismic hazard is shaped by complex fault systems and heterogeneous near-surface conditions [1,2,3,4]. Within this context, research on earthquake precursors has sought measurable departures in the coupled lithosphere–hydrosphere–atmosphere system that may emerge before seismic rupture. Among the proposed proxies, radon has received sustained attention because it is a naturally occurring radioactive noble gas that migrates through fractured rock and porous media and may respond to changes in permeability, stress regime, and fluid circulation. As a result, departures of radon time series from an expected background, commonly referred to as radon anomalies, have been repeatedly investigated as possible earthquake-related signals across a wide range of tectonic and environmental settings [5,6,7,8,9].
A central difficulty, however, is that radon variability is also strongly controlled by non-tectonic forcing. Meteorological conditions, hydrological variability, and site-specific transport processes can generate fluctuations that are similar in magnitude to those hypothesised for precursory behaviour [6,7,10,11,12,13,14,15,16]. This confounding structure has two major implications. First, a radon anomaly is not a self-evident object but an operational construct that depends on how the background is defined, which variable is evaluated, how thresholds are set, and whether persistence conditions are imposed. Second, claims about earthquake-related anomalies remain difficult to compare across studies unless measurement settings, preprocessing decisions, exogenous controls, and anomaly criteria are reported with sufficient precision to distinguish tectonic-related departures from environmentally driven variability [17,18,19].
Artificial intelligence (AI) and machine learning (ML) have increasingly been introduced into this problem, mainly to model the expected radon background under changing exogenous conditions and to identify candidate anomalies from observation–background departures [20,21,22,23]. These applications span heterogeneous model families, including neural networks, tree-based methods, and hybrid decomposition–learning pipelines, and they are coupled to diverse anomaly extraction rules [24,25]. However, the evidence remains methodologically fragmented. Studies differ in the monitored medium, temporal resolution, covariate structure, preprocessing strategy, anomaly definition, and the temporal and spatial rules used to relate detected anomalies to earthquakes. In addition, evaluation is often centred on reconstruction accuracy rather than on alarm-oriented performance and chronology-aware validation designs, which limits direct comparison of operational claims across sites and study designs [19,26,27,28,29].
Against this background, the present systematic review provides a PRISMA-guided synthesis of peer-reviewed studies that apply AI-based methods to the detection, modelling, or evaluation of radon anomalies in an explicit earthquake context. Rather than asking whether radon is universally predictive of earthquakes, the review focuses on how the literature constructs and validates the concept of radon anomaly under AI-enabled analytical frameworks. Specifically, the review addresses five questions: (1) what types of radon data and monitoring configurations are used in AI-based precursor studies; (2) how radon anomalies are operationally defined; (3) what roles AI methods play within the analytical pipeline, including preprocessing and treatment of exogenous drivers; (4) how anomaly–earthquake relationships are operationalised through temporal and spatial coupling rules; and (5) how models are validated and how performance is reported. By organising the evidence around these five questions, the review aims to clarify the methodological conditions under which AI-based radon studies support, weaken, or complicate precursor claims, and to identify the reporting and design features that most strongly affect comparability, reproducibility, and potential operational relevance.
The remainder of this paper is organised as follows. Section 2 describes the PRISMA-based review design, including information sources, eligibility criteria, screening, extraction, and synthesis procedures. Section 3 presents the evidence according to the five guiding questions of the review: study and monitoring characteristics, operational definitions of radon anomaly, AI roles and exogenous-control strategies, anomaly–earthquake coupling frameworks, and validation and performance reporting. Section 4 examines the methodological implications of these patterns and outlines priorities for improving comparability, reproducibility, and inference quality in future research on radon-based earthquake precursors.
2. Methodology
This review follows the PRISMA 2020 framework for transparent reporting of evidence syntheses [30]. Figure 1 documents the study selection workflow. Our objective was to identify, select, and synthesise peer-reviewed journal articles that applied artificial intelligence methods to detect, model, or evaluate radon anomalies as potential earthquake precursors, and to summarise the methodological choices and reported performance.
Figure 1.
PRISMA 2020 flow diagram for study selection.
2.1. Information Sources and Search Strategy
We conducted a comprehensive search on 10 March 2026, in two bibliographic databases: Scopus and Web of Science Core Collection. We limited the searches to the Scopus fields “Article title, Abstract, Keywords” and to the Web of Science “Topic” field.
The Boolean query comprised four concept groups combined with the AND operator. Within each group, we combined synonyms with OR. Quoted phrases indicate exact matches, and asterisks indicate truncation:
- Group 1 (radon signal): (“radon anomaly” OR “radon anomalies” OR “radon concentration” OR “radon gas” OR “radon emission” OR “radon exhalation” OR “soil gas radon” OR “Rn-222” OR “soil radon” OR “radon monitoring” OR “radon data”)
- Group 2 (earthquakes): (earthquake* OR “seismic activity” OR “seismic event*” OR “seismic precursor*” OR “precursory signal”)
- Group 3 (analysis / prediction): (“correlation” OR “correlations” OR “predictive value” OR “prediction” OR “forecasting” OR “forecast” OR “statistical analysis” OR “data analysis” OR “precursory anomaly” OR “pre-seismic anomalous”)
- Group 4 (artificial intelligence): (“artificial intelligence” OR “machine learning” OR “deep learning” OR “neural network” OR LSTM OR “support vector*” OR “random forest*” OR “decision tree*” OR “ensemble learning” OR “eXtreme Gradient Boosting” OR XGBoost OR “supervised method”)
We did not apply filters for publication year or language at the search stage. The full search equation was Group 1 AND Group 2 AND Group 3 AND Group 4.
2.2. Record Management and De-Duplication
We exported all records retrieved from Scopus () and Web of Science () and combined them in RStudio version 2026.1.1.403 using the Bibliometrix package, with additional verification in Microsoft Excel. Automated and manual checks identified and removed 35 duplicates, which yielded a combined set of 51 unique records for screening, as shown in Figure 1.
2.2.1. Inclusion and Exclusion Criteria
We defined the eligibility criteria to retain studies that directly addressed artificial intelligence methods for radon anomaly analysis in an explicit earthquake context. We included studies only when they satisfied all core inclusion criteria and did not meet any exclusion criteria.
We included studies that met the following criteria:
- The study had to be an original research article. We prioritised papers that reported their own data, modelling, analysis, and results. We excluded papers that were only conceptual, perspective-based, commentaries, reviews, or articles focused only on networks or instrumentation.
- The study had to use artificial intelligence, machine learning, deep learning, or computational intelligence as a central component of the method. A generic decision structure or evaluation logic was not sufficient. The method had to explicitly implement algorithms such as artificial neural networks, long short-term memory networks, support vector machines, random forest, extreme gradient boosting, decision trees, or ensemble approaches.
- Radon had to be a central variable in the study design. We included studies in which radon in soil, groundwater, air, or radon time series was the main signal under analysis. We did not retain studies in which radon appeared only marginally within a broader multivariable framework.
- The main objective had to be oriented toward radon anomalies. This was the most important criterion. We included studies that aimed to detect radon anomalies, identify or classify them, model the expected radon background in order to isolate anomalies, compare methods for recognizing radon anomalies, or interpret radon anomalies as possible seismic precursors.
- The study had to establish an explicit link with earthquakes. It was not sufficient to model radon only against meteorological variables. To be eligible, the study had to connect radon variations or anomalies explicitly with seismic events, seismic activity, pre-seismic periods, or the possible use of radon as an earthquake precursor.
- The study had to provide at least one method-related or performance-related contribution. We gave priority to articles that reported fitting or error metrics, comparisons between algorithms, anomaly detection criteria, identification rates, or concrete performance results.
- We accepted multimodal studies only when the radon component remained analytically central.
- We also accepted, with caution, studies whose main objective was to model the radon background when that model was later used to isolate anomalies interpreted as seismically relevant.
We excluded a study when one or more of the following conditions applied:
- The main focus was not radon anomaly analysis but another seismic task. We excluded studies in which radon was used only as an input to predict a different target, such as epicentre, magnitude, or any other seismic output not formulated as radon anomaly analysis [31,32,33,34,35,36,37,38,39].
- The study addressed seismic precursors in general but not radon anomalies as the central methodological object [31,32,33,34,35,36,38,40,41,42].
- The main objective was another radon-related physical process rather than precursor anomaly detection. We excluded studies centred on soil or atmospheric ionisation, lithosphere–atmosphere–ionosphere coupling as the primary target, or estimation of variables derived from radon instead of radon anomaly detection itself [20,36,37,39,41].
- The article was mainly about instrumentation, network design, or observational systems. When the main contribution was the design of stations, sensors, telemetry, or an observational network, and the study did not centrally develop and evaluate an artificial intelligence method for radon anomaly detection, we excluded it from the main corpus [37,42,43,44,45].
- The study focused on imputation, reconstruction, or preprocessing of radon time series without reaching the central review problem. Articles on imputation could use machine learning and radon series, but they did not address methods for detecting radon anomalies as earthquake precursors [43,44,45].
- The study focused on volcanism or caldera unrest rather than tectonic earthquakes. Although some of these studies were methodologically relevant, we did not consider them part of the core review unless the seismic component was strong and explicit [20].
- The article was not an original empirical study. We excluded perspectives, strategic proposals, conceptual commentaries, and similar publications [46].
Operationally, we included a study that used artificial intelligence on radon data to detect, model, classify, or interpret radon anomalies in an explicit relationship with earthquakes. We excluded a study when it used radon and artificial intelligence, but the target of prediction or interpretation was a different variable, such as epicentre, magnitude, ionisation, or a broader multivariable forecasting framework.
This rule guided several decisions at the eligibility boundary. We retained studies in which the model learned the expected behaviour of radon, and the deviations from that expected behaviour were later interpreted as seismically relevant anomalies. We also retained multimodal studies when radon remained an explicit anomaly signal rather than a secondary predictor. In contrast, we excluded studies in which radon functioned only as one feature for another predictive task, as well as studies primarily devoted to general seismic forecasting rather than the specific problem of radon anomaly detection.
2.3. Screening and Selection Process
We performed two screening stages: (i) title and abstract screening and (ii) full-text eligibility assessment. All reviewers were members of the author team. Two reviewers conducted title and abstract screening and full-text assessment independently using prespecified eligibility criteria. They resolved disagreements at any stage through discussion and consensus. When consensus was not reached, a third reviewer adjudicated. We maintained a decision log to ensure traceability of inclusion and exclusion decisions and to standardise the application of the criteria.
First, we screened 51 records. At that stage, we excluded non-eligible document types, including conference papers (), reviews (), and a book chapter (). Second, we sought full texts for 44 records, but we could not retrieve 1 report. Therefore, we assessed 43 reports for eligibility. We then excluded 17 reports because they did not meet the review objective according to the criteria described in Section 2.2.1. The final corpus comprised 26 articles that met all inclusion criteria, as shown in Figure 1.
2.4. Data Extraction
We carried out structured extraction for each included study in RStudio and Excel using a standardised extraction form and coding guide. Two reviewers performed data extraction independently. They resolved discrepancies in extracted fields or coding decisions by consensus and, when needed, a third reviewer adjudicated, following the same decision-tracking approach used during screening.
The extraction template captured bibliographic metadata; study site and monitoring-site location; radon sensing modality and sampling scheme; environmental covariates and their treatment; artificial intelligence approach and model specification; target task, for example, background modelling, anomaly detection, or forecasting; operational definition of radon anomaly and labelling windows relative to seismic events; validation design; and performance metrics as reported by the original authors. When studies reported multiple models or settings, we extracted and retained all relevant configurations.
2.5. Synthesis of Methods and Performance
We did not plan a quantitative meta-analysis because the included studies showed methodological heterogeneity across instruments, sampling intervals, environmental corrections, modelling choices, anomaly criteria, and validation windows. Instead, we synthesised methods and performance narratively. We grouped the studies by modelling family and by role in the analytical pipeline, and we summarised the reported metrics as provided in the primary articles. We discussed cross-study comparability qualitatively, with emphasis on differences in instrumentation, environmental normalisation, and seismic context. We used the PRISMA flow shown in Figure 1 to anchor the counts at each stage of the process.
3. Results
3.1. Study, Monitoring, and Radon Measurement Characteristics
The final corpus comprised 26 journal articles that met all inclusion criteria, as shown in Table 1. Publication output remained sparse from 2002 to 2018 and then increased from 2020 onward, reaching its highest level in 2020 and 2024, as illustrated in Figure 2a.
Table 1.
Overview of included studies and monitoring-site locations.
Figure 2.
Production over time and geographical distribution of radon datasets.
Monitoring sites were distributed unevenly across the corpus. Table 1 and Figure 2b show a concentration in South Asia and parts of Europe, particularly along the Himalayan arc, the North Anatolian Fault, and several geothermal or karst settings. Within the included corpus, no monitoring sites were identified in the Americas or Africa. The included studies covered fault-related soil-gas stations, caves, springs, wells, university radioisotope facilities, and networked platforms, which in turn determined the temporal structure and measurement characteristics of the radon series available for modelling and anomaly analysis.
3.1.1. Radon-Bearing Medium
Table 2 shows that the corpus spans several radon-bearing media and site types. Soil-gas monitoring is the dominant configuration, either through continuous stations near active faults and observatories or through weekly integral SSNTD deployments. Smaller subsets use near-surface accumulation systems, groundwater and thermal-spring radon, atmospheric radon or ionisation-current proxy data in university radioisotope facilities, and cave-air or hybrid cave–soil configurations.
Table 2.
Radon measurement configurations, instrumentation, installation, and temporal resolution. Studies may appear in more than one row when multiple measurement configurations are analysed within the same work.
3.1.2. Instruments and Calibration Practices
Instrumentation falls into three broad groups: continuous active monitors for soil gas, cave air, accumulation systems, and some water deployments; SSNTD systems operated in weekly integral mode; and application-specific systems for water and atmospheric radon. Calibration reporting is uneven. Explicit detector development or calibration is reported for SMARTRnDuo and the BhaROSA system [64,70], while SSNTD-based studies rely on established calibration curves or protocols [53,65]. Several active-monitor studies also provide detailed detector specifications or measurement principles, including RTM-2200, RADIM3A and RaMonA, and AlphaGUARD [57,58,71].
3.1.3. Sampling Depth and Installation Geometry
For soil-gas observations, sampling depths are often within the upper metre, although the corpus also includes installations at about 5 m and a 10 m borehole observatory. Near-surface accumulation systems operate immediately below the surface and include diffusion-control structures or sheltered housings. Installation reporting is likewise heterogeneous. Some studies describe casing, sealing, shelters, pumps, tubing arrangements, or borehole construction in sufficient detail to contextualise the measurements, whereas others provide only partial information.
3.1.4. Sampling Frequency and Temporal Resolution
Temporal resolution ranges from continuous monitoring at 10–60 min intervals to weekly integral SSNTD measurements and long daily records in groundwater settings. High-frequency observations are often aggregated to daily values before modelling or anomaly analysis. Weekly SSNTD series represent a distinct design based on seven-day integrations, whereas groundwater records include decade-scale and multi-decadal daily observations. Overall, acquisition schemes vary with the monitored medium, instrument technology, and study design.
3.2. Operational Definitions of Radon Anomaly
We use a common notation to compare operational anomaly rules across studies. This notation is only a synthesis device, because the original papers use different symbols and do not define all indices in the same way. In particular, some studies introduce source-specific labels such as , , or related observed–predicted discrepancy terms; unless the original notation is needed for interpretive precision, we discuss these quantities under the unified residual notation . We denote the measured radon concentration at time t by and the model-based background by . When studies compare observations with a modelled background, we write the residual and two relative mismatch indices as
For count-based monitoring, denotes the detected counts in the sampling bin . We use for the total series length, T for seismic-window half-widths when such windows are defined, and for the minimum duration required by the anomaly rule. When studies merge individual exceedances into swarms or events, we retain the reported event labels and summaries, including CA, FA, and NA when these are defined explicitly.
The anomaly families below are organised by the decision variable and the corresponding decision rule. Specific modelling pipelines are then treated as study-specific implementations of these broader families.
3.2.1. Thresholding on a Univariate Series
A first family defines anomalies as excursions of a radon series beyond a reference band scaled by dispersion:
Here, and denote the mean and standard deviation estimated over the reference period used by the study, and k is the threshold multiplier, that is, the number of standard deviations required for anomaly declaration. In the layered neural network and Adaline studies, anomaly phenomena other than earthquakes are assumed to increase or decrease radon beyond a mean-based reference band equivalent to for longer than one day [47,48]. A related ANN study defines a radon anomaly as a value that exceeds the average by [53]. In an automated anomaly-detection study, anomalous periods are likewise identified when radon deviates by more than [56]. A three-year comparison of raw, corrected, and neural-predicted radon also uses deviations from the mean and standard deviation, with the reference period defined in annual, seasonal, or FFT-based terms [52]. By contrast, one ANN study identifies positive and negative anomaly peaks on the predicted radon series at above and below the mean line [64]. Figure 3 provides a schematic representation of this univariate threshold-based anomaly family.
Figure 3.
Conceptual illustration of univariate threshold-based anomaly detection. A radon anomaly is declared when the observed series exceeds the reference band for at least a minimum duration .
For count-based monitoring, the same logic is implemented in Poisson form. If denotes the baseline count used by the monitoring framework, the operational rule can be written as
This formulation matches the INDRA-SA framework, where radon counting statistics are treated as Poisson-distributed, measurements outside the baseline range are considered statistically significant departures, and only anomalies with signal duration greater than 12 h are retained [70].
3.2.2. Residual Threshold (Observed–Predicted)
Residual-based criteria define anomalies as departures from a model-implied background rather than from an unconditional mean. In the notation of Equation (1), the generic rule is
where and are the residual mean and dispersion estimated in the way reported by each study, and k again denotes the threshold multiplier in units of standard deviation. An ARIMA-based residual analysis applies a stringent threshold of to residual radon [65]. In a joint Radon–TEC study, the anomaly criterion is applied to the residuals of the best-performing model, and values with residuals exceeding are treated as anomaly points [63]. In atmospheric radon applications using random forest, anomalies are identified from the observed–predicted discrepancy, which in the present synthesis is treated as the residual series , and periods at or higher that last at least one day are treated as anomalies [66]. Figure 4 visually summarises this residual-based anomaly family.
Figure 4.
Conceptual illustration of residual-based anomaly detection. A radon anomaly is declared when the residual series exceeds the reference band for at least a minimum duration .
3.2.3. Model-Based Relative Index with Band or Fixed Threshold
Another family uses dimensionless indices derived from the comparison between observed and predicted radon.
- Fixed absolute threshold on a relative mismatch.A point is anomalous whenfor a prescribed threshold . In the thermal-spring hydrogeological study, the model-based relative index is written as , and the main threshold is set at , with sensitivity checks at and [50]. A decision-tree study identifies precursor anomalies when the relative difference between observed and modelled radon exceeds [54]. A hybrid multiANN study uses a source-specific relative change, denoted in the original article aswhich corresponds to the unified relative-mismatch index introduced in Equation (1). In that study, values above are regarded as possible anomalies [67].
- Statistical band on a relative index.The decision can also be expressed as a band on a relative index:In one study, is defined explicitly as , and statistically significant anomalies are selected when lies outside the reference band [58]. A recent study uses the related index and defines anomalies when Q exceeds , with the mean and standard deviation computed over a one-week window with overlap [72]. Another ANN study also works with the ratio , but its decision rule is not only pointwise. An anomaly occurs when the ratio exceeds a predefined threshold T, nearby anomalies are merged into the same swarm when separated by less than , and swarm duration together with anomaly integral I are used jointly with CA, FA, and NA labelling [51]. Figure 5 illustrates the two main variants of this family: fixed-threshold and band-based decisions on a relative index.
Figure 5.
Conceptual illustration of relative-index-based anomaly detection. A radon anomaly is declared when the relative index exceeds the fixed threshold or departs from the statistical band for at least a minimum duration .
3.2.4. Uncertainty-Band Rules
A complementary family compares the observation with a model-implied background and an associated uncertainty band:
In one hybrid framework, values in the raw signal are treated as positive or negative anomalies when they are not within the confidence interval of the predicted signal [55]. The reported band is constructed as
where is the standard deviation of the predicted data, and n is the signal length [55]. A related hybrid method treats a value in the original radon series as an outlier when it is outside the confidence interval around the predicted signal, and the resulting anomalies are then normalised [57]. This logic is illustrated in Figure 6, where anomalies are defined by departures of beyond the uncertainty interval around .
Figure 6.
Conceptual illustration of uncertainty-band-based anomaly detection. A radon anomaly is declared when the observed series falls outside the uncertainty band around the predicted background.
3.2.5. Physico-Environmental Gradient Rules
Gradient-based rules detect anomalies from the joint behaviour of the temporal gradients of radon concentration and a hydrological proxy. Using finite differences,
define
Here, denotes the water level above the monitoring probe. An anomaly is declared when the gradients are co-oriented and exceed fixed magnitude thresholds:
A canonical implementation uses and , with additional sensitivity checks at 5 and for the hydrological threshold [50]. In that study, anomalies are later summarised as CA, FA, or NA and can be grouped into swarms [50]. Figure 7 illustrates the gradient-based anomaly family, in which anomaly decisions depend on the joint sign and magnitude of the radon and hydrological gradients.
Figure 7.
Conceptual illustration of gradient-based anomaly detection. A radon anomaly is declared when the radon and hydrological gradients are co-oriented and both exceed their respective thresholds, that is, when , , and . The gray shaded regions indicate time intervals in which these joint sign-and-threshold conditions are satisfied and are therefore flagged as anomaly windows.
3.2.6. Performance Heuristics and Classifier-Aggregation Rules
Some studies shift from fixed amplitude bands to performance-oriented heuristics. Two strategies recur: degradation in predictive agreement across predefined windows and aggregation of sample-wise classifier outputs at the day level.
- Windowed performance degradation.Predictive agreement over a window W is summarised bywhere is the mean of within W. In the EMD–LSTM study, radon anomalies are identified by comparing the values during non-seismic and seismic periods. The seismic windows are examined with half-widths of , , , and days, and anomalies are identified when the difference between the corresponding values is greater than [61].
- Daily aggregation of sample-wise seismic indications.In this family, sample-level outputs are , where indicates a sample classified as seismic and a sample classified as non-seismic. Grouping samples by day d into blocks of 36 readings, the daily seismic proportion isA day is labelled anomalous whenwith the indication factor set to [59]. This rule aggregates scattered sample-wise outputs into a day-level seismic indication [59].
3.2.7. Subsequence Discord Scores
A distinct family identifies anomalies as subsequences with unusually large distance from their nearest neighbours in the same series. If denotes the matrix-profile score assigned to the subsequence that starts at index t, anomaly candidates are selected by
This operational form matches the STUMPY-based detector used in [63], where sequences with the highest distances are treated as anomalous patterns and the first seven such sequences are selected for analysis [63].
3.2.8. Studies Without an a Priori Operational Definition of Radon Anomaly
In addition to studies that pre-specify explicit anomaly rules, we identified a subset that uses the term anomaly without fixing an a priori decision criterion. For synthesis and comparability, these studies fall into recurring methodological patterns.
Some contributions learn a background model during non-seismic periods and then interpret departures around earthquakes as anomalous post hoc, without fixing a quantitative exceedance rule in advance. This includes model trees trained on environmental parameters, where reduced predictability during seismically active intervals is interpreted as anomalous behaviour [49]. It also includes ANN-based baselines that compare predicted non-seismic radon behaviour with observed concentrations around recorded earthquakes and interpret significant deviations as anomalies, without defining a single threshold rule in advance [68]. Related ensemble and delegated-regression approaches report prediction errors across seismic windows and evaluate how well modelled and observed radon agree, but they do not define a single operational anomaly criterion tied to a radon-derived index [60].
Other studies do not define a radon anomaly rule at all and instead formulate the task directly as supervised classification of seismic versus non-seismic windows. In this line, windows are labelled from earthquake timing and model performance is evaluated through AUC, accuracy, and related classification metrics rather than through an a priori threshold on radon-derived quantities [69].
3.3. Role of AI, Preprocessing, and Control of Exogenous Drivers
Across studies that implement an explicit anomaly workflow, AI is used primarily to estimate an expected radon background rather than to predict earthquakes directly. Candidate precursors are then inferred from residuals, relative discrepancies, confidence-band exceedances, or related rule-based criteria, as summarised in Table 3. This background-oriented logic does not cover the full corpus. Some studies identify anomalous periods through predictive-skill degradation, whereas others classify windows or segments directly without defining a residual-based anomaly variable. Representative implementations include meteorology-corrected baselines followed by thresholding [64], mismatch-index thresholding with Q under a band [58], ratio-based anomaly indices such as [72], and adaptive linear learners in which the residual is treated as the anomalous component [48].
Table 3.
Workflow-level synthesis of AI roles across the studies, integrating the main background-construction and environmental-noise separation strategies. Role codes: B = baseline/background modelling; C = supervised classification. Preprocessing, decomposition, thresholding, and plausibility filters are reported within the relevant workflow families rather than as separate top-level categories.
Some studies compare several candidate baselines and derive anomalies from the selected residual workflow [63,65]. Others use tree-based, boosted, or ANN-based baselines in hydrogeological settings and define anomalies through observed–predicted discrepancies, ratio thresholds, gradient-consistency rules, or contrasts between non-seismic and precursory periods [50,54,62]. Hybrid pipelines combine decomposition and learning to reconstruct a baseline and confidence band, with anomalies defined as out-of-band departures [55,57]. Another group identifies anomalous periods through deterioration of predictive skill during seismic windows [49,61]. A two-stage design further removes candidates explainable by meteorological forcing [70], whereas direct classification and segment aggregation define a distinct AI role that does not rely on background–residual separation [59,69].
Preprocessing and exogenous control link the measurement settings described above with the anomaly criteria summarised in Section 3.2. Across the corpus, the monitored covariates vary with the observed medium and with the strategy used to separate environmentally driven variability from candidate precursory behaviour. Soil-gas and accumulation-chamber studies mainly record air temperature, pressure, relative humidity, precipitation, and sometimes wind speed or soil temperature [49,52,56,58,60,64,67,68,70,71]. Weekly integrated soil-gas studies use seven-day averages of temperature, pressure, humidity, rainfall, and, where reported, lagged rainfall terms [47,48,53,65]. Some high-frequency soil-gas studies further include thoron and soil-related variables, such as soil temperature at multiple depths, soil–air pressure, and soil–air temperature contrasts [51,59,60]. In hydrological systems, the covariate structure broadens to water temperature, hydrostatic head or water level, discharge or flow, precipitation, and barometric pressure [50,54,61,62]. Cave and karst studies rely on interior and exterior air temperature, cave-air pressure, and relative humidity, with one study also incorporating wind, rainfall, and piezometric level [55,57]. A smaller subset incorporates TEC, Kp, Dst, and solar radio flux at 10.7 cm to screen space-weather effects in joint radon–TEC workflows [63]. Other studies rely on minimal exogenous information, such as date or direct radon windows without a multivariate environmental model [66,69]. One soil-radon observatory setting also combines atmospheric and shallow hydrogeological covariates, including air temperature, atmospheric pressure, water-level fluctuations, rainfall, and sub-surface soil temperature [72].
3.3.1. Environmental and Auxiliary Covariates
The auxiliary variables monitored alongside radon are therefore not uniform across the corpus. In soil-gas settings, they are used mainly to represent atmospheric forcing and near-surface transport conditions, whereas in springs, wells, and boreholes they are tailored to hydrological control [50,54,61,62]. Cave and karst studies emphasise variables linked to ventilation regimes and cave-air dynamics [55,57], and joint radon–TEC workflows incorporate geomagnetic and solar indicators to screen non-seismic ionospheric variability [63]. By contrast, some studies use only minimal or implicit exogenous information [66,69].
3.3.2. Background Modelling and Separation of Environmental Noise
In studies with explicit background–signal separation, exogenous covariates enter the workflow mainly through estimation of the expected radon level . As summarised in Table 3, this background construction follows a limited number of recurring patterns. One relies on statistical or machine-learning models driven by exogenous predictors, including multivariate regression, model trees, Adaline-type models, multilayer perceptrons, radial basis function networks, feedforward ANNs, CNN-based models, LSTM networks, and boosted or delegated regressors [47,48,49,50,51,52,53,54,55,56,58,61,64,65,67,68,70,71,72]. Another layer uses signal-processing and decomposition tools, such as wavelet denoising, empirical mode decomposition, Hilbert–Huang transforms, and fast Fourier transform, to stabilise the baseline before model fitting [52,55,57,61,65,68,70]. Once is defined, studies apply the anomaly rules synthesised in Section 3.2 and, in some cases, post-detection filters to remove environmentally driven or physically implausible candidates. Representative examples include magnitude–distance consistency rules based on Dobrovolsky-type relations [50,54,63,67,70] and geomagnetically quiet-condition filters in joint radon–TEC analyses [63].
3.4. Anomaly–Earthquake Coupling Frameworks and Reported Precursor Characteristics
Across the corpus, the radon anomaly–earthquake relationship is operationalised by combining event selection, temporal linkage, and an anomaly rule that maps departures in or in model-derived quantities to earthquake occurrence, as synthesised in Table 4. Many studies use magnitude-dependent spatial filters, but the adopted relations are not uniform. Several apply Dobrovolsky-type preparation zones or explicit distance ratios such as [49,50,51,52,53,55,58,65,67]. Others combine Dobrovolsky-type selection with additional criteria, including Fleischer-type constraints [64], piecewise magnitude–distance or deformation-based relations [54,68,71], or strain and seismic-energy-density filters [61,70]. A second group uses local earthquake occurrence during the monitoring interval or seismic versus non-seismic segmentation without a formal preparation-radius filter [47,56,59,60,69].
Table 4.
Operational coupling coding scheme by study.
The retained seismicity also varies with the adopted selection rule. Some studies focus on local low-to-moderate earthquakes in dense regional settings [49,50,51,72]. Others examine moderate regional earthquakes selected through magnitude–distance filters [52,64,65,71]. Case-study designs without a formal spatial filter extend to large mainshocks analysed through site-specific radon behaviour [66].
Temporal coupling is also implemented in several distinct ways. Some studies define seismically active windows around each selected earthquake, such as days [49,50,58], parameterised windows with tested from 0 to 10 days and extended sensitivity analyses [51], or grouped seismic periods of days [61]. Others apply fixed precursor-validity rules, such as within 10 days before the earthquake [52], within 100 h [70], or within 72 h before the event while excluding the following 72 h from evaluation [71]. Another set reports observed lead times after anomaly detection rather than imposing a single symmetric seismic window, including peak-to-event delays in the ANN correlation study [64], lag clustering up to days in the cave-air study [55], and event-centred radon–TEC comparisons spanning hours to a few days before shocks [63]. Classification-oriented studies instead define seismic and non-seismic segments through window size, weekly grouping, or day-level aggregation [47,56,59,60,69].
As shown in Section 3.2, the anomaly criteria used in these coupling frameworks are predominantly threshold- or discrepancy-based. Simple criteria declare anomalies when radon exceeds a reference band on the raw or corrected series [47,48,52,53,56,64]. More conservative approaches apply stringent residual thresholds, as in the ARIMA residual peaks beyond [65] or the observed–predicted difference in the atmospheric-radon case study [66]. Several studies estimate through regression, tree-based, or machine-learning models and then analyse residual quantities, ratio indices, or swarm descriptors [50,51,54,58,67,72]. Uncertainty-envelope formulations define anomalous values as observations outside or confidence bands around [55,57]. Other contributions define anomalous conditions through the loss of predictive skill during seismic windows rather than through pointwise residual exceedance [49,61]. A separate subset uses supervised labels instead of an explicit anomaly construct [59,69].
This variation in spatial and temporal rules carries over to the evaluation of anomaly–earthquake relationships. Several studies use explicit categories in which anomalies inside prescribed space–time windows are labelled as correct alarms, anomalies without a corresponding event as false alarms, and earthquakes without associated anomalies as no alarm [50,51,58,72]. Others quantify association through fixed lead-time validity rules [52,70,71] or through lag and lead analyses over broader windows [55,57,63]. In another subset, seismicity enters mainly as a binary context, seismic versus non-seismic segments, and the objective is class discrimination rather than event-wise precursor attribution [47,59,69].
Reported Precursor Characteristics
Reported precursor characteristics are heterogeneous and depend strongly on the operational anomaly definition. A first recurrent pattern emphasises the magnitude of discrepancy indices or swarm-level behaviour rather than signed excursions, particularly in studies based on Q-type thresholds, relative-change rules, or grouped anomaly episodes [51,58,67,72]. A second pattern reports positive and negative peaks explicitly and relates their sign to local hydrogeological or tectonic conditions [53,64,66,72]. A third pattern does not characterise precursors through signed radon excursions at all but through degradation of predictive skill during seismically active periods [49,61].
Across the corpus, reported lead times range from hours to months, and durations range from isolated spikes to prolonged swarms or extended hydrological episodes [54,55,63,70,71]. Short-lived residual peaks and transient weekly anomalies coexist with sustained seasonal departures, broader lag structures, and duration-constrained pre-event windows [53,55,65,66,70,71].
Most studies summarise results through CA/FA/NA counts, detected versus missed events, or qualitative episode narratives rather than through harmonised event-wise distributions of sign, onset, and duration [50,51,52,58,70,71,72]. Several studies also stress station dependence and local geological or hydrological control, indicating that precursor sign, amplitude, persistence, and timing are not homogeneous across sites or event classes [61,66,68,70,72].
3.5. Validation Designs and Reported Performance
Performance reporting is dominated by signal-reconstruction metrics, as shown in Table 5. Most studies quantify how closely a baseline reproduces observed radon dynamics through correlation coefficients and error measures such as RMSE, MSE, RMSLE, MAPE, PB, and, in a smaller subset, [50,51,54,56,60,61,66,67,68,72]. Full alarm-level evaluation through precision, recall, F1, ROC curves, confusion matrices, or event-wise lead-time distributions is uncommon. Instead, operational effectiveness is usually reported through detection-style summaries such as CA/FA/NA, TA/FA/NA, detected versus missed events, or fractions of earthquakes preceded by anomalies [50,51,52,58,70,71,72]. In some studies, degradation of correlation or fit during seismically active testing is itself interpreted as evidence of an additional endogenic contribution [49,61].
Table 5.
Metrics and validation synthesis across the reviewed evidence.
Validation practices are likewise heterogeneous and often do not impose time-aware blocking. Random splits, repeated k-fold cross-validation, stratified sampling, and standard train–validation–test partitions are common in both baseline modelling and classification [49,51,59,60,67,69,72]. Some studies rely instead on event-centred or context-ordered evaluation, and one study explicitly trains and validates on non-seismic periods before predicting on seismic periods [61]. In several others, split protocols are only partially specified or are embedded in anomaly-matching rules rather than in a formal validation design [47,48,55,57]. Leakage control under sliding or overlapping windows is generally not described, including in classification-oriented pipelines [59,69].
3.6. Limitations Reported in the Primary Studies
The primary studies repeatedly report limitations that constrain inference strength, reproducibility, and cross-study comparability. Across the 26 included studies, reporting depth is heterogeneous. Some papers discuss these issues in detail, whereas others mention them only briefly, which makes systematic reproducibility assessment difficult [66,70,72].
- Restricted spatial and temporal scope, and limited external validity. Single-station or few-station deployments remain common, which restricts generalisation across tectonic, hydrogeological, and climatic settings. Several studies state explicitly that broader spatial coverage, larger monitoring networks, or validation in additional regions is needed [66,70,72]. Limited monitoring duration also constrains the ability to characterise interannual variability and rare-event dynamics, and longer time series are repeatedly requested [50,66,70,72]. In cave-based analyses, the high proportion of earthquakes below the selected magnitude threshold further limits correlation claims [55].
- Environmental confounding and incomplete control of exogenous drivers. Many studies emphasise that radon variability is strongly affected by non-tectonic drivers such as pressure, temperature, rainfall, humidity, and hydrological changes, which complicates causal attribution [50,63,64,70]. This problem becomes more severe when relevant covariates are missing or only partially observed. In particular, incomplete rainfall and soil-moisture information are identified as important limitations for separating meteorological forcing from possible precursor signals [70]. Several studies also note that residual environmental influence may remain even after background correction or model-based filtering [50,63,64].
- Operational degrees of freedom in thresholds, coupling windows, and event selection. Reported results depend strongly on the adopted anomaly threshold, the temporal coupling rule, and the earthquake-selection framework. Studies that optimise or compare multiple parameter settings show that correct alarms, false alarms, and missed events can change substantially when these choices are modified [50,51,52]. Sensitivity to the adopted precursor-validity window or to the event-selection relation therefore limits direct comparison across studies and reduces transferability of apparently successful settings [50,51,52,55].
- Data completeness and measurement constraints. Several studies report limitations linked to data quality, continuity, and measurement design. These include incomplete meteorological records, restricted input spaces, and the need for stronger quality control in long radon series [70,72]. Measurement sensitivity is also identified as a limitation. In particular, low sensitivity of some soil-radon configurations and the restricted representativeness of individual stations motivate denser or redesigned monitoring systems [70,72]. These constraints affect both anomaly detection and the interpretation of apparently precursor-like behaviour.
- Modelling and evaluation constraints. Some studies report limitations associated with model structure, optimisation, and evaluation. Class imbalance, mixed effects of data augmentation, and the risk of overfitting are discussed explicitly in classification-oriented work [69]. ANN-based designs also report limited interpretability, restricted extrapolation beyond the observed input space, and sensitivity to model architecture [68,72]. In one hybrid framework, computational demand and implementation complexity are noted as practical limitations for reproducibility and scalability [67]. These issues reduce confidence in direct transfer of the reported performance to other settings.
- Incomplete mechanistic interpretability and non-universal coupling. Several studies stress that anomalous radon behaviour does not imply a unique physical mechanism and does not support a universal precursor formulation. The sign of the anomaly, its timing, and its persistence can differ across sites and events, and opposite responses may occur under different tectonic or hydrogeological conditions [50,68]. Some studies state explicitly that radon should not be treated as a standalone or universal precursor and that local geological context remains decisive [70,72]. In multimodal radon–TEC analyses, coupling is also described as conditional rather than deterministic, with residual non-seismic contamination still possible after filtering [63].
4. Discussion
Before turning to the methodological heterogeneity of the reviewed studies, it is important to situate radon anomalies within the physical processes that give them interpretive meaning. Outside the AI literature, anomalous radon behaviour has long been discussed in relation to stress- and strain-induced changes in fracture permeability, carrier-fluid circulation, hydrogeological mixing, and fault- or hydrothermal-degassing pathways, all of which can modify radon emanation, transport, and accumulation in different ways depending on the monitored medium and the local geological setting [15,74,75,76]. This physical framing also helps explain why candidate precursory responses are not sign-invariant across studies: increases, decreases, or mixed behaviours may all be observed, particularly where shallow meteorological forcing interacts with deeper tectonic or volcanic controls [20,76,77]. From this perspective, AI does not by itself establish precursor status. Rather, its main contribution is to provide a more systematic way to estimate the expected background and to isolate candidate departures that must still be interpreted against site-specific geophysical and hydrogeochemical processes [15,20]. This perspective is important for interpreting the methodological patterns synthesised below.
The reviewed evidence shows that AI-based research on radon anomalies in an earthquake context remains a relatively recent and methodologically fragmented field. Publication output increased after 2020, but the included corpus is geographically concentrated, with strong representation from South Asia and selected European settings and no included monitoring sites in the Americas or Africa. This absence should be interpreted within the specific scope of the present review rather than as an absence of radon–earthquake research in the Americas more broadly. Earlier studies from southern California, Ecuador, and Mexico reported radon monitoring in relation to seismic activity or possible precursor behaviour, but these studies fall outside the included corpus because they did not apply AI-based methods to the detection, modelling, or evaluation of radon anomalies in an explicit earthquake-analysis framework [78,79,80,81]. This distribution matters because the current evidence base is dominated by a limited set of tectonic, hydrogeological, and environmental contexts. In consequence, the literature provides a growing but still regionally uneven basis for assessing AI-supported radon-anomaly frameworks as possible earthquake-related tools.
A first implication concerns the measurement layer on which all later analytical steps depend. The corpus spans heterogeneous radon-bearing media, including soil gas, groundwater and thermal springs, cave air, near-surface accumulation systems, and atmospheric radon or ionisation-current proxy data. These configurations differ in sampling depth, temporal resolution, installation geometry, and instrument type, ranging from continuous active monitors to weekly SSNTD deployments. This variation is not peripheral, because it conditions the temporal structure of the series, the scale at which anomalies can be defined, and the kinds of exogenous drivers that require control. It also means that the reviewed studies do not analyse a single, physically homogeneous manifestation of radon. Instead, they work with related but non-equivalent signals measured under substantially different observational conditions. In the same way, uneven calibration reporting and incomplete installation detail limit strict comparability across studies even before differences in modelling strategy are considered [53,57,58,64,65,70,71].
A second implication is that the role of AI is narrower and more structured than the broad label of intelligent earthquake prediction may suggest. Across studies with an explicit anomaly workflow, AI is used mainly to estimate an expected radon background under changing environmental or hydrological conditions rather than to predict earthquakes directly. In this sense, the dominant analytical problem is background construction and deviation extraction. The reviewed literature therefore supports a view of AI as an intermediate methodological layer between raw radon observations and anomaly interpretation. This role appears across several workflow families, including meteorology-driven regressors, hydrogeochemical background models, hybrid decomposition–learning pipelines, temporal forecasting models, multimodal screening strategies, and supervised classifiers. The main difference across these families is not only the algorithm employed. It lies in how each study defines the expected signal and in how departures from that signal enter precursor interpretation [47,48,49,50,51,52,53,54,55,56,57,58,59,60,61,62,63,64,65,66,67,68,69,70,71,72].
From a practical standpoint, tool selection should therefore begin with the analytical task rather than with the algorithm label. When the objective is to estimate an expected radon background under meteorological or hydrological forcing, baseline-oriented regressors provide the most natural starting point because they preserve a direct link between background construction and anomaly definition. When the series is strongly non-stationary or multi-scale, decomposition-assisted reconstruction or forecasting frameworks can be more appropriate, provided that the anomaly rule remains explicit after reconstruction. By contrast, direct classifiers are more defensible when window labels, anomaly–earthquake coupling criteria, and chronology-aware evaluation are clearly specified, since in these designs, precursor characterisation is embedded in the class-definition step rather than in a residual-based anomaly variable. Within the present corpus, comparatively stronger examples are studies that combine explicit background–signal separation, monitored exogenous covariates, transparent anomaly rules, and some form of chronology- or context-ordered evaluation [50,61,63,65,70,71].
This pattern also helps distinguish comparatively stronger and weaker forms of evidence within the corpus. Evidence is more interpretable when studies combine explicit background–signal separation, monitored exogenous covariates, a transparent anomaly rule, and an explicit anomaly–earthquake coupling framework, particularly when some form of chronology- or context-ordered evaluation is preserved [50,61,63,65,70,71]. By contrast, evidence is weaker when anomalies are defined post hoc, when exogenous control remains minimal or implicit, or when validation relies mainly on random splits without clear protection of temporal structure [59,60,68,69]. This distinction does not mean that the former group resolves the precursor problem, but it does indicate that some designs provide a firmer basis for interpretation than others.
This point is closely tied to one of the central findings of the review: a radon anomaly is not a uniform entity across the literature. Instead, it is an operational construct whose meaning depends on the decision variable, the thresholding logic, the persistence rule, and the treatment of non-tectonic forcing. Some studies work with deviations from a raw or corrected series mean, others with residual thresholds, relative mismatch indices, confidence-band exceedances, gradient-based rules, or predictive-skill deterioration. A separate subset does not define an a priori anomaly rule at all and instead interprets model departures post hoc or formulates the problem directly as supervised classification. Consequently, studies that all use the language of radon anomalies are not necessarily identifying the same type of object. This heterogeneity is not only terminological. It shapes what is counted as an anomaly, how often anomalies are detected, and how easily results can be compared across sites and methods.
The treatment of exogenous drivers reinforces this interpretation. Across the corpus, auxiliary monitoring is adapted to the monitored medium, acquisition setting, and the specific strategy used to distinguish environmental variability from candidate precursor signals. Soil-gas studies mainly incorporate atmospheric variables and, in some cases, thoron or soil-state measurements, whereas spring, well, and borehole studies rely more heavily on hydrological covariates. Cave and karst studies emphasise variables associated with ventilation and cave-air dynamics, and multimodal radon–TEC workflows add geomagnetic and solar indicators. This pattern indicates that exogenous control is not a secondary refinement but a defining feature of anomaly construction. At the same time, some predictive or classification-oriented studies use exogenous variables without translating them into a formal background–signal separation or a single explicit anomaly rule [60,68,69]. This further complicates comparison between studies that appear similar at the level of algorithm labels but differ substantially in the analytical meaning assigned to model output.
The same dependence on operational design is visible in the way anomaly–earthquake relationships are defined. The reviewed studies do not share a single spatial or temporal coupling framework, as temporal linkage varies from fixed precursor windows to lag-based association, grouped seismic periods, or segment-level discrimination. Some use Dobrovolsky-type preparation zones, others combine these with additional magnitude–distance or deformation-related filters, and still others rely on local seismic occurrence without a formal spatial rule. This review does not treat Dobrovolsky-type relations, or any other single spatial-coupling rule, as universally valid across settings. More restrictive estimates of earthquake preparation-zone size have also been discussed in the broader precursor literature, including the source-nucleation framework proposed by Ohnaka [82]. Accordingly, precursor yield depends materially on the adopted event-selection framework, because changing the spatial rule changes which earthquakes enter the analysis and therefore alters the apparent frequency, timing, and consistency of anomaly–earthquake associations.
This dependence on event selection is compounded by uneven reporting of the seismic data source. Some papers explicitly identify a seismic catalogue, an observatory, an agency, or an institutional earthquake repository, including the NEIC earthquake catalogues [54], the United States Geological Survey [55,57,58,64], the Office of Seismology of the Environmental Agency of the Republic of Slovenia [49,50,51], the Indian Meteorological Department [53,65,72], the Pakistan Meteorological Department [59], the Kandilli Observatory and Earthquake Research Institute [63,67,71], and the National Centre for Seismology in India together with the European-Mediterranean Seismological Centre [70]. By contrast, several studies discuss seismic events, define earthquake windows, or present event tables without explicitly identifying the catalogue or institutional repository from which the earthquake records were obtained [47,48,52,56,60,61,62,66,68,69]. This uneven reporting is methodologically relevant because it limits source traceability and complicates cross-study comparison of earthquake selection procedures.
This helps explain another major pattern emerging from the corpus: reported precursor characteristics are heterogeneous not only in magnitude but also in form. Some studies emphasise relative discrepancies or swarm-type structures, others signed positive and negative peaks, and others deterioration of predictive skill rather than explicit radon excursions. Lead times range from hours to months, and durations range from isolated peaks to prolonged episodes. However, this variability should not be read only as a property of tectonic or hydrogeological context. It also reflects the operational way in which anomalies are constructed and the temporal granularity at which the underlying signal is observed, whether through high-frequency continuous monitoring, daily aggregation, or weekly integral measurements. The reported sign, onset, persistence, and apparent precursor window therefore depend in part on whether a study works with residual exceedance, ratio thresholds, confidence bands, grouped swarms, or performance loss, and also on the temporal structure available for analysis. Moreover, the literature frequently reports results through CA/FA/NA summaries, detected versus missed events, or qualitative episode narratives rather than through harmonised event-wise descriptions of sign, onset, and persistence. Taken together, these features support a context-dependent precursor phenomenology rather than a single radon response that can be transported directly across monitoring settings [49,50,51,52,53,54,55,58,61,63,64,65,66,67,68,70,71,72].
The validation layer further limits strong operational inference. Most studies prioritise signal-reconstruction performance, whereas full alarm-level evaluation is less common and is often replaced by detection-style summaries such as correct alarms, false alarms, no alarms, or detected versus missed events. This distribution suggests that methodological emphasis has been placed mainly on how closely a model reproduces observed radon dynamics, rather than on a standardised assessment of precursor-detection performance. A central implication follows from this imbalance: better reconstruction of the expected radon background does not by itself demonstrate better precursor usefulness at the level of earthquake-related decision making. The reviewed studies also differ substantially in their validation regimes. Random splits, repeated cross-validation, train–validation–test partitions, event-centred windowing, and, less frequently, chronology-aware designs coexist across the corpus. As a result, direct comparison remains limited, because reported performance depends not only on the metric family used but also on how temporal dependence, seismic segmentation, and anomaly–earthquake matching are incorporated into the evaluation design. In particular, the limited use of explicit chronology-aware validation weakens the strength of claims about operational relevance under real monitoring conditions [47,48,49,50,51,52,54,55,56,57,58,59,60,61,66,67,68,69,70,71,72].
From this perspective, AI appears to add most value when it is used to formalise background estimation, confounder control, and deviation extraction. The corpus provides far less support for the stronger claim that AI has already converted radon monitoring into an operationally validated earthquake-prediction framework. In other words, the main advance introduced by AI is methodological rather than predictive. It improves the handling of expected radon behaviour under variable environmental conditions, but it does not remove the dependence of precursor claims on site context, anomaly definition, coupling architecture, and evaluation design.
The limitations reported by the primary studies are consistent with these broader patterns. Restricted spatial scope, limited monitoring duration, incomplete environmental control, sensitivity to thresholds and coupling rules, data-quality constraints, model-structure limitations, and incomplete mechanistic interpretability all point in the same direction. The literature does not support a simple universal formulation in which radon anomalies can be treated as stable and directly transferable earthquake precursors across settings. Instead, the reviewed evidence suggests that claims of precursor relevance are highly conditional on site context, monitoring design, environmental normalisation, anomaly definition, and validation strategy. This does not invalidate the use of AI in radon-anomaly studies. Rather, it indicates that the central scientific challenge is methodological standardisation and transparent operationalisation, not merely the adoption of more complex algorithms.
Seen against the broader precursor literature summarised in Section 1, this review suggests continuity as much as innovation. Earlier work had already emphasised environmental confounding, site dependence, and the difficulty of comparing anomaly claims across studies [6,7,10]. The AI-based corpus does not eliminate these problems. Instead, it shifts the methodological centre of gravity toward background construction, covariate-aware normalisation, and explicit anomaly extraction. In that sense, the main contribution of AI is not that it resolves the precursor question, but that it makes the structure of the problem more explicit. It forces studies to specify what counts as expected behaviour, what counts as deviation, and under what conditions that deviation is interpreted as seismically relevant.
This positioning also becomes clearer when the present review is compared with broader recent reviews on machine learning in earthquake research. The review [83] synthesises machine learning applications across earthquake engineering through a dual scientometric and systematic review framework focused on ground-motion models, earthquake prediction models, and structural health monitoring. Within that broader landscape, radon-related studies appear only as one possible source of precursor information rather than as a distinct methodological subfield. In contrast, the present review concentrates specifically on how AI-based studies construct, define, and validate radon anomalies in an explicit earthquake context. The difference is therefore not only thematic narrowness versus breadth, but also analytical depth: whereas Noor [83] maps the wider machine learning ecosystem in earthquake engineering, our review isolates the operational architecture through which radon anomalies are transformed into candidate precursor evidence. This makes the two reviews complementary rather than redundant.
A similar relationship can be observed with the review [84], which compiles machine learning and deep learning studies on earthquake prediction across several domains, including ionospheric disturbances, signal discrimination, magnitude estimation, hydrological changes, and radon-related analyses. That review confirms that radon has already been recognised as a relevant component within the broader earthquake-prediction literature and that several model families, such as layered neural networks, decision trees, XGBoost, LSTM, and ensemble methods, have been applied in this context [84]. However, radon anomalies are treated there as one topic among many, without a dedicated synthesis of anomaly definitions, exogenous-control strategies, coupling rules, or validation designs. In this sense, the present review extends that broader line of work by providing a focused synthesis of the methodological conditions under which AI-based radon studies support, weaken, or complicate precursor claims.
From this perspective, the main contribution of the review is not to resolve whether radon is universally predictive of earthquakes but to clarify the conditions under which AI-based radon studies produce evidence that is more or less interpretable. Stronger inference will require broader spatial deployment, longer monitoring records, more complete treatment of locally relevant confounders, explicit reporting of anomaly thresholds and coupling rules, and evaluation designs that better preserve temporal ordering. It will also require more comparable benchmarking across studies, because improvement claims remain difficult to interpret when datasets, anomaly definitions, and validation regimes all change simultaneously. In the absence of these conditions, apparent improvements in reconstruction accuracy or local anomaly–earthquake association may remain difficult to generalise beyond the specific setting in which they were obtained.
The limitations extracted from the corpus point to a minimum set of reporting and design conditions for stronger inference and better cross-study comparability:
- Scope: Broader spatial deployment and longer monitoring duration that can capture interannual variability, site heterogeneity, and rare-event dynamics [50,66,70,72].
- Confounder control: More complete and better integrated environmental monitoring, especially for rainfall, soil moisture, and other locally relevant drivers [50,64,70].
- Operational transparency: Explicit and justified reporting of anomaly thresholds, coupling windows, earthquake-selection criteria, and the analytical role assigned to model outputs, together with sensitivity analyses when parameter choices are varied [50,51,52,55].
- Evaluation rigour: Clearer discussion of imbalance, overfitting risk, model interpretability, computational constraints, and validation designs that preserve temporal ordering more explicitly when these factors affect the credibility or transferability of reported results [61,67,68,69,72].
4.1. Limitations of This Review
Although the review followed PRISMA 2020 and used independent dual screening and extraction, several limitations should temper interpretation.
4.1.1. Coverage, Scope, and Retrieval
Because we limited the searches to Scopus and the Web of Science Core Collection up to a fixed cut-off date and to peer-reviewed journal articles, relevant evidence published later, affected by indexing delays, or disseminated primarily via conferences, preprints, technical reports, or non-indexed venues may be under-represented. Retrieval may also be sensitive to terminology and indexing practices, so studies framed under adjacent descriptors without explicit anomaly language may have been missed. In addition, we did not document supplementary retrieval routes such as backward or forward citation chasing, targeted hand-searching, or expert consultation, which may reduce recall in a small and fragmented field.
4.1.2. Study Quality Appraisal and Reporting Dependence
We did not implement a formal study-level risk-of-bias appraisal tailored to time-series modelling and detection. Consequently, the synthesis does not grade certainty of evidence or weight findings by methodological robustness, such as leakage control, time-aware validation, calibration traceability, or alarm-metric completeness. Moreover, several dimensions that matter for comparability are inconsistently reported in primary studies, including calibration detail, ratio-index implementation, windowing and merging rules, and confusion-matrix-style alarm metrics. This limits extraction granularity and requires conservative interpretation in some parts of the synthesis.
4.1.3. Heterogeneity and Limits on Quantitative Inference
Substantial heterogeneity in measurement configurations, sampling resolution, covariate control, background modelling, anomaly definitions, coupling protocols, and validation designs prevented quantitative pooling. We therefore interpret the conclusions as comparative patterns in practice rather than as pooled estimates of effect or performance.
4.1.4. Coding Judgement and External Validity
Although dual screening and dual extraction reduce error, harmonizing heterogeneous operational definitions still requires interpretive mapping, and some edge cases may carry residual classification uncertainty. Finally, because the evidence base remains geographically and contextually concentrated, generalisability to underrepresented regions and monitoring regimes remains limited.
4.2. Future Perspectives
Future progress in this field will depend less on adding new algorithm labels and more on improving the design conditions under which radon anomalies are constructed, compared, and interpreted. A first priority is to expand the empirical basis of the literature through broader spatial deployment, longer monitoring records, and more diverse geological and climatic settings. Short records make this expansion especially important, because they limit the ability to distinguish recurring non-tectonic variability from candidate earthquake-related departures and may inflate apparent anomaly yield when only a small observational baseline is available [7]. The current corpus is concentrated in a limited set of regional contexts, whereas several primary studies already indicate the need for larger monitoring networks, longer observation periods, and validation across additional regions [50,66,70,72]. Extending coverage in this way would improve both external validity and the capacity to distinguish site-specific behaviour from patterns that recur across settings.
A second priority is stronger standardisation of the analytical pipeline. The reviewed evidence shows that the meaning of a radon anomaly depends on how the expected background is defined, how exogenous drivers are controlled, which thresholds are applied, and how anomaly persistence is operationalised. Future studies would therefore benefit from more explicit reporting of anomaly definitions, coupling windows, event-selection criteria, and sensitivity analyses for alternative parameter choices [50,51,52,55]. This need is especially important in a literature where similar model families are often used under substantially different operational assumptions.
A third priority concerns validation. The field would gain from designs that preserve temporal ordering more explicitly, separate model development from anomaly–earthquake evaluation more transparently, and report performance in forms that are comparable across studies. The current literature relies heavily on signal-reconstruction metrics and detection-style summaries, whereas full alarm-level evaluation remains less common. Future work should therefore place greater emphasis on chronology-aware validation, clearer reporting of detected and missed events, and more transparent linkage between reconstruction performance and operational anomaly assessment [50,52,58,61,70,71,72].
A fourth priority is deeper integration between modelling and physical interpretation. The corpus shows that radon variability is shaped by atmospheric, hydrological, geological, and, in some cases, ionospheric influences, so future research should continue to refine confounder control rather than treat it as a secondary adjustment. This includes more complete monitoring of locally relevant drivers, clearer separation between environmentally forced and candidate precursory components, and more cautious interpretation of multimodal evidence such as joint radon–TEC workflows [50,63,64,70]. Under these conditions, AI would be positioned not as a substitute for physical understanding, but as a more rigorous framework for constructing, testing, and comparing radon-anomaly hypotheses in an earthquake context.
5. Conclusions
This systematic review synthesised 26 peer-reviewed journal articles that applied artificial intelligence in an explicit earthquake context to detect, model, classify, or evaluate radon anomalies. The evidence shows that this field has grown mainly in recent years, but it remains geographically concentrated and methodologically heterogeneous. Within the included corpus, monitoring sites are concentrated in South Asia and selected European settings, and the reviewed studies span substantially different observational configurations, including soil gas, groundwater and thermal springs, cave air, near-surface accumulation systems, and atmospheric radon or ionisation-current proxy data. These differences shape the temporal structure of the analysed series and the kinds of exogenous drivers that need to be controlled before anomaly interpretation.
Across the reviewed literature, radon anomalies are not defined through a single operational framework. Instead, studies use a wide range of decision rules, including deviations from raw or corrected series means, residual thresholds, relative mismatch indices, confidence-band exceedances, gradient-based criteria, predictive-skill deterioration, and classification-based formulations. This result is central because it shows that the term radon anomaly does not refer to a uniform analytical object across studies. In practice, the meaning of an anomaly depends on how the expected background is constructed, how persistence is treated, which thresholds are adopted, and how non-tectonic forcing is controlled.
The review also shows that the main role of artificial intelligence in this literature is methodological rather than directly predictive. In most studies with an explicit anomaly workflow, AI is used primarily to estimate an expected radon background under changing environmental or hydrological conditions, after which candidate precursor signals are inferred from deviations between observed and expected behaviour. The reviewed workflows include meteorology-driven regressors, hydrogeochemical background models, hybrid decomposition–learning pipelines, temporal forecasting approaches, multimodal screening designs, and supervised classification schemes. What distinguishes these workflows is not only the algorithmic family used but also the analytical role assigned to model output in anomaly construction and interpretation.
The anomaly–earthquake relationship is likewise operationalised in highly heterogeneous ways. The reviewed studies differ in spatial coupling rules, temporal linkage strategies, and evaluation logic. Some rely on Dobrovolsky-type preparation zones or related magnitude–distance frameworks, whereas others use local seismic occurrence or segment-level discrimination without a formal spatial rule. Temporal linkage ranges from fixed precursor-validity windows to lag-based association and grouped seismic periods. Reported precursor characteristics are therefore heterogeneous in sign, magnitude, duration, and lead time, and they are commonly summarised through correct alarms, false alarms, no alarms, detected versus missed events, or qualitative episode narratives rather than through harmonised event-wise descriptions.
Validation practices further limit direct comparison across studies. Most articles prioritise signal-reconstruction metrics such as correlation coefficients and error measures, whereas full alarm-level evaluation is less common and often replaced by detection-style summaries. The reviewed studies also use heterogeneous validation regimes, including random splits, repeated cross-validation, train–validation–test partitions, event-centred windowing, and a smaller number of chronology- or context-ordered designs. In consequence, reported performance remains difficult to compare across the corpus because it depends simultaneously on the metric family, the anomaly definition, the coupling framework, and the preservation or disruption of temporal structure during evaluation.
Taken together, the reviewed evidence does not support a universal formulation in which radon anomalies can be treated as stable and directly transferable earthquake precursors across settings. Instead, it shows that claims of precursor relevance remain conditional on monitoring design, site context, environmental normalisation, anomaly definition, coupling architecture, and validation strategy. The main contribution of this review is therefore to clarify the methodological conditions under which AI-based radon studies produce evidence that is more or less interpretable. Stronger progress in this field will require broader spatial coverage, longer monitoring records, more complete treatment of locally relevant confounders, clearer reporting of anomaly definitions and coupling rules, and evaluation designs that preserve temporal ordering more explicitly. Under those conditions, AI can serve as a more rigorous framework for constructing and comparing radon-anomaly hypotheses in an earthquake context.
Author Contributions
Conceptualisation, F.D.; methodology, F.D. and N.C.; software, F.D. and N.C.; validation, R.L. and B.M.; formal analysis, F.D., N.C. and R.L.; investigation, F.D., R.L., N.C. and B.M.; resources, N.C. and B.M.; data curation, F.D. and R.L.; writing—original draft preparation, F.D., N.C. and B.M.; writing—review and editing, F.D. and R.L.; visualisation, N.C. and B.M.; supervision, F.D. and N.C.; project administration, F.D. All authors have read and agreed to the published version of the manuscript.
Funding
This research received no external funding.
Data Availability Statement
No new experimental data were generated in this study. The data analysed in this review were derived from the published articles cited in the manuscript.
Conflicts of Interest
The authors declare no conflicts of interest.
Abbreviations
The following abbreviations are used in this manuscript:
| AAIF | Automatic Anomaly Indication Function |
| AI | Artificial Intelligence |
| ANN | Artificial Neural Network |
| ARIMA | Autoregressive Integrated Moving Average |
| AUC | Area Under the Curve |
| CA | Correct Alarm |
| CNN | Convolutional Neural Network |
| EEMD | Ensemble Empirical Mode Decomposition |
| EMD | Empirical Mode Decomposition |
| EWMA | Exponentially Weighted Moving Average |
| FA | False Alarm |
| FFT | Fast Fourier Transform |
| F1 | F1 Score |
| HHT | Hilbert–Huang Transform |
| IF | Indication Factor |
| LSTM | Long Short-Term Memory |
| MAPE | Mean Absolute Percentage Error |
| MCC | Matthews Correlation Coefficient |
| ML | Machine Learning |
| MLR | Multiple Linear Regression |
| MSE | Mean Squared Error |
| NA | No Alarm |
| PACF | Partial Autocorrelation Function |
| PB | Percentage Bias |
| PRISMA | Preferred Reporting Items for Systematic Reviews and Meta-Analyses |
| Coefficient of Determination | |
| RMSE | Root-Mean-Square Error |
| RMSLE | Root-Mean-Square Logarithmic Error |
| ROC | Receiver Operating Characteristic |
| SA | Seismically Active |
| SSNTD | Solid-State Nuclear Track Detector |
| TA | True Alarm |
| TEC | Total Electron Content |
| XGBoost | Extreme Gradient Boosting |
References
- Gitis, V.; Derendyaev, A. Two-Stage Systematic Forecasting of Earthquakes. Geosciences 2025, 15, 170. [Google Scholar] [CrossRef] [Scilit]
- Mizrahi, L.; Dallo, I.; van der Elst, N.J.; Christophersen, A.; Spassiani, I.; Werner, M.J.; Iturrieta, P.C.; Bayona, J.; Iervolino, I.; Schneider, M.; et al. Developing, testing, and communicating earthquake forecasts: Current practices and future directions. Rev. Geophys. 2024, 62, e2023RG000823. [Google Scholar] [CrossRef] [Scilit]
- Biondini, E.; Gasperini, P. Comparison between alarm-based and probability-based earthquake forecasting methods. Geophys. J. Int. 2023, 235, 1541–1551. [Google Scholar] [CrossRef] [Scilit]
- Hu, Y.; Zhang, Q.; Zhu, H.; Wang, B.; Xiong, H.; Wang, H. Scalable intermediate-term earthquake forecasting with multimodal fusion neural networks. Sci. Rep. 2025, 15, 9748. [Google Scholar] [CrossRef] [Scilit]
- D’Incecco, S.; Petraki, E.; Priniotakis, G.; Papoutsidakis, M.; Yannakopoulos, P.; Nikolopoulos, D. CO2 and Radon Emissions as Precursors of Seismic Activity. Earth Syst. Environ. 2021, 5, 655–666. [Google Scholar] [CrossRef] [Scilit]
- D’Alessandro, A.; Scudero, S.; Siino, M.; Alessandro, G.; Mineo, R. Long-Term Monitoring and Characterization of Soil Radon Emission in a Seismically Active Area. Geochem. Geophys. Geosyst. 2020, 21, e2020GC009061. [Google Scholar] [CrossRef] [Scilit]
- Woith, H. Radon earthquake precursor: A short review. Eur. Phys. J. Spec. Top. 2015, 224, 611–627. [Google Scholar] [CrossRef] [Scilit]
- Díaz, F.; Liza, R. Radon Anomalies and Earthquake Prediction: Trends and Research Hotspots in the Scientific Literature. Geosciences 2025, 15, 283. [Google Scholar] [CrossRef] [Scilit]
- Nikolopoulos, D.; Cantzos, D.; Alam, A.; Dimopoulos, S.; Petraki, E. Electromagnetic and Radon Earthquake Precursors. Geosciences 2024, 14, 271. [Google Scholar] [CrossRef] [Scilit]
- Pulinets, S.; Mironova, I.; Miklyaev, P.; Petrova, T.; Shitov, A.; Karagodin, A. Radon Variability as a Result of Interaction with the Environment. Atmosphere 2024, 15, 167. [Google Scholar] [CrossRef] [Scilit]
- Kamişlıoğlu, M.; Külahcı, F. Chaotic Behavior of Soil Radon Gas and Applications. Acta Geophys. 2016, 64, 1563–1592. [Google Scholar] [CrossRef] [Scilit]
- Soldati, G.; Cannelli, V.; Piersanti, A. Monitoring soil radon during the 2016–2017 central Italy sequence in light of seismicity. Sci. Rep. 2020, 10, 13137. [Google Scholar] [CrossRef] [Scilit] [PubMed]
- Alam, A.; Wang, N.; Zhao, G.; Mehmood, T.; Nikolopoulos, D. Long-lasting patterns of radon in groundwater at Panzhihua, China: Results from DFA, fractal dimensions and residual radon concentration. Geochem. J. 2019, 53, 341–358. [Google Scholar] [CrossRef] [Scilit]
- Zafrir, H.; Barbosa, S.; Levintal, E.; Weisbrod, N.; Ben Horin, Y.; Zalevsky, Z. The Impact of Atmospheric and Tectonic Constraints on Radon-222 and Carbon Dioxide Flow in Geological Porous Media—A Dozen-Year Research Summary. Front. Earth Sci. 2020, 8, 559298. [Google Scholar] [CrossRef] [Scilit]
- Neri, M.; Ferrera, E.; Giammanco, S.; Currenti, G.; Cirrincione, R.; Patanè, G.; Zanon, V. Soil radon measurements as a potential tracer of tectonic and volcanic activity. Sci. Rep. 2016, 6, 24581. [Google Scholar] [CrossRef] [Scilit]
- Singh, S.; Jaishi, H.P.; Tiwari, R.P.; Tiwari, R.C. A study of variation in soil gas concentration associated with earthquakes near Indo-Burma Subduction zone. Geoenviron. Disasters 2016, 3, 22. [Google Scholar] [CrossRef] [Scilit]
- Bhardwaj, A.; Sam, L.; Martin-Torres, F.J. The challenges and possibilities of earthquake predictions using non-seismic precursors. Eur. Phys. J. Spec. Top. 2021, 230, 367–380. [Google Scholar] [CrossRef] [Scilit]
- Freund, F.; Ouillon, G.; Scoville, J.; Sornette, D. Earthquake precursors in the light of peroxy defects theory: Critical review of systematic observations. Eur. Phys. J. Spec. Top. 2021, 230, 7–46. [Google Scholar] [CrossRef] [Scilit]
- Jiao, Z.H.; Zhao, J.; Shan, X. Pre-seismic anomalies from optical satellite observations: A review. Nat. Hazards Earth Syst. Sci. 2018, 18, 1013–1036. [Google Scholar] [CrossRef] [Scilit]
- Sabbarese, C.; Ambrosino, F.; Chiodini, G.; Giudicepietro, F.; Macedonio, G.; Caliro, S.; De Cesare, W.; Bianco, F.; Pugliese, M.; Roca, V. Continuous radon monitoring during seven years of volcanic unrest at Campi Flegrei caldera (Italy). Sci. Rep. 2020, 10, 9551. [Google Scholar] [CrossRef] [Scilit]
- Rezaie, F.; Kim, S.W.; Alizadeh, M.; Panahi, M.; Kim, H.; Kim, S.; Lee, J.; Lee, J.; Yoo, J.; Lee, S. Application of Machine Learning Algorithms for Geogenic Radon Potential Mapping in Danyang-Gun, South Korea. Front. Environ. Sci. 2021, 9, 753028. [Google Scholar] [CrossRef] [Scilit]
- Moghadamnejad, A.; Moghaddasi, M.A.; Hamidia, M.; Karami Mohammadi, R.; Zare, M. Ranking Earthquake Prediction Algorithms: A Comprehensive Review of Machine Learning and Deep Learning Methods. Soil Dyn. Earthq. Eng. 2026, 200, 109740. [Google Scholar] [CrossRef] [Scilit]
- Chi, C.; Li, C.; Han, Y.; Yu, Z.; Li, X.; Zhang, D. Pre-earthquake anomaly extraction from borehole strain data based on machine learning. Sci. Rep. 2023, 13, 20095. [Google Scholar] [CrossRef] [Scilit] [PubMed]
- Davy, A.; Ehret, T.; Morel, J.M.; Delbracio, M. Reducing Anomaly Detection in Images to Detection in Noise. In Proceedings of the 2018 IEEE International Conference on Image Processing (ICIP), Athens, Greece, 7–10 October 2018; pp. 1058–1062. [Google Scholar] [CrossRef] [Scilit]
- Ulmer, M.; Zgraggen, J.; Goren Huber, L. A Generic Machine Learning Framework for Fully-Unsupervised Anomaly Detection with Contaminated Data. Int. J. Progn. Health Manag. 2024, 15, 3589. [Google Scholar] [CrossRef] [Scilit]
- Wu, P.; Meng, Q.; Zhang, Y.; Zhan, C.; Allam, M.; Zhang, L.; Hu, X. Coarse-graining research of the thermal infrared anomalies before earthquakes in the Sichuan area on Google Earth engine. Front. Earth Sci. 2023, 11, 1101165. [Google Scholar] [CrossRef] [Scilit]
- Nandan, S.; Kamer, Y.; Ouillon, G.; Hiemer, S.; Sornette, D. Global models for short-term earthquake forecasting and predictive skill assessment. Eur. Phys. J. Spec. Top. 2021, 230, 425–449. [Google Scholar] [CrossRef] [Scilit]
- Mignan, A.; Ouillon, G.; Sornette, D.; Freund, F. Global Earthquake Forecasting System (GEFS): The challenges ahead. Eur. Phys. J. Spec. Top. 2021, 230, 473–490. [Google Scholar] [CrossRef] [Scilit]
- Katsumata, K.; Nakatani, M. Testing the seismic quiescence hypothesis through retrospective trials of alarm-based earthquake prediction in the Kurile–Japan subduction zone. Earth Planets Space 2021, 73, 100. [Google Scholar] [CrossRef] [Scilit]
- Page, M.J.; McKenzie, J.E.; Bossuyt, P.M.; Boutron, I.; Hoffmann, T.C.; Mulrow, C.D.; Shamseer, L.; Tetzlaff, J.M.; Akl, E.A.; Brennan, S.E.; et al. The PRISMA 2020 statement: An updated guideline for reporting systematic reviews. BMJ 2021, 372, n71. [Google Scholar] [CrossRef] [Scilit]
- Külahcı, F.; İnceöz, M.; Doğru, M.; Aksoy, E.; Baykara, O. Artificial neural network model for earthquake prediction with radon monitoring. Appl. Radiat. Isot. 2009, 67, 212–219. [Google Scholar] [CrossRef] [Scilit]
- Sikder, I.U.; Munakata, T. Application of rough set and decision tree for characterization of premonitory factors of low seismic activity. Expert Syst. Appl. 2009, 36, 102–110. [Google Scholar] [CrossRef] [Scilit]
- Putranto, C.A.; Sunarno; Faridah; Pratama, T.O. Earthquake epicenter prediction from the Java-Bali radon gas telemonitoring station using machine learning. Int. J. Adv. Appl. Sci. 2025, 14, 39–45. [Google Scholar] [CrossRef] [Scilit]
- Pratama, T.O.; Sunarno; Wijatna, A.B.; Haryono, E. Earthquake magnitude prediction in Indonesia using a supervised method based on cloud radon data. Int. J. Reconfig. Embed. Syst. 2024, 13, 577–585. [Google Scholar] [CrossRef] [Scilit]
- Hajikhodaverdikhan, P.; Nazari, M.; Mohsenizadeh, M.; Shamshirband, S.; Chau, K.w. Earthquake prediction with meteorological data by particle filter-based support vector regression. Eng. Appl. Comput. Fluid Mech. 2018, 12, 679–688. [Google Scholar] [CrossRef] [Scilit]
- Dutta, P.K.; Mishra, O.P.; Naskar, M.K. Evaluation of seismogenesis behavior in Himalayan belt using data mining tools for forecasting. Cent. Eur. J. Geosci. 2013, 5, 236–253. [Google Scholar] [CrossRef] [Scilit]
- Jena, R.; Pradhan, B.; Naik, S.P.; Alamri, A.M. Earthquake risk assessment in NE India using deep learning and geospatial analysis. Geosci. Front. 2021, 12, 101110. [Google Scholar] [CrossRef] [Scilit]
- Saidani, O.; Manoharan, R.R.; Naje, A.S.; Mishra, R.; Subburaj, A.; S, M.; Sikkandar, M.Y.; Sundaram, S.G.; Rajan, R.; Sengan, S. Analysis of positive correlation in magnitude and time measurement for earthquake using electric signals. Earth Sci. Inform. 2022, 15, 1527–1544. [Google Scholar] [CrossRef] [Scilit]
- Reddy, R.G.; Reddy, M.S.; Anisha, P.R.; Reddy, C.K.K. Identification of Earthquakes Using Wavelet Transform and Clustering Methodologies. Int. J. Civ. Eng. Technol. 2017, 8, 666–676. [Google Scholar]
- Toader, V.E.; Nicolae, V.; Moldovan, I.A.; Ionescu, C.; Marmureanu, A. Monitoring of Gas Emissions in Light of an OEF Application. Atmosphere 2021, 12, 26. [Google Scholar] [CrossRef] [Scilit]
- Muhammad, A.; Külahcı, F.; Salh, H.; Hama Rashid, P.A. Long Short Term Memory networks (LSTM)-Monte-Carlo simulation of soil ionization using radon. J. Atmos. Sol.-Terr. Phys. 2021, 221, 105688. [Google Scholar] [CrossRef] [Scilit]
- Sahoo, B.K.; Sapra, B.K.; Kanse, S.D.; Gaware, J.J.; Kumbhar, D.H.; Ratheesh, M.P.; Khan, A.; Aswal, D.K. A sensitive system based on radon amplification at soil-air interface: Aiming to advance earthquake precursor research. J. Environ. Radioact. 2024, 278, 107482. [Google Scholar] [CrossRef] [Scilit]
- Mir, A.A.; Çelebi, F.V.; Rafique, M.; Hussain, L.; Almasoud, A.S.; Alajmi, M.; Al-Wesabi, F.N.; Hilal, A.M. An Improved Imputation Method for Accurate Prediction of Imputed Dataset Based Radon Time Series. IEEE Access 2022, 10, 20590–20601. [Google Scholar] [CrossRef] [Scilit]
- Bashir, N.; Mir, A.A.; Daud, A.; Rafique, M.; Bukhari, A. Time Series Reconstruction with Feature-Driven Imputation: A Comparison of Base Learning Algorithms. IEEE Access 2024, 12, 85511–85530. [Google Scholar] [CrossRef] [Scilit]
- Mir, A.A.; Kearfott, K.J.; Çelebi, F.V.; Rafique, M. Imputation by feature importance (IBFI): A methodology to envelop machine learning method for imputing missing patterns in time series data. PLoS ONE 2022, 17, e0262131. [Google Scholar] [CrossRef] [Scilit]
- Szakács, A. Precursor-Based Earthquake Prediction Research: Proposal for a Paradigm-Shifting Strategy. Front. Earth Sci. 2021, 8, 548398. [Google Scholar] [CrossRef] [Scilit]
- Negarestani, A.; Setayeshi, S.; Ghannadi-Maragheh, M.; Akashe, B. Layered neural networks based analysis of radon concentration and environmental parameters in earthquake prediction. J. Environ. Radioact. 2002, 62, 225–233. [Google Scholar] [CrossRef] [Scilit]
- Negarestani, A.; Setayeshi, S.; Ghannadi-Maragheh, M.; Akashe, B. Estimation of the radon concentration in soil related to the environmental parameters by a modified Adaline neural network. Appl. Radiat. Isot. 2003, 58, 269–273. [Google Scholar] [CrossRef] [Scilit]
- Zmazek, B.; Todorovski, L.; Dzeroski, S.; Vaupotic, J.; Kobal, I. Application of decision trees to the analysis of soil radon data for earthquake prediction. Appl. Radiat. Isot. 2003, 58, 697–706. [Google Scholar] [CrossRef] [Scilit] [PubMed]
- Zmazek, B.; Todorovski, L.; Živčić, M.; Džeroski, S.; Vaupotič, J.; Kobal, I. Radon in a thermal spring: Identification of anomalies related to seismic activity. Appl. Radiat. Isot. 2006, 64, 725–734. [Google Scholar] [CrossRef] [Scilit] [PubMed]
- Torkar, D.; Zmazek, B.; Vaupotič, J.; Kobal, I. Application of artificial neural networks in simulating radon levels in soil gas. Chem. Geol. 2010, 270, 1–8. [Google Scholar] [CrossRef] [Scilit]
- Gupta, D.; Shahani, D.T. Estimation of radon as an earthquake precursor: A neural network approach. J. Geol. Soc. India 2011, 78, 243–248. [Google Scholar] [CrossRef] [Scilit]
- Singh, S.; Jaishi, H.P.; Tiwari, R.P.; Tiwari, R.C. Time Series Analysis of Soil Radon Data Using Multiple Linear Regression and Artificial Neural Network in Seismic Precursory Studies. Pure Appl. Geophys. 2017, 174, 2793–2802. [Google Scholar] [CrossRef] [Scilit]
- Zhang, S.; Shi, Z.; Wang, G.; Yan, R.; Zhang, Z. Groundwater radon precursor anomalies identification by decision tree method. Appl. Geochem. 2020, 121, 104696. [Google Scholar] [CrossRef] [Scilit]
- Ambrosino, F.; Thinová, L.; Briestenský, M.; Šebela, S.; Sabbarese, C. Detecting time series anomalies using hybrid methods applied to Radon signals recorded in caves for possible correlation with earthquakes. Acta Geod. Geophys. 2020, 55, 405–420. [Google Scholar] [CrossRef] [Scilit]
- Rafique, M.; Tareen, A.D.K.; Mir, A.A.; Nadeem, M.S.A.; Asim, K.M.; Kearfott, K.J. Delegated Regressor, A Robust Approach for Automated Anomaly Detection in the Soil Radon Time Series Data. Sci. Rep. 2020, 10, 3004. [Google Scholar] [CrossRef] [Scilit] [PubMed]
- Ambrosino, F.; Thinová, L.; Briestenský, M.; Giudicepietro, F.; Roca, V.; Sabbarese, C. Analysis of geophysical and meteorological parameters influencing 222Rn activity concentration in Mladeč caves (Czech Republic) and in soils of Phlegrean Fields caldera (Italy). Appl. Radiat. Isot. 2020, 160, 109140. [Google Scholar] [CrossRef] [Scilit]
- Haider, T.; Barkat, A.; Hayat, U.; Ali, A.; Awais, M.; Alam, A.; Rehman, K.; Shah, M.A. Identification of radon anomalies induced by earthquake activity using intelligent systems. J. Geochem. Explor. 2021, 222, 106709. [Google Scholar] [CrossRef] [Scilit]
- Mir, A.A.; Çelebi, F.V.; Rafique, M.; Faruque, M.R.I.; Khandaker, M.U.; Kearfott, K.J.; Ahmad, P. Anomaly Classification for Earthquake Prediction in Radon Time Series Data Using Stacking and Automatic Anomaly Indication Function. Pure Appl. Geophys. 2021, 178, 1593–1607. [Google Scholar] [CrossRef] [Scilit]
- Mir, A.A.; Çelebi, F.V.; Alsolai, H.; Qureshi, S.A.; Rafique, M.; Alzahrani, J.S.; Mahgoub, H.; Hamza, M.A. Anomalies Prediction in Radon Time Series for Earthquake Likelihood Using Machine Learning-Based Ensemble Model. IEEE Access 2022, 10, 37984–37999. [Google Scholar] [CrossRef] [Scilit]
- Feng, X.; Zhong, J.; Yan, R.; Zhou, Z.; Tian, L.; Zhao, J.; Yuan, Z. Groundwater Radon Precursor Anomalies Identification by EMD-LSTM Model. Water 2022, 14, 69. [Google Scholar] [CrossRef] [Scilit]
- Zhang, S.; Shi, Z.; Wang, G.; Yan, R.; Zhang, Z. Application of the extreme gradient boosting method to quantitatively analyze the mechanism of radon anomalous change in Banglazhang hot spring before the Lijiang Mw 7.0 earthquake. J. Hydrol. 2022, 612, 128249. [Google Scholar] [CrossRef] [Scilit]
- Muhammad, A.; Külahcı, F.; Birel, S. Investigating radon and TEC anomalies relative to earthquakes via AI models. J. Atmos. Sol.-Terr. Phys. 2023, 245, 106037. [Google Scholar] [CrossRef] [Scilit]
- Thuamthansanga, T.; Tiwari, R.C. Identification of pre-seismic radon anomaly using artificial neural network near Indo-Burman subduction line. J. Radioanal. Nucl. Chem. 2024, 333, 5519–5529. [Google Scholar] [CrossRef] [Scilit]
- Jaishi, H.P.; Singh, S.; Tiwari, R.P.; Tiwari, R.C. Comparing wavelet-based artificial neural network, multiple linear regression, and ARIMA models for detecting genuine radon anomalies associated with seismic events. Proc. Indian Natl. Sci. Acad. 2024, 90, 682–696. [Google Scholar] [CrossRef] [Scilit]
- Tsuchiya, M.; Nagahama, H.; Muto, J.; Hirano, M.; Yasuoka, Y. Detection of atmospheric radon concentration anomalies and their potential for earthquake prediction using Random Forest analysis. Sci. Rep. 2024, 14, 11626. [Google Scholar] [CrossRef] [Scilit]
- Muhammad, A.; Danbatta, S.J.; Muhammad, I.Y.; Nasidi, I.I. Exploring soil radon (Rn) concentrations and their connection to geological and meteorological factors. Environ. Sci. Pollut. Res. 2024, 31, 565–578. [Google Scholar] [CrossRef] [Scilit]
- Yotov, K.; Hadzhikolev, E.; Hadzhikoleva, S. Modeling the Relationship Between Radon Anomalies and Seismic Activity Using Artificial Neural Networks and Statistical Methods. Mathematics 2025, 13, 1075. [Google Scholar] [CrossRef] [Scilit]
- Bashir, N.; Mir, A.A.; Osama, M.; Abbasi, S.M.; Nikolopoulos, D.; Qureshi, S.A.; Rafique, M. Enhancing seismic activity classification in augmented soil gas radon time series data through computational intelligence techniques. J. Atmos. Sol.-Terr. Phys. 2025, 274, 106560. [Google Scholar] [CrossRef] [Scilit]
- Sahoo, B.K.; Khan, A.; Ratheesh, M.P.; Kumbhar, D.H.; Gaware, J.J.; Kanse, S.D.; Agarwal, T.K.; Sapra, B.K. The Indian Network for Detecting Radon Anomaly signal for Seismic Application. J. Environ. Radioact. 2025, 289, 107761. [Google Scholar] [CrossRef] [Scilit]
- Ankara, A.C.; Tekeş, B.N.; Tülü, F.; Günay, O.; Cantürk, İ. A comprehensive study on application of LSTM neural networks for radon-based earthquake anomaly detection in Istanbul. J. Radioanal. Nucl. Chem. 2026, 335, 497–518. [Google Scholar] [CrossRef] [Scilit]
- Vandana; Kumar, P.C.; Kumar, N.; Verma, S.K. Radon as an earthquake precursor: A machine learning case study from the Garhwal Himalaya, NW India. J. Radioanal. Nucl. Chem. 2026, 335, 1051–1074. [Google Scholar] [CrossRef] [Scilit]
- Biagi, P.F.; Ermini, A.; Cozzi, E.; Khatkevich, Y.M.; Gordeev, E.I. Hydrogeochemical precursors in Kamchatka (Russia) related to the strongest earthquakes in 1988–1997. Nat. Hazards 2000, 21, 263–276. [Google Scholar] [CrossRef] [Scilit]
- Toutain, J.P.; Baubron, J.C. Gas geochemistry and seismotectonics: A review. Tectonophysics 1999, 304, 1–27. [Google Scholar] [CrossRef] [Scilit]
- Girault, F.; Schubnel, A.; Pili, É. Transient radon signals driven by fluid pressure pulse, micro-crack closure, and failure during granite deformation experiments. Earth Planet. Sci. Lett. 2017, 474, 409–418. [Google Scholar] [CrossRef] [Scilit]
- Huang, P.; Lv, W.; Huang, R.; Luo, Q.; Yang, Y. Earthquake precursors: A review of key factors influencing radon concentration. J. Environ. Radioact. 2024, 271, 107310. [Google Scholar] [CrossRef] [Scilit]
- Zhao, Y.; Liu, Z.; Li, Y.; Hu, L.; Chen, Z.; Sun, F.; Lu, C. A case study of 10 years groundwater radon monitoring along the eastern margin of the Tibetan Plateau and in its adjacent regions: Implications for earthquake surveillance. Appl. Geochem. 2021, 131, 105014. [Google Scholar] [CrossRef] [Scilit]
- Shapiro, M.H.; Melvin, J.D.; Tombrello, T.A.; Whitcomb, J.H. Automated radon monitoring at a hard-rock site in the southern California transverse ranges. J. Geophys. Res. Solid Earth 1980, 85, 3058–3064. [Google Scholar] [CrossRef] [Scilit]
- Humanante, B.F.; Giroletti, E.; Idrovo, J.; Monnin, M.; Pasinetti, R.; Seidel, J.L. Radon signals related to seismic activity in Ecuador, March 1987. Pure Appl. Geophys. 1990, 132, 505–520. [Google Scholar] [CrossRef] [Scilit]
- Segovia, N.; Mena, M.; Tamez, E. Radon monitoring related to a subduction zone in Mexico. Nucl. Tracks Radiat. Meas. 1993, 22, 435–440. [Google Scholar] [CrossRef] [Scilit]
- Segovia, N.; de la Cruz-Reyna, S.; Mena, M.; Ramos, E.; Monnin, M.; Seidel, J.L. Radon in soil anomaly observed at Los Azufres geothermal field, Michoacan: A possible precursor of the 1985 Mexico earthquake (Ms = 8.1). Nat. Hazards 1989, 1, 319–329. [Google Scholar] [CrossRef] [Scilit]
- Ohnaka, M. Earthquake source nucleation: A physical model for short-term precursors. Tectonophysics 1992, 211, 149–178. [Google Scholar] [CrossRef] [Scilit]
- Noor, U.A. Machine Learning Innovations in Revolutionizing Earthquake Engineering: A Review. Arch. Comput. Methods Eng. 2026, 33, 687–743. [Google Scholar] [CrossRef] [Scilit]
- Gürsoy, G.; Varol, A.; Nasab, A. Importance of Machine Learning and Deep Learning Algorithms in Earthquake Prediction: A Review. In Proceedings of the 2023 11th International Symposium on Digital Forensics and Security (ISDFS), Chattanooga, TN, USA, 11–12 May 2023. [Google Scholar] [CrossRef] [Scilit]
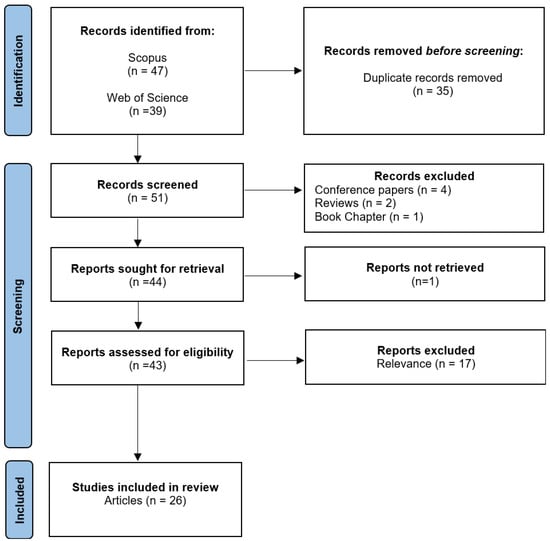
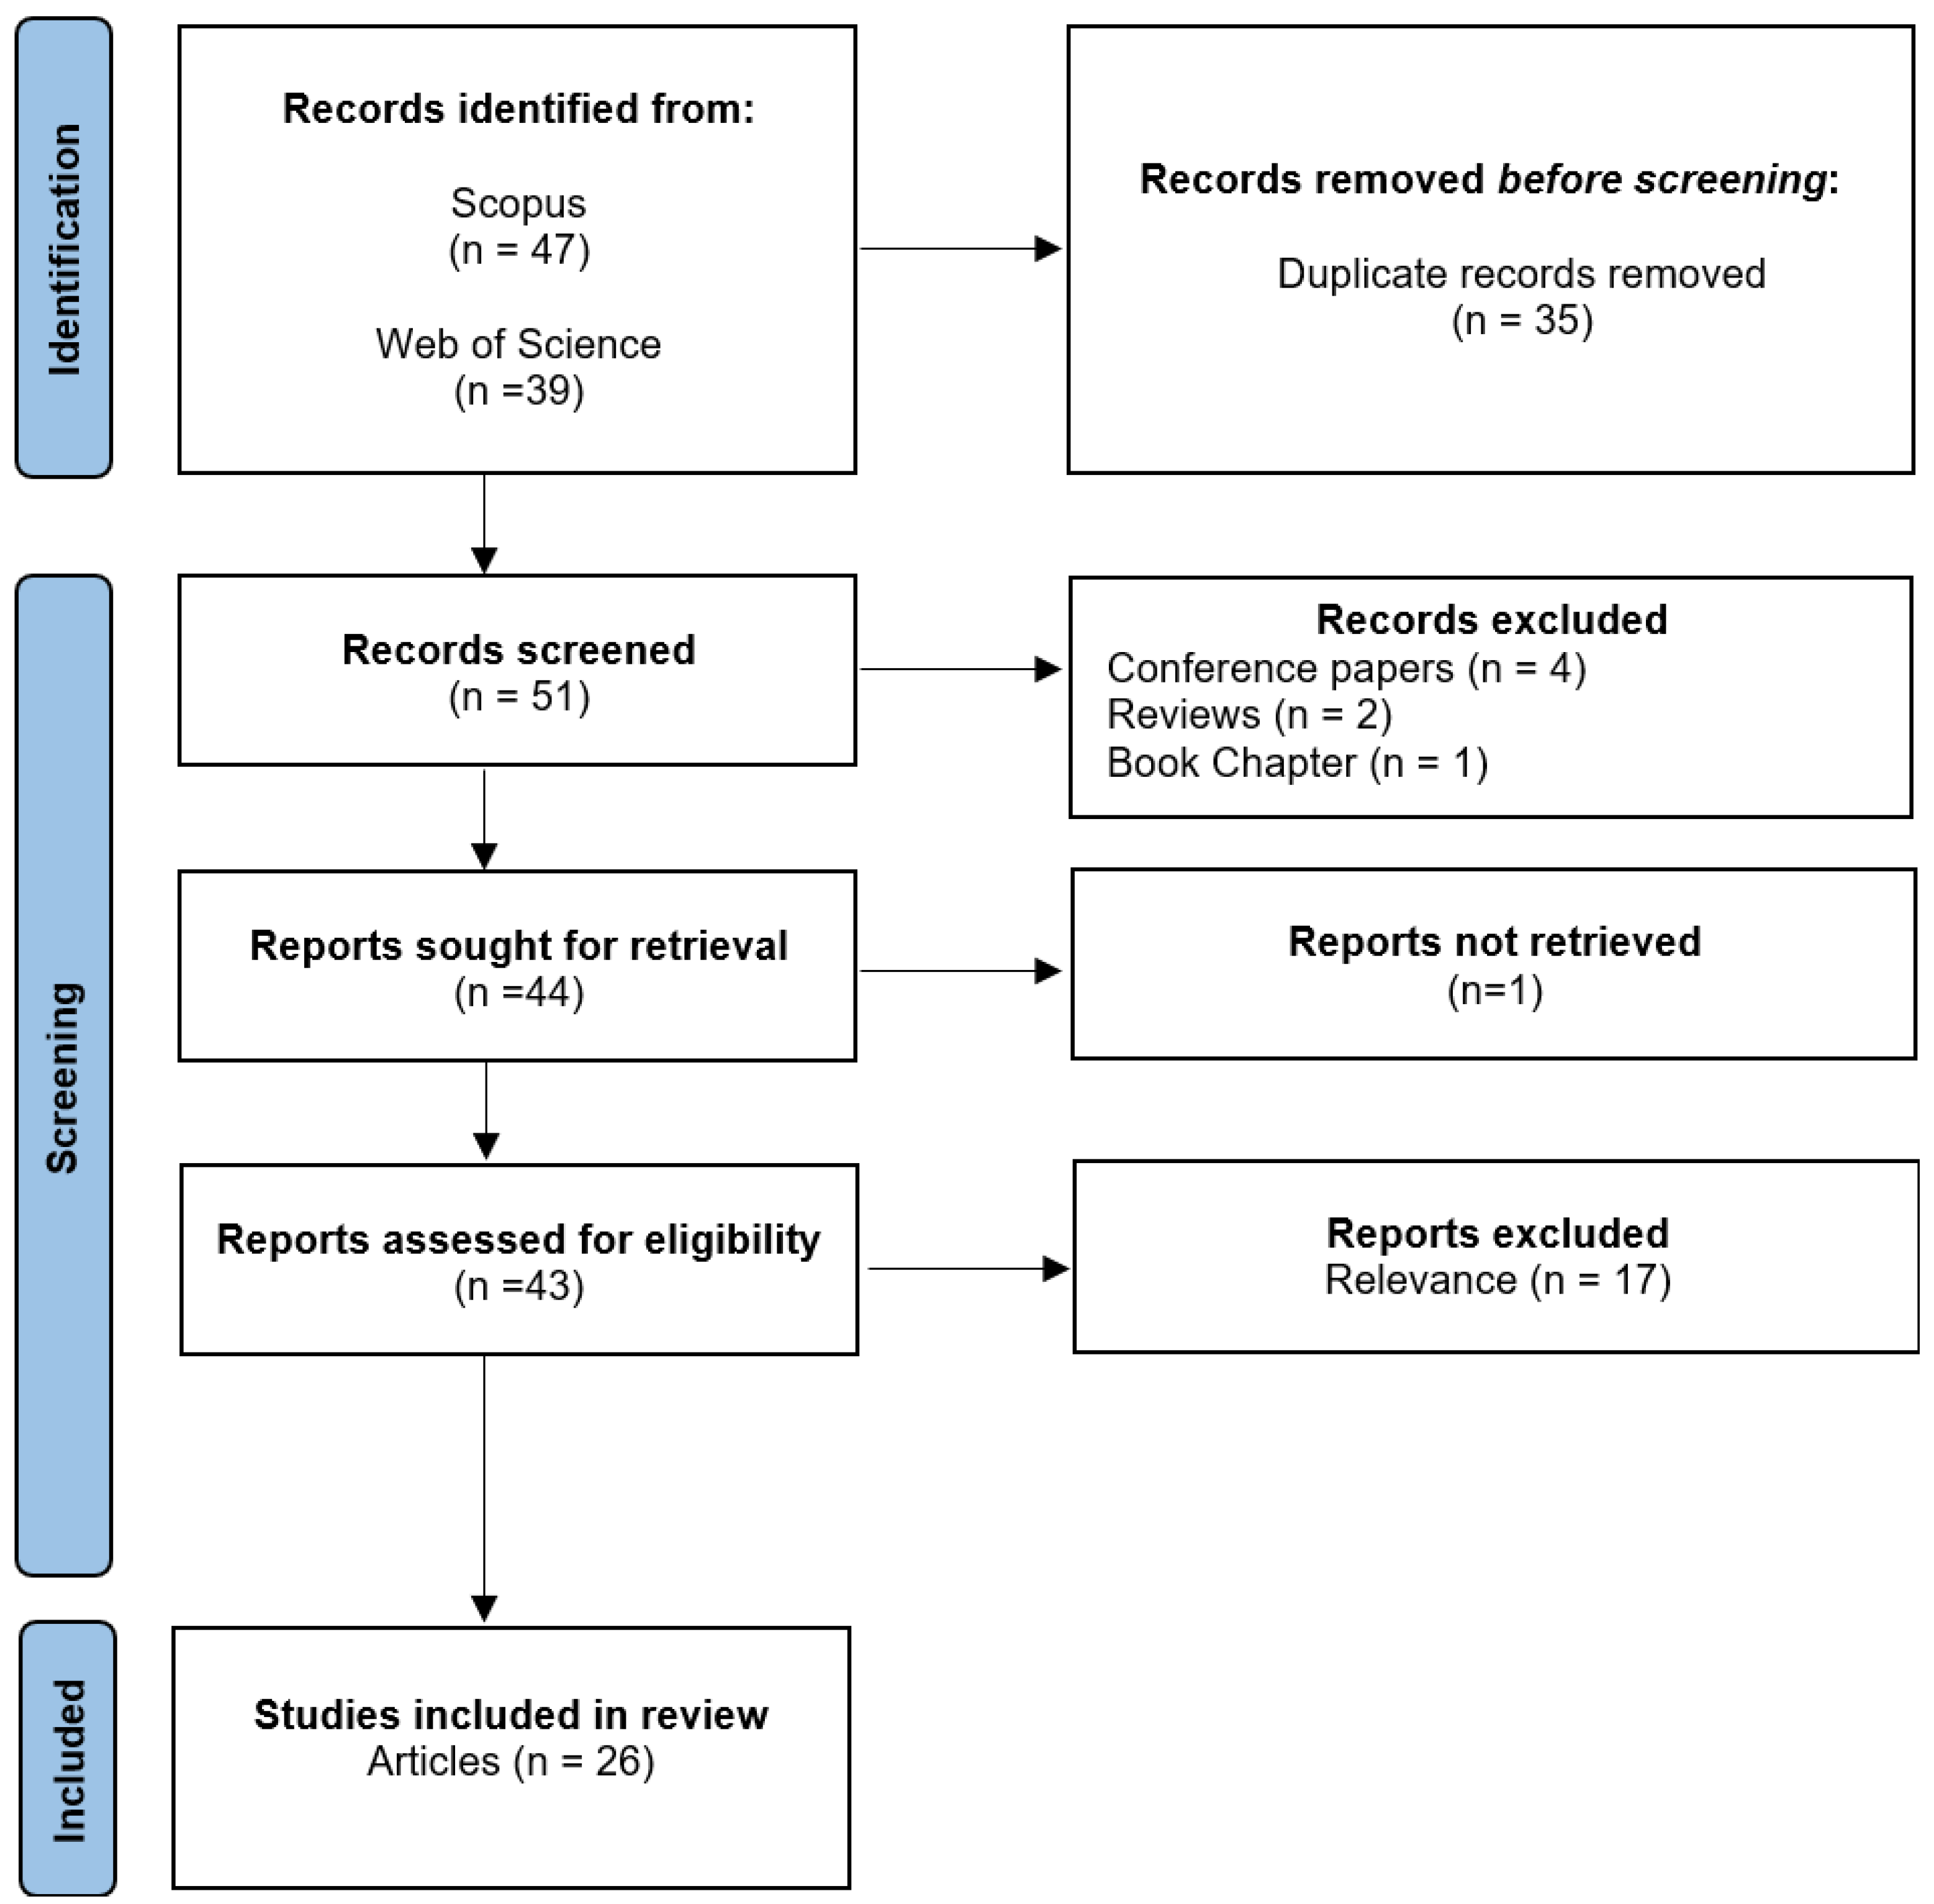
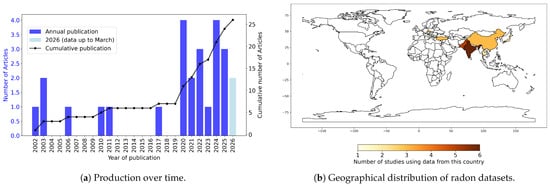
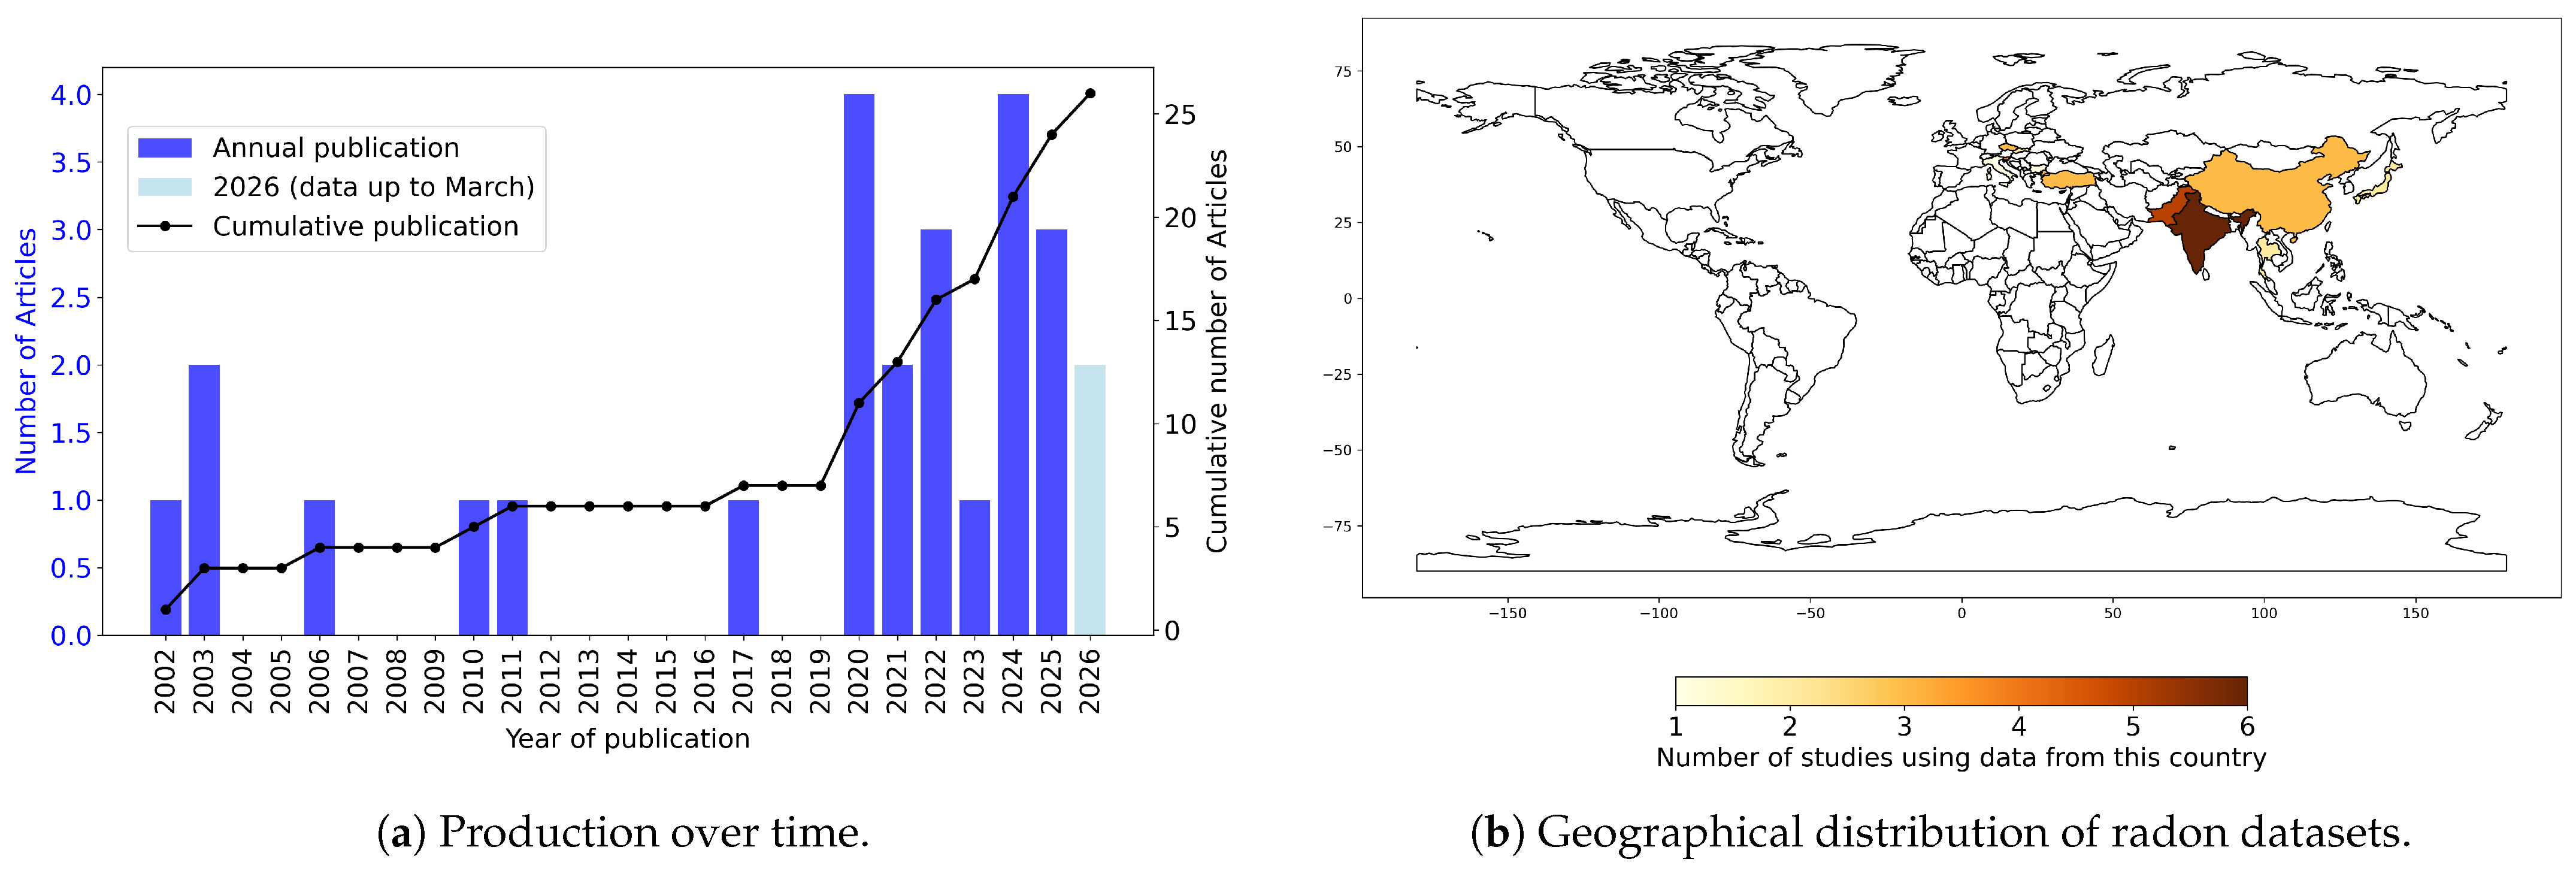
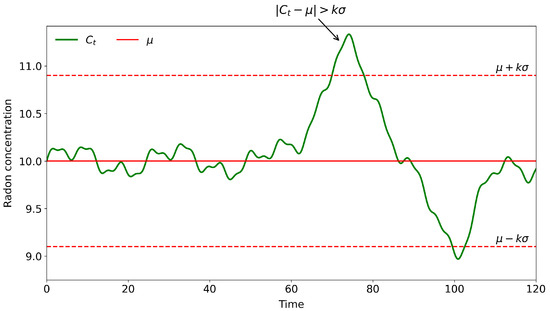
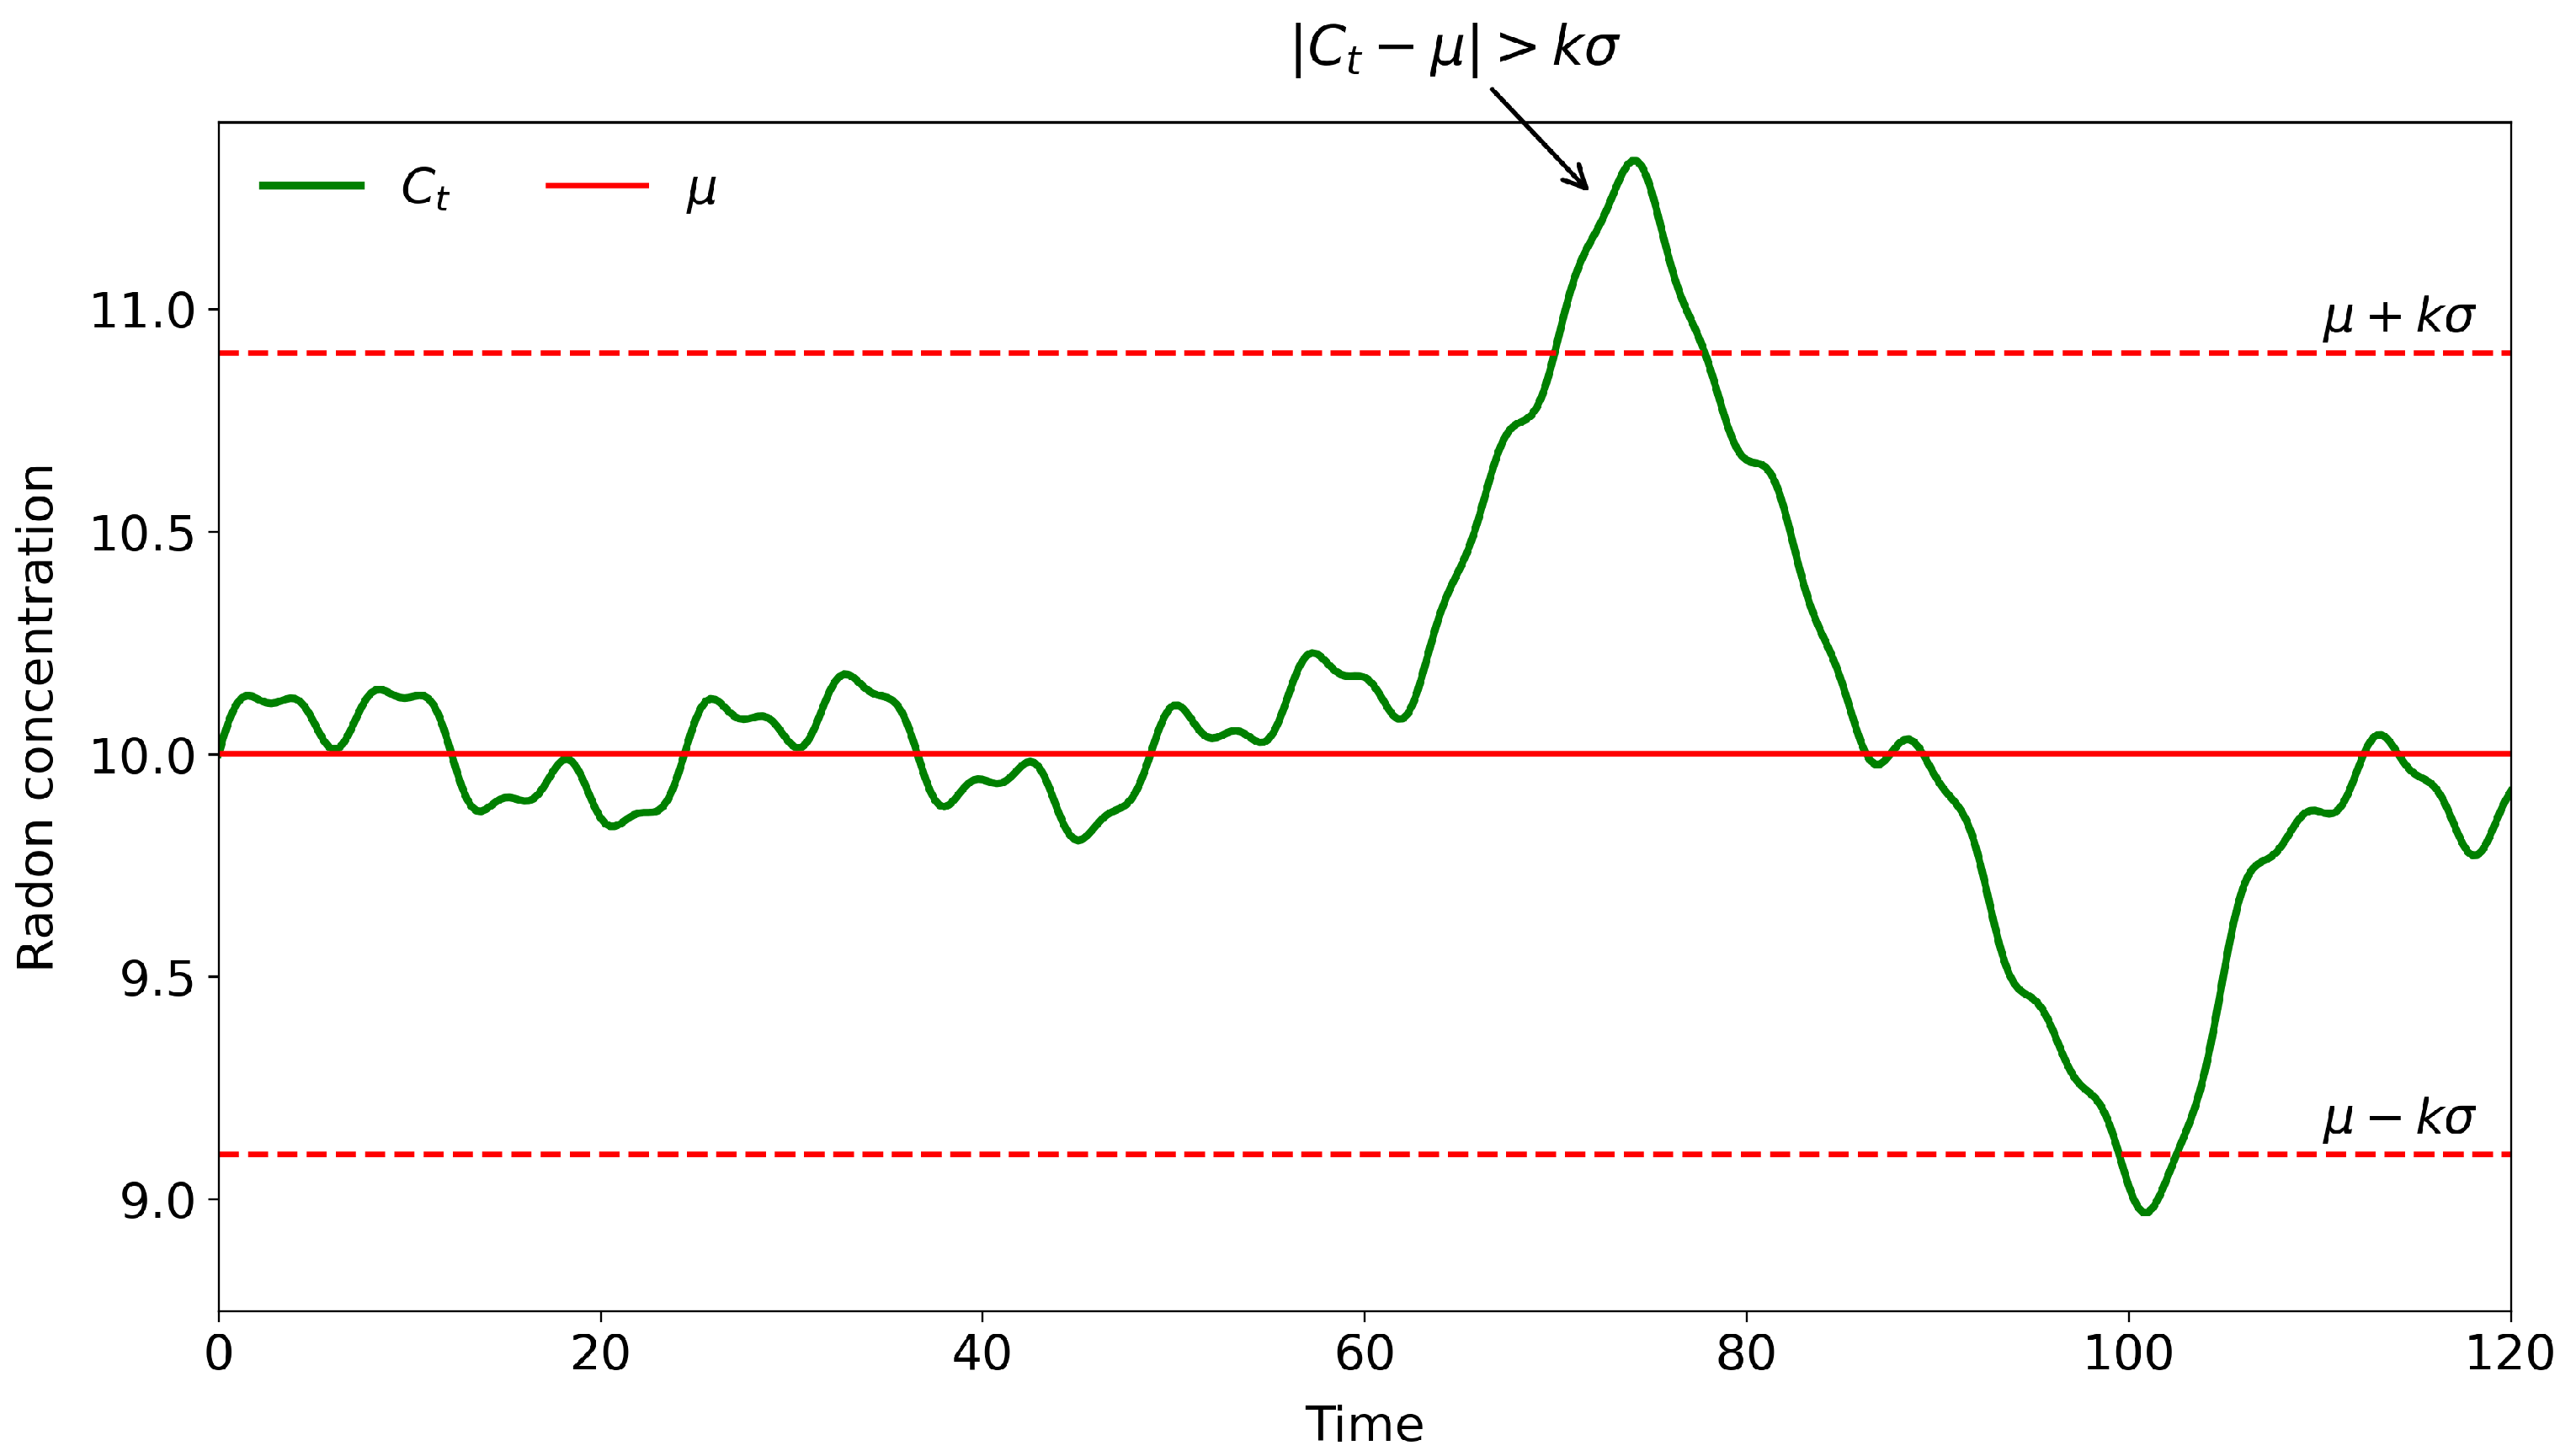
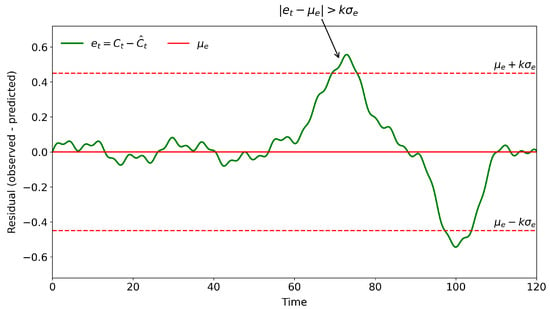
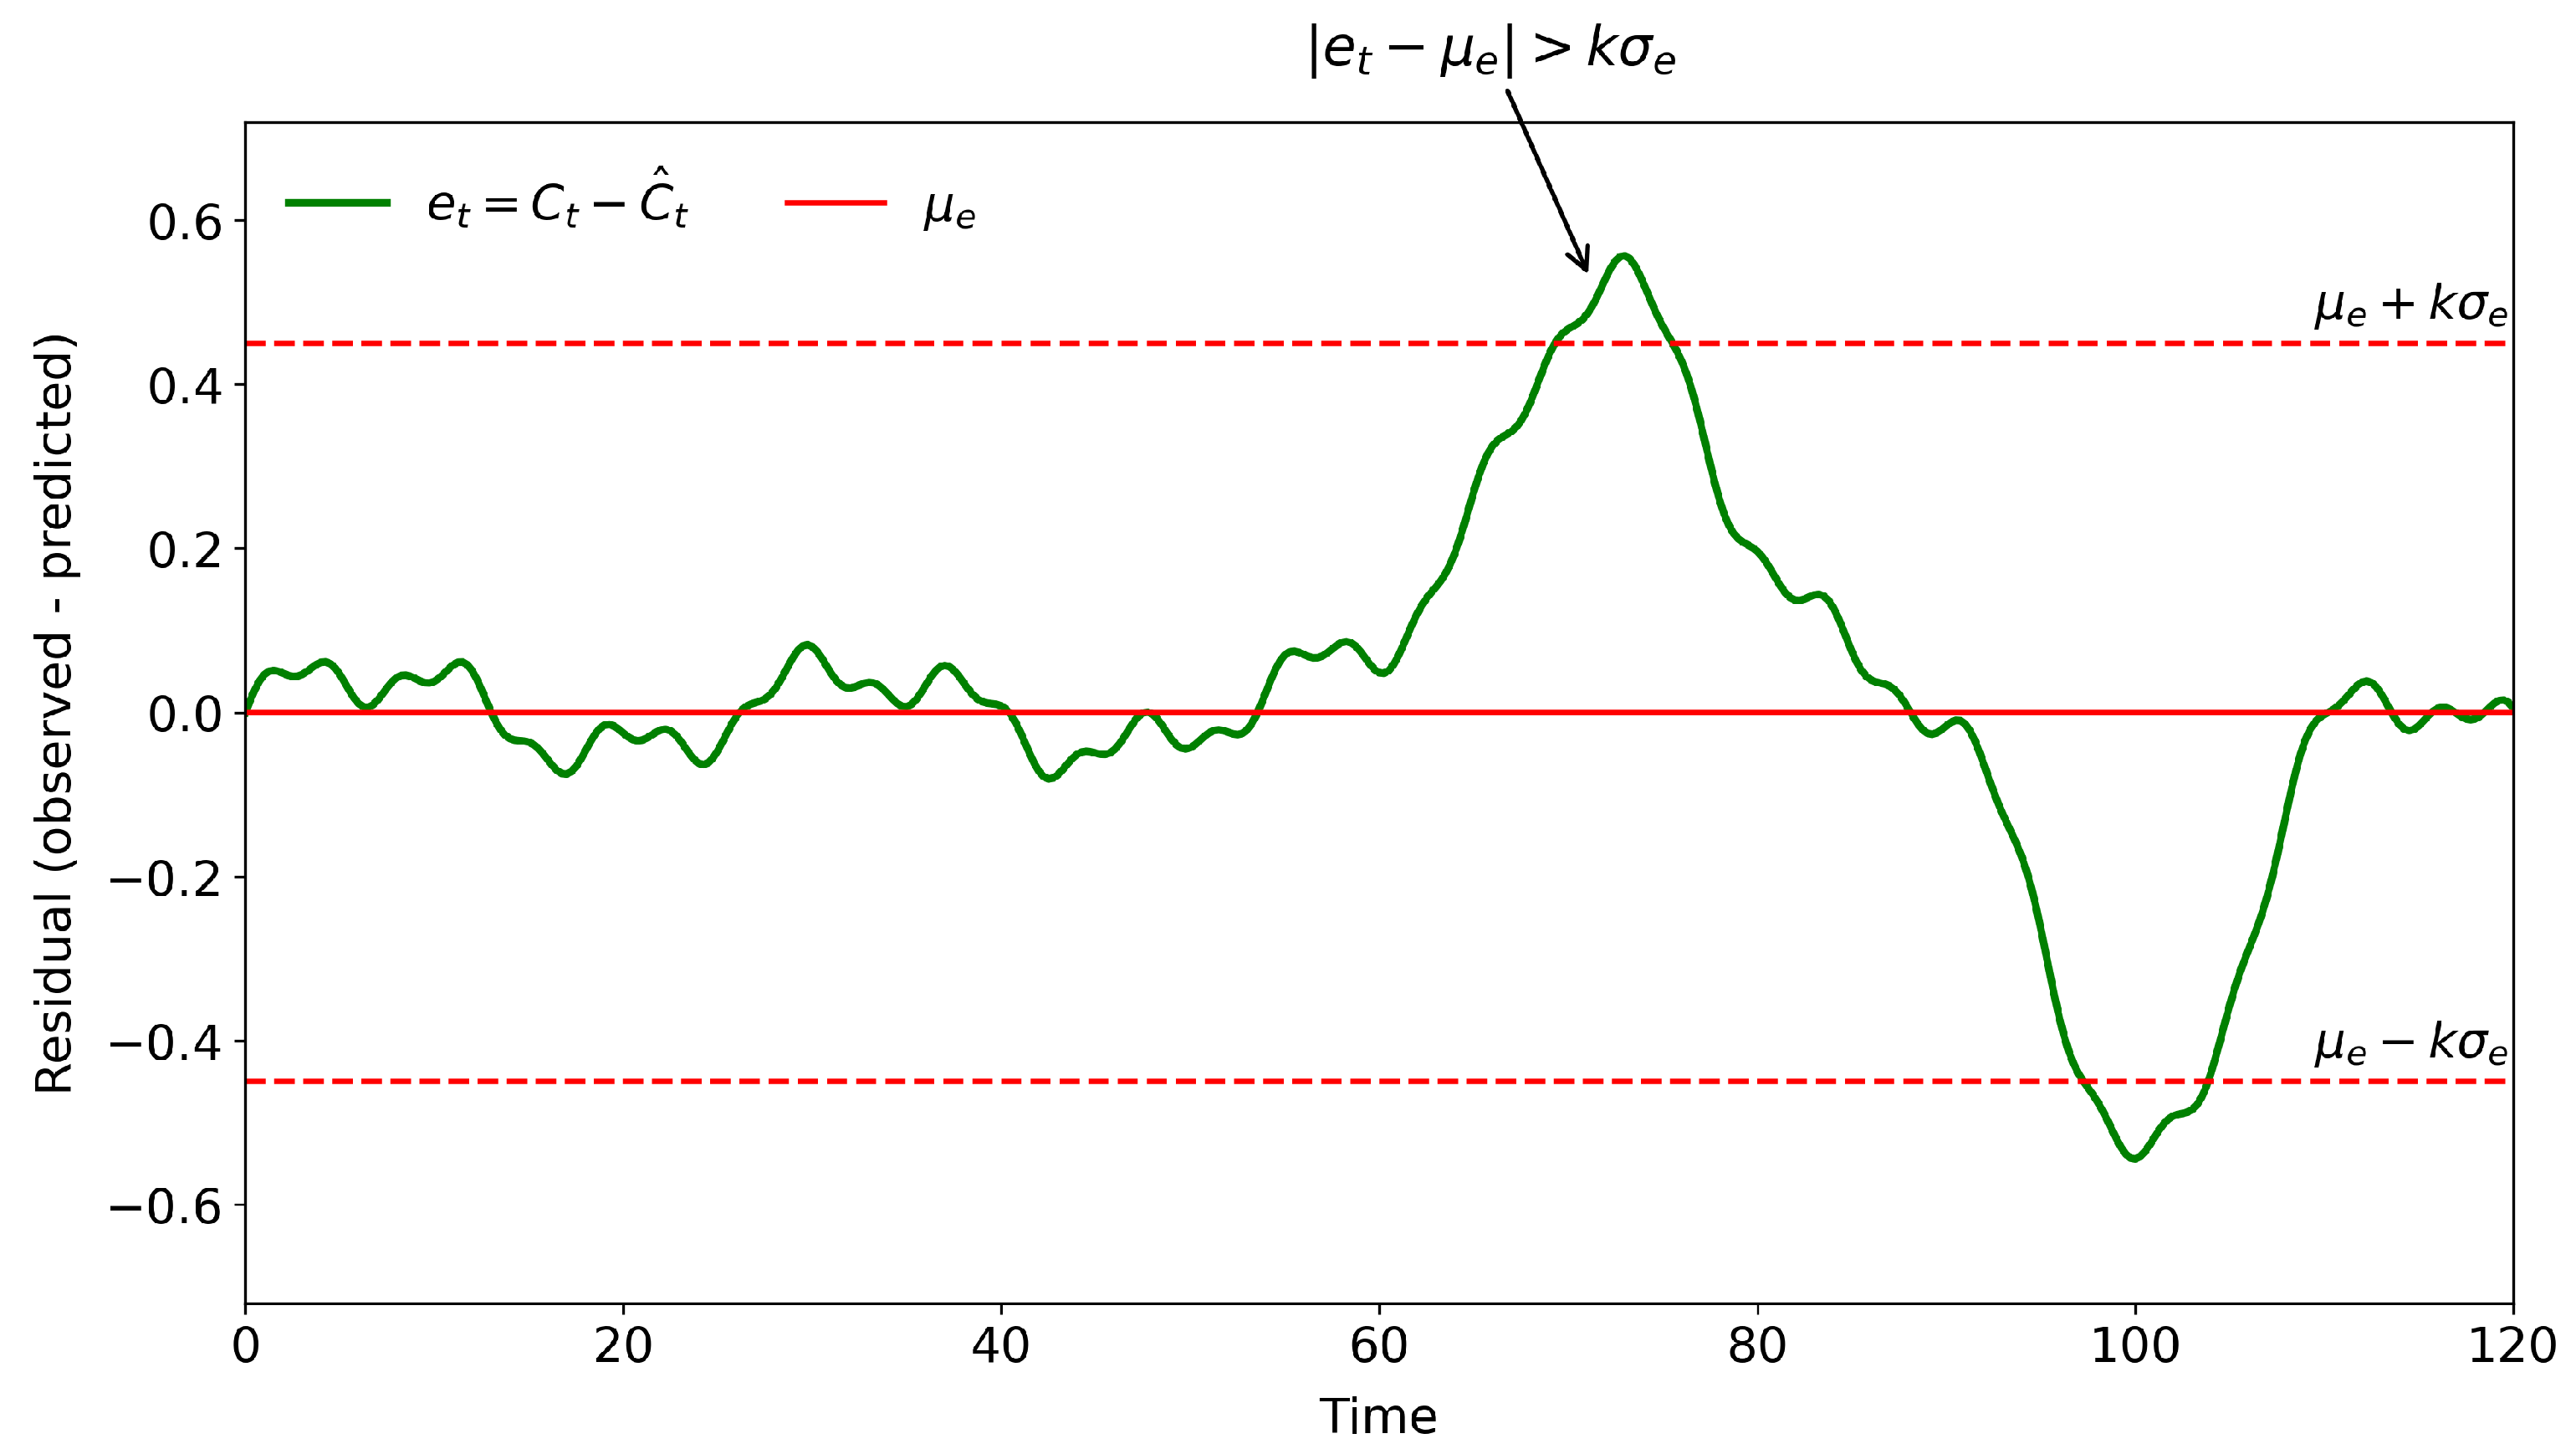
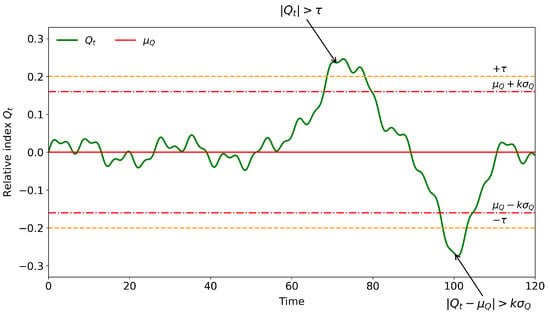
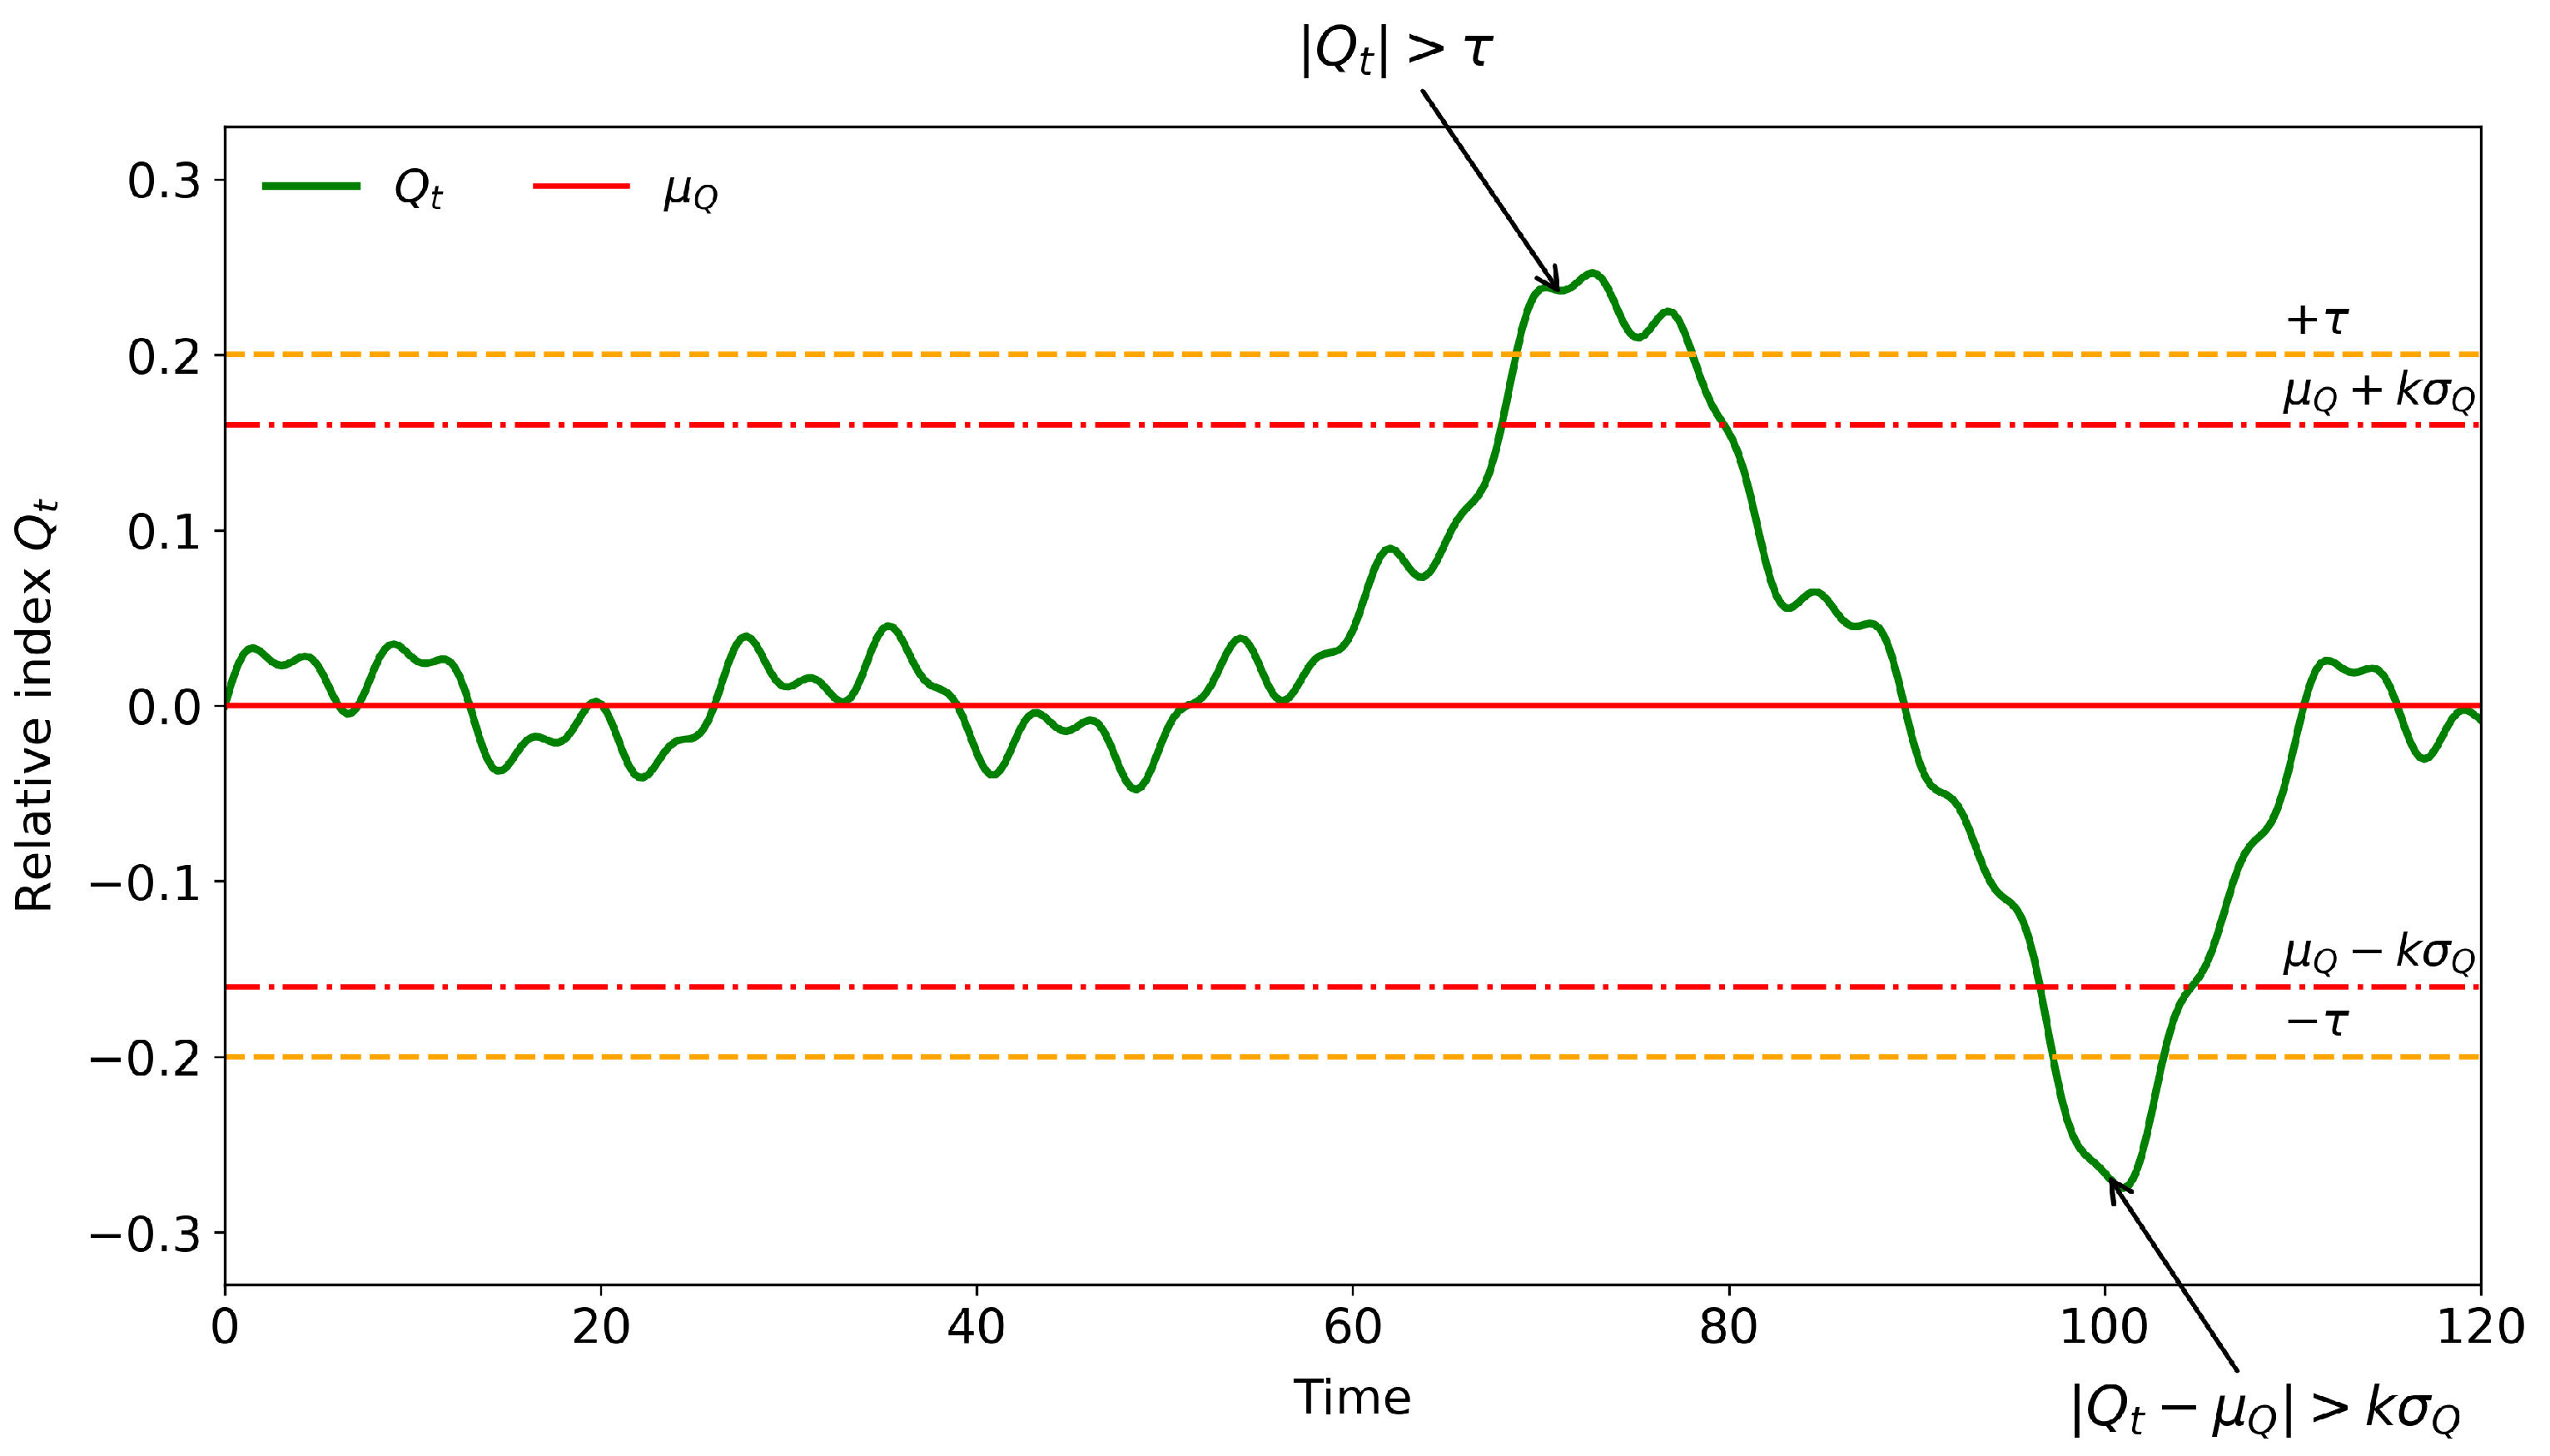
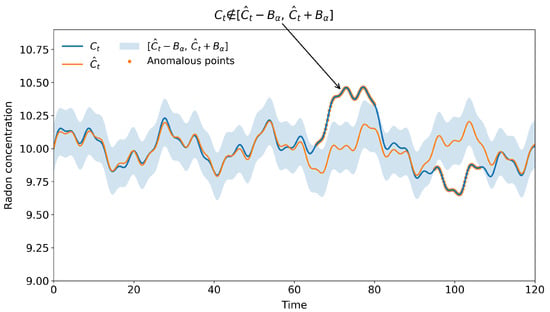
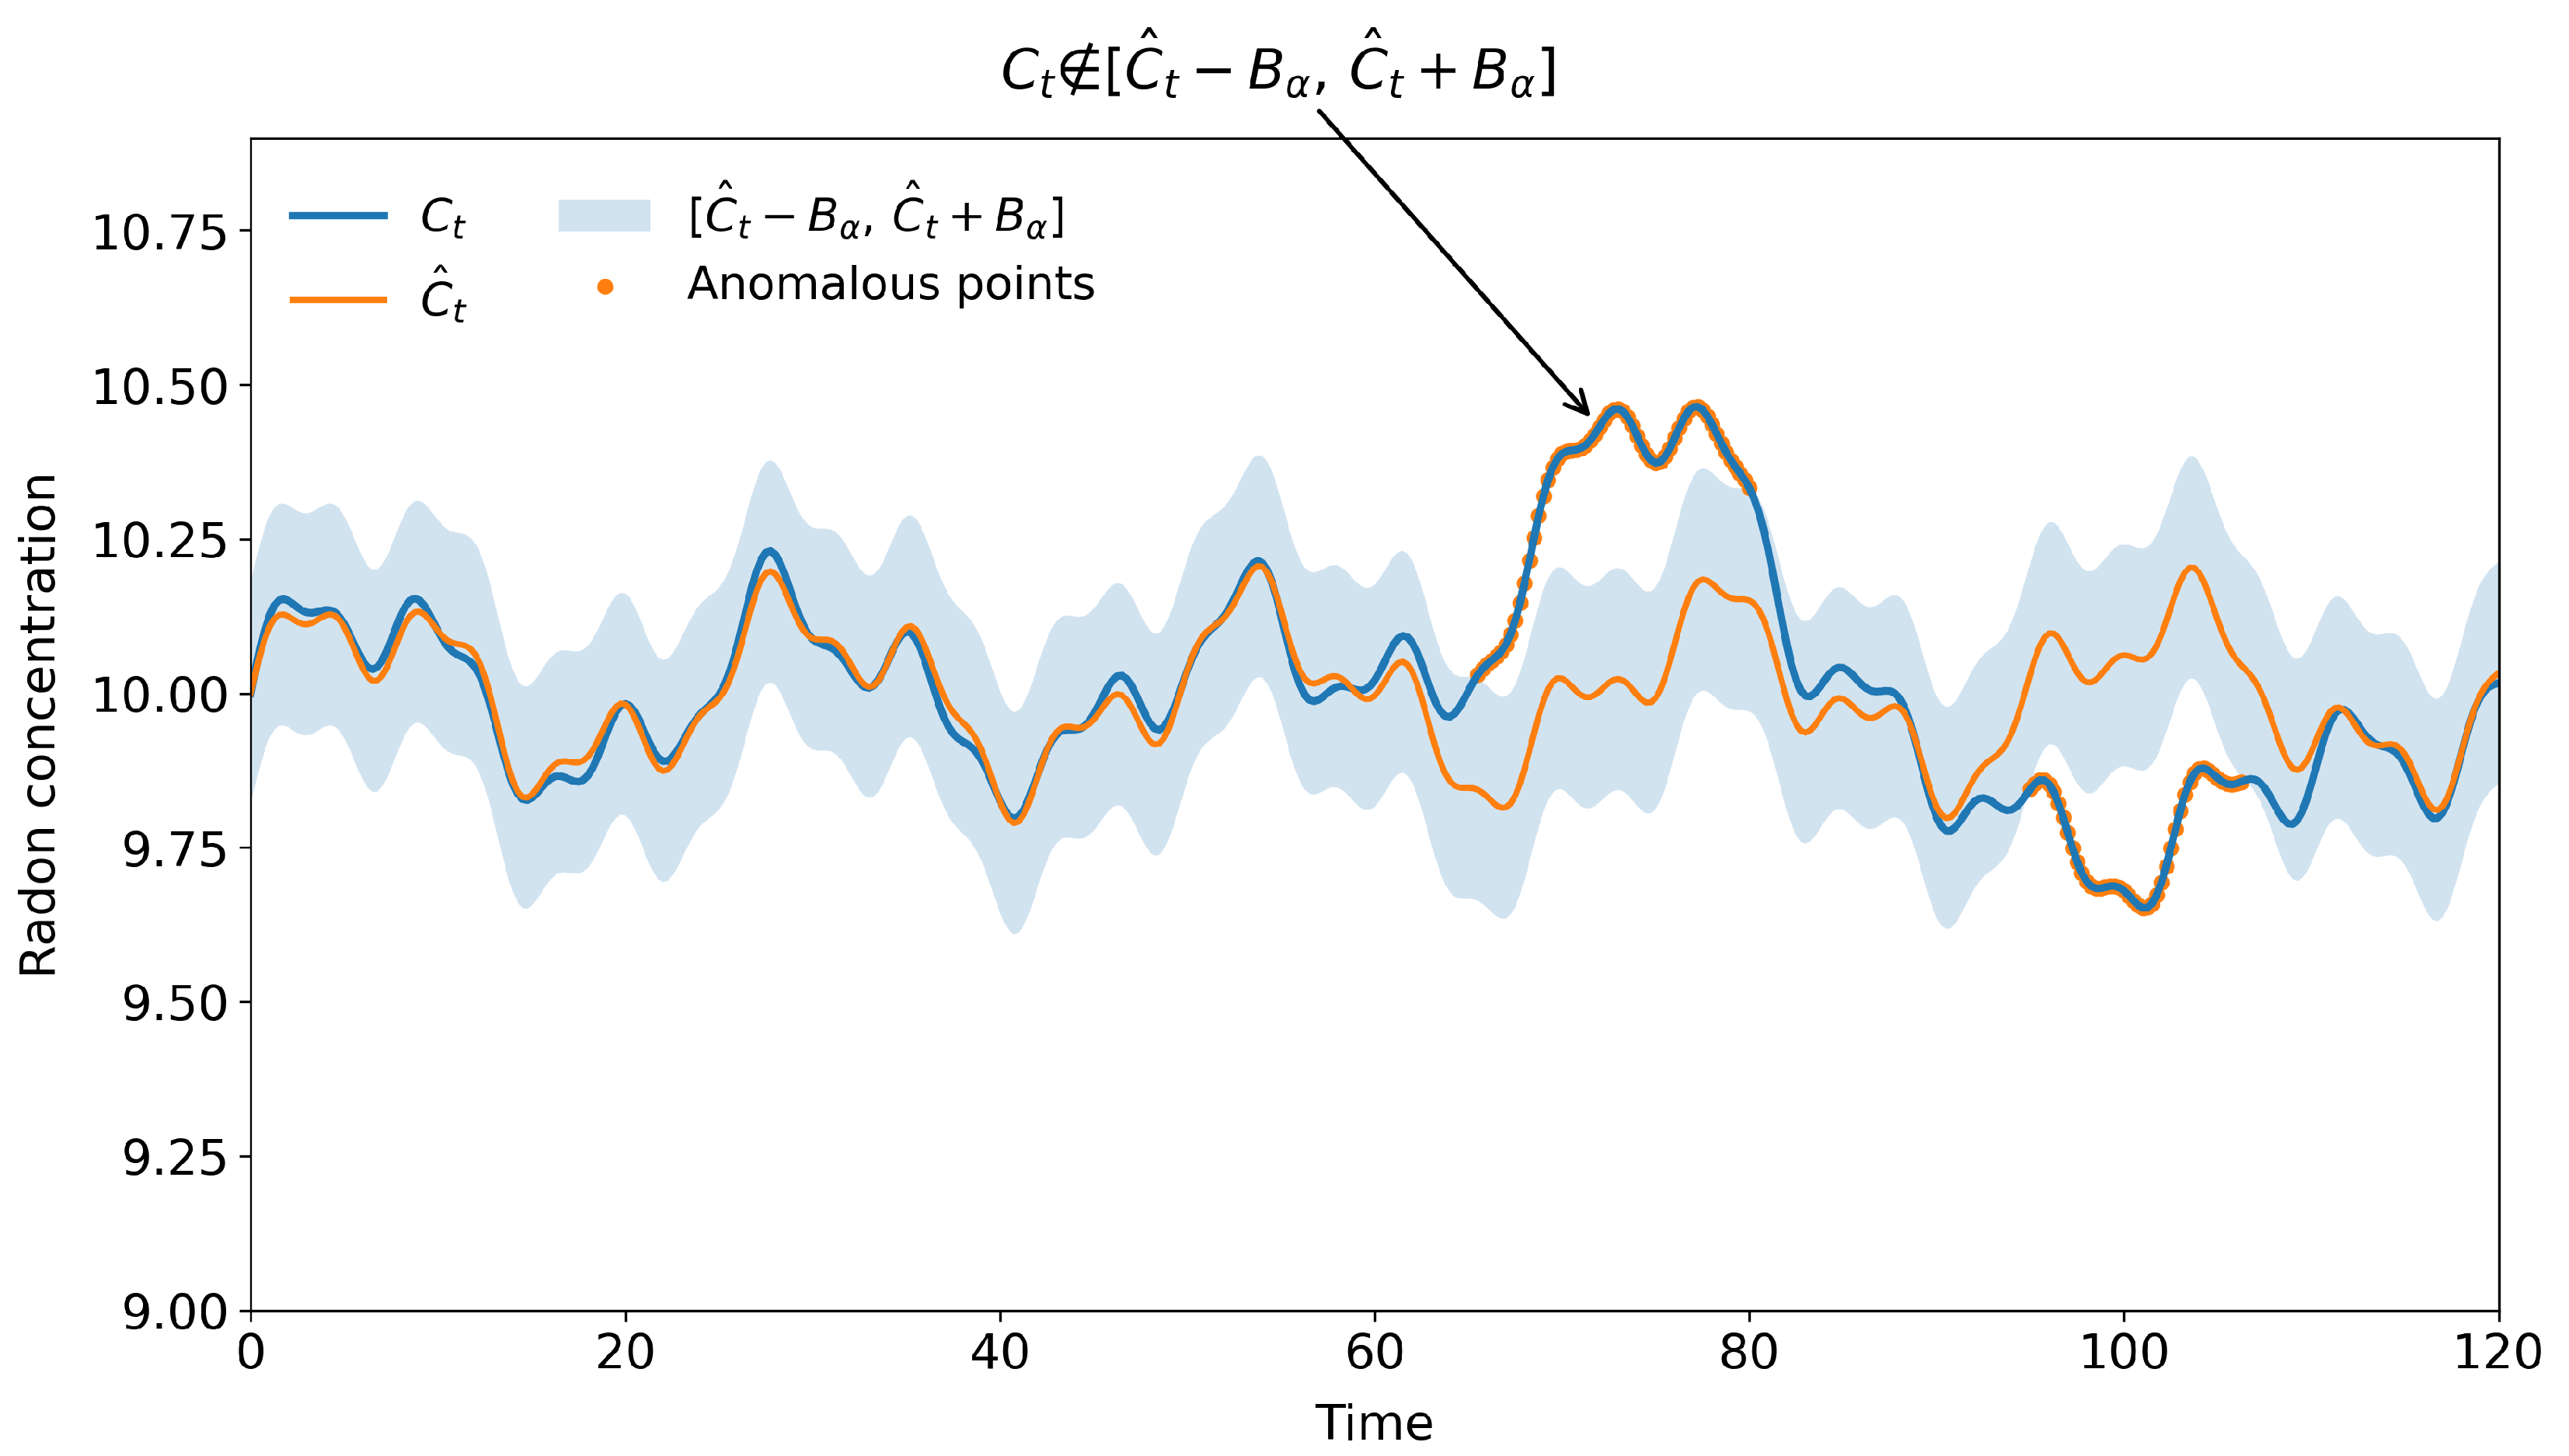
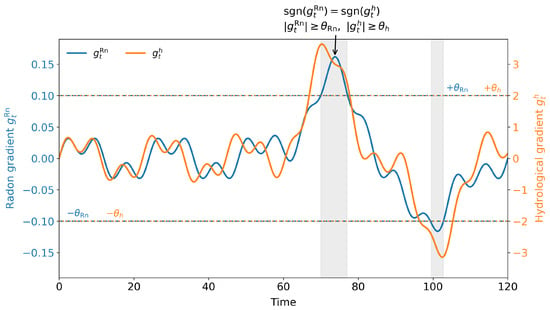

Disclaimer/Publisher’s Note: The statements, opinions and data contained in all publications are solely those of the individual author(s) and contributor(s) and not of MDPI and/or the editor(s). MDPI and/or the editor(s) disclaim responsibility for any injury to people or property resulting from any ideas, methods, instructions or products referred to in the content. |
© 2026 by the authors. Licensee MDPI, Basel, Switzerland. This article is an open access article distributed under the terms and conditions of the Creative Commons Attribution (CC BY) license.