


Abstract
Grain-size distributions of surface sediments provide indicators of sediment provenance and transport, and their comparison through time can reveal changes in the sedimentary organization at river mouths. This study analyzes 113 surface-sediment samples collected in April 2016 and April 2025 from the Day River mouth, southern Red River Delta, Vietnam, under the same seasonal regime at the end of the northeast monsoon. The datasets were collected before and after the construction of a mainland–Con Noi sandbar sea-crossing road and bridge and the subsequent appearance of a T-shaped spur dike system. Grain-size distributions were jointly analyzed using End-member Modelling Analysis (EMMA) and Grain-Size Trend Analysis (GSTA). Three end-members were consistently resolved in both datasets, explaining 86% and 91% of the total variance: EM1, medium silt (10.1–11.6 μm); EM2, very fine sand (88–101 μm); and EM3, fine sand (133–175 μm). EM1 is concentrated along the river channel, river mouth and northern nearshore zone, whereas EM3 is mainly distributed in the southern to southeastern offshore sector and EM2 occupies transitional zones. GSTA identifies two co-existing trends, FB- associated with finer-grained sediment trends and CB+ associated with the relative redistribution and accumulation of coarser material. Between 2016 and 2025, EM1 displayed a higher variance contribution in the 2025 dataset (43%) than in 2016 (35%), whereas EM3 displayed the opposite tendency (35% versus 45%); EM2 remained broadly similar (20–22%). However, statistical comparisons performed on paired stations and within the common sampling domain did not detect significant differences in the overall proportions of the end-members. In contrast, mapped distributions of the end-members revealed descriptive differences in their spatial organization between surveys. The FB- XOR CB+ representation further highlights a more spatially differentiated pattern in 2025, particularly around Con Noi and the southeastern offshore sector. These results suggest that the principal decadal evolution was expressed as a spatial reorganization of persistent sediment components and associated grain-size trend patterns, rather than as a statistically demonstrable change in their overall proportions or the emergence of a new sedimentary regime. The observed patterns are consistent with the combined influence of the fluvial sediment supply, tidal and wave processes, and southward residual longshore sediment transport. Coastal infrastructure constructed between the two surveys may have contributed to local sedimentary reorganization at the Day River mouth.
1. Introduction
The grain-size distribution, its statistical parameters and the shape of its frequency curves are among the fundamental transport fingerprint regime and the sorting processes acting within a specific depositional environment [1]. Sediments are generally mixtures of several populations with distinct sources and transport mechanisms [2], so classical Gaussian statistical descriptors based on the mean, sorting or skewness alone are often insufficient to decipher the underlying sedimentary processes [3].
Based on the premise that each sediment source bears a characteristic grain-size signature reflecting a specific transport regime, [3,4,5] proposed the End-member Modelling Analysis (EMMA) to infer sediment sources, transport mechanisms and depositional environments from grain-size distributions. Over more than 25 years of development, EMMA has been implemented on several computational platforms, including Fortran [3], MATLAB [6,7] and the R package EMMAgeo [8], and has been widely applied in sedimentological studies [6,9,10,11,12,13,14].
In parallel, Sediment Trend Analysis (STA) was proposed by McLaren (1981) [15] to predict sediment transport directions from the spatial variability of three grain-size parameters, namely, the mean grain size, sorting and skewness. According to this framework, sediments transported in relative low-energy environments tend to become finer, better sorted, and more negatively skewed relative to their source (case FB-), whereas case CB+ represents a complementary trend characterized by coarser, better sorted, and more positively skewed sediments under higher-energy conditions—these two being the most commonly encountered situations in natural systems [16]. Building on McLaren (1981) [15] and McLaren and Bowles (1985) [16], the methodology has been extended from one-dimensional [16]) to two-dimensional [17,18]. These latter have been critically reviewed and compared by several authors (Le Roux and Rojas, 2007 [19]; McLaren et al., 2007 [20]; Poizot et al., 2006, 2008 [21,22]). A key methodological advance was introduced by Poizot et al. (2006) [21], who used geostatistical analysis to objectively determine the characteristic distance Dg, replacing the fixed mean sampling distance Dcr used in Gao and Collins (1992) [17]. Poizot and Méar (2010) [23] subsequently developed the GiSedTrend plugin within a GIS environment, enabling the proper treatment of natural and anthropogenic morphological barriers during vector-field computation—a limitation of earlier GSTA versions. The tool has been successfully applied to various marine and coastal settings [12,14,24,25,26]. More recently, Baux et al. (2022) [27] extended the approach by using geochemical proxies such as TOC, Ca and Si into a GSTA* framework. Finally, Poizot et al. (2026) [14] developed a generalization of the GSTA approach, the Multi-proxy Sediment Trend Analysis (MSTA), and gave an application using end-member decomposition results.
A growing body of literature has demonstrated the high consistency between EMMA and GSTA in resolving the sediment provenance, transport mechanisms and dispersal trends, and the combined application of the two methods has become increasingly widespread [12,14,25,28,29,30,31,32]. In these studies, grain-size end-member modelling combined with GSTA has provided a more comprehensive understanding of sediment transport patterns and associated mechanisms, thereby facilitating more robust environmental interpretations.
The Day River mouth is a river-dominated estuarine–coastal system in the southern Red River Delta where the fluvial sediment supply interacts with tides, waves and longshore transport. Previous studies have documented substantial sediment redistribution in the Red River Delta and at the Day River mouth. In particular, previous work has identified southward residual longshore transport along the Red River Delta coast, with a net rate of about 150 × 103 m3 yr−1, associated with the predominance of winter-monsoon-driven southward transport [33]. Dinh Xuan Thanh et al. (2024) [34], using 42 surface-sediment samples and the McLaren and Bowles method, identified convergent transport pathways toward the central Day River mouth. These studies establish the importance of fluvial, tidal, wave and longshore processes, but they do not directly resolve how the sediment grain-size populations and their spatial transport organization changed over the 2016–2025 interval.
This temporal dimension is particularly relevant because the coastal configuration of the Day River mouth changed during the study period. The construction of a more than 6 km-long sea-crossing road and bridge connecting the mainland at Kim Dong to the Con Noi sandbar began in 2017 and was completed in 2020. A T-shaped spur dike system appeared in August 2021. The 2016 and 2025 surveys therefore provide two temporally separated snapshots of the surface-sediment field, both collected in April at the end of the northeast monsoon, before and after the formation of these new anthropogenic boundaries.
The key scientific question addressed here is not whether GSTA can identify sediment-transport trends, but whether the sedimentary system itself was reorganized over the decade. Specifically, we ask whether the fundamental grain-size components persisted between 2016 and 2025, whether their relative contributions and spatial distributions changed, and whether these changes were accompanied by a reorganization of the spatial relationship between fine-material and coarse-material trends. This distinction is important because a persistent set of end-members can coexist with substantial changes in their spatial partitioning and transport organization.
Accordingly, this study combines EMMA and GSTA for 36 surface-sediment samples collected in April 2016 and 77 samples collected in April 2025. The objectives are as follows: (1) to identify the principal grain-size end-members and compare their relative contributions between the two surveys; (2) to characterize the corresponding GSTA patterns; (3) to use the FB- XOR CB+ representation to examine the spatial partitioning of coexisting sedimentary trends; and (4) to evaluate the observed decadal reorganization in relation to the documented natural hydrodynamic setting and the newly established anthropogenic boundaries at Con Noi.
Over the world, the construction of modern roads has an effect on the ecosystem, resulting in significant changes [35,36]), e.g., in Russia, the Crimean Bridge in the Kerch Strait and large crossings around Vladivostok (like the Amur Bay Bridge and Golden Horn Bridge) have caused measurable local ecosystem changes through intensive coastal modification, altered water exchange, and the changing biodiversity of seabed habitats [37]). Although the construction of bridges and roads across bays and straits inevitably alters the natural environment, over time, these engineering constructions can yield significant benefits for the local ecosystem. During the construction of large bridges across the bays, e.g., in the United States, China, or Peter the Great Bay in Vladivostok (Russia), ecologists often observe a localized increase in biodiversity.
2. Study Area
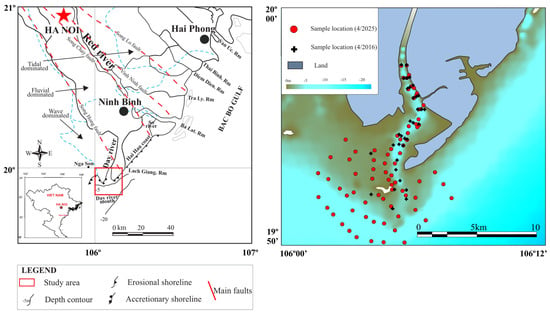
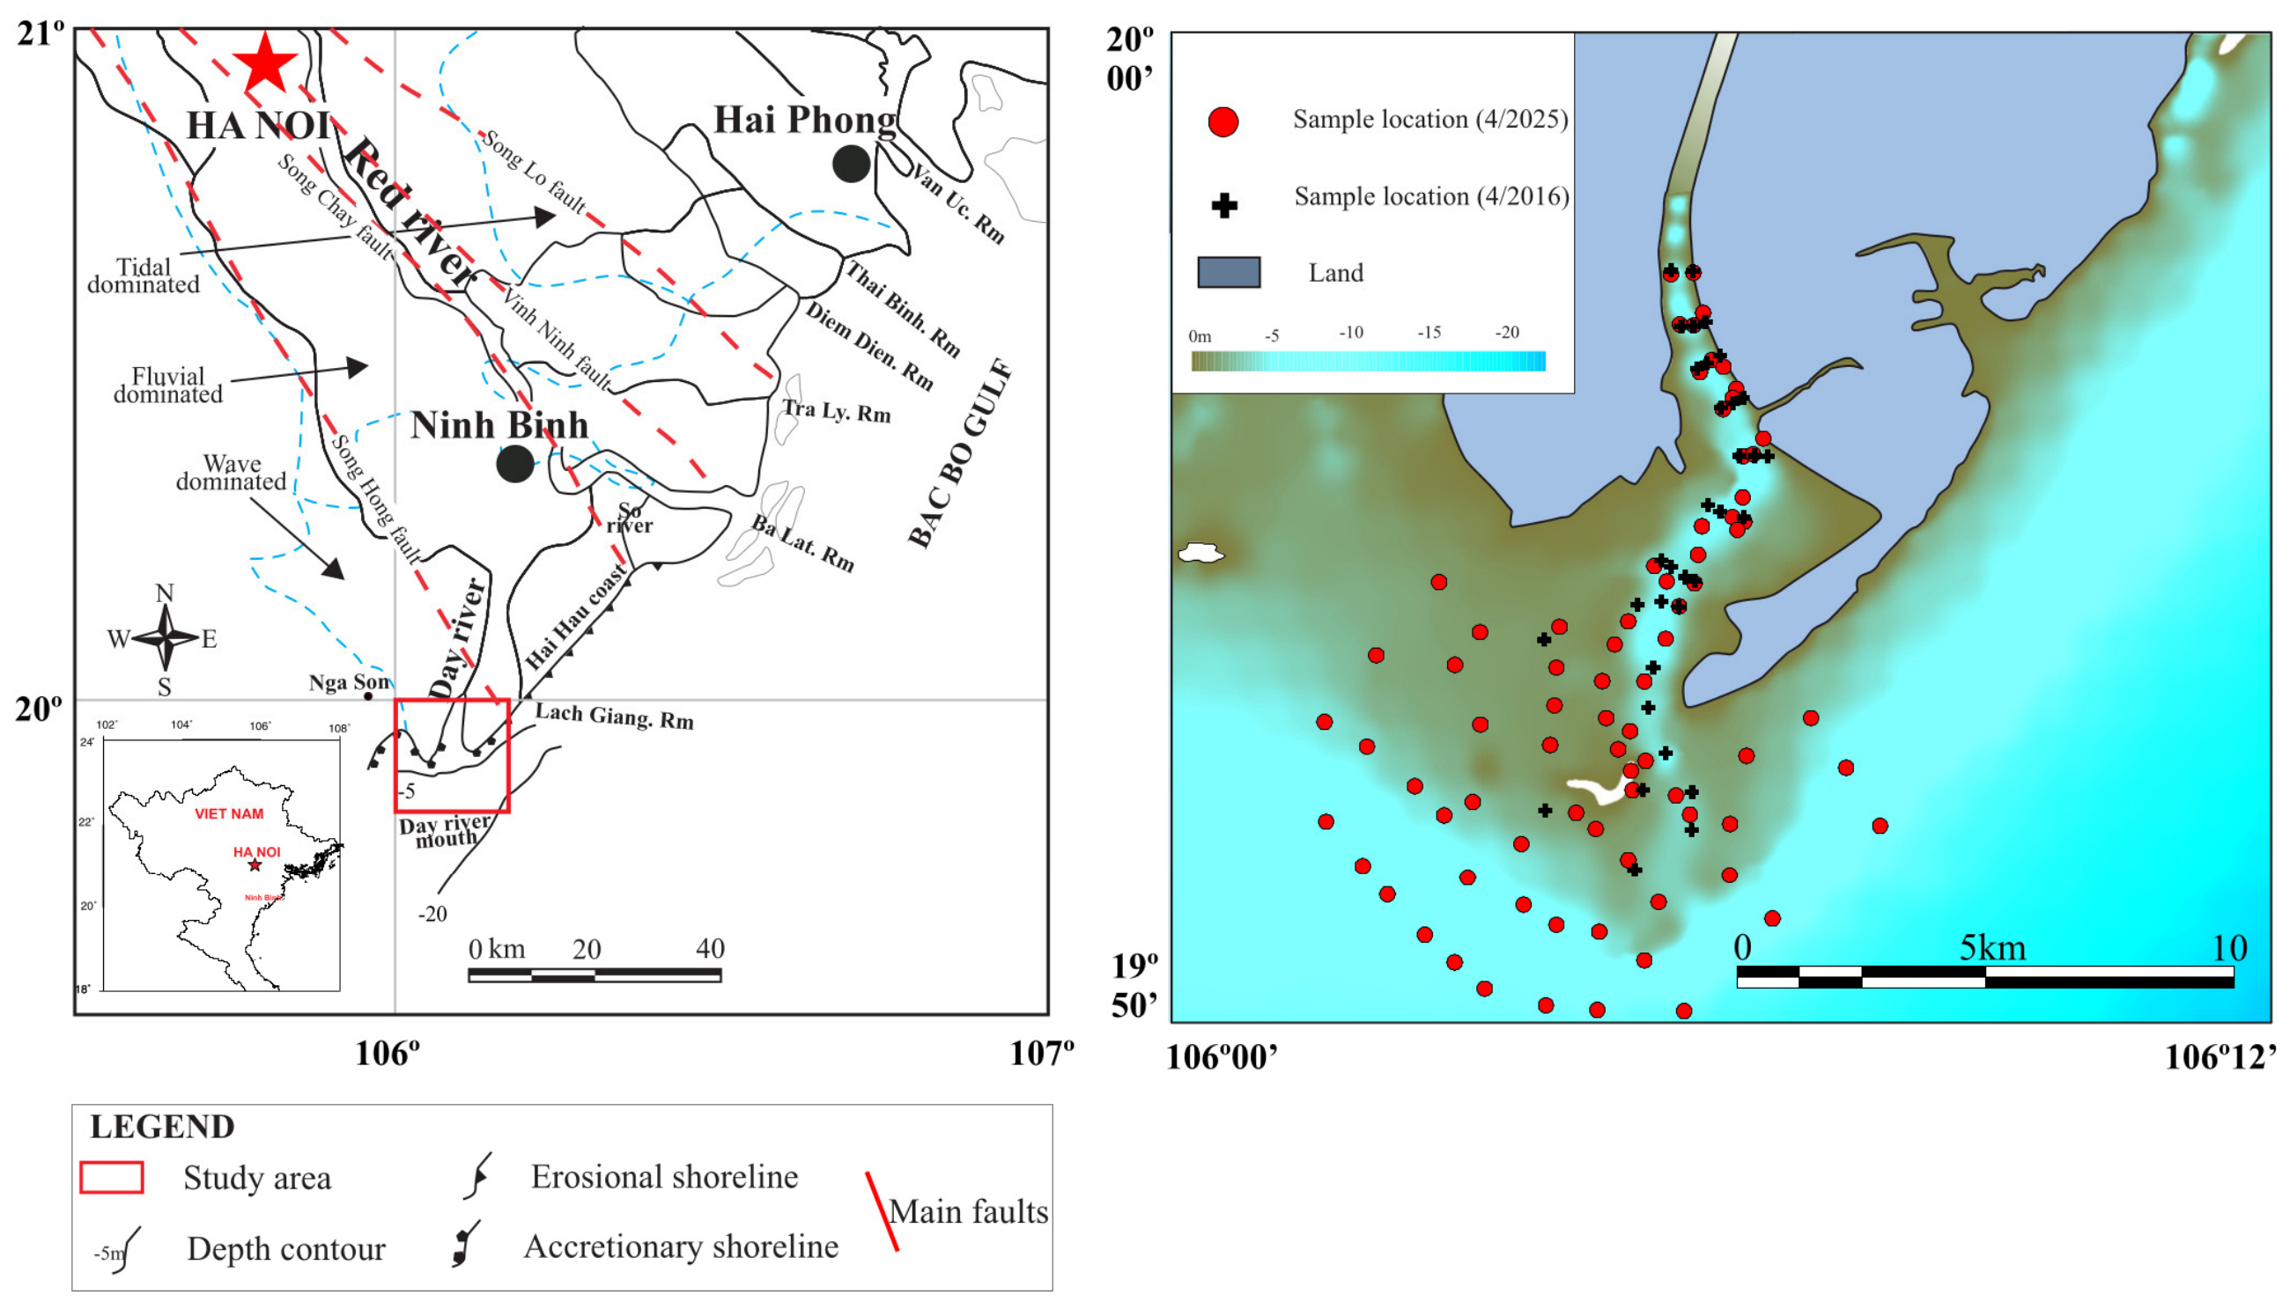
On the deltaic plain, the geological structural framework of the Song Hong sediment basin is governed by major regional tectonic fault systems trending NW–SE, including the Song Lo, Vinh Ninh, Song Chay, and Song Hong faults (Figure 1). In river-dominated deltaic systems such as the Red River delta, the massive input of fluvial sediments interacting with marine dynamics produces rapid and complex changes along the coast and in associated coastal ecosystems, particularly at river mouths. The Red River system delivers approximately 100 Mt of sediment to the sea annually through its main distributaries—Van Uc, Thai Binh, Diem Dien, Tra Ly, Ba Lat, Lach Giang and Day—with the Day River mouth accounting for about 19% of the total load [38,39]. The river mouth is located within a concave shoreline segment and is thus relatively sheltered from direct wave exposure, further enhancing depositional conditions (Figure 1).
Figure 1.
Map of the study area showing surface-sediment sampling sites. Eroding and accreting coastal segments are delineated after Duc et al. (2007) [40]. Dashed lines mark the boundaries of delta domains influenced by fluvial, tidal and wave processes according to Mathers and Zalasiewicz (1999) [41]. Main faults are identified according to Fyhn et al. (2019) [42].
The Day River mouth is located in the southern part of the Red River delta and shares the general characteristics of this system. From a geomorphological standpoint, it is a wave-influenced area [41,43], with surface sediments dominated by sand, silty sand and silt [41]. The region experiences two distinct monsoon seasons: the northeast monsoon from October to April and the southwest monsoon from May to September. Wind-field data from stations around Hai Hau during the transitional months between the two seasons show a pronounced topographic control [44]. The wind regime in the study area is characterized using observational data from the Bach Long Vi meteorological station in the Gulf of Tonkin. Previous studies based on wind records covering the periods 1975–1995 [45,46], 1976–1996 [47], and 2005–2023 [48] indicate that the regional monsoon regime has maintained relatively stable characteristics over several decades. Notably, the 2005–2023 dataset encompasses the 2016 survey period and extends close to the 2025 survey period, providing a basis for considering both surveys within the context of a relatively stable regional monsoon regime. The Day River mouth area exhibits an irregular diurnal tidal regime with a maximum tidal range of 2.0–2.5 m and an average range of about 1.4 m.
Longshore sediment fluxes, computed using energy-based formulations (CERS, Queens) and shear-stress-based approaches (the modified Peter–Meyer formula), indicate the following: (i) for the segment extending from the So River mouth to Lach Giang (Figure 1), sediment export exceeds input by about 600–800 × 103 m3yr−1, producing a negative sediment budget; and, (ii) along the southern shore of Lach Giang extending to Nga Son (southwest of the Day River mouth), sediment input exceeds export by about 700 × 103 m3yr−1 [49].
Despite the large volume of sediment discharged from the Day River, this area does not exhibit well-developed subaerial accretion features comparable to those at the Ba Lat, Tra Ly or Lach Giang mouths. In addition to fluvial inputs from the Day River, the area may also receive sediment supplied by the Red River system and redistributed alongshore from the northeast, particularly from the Ba Lat–Lach Giang coastal sector. Previous studies in the Red River delta indicate that the resultant annual longshore sediment transport is directed southwards, with an estimated net rate of about 150 × 103 m3yr−1. This southward residual transport reflects the predominance of winter-monsoon-driven sediment movement over the weaker northward component during summer [33]. This longshore flux is deflected by the seabed morphology and by the Day River discharge, resulting in nearshore deposition that fills the accommodation space between the mouth and the outer submarine bar. Consequently, the natural tidal flat at the Day River mouth has a large areal extent, with only a narrow separation between the inner flat and the outer submerged bar [50].
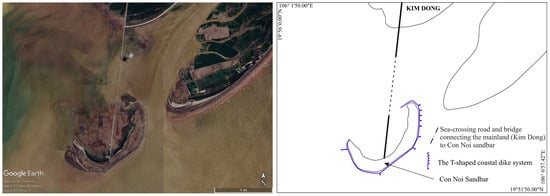
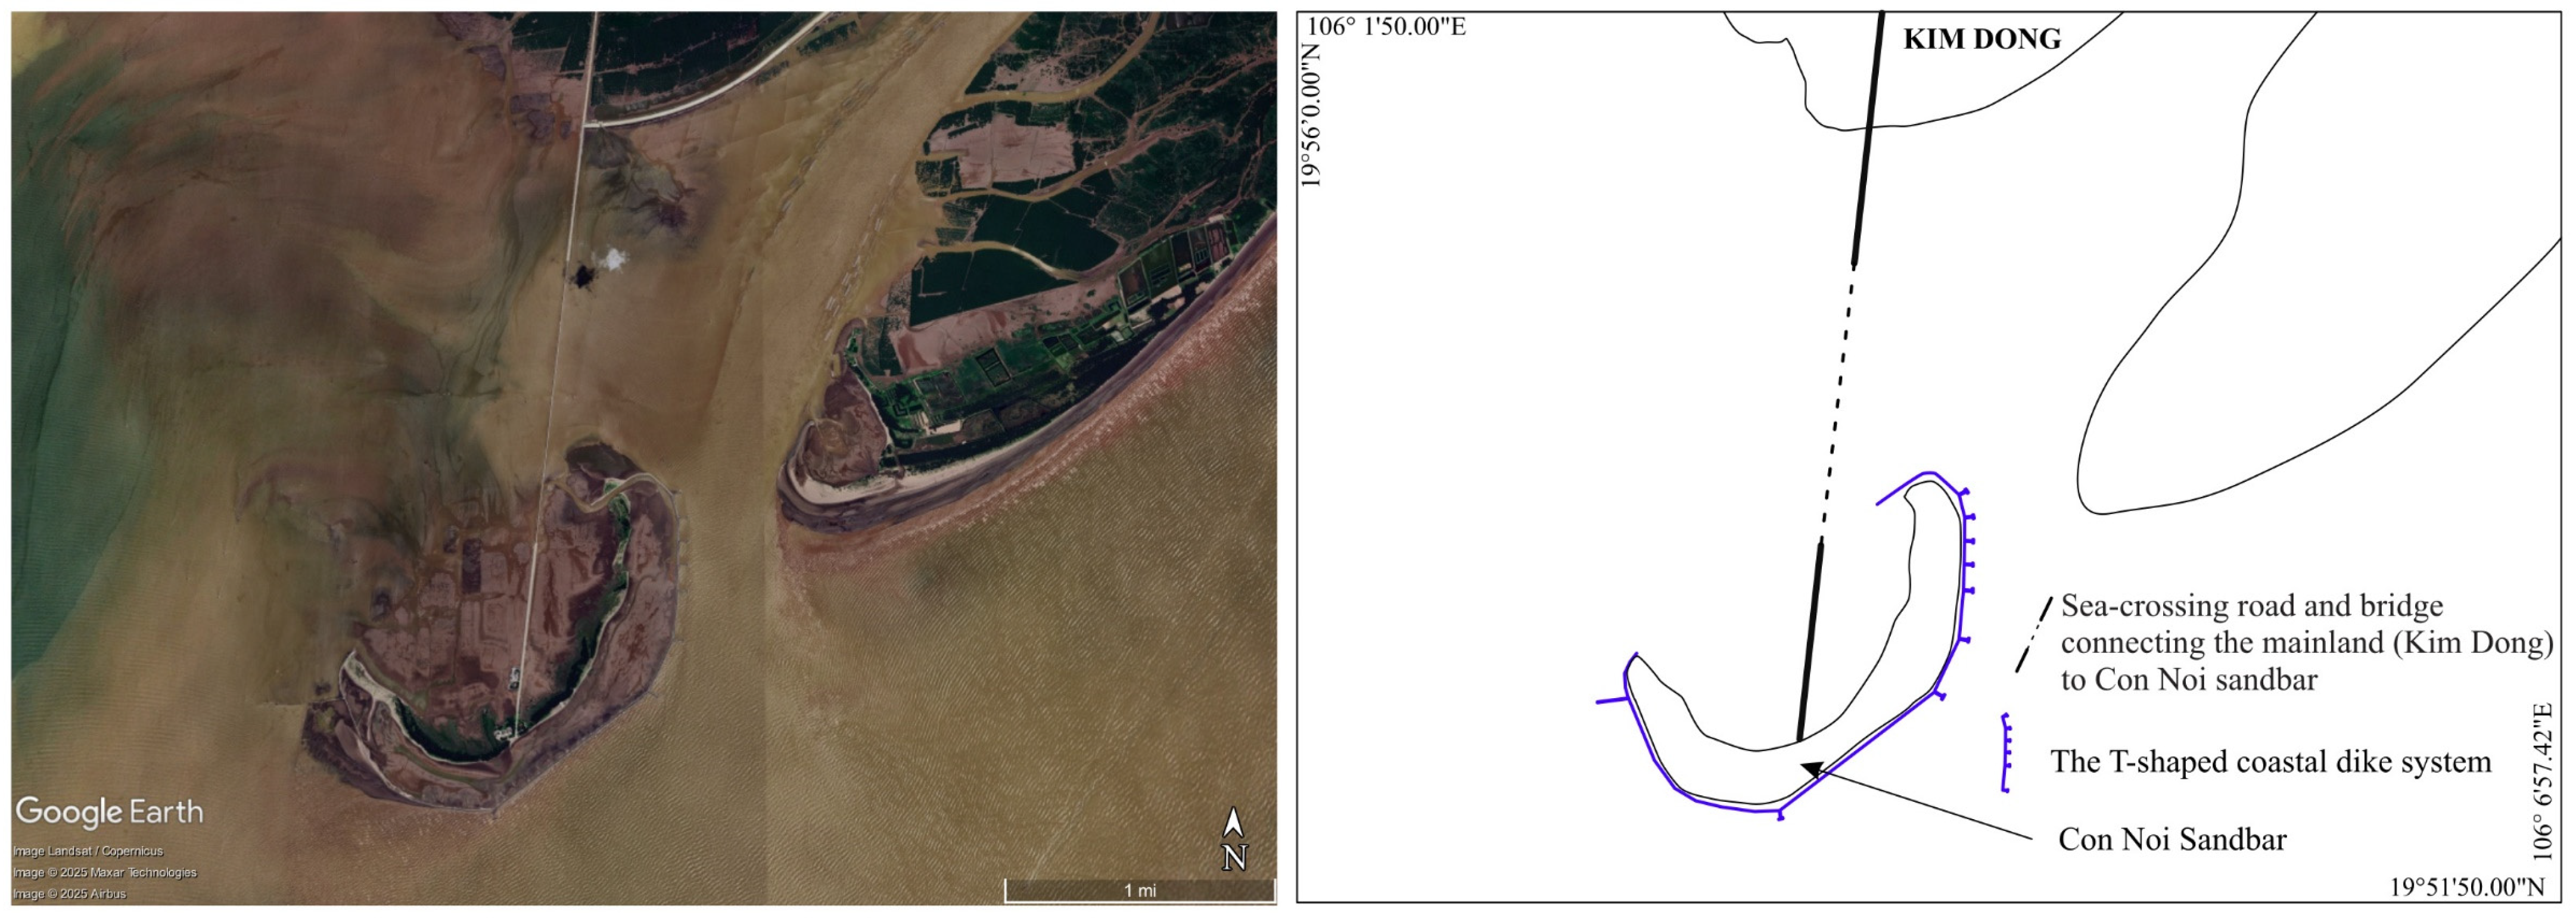
In 2017, the construction of a sea-crossing road and a bridge of more than 6 km long was started to connect the mainland (Kim Dong) to the Con Noi sandbar (Figure 2). These works were completed in 2020. Finally, to protect the side facing the open sea of the Con Noi sandbar, a T-shaped spur dike has been installed in August 2021 (Figure 2).
Figure 2.
Location of the sea-crossing road and bridge connecting the mainland to Con Noi sandbar and the surrounding T-shaped spur dike.
3. Materials and Methods
3.1. Sampling and Grain-Size Analysis
A total of 113 surface-sediment samples were collected from the Day River mouth during two field surveys, comprising 36 samples in April 2016 and 77 samples in April 2025 (Figure 1). Sediment accumulation rates in the tidal flats of the Day River mouth, determined using the radionuclides 210Pb and 226Ra, range from 0.14 to 0.64 cm/year [51]. These previously reported rates provide a reference for selecting the upper 0–10 cm sediment layer to characterize sedimentary properties integrated over multiyear to decadal timescales, although the actual period represented may vary depending on location and local depositional and erosional conditions. Sediment samples were collected using a Petersen grab sampler and stored in sealed plastic bags prior to laboratory analysis.
Grain-size analysis was performed at the Institute of Earth Sciences, Vietnam Academy of Science and Technology (VAST), using a Horiba LA-960 laser particle size analyzer with a measurement range of 0.01–5000 µm. Prior to measurement, hydrogen peroxide (H2O2) and hydrochloric acid (HCl) were used to remove organic matter and carbonate (CaCO3), respectively.
3.2. End-Member Modelling Analysis (EMMA) Method
EMMA is a multivariate statistical method that estimates the relative contribution of grain-size end-members based on the covariance of grain-size distributions, aiming to give a direct link between grain-size variability and the physical laws governing sediment production and transport [4,5].
The measured grain-size distributions were used as input to the EMMAgeo V0.9.8 model following the procedure of Dietze et al. (2012) [6] and Dietze and Dietzel (2019) [8]. The raw data were standardized and column-weighted to produce a weighted matrix W, with weights depending on the lower (l) and upper (100–l) percentile limits. Eigenvectors (V) and eigenvalues (Λ) were computed from the similarity matrix:
Γ = WT W
Then, a factor rotation is applied to simplify the matrix structure and to identify the optimal number of end-members through iterations. The eigenvector loadings were non-negativity-constrained, and the scores (M) were estimated by non-negative least squares (NNLS), representing the relative contribution of each end-member in each sample. The V and M matrices were then back-transformed to the original units and re-normalized to satisfy the constant-sum constraint, yielding the end-member loadings (V*) and scores (M*); the explained variance of each end-member was calculated relative to the total variance, reflecting the relative importance of involved sedimentary processes.
Model fit was assessed through the modelled dataset and the residual matrix:
using the row- and column-averaged coefficients of determination (r2) between X and X* [6].
X* = M*V*
E = X* − X
3.3. Grain-Size Trend Analysis (GSTA) Method
GSTA was implemented using the GiSedTrend GIS plugin V2.5 [23], which adopts the two-dimensional approach of Gao and Collins (1992) [17]. At each site, unit trend vectors are derived by comparing the three grain-size parameters (Md—mean grain size, So—sorting, Sk—skewness) with those of neighboring sites located within the characteristic distance Dg, objectively determined from geostatistical variogram analysis [21]. When several unit vectors coexist at a single site, a composite trend vector R is obtained by vector summation:
where n is the number of unit trend vectors r identified at the site.
Complementary to the AND and OR logical operators, XOR (eXclusive OR) has been added as a possible choice for trend case combinations. Gao and Collins (1992) [17] combined FB- and CB+ trend cases for their study: “FB- OR CB+”. With this latter combined trend case, a vector is defined when either FB- or CB+ is found between two sample locations. Studying, for example, the “FB- XOR CB+” trend case, a vector is defined between two sample locations through the following steps:
- (1)
- A separate vector summation is made for FB- and CB+ for all surrounding neighbor sample locations in Dg;
- (2)
- The modules of each resulting vector are compared, and the highest one is retained;
- (3)
- The angle and module of the chosen trend case are stored at the same time as its name.
The XOR operator aims to retain the most representative trend case of those studied at each sample location.
3.4. GIS Method
Kriging–Ordinary interpolation was used to estimate the spatial distribution of sediment parameters at unsampled locations based on their observed values at sampling stations. The interpolation procedure involved the following steps:
- (1)
- Data preparation: The sediment parameters were treated as random variables assumed to follow a normal distribution, using either their original values or logarithmically transformed values, as appropriate.
- (2)
- Semivariogram analysis and model selection: Experimental semivariograms were constructed to characterize the spatial variability of the sediment parameters as a function of the distance between sampling locations. Appropriate theoretical semivariogram models, including spherical, circular, Gaussian, and exponential models, were considered. The spherical model was selected for the interpolation, with the corresponding model parameters for the two datasets presented in Table 1.Table 1. Model parameters fitted on semivariograms of 2016 and 2025 datasets.
- (3)
- Spatial interpolation: Kriging–Ordinary interpolation was subsequently performed using the selected spherical semivariogram model to generate continuous spatial distribution maps of the sediment parameters.
4. Results
4.1. EMMA and Spatial Distribution of the End-Members
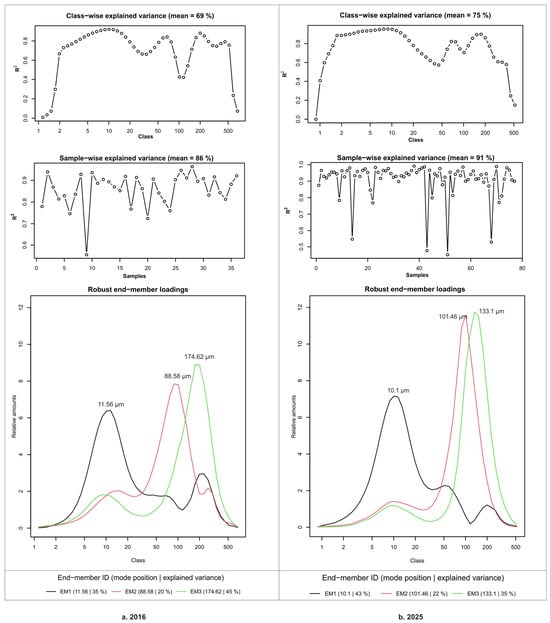
Figure 3a shows the default graphical output for the dataset of 2016, provided by EMMAgeo, for three end-members, with R2 values (squared Pearson correlation coefficients) organized by grain size class and a sample of 0.69 and 0.86, respectively. The mode position and explained variance for EM1–EM3 were 35%, 20% and 45%, respectively.
Figure 3.
End-member modelling results for the surface-sediment datasets of (a) 2016 and (b) 2025.
Figure 3b shows the default graphical output for the dataset of 2025, provided by EMMAgeo, for three end-members, with R2 values (squared Pearson correlation coefficients) organized by grain size class and a sample of 0.75 and 0.91, respectively. The mode position and explained variance for EM1–EM3 were 43%, 22% and 35%, respectively.
Each end-member exhibits a dominant mode and an approximately log-normal shape in its grain-size frequency curve. The modal grain size progressively increases from EM1 to EM3, reflecting a coarsening sequence. In the 2016 and 2025 datasets, respectively, EM1 peaks at 11.56 μm and 10.1 μm (medium silt), EM2 at 88.58 μm and 101.46 μm (very fine sand), and EM3 at 174.62 μm and 133.1 μm (fine sand). Secondary modes, when present, fall within the medium silt to fine sand range (Figure 3).
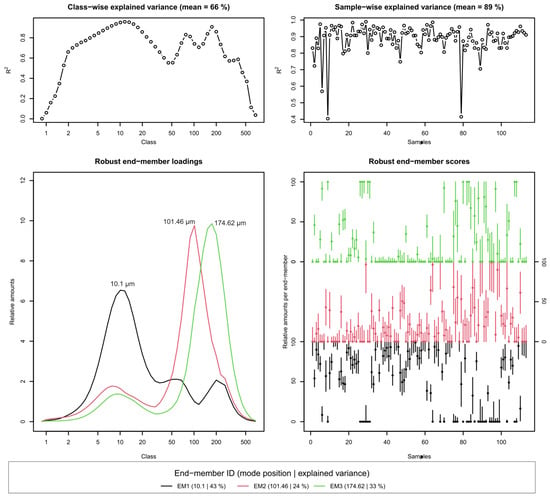
A joint EMMA was performed on the combined dataset of 113 surface-sediment samples collected in 2016 and 2025 (Figure 4). The joint analysis identified three robust end-members with modal grain sizes of 10.1, 101.46, and 174.62 µm, respectively. The contributions of these three end-members to the explained variance were 43%, 24%, and 33%, respectively, indicating a relatively well-defined three-component grain-size structure ranging from fine-grained material to fine sand. The overall model fit was high at the sample level, with a mean sample-wise R2 of 0.89 and a mean class-wise R2 of 0.66. Although a small number of individual samples showed a lower reconstruction performance, most samples exhibited a high proportion of explained variance. The identification of three distinct end-members when the two datasets were combined and analyzed within a single model suggests that the overall end-member structure was largely maintained.
Figure 4.
Joint EMMA of the combined 2016 and 2025 dataset, showing explained variance, robust end-member loadings, and end-member scores.
In addition, we have restricted the comparison to the sampling area common to both campaigns (33 stations in 2016, 46 in 2025) and to EM1 and EM3 end-members. Within this area, the average proportion of EM1 rose from 52.6 per cent to 59.4 per cent and that of EM3 fell from 26.8 per cent to 23.1 per cent (Table 2).
Table 2.
Mean end-members’ comparison between global and common areas of each dataset. n: numbers of points, EMs: end-members.
This initial analysis does not allow us to clearly determine whether the two datasets differ. We therefore supplemented the analysis with a paired comparison across 21 resampled stations: the mean difference between 2025 and 2016 is +10.4 percentage points for EM1 (95% CI: −1.7 to 22.5; p = 0.089) and −9.4 for EM3 (−24.9 to 6.1; p = 0.22) (Table 3). No difference was detected at the 5-percent significance level, but the small sample size limits the statistical power of the test; these results do not allow us to conclude either that the situation is stable or that it has changed.
Table 3.
Mean paired comparison tests of each end-member on common domain. Mean diff.: Average percentage change (positive = increase in 2025), 95% Conf.Int.: 95% confidence interval difference of datasets for each end-member (common domain), p_value: score of paired Student test, n: number of points.
We then estimated the difference in means between 2025 and 2016 for the common domain using bootstrapping (5000 resampling runs with replacement in each survey). The 95% confidence intervals include zero for all three poles: EM1, +6.8 points (−8.7 to 22.5); and EM3, −3.7 (−20.8 to 12.4) (Table 4). With 33 and 46 stations, the analysis lacks the statistical power to detect changes in the order of ten points. None of the statistical approaches (common-domain comparison, paired-station analysis, or bootstrap resampling) detected significant differences in the overall end-member proportions. Consequently, the available data do not provide sufficient evidence to conclude that the overall composition changed between the two surveys. These results should not, however, be interpreted as demonstrating equivalence between the datasets. Rather, they indicate that the persistence of similar end-member proportions cannot be rejected with the present sampling design and statistical power.
Table 4.
Bootstrap means comparison on common domain for each end-member. n_xxxx: number of points of each dataset, 95% Conf.Int.: 95% confidence interval on simulated differences for each end-member (common domain), % draws ∆ > 0: pseudo-probability that 2025 will exceed 2016 (frequency of draws in which the difference is positive).
4.1.1. The 2016 Dataset
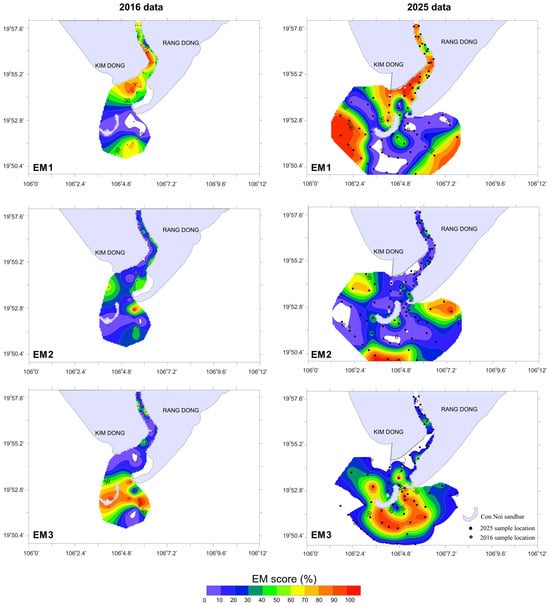
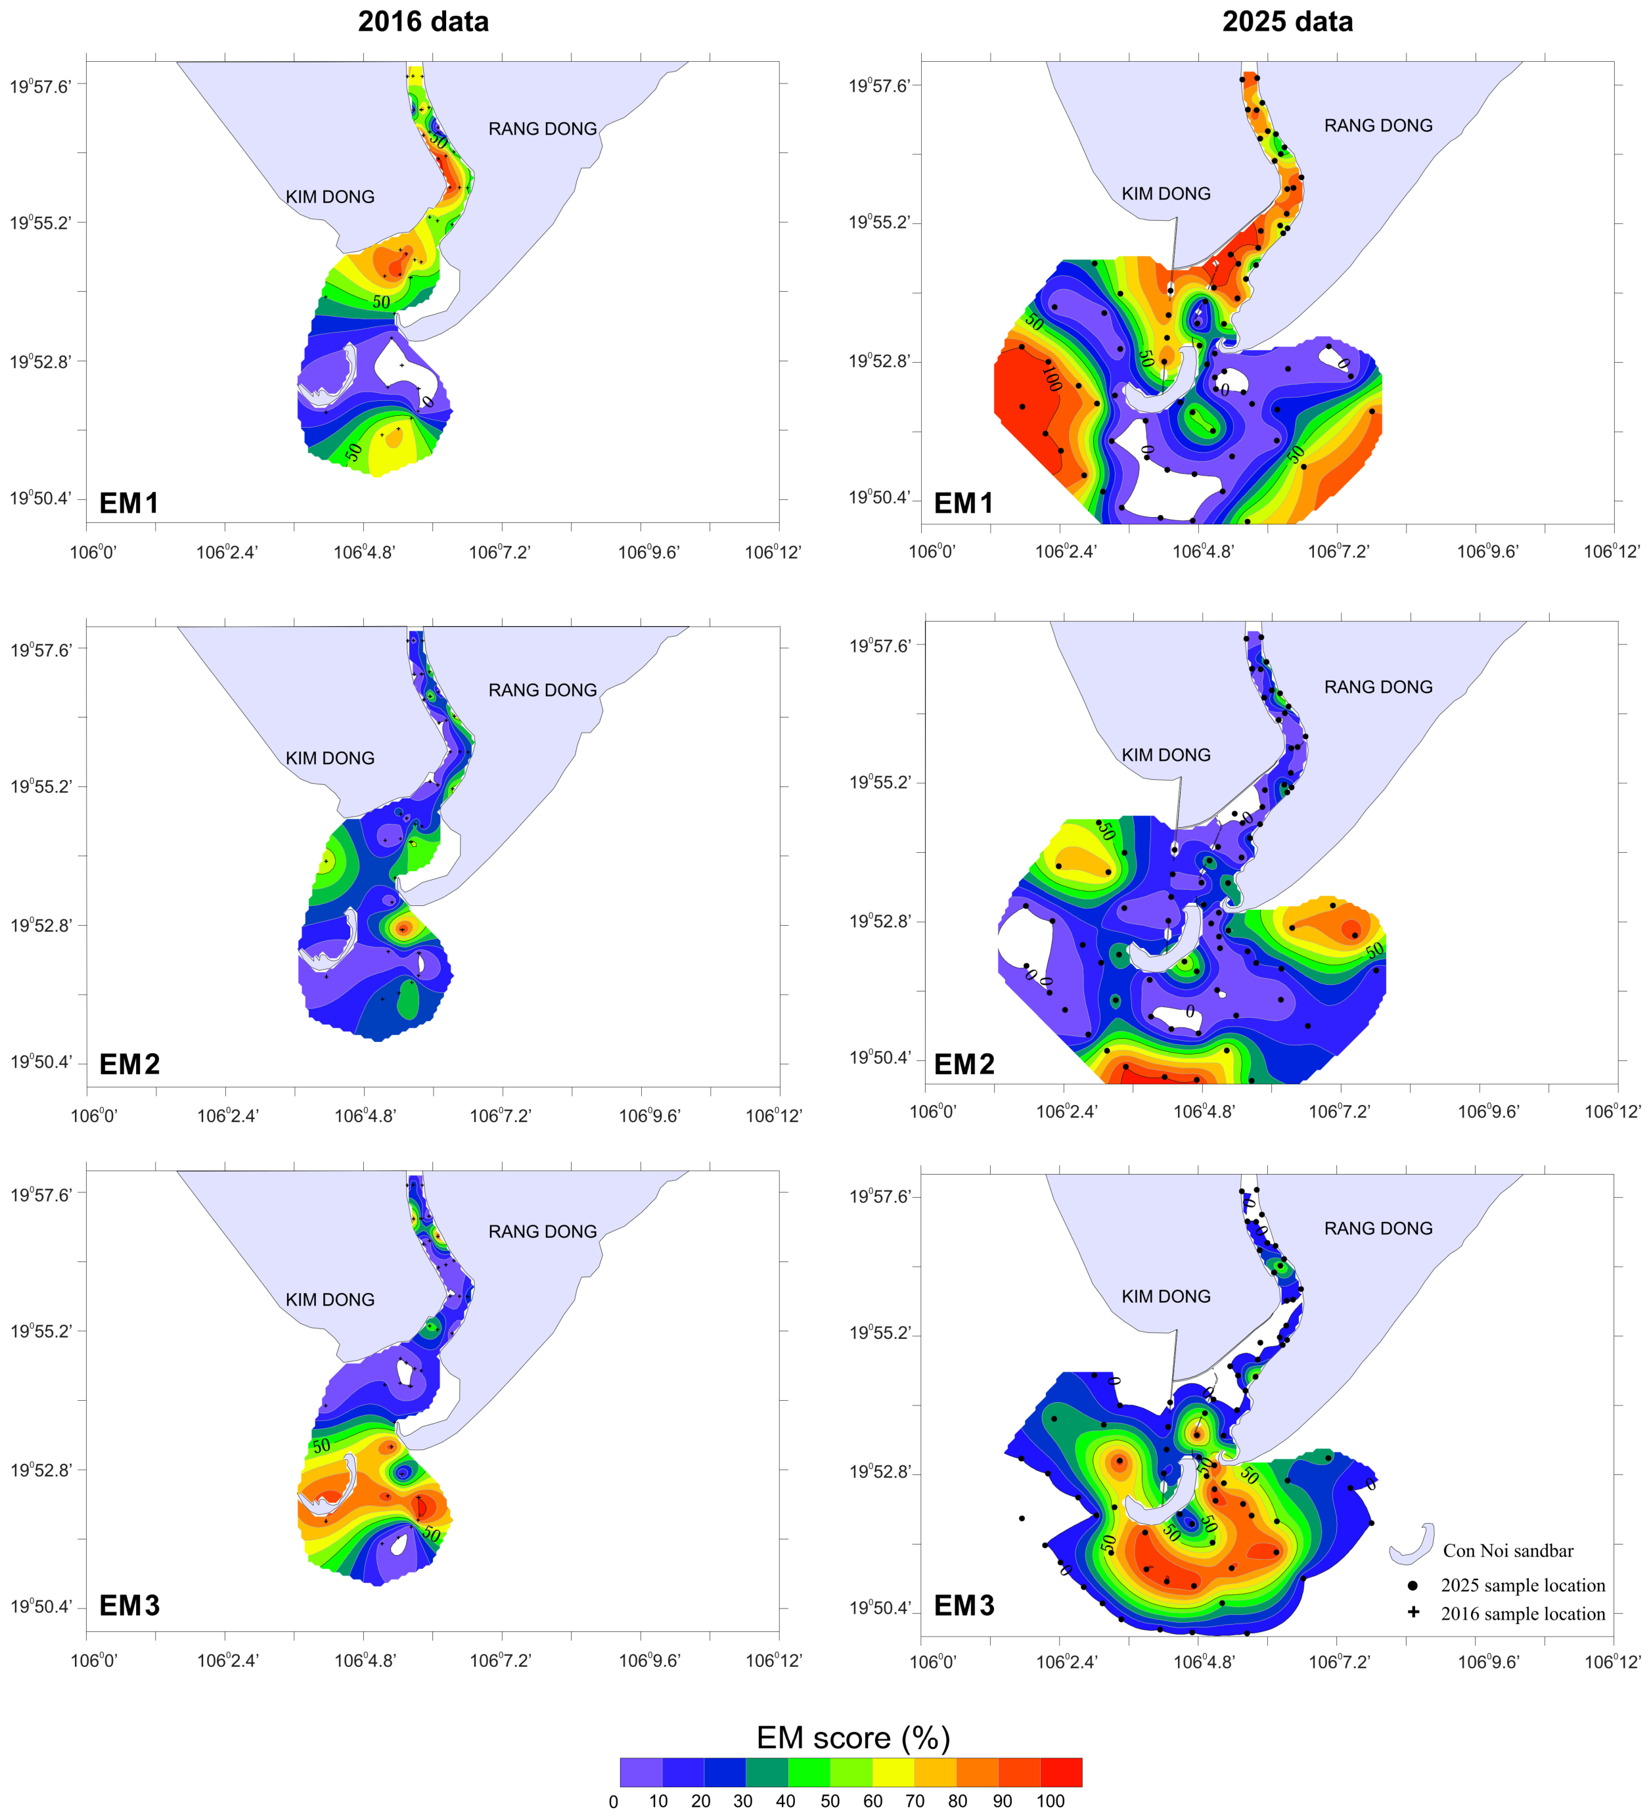
The three end-members (EM1–EM3) display a clear spatial zonation, reflecting distinct sedimentary environments and dynamic processes (Figure 5 left). EM1 (medium silt) is concentrated in the northern part of the study area, within the river channel and particularly around the Day River mouth. The fine grain size and the spatial pattern suggest a low-energy depositional environment dominated by fluvial discharge and nearshore accretion.
Figure 5.
Spatial distribution of the relative abundances of the end-members for the 2016 (left) and 2025 (right) datasets.
EM3 (fine sand) is mainly distributed in the southern part of the study area, particularly offshore of the Day River mouth where the EM1 contents are low, corresponding to an area subject to the combined action of waves and longshore currents—where Con Noi sandbar has formed. Its coarser grain size and offshore position suggest that EM3 reflects a higher-energy environment relative to the other EMs, typical of seaward sediment transport and redistribution.
EM2 (very fine sand) occurs as a complement to both EM1 and EM3, with elevated values only at isolated sites. It represents the transitional grain-size fraction between fluvial and marine influences, reflecting local resuspension and dispersal under the combined action of river discharge, tidal currents and nearshore waves.
Overall, the three end-members delineate a proximal-to-distal gradient: fine material (EM1) concentrated near the river mouth to the north, intermediate material (EM2) in the central transitional zone, and coarse material (EM3)—which explains the largest fraction of variance in the 2016 dataset—in the southern offshore area. This pattern reflects a progressive decrease in fluvial influence and an increasing role of marine dynamics across the study area.
4.1.2. The 2025 Dataset
EMMAgeo results for the 2025 dataset reveal a similar three-end-member structure, but with a different spatial distribution, reflecting shifts in sediment sources and hydrodynamic conditions (Figure 5 right). The 2025 sampling grid was extended further to the south and offshore compared with 2016.
EM1 (medium silt) is concentrated along the river channel and the northern nearshore zone, extending into shallow offshore waters. High EM1 contents (orange–red zones) indicate strong control by Day-River-derived material, transported seaward and deposited under low-energy conditions. Although the sampling area was broader in 2025, the comparative results indicate that the higher EM1 values shifted seaward relative to those in 2016.
EM3 (fine sand) remains dominant offshore of the Day River mouth, especially from the central to the distal offshore areas south of the mouth. High EM3 contents can be linked to a high-energy environment controlled by waves and strong longshore currents, where coarse material is redistributed offshore. The southeastward expansion of EM3 is consistent with a tendency for wave-current dynamics to redistribute fine sand further offshore, reflecting the dominant role of marine processes in reshaping the seabed morphology of the Day River mouth area.
EM2 (very fine sand) shows relatively low values in the river channel and central areas, with a patchy distribution and higher values at marginal sites (both nearshore and offshore). This component represents an intermediate-energy environment influenced simultaneously by river discharge, tides and nearshore waves.
Compared with the 2016 dataset, the 2025 EMMA results show a spatial expansion of all three end-members to the sea, most notably EM1 and EM3, reflecting the intensification of both fine- and coarse-material transport and deposition towards the offshore. Overall, fine material concentrates within the river mouth and nearshore zone, while coarser material expands further offshore, suggesting a different spatial organization of the interaction between fluvial, tidal and wave processes in the recent period and characterizing an actively accreting and transporting estuarine–coastal system.
4.2. Grain-Size Trend Analysis (GSTA) Results
The characteristic distance Dg was determined independently for each dataset through a variogram analysis, yielding Dg = 8000 m for the 2016 dataset and Dg = 5000 m for the 2025 dataset. The difference reflects the respective sampling densities and spatial coverages of the two surveys. GSTA was then applied to each dataset separately using its own Dg value, so that the resulting vector fields can be interpreted in terms of transport direction and trend consistency. The combined use of end-member analysis and GSTA reveals, in the study area, a strong correlation between the transport scenario and the geographic distribution of two of the identified EMs (EM1 and EM3) for both datasets (2016 and 2025).
4.2.1. The FB- Trend Case
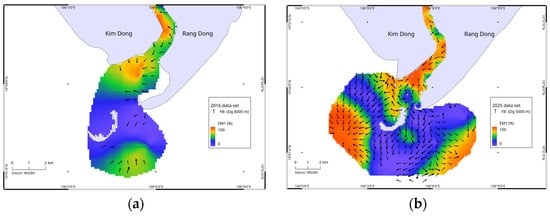
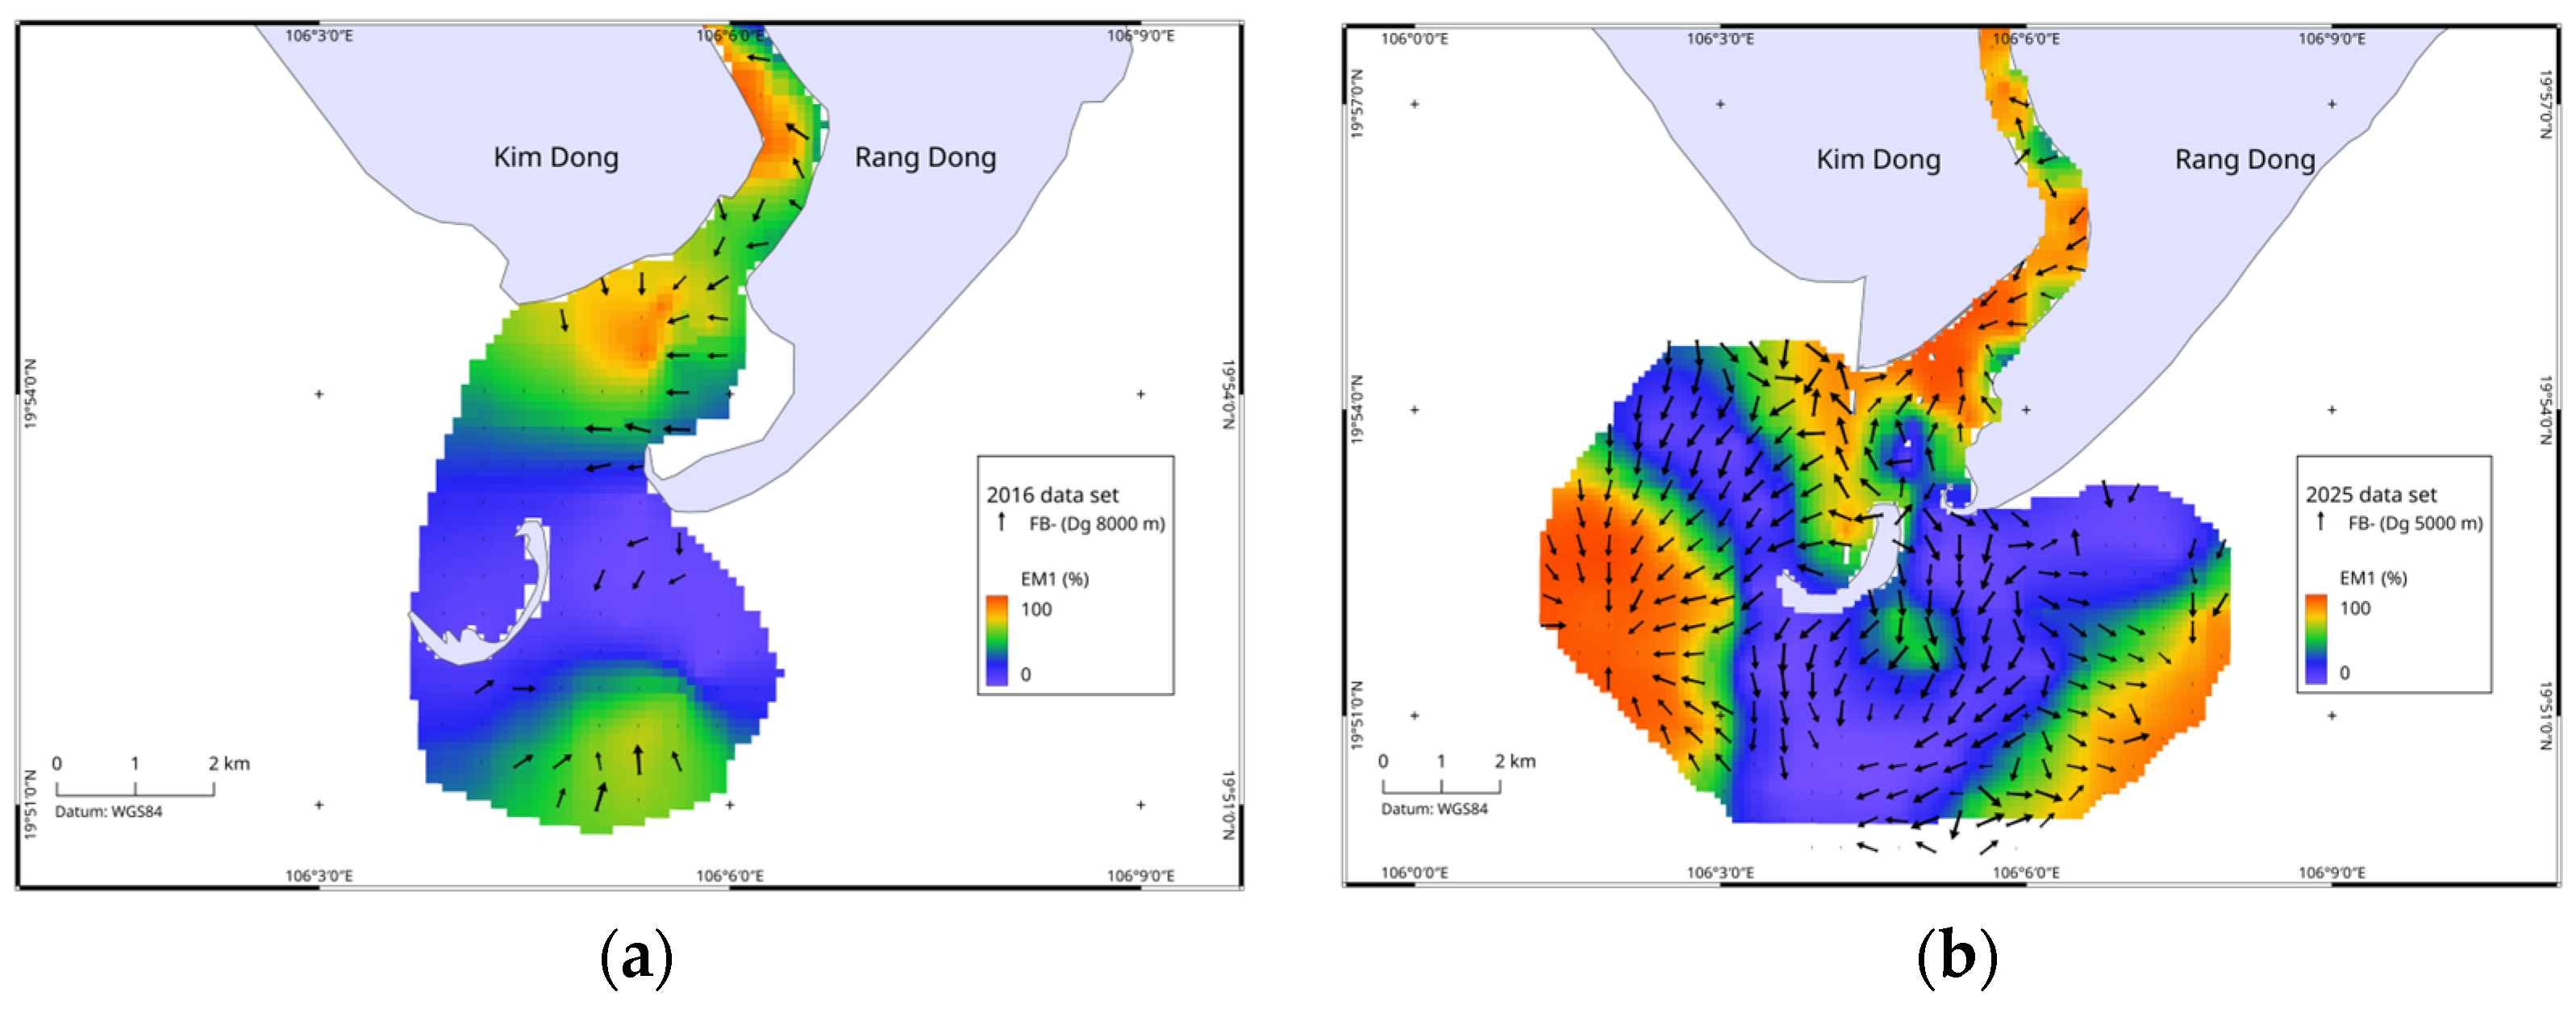
The FB- vector field highlights the transport of the finest particle fraction (EM1) and helps explain its spatial distribution (Figure 6). In 2016, FB- is primarily present in the Day River up to its mouth and is virtually absent elsewhere (offshore). The finest fraction remains trapped at the mouth of the Day River. In 2025, the FB- vector field covers almost the entire study area; only two small areas, one to the south and the other to the east, have no vectors. In the upper reaches of the Day River, the vectors are oriented in the direction of increasing EM1 values. The mouth of the Day River shows significant changes to the coastline, with heavy human development marked by the construction of roads and bridges connecting the mainland to Con Noi Island at two locations. Around these developments, the FB- vector field remains oriented in the direction of increasing EM1 percentages to indicate shifts from the south to north near Con Noi Island, which then diverge on either side (to the west and toward the interior of the Day River) of the road landing on the mainland (south Kim Dong). The vectors in the FB- case also remain oriented toward the areas of highest EM1 concentrations west of the study area (not investigated in 2016). South and east of Con Noi Island, the vectors are initially oriented from north to south, then gradually diverge westward and eastward.
Figure 6.
FB- trend case over EM1 for (a) the 2016 dataset and (b) the 2025 dataset.
4.2.2. The CB+ Trend Case
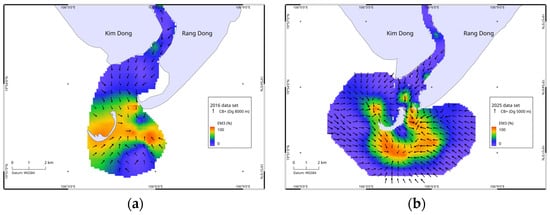
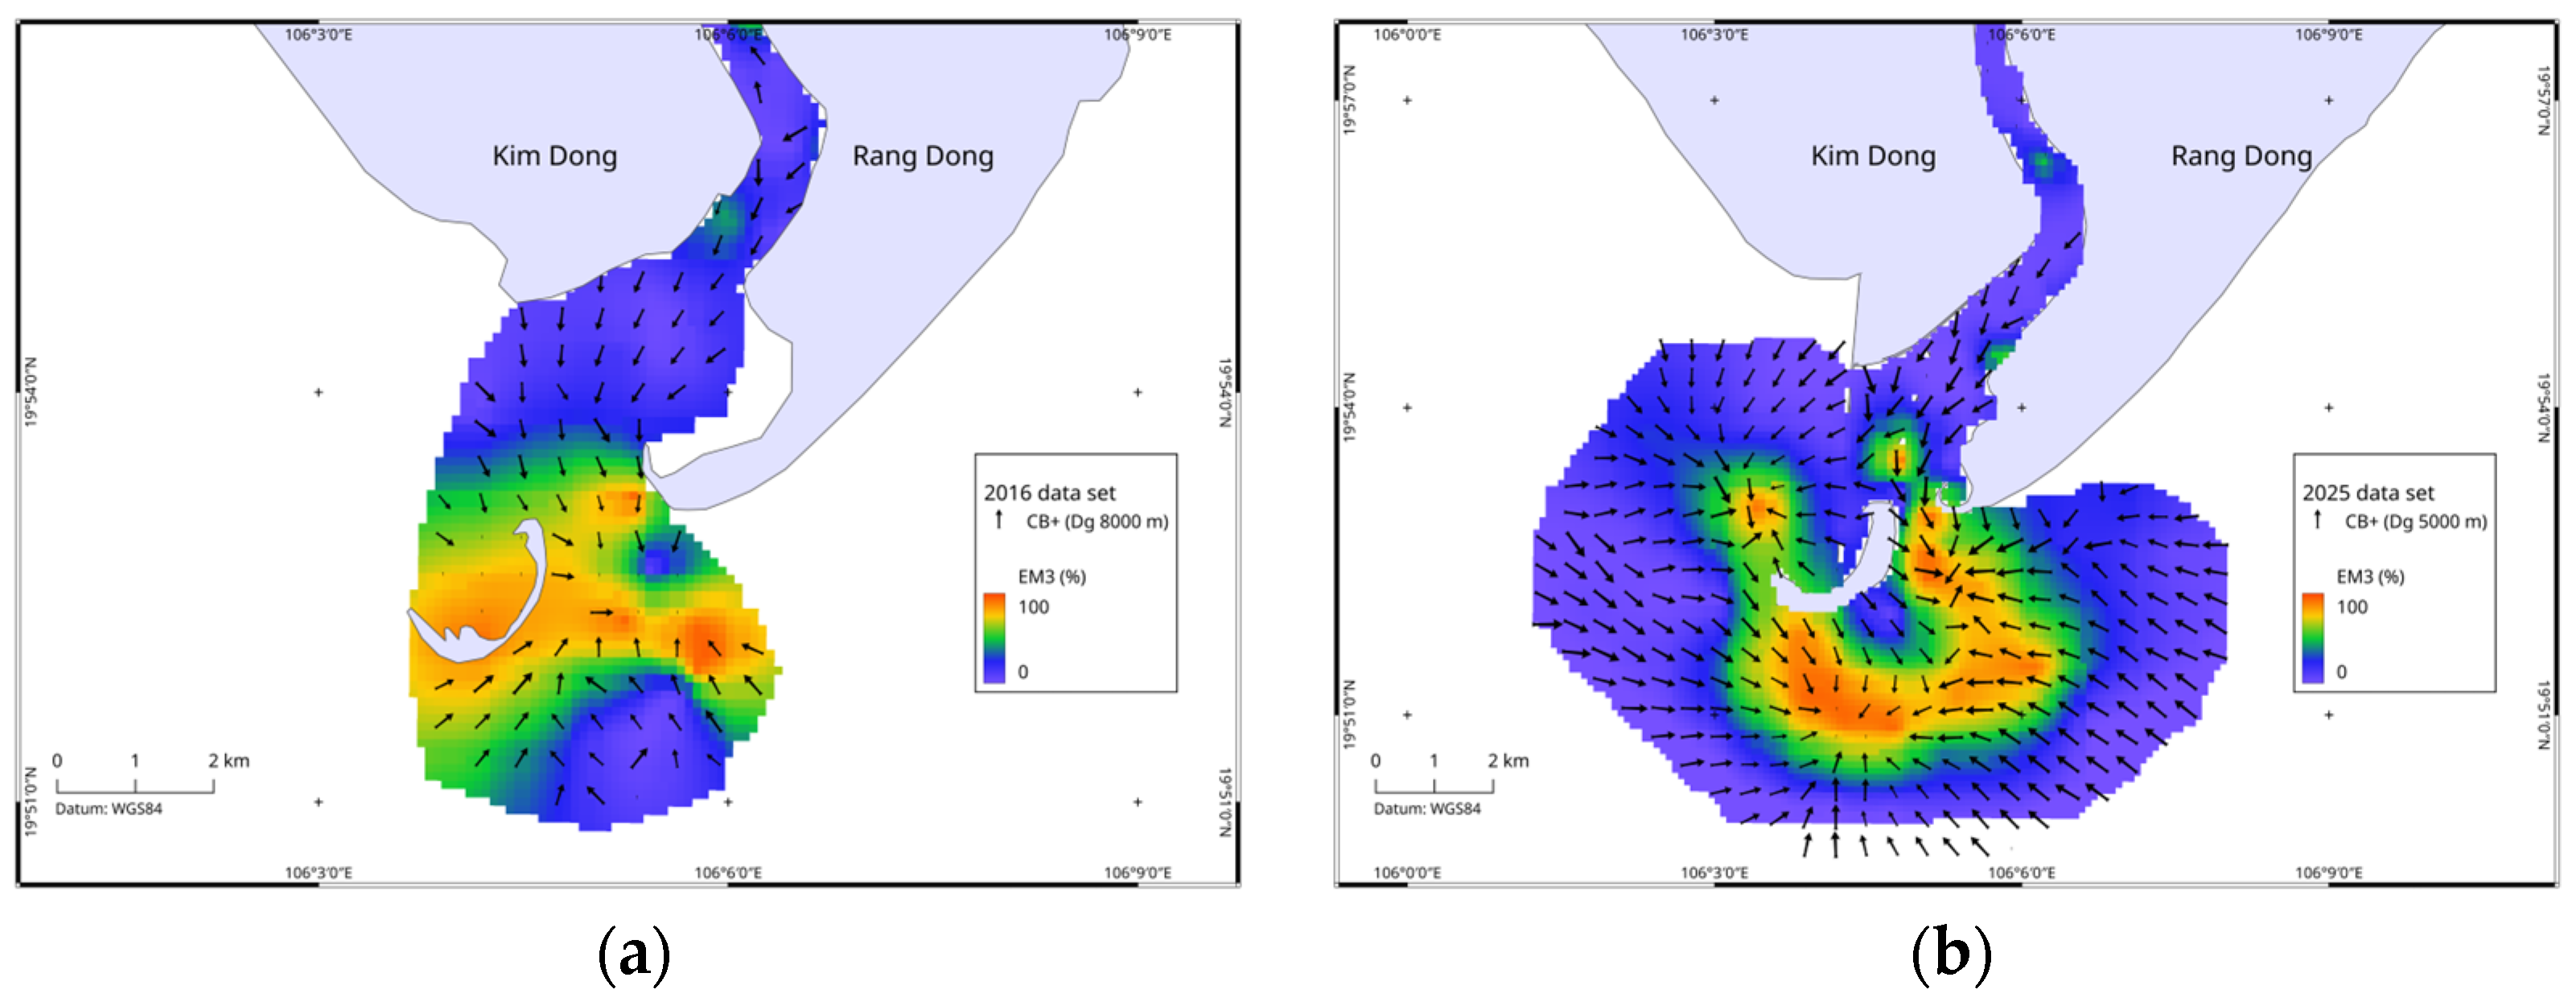
The vector field for the CB+ case, on the other hand, correlates well with the distribution of EM3 (fine sand) concentrations (Figure 7). Whether for the 2016 or 2025 data, the CB+ vector fields contain a greater number of vectors than the FB- case.
Figure 7.
CB+ trend case over EM3 for (a) the 2016 dataset and (b) the 2025 dataset.
The movements of the coarsest fraction in 2016 (EM3), as illustrated by the CB+ case, are clearly marked from upstream to downstream in the Day River. This fraction is concentrated along an east–west axis at the latitude of Con Noi Island. The CB+ vectors south of the zone, oriented south–north (toward the highest concentrations of EM3), indicate the grain-size gradation toward the open water and do not represent actual particle transport. The CB+ vector field for 2025 is clearly structured, still consistent with the spatial distribution of EM3 concentrations. Compared to 2016, the highest concentrations of EM3 have shifted further south of Con Noi Island, forming a horseshoe shape with the concave side facing the island. The CB+ vectors are therefore oriented toward these high concentrations of EM3.
4.2.3. The FB- XOR CB+ Trend Case
The FB- XOR CB+ trend case highlights, at each sampling location, the dominant trend between the two grain-size trend cases identified in the study area, namely, FB- and CB+. This combined representation makes it possible to better distinguish the respective spatial domains of fine-grained sediment transport and coarse-material redistribution/accumulation, while avoiding the redundancy that arises when both cases are plotted independently.
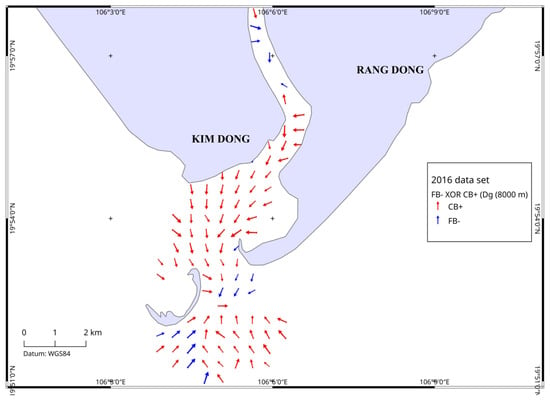
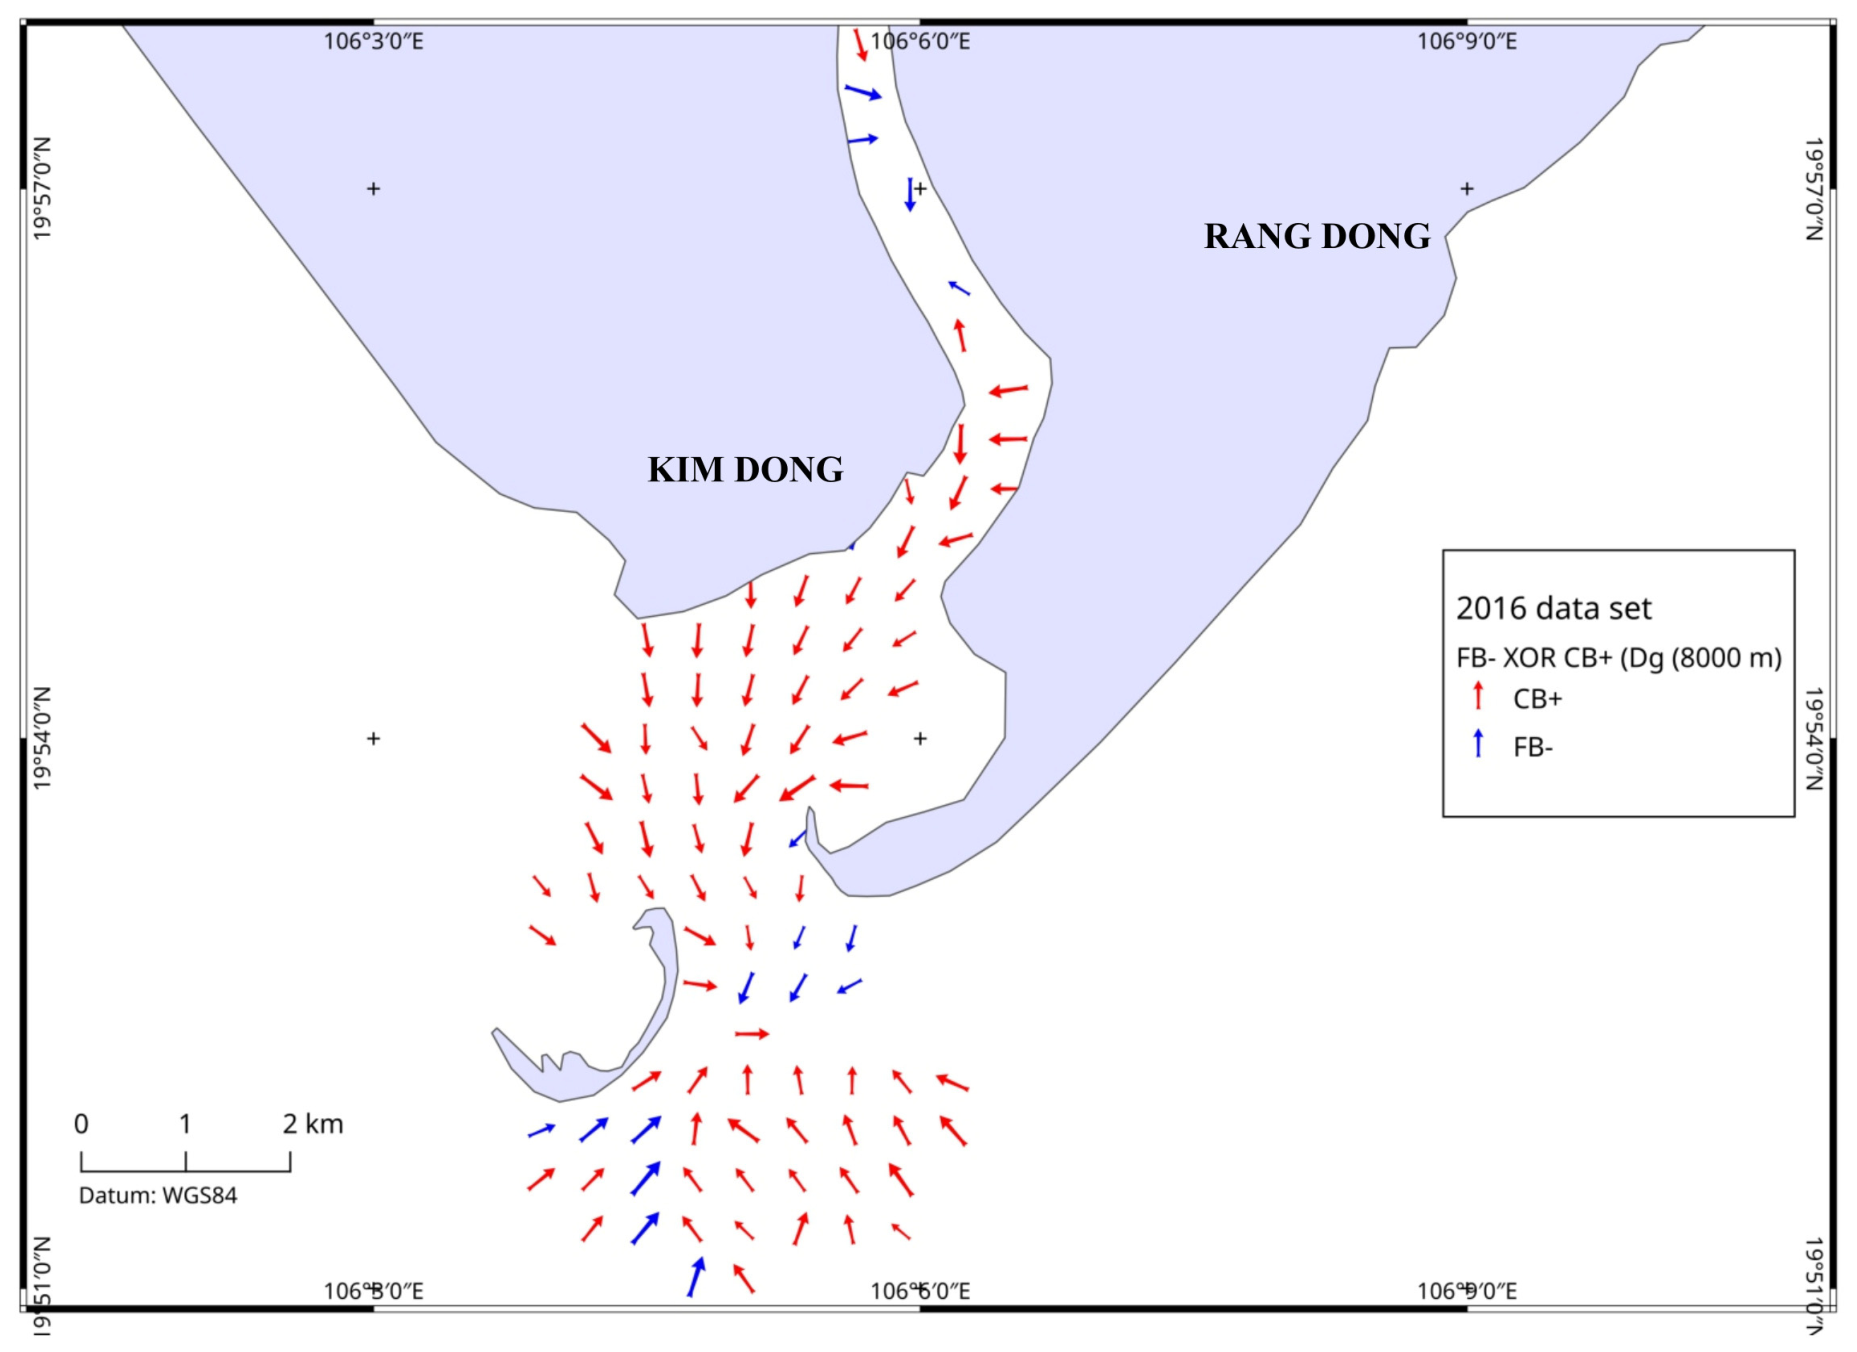
For the 2016 dataset (Figure 8), the XOR map shows that the CB+ case predominates over most of the river-mouth and offshore area, particularly in the central and southern sectors seaward of the Day River mouth. The CB+ (red) vectors generally converge toward the outer-mouth zone around the Con Noi sandbar, suggesting that the coarser sediment fraction was preferentially redistributed and relatively accumulated in this depositional domain. In contrast, the FB- (blue) case is much less extensive, being restricted to a few vectors in the upper estuarine channel and in some southern and southeastern offshore positions. This pattern indicates that, in 2016, the sedimentary signal was dominated mainly by the trend associated with coarse-material sorting and accumulation, whereas the fine-grained transport trend was present but spatially limited.
Figure 8.
2016 dataset, FB- XOR CB+ trend case, red arrows for CB+ and blue arrows for FB-.
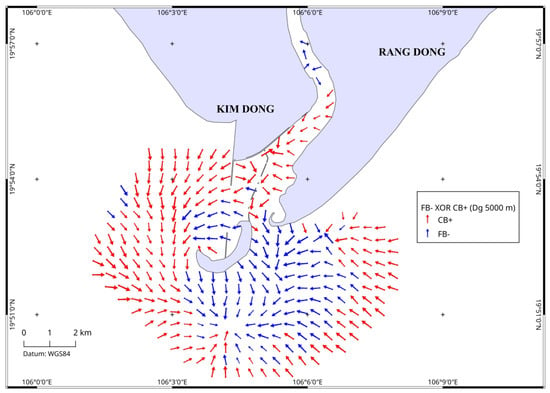
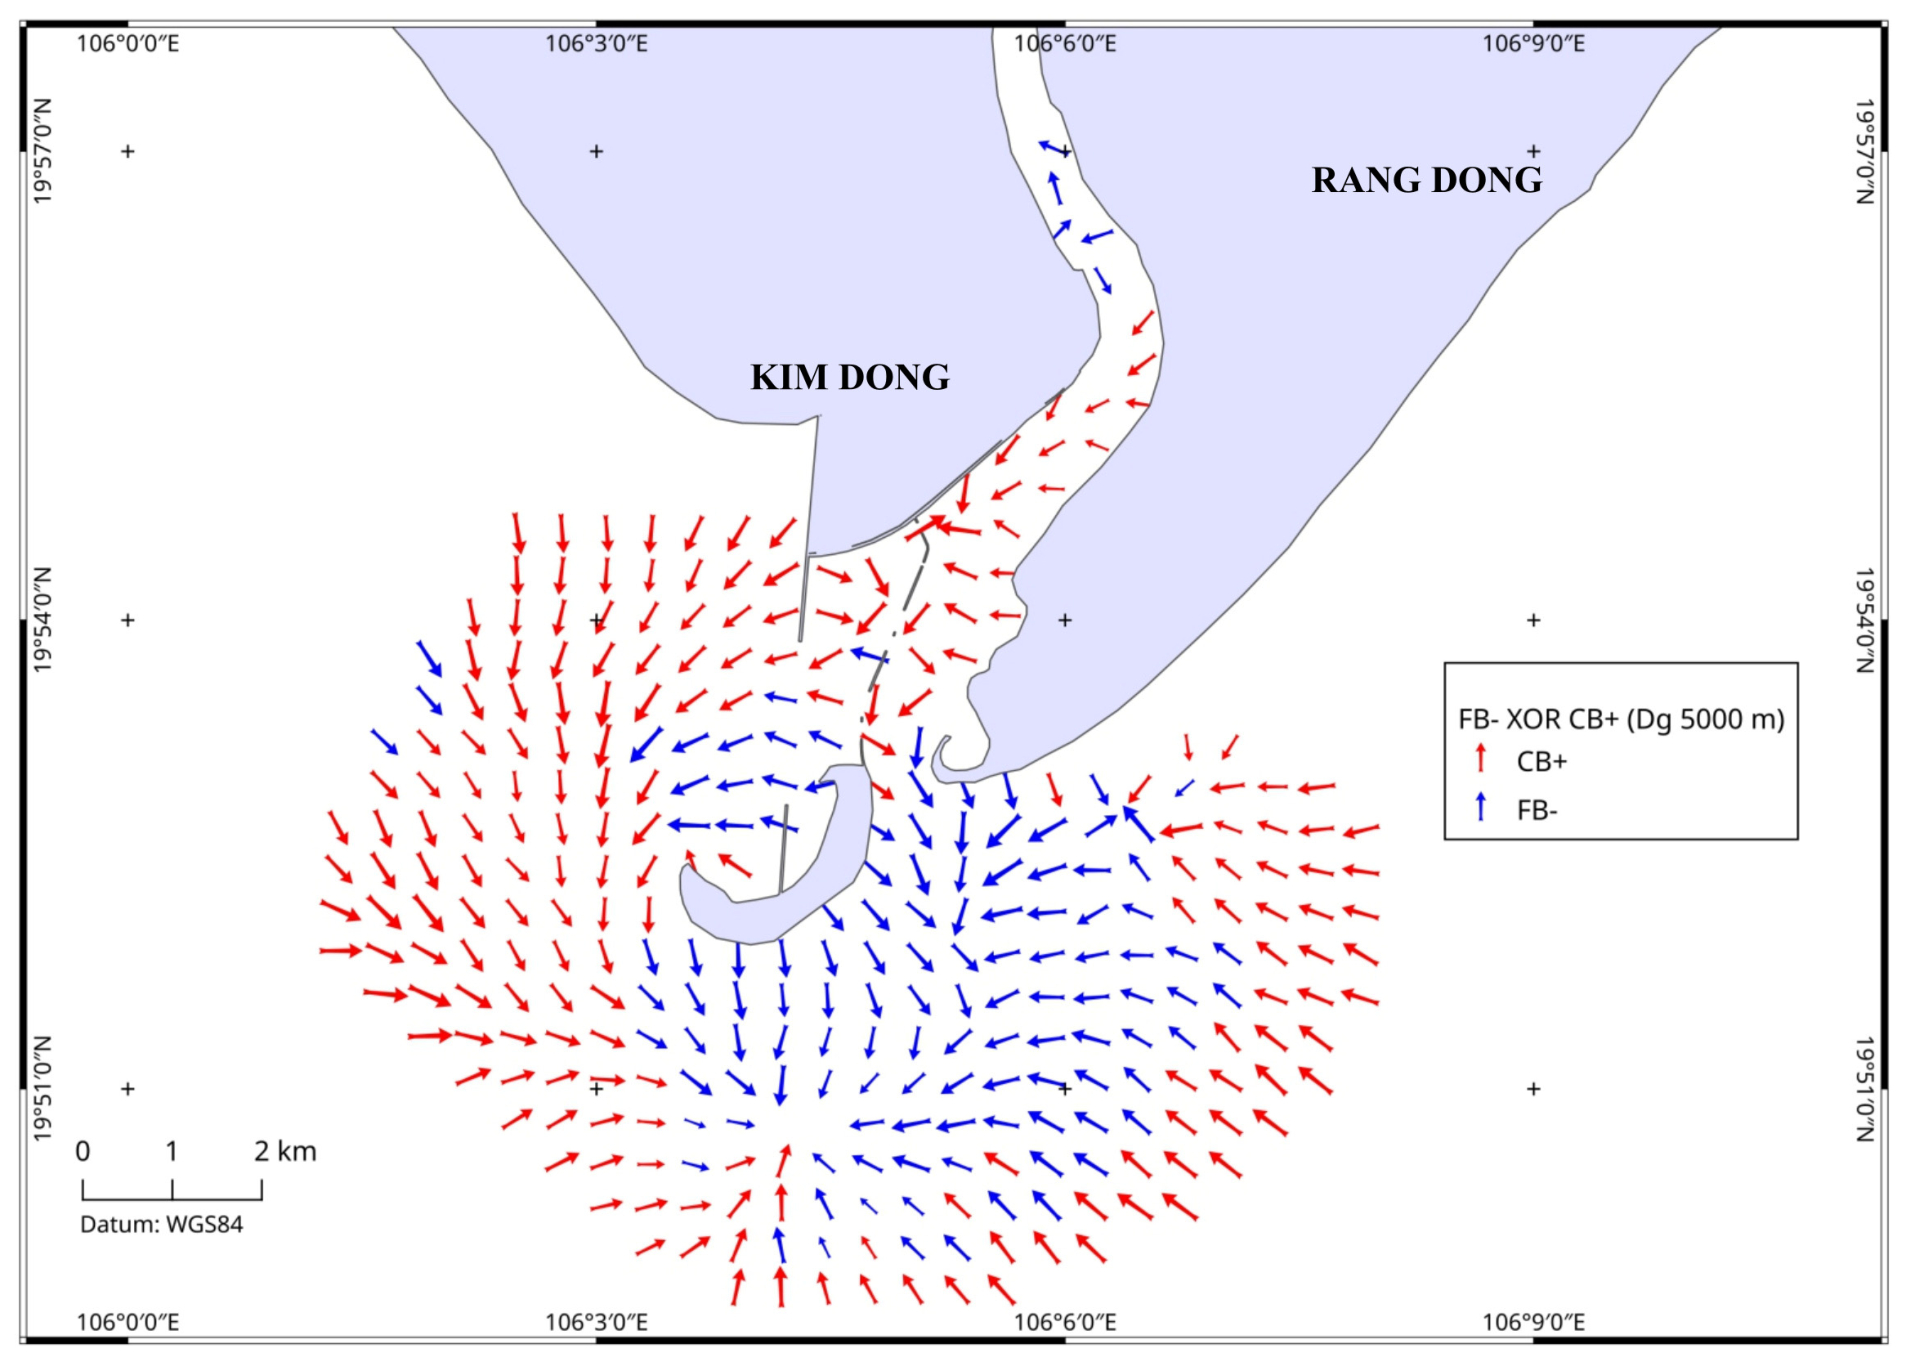
For the 2025 dataset (Figure 9), the XOR pattern becomes more structured and shows a clearer spatial partitioning between the two trend cases. The FB- case expands markedly, especially from the area around and south of Con Noi toward the southeastern offshore zone, where FB- (blue) vectors form a coherent field. This distribution suggests a stronger expression of the trend related to fine-grained sediment transport and redistribution, likely reflecting the enhanced differentiation of sediment pathways in the outer estuarine zone. Meanwhile, the CB+ (red) case remains dominant in the western offshore sector and in parts of the estuarine-mouth area, where vectors point toward zones interpreted as relative coarse-material accumulation. Around the mouth and near the coastal structures, the juxtaposition of the FB- and CB+ fields indicates the coexistence of two complementary processes: fine-sediment transfer along preferred pathways and the localized coarse-sediment concentration in adjacent accumulation zones.
Figure 9.
2025 dataset, FB- XOR CB+ trend case, red arrows for CB+ and blue arrows for FB-.
Overall, the FB- XOR CB+ trend case confirms that sediment transport at the Day River mouth is not controlled by a single uniform pathway, but, rather, by the coexistence of two concurrent sedimentary tendencies: (i) a trend linked to the transport of finer material, represented by FB-, and (ii) a trend linked to the relative redistribution and accumulation of coarser material, represented by CB+. Compared with 2016, the 2025 map reveals a more pronounced spatial differentiation between these two tendencies, particularly around Con Noi and in the offshore southeastern sector. This change is consistent with the decadal reorganization of the sedimentary system inferred from EMMA and from the separate GSTA analyses, and may reflect not only natural hydrodynamic controls but also the influence of the sea-crossing road–bridge and the T-shaped spur dike, which may have modified local flow pathways and sediment redistribution patterns.
5. Discussion
5.1. Persistence and Reorganization of the Sedimentary System
The combined EMMA-GSTA approach consistently resolves three sedimentary domains that are present in both surveys. The statistical analyses performed on paired stations and on the common sampling domain do not provide evidence for significant changes in the overall proportions of these end-members. However, the mapped distributions of the end-members and the associated GSTA patterns reveal descriptive differences in their spatial organization between 2016 and 2025. Thus, the principal result of this study is not a demonstrated change in sediment composition, but an apparent reorganization of the spatial expression of persistent sedimentary components.
These shifts occurred during a period when new coastal infrastructures were constructed and are therefore temporally consistent with a possible anthropogenic influence. However, the available data do not allow the relative contribution of natural and anthropogenic drivers to be quantified. EMMAgeo consistently identified three end-members in both datasets, explaining 86% and 91% of the total variance in 2016 and 2025, respectively. Their comparable modal grain sizes, medium silt (EM1), very fine sand (EM2), and fine sand (EM3), suggest that the principal sedimentary components persisted over the investigated decade. The major change therefore lies not in the appearance of new sediment populations, but in their relative contribution, spatial partitioning, and association with the GSTA patterns.
This distinction is important because the changes between the two surveys cannot be evaluated solely from end-member variance contributions. EM1 displayed a higher variance contribution in the 2025 dataset than in 2016, while EM3 displayed the opposite tendency. However, because these differences are not statistically significant, they should be interpreted as descriptive tendencies rather than demonstrated compositional changes.
EM2 remained comparatively stable (20–22%). Thus, changes in the variance contribution and spatial extent do not necessarily occur in parallel. Instead, the results indicate a redistribution of the existing sedimentary components across the river-mouth-offshore system. Although differences in the sampling density and spatial coverage between the two surveys must be considered, the combined EMMA and GSTA patterns suggest that the 2025 survey displayed a more spatially differentiated spatial organization than the 2016 survey.
5.2. EM1 and Seaward Redistribution of Fine Fluvial Material
EM1, with a modal grain size of approximately 10.1–11.6 µm, represents the finest end-member and is interpreted predominantly as fine sediment of fluvial origin. Its concentration along the Day River channel, river-mouth sector, and adjacent shallow coastal waters is consistent with the delivery and subsequent redistribution of suspended fine sediment from the river. Such an interpretation is compatible with observations from the Red River Delta showing that a substantial proportion of fine river-derived sediment remains in suspension and may be transported seaward [38]. Observations from the Ba Lat distributary similarly indicate that fine silt constitutes a major fraction of transported sediment and that sediment transport occurs predominantly in suspension [39].
Between 2016 and 2025, the variance contribution of EM1 increased from 35% to 43%, accompanied by a broader distribution toward shallow offshore waters. This change should not be interpreted directly as evidence for an increase in fluvial sediment supply, because end-member variance represents its relative contribution within each dataset rather than sediment flux. Instead, the seaward expansion of EM1 indicates a broader spatial influence of the fine-grained component in 2025. Its spatial association with the FB- trends further supports a relative seaward redistribution of fine material from the river-mouth domain.
5.3. EM2 and Persistence of the Fluvial–Marine Transition
EM2, with a modal grain size of approximately 88–101 µm, represents very fine sand and occupies an intermediate position between the fine-grained EM1 and the coarser EM3. Its patchy spatial distribution, particularly along marginal and transitional zones, is consistent with sediment mixing and reworking at the interface between fluvial and marine influences.
In contrast to EM1 and EM3, EM2 changed only slightly in its variance contribution, from approximately 20% in 2016 to 22% in 2025. Its end-member loading curves are also the most similar between the two surveys. These characteristics suggest that, despite the broader spatial reorganization of the sedimentary system, the transitional mixing component remained comparatively stable over the investigated decade. EM2 therefore represents a persistent link between the river-derived fine fraction and the more strongly marine-reworked sandy fraction.
5.4. EM3 and Southeastward Redistribution of Fine Sand
EM3, with modal grain sizes of approximately 133–175 µm, represents fine sand and occurs predominantly south and southeast of the Day River mouth. Its offshore distribution and spatial association with CB+ trends are consistent with marine reworking and the relative redistribution or accumulation of sandy material. Waves, tidal currents, and wave-driven coastal currents are important agents of sediment redistribution along the southwestern Red River Delta coast [33,38].
An important change between the surveys is that the variance contribution of EM3 decreased from 45% to 35%, while its spatial extent expanded markedly toward the southeast. This apparent contrast indicates that the relative contribution of EM3 to the overall grain-size dataset decreased, whereas the area influenced by this sandy component became broader. In addition, the main EM3 mode shifted from approximately 174.6 µm in 2016 to 133.1 µm in 2025, indicating a relatively finer expression of this end-member in the later survey.
The southeastward expansion of EM3 is consistent with the regional longshore sediment-transport regime. Investigations along the southwestern Red River Delta coast documented a pronounced seasonal asymmetry, with southward transport during the winter monsoon exceeding the northward component during summer and producing a net annual southward longshore sediment transport of approximately 150 × 103 m3 yr−1 [33]. This regional tendency provides a plausible hydrodynamic context for the southeastward redistribution of EM3, although it does not demonstrate that the observed EM3 change was directly caused by longshore transport.
5.5. Reorganization of Sediment-Transport Trends Revealed by GSTA
The GSTA results highlight changes in the spatial organization of the sedimentary system. In 2016, the trend field was comparatively simple, with CB+ prevailing over much of the river-mouth and offshore sectors and FB- occurring mainly within the river channel and locally offshore. In 2025, FB- became more widely developed around Con Noi and in the southeastern offshore sector, while CB+ remained prominent west and north of the river mouth and in several marginal offshore zones.
The FB- XOR CB+ patterns therefore reveal stronger spatial differentiation between domains characterized by relative fining and those characterized by relative coarsening. The correspondence between FB- and the finer EM1 domain, and between CB+ and the sandy EM3 domain, provides an internally consistent relationship between EMMA and GSTA. Rather than representing two independent sediment-transport systems, these patterns indicate the spatial coexistence of fine-material redistribution and sandy-material reworking within the same river-mouth system.
Particular attention should be given to the more heterogeneous vector organization around Con Noi in 2025, where local convergence, divergence, and deflection are more evident than in 2016. These configurations suggest an increased spatial variability in sediment redistribution pathways. However, GSTA vectors represent relative grain-size trends between sampling locations and should not be interpreted as direct measurements of instantaneous sediment trajectories, fluxes, or current directions. Because each survey was analyzed using a dataset-specific Dg value and different sampling configurations, these differences should be interpreted as descriptive contrasts rather than strictly comparable quantitative changes in sediment transport patterns.
5.6. Hydrodynamic Controls and Anthropogenic Boundaries
The observed sedimentary reorganization can be interpreted within the regional hydrodynamic setting of the southern Red River Delta. Fluvial discharge supplies sediment to the river-mouth zone, while waves, tidal currents, and wave-driven coastal currents redistribute material across the shallow coastal environment [38]. Fine river-derived sediment can remain in suspension and be transported seaward, whereas tidal resuspension also plays an important role in sediment dynamics, particularly during the dry season [38,39]. These processes provide a regional process framework for the seaward expansion of EM1 and the marine reworking of EM3.
Longshore sediment transport provides an additional mechanism for sandy-material redistribution. Along the southwestern Red River Delta coast, southward transport during the winter monsoon substantially exceeds the northward component during summer, producing a net annual southward transport of approximately 150 × 103 m3 yr−1 [33]. This regional transport tendency is consistent with the southeastward expansion of EM3 between 2016 and 2025, although it should be regarded as hydrodynamic context rather than direct evidence of the transport pathways inferred from GSTA.
Against this natural hydrodynamic background, the road–bridge connecting Kim Dong to Con Noi, constructed during 2017–2020, and the T-shaped spur-dike system that appeared subsequently introduced new physical boundaries into the river-mouth system. The more pronounced spatial differentiation of the FB- and CB+ trends around Con Noi in 2025, together with the local convergence, divergence, and deflection of the trend vectors, is consistent with the hypothesis that these structures may have contributed to local changes in sediment redistribution pathways. These anthropogenic structures are therefore considered additional controls that may influence sediment redistribution within the natural river–tide–wave–longshore transport system.
5.7. Comparison with Previous Studies and Implications
The present results are broadly consistent with, but extend, previous sediment-transport studies at the Day River mouth. Based on 42 surface-sediment samples covering approximately 65 km2, Dinh Xuan Thanh et al. (2024) [34] identified three convergent sediment-transport trends: from northeast to southwest along the coast, from the western sector toward the central estuary, and from the southeast toward Con Noi. Their study did not clearly identify the river-to-sea trend observed in the present GSTA analysis. This difference may partly reflect the differences in sampling design and spatial coverage, because their samples were concentrated mainly within the river-mouth and shallow tidal-flat sectors, whereas the present surveys extend from the river channel to offshore water depths of approximately 25 m. Nevertheless, their distribution of finer sediments west of and around Con Noi and fine sand toward the southeast is broadly compatible with the EM1 and EM3 domains identified here.
The shoreline modelling results of Vu et al. (2026) [48] provide an additional longer-term perspective, indicating that riverine sediment supply remains important to the regional sediment budget, while longshore transport contributes to sediment redistribution along the coast. In this context, the present EMMA–GSTA results add information on the internal spatial organization of the sedimentary system: the same fundamental sedimentary components persisted between 2016 and 2025, but their spatial distributions and associated grain-size trends exhibited substantial reorganization, whereas significant changes in overall end-member proportions could not be statistically demonstrated.
The principal contribution of the present study is therefore not the identification of an entirely new sediment-transport pathway. Rather, it is the demonstration that a river-mouth system characterized by persistent sedimentary components can undergo substantial decadal reorganization in their spatial partitioning and relative transport trends. This distinction provides a more process-oriented interpretation of the observed changes than the consideration of individual grain-size parameters or transport vectors alone.
The available datasets do not provide direct before-and-after measurements of currents, waves, or suspended-sediment transport associated with the construction of the road–bridge and T-shaped spur-dike system. Their influence should therefore be regarded as a plausible contribution to the observed sedimentary reorganization rather than a demonstrated causal relationship. Future seasonal sampling, direct hydrodynamic measurements, suspended-sediment observations, and numerical modelling would be required to quantify these mechanisms and distinguish anthropogenic effects from natural variability.
The EMMA and GSTA results suggest that two concurrent sedimentary tendencies can be identified at the Day River mouth: the seaward redistribution of fine fluvial material, expressed by the association between EM1 and FB− trends, and the marine reworking and relative redistribution/accumulation of fine sand seaward of the river mouth, expressed by the association between EM3 and CB+ trends. The persistence of these sedimentary components in both surveys, combined with changes in their spatial distributions and GSTA organization, suggests that the fundamental sedimentary components remained present while their spatial expression underwent substantial reorganization between 2016 and 2025.
6. Conclusions
The joint analysis of 113 surface-sediment samples collected in April 2016 and April 2025 shows that the Day River-mouth sedimentary system retained three fundamental grain-size components over the decade: EM1, medium silt; EM2, very fine sand; and EM3, fine sand. These end-members explain 86% and 91% of the total variance in the 2016 and 2025 datasets, respectively. Their recurrence and comparable modal characteristics indicate the persistence of the basic sedimentary components despite apparent differences in their relative contribution and spatial distribution.
The main decadal change was therefore a reorganization rather than a replacement of the sedimentary components. Although EM1 displayed a higher variance contribution in the 2025 dataset and EM3 a lower one, statistical analyses performed on paired stations, on the common sampling domain, and through bootstrap resampling did not detect significant differences in the overall proportions of the end-members. Accordingly, the observed differences should be regarded as descriptive tendencies rather than demonstrated compositional changes. In contrast, the spatial distributions of the end-members indicate a reorganization of their geographical expression, with a broader offshore influence of EM1 and a southeastward extension of EM3. EM2 remained comparatively stable, changing from 20% to 22%. The EM3 loading curve also became finer in 2025, with its principal mode changing from 174.62 μm in 2016 to 133.1 μm in 2025, whereas the main EM1 peaks remained similar and the secondary peak was more pronounced in 2016.
GSTA provides an independent spatial expression of this reorganization. FB- is spatially associated with the fine-grained EM1 domain, whereas CB+ is associated with the EM3 domain and the relative redistribution or accumulation of coarser material. The FB- XOR CB+ representation reveals contrasting spatial organizations between the two surveys, with a relatively simple CB+-dominated pattern in 2016 and a more differentiated pattern in 2025. Because the surveys differ in sampling density, spatial coverage and Dg, these contrasts should be interpreted descriptively rather than as direct quantitative measures of transport change.
These results indicate that the Day River-mouth system operates through coexisting fine-material and coarse-material sedimentary trends within a hydrodynamically heterogeneous river–coastal environment. The observed patterns are consistent with the combined influence of fluvial discharge, tides, waves and southward residual longshore transport. The temporal correspondence with the construction of the mainland–Con Noi road–bridge and T-shaped spur dike suggests that these structures may have contributed to local sedimentary reorganization, but their quantitative contribution cannot be resolved from the present data.
The coupled EMMA–GSTA framework, when applied to multi-temporal surface-sediment datasets, proves to be a cost-effective tool for decoding sediment sources, transport pathways and decadal morphodynamic trends in river-mouth environments, thereby providing a scientific basis for coastal zone management and hard-structure planning in the Red River delta.
The principal contribution of this study is therefore the identification of a decadal reorganization in the spatial distribution and grain-size trend organization of persistent sediment components. The available evidence supports descriptive spatial reorganization, whereas significant changes in the overall end-member proportions could not be statistically demonstrated.
Direct hydrodynamic observations, seasonal sampling and numerical modelling are required to quantify the mechanisms responsible for the observed changes.
Author Contributions
Conceptualization, D.M.D., N.L.D. and E.P.; methodology, D.M.D., E.P. and N.L.D.; software, D.M.D. and E.P.; validation, D.M.D., E.P., M.S. and R.S.; formal analysis, D.M.D., N.L.D. and E.P.; investigation, D.M.D., H.T.T.T., H.D.Q., D.N.V., N.B.V. and T.N.X.; resources, N.L.D., D.M.D., H.P.T. and R.S.; data curation, D.M.D., H.T.T.T. and N.B.V.; writing—original draft preparation, D.M.D.; writing—review and editing, D.M.D., E.P., N.L.D., M.S., A.V. and R.S.; visualization, D.M.D., H.P.T., A.K. and E.P.; supervision, N.L.D. and E.P.; project administration, N.L.D. and D.M.D.; funding acquisition, N.L.D. All authors have read and agreed to the published version of the manuscript.
Funding
This research was funded by the projects coded NVKN13.06/26-27 and VAST05.04/25-26.
Data Availability Statement
The data are available from the authors upon request.
Conflicts of Interest
The authors declare no conflicts of interest.
References
- Flemming, B.W. The influence of grain-size analysis methods and sediment mixing on curve shapes and textural parameters: Implications for sediment trend analysis. Sediment. Geol. 2007, 202, 425–435. [Google Scholar] [CrossRef] [Scilit]
- Flemming, B.W. Process and pattern of sediment mixing in a microtidal coastal lagoon along the west coast of South Africa. In Tide-Influenced Sedimentary Environments and Facies; de Boer, P.L., van Gelder, A., Nio, S.D., Eds.; Reidel: Dordrecht, The Netherlands, 1988; pp. 275–288. [Google Scholar]
- Weltje, G.J. End-member modeling of compositional data: Numerical-statistical algorithms for solving the explicit mixing problem. Math. Geol. 1997, 29, 503–549. [Google Scholar] [CrossRef] [Scilit]
- Weltje, G.J.; Prins, M.A. Genetically meaningful decomposition of grain-size distributions. Sediment. Geol. 2007, 202, 409–424. [Google Scholar] [CrossRef] [Scilit]
- Weltje, G.J.; Prins, M.A. Muddled or mixed? Inferring palaeoclimate from size distributions of deep-sea clastics. Sediment. Geol. 2003, 162, 39–62. [Google Scholar] [CrossRef] [Scilit]
- Dietze, E.; Hartmann, K.; Diekmann, B.; IJmker, J.; Lehmkuhl, F.; Opitz, S.; Stauch, G.; Wünnemann, B.; Borchers, A. An end-member algorithm for deciphering modern detrital processes from lake sediments of Lake Donggi Cona, NE Tibetan Plateau, China. Sediment. Geol. 2012, 243–244, 169–180. [Google Scholar] [CrossRef] [Scilit]
- Paterson, G.A.; Heslop, D. New methods for unmixing sediment grain size data. Geochem. Geophys. Geosystems 2015, 16, 4494–4506. [Google Scholar] [CrossRef] [Scilit]
- Dietze, E.; Dietzel, M. Grain-size distribution unmixing using the R package EMMAgeo. E&G Quat. Sci. J. 2019, 68, 29–46. [Google Scholar] [CrossRef] [Scilit]
- Prins, M.A.; Bouwer, L.M.; Beets, C.J.; Troelstra, S.R.; Weltje, G.J.; Kruk, R.W.; Kuijpers, A.; Vroon, P.Z. Ocean circulation and iceberg discharge in the glacial North Atlantic: Inferences from unmixing of sediment size distributions. Geology 2002, 30, 555–558. [Google Scholar] [CrossRef] [Scilit]
- Collins, J.D.; O’Grady, P.; Langford, R.P.; Gill, T.E. End-member mixing analysis (EMMA) applied to sediment grain-size distributions to characterize formational processes of the main excavation block, Unit 2, of the Rimrock Draw Rockshelter (35HA3855), Harney Basin, eastern Oregon (USA). Archaeometry 2016, 59, 331–345. [Google Scholar] [CrossRef] [Scilit]
- López-González, N.; Alonso, B.; Juan, C.; Ercilla, G.; Bozzano, G.; Cacho, I.; Casas, D.; Palomino, D.; Vázquez, J.-T.; Estrada, F.; et al. 133,000 years of sedimentary record in a contourite drift in the western Alboran Sea: Sediment sources and paleocurrent reconstruction. Geosciences 2019, 9, 345. [Google Scholar] [CrossRef] [Scilit]
- Dong, M.D.; Poizot, E.; Cuong, D.H.; Anh, L.D.; Hung, D.Q.; Thuy Huong, T.T.; Diep, N.V.; Huong, N.B. Transport trend of recent sediment within the nearshore seabed of Hai Hau, Nam Dinh province, southwest Red River delta. Front. Earth Sci. 2023, 11, 1099730. [Google Scholar] [CrossRef] [Scilit]
- Le, D.A.; Mai, D.D.; Tran, T.T.H.; Le, D.L.; Nguyen, N.T.; Vu, H.D.; Bui, V.N.; Pham, T.H.; Duong, V.H. Grain-size distribution characteristics of sediments in coastal shallow waters from Van Don to Tien Yen—Ha Coi, northwest Gulf of Tonkin, Vietnam, according to end-member modelling analysis. Vietnam J. Mar. Sci. Technol. 2024, 24, 1–16. [Google Scholar] [CrossRef] [Scilit]
- Poizot, E.; Murat, A.; Baux Frigola, N.; Gregoire, G.; Méar, Y. MSTA: A new framework for sediment dynamic analysis. Estuar. Coast. Shelf Sci. 2026, 335, 109844. [Google Scholar] [CrossRef] [Scilit]
- McLaren, P. An interpretation of trends in grain size measures. J. Sediment. Petrol. 1981, 51, 611–624. [Google Scholar] [CrossRef] [Scilit]
- McLaren, P.; Bowles, D. The effects of sediment transport on grain-size distributions. J. Sediment. Petrol. 1985, 4, 457–470. [Google Scholar] [CrossRef] [Scilit]
- Gao, S.; Collins, M. Net sediment transport patterns inferred from grain-size trends, based upon definition of ‘transport vectors’. Sediment. Geol. 1992, 80, 47–60. [Google Scholar] [CrossRef] [Scilit]
- Le Roux, J.P. Net sediment transport patterns inferred from grain-size trends, based upon definition of ‘transport vectors’—Comment. Sediment. Geol. 1994, 90, 153–156. [Google Scholar] [CrossRef] [Scilit]
- Le Roux, J.P.; Rojas, E. Sediment transport patterns determined from grain size parameters: Overview and state of the art. Sediment. Geol. 2007, 202, 473–488. [Google Scholar] [CrossRef] [Scilit]
- McLaren, P.; Hill, S.H.; Bowles, D. Deriving transport pathways in a sediment trend analysis (STA). Sediment. Geol. 2007, 202, 489–498. [Google Scholar] [CrossRef] [Scilit]
- Poizot, E.; Méar, Y.; Thomas, M.; Garnaud, S. The application of geostatistics in defining the characteristic distance for grain-size trend analysis. Comput. Geosci. 2006, 32, 360–370. [Google Scholar] [CrossRef] [Scilit]
- Poizot, E.; Méar, Y.; Biscara, L. Sediment trend analysis through the variation of granulometric parameters: A review of theories and applications. Earth-Sci. Rev. 2008, 86, 15–41. [Google Scholar] [CrossRef] [Scilit]
- Poizot, E.; Méar, Y. Using a GIS to enhance grain size trend analysis. Environ. Model. Softw. 2010, 25, 513–525. [Google Scholar] [CrossRef] [Scilit]
- O’Shea, M.; Murphy, J. The validation of a new GSTA case in a dynamic coastal environment using morphodynamic modelling and bathymetric monitoring. J. Mar. Sci. Eng. 2016, 4, 27. [Google Scholar] [CrossRef] [Scilit]
- Yu, X.; Li, T.; Gu, D.; Feng, A.; Liu, S.; Li, P.; Xu, G.; Yan, W.; Zhang, Z.; Zhu, Z. Sediment transport in the Luanhe River delta: Grain size trend analysis. J. Oceanol. Limnol. 2019, 37, 982–997. [Google Scholar] [CrossRef] [Scilit]
- Paladino, Í.M.; Mengatto, M.F.; Mahiques, M.M.; Noernberg, M.A.; Nagai, R.H. End-member modeling and sediment trend analysis as tools for sedimentary processes inference in a subtropical estuary. Estuar. Coast. Shelf Sci. 2022, 278, 108126. [Google Scholar] [CrossRef] [Scilit]
- Baux, N.; Murat, A.; Poizot, E.; Méar, Y.; Grégoire, G.; Lesourd, S.; Dauvin, J.-C. An innovative geostatistical sediment trend analysis using geochemical data to highlight sediment sources and transport. Comput. Geosci. 2022, 26, 263–278. [Google Scholar] [CrossRef] [Scilit]
- Liu, T.; Shi, X.; Li, C.; Yang, G. The reverse sediment transport trend between abandoned Huanghe River (Yellow River) delta and radial sand ridges along Jiangsu coastline of China—An evidence from grain size analysis. Acta Oceanol. Sin. 2012, 31, 83–91. [Google Scholar] [CrossRef] [Scilit]
- Li, T.; Li, T.J. Sediment transport processes in the Pearl River estuary as revealed by grain-size end-member modeling and sediment trend analysis. Geo-Mar. Lett. 2018, 38, 167–178. [Google Scholar] [CrossRef] [Scilit]
- Yuan, X.; Yang, Q.; Meadows, M.E.; Luo, X.; Wang, Z. Grain size and organic geochemistry of recent sediments in Lingding Bay, Pearl River delta, China: Implications for sediment dispersal and depositional processes perturbed by human activities. Anthr. Coasts 2021, 4, 147–167. [Google Scholar] [CrossRef] [Scilit]
- Chen, J.; Wu, S.; Liu, S.; Chen, W.; Qin, Y.; Wan, X. Sedimentary dynamics in the distal margin around isolated carbonate platforms of the northern South China Sea. Front. Earth Sci. 2022, 10, 884921. [Google Scholar] [CrossRef] [Scilit]
- Meng, L.; Wang, L.; Zhao, J.; Zhan, C.; Liu, X.; Cui, B.; Zeng, L.; Wang, Q. End-member characteristics of sediment grain size in modern Yellow River delta sediments and its environmental significance. Front. Mar. Sci. 2023, 10, 1141187. [Google Scholar] [CrossRef] [Scilit]
- Ostrowski, R.; Pruszak, Z.; Różyński, G.; Szmytkiewicz, M.; Van Ninh, P.; Quynh, D.N.; Lien, N.T.V. Coastal processes at selected shore segments of south Baltic Sea and Gulf of Tonkin (South China Sea). Arch. Hydro-Eng. Environ. Mech. 2009, 56, 3–28. [Google Scholar]
- Thanh, D.X.; Quan, N.H.; Trang, N.T.H.; Nhan, T.T.T.; Huu, V.C. Grain-size characteristics and net transport patterns of surficial sediments in the Day River estuary. VNU J. Sci. Earth Environ. Sci. 2024, 40, 105–115. [Google Scholar] [CrossRef] [Scilit]
- Li, Q.; Qian, R.; Gao, J.; Huang, J. Environmental impacts and risks of bridges and tunnels across lakes: An overview. J. Environ. Manag. 2022, 319, 115684. [Google Scholar] [CrossRef] [Scilit] [PubMed]
- Mazarrasa, I.; Garcia-Orellana, J.; Puente, A.; Juanes, J.A. Coastal engineering infrastructure impacts Blue Carbon habitats distribution and ecosystem functions. Sci. Rep. 2022, 12, 19352. [Google Scholar] [CrossRef] [Scilit] [PubMed]
- Fashchuk, D.Y.; Terentyev, A.S.; Kovalchuk, S.K.; Kucheruk, N.V. Present geoecological transformations in the Kerch strait ecosystem. Her. Russ. Acad. Sci. 2019, 89, 166–171. [Google Scholar] [CrossRef] [Scilit]
- Pruszak, Z.; Szmytkiewicz, M.; Hung, N.M.; Van Ninh, P. Coastal processes in the Red River delta area, Vietnam. Coast. Eng. J. 2002, 44, 97–126. [Google Scholar] [CrossRef] [Scilit]
- Van Maren, D.S.; Hoekstra, P. Seasonal variation of hydrodynamics and sediment dynamics in a shallow subtropical estuary: The Ba Lat River, Vietnam. Estuar. Coast. Shelf Sci. 2004, 60, 529–540. [Google Scholar] [CrossRef] [Scilit]
- Duc, D.M.; Nhuan, M.T.; Van Ngoi, C.; Nghi, T.; Tien, D.M.; van Weering, T.C.E.; van den Bergh, G.D. Sediment distribution and transport at the nearshore zone of the Red River delta, Northern Vietnam. J. Asian Earth Sci. 2007, 29, 558–565. [Google Scholar] [CrossRef] [Scilit]
- Mathers, S.; Zalasiewicz, J. Holocene sedimentary architecture of the Red River delta, Vietnam. J. Coast. Res. 1999, 15, 314–325. [Google Scholar]
- Fyhn, M.B.W.; Thomsen, T.B.; Keulen, N.; Knudsen, C.; Rizzi, M.; Bojesen-Koefoed, J.ø.; Olivarius, M.; Tri, T.V.; Phach, P.V.; Minh, N.Q.; et al. Detrital zircon ages and heavy mineral composition along the Gulf of Tonkin—Implicationfor sand provenance in the Yinggehai-Song Hong and Qiongdongnan basins. Mar. Pet. Geol. 2019, 101, 162–179. [Google Scholar] [CrossRef] [Scilit]
- Mather, S.J.; Davies, J.; McDonald, A.; Zalasiewicz, J.A.; Marsh, S. The Red River Delta of Vietnam. British Geological Survey Technical Report WC/96/02; British Geological Survey: Nottingham, UK, 1996; 41p. [Google Scholar]
- Huu, V.C.; Hoan, L.X.; Son, N.M. Calculation of waves and sediment transport in the nearshore Hai Hau - Nam Dinh. J. Water Resour. Sci. Technol. 2012, 7. (In Vietnamese). Available online: https://www.vawr.org.vn/tinh-toan-song-va-van-chuyen-bun-cat-tai-vung-bien-ven-bo-hai-hau-nam-dinh (accessed on 4 November 2026).
- Wijdeven, B. Coastal Erosion on a Densely Populated Delta Coast: The Interactions between Man and Nature—A Case Study of Nam Dinh Province, Red River Delta, Vietnam. Master’s Thesis, Delft University of Technology, Delft, The Netherlands, 2002. Available online: https://resolver.tudelft.nl/uuid:c844fe54-2421-46d4-a26b-3352e5bcdc61 (accessed on 15 October 2026).
- Vu, L.G. Coastal Morphology: A Case Study in Province of Nam Dinh, Red River Delta, Vietnam. Master’s Thesis, Delft Uni-versity of Technology, Delft, The Netherlands, 2003. Available online: https://ihedelftrepository.contentdm.oclc.org/digital/collection/masters2/id/46104/ (accessed on 15 October 2026).
- Hoan, L.X.; Hanson, H.; Larson, M.; Donnelly, C.; Nam, P.T. Modeling shoreline evolution at Hai Hau Beach, Vietnam. J. Coast. Res. 2010, 26, 31–43. [Google Scholar] [CrossRef] [Scilit]
- Vu, C.H.; Le, X.H.; Pham, N.T.; Tran, D.H.; Pham, V.C.; Doan, T.H.; Tran, A.T. One-line modelling of sediment transport and shoreline evolution on a river-dominated coast: The Day Estuary, Vietnam. Sustain. Mar. Struct. 2026, 8, 238–257. [Google Scholar] [CrossRef] [Scilit]
- Nguyen, K.N.; Mac, V.D.; Nguyen, A.T. Evolution of Lach Giang estuary through analysis of historical documents, satellite images and political orientation to stabilize the coast. J. Water Resour. Sci. Technol. 2013, 16. (In Vietnamese). Available online: https://www.vawr.org.vn/images/File/PGS.TS.%20Nguyen%20Khac%20Nghia.pdf (accessed on 4 November 2026).
- Hung, D.Q.; Dang, V.H.; Pha, P.D.; Nguyet, N.T.A.; Huong, N.B.; Son, N.T. Studying and forecasting the evolution of the Day river coastal zone up to the year of 2070. Vietnam J. Mar. Sci. Technol. 2020, 20, 39–49. (In Vietnamese) [Google Scholar] [CrossRef] [Scilit]
- Nhon, D.H.; Thanh, T.D.; Nghi, D.T.; Trang, C.T.T.; Kha, P.T.; Anh, N.T.K.; Hai, P.S. Accumulation of Persistent Organic Pollutants in Sediment on Tidal Flats in the North of Vietnam. VNU J. Sci. Earth Environ. Sci. 2014, 30, 13–26. [Google Scholar]

Disclaimer/Publisher’s Note: The statements, opinions and data contained in all publications are solely those of the individual author(s) and contributor(s) and not of MDPI and/or the editor(s). MDPI and/or the editor(s) disclaim responsibility for any injury to people or property resulting from any ideas, methods, instructions or products referred to in the content. |
© 2026 by the authors. Licensee MDPI, Basel, Switzerland. This article is an open access article distributed under the terms and conditions of the Creative Commons Attribution (CC BY) license.