


Abstract
This study investigates the impacts of Posidonia oceanica (hereinafter P. oceanica) meadows on the coastal morphodynamics of Navarino Bay, Greece, and their role in mitigating coastal erosion. To achieve this, we employed the MIKE 21/3 Coupled Model FM to conduct hydrodynamic and morphodynamic simulations. The study compares two scenarios, one with and one without the presence of P. oceanica, to assess its impact on sediment stability and shoreline protection. Field data, including bathymetric and coastal morphology metrics, were integrated with wind and wave statistics from the Poseidon system. Advanced geospatial tools (ArcGIS Pro) and numerical modeling were used to simulate wave dynamics, current speeds, and sediment transport over a one-year period. Our findings indicate that P. oceanica reduces current velocities and wave energy, leading to enhanced sediment stabilization and reduced erosion rates. This research emphasizes the geomorphological significance of P. oceanica as a protective measure and a nature-based solution (NBS) for addressing coastal management challenges. Our results underscore the need for sustainable practices to maintain the integrity of Mediterranean seagrass meadows amid rising environmental pressures.
1. Introduction
Coastal zones are dynamic interfaces where terrestrial and marine environments interact, shaped by complex physical, biological, and anthropogenic processes. These regions provide critical ecosystem services, support diverse marine and terrestrial habitats, and are home to a significant proportion of the global population [1,2]. Among the various coastal ecosystems, seagrass meadows, such as those formed by P. oceanica, play a fundamental role in shoreline stabilization and mitigation of coastal erosion. Their extensive root and rhizome systems stabilize sediments and reduce hydrodynamic energy, thus contributing to coastal resilience [3,4]. However, seagrass meadows are increasingly threatened by human activities, including coastal development, pollution, and climate change, raising concerns about their long-term viability and effectiveness as a nature-based coastal defense strategy [5,6].
Coastal erosion is one of the most pressing issues affecting coastal stability, exacerbated by sea level rise, storm surges, and anthropogenic disturbances [1,7]. In the Mediterranean region, P. oceanica meadows serve as a crucial buffer against these challenges by attenuating wave energy and trapping coastal sediments [3]. However, despite their widely recognized ecological importance, the quantitative assessment of their role in coastal protection remains limited, particularly in regions experiencing increasing anthropogenic pressures [5].
Navarino Bay, located on the southwestern coast of Greece, presents an ideal setting for studying the influence of P. oceanica on coastal erosion due to its unique geomorphological characteristics and the presence of extensive seagrass meadows. The bay is subject to natural coastal dynamics and human-induced stressors, such as tourism and maritime activities, which influence sediment transport and shoreline stability [8,9]. Understanding the role of P. oceanica in this context is essential for developing effective conservation and management strategies aimed at enhancing coastal resilience. Numerical modelling offers a means of quantifying the effect of seagrass meadows on coastal hydrodynamics, which is difficult to obtain from field measurements alone since the response of the system in the absence of the meadows cannot be observed directly. Process-based coastal models have different approaches in the representation of vegetation. Some models require detailed data on plant height, shoot density, etc., and resolve the flow within the meadow. Other approaches represent the meadows through an increased bed roughness [4]. Given the data available for Navarino Bay, the latter approach was adopted here. This study employs the MIKE 21/3 Coupled Model FM to simulate wave, current, and sediment interactions in Navarino Bay under two different scenarios—with and without the presence of P. oceanica meadows [10]. Numerical modeling provides a robust framework for assessing the extent to which seagrass meadows contribute to coastal protection, offering valuable insights for sustainable coastal zone management. By evaluating the capacity of P. oceanica to mitigate erosion and stabilize sediments, this research contributes to the growing body of knowledge on nature-based solutions for coastal protection.
Ecological Role of P. oceanica
P. oceanica (L.) Delile is a marine angiosperm found in the Mediterranean Sea, covering 1–2% of the seabed and dominating nearly half of the sublittoral zone [11]. P. oceanica is distinguishable by its elongated leaves, intricate root system, and dense leaf covering its rhizomes [12]. Its dense growth forms “mats,” crucial for ecosystem engineering and marine biodiversity [13,14]. P. oceanica meadows serve as habitats for fish, crustaceans, mollusks and other organisms, enriching coastal ecosystems through oxygen production via photosynthesis [15,16,17]. They also function as significant carbon sinks, binding carbon within their “mat” and contributing to climate change mitigation [18,19].
Moreover, seagrasses like P. oceanica enhance biological productivity and biodiversity by providing attachment sites, stabilizing sediments, and creating microhabitats distinct from unvegetated areas [12,20]. They also act as natural water filters, trapping suspended particles and significantly attenuating wave energy, thereby contributing to coastal protection [4,21,22,23]. Conversely, degradation of P. oceanica meadows correlates with reduced biodiversity and diminished ecosystem services [24].
Research by Panayotidis et al. [25] confirms that P. oceanica is the dominant seagrass species in Greek waters, covering much of the seabed up to depths of 25–30 m (and even deeper in some areas). Furthermore, meadows of this species are present along approximately 70% of the Greek coastline [25]. Conservation of P. oceanica is reinforced through international agreements such as the Barcelona Convention (1976), the Bern Convention (1979) and the EU Habitats Directive (92/43/EEC) [26,27,28]. However, a knowledge gap persists in the eastern Mediterranean, for example, detailed habitat mapping and long-term monitoring data on P. oceanica distribution and degradation are scarce in Egypt, Turkey, and Cyprus [6,29].
2. Study Area
2.1. Geographical Setting and Hydrology
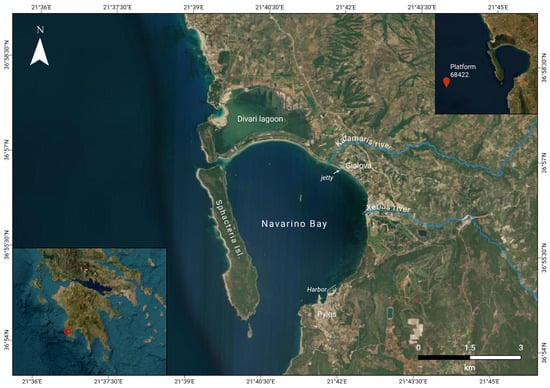
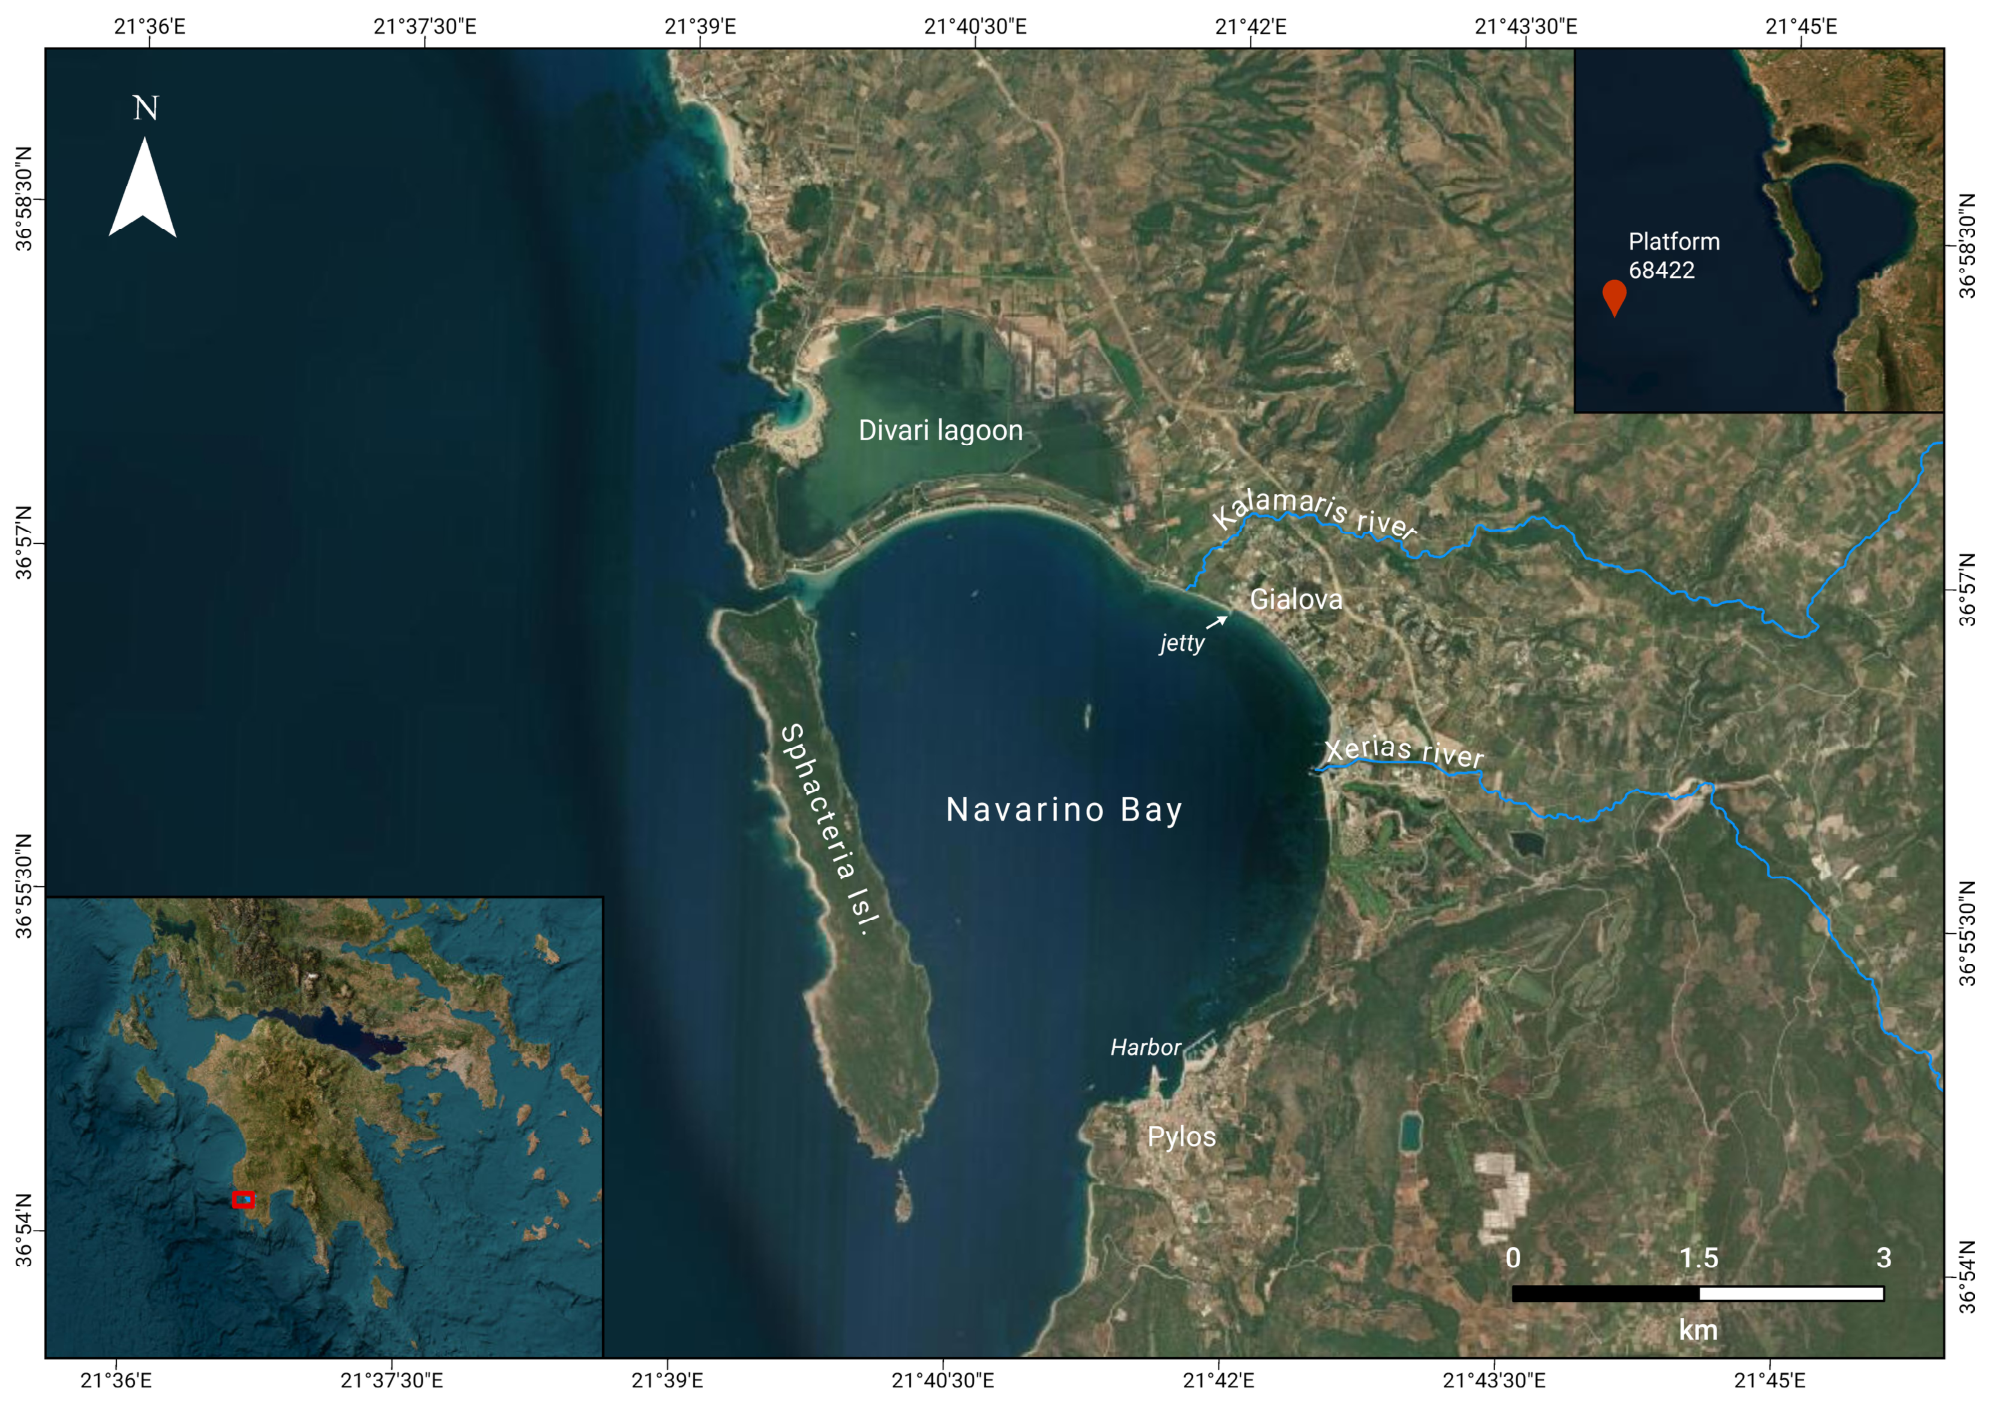
Navarino Bay is located on the southwestern coast of the Peloponnese, Greece (Figure 1). It has a distinctive elliptical shape, and it is semi-enclosed by the elongated Sphacteria Island, which forms a natural barrier along the bay’s western side [8,30]. A sandy barrier island in the northern part of the bay, measuring around 3 km in length and 200–300 m in width, separates the bay from the Divari lagoon [8,31]. This barrier, estimated to be over 2300 years old, was formed by sediment deposits carried by the Xerias and Kalamaris rivers, whose estuaries are in the eastern flanks of the bay [8,9].
Figure 1.
Location of Navarino Bay, Peloponnese, Greece, and the main features described in the text. The lower left inset indicates the position of the study area within the Peloponnese (red frame), and the upper right inset the location of Poseidon platform 68422.
The longshore transport of sediments is from the west to the east, further contributing to the configuration of the barrier [8]. Sediment input to the bay is mainly from the aforementioned rivers (Figure 1), especially during rainy seasons, along with contributions from other streams [32].
The bay connects to the Ionian Sea through its southern mouth and via a narrow, shallow channel to the northwest. Additionally, it links to Divari Lagoon through a main artificial channel in the center of the sandy barrier, which is approximately 100 m long, 10 m wide, and 1.2 m deep [8,33]. The town of Pylos and the village of Gialova, located on the southeastern and eastern shores of the bay, respectively, are sources of urban pollution that affect the bay [30]. The eastern shoreline of the bay, from the sandy barrier to Pylos Harbour, has a length of approximately 8.5 km.
The current morphology of the Bay of Navarino is a consequence of tectonic and erosion events during the Quaternary [32]. The bay’s depth exceeds 60 m in the south and approximately 40 m at 1 km away from the northern sandbars [8]. The northern sandbars, formed by wave action from the Ionian Sea, create a wide arc in the bay’s northern part, featuring a sandy beach [8,9]. The bay is microtidal, and the tidal range is small relative to wind- and wave-induced water level variations.
2.2. Holocene Evolution, Human Influence, and Ecological Significance
Over the past 9000 years, Navarino Bay and the Ionian Sea have experienced significant morphological changes. A notable marine regression began around 9500–8900 BC, followed by sediment accumulation and shoreline progradation during 8000–4000 BC [9,32]. Around 5000 BC, stratigraphic studies revealed a maximum landward shift of the shoreline, as delta formation was driven by decelerating sea-level rise and increased sedimentation [8,34]. Soil erosion rates intensified with the advent of agricultural activities during 3200–1050 BC, contributing to landscape instability, particularly after 5000 BC, as deforestation and vegetation fluctuations compounded these effects [9,34]. These processes led to the formation of sandy beaches and dune fields, shaping the modern Navarino Strait, often referred to as “Sandy Pylos” [8,32].
The ecological diversity of the area, including grasslands, sandy shores, olive orchards, and wetlands, makes it a valuable site in the Natura 2000 network [8,9,35]. Seagrass meadows, such as the endemic P. oceanica, thrive in the area.
2.3. Coastal Erosion in Navarino Bay
Navarino Bay is shaped by tectonic activity, sediment transport, and erosion processes and has experienced significant shoreline changes over millennia as a result of both natural and anthropogenic factors. Human interventions, including the expansion of agriculture, changes in land-use practices, urban development and the historical construction of harbors and coastal infrastructure, have altered sediment fluxes and modified the natural balance of sediment transport and wave dynamics along the shoreline, disrupting the natural coastal balance [8,9,32,34].
Recent work on coastal change in the bay has focused on the coastal dunes, including research by Zacharias et al. [36], which identified significant changes in the shape of coastal sand dunes that resulted from both natural factors like rainfall and erosion by sea waves, as well as anthropogenic activities such as human presence on the dunes [36].
3. Materials and Methods
3.1. Data Collection
Table 1 presents the categories of data collected for the study along with their respective sources. Specifically, it includes bathymetric data, substrate types (mud, sand, hard structures), data on the presence of P. oceanica, and coastal data. The primary sources of the data are publications by Evelpidou et al. [37] and the EMODnet database (Table 1). The submarine geomorphology and substrate of the bay were mapped with a Humminbird HELIX 9 Side-Scan Sonar operating at 455 kHz, with a swath of 160 m and a positional accuracy of ±4.5 m [37]. The survey was carried out during January 2023 and achieved near-complete coverage of the ~17 km2 bay. Substrate types were delineated by on-screen digitisation of the acoustic imagery, supported by ROV photography and grab samples [37]. Thirty marine sediment samples were collected with a Van Veen grab at four representative depths (approximately 2, 5, 8 and 12 m) along cross-sections extending seawards from the beach, at distances of 30 to 830 m from the coastline [37]. Grain-size distributions and Folk–Ward graphical statistics were obtained by dry sieving through a stacked series of meshes from 4 mm to 63 µm [37], and processing using GRADISTAT v.8 [38]. The combination of these datasets provides a complete and continuous view of the bathymetry and surface features of the seabed (mud, sand, hard substrate, P. oceanica meadows) from offshore areas to the coastline.
Table 1.
Data collected and used in the model, together with their respective sources.
3.1.1. Bathymetry and Bottom Surface Composition
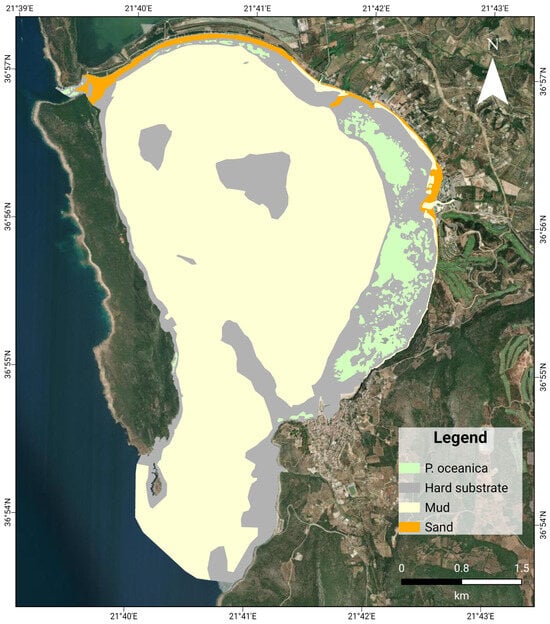
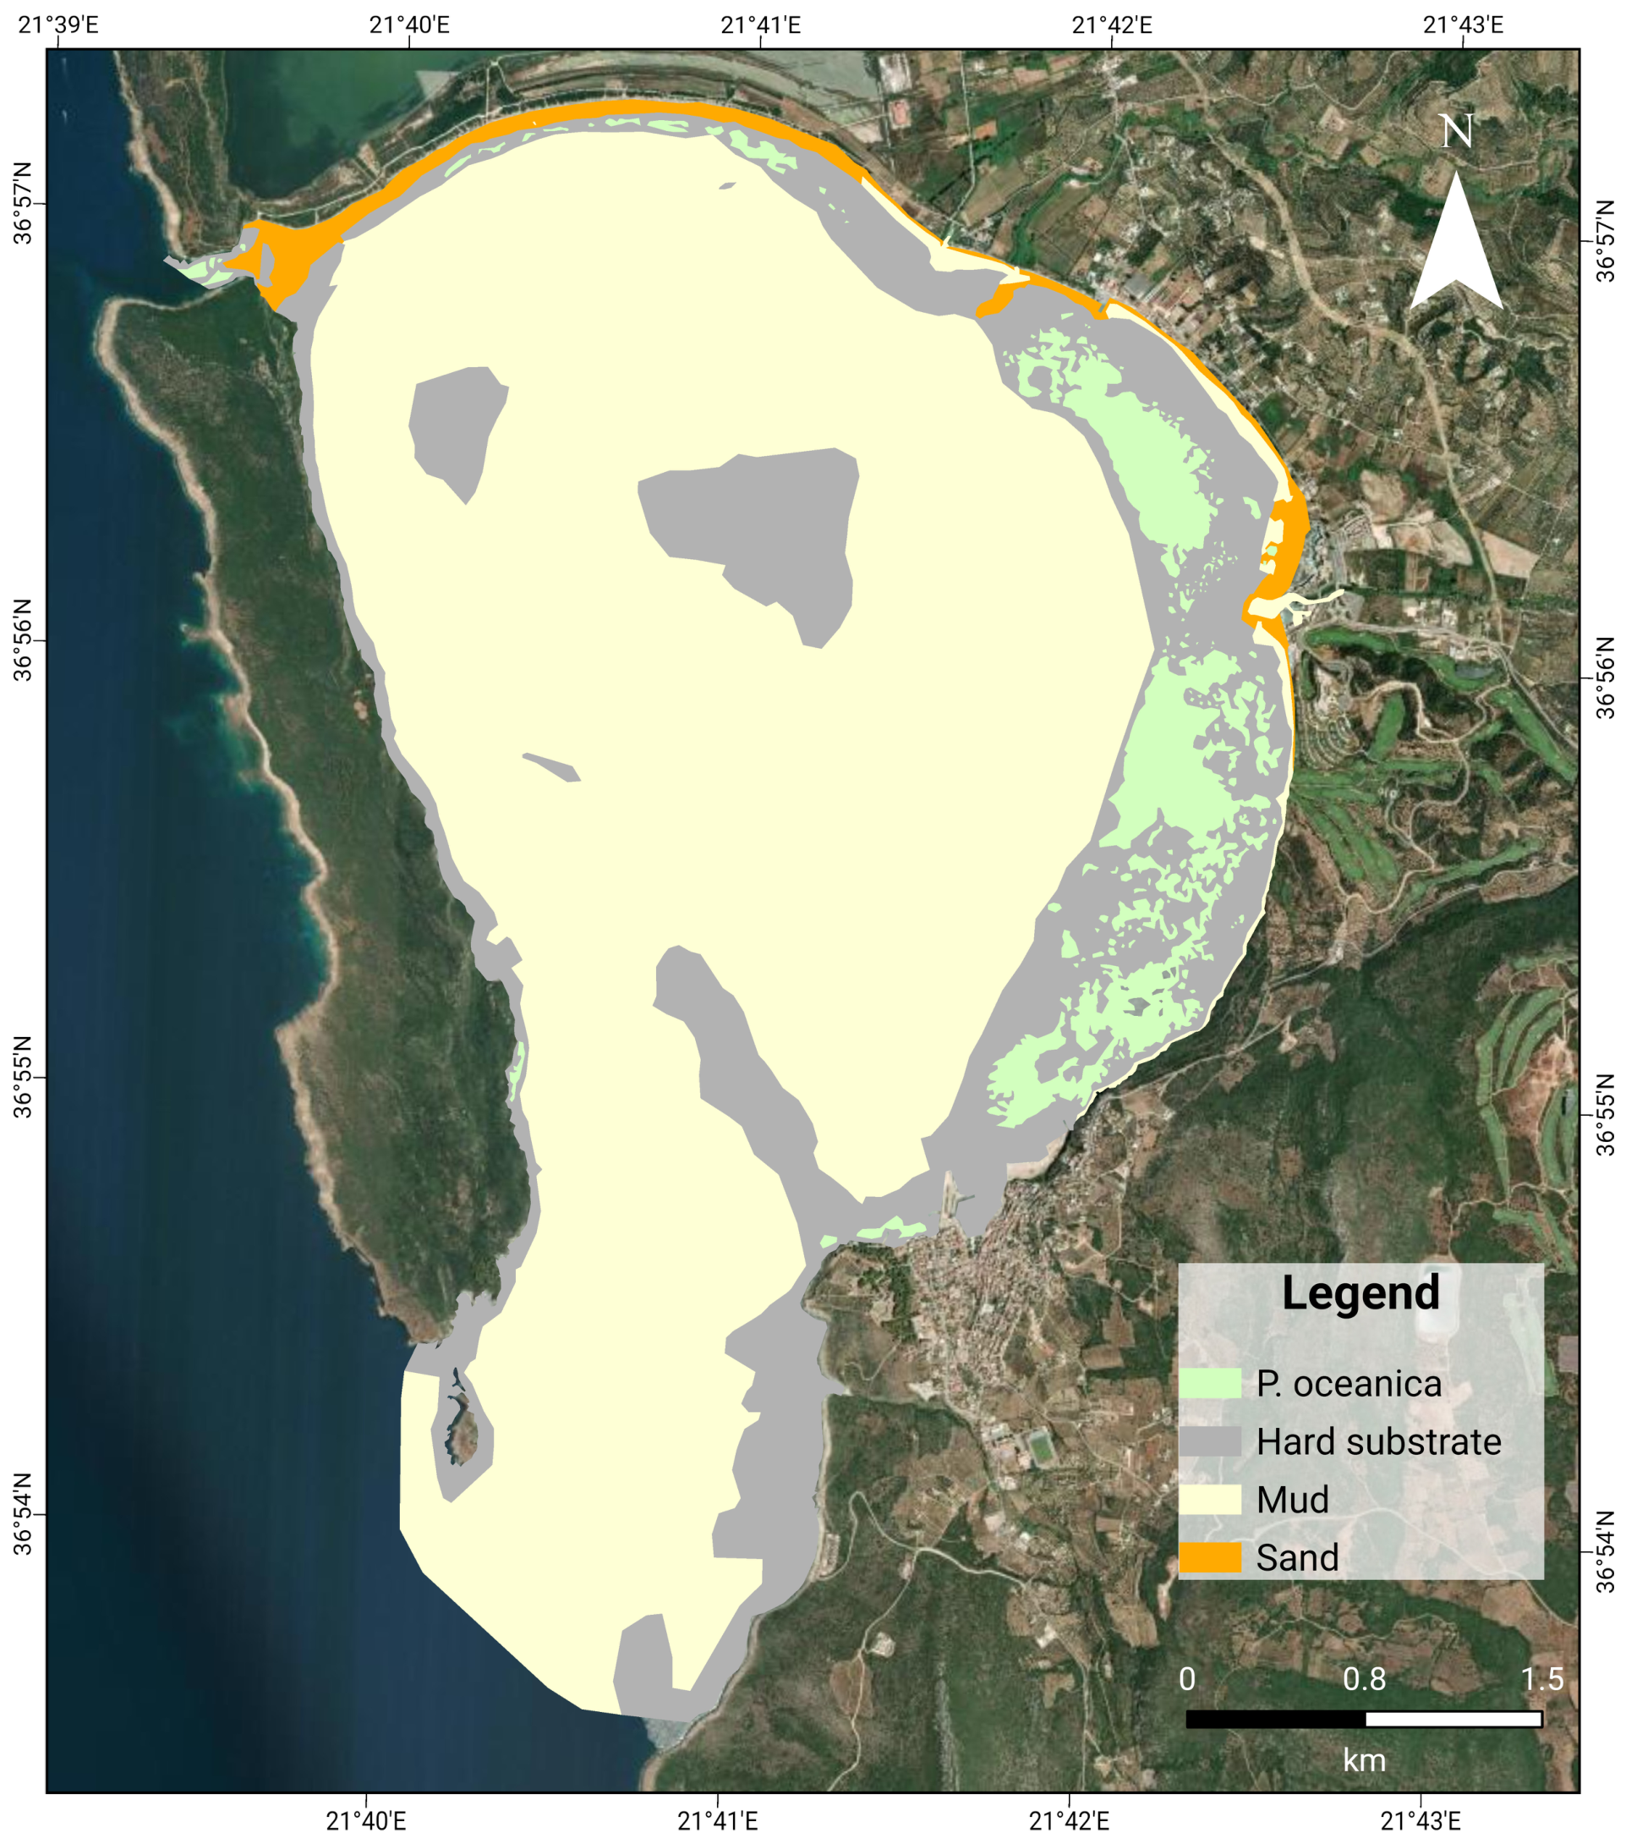
Within Navarino Bay, bathymetry and bottom surface composition (mud, sand, hard substrate, and P. oceanica meadows) were obtained from the surveys described above, collected by Evelpidou et al. [37]. Bathymetry and bottom surface composition were obtained from the European Marine Observation and Data Network (EMODnet) only for outside Navarino Bay [39,40]. The combination of these datasets provides a complete and continuous view of the bathymetry and surface features of the seabed (mud, sand, hard substrate, P. oceanica meadows) from offshore areas to the coastline (Figure 2).
Figure 2.
Spatial distribution of seabed substrates in Navarino Bay.
3.1.2. Wind and Wave Data
The wind and wave data utilized in this study were sourced from the Poseidon system [41], specifically platform 68422 (see Figure 1 for location), managed by the Hellenic Center for Marine Research (HCMR) (36.9° N, 21.6° E, water depth of approximately 1000 m). It provides long-term, continuous data, which is essential for a thorough analysis of wind and wave patterns over time. For the analysis, data spanning from 2007 to 2024 were selected, ensuring a comprehensive and consistent dataset that reflects the long-term variability of wind and wave conditions in the region. The data were accessed via the official Poseidon system website, with wind speed, wind direction, significant wave height (Hm0), mean wave direction (Mdir), and peak spectral wave period (Tp) recorded every three hours.
3.2. Data Analysis
ArcGIS Pro v. 3.0.0 was used to conduct mapping and geospatial analysis of both field-collected and external datasets. All data were visualized and edited within the software to ensure accurate representation and alignment with the Greek Grid coordinate system. The datasets were then refined and verified before being exported for further modeling. This methodology enabled robust evaluation of seafloor characteristics and supported subsequent modeling tasks by providing a high-quality, accurately georeferenced dataset.
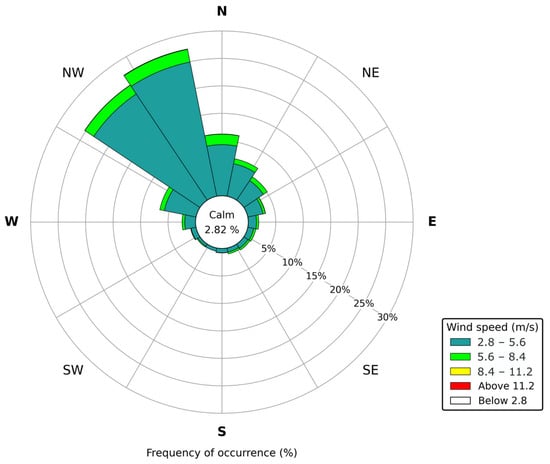
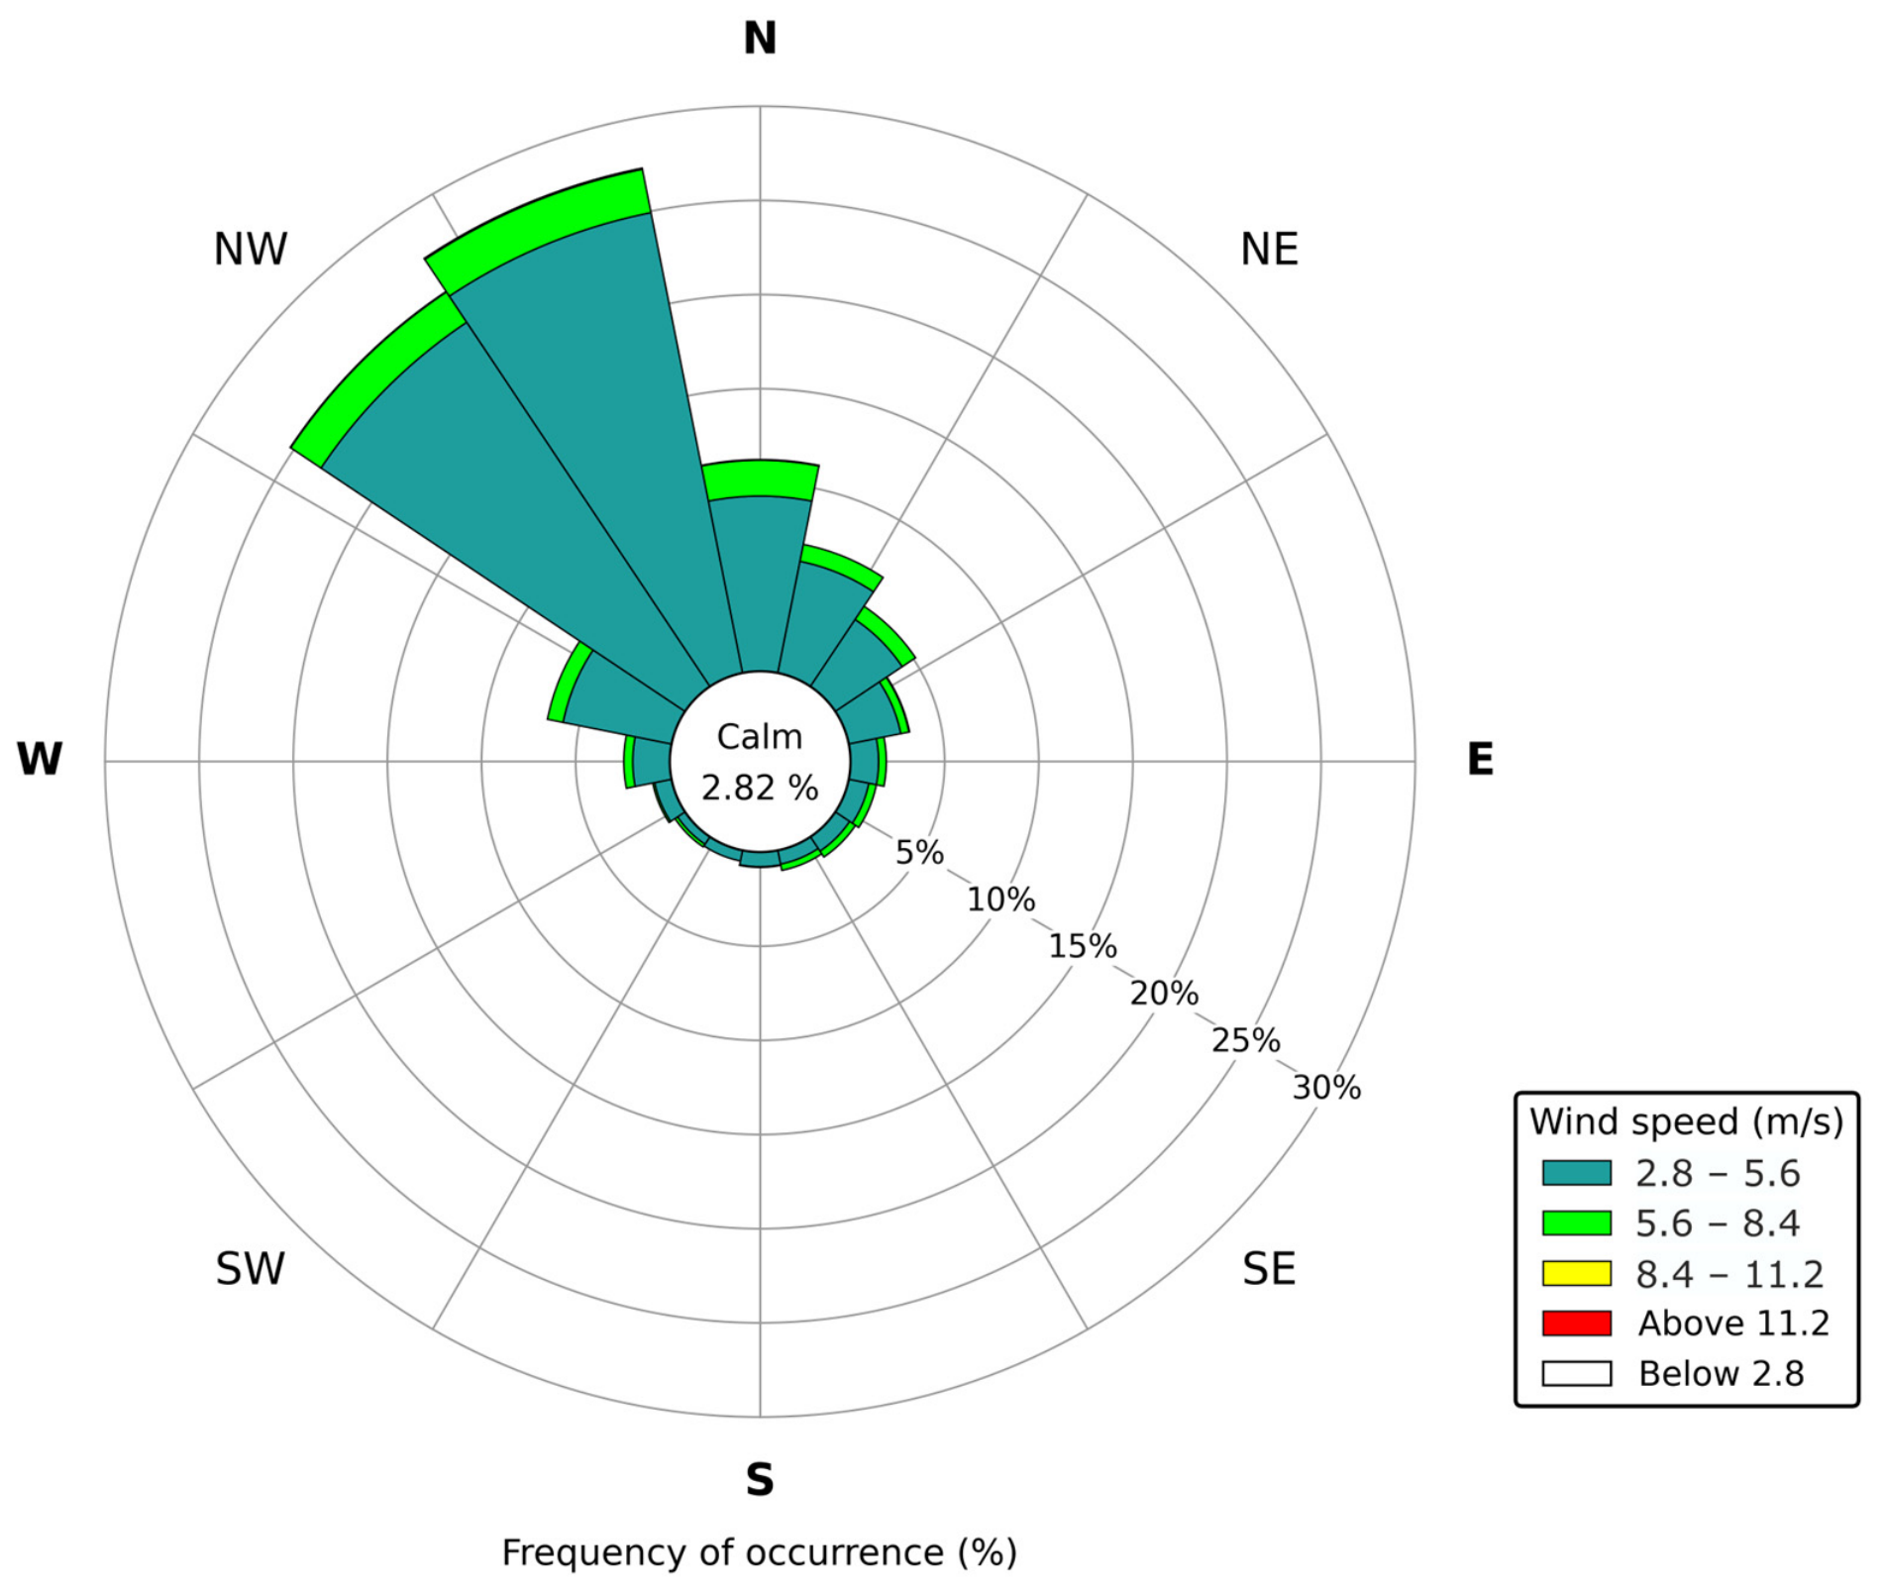
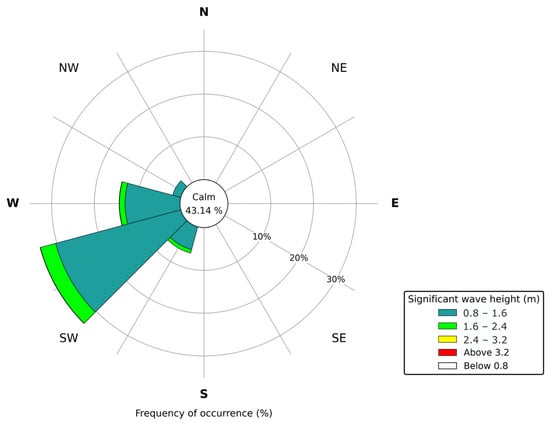
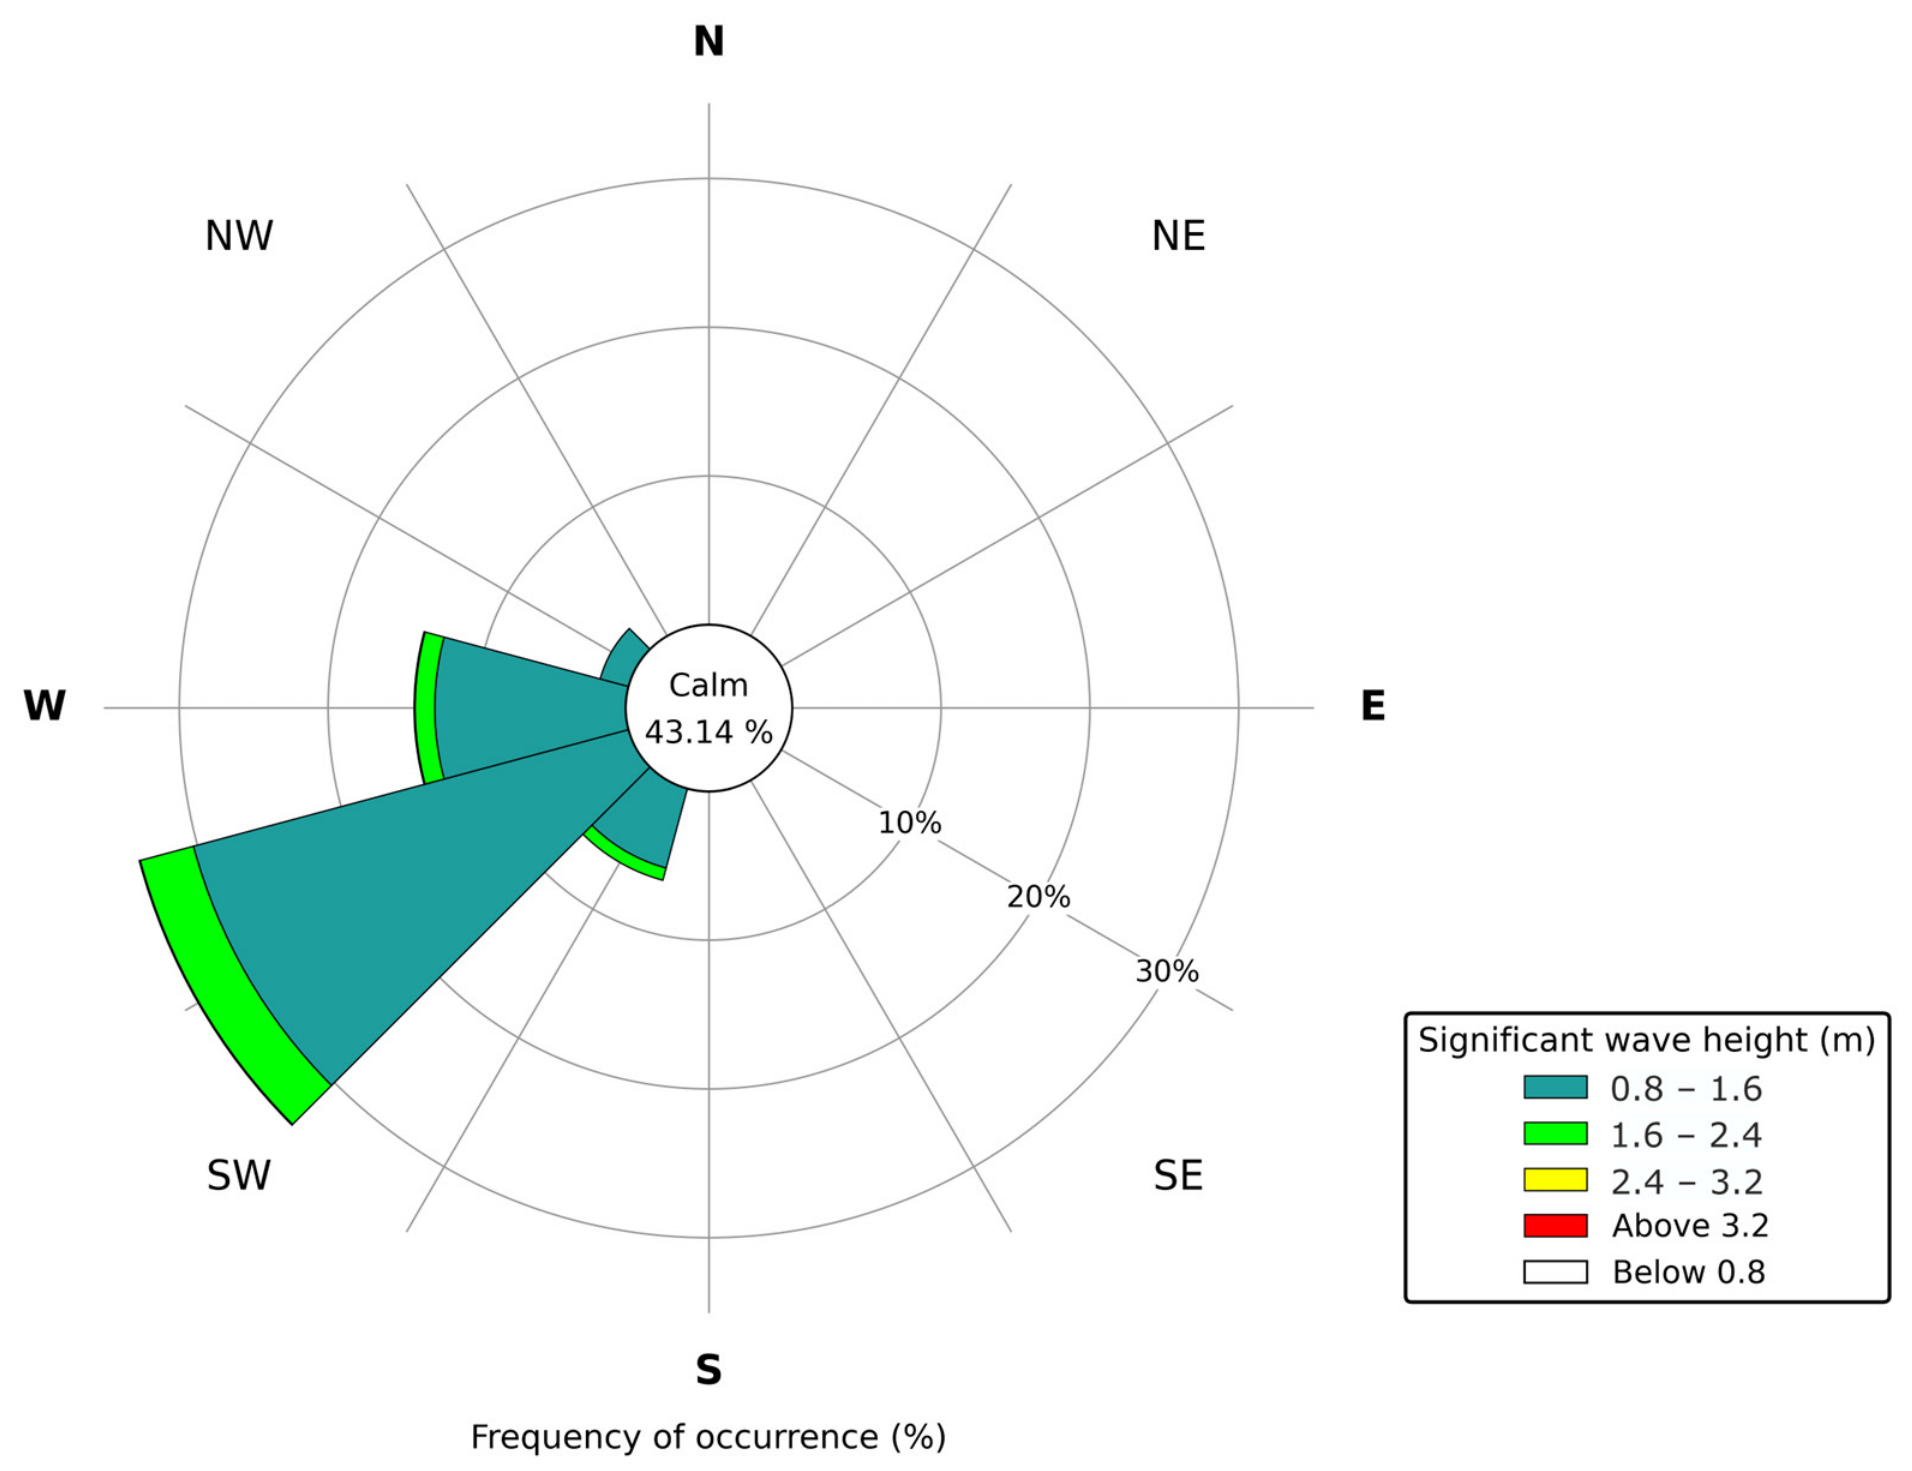
Also, the dataset for wind and wave data underwent careful processing to eliminate any potential outliers and inconsistencies, ensuring data reliability. The numerical simulations are forced using the complete 3 hourly wave time series recorded in 2024 (Figure 3 and Figure 4). This year was selected because its main wave statistics and directional distribution are considered representative of the wave climate observed between 2007 and 2024. The use of a 3 hourly time step allows the temporal variability of the wave forcing to be explicitly represented. However, this approach is computationally demanding, particularly for morphological simulations, which limits the simulations to a single representative year. By leveraging this long-term dataset, the study aimed to ensure that the selected forcing conditions represent typical wind and wave conditions in the region, which are critical for understanding coastal dynamics and simulating their impact on the morphodynamics of Navarino Bay.
Figure 3.
Wind rose for Navarino Bay, derived from the representative year. The radial axis shows the frequency of occurrence (%) and wind speed classes are indicated by the colour scale. Calm conditions (wind speed less than 2.8 m/s) comprise 2.82% of the record.
Figure 4.
Wave rose for Navarino Bay, derived from the representative year. The radial axis shows the frequency of occurrence (%) and significant wave height classes are indicated by the colour scale. Calm conditions (Hm0 below 0.8 m) comprise 43.14% of the record.
3.3. Model Setup
The MIKE 21/3 Coupled Model FM is an advanced, flexible modeling system developed by the Danish Hydraulic Institute (DHI) for simulating various water environments. Its unstructured grid approach allows for detailed, high-resolution analysis in regions of interest, such as nearshore areas, while maintaining coarser resolution offshore [42].
The model was applied to Navarino Bay to investigate coastal morphodynamics by integrating three main modules: the Hydrodynamic (HD) module, the Spectral Wave (SW) module, and the Sediment Transport (ST) module. Together, these components simulate water levels, currents, and wave actions, as well as sediment transport processes, enabling the continuous updating of the bay’s bathymetry throughout the simulation [42]. This comprehensive setup makes MIKE 21/3 Coupled Model FM well-suited for capturing the complex interactions between hydrodynamics, waves, and sediment dynamics [42].
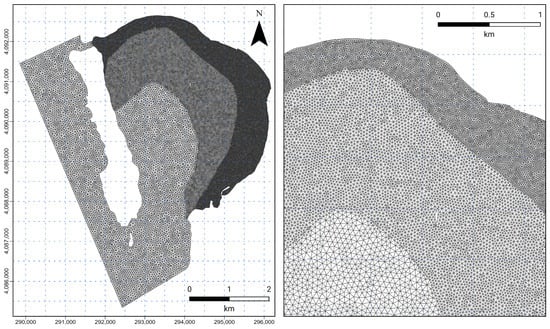
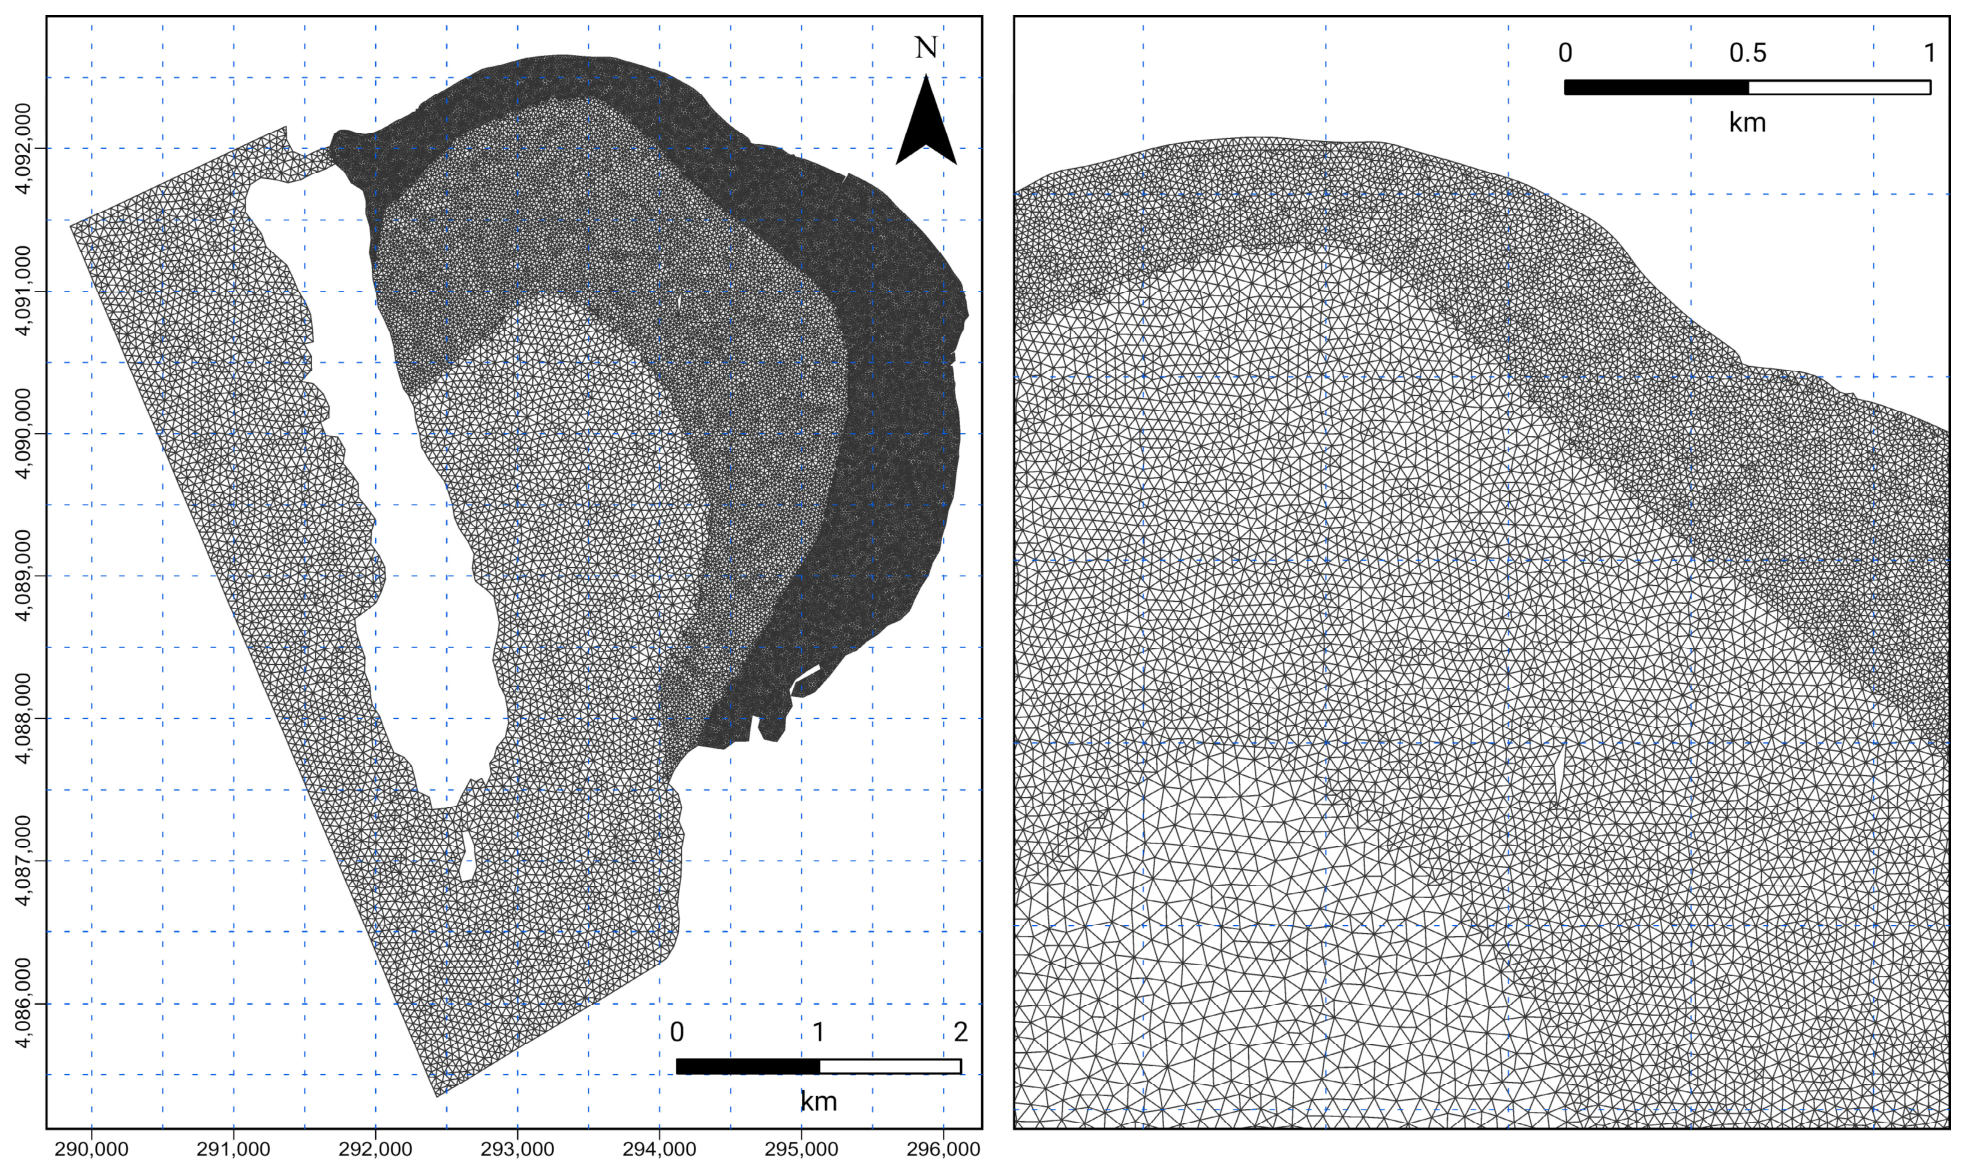
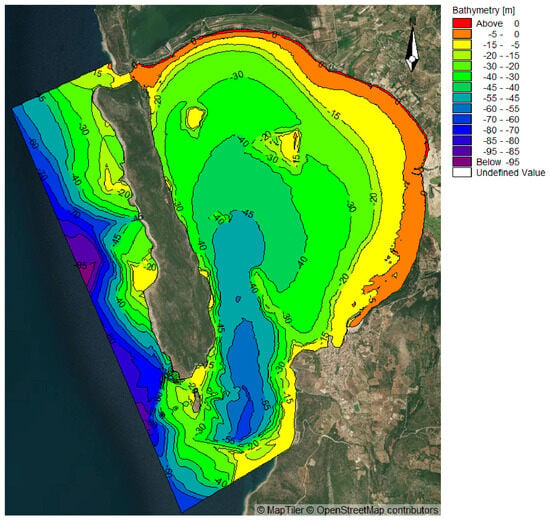
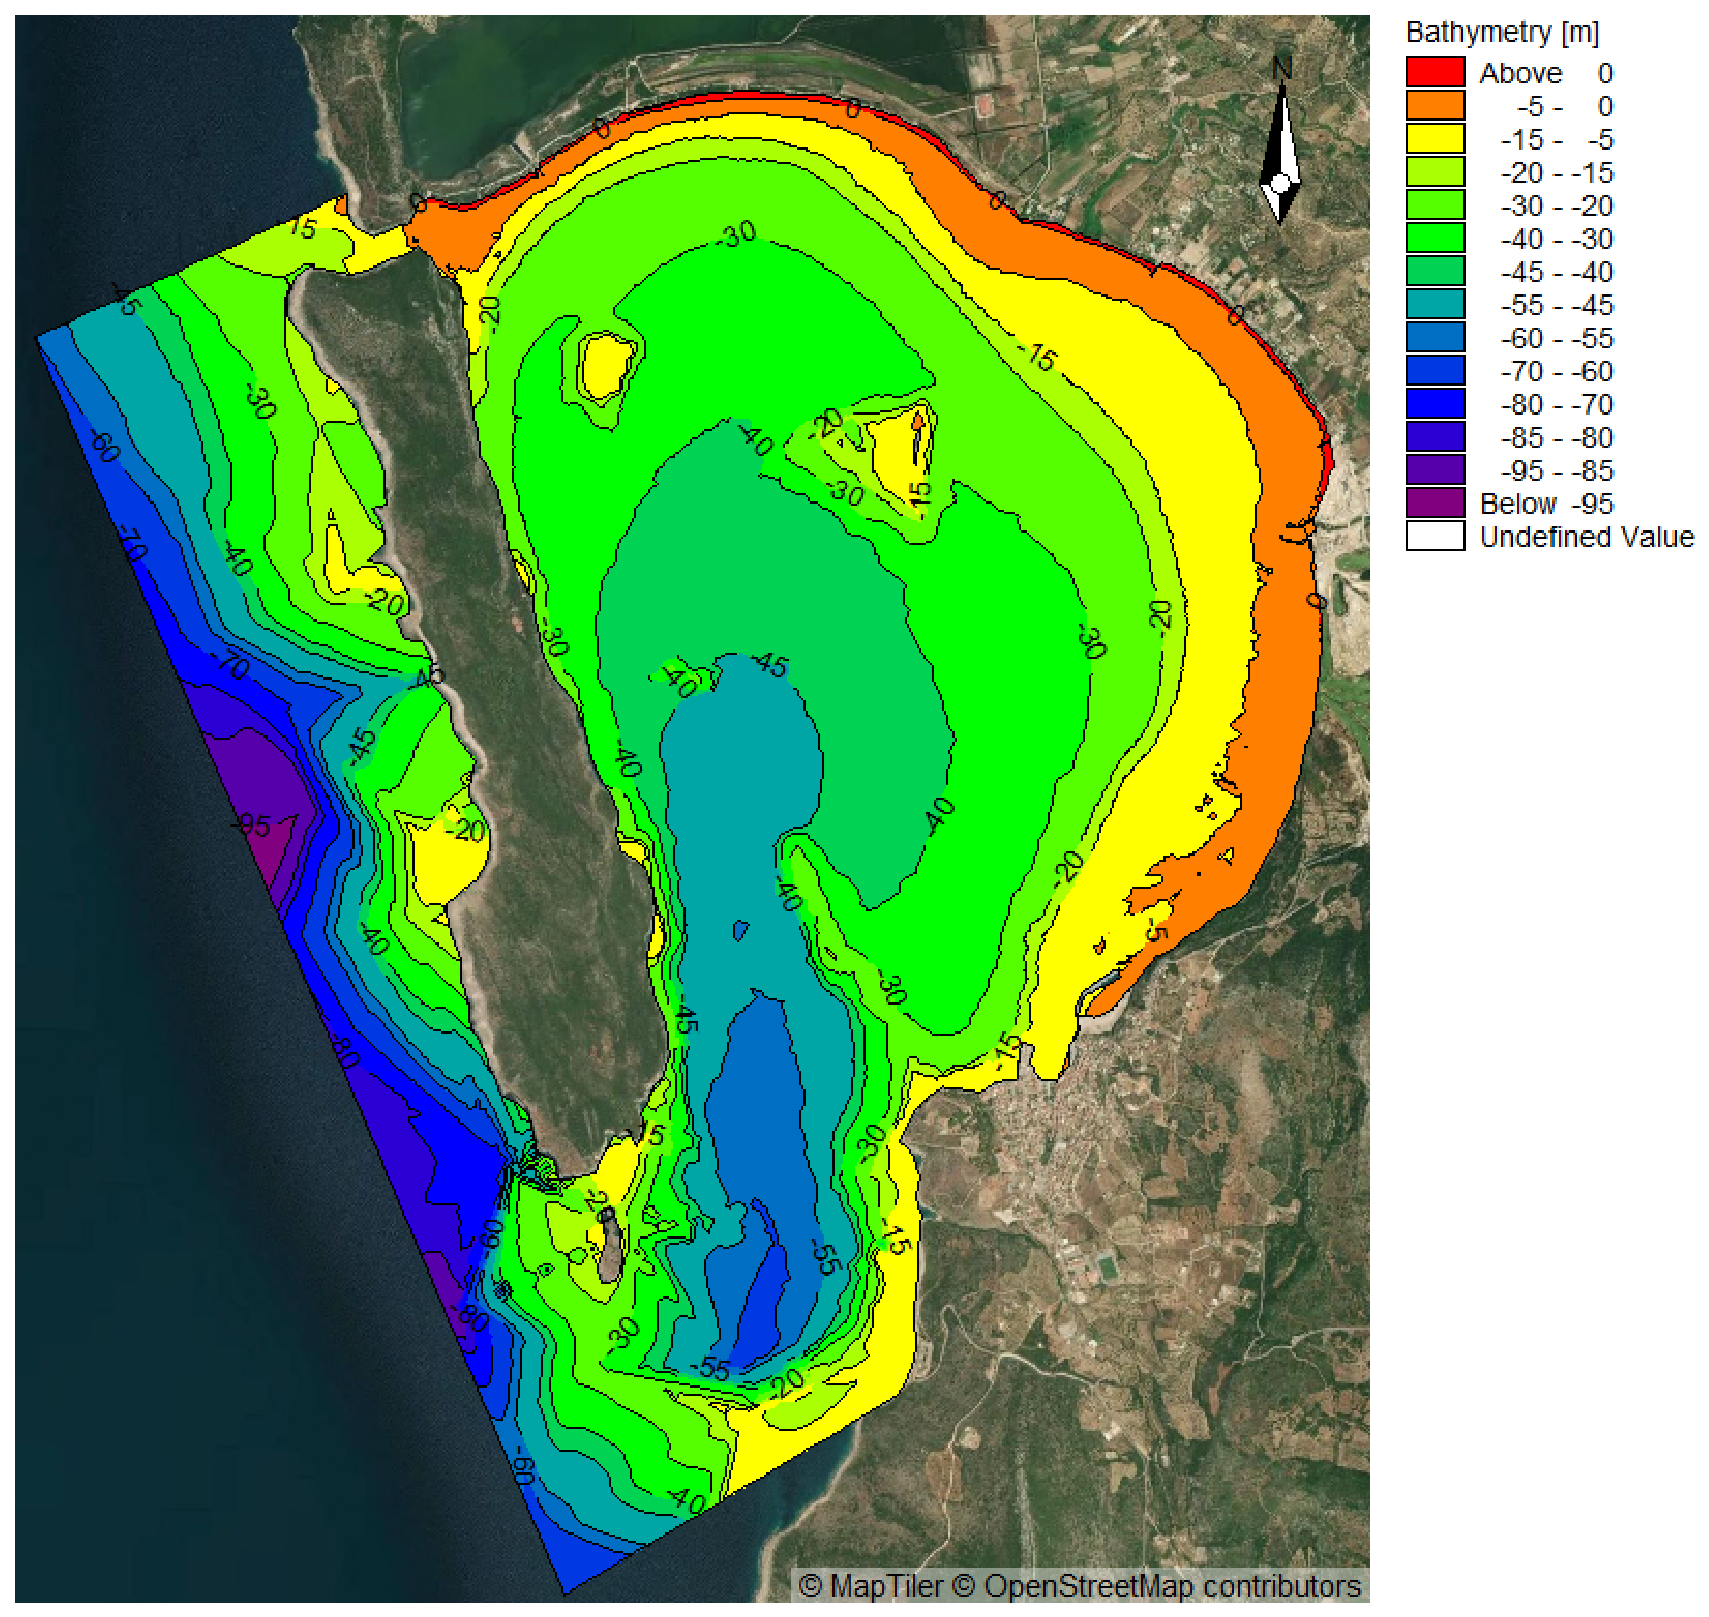
A triangular, unstructured mesh (Figure 5) was generated for the study area using the Mesh Generator tool in the MIKE Zero toolbox. Bathymetry data informed node elevations, ensuring accurate representation of the physical environment. Finer mesh resolution was allocated to shallow and coastal areas to capture detailed hydrodynamic processes. The mesh in the Greek Grid projection system comprises 65,420 elements and 33,361 nodes. The depth ranges from 96 m offshore to +1.9 m at the landward boundary, with a maximum water depth of 48 m within the bay (Figure 6).
Figure 5.
The unstructured mesh that was generated for the whole domain with the tool Mesh Generator (left), with finer resolution towards the coastline (right).
Figure 6.
Bathymetry mesh file that was created with the tool Mesh Generator. Contours are drawn at 10 m intervals. Depth ranges from 96 m offshore to +1.9 m at the landward boundary, with a maximum water depth of 48 m within the bay.
The model was forced with the significant wave height, peak period and mean wave direction of the representative year, together with the corresponding wind speed and direction. The harbour breakwater at Pylos and the jetty at Gialova are represented geometrically as part of the coastline of the computational mesh. No beach nourishment or other coastal interventions were carried out in the bay during the simulated period.
3.3.1. Bed Resistance
In the Hydrodynamic (HD) module, bed resistance is quantified using the Mannings’ M (or n) coefficient to represent friction between water flow and the seabed. Different substrates such as mud, sand, hard structures, and vegetated areas require distinct Mannings’ values based on their roughness characteristics. A higher M value corresponds to a smoother surface with less resistance, allowing water to flow more easily and at higher velocities [43]. Conversely, a lower M value indicates a rougher surface, increasing friction and slowing down the water flow [43].
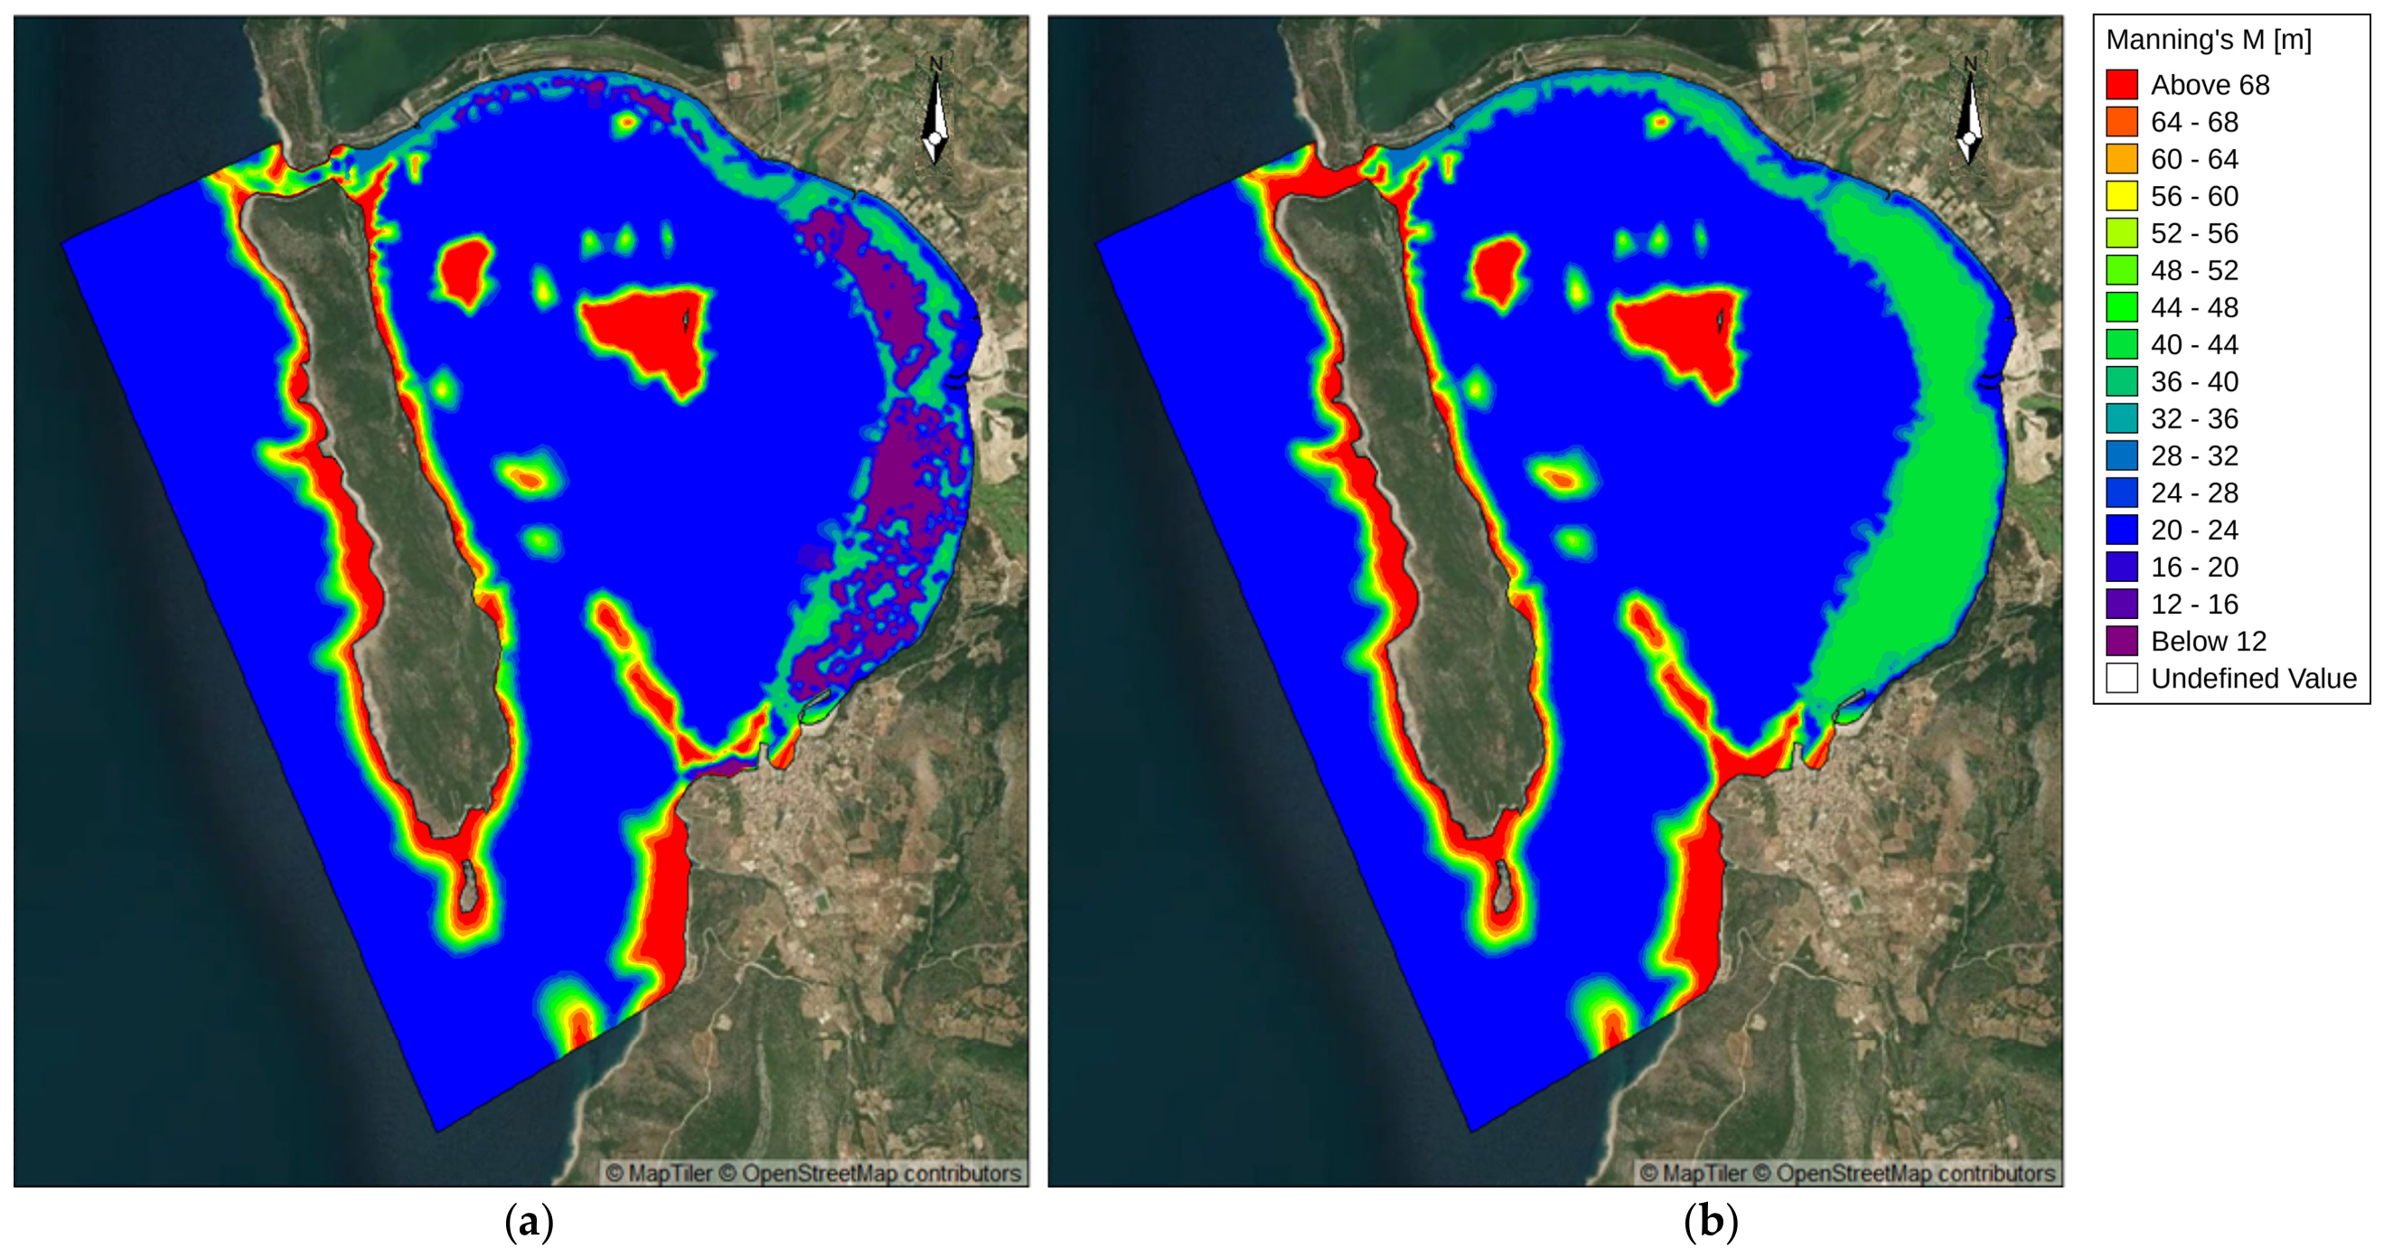
Mannings’ M values (Figure 7) were applied to represent bed resistance based on the specific substrate types found within Navarino Bay and its offshore areas. Different Mannings’ M values were assigned according to substrate type, identified during substrate mapping. These values, retrieved from the literature [44,45,46] and manuals (MIKE 21 manuals; Ref. [47]), were used to reflect substrate-specific roughness in Navarino Bay’s hydrodynamic simulations (Table 2). For numerical reasons, the Manning’s M coefficient values are not fixed but are extrapolated progressively between classes to allow for smooth transitional changes in bed resistance across the seabed to better represent gradual shifts in substrate types rather than abrupt boundaries [47,48]. Areas classified as “no data” in the substrate map were assigned the value of the surrounding class.
Figure 7.
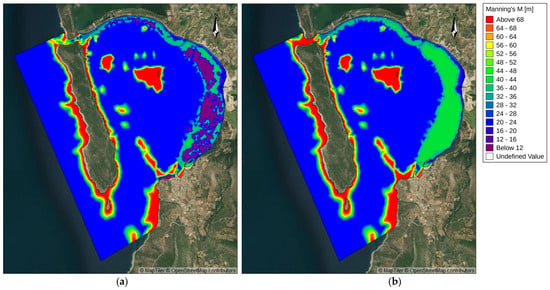
Manning’s M number for the whole domain with color zones indicating different Manning’s M values that were used in the simulation. These values range from 10 to 70 m1/3/s: (a) with and (b) without P. oceanica.
Table 2.
Manning’s M values (m1/3/s) for the substrate types identified in Navarino Bay. Values were derived from literature ranges and were applied in the simulations.
3.3.2. Sediment Properties and Sediment Table
The model calibration utilized key sedimentological properties that were obtained from Evelpidou et al. [37] to simulate sediment transport dynamics accurately. Median grain size (D50), representing the grain diameter at which 50% of the sediment sample by weight is finer, was obtained directly from the cumulative grain-size distribution curve. The Folk and Ward [49] graphical method allowed for the derivation of physical sediment descriptions, such as “very coarse sand” or “moderately sorted,” based on standard grain size classifications. Meanwhile, geometrical standard deviation (σg), which quantifies sediment sorting and affects bed roughness and flow resistance, was similarly derived using the Folk and Ward approach [49]. Given the limited number of sediment samples, average D50 and σg values were computed from the available data and applied uniformly across the model. This simplified parameterization approach, while not capturing spatial variability, aligns with standard practices in sediment modeling under data constraints [50,51].
The Q3D (Quasi-3D) sediment transport table in the MIKE 21 ST module was used to efficiently simulate sediment transport by pre-calculating sediment movement under different hydrodynamic conditions. These tables store sediment transport rates based on combinations of current velocities (horizontal flow), wave conditions (height, period, direction), sediment properties (grain size), etc. During the simulation, the hydrodynamic and wave modules provide real-time data, and the ST module references these pre-calculated tables to determine sediment transport rates for the given conditions. This method allows for efficient, accurate modeling of geomorphic processes such as erosion, deposition, and bed level changes without the need for constant re-calculation, making it ideal for complex coastal morphodynamic studies. By leveraging Q3D tables, the model can simulate how waves and currents interact to influence sediment transport, ensuring detailed, dynamic representations of coastal changes over time.
3.4. Modeling Scenarios
Two distinct modeling scenarios were developed to investigate the role of P. oceanica meadows in mitigating coastal erosion in Navarino Bay. Both scenarios were simulated using the MIKE 21/3 Coupled Model FM over a one-year period (1 January 2024–1 January 2025), using the wave and wind forcing described in Section 3.2.
In the first scenario, hereafter referred to as the baseline scenario, the P. oceanica meadows present in the bay were considered to simulate their role in coastal protection. Their effect was represented as an additional bed resistance influencing wave energy dissipation and sediment stabilization.
In the second scenario, hereafter referred to as the meadow-removal scenario, the Manning’s M value assigned to the meadows was replaced with that of the underlying seabed type (mud, sand or hard substrate). The presence of P. oceanica is represented exclusively through the spatially varying bed roughness map shown in Figure 7. Each substrate class, including the mapped meadows, was assigned to a Manning’s M value (Table 2), with the meadows corresponding to the roughest class. The meadows therefore act as a rougher bed within the Hydrodynamic module. The two scenarios therefore differ only in the roughness assigned to the meadow polygons, which takes the value of the underlying seabed in the meadow-removal scenario (Figure 7a,b).
Both scenarios were run under identical boundary conditions, meaning that all external factors and inputs influencing the simulation, such as wind, wave conditions, and other environmental parameters were kept the same in both model runs. This approach ensures that any differences in the results can be attributed solely to the presence or absence of P. oceanica meadows.
At the end of the one-year simulation period, the results from both scenarios were analyzed to compare coastal morphodynamic evolution and erosion patterns. The comparison aimed to determine the extent to which P. oceanica contributes to reducing coastal erosion and promoting sediment stability in Navarino Bay. The differences between the two scenarios provided insights into the protective role of P. oceanica in coastal environments.
4. Results
The two scenarios were compared in terms of five parameters: significant wave height, current speed, total load magnitude, bed level change and its rate. Wave height and current speed are presented at individual time steps, under representative forcing conditions, while sediment transport and bed level change are presented at the annual scale. The results are described below for each parameter, with the baseline scenario presented first and the meadow-removal scenario second.
4.1. Significant Wave Height
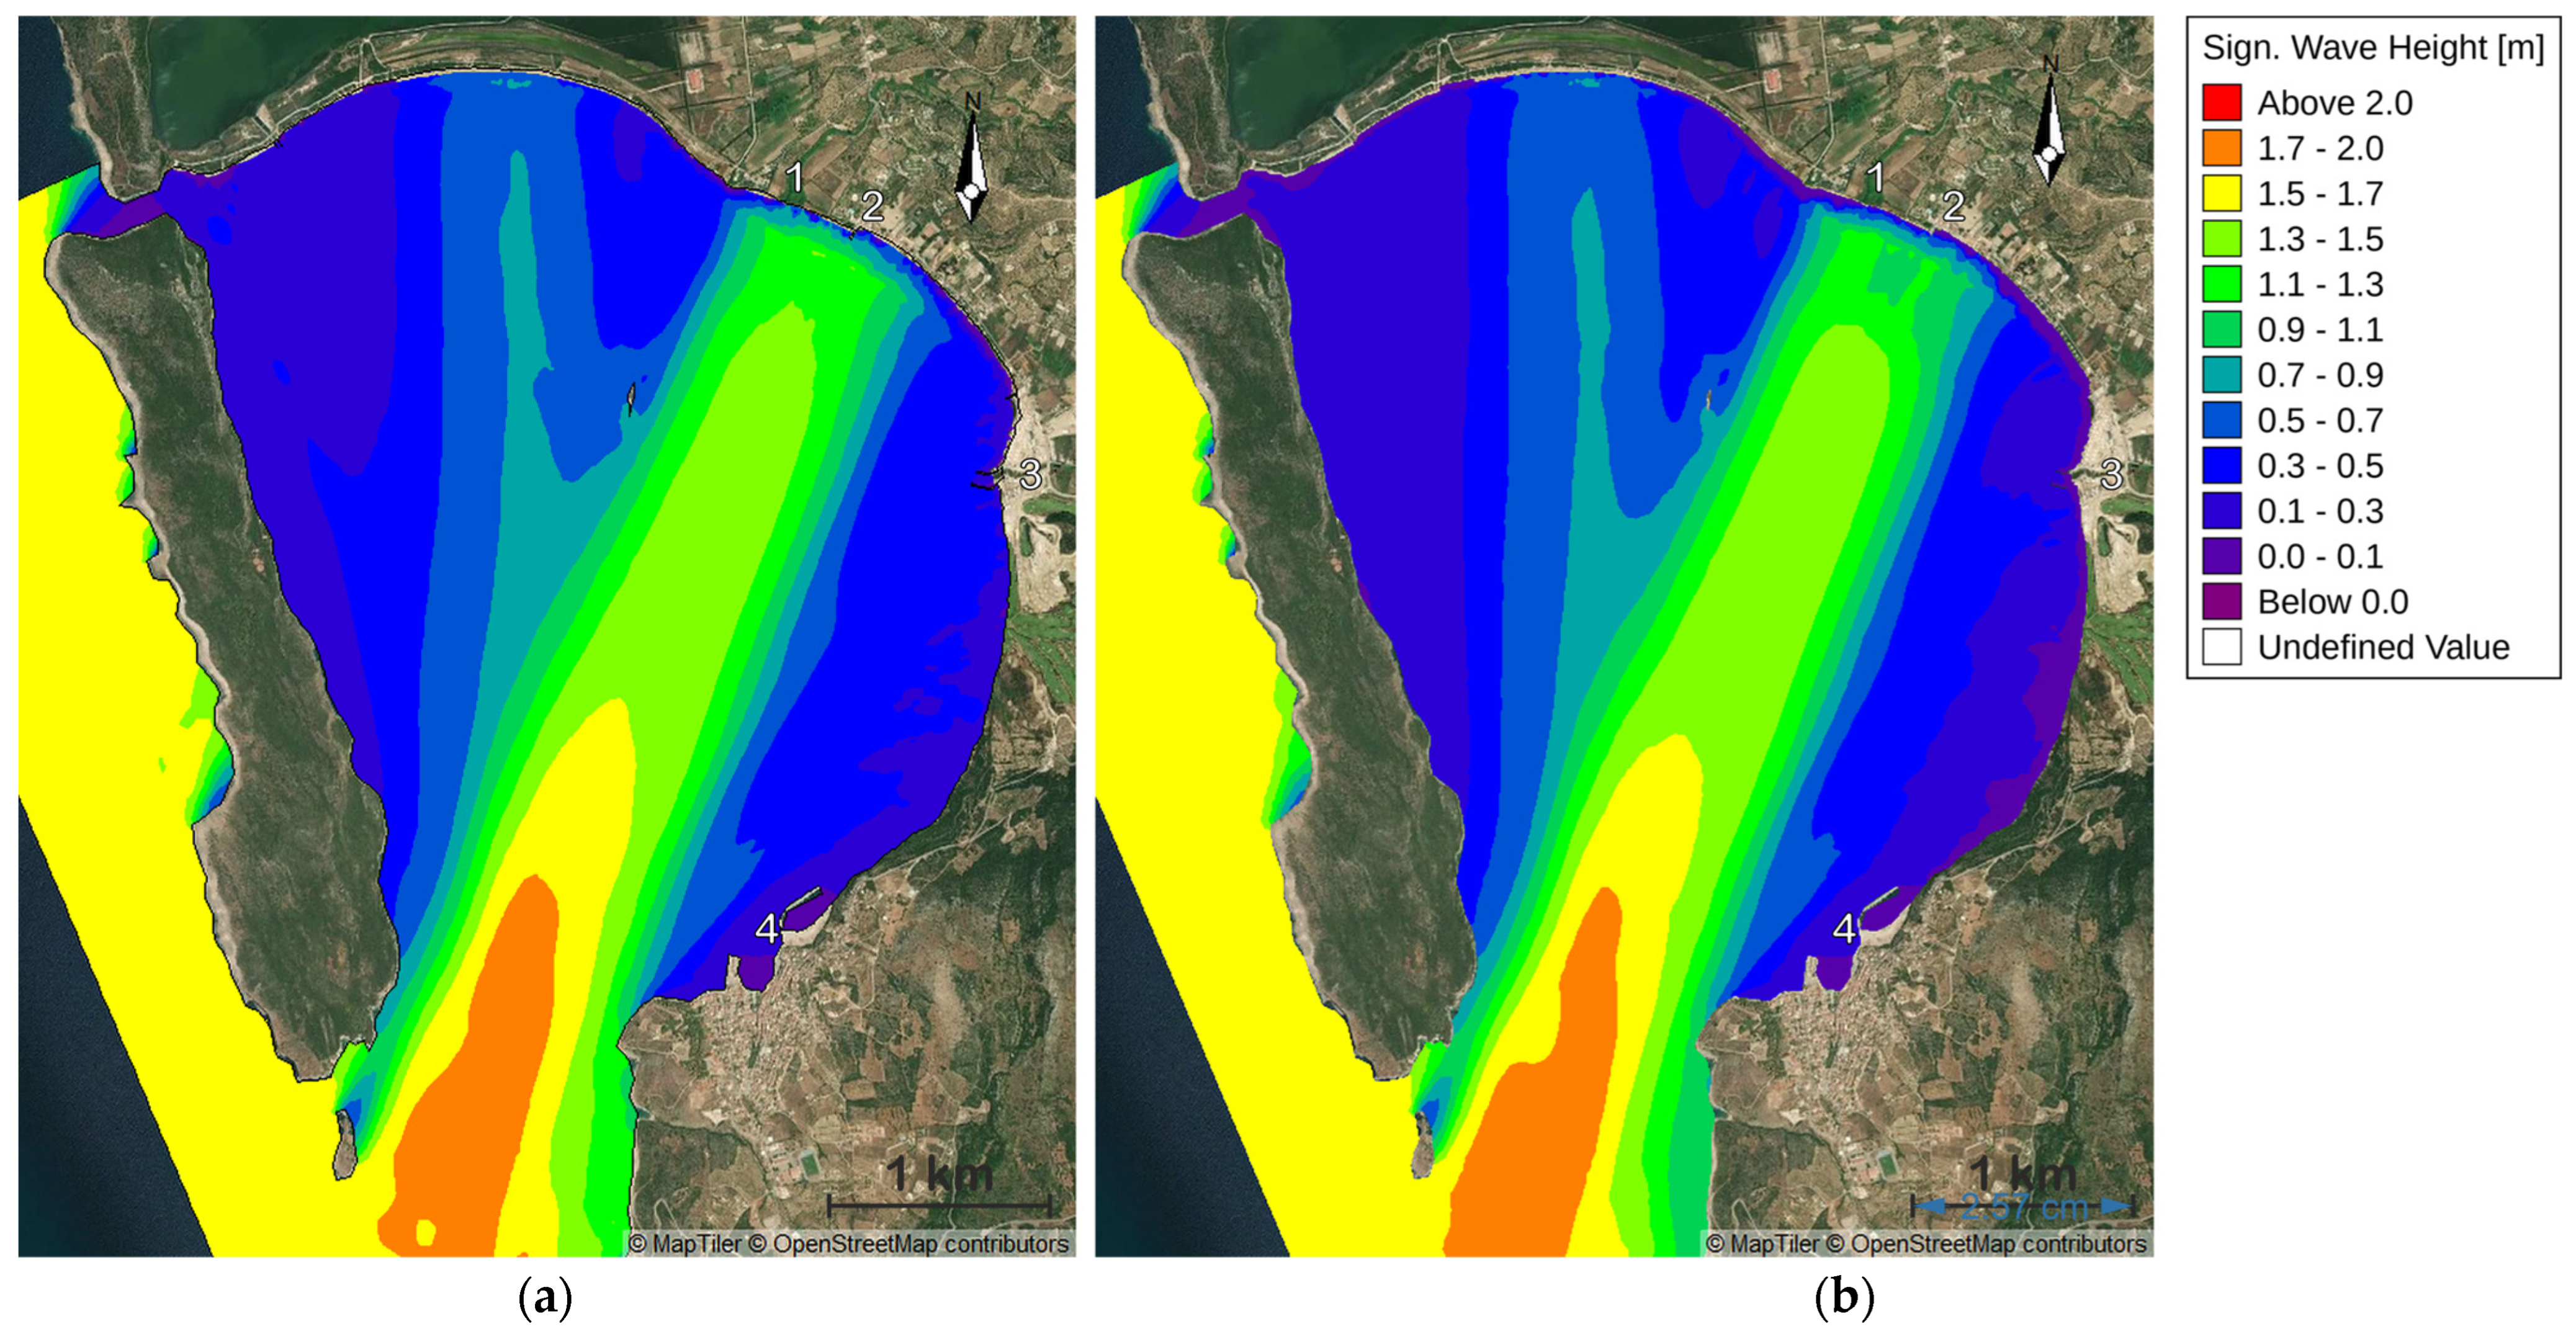
Navarino Bay’s largest significant wave heights are found in the region outside the bay and the southern entrance due to the open sea conditions and lack of natural obstructions. As waves enter the bay, they move into shallower waters and interact with Sphacteria Island, which protects the bay from intense wave and current activity, resulting in wave propagation and a marked reduction in wave height from the entrance to the inner areas. The comparison between the two scenarios highlights the impact of P. oceanica meadows on wave propagation and characteristics.
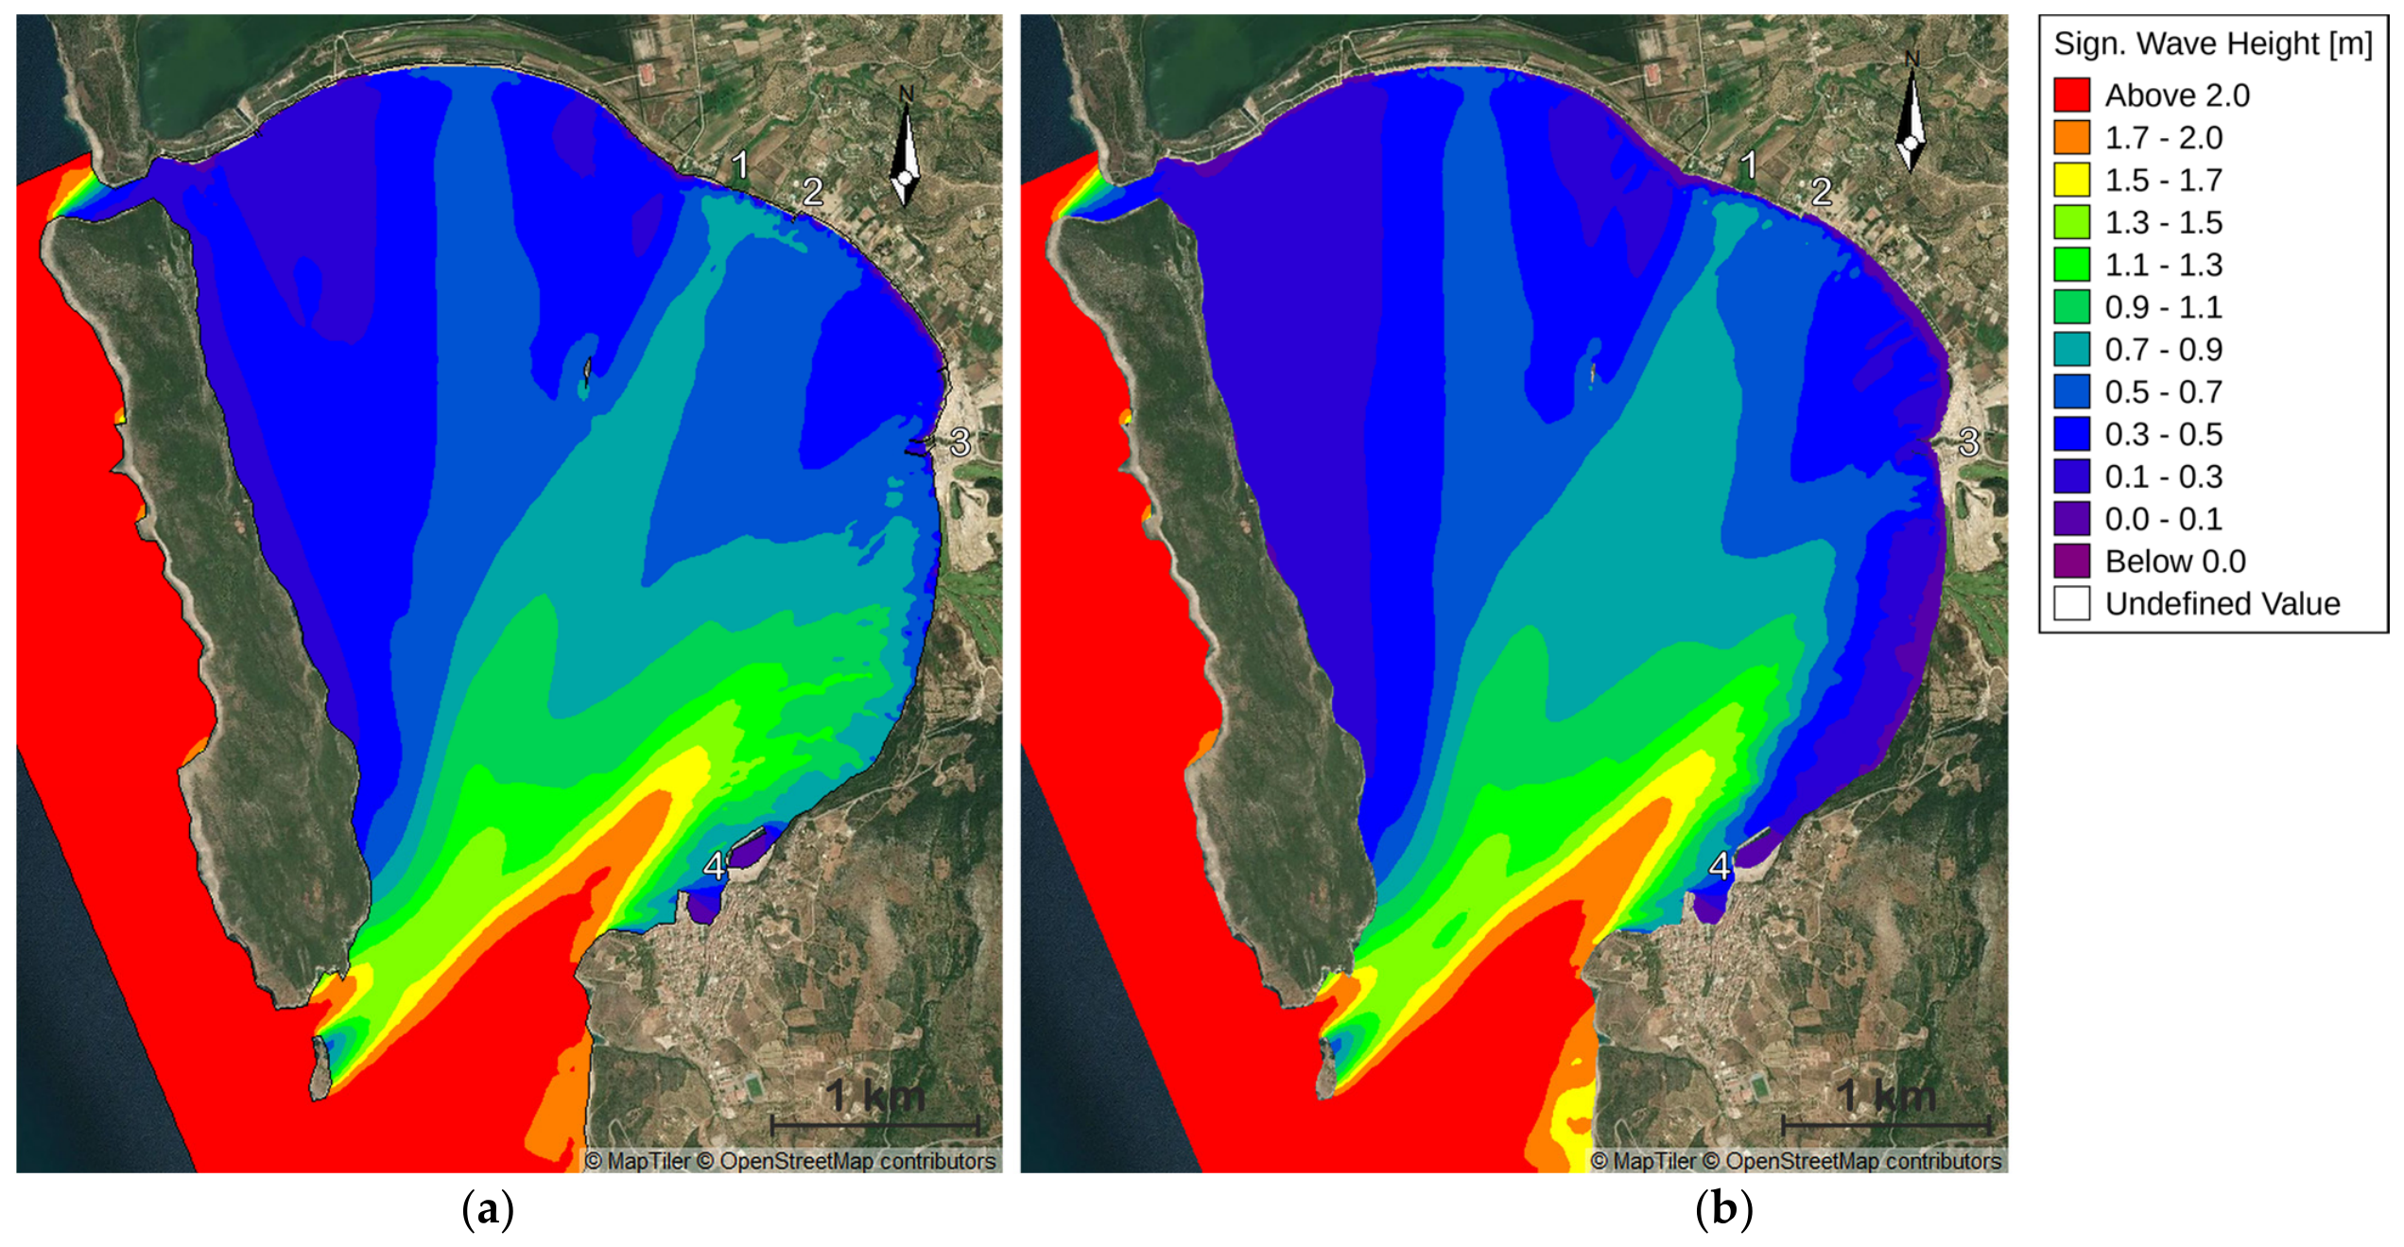
In the baseline scenario (Figure 8a), wave heights are noticeably reduced in the near-shore zone between the Xerias River mouth and Pylos Harbour, and the higher wave heights are confined further offshore. A comparable reduction is observed along the eastern part of Gialova. In the meadow-removal scenario (Figure 8b), higher waves (depicted in red, orange, and yellow tones) penetrate further into the bay, especially in the southern and southwestern parts. These results indicate that P. oceanica acts as a natural wave buffer, dissipating wave energy.
Figure 8.
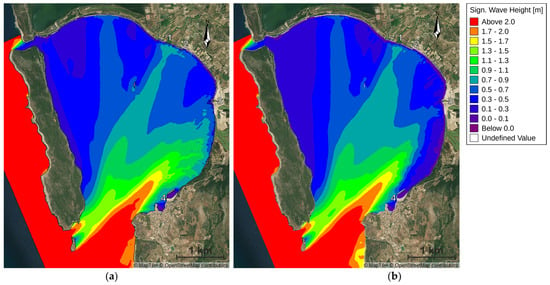
Comparison of significant wave height (m) distribution in Navarino Bay, (a) with and (b) without P. oceanica, at time step 1812 of 2920 (14 August 2024, 12:00), corresponding to offshore forcing conditions of Hm0 = 2.4 m, Tp = 7.8 s and mean wave direction 223°. 1: Kalamaris River mouth, 2: Gialova jetty, 3: Xerias River mouth, 4: Pylos Harbour.
Further evidence of this protective function is seen in Figure 9, which shows the wave height distribution at another time step, also under high wave conditions. In this scenario, while waves again enter from the southern opening, the strongest reflection and energy concentration shift to the central part of the bay, unlike the southwestern focus in Figure 8. Despite the different wave propagation patterns, the presence of P. oceanica still results in noticeably lower wave heights near the shore.
Figure 9.
Comparison of significant wave height (m) distribution in Navarino Bay (a) with and (b) without P. oceanica, at time step 1877 of 2920 (22 August 2024, 15:00), corresponding to offshore forcing conditions of Hm0 = 1.6 m, Tp = 6.3 s and mean wave direction 202°. 1: Kalamaris River mouth, 2: Gialova jetty, 3: Xerias River mouth, 4: Pylos Harbour.
Overall, P. oceanica influences not only waves propagating directly from the open sea but also those reflected or redirected within the bay. This is clearly demonstrated in both Figure 8 and Figure 9, where a consistent reduction in wave energy nearshore is observed in the presence of seagrass. Regardless of the direction and dynamics of wave movement, P. oceanica reduces the wave energy reaching the coastline and thereby strengthening protection against coastal erosion.
4.2. Current Speed
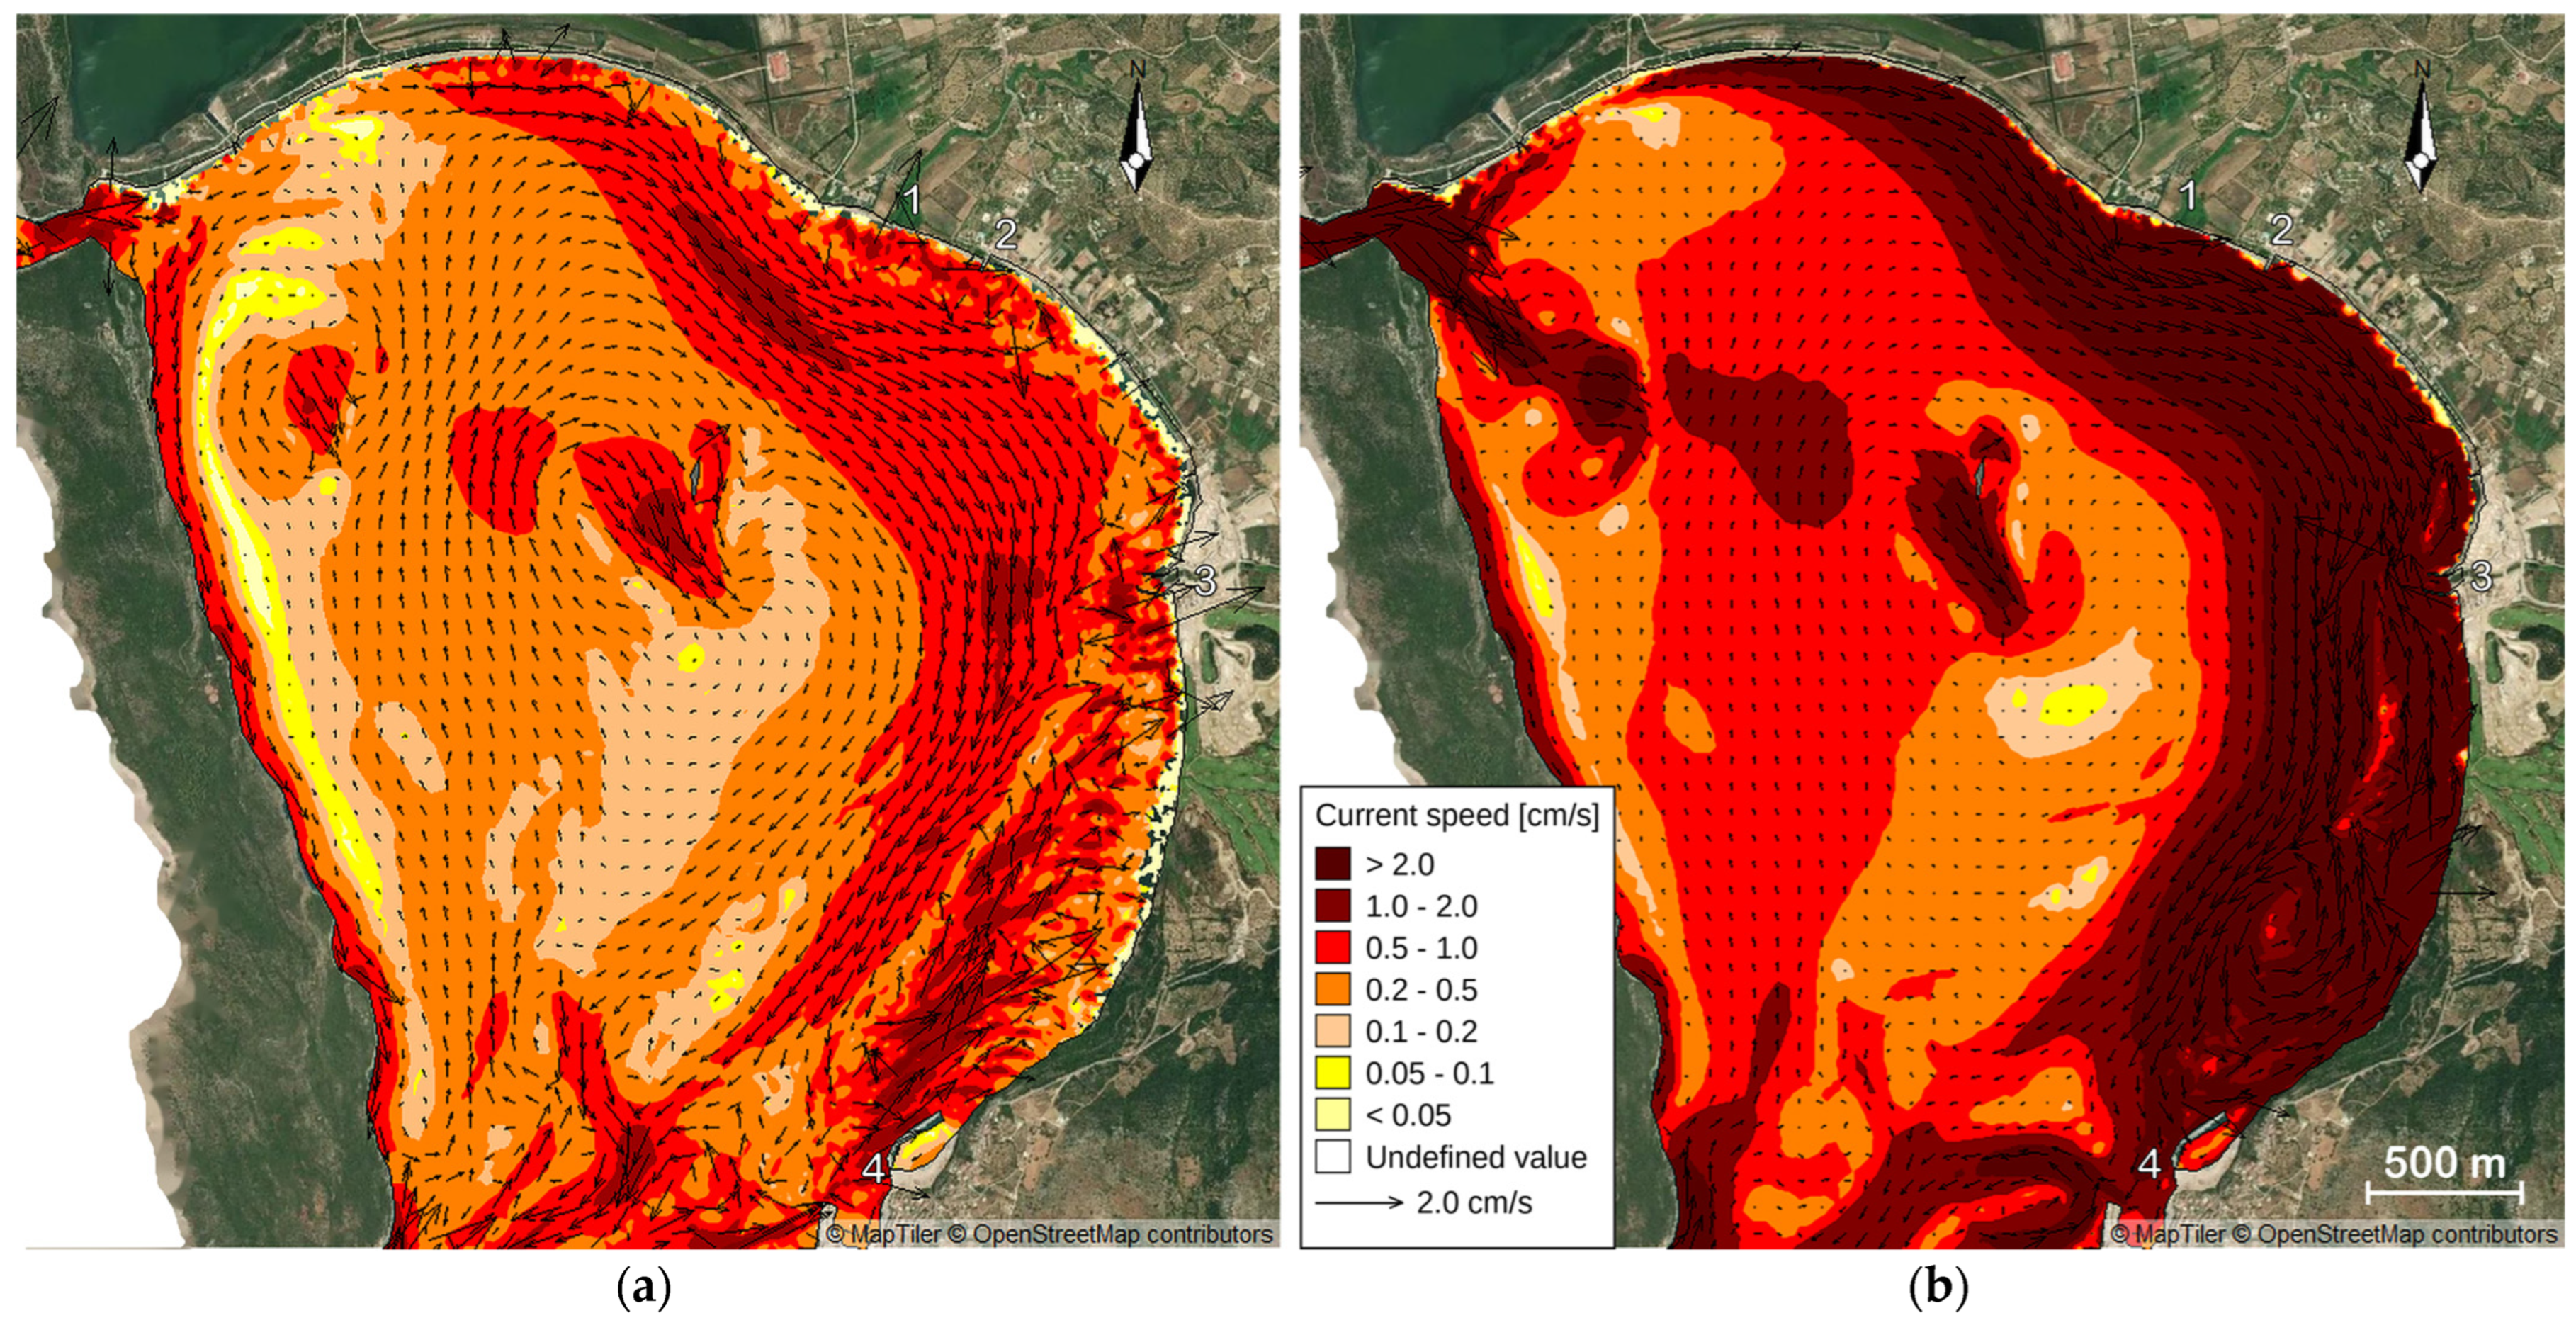
The hydrodynamic simulations clearly illustrate the significant impact of P. oceanica on current speed distribution in Navarino Bay, as depicted in Figure 10. In the model incorporating P. oceanica (Figure 10a), current velocities are generally low to moderate, with most values ranging between 0.2–0.5 cm/s (represented by orange tones). While localized areas display lower speeds (<0.2 cm/s, shown in yellow and white), these zones are limited in spatial extent and do not dominate the bay. The presence of dense P. oceanica meadows acts as a hydrodynamic buffer, reducing flow velocity and dissipating energy. This effect is particularly visible in the inner bay, where circulation is more uniform and attenuated, indicating the ability of the vegetation to stabilize sediments and limit turbulent flow. In contrast, the model without P. oceanica (Figure 10b) shows a significant increase in current speed. Values frequently exceed 1.0 cm/s near the coastline, especially in the southeastern part, and former seagrass zones reach above 2.0 cm/s (dark red areas). The absence of seagrass removes a key resistance mechanism, exposing these regions to stronger hydrodynamic forces. This comparison clearly demonstrates that P. oceanica plays a key role in modulating water movement, reducing current speeds and limiting sediment resuspension and erosion, ultimately promoting coastal stability.
Figure 10.
Comparison of current speed distribution in Navarino Bay, (a) with and (b) without P. oceanica, at the same time step as Figure 8 (14 August 2024, 12:00; time step 1812 of 2920), corresponding to offshore forcing conditions of Hm0 = 2.4 m, Tp = 7.8 s and mean wave direction 223°. Color zones indicate current speed and arrows indicate flow direction. 1: Kalamaris River mouth, 2: Gialova jetty, 3: Xerias River mouth, 4: Pylos Harbour.
4.3. Total Load Magnitude
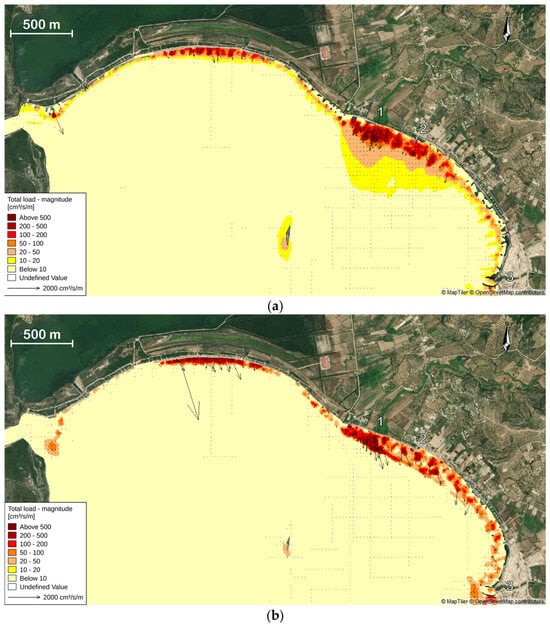
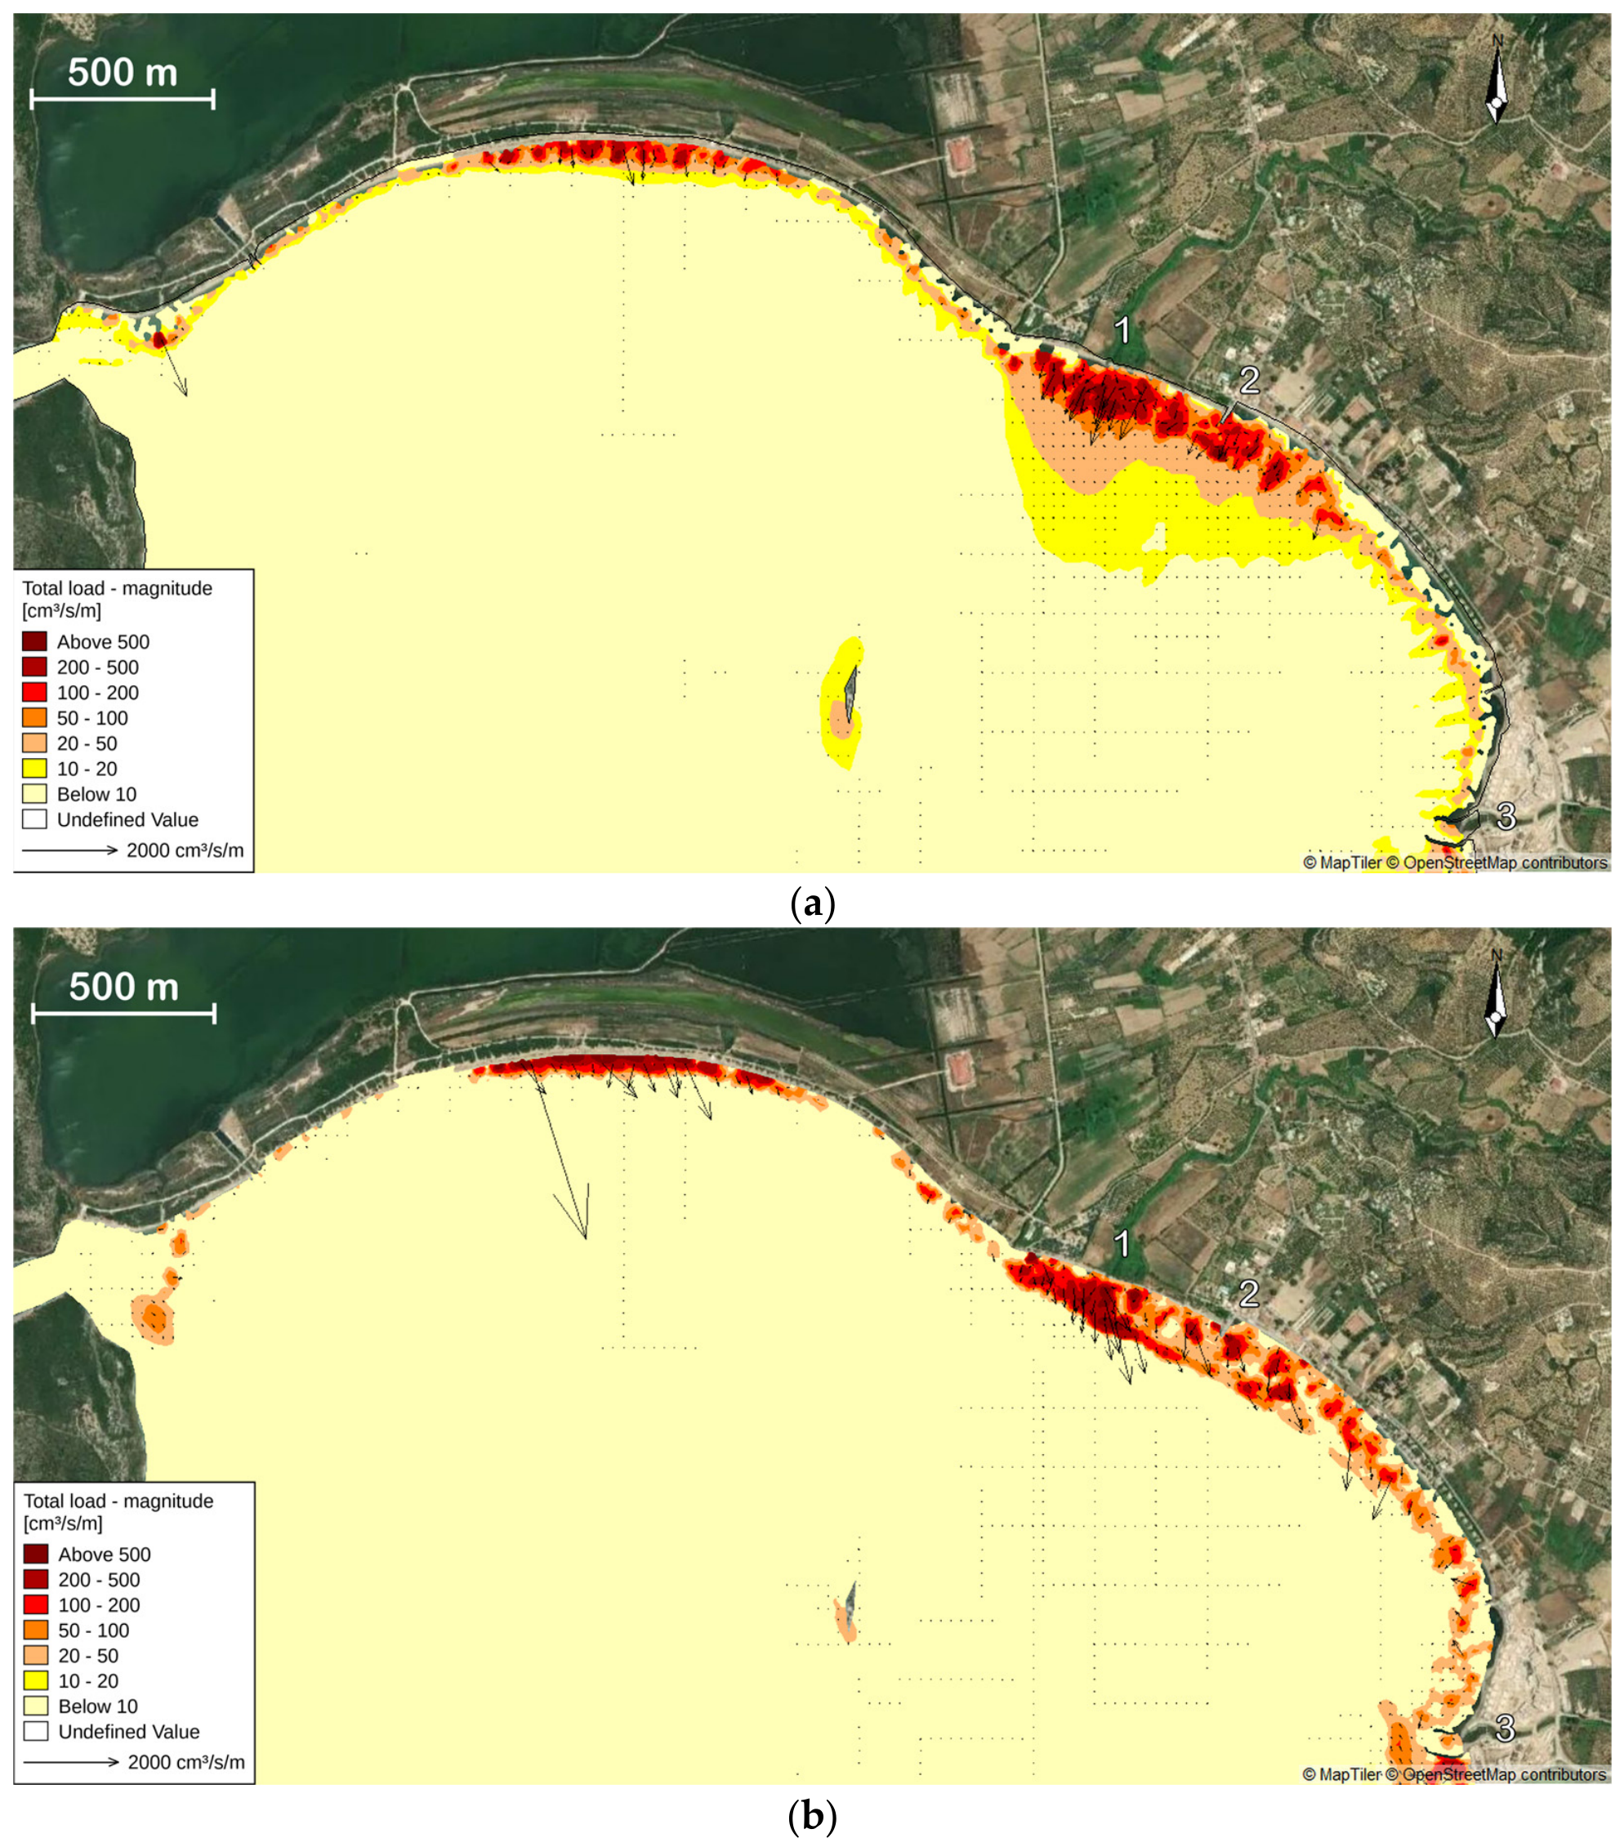
The term “total load magnitude” refers to the total volume of sediment transported per second and per meter of shoreline (unit: cm3/s/m), including both suspended load and bed load (rolling and sliding). In simple terms, the higher this value, the greater the amount of sediment in motion, increasing the potential for erosion or sediment redistribution. The spatial distribution of this parameter provides critical insight into the stability or vulnerability of coastal systems.
A comparison between two scenarios (Figure 11), with and without the presence of the seagrass P. oceanica, in the Navarino Bay area reveals significant differences in both the intensity and distribution of sediment transport.
Figure 11.
Comparison of total annual sediment transport magnitude (cm3/s/m) in Navarino Bay under two scenarios: (a) with and (b) without P. oceanica. 1: Kalamaris River mouth, 2: Gialova jetty, 3: Xerias River mouth.
When P. oceanica is present (Figure 11a), total sediment transport is generally low in magnitude and spatial extent. Most of the shoreline records values below 20 cm3/s/m, typically under 10 cm3/s/m, indicating conditions of a stable and well-protected seabed. High transport values above 200 cm3/s/m are restricted to isolated spots, mostly in areas where P. oceanica coverage is sparse or absent. The presence of seagrass significantly reduces sediment mobility by acting as a natural filter, slowing down water flow and dissipating wave energy.
Interestingly, moderate to high sediment transport values (e.g., 50–200 cm3/s/m) are observed in deeper offshore areas, attributed to the deflection of currents caused by P. oceanica. The dense vegetation near the coastline slows down flow and acts as a barrier, forcing the currents to redirect toward deeper or less sensitive regions of the bay. In other words, Posidonia does not necessarily reduce the total amount of sediment being transported, but rather redistributes the transport spatially, effectively shielding shallow coastal zones. This redirection of flow results in a broader reorganization of the bay’s hydrodynamic structure, as the vegetation influences currents not only locally but at a regional level. Consequently, more intense sediment transport occurs farther offshore, where redirected flows regain speed and energy.
In scenario where P. oceanica is absent (Figure 11b), there is a significant increase in both the magnitude and spatial extent of sediment transport. Along the coast—particularly in the northeastern and southeastern sectors of the bay—values exceeding 200 cm3/s/m are recorded, with large zones reaching even beyond 500 cm3/s/m. Low transport values (<10 cm3/s/m) are now confined to remote or sheltered areas. Additionally, the direction and density of the flow vectors indicate a highly dynamic and persistent pattern of seabed mobility, with stronger hydrodynamic forces making the coastal environment much more vulnerable to erosion and sediment loss.
4.4. Bed Level Change
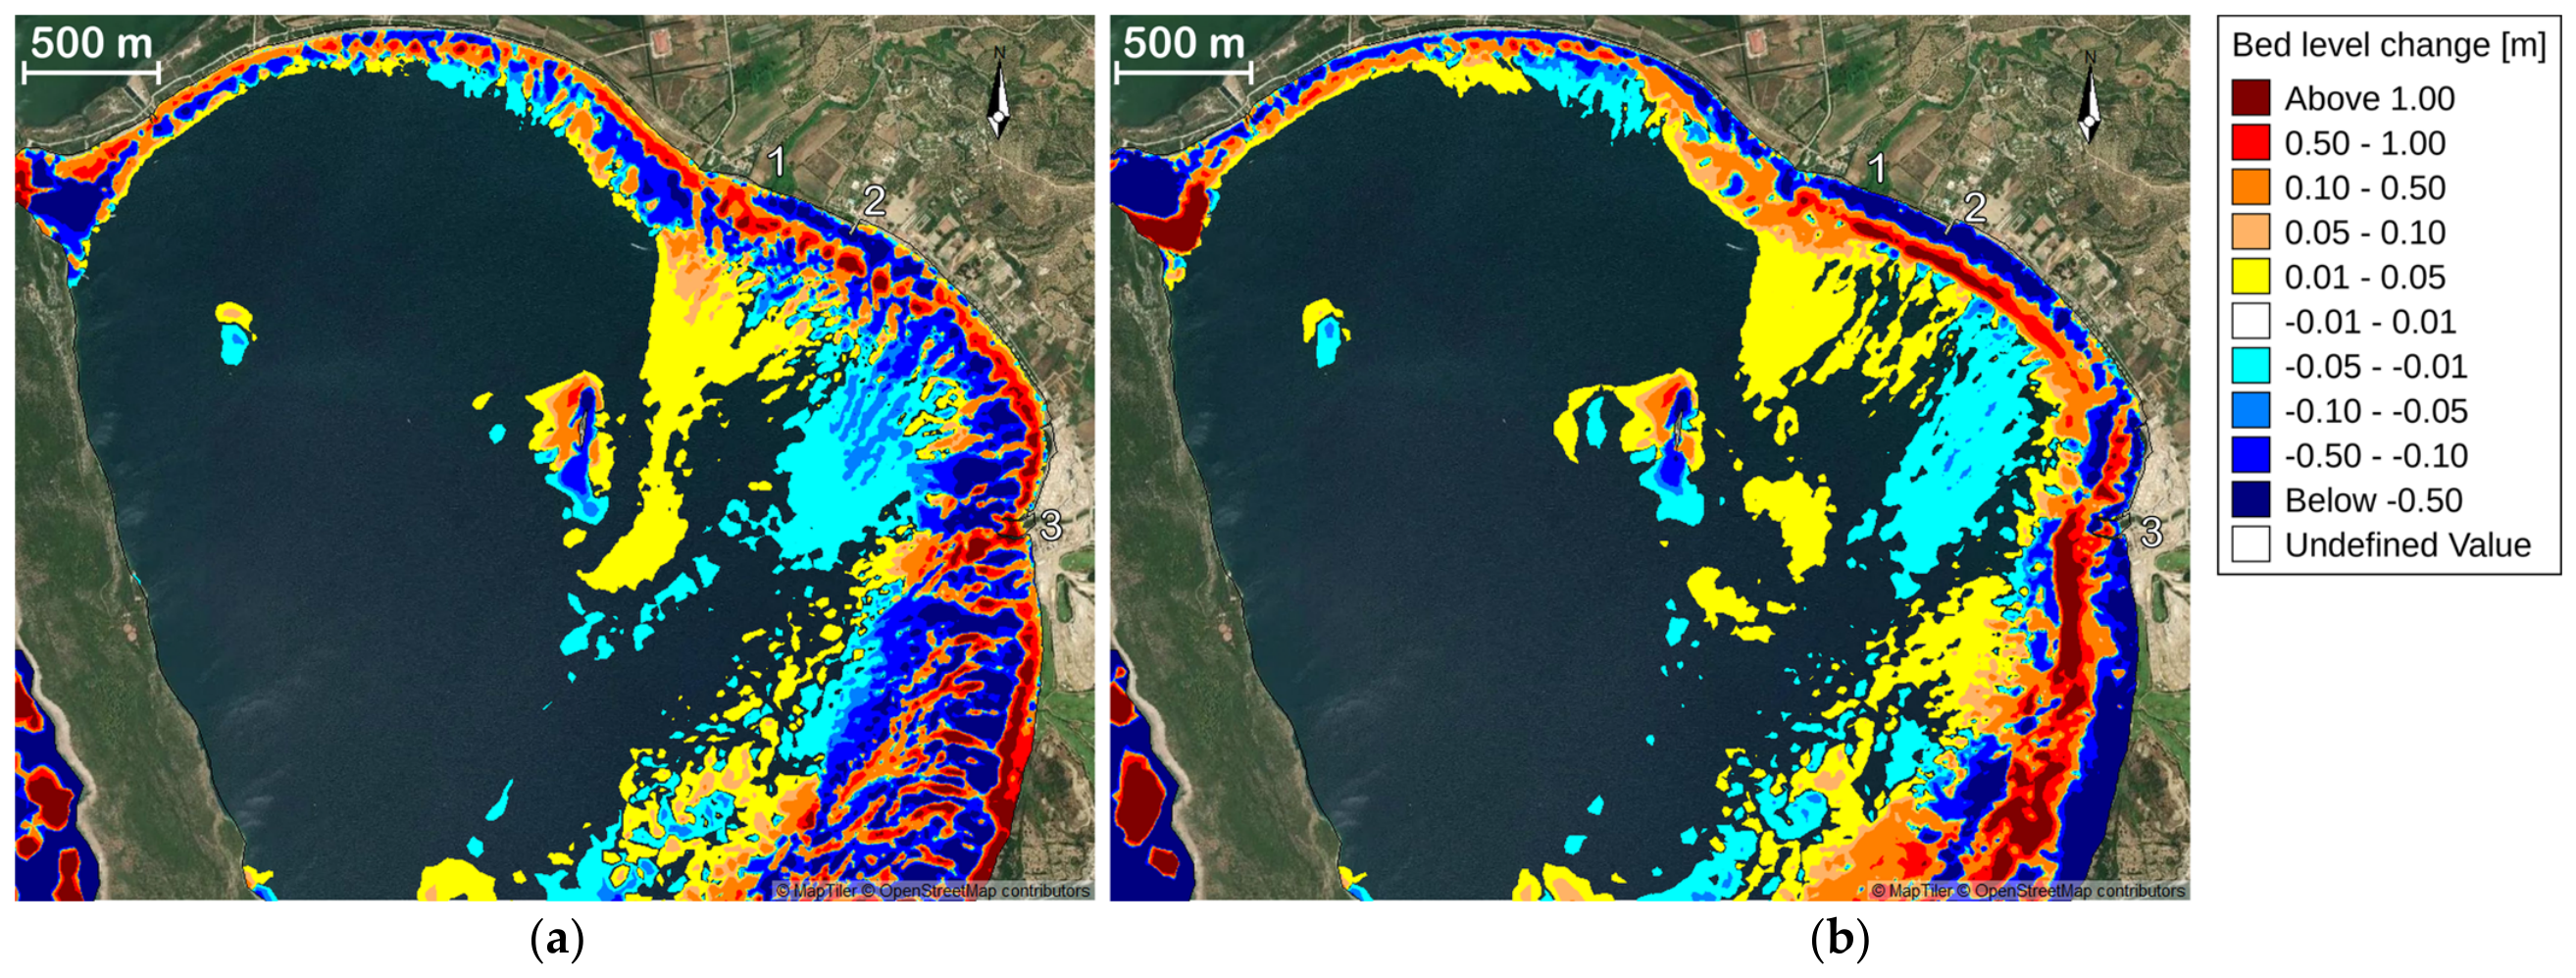
The bed level change analysis highlights the dynamic processes of erosion and deposition that alter the seabed’s elevation over time. As shown in the maps, significant variations in bed level change are observed, particularly in depths lower than 16 m in the coastal zone of Navarino Bay.
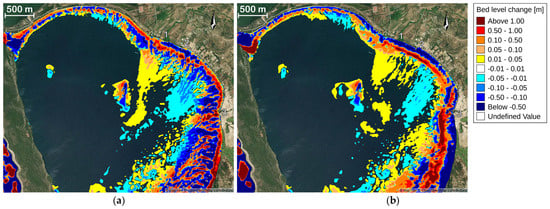
In both scenarios (Figure 12), the most pronounced bed level changes occur near the shoreline, particularly along the eastern and southeastern sections of the bay. These nearshore zones exhibit the largest areas of sediment deposition (red to orange, >0.10 m) and erosion (blue to dark blue, <–0.10 m), indicating that coastal dynamics are more intense close to the surf zone.
Figure 12.
Comparison of bed level changes in Navarino Bay under two scenarios: (a) with and (b) without P. oceanica. The maps show areas of sediment deposition (red) and erosion (blue), with unchanged areas in white, highlighting spatial variations in bed level changes. 1: Kalamaris River mouth, 2: Gialova jetty, 3: Xerias River mouth.
In the scenario with P. oceanica (Figure 12a), the extent and intensity of erosion are fragmented and localized. Areas of strong erosion (dark and medium blue), and mild erosion (light blue to cyan, –0.10 to –0.01 m) dominates in the central and inner bay zones, suggesting a potential effect provided by the seagrass meadows.
Conversely, in the absence of P. oceanica (Figure 12b), the shoreline undergoes more extensive and severe erosion. Continuous stretches of shoreline and surf zone erosion are visible, especially along the southeastern coast, with values dropping below –0.50 m. This pattern reflects the lack of physical resistance against hydrodynamic forces, such as wave and current action. This erosion is probably cross-shore organised due to undertow processes as evidenced by the continuous stretches of sedimentation. This nearshore sediment loss would be expected to translate into shoreline retreat, although quantifying the resulting change in shoreline position is beyond the scope of the present simulations.
Sediment deposition patterns are also influenced by the presence of P. oceanica. In the vegetated case, deposition is more localized around central reef-like structures, while in the unvegetated case, deposition is more spatially dispersed but less intense, indicating an offshore shift in sediment transport and accumulation mechanisms.
Rate of Bed Level Change
The rate of bed level change serves as a complementary metric to the total bed level change, offering a quantitative measure of the intensity of erosion and deposition per unit time (m/day). While the absolute change reflects the cumulative vertical variation of the seabed over a given period, the rate of change provides insight into the temporal dynamics of sediment transport processes. This parameter enhances the interpretative capacity of the analysis, particularly for identifying zones of rapid morphological activity that may require focused environmental management.
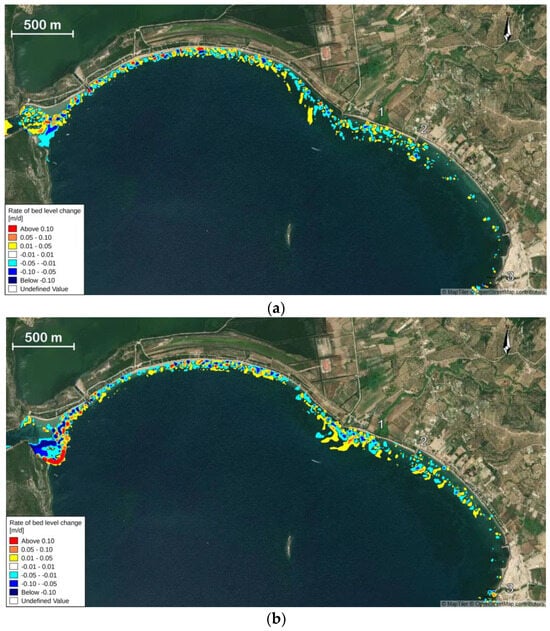
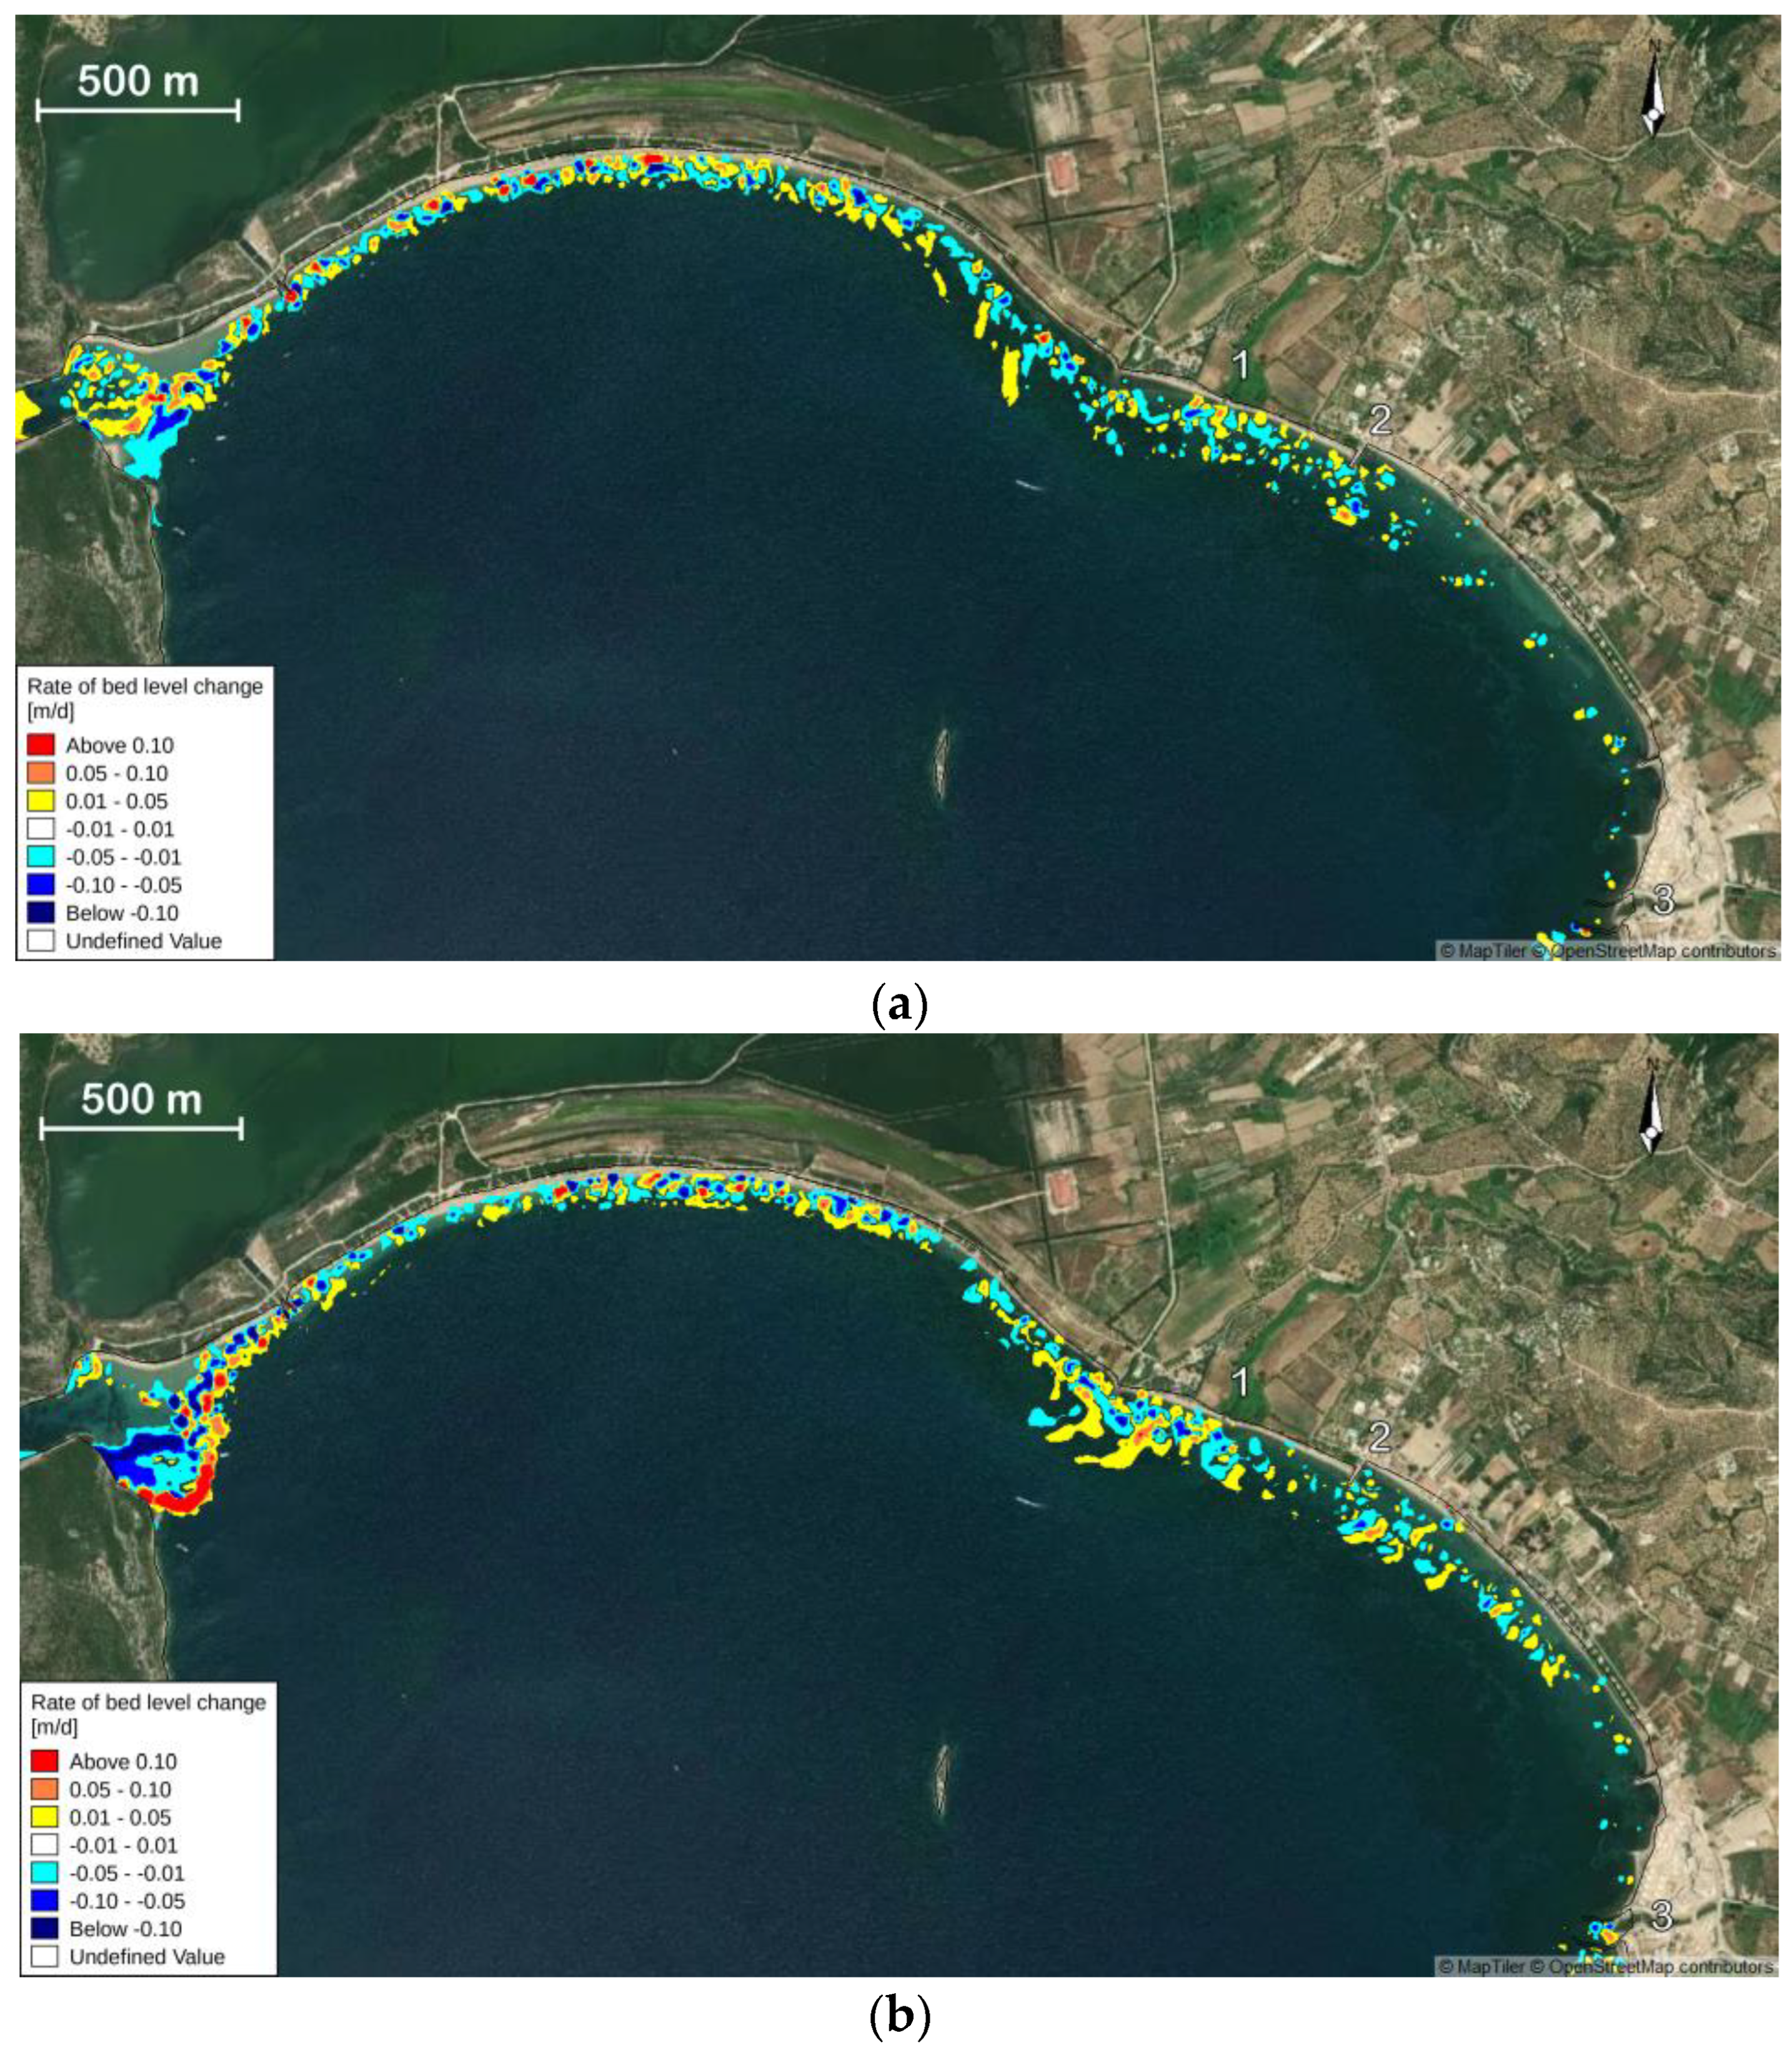
As shown in the maps (Figure 13), the spatial patterns of the rate of bed level change largely mirror those observed in the total bed level change. However, the rate-based maps reveal more precise distributions of high-activity zones and highlight areas where seabed changes occur more intensively and rapidly, particularly along the shoreline in both scenarios.
Figure 13.
Comparison of the bed level change rate (m/day) near the coastline under the two scenarios: (a) with and (b) without P. oceanica. Areas of sediment deposition are shown in red hues, while erosion is represented by blue tones. White areas indicate minimal or no change. The comparison highlights the stabilizing effect of P. oceanica as it reduces both the intensity and extent of seabed erosion and deposition, particularly in the nearshore zone.
In the baseline scenario (Figure 13a), areas experiencing high rates of deposition (>0.10 m/day, red) and erosion (<–0.10 m/day, dark blue to black) are limited in extent. Most of the bay exhibits mild changes, ranging between –0.01 and 0.05 m/day, particularly in the central and nearshore zones. This spatial distribution confirms the attenuating role of seagrass meadows in dampening the intensity of sediment dynamics.
Conversely, in the scenario without P. oceanica (Figure 13b), a significant increase in both the magnitude and extent of rapid bed level changes is observed. The western section of the bay displays large areas with erosion rates below –0.10 m/day, while deposition zones above 0.10 m/day become more spatially extensive. Notably, a continuous band of strong erosion emerges along the southeastern shoreline, indicating elevated hydrodynamic forcing in the absence of seagrass cover.
Overall, the presence of P. oceanica appears to moderate both the frequency and intensity of daily seabed changes, acting as a natural buffer against wave energy and reducing sediment mobilization. The rate of change thus underscores the critical ecological function of seagrass meadows in stabilizing the coastal seabed and mitigating morphological disturbances.
5. Discussion
5.1. The Ability of Posidonia to Reduce Hydrodynamic Forces
The comparative analysis of two simulation scenarios—one with and one without P. oceanica—demonstrates the role of this seagrass in maintaining coastal stability in Navarino Bay. Although the bay benefits from partial natural protection by Sphacteria Island, P. oceanica provides an additional layer of defense against hydrodynamic stress. As shown in Section 4, its dense meadows attenuate wave energy to a limited extent, while their effect on the current field is more pronounced, with flow slowed in shallow areas and redirected toward deeper regions. This redistribution decreases sediment mobility in the most sensitive coastal zones and results in lower daily rates of erosion and deposition, highlighting a dual stabilizing and damping function.
In contrast, the scenario without P. oceanica shows morphological changes in the bay’s structure, as the sediment buffer in front of the coast is reduced and the shoreline becomes more exposed to wave action. The presence of P. oceanica not only reduces erosion but also fosters a more balanced pattern of sedimentation, supporting the resilience of the seabed.
The study was based on the use of the Manning coefficient to simulate seabed roughness, including P. oceanica meadows. This approach allowed for effective representation of the influence of different substrate types (sand, mud, rocky seabed, meadows) on water flow and sediment transport. However, using the Manning coefficient alone has certain limitations. The assignment of a fixed Manning value for each substrate type does not capture micro-scale variations in meadow density or texture, thus simplifying spatial variability, which can significantly affect local flow dynamics. In addition, there is a lack of plant-hydrodynamic interactions as the method does not account for dynamic changes in the meadow structure (e.g., leaf breakage, seasonal variations), which can modify flow resistance and erosion patterns. Lastly, the sediment parameterization is fixed. Although D50 and σg values were used for sediment transport, the spatial variability of sediments is not accurately represented, potentially leading to under- or overestimation of local sediment movement. The model was not calibrated or validated against local observations, as no in-situ measurements are available for Navarino Bay; the results should therefore be interpreted as a comparison between the two scenarios rather than as absolute values. The present study covers one representative year. Since the objective was to isolate the effect of the meadows rather than to reproduce the observed evolution of the bay, a one-year simulation under identical forcing in both scenarios is sufficient for this comparison. However, it does not capture interannual variability or the cumulative morphological response over longer periods.
It should also be noted that sediment transport in the ST module is not computed from the mean current alone: the Q3D transport tables are a function of current velocity, wave height and wave period. The current speed distributions presented in Section 4.2 should therefore be interpreted as an indicator of the circulation pattern, and not as a direct predictor of sediment mobility.
Nevertheless, the methodology provides a reliable first estimate of the effect of P. oceanica meadows on hydrodynamic conditions and coastal protection, allowing for comparisons between the two scenarios (with and without meadows). This approach is widely used in similar studies [52,53], as it only requires the meadows spatial extent and the substrate classes, both of which were available for the study area. Conversely, more complex plant-hydrodynamic models require more detailed data and require higher computational resources but provide higher accuracy.
The results from Navarino Bay indicate that the presence of P. oceanica meadows is associated with lower wave heights, current velocities, and sediment transport rates, in agreement with the protective function reported for meadows elsewhere in the Mediterranean. Field measurements have shown that P. oceanica canopies attenuate wave energy, with a reduction in the root mean square wave height of about 50% reported for waves of 1.1 m propagating over approximately 1000 m of meadow [22], while experimental work has demonstrated reduced particle resuspension within meadows [23]. Our results also show low total sediment transport in areas covered by P. oceanica, with higher loads restricted to areas with sparse or absent coverage, consistent with the simulations showing increased erosion and sediment transport along the coast in the absence of meadows.
Some differences were also noted. In Navarino Bay, the effect of the meadows appears to influence not only the nearshore but also deeper water currents, due to the bay’s geomorphology and the presence of Sphacteria Island, which is not reported in open coasts without natural barriers. The simulation was based on a simplified Manning model, whereas other studies use more complex hydrodynamic-vegetation interaction models (e.g., CFD-based models), which may explain the differences in the spatial distribution of wave energy and sediment transport.
Overall, the results from Navarino Bay reinforce the international literature on the role of P. oceanica meadows in coastal protection while also highlighting the need for further research with more detailed parameterization of meadow structure and their interactions with sediments.
These results support the preservation and restoration of P. oceanica meadows as an important measure in sustainable coastal zone management. Their geomorphological value in protecting vulnerable shorelines is confirmed by the present simulations.
5.2. Management Implications and Future Directions
P. oceanica’s conservation requires a comprehensive understanding of its ecological role and the pressures it faces, such as coastal constructions, anchoring and pollution. Detailed mapping and data-driven monitoring programs are necessary for determining its distribution and for supporting adaptive management and regionally tailored strategies under climate change [29,54,55,56,57,58]. Public awareness and education also contribute to P. oceanica conservation, given its ecological importance as a carbon sink [59], while targeted programs for the boating and tourism sectors can promote sustainable anchoring practices and long-term stewardship [60,61,62,63,64]. Effective policies and a precautionary approach are also important [65,66], and Marine Protected Areas (MPAs) are a well-established tool in this context, with documented benefits including reduced anchoring and dredging dam-age and support for restoration and biodiversity [55,56,60,65,67]. Restoration and replanting efforts are also crucial for combating erosion, with environmental engineering techniques showing promise in restoring degraded meadows [68,69]. Their success depends on site-selection criteria such as adequate water depth, suitable substrate, water quality and proximity to healthy donor meadows [5,55,59,70,71,72,73], as well as on appropriate transplanting techniques supported by systematic monitoring [74,75,76,77,78]. The present simulations indicate which parts of the bay are most sensitive to the loss of the meadows and can therefore help identify the areas and the parameters that monitoring programmes should prioritise. Future monitoring in the bay should include current and water level measurements within the meadows and in neighboring unvegetated areas, along with re-peated bathymetric surveys, which would allow numerical models of the bay to be calibrated and validated.
Evaluating restoration scenarios through modeling is equally critical for P. oceanica recovery projects. Models can assess restoration strategies across different scales, emphasizing areas where interventions provide maximum benefits, such as erosion-prone regions [70]. Dynamic modeling frameworks that account for seasonal variations and climate impacts enhance these studies [79], and geospatial modeling has been instrumental in assessing the restoration suitability of P. oceanica meadows [80]. Techniques like degradable mats or engineered substrates can further improve success rates [57], while simulation models must also evaluate sustainable donor material collection and trade-offs between restoration and conservation [81]. Clear success metrics, such as biodiversity recovery and carbon sequestration, ensure restoration efforts are impactful and durable. Combining protection, monitoring, and restoration efforts ensures that P. oceanica meadows are safeguarded for future generations while contributing to marine ecosystem stability and climate change mitigation. Numerical modelling contributes to this by allowing the consequences of meadow loss to be assessed before it occurs, as in the present study, where the comparison between the two scenarios quantifies the protective function of the meadows in a specific coastal setting.
Beyond the scale of individual restoration projects, broader coastal-scale simulations offer additional value for understanding the wider dynamics and ecological functions of P. oceanica, providing the tools to decision-makers to evaluate strategies for coastal protection and adaptation [79,82,83]. Simulations spanning 5 to 10 years are particularly useful for examining these coastal system dynamics. They help identify trends in coastal erosion, sediment movement, and changes in P. oceanica coverage [71,82,84]. By integrating natural factors, such as wave energy and sediment flows, alongside human influences like infrastructure development, these models assess the viability of current coastal management practices and inform conservation strategies. Software like MIKE Zero (DHI) offer advanced platforms for studying shoreline morphology and the effects of natural forces like tides and storms. MIKE Zero’s modules can also be used to evaluate human activities, such as breakwaters and beach replenishment projects. When paired with long-term simulations, MIKE Zero facilitates scenario-based analyses, fostering sustainable management practices that address ecological and socio-economic priorities.
Simulations incorporating climate change scenarios are crucial for predicting impacts on coastal ecosystems. Sea level rise, changes in wave patterns and temperature variations significantly influence P. oceanica meadows [85]. Advanced modeling systems combine socio-economic and climate scenarios to project future coastal conditions [83,86]. Recent studies highlight the vulnerability of Mediterranean marine habitats to climate change, emphasizing the need for habitat modeling to predict future distributions and impacts [87]. Research demonstrates that rising sea surface temperatures (SST) impact P. oceanica morphology, leading to denser meadows with smaller leaves [88]. While moderate temperature increases may temporarily enhance growth rates, prolonged warming can stress the species by accelerating metabolic demands, increasing respiration rates, and disrupting photosynthesis [89]. This can lead to reduced overall biomass and increased susceptibility to disease and habitat degradation [70,90]. Studies on marine heatwaves have revealed their detrimental effects on seagrass growth and biochemical processes [91]. Warming conditions and marine heat waves may alter the nutritional value of P. oceanica [92,93]. Modeling these scenarios helps identify early indicators of ecological stress and predict ecosystem service losses, such as reduced carbon storage and coastal protection [73,94]. The approach followed in this work could be extended to such scenarios since the same model setup can be fed with modified wave and water level conditions, and the extent of the meadows can be varied to represent their projected response to warming.
6. Conclusions
This study investigated the impact of P. oceanica meadows in the coastal morphodynamics of Navarino Bay. Two scenarios, with and without the meadows, were simulated with the MIKE 21/3 Coupled Model FM over a period of one year. Our results show that while the bay benefits from partial natural shielding provided by the island of Sphacteria, P. oceanica offers an additional layer of defense against coastal erosion and hydrodynamic forces. This contribution is evident in its ability to stabilize sediments, reduce sediment transport, and mitigate the effects of bed level changes along the coastline. The findings demonstrate that P. oceanica contributes to the morphological stability of Navarino Bay.
Based on the model with P. oceanica, sediment removal is reduced and deposition dominates along the coastal boundary. This is also observed in the lower rates of bed level change in the protected areas. This stabilization effect prevents the displacement of sediments and favors the retention of coastal sediments within the coastal zone. Conversely, in the meadow removal scenario, erosion becomes the dominant process along the coastline, where higher rates of bed level change are observed. The loss of sediment from these areas results in offshore redistribution and morphological alterations.
Our findings underscore the importance of P. oceanica in protecting coastal environments. This study emphasizes the need to preserve and protect P. oceanica meadows as a vital component of coastal management strategies. By mitigating sediment transport, promoting deposition, and limiting erosion, P. oceanica contributes to the stability and resilience of coastal ecosystems.
Author Contributions
Conceptualization, N.E.; methodology, I.A. and N.E.; software, I.A.; validation, I.A., F.S., N.E. and A.K.; investigation, I.A., N.E. and A.K.; data curation, I.A. and N.E.; writing—original draft preparation, I.A.; writing—review and editing, N.E., A.K. and F.S.; visualization, I.A.; supervision, N.E., F.S. and A.K. All authors have read and agreed to the published version of the manuscript.
Funding
This research received no external funding.
Data Availability Statement
The data presented in this work are available upon request from the corresponding author.
Acknowledgments
This manuscript is derived from the MSc thesis of Ioanna Arvaniti [10], carried out at the Department of Geology and Geoenvironment of the National and Kapodistrian University of Athens under the supervision of Niki Evelpidou, Anna Karkani and François Sabatier.
Conflicts of Interest
The authors declare no conflicts of interest.
References
- Bird, E.C.F. Coastal Geomorphology: An Introduction; John Wiley & Sons: Chichester, UK, 2011. [Google Scholar]
- Crossland, C.J.; Baird, D.; Ducrotoy, J.-P.; Lindeboom, H.; Buddemeier, R.W.; Dennison, W.C.; Maxwell, B.A.; Smith, S.V.; Swaney, D.P. The Coastal Zone—A Domain of Global Interactions. In Coastal Fluxes in the Anthropocene: The Land-Ocean Interactions in the Coastal Zone Project of the International Geosphere-Biosphere Programme; Crossland, C.J., Kremer, H.H., Lindeboom, H.J., Marshall Crossland, J.I., Le Tissier, M.D.A., Eds.; Springer: Berlin/Heidelberg, Germany, 2005; pp. 1–37. [Google Scholar] [CrossRef] [Scilit] [PubMed]
- Boudouresque, C.F.; Bernard, G.; Bonhomme, P.; Charbonnel, E.; Diviacco, G.; Meinesz, A.; Pergent, G.; Pergent-Martini, C.; Ruitton, S.; Tunesi, L. Protection and Conservation of Posidonia oceanica Meadows; RAMOGE Secretariat: Monaco, 2012. [Google Scholar]
- Ondiviela, B.; Losada, I.J.; Lara, J.L.; Maza, M.; Galván, C.; Bouma, T.J.; van Belzen, J. The role of seagrasses in coastal protection in a changing climate. Coast. Eng. 2014, 87, 158–168. [Google Scholar] [CrossRef] [Scilit]
- Duarte, C.; Losada, I.J.; Hendriks, I.; Mazarrasa, I.; Marba, N. The role of coastal plant communities for climate change mitigation and adaptation. Nat. Clim. Change 2013, 3, 961–968. [Google Scholar] [CrossRef] [Scilit]
- Telesca, L.; Belluscio, A.; Criscoli, A.; Ardizzone, G.; Apostolaki, E.T.; Fraschetti, S.; Gristina, M.; Knittweis, L.; Martin, C.S.; Pergent, G.; et al. Seagrass meadows (Posidonia oceanica) distribution and trajectories of change. Sci. Rep. 2015, 5, 12505. [Google Scholar] [CrossRef] [Scilit] [PubMed]
- Griggs, G.; Reguero, B.G. Coastal Adaptation to Climate Change and Sea-Level Rise. Water 2021, 13, 2151. [Google Scholar] [CrossRef] [Scilit]
- Kraft, J.C.; Rapp, G., Jr.; Aschenbrenner, S.E. Late Holocene palaeogeomorphic reconstructions in the area of the Bay of Navarino: Sandy Pylos. J. Archaeol. Sci. 1980, 7, 187–210. [Google Scholar] [CrossRef] [Scilit]
- Zangger, E.; Timpson, M.E.; Yazvenko, S.B.; Kuhnke, F.; Knauss, J. The Pylos Regional Archaeological Project Part II: Landscape evolution and site preservation. Hesperia 1997, 66, 549–641. [Google Scholar] [CrossRef] [Scilit] [PubMed]
- Arvaniti, I. Study of Coastal Morphodynamics in Navarino Bay (Pylos, Peloponnese, Greece). Master’s Thesis, National and Kapodistrian University of Athens, Athens, Greece, 2025. Available online: https://pergamos.lib.uoa.gr/uoa/dl/object/uoadl:3458913 (accessed on 22 October 2026).
- Pergent, G.; Rico-Raimondino, V.; Pergent-Martini, C. Fate of primary production in Posidonia oceanica meadows of the Mediterranean. Aquat. Bot. 1997, 59, 307–321. [Google Scholar] [CrossRef] [Scilit]
- Borum, J.; Greve, T. The four European seagrass species. In European Seagrasses: An Introduction to Monitoring and Management; The M&MS project: Copenhagen, Denmark, 2004; pp. 1–7. [Google Scholar]
- Koch, E.W. Beyond light: Physical, geological, and geochemical parameters as possible submersed aquatic vegetation habitat requirements. Estuaries 2001, 24, 1–17. [Google Scholar] [CrossRef] [Scilit] [PubMed]
- Picard, J.; Molinier, R. Recherches sur les Herbiers de Phanérogames Marines du Littoral Méditerranéen Français. Ann. Inst. Océanogr. 1952, 27, 157–234. [Google Scholar]
- Augustin, L.N.; Irish, J.L.; Lynett, P. Laboratory and numerical studies of wave damping by emergent and near-emergent wetland vegetation. Coast. Eng. 2009, 56, 332–340. [Google Scholar] [CrossRef] [Scilit]
- Francour, P. Fish assemblages of Posidonia oceanica beds at Port-Cros (France, NW Mediterranean): Assessment of composition and long-term fluctuations by visual census. Mar. Ecol. 1997, 18, 157–173. [Google Scholar] [CrossRef] [Scilit]
- Gobert, S.; Cambridge, M.; Velimirov, B.; Pergent, G.; Lepoint, G.; Bouquegneau, J.-M.; Dauby, P.; Pergent-Martini, C.; Walker, D. Biology of Posidonia oceanica. In Seagrasses: Biology, Ecology and Conservation; Larkum, A.W.D., Orth, R.J., Duarte, C.M., Eds.; Springer: Dordrecht, The Netherlands, 2006; pp. 387–408. [Google Scholar]
- Mateo, M.A.; Romeo, J.; Perez, M.; Littler, M.M.; Littler, D.S. Dynamics of millenary organic deposits resulting from the growth of the Mediterranean seagrass Posidonia oceanica. Estuar. Coast. Shelf Sci. 1997, 44, 103–110. [Google Scholar] [CrossRef] [Scilit]
- Pergent, G.; Bazairi, H.; Bianchi, C.; Boudouresque, C.; Buia, M.; Clabaut, P.; Harmelin, M.; Mateo, M.; Montefalcone, M.; Morri, C.; et al. Les Herbiers de Magnoliophytes Marines de Méditerranée: Résilience et Contribution à L’atténuation des Changements Climatiques; IUCN: Gland, Switzerland; Málaga, Spain, 2012. [Google Scholar]
- de Boer, W.F. Seagrass–sediment interactions, positive feedbacks and critical thresholds for occurrence: A review. Hydrobiologia 2007, 591, 5–24. [Google Scholar] [CrossRef] [Scilit]
- Hendriks, I.E.; Sintes, T.; Bouma, T.J.; Duarte, C.M. Experimental assessment and modeling evaluation of the effects of the seagrass Posidonia oceanica on flow and particle trapping. Mar. Ecol. Prog. Ser. 2008, 356, 163–173. [Google Scholar] [CrossRef] [Scilit]
- Infantes, E.; Orfila, A.; Simarro, G.; Terrados, J.; Luhar, M.; Nepf, H. Effect of a seagrass (Posidonia oceanica) meadow on wave propagation. Mar. Ecol. Prog. Ser. 2012, 456, 63–72. [Google Scholar] [CrossRef] [Scilit]
- Terrados, J.; Duarte, C.M. Experimental evidence of reduced particle resuspension within a seagrass (Posidonia oceanica L.) meadow. J. Exp. Mar. Biol. Ecol. 2000, 243, 45–53. [Google Scholar] [CrossRef] [Scilit]
- Tews, J.; Brose, U.; Grimm, V.; Tielbörger, K.; Wichmann, M.C.; Schwager, M.; Jeltsch, F. Animal species diversity driven by habitat heterogeneity/diversity: The importance of keystone structures. J. Biogeogr. 2004, 31, 79–92. [Google Scholar] [CrossRef] [Scilit]
- Panayotidis, P.; Papathanasiou, V.; Gerakaris, V.; Fakiris, E.; Orfanidis, S.; Papatheodorou, G.; Kosmidou, M.; Georgiou, N.; Drakopoulou, P.; Loukaidi, V. Seagrass meadows in the Greek Seas: Presence, abundance and spatial distribution. Bot. Mar. 2022, 65, 259–273. [Google Scholar] [CrossRef] [Scilit]
- UNEP/MAP. Convention for the Protection of the Mediterranean Sea Against Pollution (Barcelona Convention); United Nations Environment Programme/Mediterranean Action Plan: Barcelona, Spain, 1976; Available online: https://www.unep.org/unepmap/who-we-are/barcelona-convention-and-protocols (accessed on 22 October 2026).
- Council of Europe. Convention on the Conservation of European Wildlife and Natural Habitats (Bern Convention), ETS No. 104; Council of Europe: Bern, Switzerland, 1979; Available online: https://rm.coe.int/0900001680078afc (accessed on 22 October 2026).
- European Economic Community. Council Directive 92/43/EEC of 21 May 1992 on the Conservation of Natural Habitats and of Wild Fauna and Flora; Off. J. Eur. Communities L 206, 22 July 1992; pp. 7–50. Available online: https://eur-lex.europa.eu/eli/dir/1992/43/oj (accessed on 22 October 2026).
- Gerakaris, V.; Papathanasiou, V.; Salomidi, M.; Issaris, Y.; Panayotidis, P. Spatial patterns of Posidonia oceanica structural and functional features in the Eastern Mediterranean (Aegean and E. Ionian Seas) in relation to large-scale environmental factors. Mar. Environ. Res. 2021, 165, 105222. [Google Scholar] [CrossRef] [Scilit] [PubMed]
- Varnavas, S.P.; Panagos, A.G.; Laios, G. Trace elements in surface sediments of Navarino Bay, Greece. Environ. Geol. Water Sci. 1987, 10, 159–168. [Google Scholar] [CrossRef] [Scilit]
- Emmanouilidis, A.; Katrantsiotis, C.; Norström, E.; Risberg, J.; Kylander, M.; Sheik, T.A.; Iliopoulos, G.; Avramidis, P. Middle to late Holocene palaeoenvironmental study of Gialova lagoon, SW Peloponnese, Greece. Quat. Int. 2018, 476, 46–62. [Google Scholar] [CrossRef] [Scilit]
- Malaperdas, G.; Panagopoulos, N. Mapping shoreline changes over the years: The case study of Navarino bay, Pylos, Messenia, Greece. Trends J. Sci. Res. 2021, 1, 28–35. [Google Scholar] [CrossRef] [Scilit]
- Chatzigeorgiou, G.; Reizopoulou, S.; Maidanou, M.; Naletaki, M.; Orneraki, E.; Apostolaki, E.; Arvanitidis, C. Macrobenthic community changes due to dystrophic events and freshwater inflow: Changes in space and time in a Mediterranean lagoon (Gialova lagoon, SW Greece). Estuar. Coast. Shelf Sci. 2011, 94, 111–121. [Google Scholar] [CrossRef] [Scilit]
- Engel, M.; Knipping, M.; Brückner, H.; Kiderlen, M.; Kraft, J.C. Reconstructing middle to late Holocene palaeogeographies of the lower Messenian plain (southwestern Peloponnese, Greece): Coastline migration, vegetation history and sea level change. Palaeogeogr. Palaeoclimatol. Palaeoecol. 2009, 284, 257–270. [Google Scholar] [CrossRef] [Scilit]
- Bray, L.; Faulwetter, S.; Kaberi, H.; Karageorgis, A.P.; Kastanidi, E.; Katsiaras, N.; Pavlidou, A.; Providakis, N.; Sigala, K.; Voutsinas, E.; et al. Assessing pressure drivers on the benthic ecosystem in the coastal zone of Western Messinia, Greece. Estuar. Coast. Shelf Sci. 2022, 274, 107935. [Google Scholar] [CrossRef] [Scilit]
- Zacharias, N.; Militsi, E.; Kylafi, M.; Valantou, V.; Kazolias, A.; Kompoti, A.; Panagiotidis, V.V. Sand & stones: The Pylos Geoarchaeological Program. J. Archaeol. Sci. Rep. 2023, 51, 104210. [Google Scholar] [CrossRef] [Scilit]
- Evelpidou, N.; Spyrou, E.; Karkani, A.; Saitis, G. Interplay of marine, coastal and terrestrial processes: A geomorphological study from Navarino Bay, Peloponnese, Greece. Reg. Stud. Mar. Sci. in review.
- Blott, S.J.; Pye, K. GRADISTAT: A grain size distribution and statistics package for the analysis of unconsolidated sediments. Earth Surf. Process. Landf. 2001, 26, 1237–1248. [Google Scholar] [CrossRef] [Scilit]
- EMODnet Digital Bathymetry (DTM 2024). EMODnet Bathymetry Consortium. Available online: https://doi.org/10.12770/cf51df64-56f9-4a99-b1aa-36b8d7b743a1 (accessed on 15 December 2024).
- EMODnet Geology. EMODnet Seabed Substrate Maps. Available online: https://emodnet.ec.europa.eu/en/geology (accessed on 15 December 2024).
- Poseidon System. Available online: https://poseidon.hcmr.gr/components/observing-components/buoys (accessed on 12 February 2025).
- DHI. MIKE 21/3 Coupled Model FM: User Guide; DHI A/S: Hørsholm, Denmark, 2024. [Google Scholar]
- Arcement, G.J., Jr.; Schneider, V.R. Guide for Selecting Manning’s Roughness Coefficients for Natural Channels and Flood Plains; U.S. Geological Survey Water Supply Paper 2339; U.S. Geological Survey: Reston, VA, USA, 1989. [Google Scholar] [CrossRef] [Scilit]
- Chow, V.T. Open-Channel Hydraulics; McGraw-Hill: New York, NY, USA, 1959. [Google Scholar]
- Soulsby, R. Dynamics of Marine Sands; Thomas Telford: London, UK, 1997. [Google Scholar]
- van Rijn, L.C. Principles of Sediment Transport in Rivers, Estuaries and Coastal Seas; Aqua Publications: Amsterdam, The Netherlands, 1993. [Google Scholar]
- U.S. Army Corps of Engineers. Coastal Engineering Manual (CEM), Engineer Manual 1110-2-1100; U.S. Army Corps of Engineers: Washington, DC, USA, 2002; 6 volumes. [Google Scholar] [CrossRef] [Scilit]
- DHI. MIKE 21 Flow Model FM, Hydrodynamic Module: Scientific Documentation; DHI A/S: Hørsholm, Denmark, 2017. [Google Scholar]
- Folk, R.L.; Ward, W.C. Brazos River bar Texas: A study in the significance of grain size parameters. J. Sediment. Res. 1957, 27, 3–26. [Google Scholar] [CrossRef] [Scilit]
- Fredsøe, J.; Deigaard, R. Mechanics of Coastal Sediment Transport; World Scientific: Singapore, 1992. [Google Scholar]
- van Rijn, L.C. Unified view of sediment transport by currents and waves. I: Initiation of motion, bed roughness, and bed-load transport. J. Hydraul. Eng. 2007, 133, 649–667. [Google Scholar] [CrossRef] [Scilit]
- Astudillo-Gutierrez, C.; Gracia, V.; Cáceres, I.; Sierra, J.P.; Sánchez-Arcilla, A. Influence of seagrass meadow length on beach morphodynamics: An experimental study. Sci. Total Environ. 2024, 921, 170888. [Google Scholar] [CrossRef] [Scilit] [PubMed]
- Christianen, M.J.; van Belzen, J.; Herman, P.M.; van Katwijk, M.M.; Lamers, L.P.; van Leent, P.J.; Bouma, T.J. Low-canopy seagrass beds still provide important coastal protection services. PLoS ONE 2013, 8, e62413. [Google Scholar] [CrossRef] [Scilit] [PubMed]
- Alcoverro, T.; Duarte, C.; Romero, J. Annual growth dynamics of Posidonia oceanica: Contribution of large-scale versus local factors to seasonality. Mar. Ecol. Prog. Ser. 1995, 120, 203–210. [Google Scholar] [CrossRef] [Scilit]
- Short, F.; Carruthers, T.; Dennison, W.; Waycott, M. Global seagrass distribution and diversity: A bioregional model. J. Exp. Mar. Biol. Ecol. 2007, 350, 3–20. [Google Scholar] [CrossRef] [Scilit]
- Duarte, C.M.; Agusti, S.; Barbier, E.; Britten, G.L.; Castilla, J.C.; Gattuso, J.P.; Fulweiler, R.W.; Hughes, T.P.; Knowlton, N.; Lovelock, C.E.; et al. Rebuilding marine life. Nature 2020, 580, 39–51. [Google Scholar] [CrossRef] [Scilit] [PubMed]
- Pansini, A.; Bosch-Belmar, M.; Berlino, M.; Sarà, G.; Ceccherelli, G. Collating evidence on the restoration efforts of the seagrass Posidonia oceanica: Current knowledge and gaps. Sci. Total Environ. 2022, 851, 158320. [Google Scholar] [CrossRef] [Scilit] [PubMed]
- Toimil, A.; Losada, I.J.; Camus, P.; Díaz-Simal, P. Managing coastal erosion under climate change at the regional scale. Coast. Eng. 2017, 128, 106–122. [Google Scholar] [CrossRef] [Scilit]
- Hemminga, M.A.; Duarte, C.M. Seagrass Ecology; Cambridge University Press: Cambridge, UK, 2000. [Google Scholar] [CrossRef] [Scilit]
- Klein, C.J.; Brown, C.J.; Halpern, B.S.; Segan, D.B.; McGowan, J.; Beger, M.; Watson, J.E.M. Shortfalls in the global protected area network at representing marine biodiversity. Sci. Rep. 2015, 5, 17539. [Google Scholar] [CrossRef] [Scilit] [PubMed]
- Cullen-Unsworth, L.C.; Unsworth, R. A call for seagrass protection. Science 2018, 361, 446–448. [Google Scholar] [CrossRef] [Scilit] [PubMed]
- Otero, M.M.; Simeone, S.; Aljinovic, B.; Salomidi, M.; Mossone, P.; Giunta Fornasin, M.E.; Gerakaris, V.; Guala, I.; Milano, P.; Heurtefeux, H.; et al. Governance and Management of Posidonia Beach-Dune System; POSBEMED Interreg Med Project, 2018. Available online: https://posbemed.interreg-med.eu/ (accessed on 12 February 2025).
- Montefalcone, M.; Albertelli, G.; Morri, C.; Bianchi, C.N. Urban seagrass: Status of Posidonia oceanica facing the Genoa city waterfront (Italy) and implications for management. Mar. Pollut. Bull. 2007, 54, 206–213. [Google Scholar] [CrossRef] [Scilit] [PubMed]
- Boudouresque, C.F.; Blanfuné, A.; Pergent, G.; Thibaut, T. Restoration of seagrass meadows in the Mediterranean Sea: A critical review of effectiveness and ethical issues. Water 2021, 13, 1034. [Google Scholar] [CrossRef] [Scilit]
- European Commission. EU Biodiversity Strategy for 2030: Bringing Nature Back into Our Lives (COM/2020/380 final); European Commission: Brussels, Belgium, 2020; Available online: https://eur-lex.europa.eu/legal-content/EN/TXT/?uri=celex:52020DC0380 (accessed on 12 February 2025).
- Marchand, M.; Sanchez-Arcilla, A.; Ferreira, M.; Gault, J.; Jiménez, J.A.; Markovic, M.; Mulder, J.; van Rijn, L.; Stănică, A.; Sulisz, W.; et al. Concepts and science for coastal erosion management—An introduction to the Conscience framework. Ocean Coast. Manag. 2011, 54, 859–866. [Google Scholar] [CrossRef] [Scilit]
- Agardy, T.; Di Sciara, G.N.; Christie, P. Mind the gap: Addressing the shortcomings of marine protected areas through large scale marine spatial planning. Mar. Policy 2011, 35, 226–232. [Google Scholar] [CrossRef] [Scilit]
- Pastor, A.; Catalán, I.A.; Terrados, J.; Mourre, B.; Ospina-Álvarez, A. Connectivity-based approach to guide conservation and restoration of seagrass Posidonia oceanica in the NW Mediterranean. Biol. Conserv. 2023, 285, 110248. [Google Scholar] [CrossRef] [Scilit]
- Piazzi, L.; Acunto, S.; Frau, F.; Atzori, F.; Cinti, M.F.; Leone, L.; Ceccherelli, G. Environmental engineering techniques to restore degraded Posidonia oceanica meadows. Water 2021, 13, 661. [Google Scholar] [CrossRef] [Scilit]
- Marbà, N.; Duarte, C.M. Mediterranean warming triggers seagrass (Posidonia oceanica) shoot mortality. Glob. Chang. Biol. 2010, 16, 2366–2375. [Google Scholar] [CrossRef] [Scilit]
- González-Correa, J.; Bayle-Sempere, J.; Sánchez Lizaso, J.; Valle, C.; Sánchez-Jerez, P.; Ruiz Fernandez, J. Recovery of deep Posidonia oceanica meadows degraded by trawling. J. Exp. Mar. Biol. Ecol. 2005, 320, 65–76. [Google Scholar] [CrossRef] [Scilit]
- Boudouresque, C.; Bernard, G.; Pergent, G.; Shili, A.; Verlaque, M. Regression of Mediterranean seagrasses caused by natural processes and anthropogenic disturbances and stress: A critical review. Bot. Mar. 2009, 52, 395–418. [Google Scholar] [CrossRef] [Scilit]
- Fernández-Torquemada, Y.; Sánchez-Lizaso, J.L. Effects of salinity on leaf growth and survival of the Mediterranean seagrass Posidonia oceanica (L.) Delile. J. Exp. Mar. Biol. Ecol. 2005, 320, 57–63. [Google Scholar] [CrossRef] [Scilit]
- Castejón Silvo, I.; Álvarez Enríquez, B.; Terrados Muñoz, J. (Eds.) Practical Guide: The Planting of Posidonia oceanica; Red Eléctrica de España: Madrid, Spain, 2018; Available online: https://www.ree.es/sites/default/files/downloadable/Guide-planting-posidonia-oceanica-nov.pdf (accessed on 12 February 2025).
- Chimienti, G.; Tursi, A.; Saponari, L.; Lovat, V.; Santoro, F.; Mastrototaro, F. A new method for the transplanting of the seagrass Posidonia oceanica. In Proceedings of the 2023 IEEE International Workshop on Metrology for the Sea, Learning to Measure Sea Health Parameters (MetroSea), La Valletta, Malta, 9–11 October 2023; pp. 83–87. [Google Scholar] [CrossRef] [Scilit]
- Marin-Diaz, B.; Bouma, T.J.; Infantes, E. Role of eelgrass on bed-load transport and sediment resuspension under oscillatory flow. Limnol. Oceanogr. 2020, 65, 426–436. [Google Scholar] [CrossRef] [Scilit]
- Montefalcone, M. Challenges in restoring Mediterranean seagrass ecosystems in the Anthropocene. Environments 2024, 11, 86. [Google Scholar] [CrossRef] [Scilit]
- Pirrotta, M.; Tomasello, A.; Scannavino, A.; Di Maida, G.; Luzzu, F.; Bellissimo, G.; Bellavia, C.; Costantini, C.; Orestano, C.; Sclafani, G.; et al. Transplantation assessment of degraded Posidonia oceanica habitats: Site selection and long-term monitoring. Mediterr. Mar. Sci. 2015, 16, 591–601. [Google Scholar] [CrossRef] [Scilit]
- Ventura, D.; Mancini, G.; Casoli, E.; Pace, D.S.; Lasinio, G.J.; Belluscio, A.; Ardizzone, G. Seagrass restoration monitoring and shallow-water benthic habitat mapping through a photogrammetry-based protocol. J. Environ. Manag. 2022, 304, 114262. [Google Scholar] [CrossRef] [Scilit] [PubMed]
- Savini, A.; Varzi, A.; Marino, L.; Fersini, G.; Piazzolla, D.; Scanu, S.; Marcelli, M. Geospatial modeling for evaluating restoration suitability of Posidonia oceanica meadows offshore Civitavecchia (eastern Tyrrhenian margin, Mediterranean Sea). In Proceedings of the EGU General Assembly 2023, Vienna, Austria, 23–28 April 2023. EGU23-14936. [Google Scholar] [CrossRef] [Scilit]
- Hinz, H.; Törnroos, A.; de Juan, S. Trait-based indices to assess benthic vulnerability to trawling and model loss of ecosystem functions. Ecol. Indic. 2021, 126, 107692. [Google Scholar] [CrossRef] [Scilit]
- Catucci, E.; Scardi, M. A machine learning approach to the assessment of the vulnerability of Posidonia oceanica meadows. Ecol. Indic. 2020, 108, 105744. [Google Scholar] [CrossRef] [Scilit]
- Llabrés, E.; Blanco-Magadán, A.; Sales, M.; Sintes, T. Modelling Seagrass Competition in the Mediterranean Sea in Global Warming Scenarios. arXiv 2022, arXiv:2204.11559. [Google Scholar] [CrossRef] [Scilit]
- Díaz-Almela, E.; Marbà, N.; Duarte, C.M. Consequences of Mediterranean warming events in seagrass (Posidonia oceanica) flowering records. Glob. Chang. Biol. 2007, 13, 224–-235. [Google Scholar] [CrossRef] [Scilit]
- Cantasano, N. The meadows of Posidonia oceanica (Linnaeus) Delile in a climate change scenario. Adv. Oceanogr. Mar. Biol. 2023, 3, AOMB.MS.ID.000563. [Google Scholar] [CrossRef] [Scilit]
- Nicholls, R.J. Planning for the impacts of sea level rise. Oceanography 2011, 24, 144–-157. [Google Scholar] [CrossRef] [Scilit]
- Bellin, N.; Rossi, V. Modeling the effects of climate change on the habitat suitability of Mediterranean gorgonians. Biodivers. Conserv. 2024, 33, 1027–1049. [Google Scholar] [CrossRef] [Scilit]
- Pansini, A.; La Manna, G.; Pinna, F.; Stipcich, P.; Ceccherelli, G. Trait gradients inform predictions of seagrass meadows changes to future warming. Sci. Rep. 2021, 11, 18107. [Google Scholar] [CrossRef] [Scilit] [PubMed]
- Marín-Guirao, L.; Bernardeau-Esteller, J.; García-Muñoz, R.; Ramos, A.; Ontoria, Y.; Romero, J.; Sandoval-Gil, J.M.; Ruiz, J.M.; Marco-Méndez, C.; Procaccini, G. Carbon economy of Mediterranean seagrasses in response to thermal stress. Mar. Pollut. Bull. 2018, 135, 617–-629. [Google Scholar] [CrossRef] [Scilit] [PubMed]
- Jordà, G.; Marbà, N.; Duarte, C. Mediterranean seagrass vulnerable to regional climate warming. Nat. Clim. Change 2012, 2, 821–-824. [Google Scholar] [CrossRef] [Scilit]
- Marín-Guirao, L.; Entrambasaguas, L.; Dattolo, E.; Ruiz, J.M.; Procaccini, G. Molecular mechanisms behind the physiological resistance to intense transient warming in an iconic marine plant. Front. Plant Sci. 2017, 8, 1142. [Google Scholar] [CrossRef] [Scilit] [PubMed]
- Stipcich, P.; Apostolaki, E.T.; Chartosia, N.; Efthymiadis, P.T.; Jimenez, C.E.; La Manna, G.; Pansini, A.; Principato, E.; Resaikos, V.; Ceccherelli, G. Assessment of Posidonia oceanica traits along a temperature gradient in the Mediterranean Sea shows impacts of marine warming and heat waves. Front. Mar. Sci. 2022, 9, 895354. [Google Scholar] [CrossRef] [Scilit]
- Stipcich, P.; Beca-Carretero, P.; Álvarez-Salgado, X.A.; Apostolaki, E.T.; Chartosia, N.; Efthymiadis, P.T.; Jimenez, C.E.; La Manna, G.; Pansini, A.; Principato, E.; et al. Effects of high temperature and marine heat waves on seagrasses: Is warming affecting the nutritional value of Posidonia oceanica? Mar. Environ. Res. 2023, 184, 105854. [Google Scholar] [CrossRef] [Scilit] [PubMed]
- Apostolaki, E.T.; Lavery, P.S.; Litsi-Mizan, V.; Serrano, E.; Inostroza, K.; Gerakaris, V.; Krause-Jensen, D.; Marbà, N.; Serrano, O. Patterns of carbon and nitrogen accumulation in seagrass (Posidonia oceanica) meadows of the Eastern Mediterranean Sea. J. Geophys. Res. Biogeosci. 2024, 129, e2024JG008163. [Google Scholar] [CrossRef] [Scilit]

Disclaimer/Publisher’s Note: The statements, opinions and data contained in all publications are solely those of the individual author(s) and contributor(s) and not of MDPI and/or the editor(s). MDPI and/or the editor(s) disclaim responsibility for any injury to people or property resulting from any ideas, methods, instructions or products referred to in the content. |
© 2026 by the authors. Licensee MDPI, Basel, Switzerland. This article is an open access article distributed under the terms and conditions of the Creative Commons Attribution (CC BY) license.