


Abstract
Understanding how clay content alters force transmission and particle rearrangement is essential for explaining the shear behavior of sand–clay mixtures. Laboratory simple shear tests and three-dimensional discrete element simulations were conducted on clean sand and mixtures containing 10%, 20%, 30%, and 40% clay. After calibration against the laboratory shear responses, the simulations were used to track contacts, force transmission, and particle rearrangement. Increasing clay content raised the coordination number but reduced the proportion of sand–sand (S–S) contacts. Despite their declining number, S–S contacts retained a disproportionately large share of the summed normal contact force and a higher force-to-contact ratio than sand–clay (S–C) and clay–clay (C–C) contacts. As clay content increased, force transmission shifted from a predominantly sand-based skeleton toward greater participation of S–C and C–C contacts, while shear resistance decreased. Non-affine displacement was concentrated mainly in the lower part of the specimens, with larger departures from locally affine motion during the earlier shear interval. Together, these observations relate the differences in shear response among the mixtures to changes in contact structure, normal-force distribution, and localized particle rearrangement.
1. Introduction
Sand–clay mixtures constitute an important class of natural and engineered geomaterials whose mechanical response is governed by interactions between coarse sand grains and fine clay particles. Unlike clean sands or homogeneous fine-grained soils, their stress transmission and deformation depend on the relative contribution of the two particle fractions to the internal load-bearing structure [1,2,3,4,5]. At relatively low clay contents, clay particles may primarily occupy intergranular voids while direct sand–sand contacts maintain the principal load-bearing skeleton. As clay content increases, direct contacts between sand grains are progressively replaced by sand–clay and clay–clay contacts, resulting in changes in packing structure, stress transmission, shear resistance, and deformation characteristics [6,7,8,9,10]. The mechanical response is further influenced by clay plasticity, particle morphology, stress state, and the spatial distribution of the fine fraction [11,12,13]. Consequently, identifying how clay content modifies the internal load-bearing structure is essential for establishing a physically meaningful interpretation of the shear behavior of sand–clay mixtures.
Considerable experimental effort has been devoted to characterizing the effects of fines on the mechanical behavior of granular soils. Monotonic and cyclic tests have demonstrated that fines content affects critical-state behavior, strength and dilatancy, static instability, and liquefaction resistance [14,15,16,17,18,19,20]. Various state variables, including the intergranular void ratio, equivalent granular void ratio, and equivalent state parameter, have therefore been proposed to account for the contribution of fines to the soil skeleton [17,21,22,23,24]. More recent investigations have emphasized that fines content alone is insufficient to characterize the response of binary mixtures because the mechanical role of fines depends strongly on their size, plasticity, spatial distribution, and participation in the load-bearing structure [18,25,26]. For sand–clay mixtures, this issue is particularly relevant because clay particles differ fundamentally from non-plastic fines in both their physical characteristics and interparticle interactions. Experimental observations indicate that clay particles may fill intergranular voids, coat sand surfaces, occur at sand–sand contacts, and eventually participate directly in the soil skeleton as clay content increases [10]. Although these studies have established the dependence of macroscopic behavior on clay content, the underlying redistribution of contacts and internal forces during shearing remains difficult to quantify experimentally.
Further experimental evidence shows that the influence of clay addition depends on both the mixture composition and the loading conditions. Krim et al. [27] conducted undrained triaxial tests on sand–clay mixtures containing up to 20% clay and found that peak and residual strengths varied with clay content and particle grading. Mohammadi and Bahadori [28], using hollow-cylinder torsional shear tests, showed that even small additions of kaolin could alter peak strength and that the trend with clay content depended on the principal stress direction. These findings indicate that clay content alone does not provide a complete explanation of mixture behavior. They also motivate closer examination of how contacts between the coarse and fine fractions develop and transmit load during shearing, which is the focus of the present study.
At the particle scale, the mechanical response of a binary mixture depends not only on the number of contacts but also on the forces transmitted through different contact subnetworks. DEM investigations have shown that fines content can significantly modify coordination number, contact composition, fabric anisotropy, force-chain structure, and the population of mechanically active particles [29,30,31,32,33]. In particular, a high contact density does not necessarily correspond to an efficient load-bearing structure. A relatively small number of coarse–coarse contacts may carry a disproportionately large fraction of the applied load, whereas numerous contacts involving fine particles may contribute less to the principal force-transmission network [30]. DEM analyses of sand–fines mixtures have further identified fines-dependent transitions in packing density, mechanical coordination number, and critical-state behavior [33]. For example, the mechanically active particle network can exhibit a fines-dependent evolution that is not directly represented by conventional void-ratio measures. These findings indicate that the transition of the load-bearing skeleton should be evaluated by jointly considering contact topology and force transmission. However, quantitative evidence for how sand–sand (S–S), sand–clay (S–C), and clay–clay (C–C) contacts contribute differently to load transmission in sand–clay mixtures remains limited.
The discrete element method (DEM) provides a direct means of resolving these particle-scale processes because the contact state, contact force, particle motion, and evolution of the internal fabric can be tracked throughout loading. Recent DEM studies have extended the analysis of binary mixtures from macroscopic stress–strain behavior to packing state, force transmission, particle morphology, and mechanically active contact networks [34,35,36]. Three-dimensional models incorporating realistic sand morphology have also demonstrated that particle shape can substantially affect the strength and micromechanical response of sand–clay mixtures [8]. Nevertheless, most available numerical studies have concentrated on triaxial stress paths or mixtures containing non-plastic fines. The micromechanical response of sand–clay mixtures under simple shear has received comparatively less attention. In particular, the coupled evolution of contact topology, force partitioning among different contact types, and localized particle rearrangement has not been systematically related to the macroscopic shear response. Resolving these relationships is necessary to determine whether the observed variation in shear strength originates primarily from changes in contact abundance or from changes in the mechanical effectiveness of the load-bearing network.
Building on previous analyses of contact-type partitioning and force transmission, this study combines these measures with spatially resolved non-affine displacement analysis. The contribution is a joint assessment of how contact-network evolution, normal-force redistribution, and localized particle rearrangement vary with clay content and shear stage. These complementary observations provide a micromechanical interpretation of the measured shear response without treating their association as proof of causality. By integrating these quantities, this study establishes a direct link between contact-network evolution, load-bearing skeleton transition, particle rearrangement, and macroscopic shear response.
2. Methodology
2.1. Laboratory Simple Shear Tests
The specimens were prepared from standard sand and natural clay collected from Qingdao, China, with clay contents (CCs) of 0%, 10%, 20%, 30%, and 40% by dry mass of the mixture. The material characteristics are summarized in Table 1. The oven-dried sand and air-dried clay were weighed at the prescribed proportions and blended using a mechanical stirrer capable of clockwise and counterclockwise rotation, with a maximum speed of 600 rpm. Alternating rotation was used to reduce agglomeration and improve mixing uniformity. The mixtures were stored in sealed containers before specimen preparation to limit moisture exchange with the surrounding air.
Table 1.
Basic physical properties of the sand and clay used in the laboratory tests.
All specimens were prepared by dry compaction to a diameter of 50 mm and an initial height of 20 mm. The same target void ratio was adopted for all mixtures to control the initial preparation condition. The material was placed in three layers and gently compacted, with the surface of each layer lightly scarified before the next layer was added to minimize artificial interfaces. The pouring height was kept as low as practicable to limit particle segregation. After compaction, the upper surface was levelled to ensure uniform contact with the loading platen. The specimens were subsequently saturated before simple shear testing; thus, dry compaction refers to specimen formation, while shearing was performed after saturation.
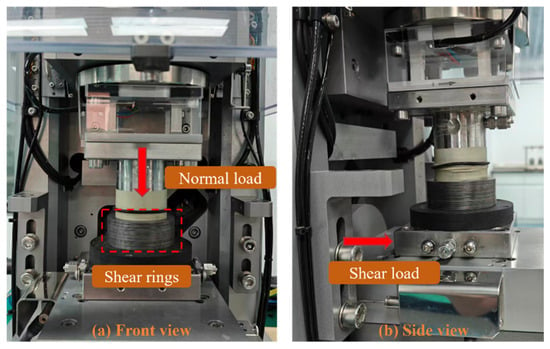
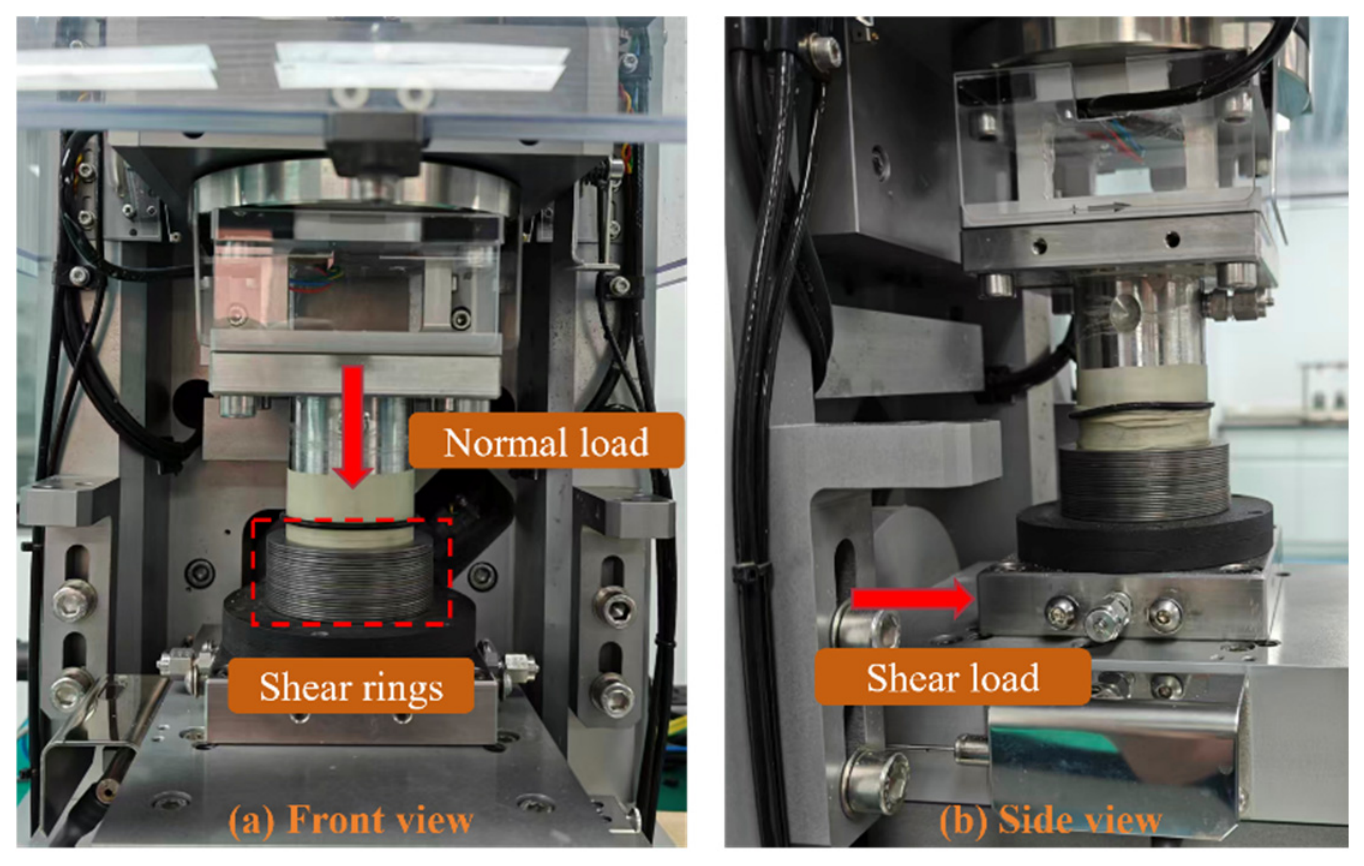
Monotonic simple shear tests were performed using a GDS electromechanical dynamic cyclic simple shear (EMDCSS) apparatus, as shown in Figure 1. The cylindrical specimen was positioned between the upper and lower loading ends and enclosed by a stack of low-friction shear rings. These rings provided circumferential confinement while allowing relative horizontal movement between adjacent rings, thereby enabling the specimen to develop an approximately simple shear deformation mode. A vertical normal stress of 100 kPa was first applied through the upper loading system and maintained throughout the test. After stabilization under the prescribed normal stress, horizontal loading was applied through the lower shear mechanism under drained conditions at a constant shear strain rate of 4.5%/h. The shear load and the horizontal and vertical displacements were continuously recorded during loading. Each test was terminated at a horizontal displacement of 4 mm, corresponding to a shear strain of 20% based on the initial specimen height. The measured shear stress and vertical deformation responses were subsequently used to evaluate the macroscopic shear behavior of the mixtures and to calibrate the corresponding PFC3D models.
Figure 1.
GDS electromechanical dynamic cyclic simple shear (EMDCSS) apparatus used for the monotonic simple shear tests: (a) front view showing the normal loading system and shear rings; (b) side view showing the horizontal shear loading system.
2.2. Numerical Model Construction
A three-dimensional DEM model was established in PFC3D to represent the laboratory simple shear specimens. The numerical specimen had a diameter of 50 mm and an initial height of 20 mm. Five mixtures with clay contents of 0%, 10%, 20%, 30%, and 40% were generated. Sand particles were assigned diameters of 0.70–1.12 mm, compared with the laboratory range of 0.15–0.30 mm, corresponding to enlargement factors of approximately 4.67 and 3.73 at the lower and upper bounds, respectively. The clay phase was represented by equivalent spherical particles with a diameter of 0.315 mm, equal to 0.45 times the minimum numerical sand diameter. This diameter is at least 63 times the upper size limit of the laboratory clay fraction (<0.005 mm) and slightly exceeds the largest laboratory sand diameter. The two components were therefore enlarged by different factors, and the laboratory sand-to-clay size ratio was not preserved.
This particle-size representation was adopted to keep the particle number and computational cost of the three-dimensional simulations manageable. The equivalent clay particles provide a simplified discretization of the fine component rather than reproducing individual clay grains. The resulting sand-to-fine diameter ratio is approximately 2.2–3.6, so the fine particles participate directly in the contact network rather than merely occupying voids within an unchanged sand skeleton. Their mechanical behavior is distinguished from that of sand through the parallel-bond model assigned to S–C and C–C contacts. Nevertheless, the altered size ratio may affect packing, contact structure, and force distribution, consistent with the particle-size effects reported for binary mixtures by Zhu et al. [31].
All particles were assigned a density of 2600 kg/m3, and the initial specimen porosity was controlled at 0.45 for all clay contents to ensure comparable initial packing conditions. As shown in Figure 2, the number of fine particles occupying the intergranular voids increased progressively with clay content, accompanied by a marked change in the contact network. Three contact types were distinguished: sand–sand (s–s), sand–clay (s–c), and clay–clay (c–c). A linear parallel-bond model was assigned to S–C and C–C contacts as a simplified representation of weak adhesion associated with the dry clay phase. Bonds were installed once before shearing at existing contacts with a gap of zero, and no rebonding was prescribed during subsequent loading. The low bond strengths provide only small tensile and cohesive shear capacities and should not be taken to imply sustained, cohesive resistance throughout shearing. A rolling-resistance linear model was used for S–S contacts to restrict particle rotation and approximate part of the resistance associated with sand-grain angularity. This contact classification was retained throughout the simulations for subsequent analyses of coordination number, force transmission, and contact-network evolution.
Figure 2.
Particle configurations and contact networks of the numerical specimens with different clay contents.
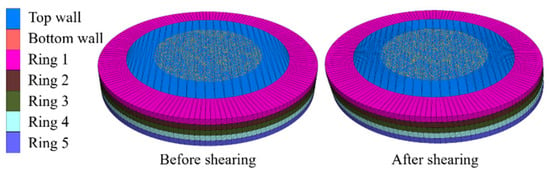
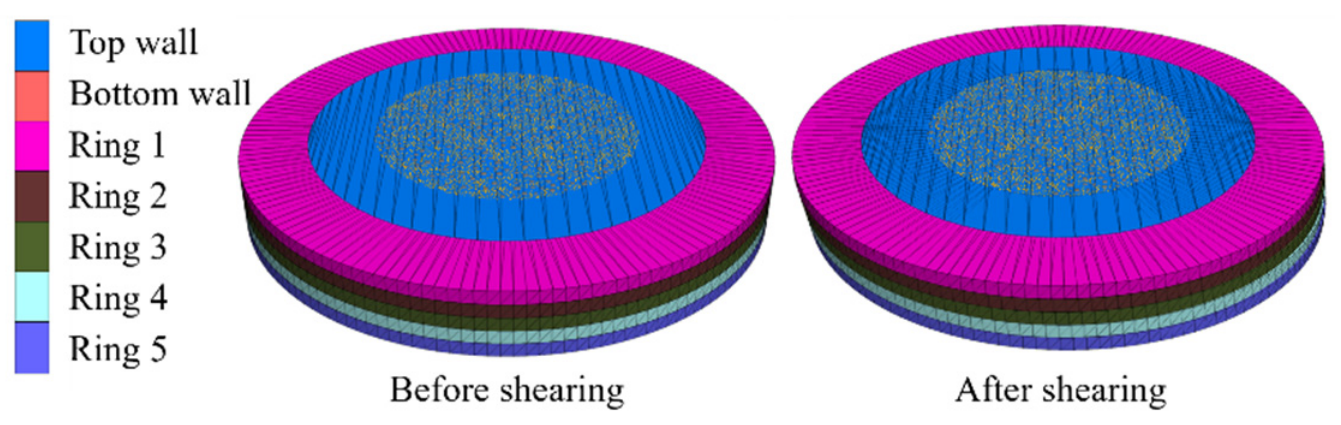
The numerical boundary configuration was designed to approximate the principal loading features of the laboratory simple shear apparatus. As shown in Figure 3, five stacked annular walls engaged the specimen after consolidation, with upper and lower walls serving as loading platens. The five-ring representation was adopted to balance boundary resolution against computational cost. Unlike the laboratory rings, whose motion responds to specimen deformation, the numerical rings were assigned velocities in the positive X direction that decreased from the bottom to the top. Relative horizontal displacement between adjacent rings was therefore prescribed, allowing differential boundary motion through the specimen height while maintaining lateral confinement. The upper platen maintained the prescribed normal stress, whereas the lower platen remained fixed. Shear loading was applied through the translating rings, and the shear stress was calculated from the ring–particle contact forces. This arrangement approximated the overall shearing action of the laboratory device, although the prescribed ring motion could influence the local deformation field.
Figure 3.
Boundary configuration of the PFC3D simple shear model before and after shearing.
Before shearing, each specimen was consolidated under a servo-controlled normal stress of 100 kPa until mechanical equilibrium was reached. This normal stress was maintained throughout shearing. The nominal post-consolidation porosities were 0.2809, 0.2335, 0.1988, 0.1800, and 0.1745 for clay contents of 0%, 10%, 20%, 30%, and 40%, respectively. These values were calculated from the summed nominal particle volumes and the specimen volume defined by the prescribed cylindrical radius and the post-consolidation platen separation. No corrections were applied for contact overlaps or particle protrusions beyond the nominal boundary, which may lower the calculated porosities. The generation porosity of 0.45 was an input parameter rather than the measured porosity immediately before consolidation; its difference from the reported values therefore does not directly quantify consolidation-induced compression.
The horizontal velocities of the stacked ring walls decreased linearly from 0.05 m/s at the bottom to zero at the top. The loading rate was assessed using the inertial number, , where = V/H is the nominal shear strain rate [37,38]. Using the relative boundary velocity V = 0.05 m/s, initial specimen height H = 0.020 m, maximum numerical particle diameter d = 1.12 mm, particle density ρp = 2600 kg/m3, and normal stress P = 100 kPa gives I ≈ 4.5 × 10⁻⁴, supporting the intended quasi-static loading conditions. Shearing continued to a horizontal displacement of 4 mm, corresponding to a nominal shear strain of 20%, consistent with the laboratory tests.
2.3. Calibration of Micromechanical Parameters
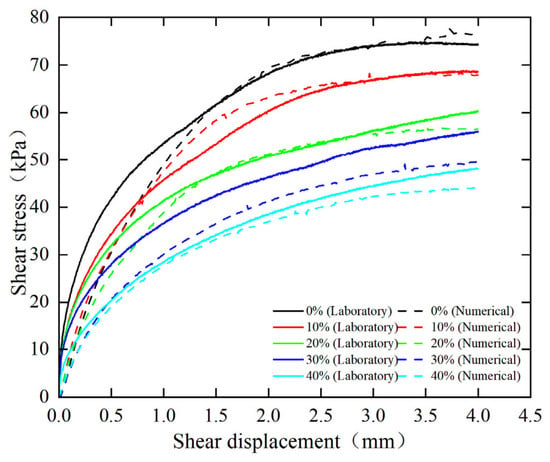
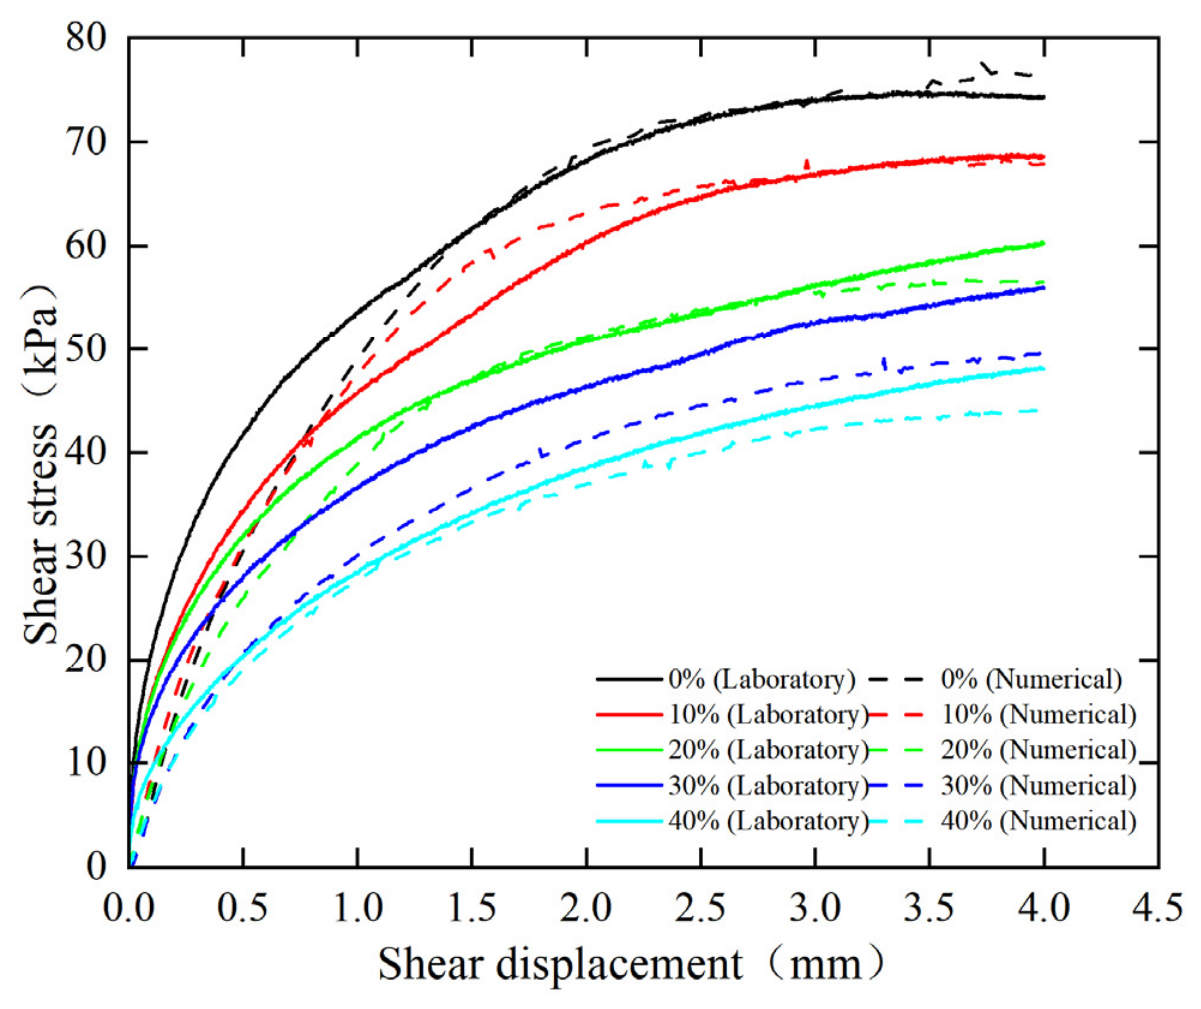
The microscopic parameters of the DEM model were calibrated by comparing the numerical shear stress–displacement responses with those obtained from the laboratory simple shear tests. The sand–sand contact parameters were first calibrated using the pure sand specimen. These parameters were then held fixed while the sand–clay and clay–clay contact parameters were adjusted to reproduce the responses of the mixtures. A single set of contact parameters was used across all clay contents, without separate adjustment for individual mixtures. Parameter selection was based on agreement with the measured stress–displacement responses rather than independent measurements of contact properties. Figure 4 presents the comparison for specimens with clay contents of 0%, 10%, 20%, 30%, and 40%. Overall, the numerical results reproduce both the evolution of shear stress with increasing shear displacement and the clay-content-dependent variation observed in the laboratory tests. For all mixtures, the shear stress increases rapidly during the initial stage and then develops more gradually with continued shearing, approaching a relatively stable state at large displacement. More importantly, the numerical simulations successfully capture the progressive reduction in shear resistance with increasing clay content, with the 0% specimen exhibiting the highest shear stress and the 40% specimen the lowest.
Figure 4.
Comparison of experimental and numerical shear stress–displacement responses of sand–clay mixtures with different clay contents.
Although the simulations capture the overall shear response and the reduction in shear resistance with increasing clay content, the initial slope of the stress–displacement curves is underestimated for mixtures with low clay contents. This difference likely reflects the choice of contact stiffnesses, which were calibrated to match the overall shear response rather than the initial stiffness alone. The spherical representation of sand grains may also contribute to the discrepancy. Rolling resistance restricts particle rotation but does not fully reproduce the geometric constraints imposed by angular grains. Differences in the contact fabric established during numerical and laboratory specimen preparation provide another possible explanation. These effects are expected to be more pronounced at low clay contents, where the response depends primarily on the sand contact network. The model therefore reproduces the overall stress–displacement behavior more closely than the initial shear stiffness.
The micromechanical parameters adopted for the three contact types are summarized in Table 2. They were calibrated against the measured shear stress–displacement responses rather than obtained from independent contact-scale measurements. The friction coefficient of 0.12 assigned to S–C and C–C contacts is an effective model parameter, rather than a measured mineral friction coefficient. The parallel-bond effective moduli and normal-to-shear stiffness ratios were assigned the same values as the corresponding linear-contact parameters in Table 2. For both contact types, the bond radius multiplier was 1.0, giving a bond radius of 0.1575 mm. The different stiffness ratios for S–C and C–C contacts were calibration choices and have not been independently verified. The shear damping ratios control viscous dissipation at the contacts and should not be interpreted as measured material damping ratios. The parameter set reproduces the principal features of the laboratory response, although the calibration does not establish a unique set of contact properties.
Table 2.
Micromechanical parameters adopted for different contact types in the PFC3D model.
3. Results and Analysis
3.1. Evolution of Contact Structure
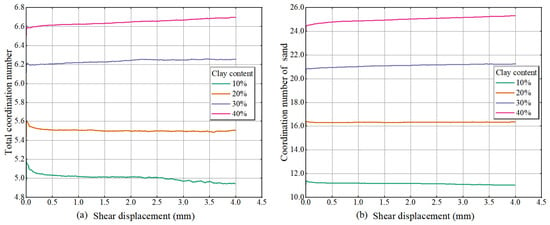
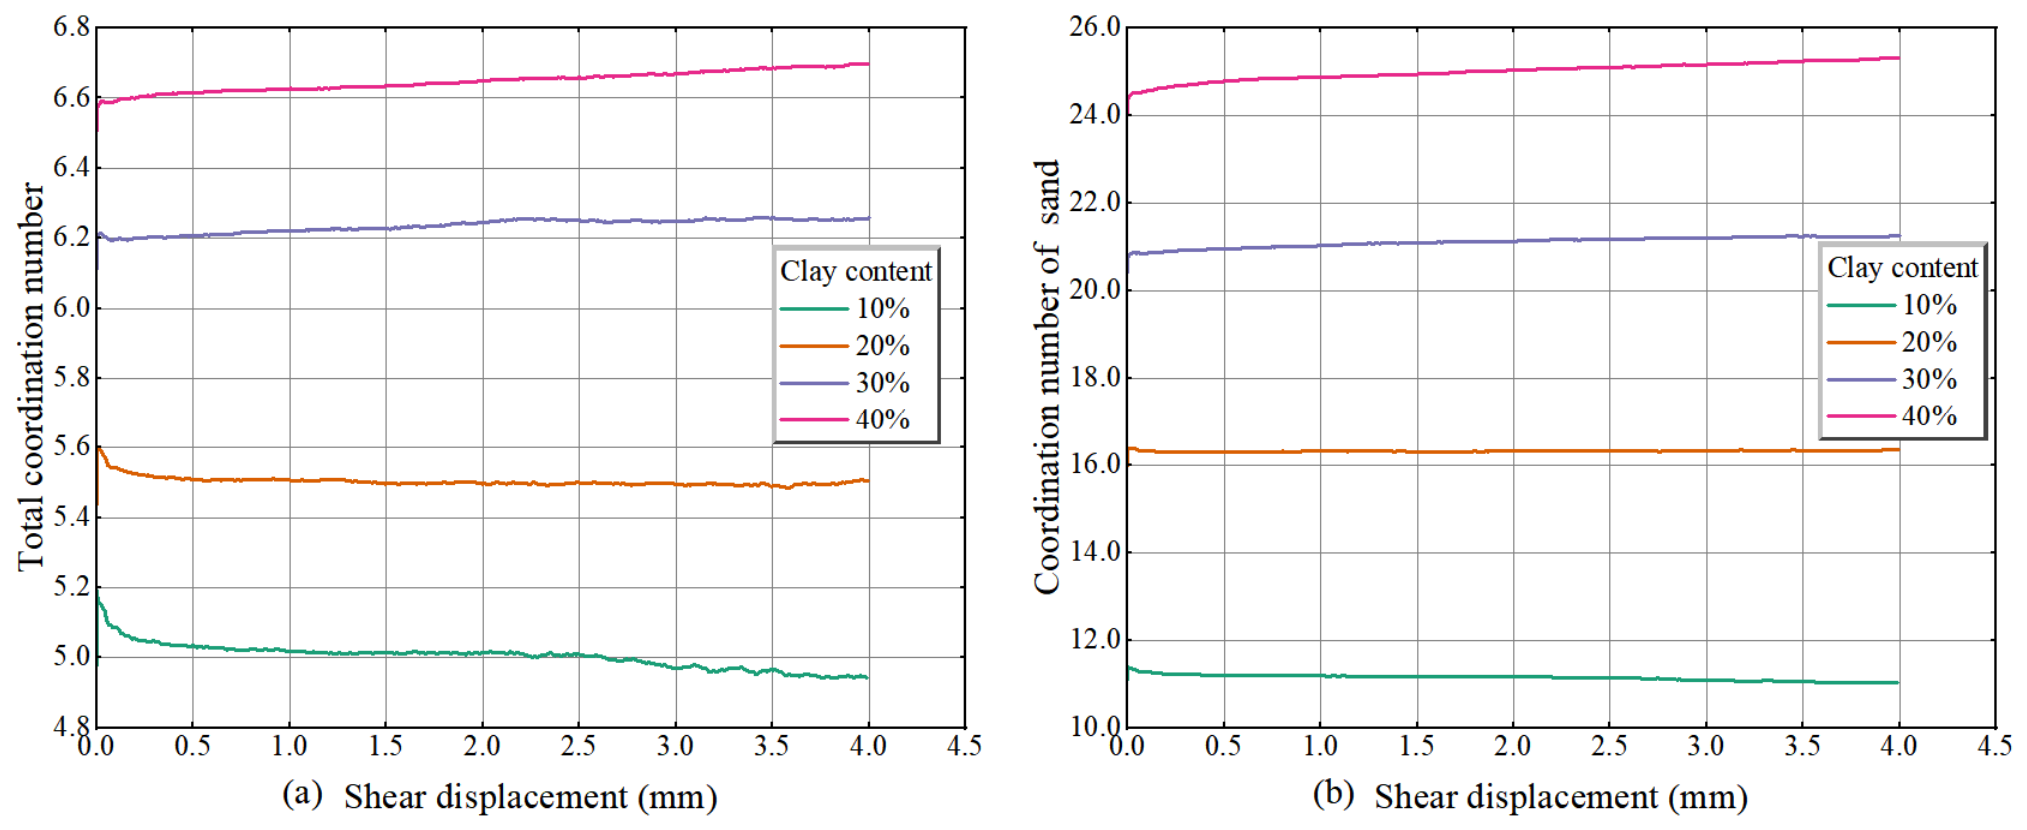
Figure 5 shows the overall and sand-particle coordination numbers during shearing. The overall coordination number was calculated as Z = 2(Nss + Nsc + Ncc)/(Ns + Nc), where Ns and Nc are the numbers of sand and clay particles, respectively, and Nss, Nsc, and Ncc are the numbers of sand–sand, sand–clay, and clay–clay contacts. Each active particle–particle contact was counted once, wall contacts were excluded, and all particles were included in the denominator. The sand-particle coordination number was calculated as Zs = (2 Nss + Nsc)/Ns, since each sand–sand contact involves two sand particles and each sand–clay contact involves one. This measure includes both contact types and differs from the sand–sand coordination number, Zss = 2 Nss/Ns, which describes direct connectivity within the sand skeleton.
Figure 5.
Evolution of coordination numbers with shear displacement for different clay contents: (a) total coordination number and (b) sand-particle coordination number.
The overall coordination number ranges from approximately 4.9 to 6.7 (Figure 5a), comparable in magnitude to the values around six discussed in the experimental studies of spherical grains [39,40]. At CC = 10%, it decreases sharply at the onset of shearing and then declines gradually. The initial decrease is smaller at CC = 20%, whereas slight increases occur at CC = 30% and 40%. The sand-particle coordination number follows similar trends but increases from approximately 11 to 25 as clay content rises (Figure 5b). These larger values represent the number of contacts per sand particle, rather than the average over the entire assembly. They reflect the numerous smaller clay particles contacting individual sand grains and should not be interpreted as an increase in direct sand–sand connectivity. The contact-type proportions in Figure 6 are therefore needed to distinguish increased sand–clay contact from changes in the sand skeleton.
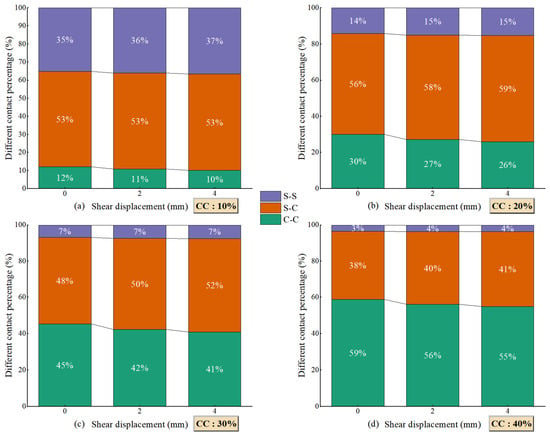
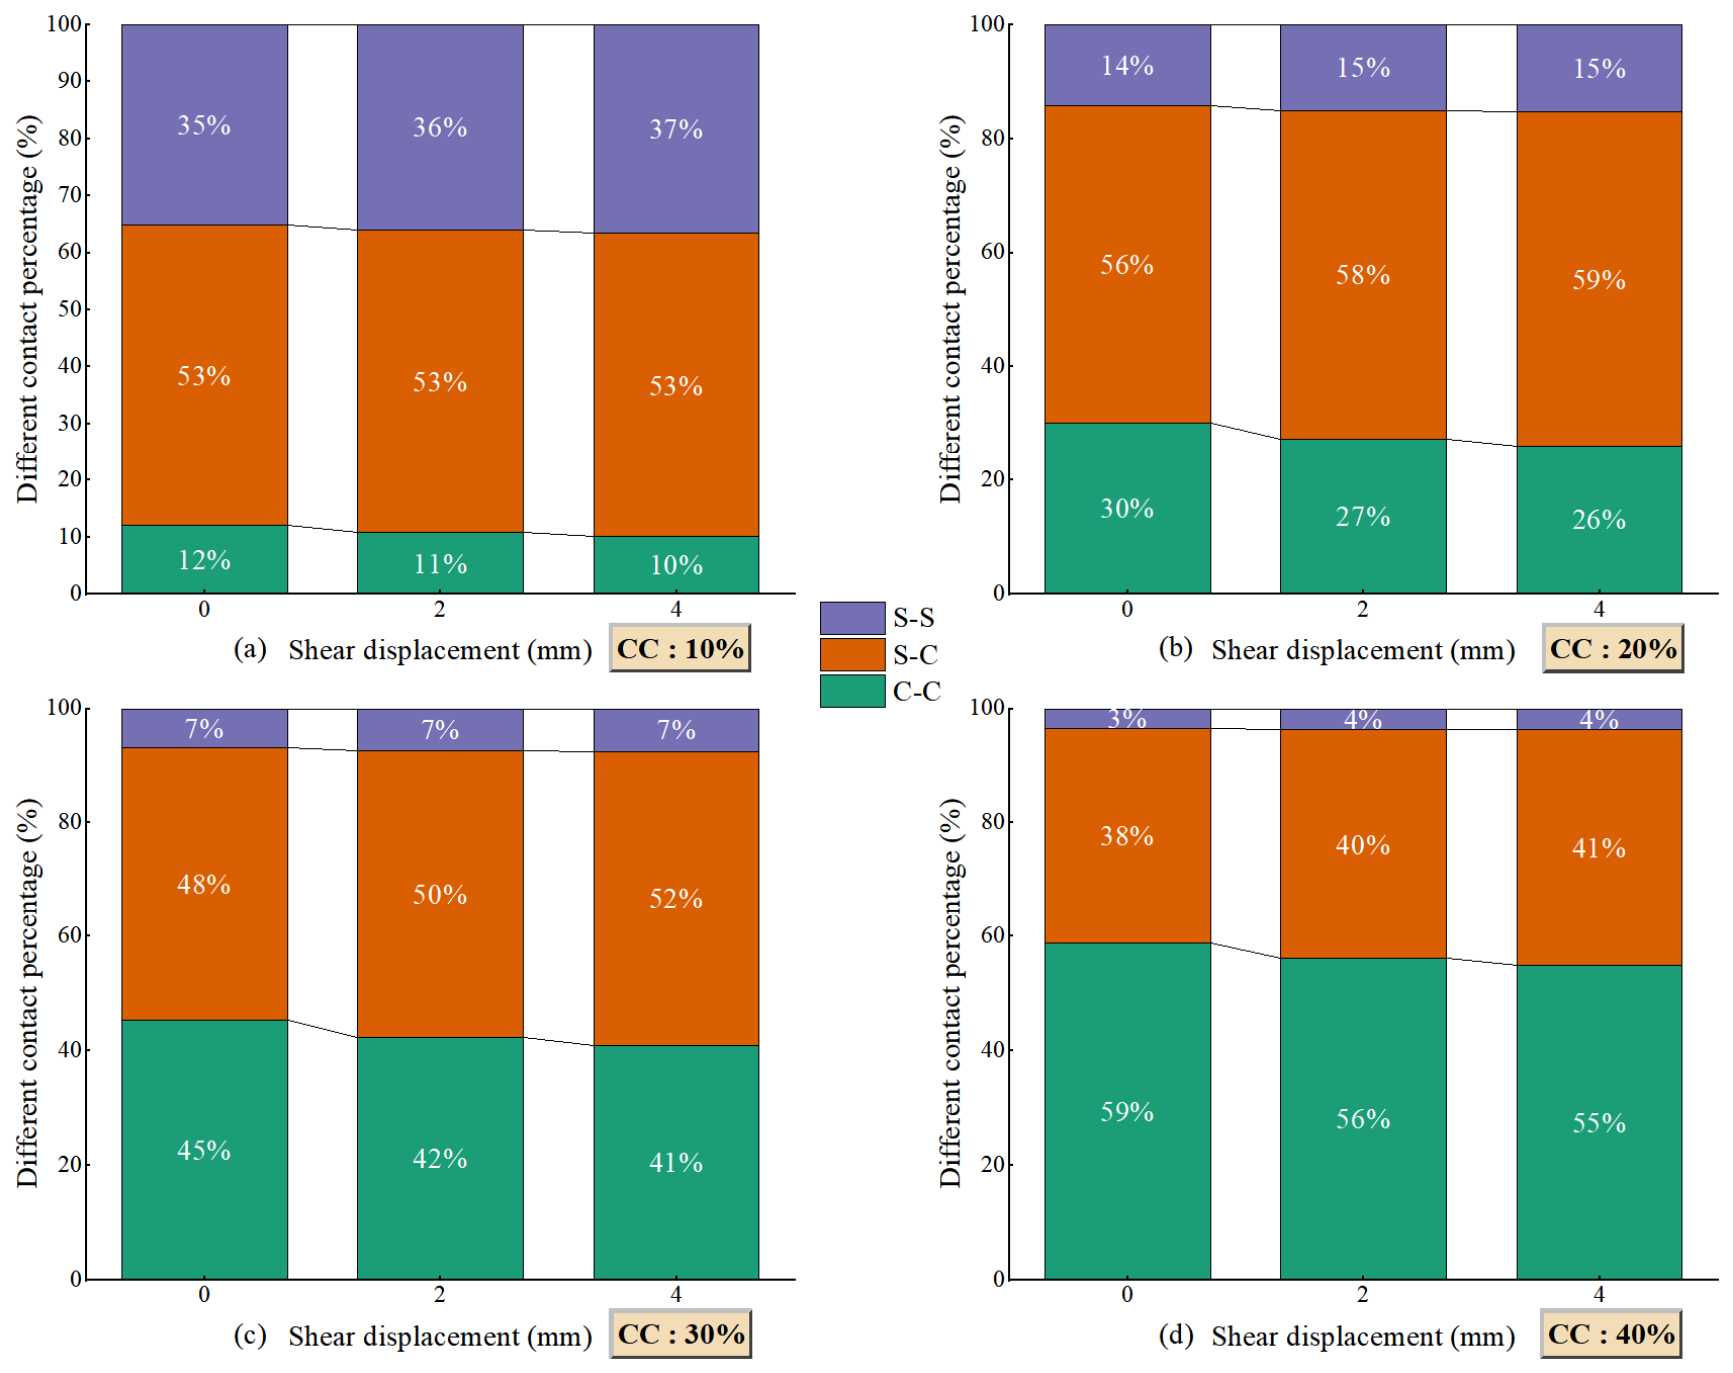
Figure 6.
Evolution of the proportions of sand–sand (S–S), sand–clay (S–C), and clay–clay (C–C) contacts at different shear stages for different clay contents.
The contact-type distributions further reveal that the increase in coordination number does not correspond to an enhancement of direct sand–sand connectivity in Figure 6. At CC = 10%, S-C contacts dominate the contact network, accounting for approximately 53%, while S-S contacts represent 35–37%. With increasing CC, the proportion of S-S contacts decreases markedly, reaching only 3–4% at CC = 40%, whereas C-C contacts increase from approximately 10–12% to 55–59%. During shearing, the C-C fraction consistently decreases, accompanied mainly by an increase in S-C contacts and, to a lesser extent, S-S contacts. Therefore, the higher coordination numbers at high CC primarily arise from the increasing participation of clay particles rather than from enhanced direct connectivity among sand grains. This observation indicates that increasing clay content progressively transforms the internal contact topology from a sand-associated network toward a clay-dominated contact network.
The decrease in the C–C fraction during shearing is consistent with redistribution of the fine particles as the contact network rearranges. Relative movement between sand grains changes the geometry of the intervening pore space, allowing clay particles to lose contacts with neighboring clay particles and establish new contacts with sand surfaces. The accompanying increase in the S–C fraction supports this interpretation. However, the C–C fraction is defined as fcc = Ncc/(Nss + Nsc + Ncc); its decline therefore indicates a reduced share of C–C contacts rather than necessarily a decrease in their absolute number. At higher clay contents, this redistribution occurs alongside a slight increase in the overall coordination number (Figure 5a), suggesting that contact renewal can maintain or increase the total connectivity while changing the relative contributions of the three contact types.
Consequently, a higher coordination number does not necessarily imply a stronger load-bearing skeleton, and the mechanical significance of this contact-network transition depends on how forces are redistributed among the different contact types, as examined in the following section.
3.2. Force Transmission Characteristics
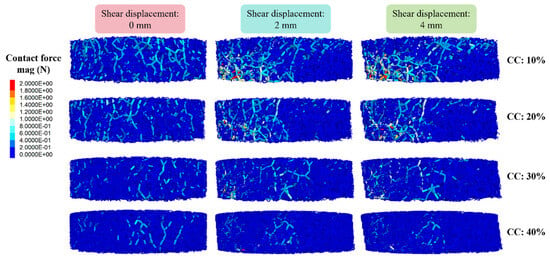
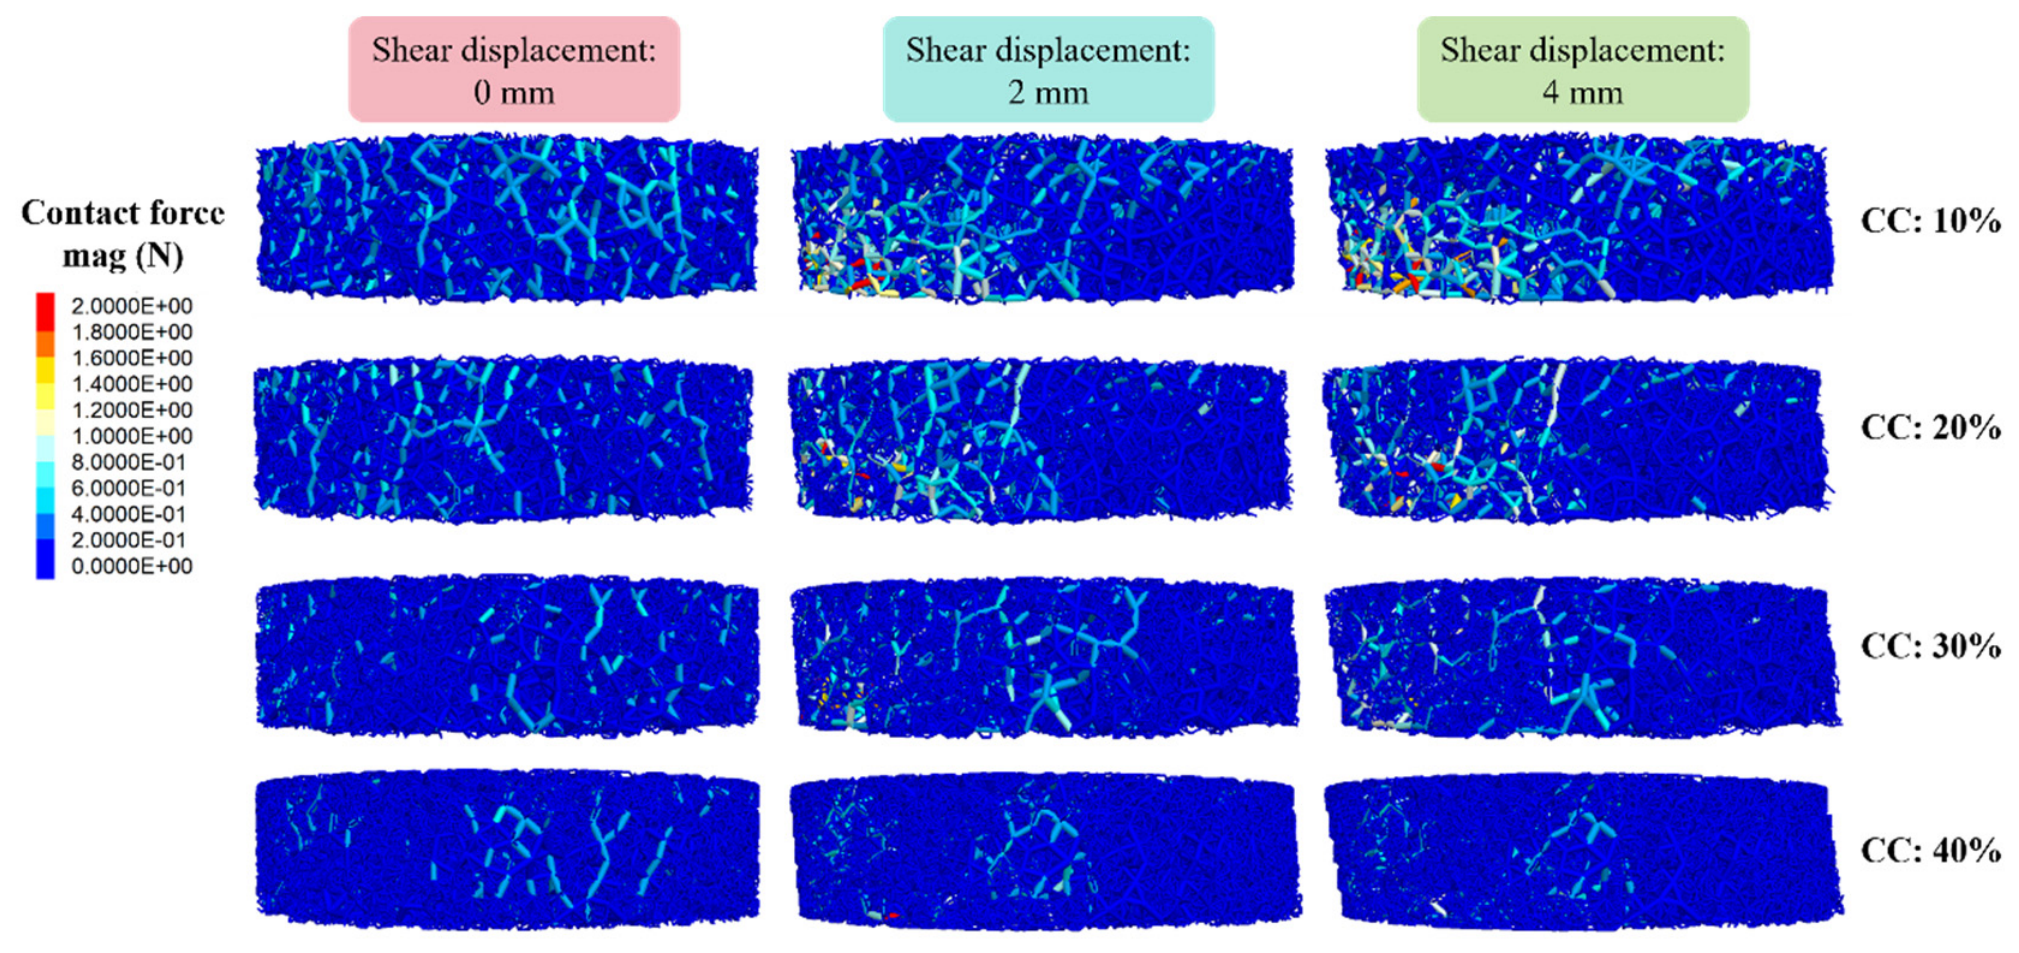
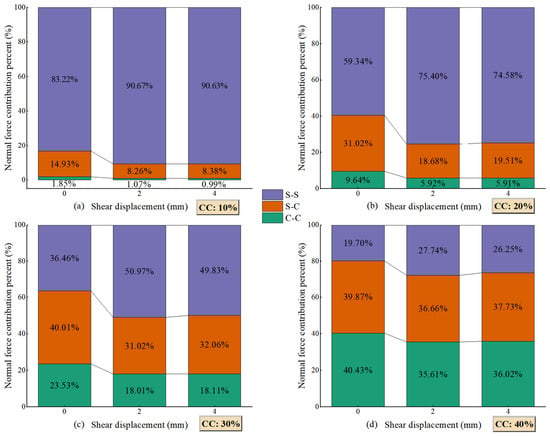
Figure 7 shows the contact-force distributions at different shear stages and clay contents. A common force range of 0–2 N was selected after examining the distributions across all specimens and was applied to every panel. The upper limit of 2 N defines the display scale; it is not a threshold for identifying strong contacts. Using the same scale preserves differences in absolute contact-force magnitude and allows their spatial distribution to be compared directly. At low clay contents, contacts carrying relatively large forces form prominent paths through the specimen. These paths become less evident as clay content increases, despite the increase in the overall coordination number. This change reflects both the lower shear resistance and the redistribution of forces among contact types. Figure 7 provides a visual comparison of these distributions, while the contributions of S–S, S–C, and C–C contacts to normal force transmission are quantified in Figure 8.
Figure 7.
Evolution of contact-force chains at different shear stages for different clay contents.
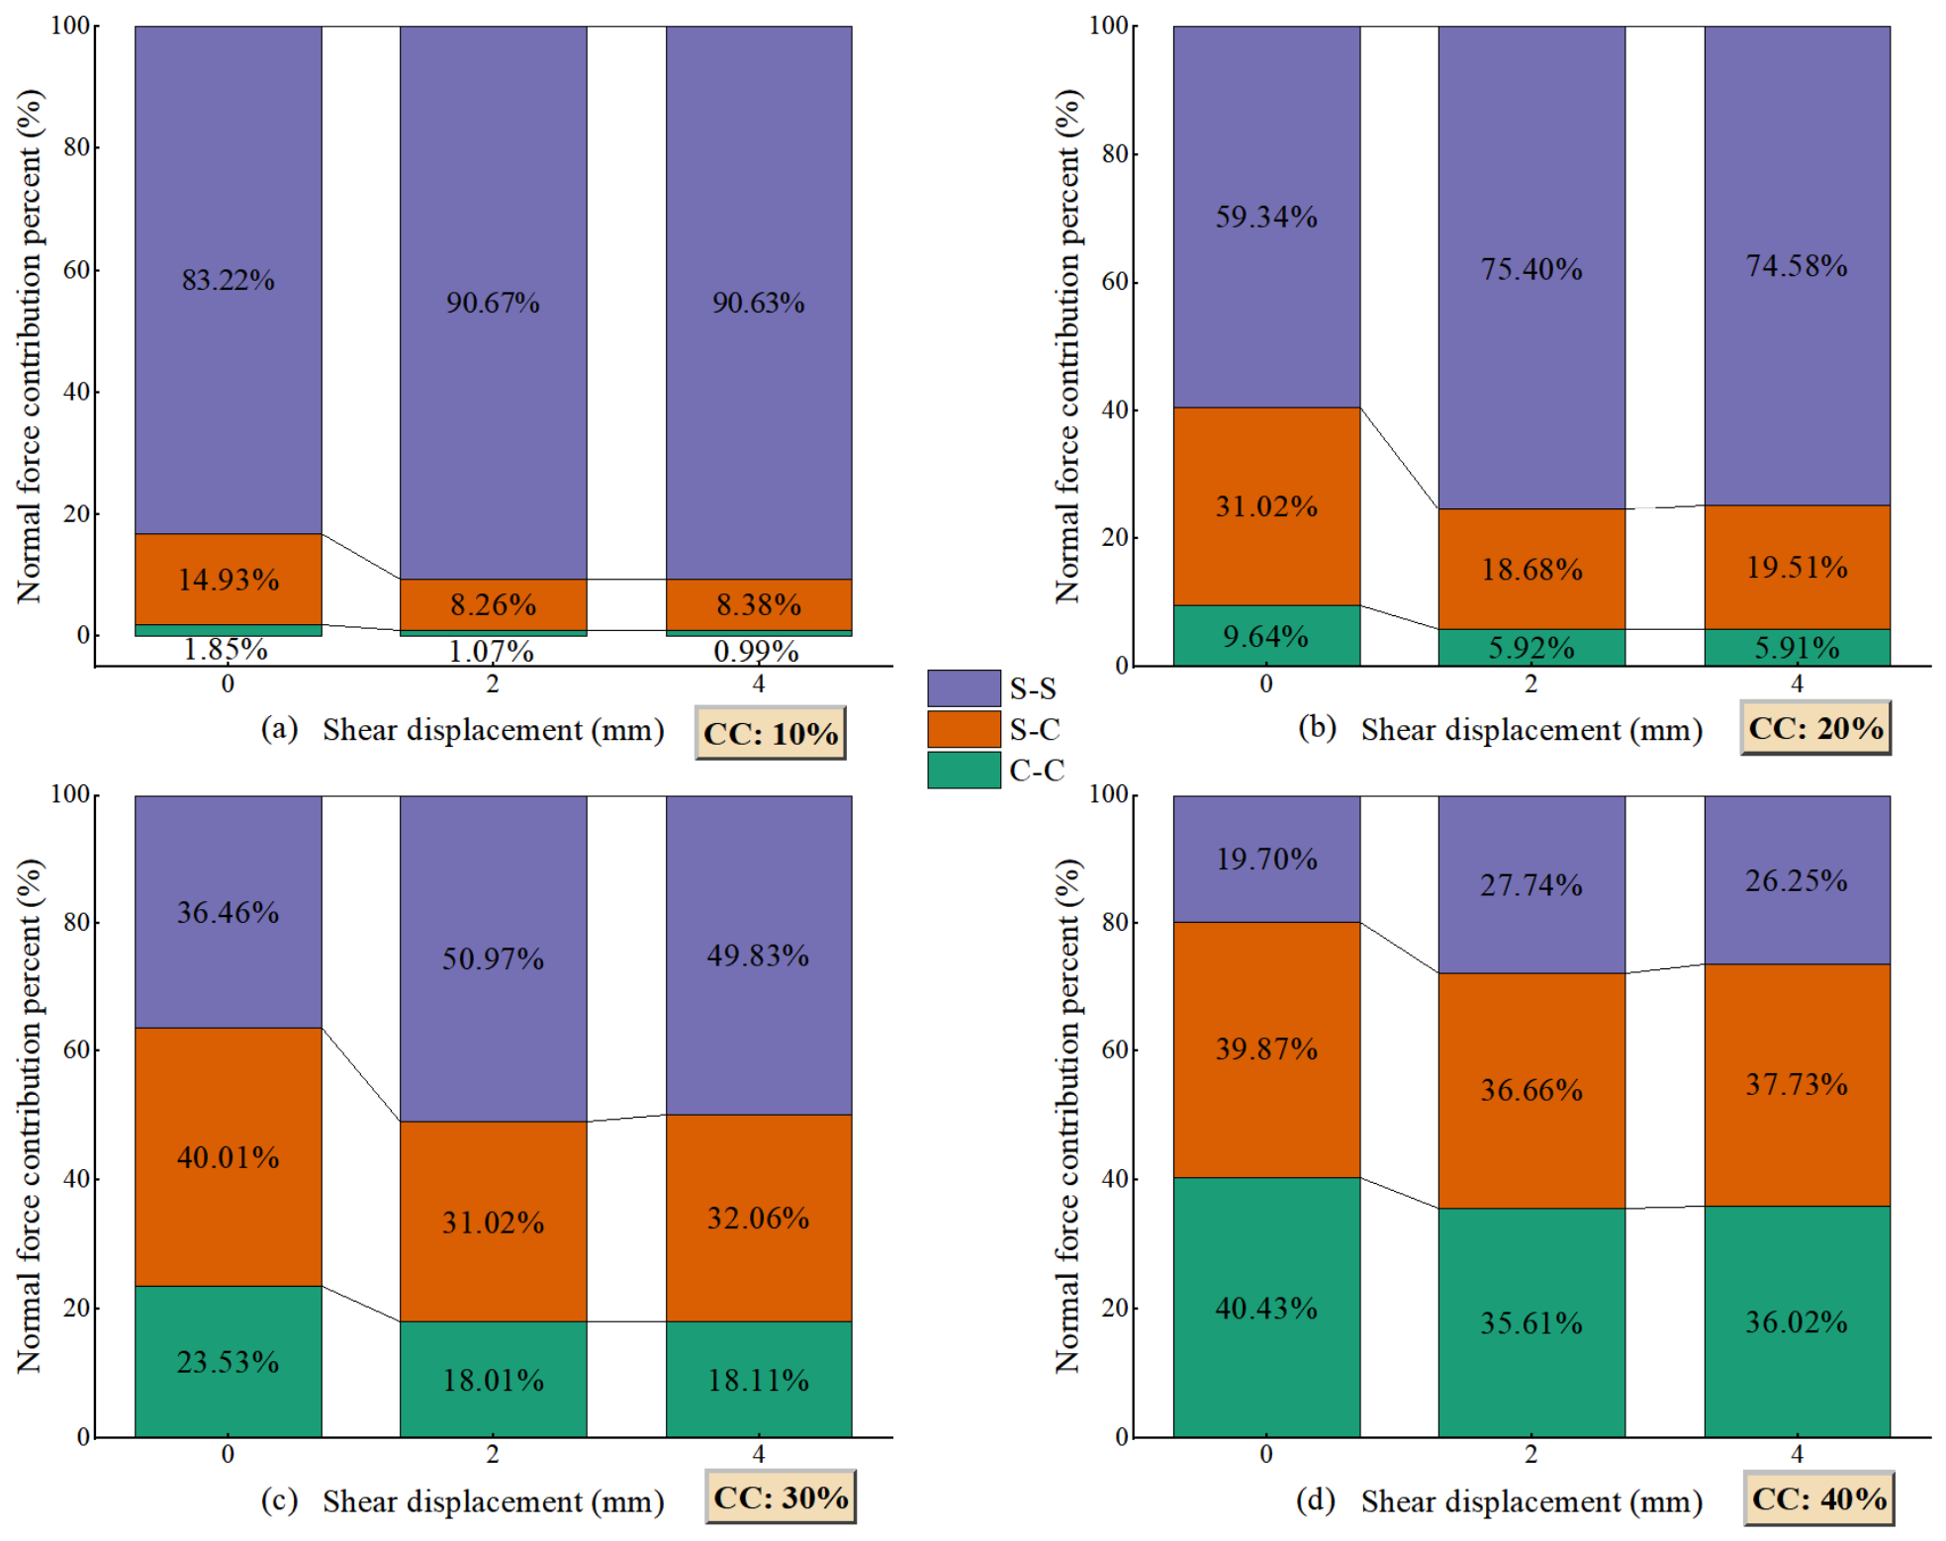
Figure 8.
Contributions of different contact types to normal force transmission at different shear stages: (a) CC = 10%, (b) CC = 20%, (c) CC = 30%, and (d) CC = 40%.
The contributions of the three contact types to normal force transmission are quantified in Figure 8. At CC = 10%, S–S contacts carry 83.22% of the total normal contact force in the initial state, and their contribution increases to approximately 91% after shearing, indicating that the load-bearing structure remains strongly dominated by direct contacts between sand particles. With increasing clay content, the contribution of S–S contacts decreases substantially. At CC = 30%, the initial contributions of S–S, S–C, and C–C contacts are 36.46%, 40.01%, and 23.53%, respectively, although the S–S contribution increases to approximately 50% after shearing. At CC = 40%, S–C and C–C contacts jointly carry approximately 80% of the normal contact force initially and more than 70% after shearing, demonstrating a transition from a sand-skeleton-dominated force network toward a mixed force-transmission network involving extensive sand–clay and clay–clay contacts. Here, the normal-force contribution refers to the fraction of the summed normal contact force carried by each contact type. It describes normal-force partitioning and should not be interpreted as the corresponding fraction of macroscopic shear stress.
Comparison with the contact proportions in Figure 6 further shows that contact abundance does not directly represent mechanical importance. S–S contacts constitute only a relatively small fraction of all contacts at intermediate and high clay contents but carry a disproportionately large fraction of the normal force. Moreover, the major redistribution of normal force occurs primarily between 0 and 2 mm, whereas the contributions of the three contact types change only slightly from 2 to 4 mm. This indicates that the principal load-bearing network is rapidly reorganized during the early stage of shearing and subsequently approaches a relatively stable force-transmission configuration. The progressive replacement of efficient S–S force-transmission paths by S–C and C–C contacts provides a micromechanical explanation for the reduction in macroscopic shear resistance with increasing clay content.
3.3. Development of Shear Localization
The micromechanical analysis focuses on particle rearrangement and shear localization to examine how changes in the contact network accompany the macroscopic shear response. Non-affine displacement quantifies local departures from affine deformation, providing a spatial description of particle rearrangements that cannot be resolved from the stress–displacement curves alone. Its spatial distributions and height-dependent profiles are used to identify deformation concentrations and compare localization patterns among mixtures with different clay contents.
To characterize particle-scale deformation localization while excluding the contribution of the imposed macroscopic simple shear deformation, the non-affine displacement measure , originally proposed by Falk and Langer [41], was adopted. For each particle i, neighboring particles j within a prescribed cutoff radius in the reference configuration were identified, and the best-fit local affine transformation tensor Ji between two successive configurations was determined. The non-affine displacement measure was then calculated as
where Ni is the number of neighboring particles, and rij denotes the relative position vector between particles i and j. The tensor Ji represents the local affine deformation that minimizes . Consequently, a small indicates that the motion of a particle and its neighbors can be largely described by a locally homogeneous deformation, whereas a large value represents pronounced non-affine motion associated with particle sliding, rearrangement, and local structural reorganization. To facilitate comparison among the specimens, was normalized by the square of the representative sand-particle diameter, . Both sand and clay particles are included in the calculation, and neighbors may belong to either particle type. Here, d50 = 0.91 mm denotes the prescribed representative sand-size parameter, calculated as the arithmetic midpoint of the specified size bounds rather than obtained from a measured particle-size distribution. The same value is used for all specimens, giving a fixed neighborhood radius of 2.5d50 = 2.275 mm.
The calculations were performed separately over the 0–2 and 2–4 mm shear intervals. These two intervals provide a comparison of non-affine deformation over the earlier and later stages of shearing. Each value describes the residual between the interval endpoints after removing the best-fitting local affine deformation. It does not resolve the sequence of rearrangements within the interval.
A fixed cutoff radius of 2.5d50 was adopted to define each particle neighborhood in the reference configuration. The same neighbors were tracked to the interval endpoint when determining the local affine transformation. Particles with fewer than six neighbors or a neighborhood matrix of rank below three were excluded. Near the specimen boundaries, only the particles physically present within the cutoff were used; no mirrored particles or wall elements were included. These criteria permit a three-dimensional affine fit, but truncated neighborhoods may still affect estimates near the boundaries.
Figure 9 presents the spatial distributions of during the 0–2 and 2–4 mm shear intervals. Pronounced spatial heterogeneity is observed for all clay contents, with particles exhibiting relatively large preferentially concentrated in the lower portion of the specimens. This indicates that particle rearrangement departs substantially from the imposed affine simple-shear deformation within this region, providing direct evidence of deformation localization. During the 0–2 mm interval, extensive high- regions are observed for CC = 10–30%, whereas the high-value particles become more spatially restricted at CC = 40%. In contrast, the middle and upper portions of the specimens are predominantly characterized by relatively low , particularly at the higher clay contents. Therefore, increasing clay content does not simply produce a monotonic change in non-affine deformation but modifies both its intensity and spatial distribution.
Figure 9.
Spatial distributions of normalized particle non-affine displacement () at different shear intervals for different clay contents.
During the subsequent 2–4 mm interval, the extent and intensity of the high- regions generally decrease. The localized non-affine deformation nevertheless remains preferentially distributed in the lower portion of the specimens, indicating that subsequent shearing tends to continue within the previously developed localized deformation zone rather than generating extensive new regions of particle rearrangement. The contrast between the two shear intervals therefore suggests that the principal reorganization of the particle assembly occurs during the earlier stage of shearing.
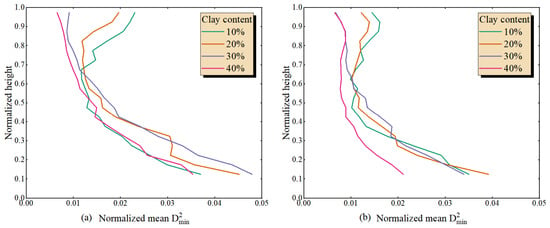
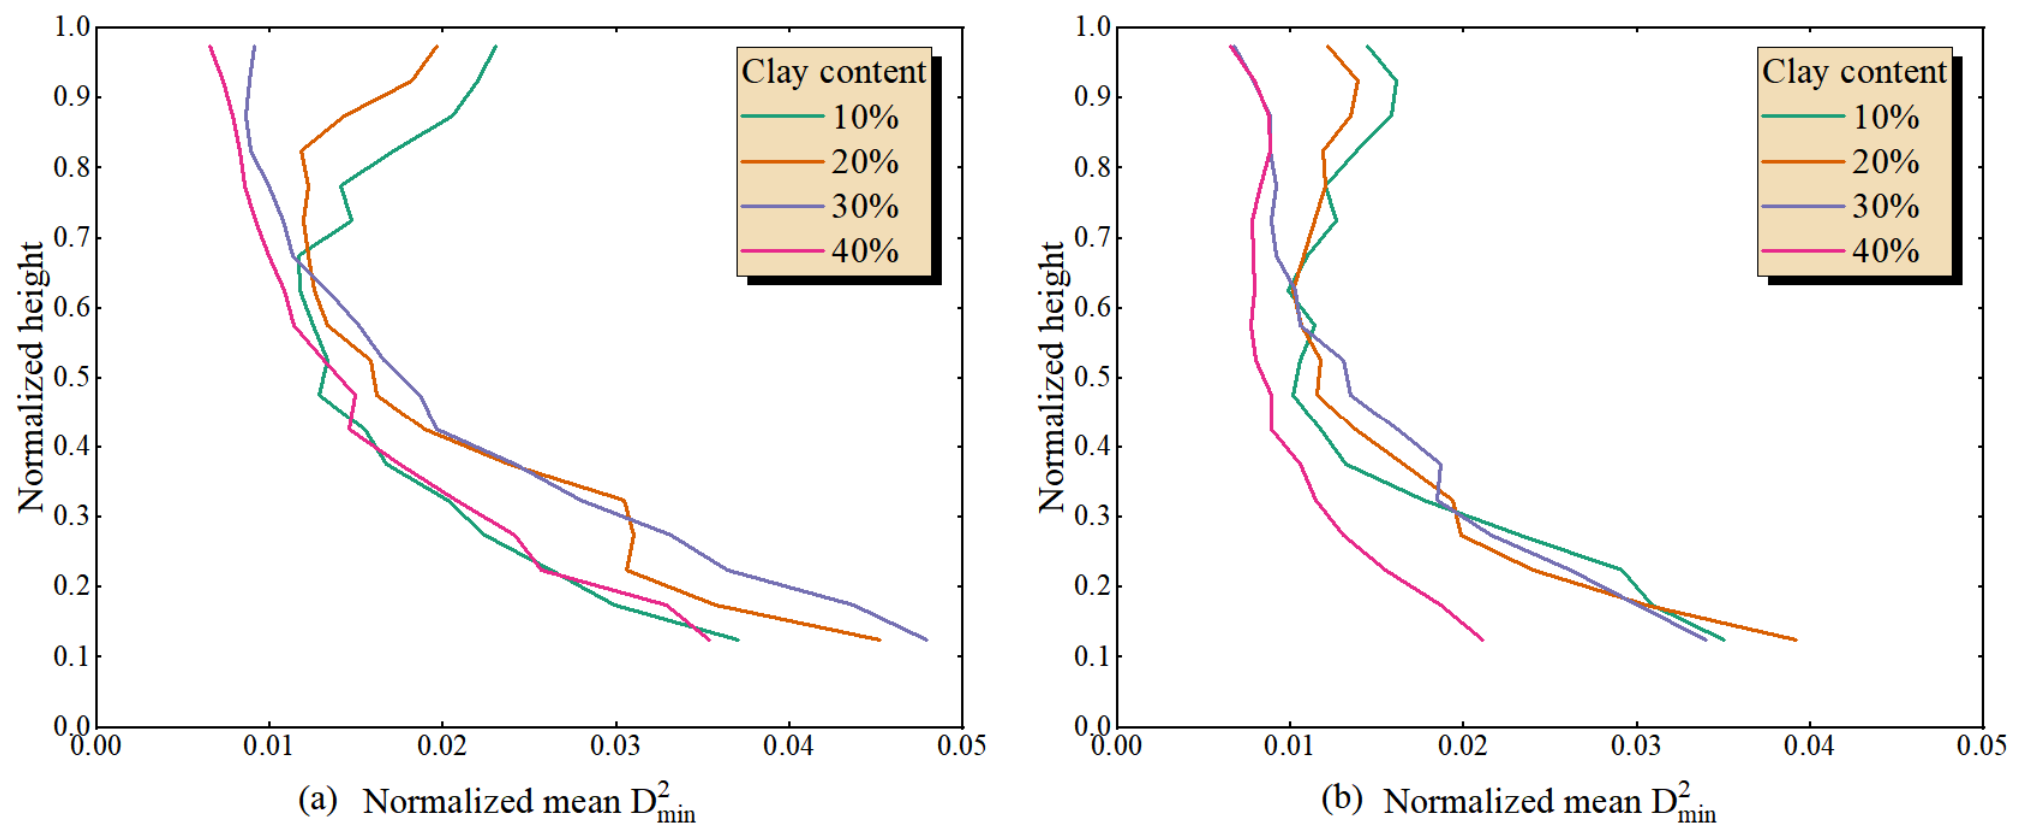
To quantify the spatial localization observed in Figure 9, the specimens were divided into horizontal layers, and the mean normalized non-affine displacement, , was calculated for each layer. Each height profile is calculated as the arithmetic mean over all valid sand and clay particles within each of 20 horizontal layers defined in the reference configuration. The profiles therefore give equal weight to individual particles, and their variation with clay content reflects both changes in particle motion and changes in the relative numbers of sand and clay particles. As shown in Figure 10, relatively high values during the 0–2 mm interval are concentrated predominantly within the lower part of the specimens, generally below z/H ≈ 0.3–0.4, followed by a pronounced decrease toward the middle and upper portions. The influence of clay content is again non-monotonic. In particular, the CC = 30% specimen exhibits relatively intense non-affine rearrangement near the bottom while maintaining substantially lower values at greater heights, whereas the CC = 40% specimen generally exhibits weaker non-affine motion throughout the middle and upper regions. These results confirm that clay addition alters not only the magnitude of particle rearrangement but also the degree to which deformation is spatially localized.
Figure 10.
Profiles of normalized mean non-affine displacement along the specimen height for different clay contents: (a) 0–2 mm and (b) 2–4 mm shear intervals.
The non-monotonic variation may reflect competing changes in contact constraints and packing. At intermediate clay contents, the reduction in direct S–S contacts may permit greater local rearrangement. At higher clay contents, the lower post-consolidation porosity and the increased participation of S–C and C–C contacts may restrict some rearrangements or redistribute them spatially. A lower shear resistance therefore need not coincide with a larger departure from locally affine motion. The changing relative numbers of sand and clay particles may also influence the profiles because the averages are calculated per particle. These effects offer a possible explanation for the observed trend, although their individual contributions have not been isolated.
Compared with the 0–2 mm interval, during the 2–4 mm interval is generally lower, and the differences among the clay contents become less pronounced, particularly in the middle and upper parts of the specimens. Figure 8 also shows that the larger changes in normal-force partitioning occur during the first 2 mm of shearing. Together, the two analyses indicate that changes in contact-force distribution and departures from locally affine deformation are more pronounced during the earlier interval. This correspondence supports a joint discussion of contact-network evolution and particle rearrangement but does not establish a direct causal relationship between them. A particle-level comparison of force changes and non-affine motion would be needed to test that relationship.
The concentration of non-affine displacement near the specimen base should be interpreted in relation to the imposed boundary motion. Although the lower platen remains fixed, the adjacent rings have the highest prescribed horizontal velocities. The resulting contrast in boundary motion may contribute to local particle rearrangement near the base. The observed localization pattern therefore reflects the combined influence of the material response and the adopted boundary conditions.
4. Discussion
4.1. Transition of the Load-Bearing Skeleton with Increasing Clay Content
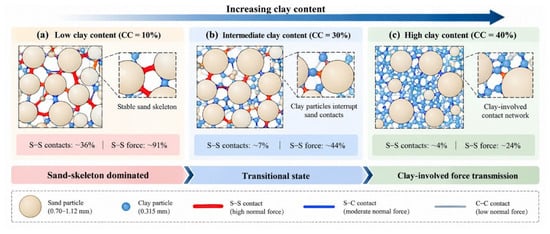
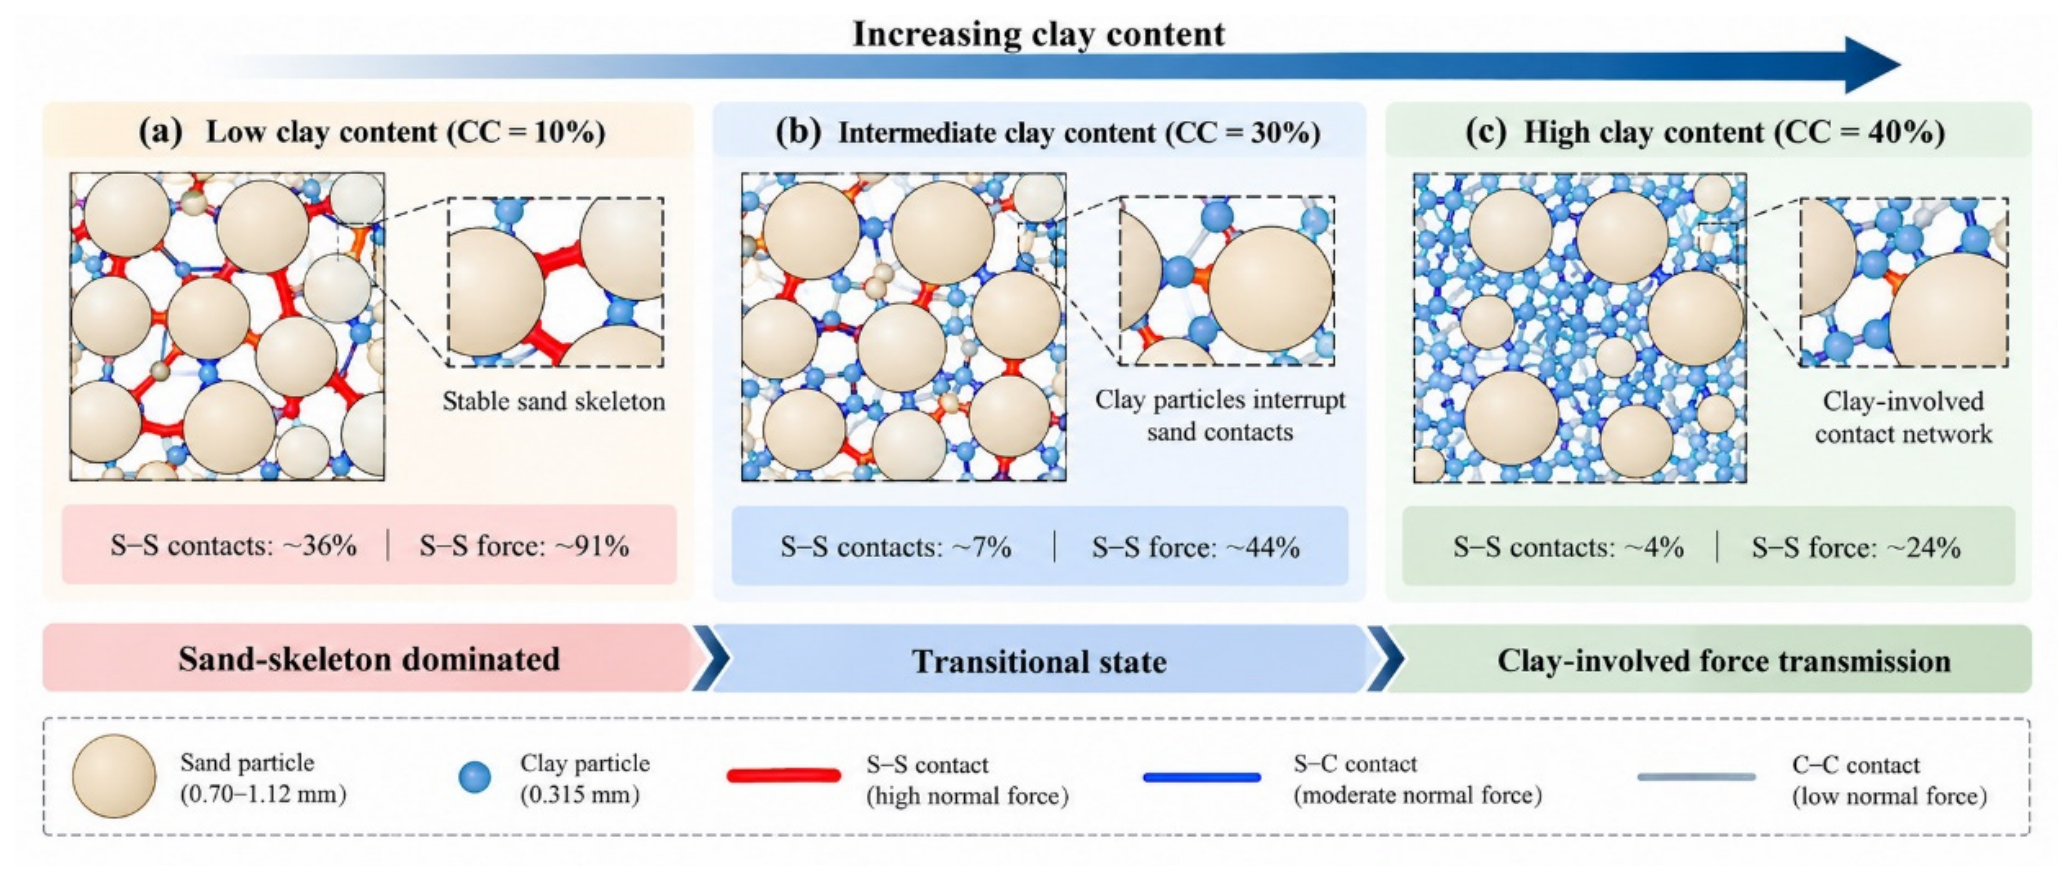
Figure 11 presents a conceptual interpretation of the contrasting contact structures observed in the numerical specimens, based on the contact-network and normal-force partitioning results in Figure 6, Figure 7 and Figure 8. The sand-dominated, transitional, and clay-involved configurations describe the changing participation of S–S, S–C, and C–C contacts as clay content increases. These descriptions provide a basis for discussing the micromechanical changes accompanying the reduction in shear resistance. They do not represent quantitatively bounded regimes or imply abrupt changes in the macroscopic response.
Figure 11.
Conceptual sketch of sand-dominated, transitional, and clay-involved contact configurations with increasing clay content.
At CC = 10%, S–S contacts account for approximately 35–37% of all contacts but transmit approximately 83–91% of the total normal contact force. This identifies a load-bearing structure dominated by direct sand contacts, although the equivalent clay particles also participate in the contact network. The distinction is based on force transmission rather than an assumption that the fine particles fit freely within the sand pores. As clay content increases, a greater share of the normal force is transferred through S–C and C–C contacts. The three configurations in Figure 11 describe this redistribution for the adopted particle-size ratio. Their associated clay contents should not be treated as general transition thresholds, since size ratio can alter the contributions and anisotropy of the contact subnetworks [31].
As the clay content increases, the increasing number of clay particles progressively interrupts direct contacts between sand particles and substantially reduces S–S connectivity. At CC = 30%, S–S contacts account for only approximately 7% of the total contacts. Nevertheless, they still transmit approximately 36–51% of the total normal contact force, indicating that the remaining S–S contacts continue to act as mechanically important load-transmission paths. Meanwhile, the increasing participation of S–C and C–C contacts enables a larger proportion of the applied load to be transferred through clay-involved contact paths. The load-bearing structure therefore evolves from a continuous sand skeleton toward a transitional mixed network in which the remaining S–S contacts and clay-involved contacts jointly participate in force transmission.
At CC = 40%, direct S–S contacts become sparse, representing only approximately 3–4% of the total contacts, and their contribution to normal force transmission decreases to approximately 20–28%. Consequently, most of the normal force is transmitted through S–C and C–C contacts. The load-bearing structure at this stage can therefore no longer be described as a continuous sand skeleton; instead, it is characterized by a clay-involved mixed force-transmission network in which isolated sand particles or locally connected sand contacts are embedded within a dense clay-associated contact network. Importantly, the persistence of a disproportionate S–S force contribution indicates that the remaining direct sand contacts still constitute locally efficient load-transmission paths even at high clay content.
The reduction in shear strength should also be considered in relation to the packing of the sand skeleton. Although the post-consolidation porosity decreased with increasing clay content, this does not necessarily indicate a denser sand skeleton, because clay occupies part of the space between sand grains. Simultaneous generation of the two particle populations does not remove this compositional effect. The observed strength reduction therefore reflects the combined influence of sand skeleton packing, contact properties, and force transmission; their individual contributions cannot be separated from the present simulations.
These results demonstrate that the transition of the load-bearing skeleton is governed not simply by the number of contacts but by the mechanical role of different contact types. With increasing clay content, the total coordination number increases because of the rapid development of S–C and C–C contacts, whereas direct S–S connectivity decreases substantially. Consequently, a denser contact network does not necessarily correspond to a more effective load-bearing skeleton. The progressive loss of continuous S–S force-transmission paths and the increasing participation of S–C and C–C contacts lead to a transition from a sand-skeleton-dominated structure, through a transitional mixed network, to a clay-involved mixed force-transmission network. This structural transition provides the micromechanical basis for understanding why the macroscopic shear resistance decreases with increasing clay content despite the simultaneous increase in total coordination number.
The sampled clay contents reveal contrasting contact structures but do not resolve the compositions at which one configuration gives way to another. The smooth decrease in shear strength is consistent with a gradual change in the relative participation of the contact types. Identifying transition thresholds will require a finer sampling of clay content and a quantitative criterion based on skeleton connectivity or stress transmission. The three configurations are therefore presented as preliminary descriptions of the simulated mixtures.
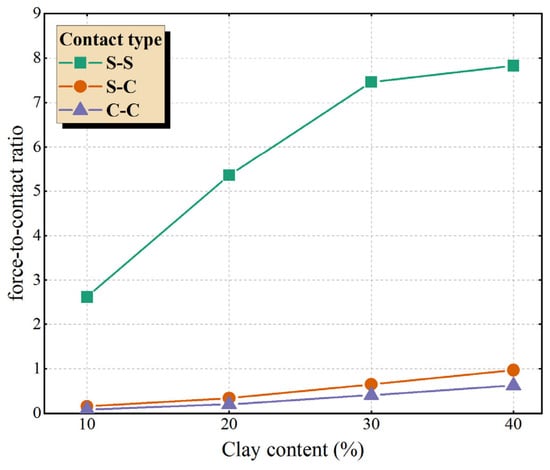
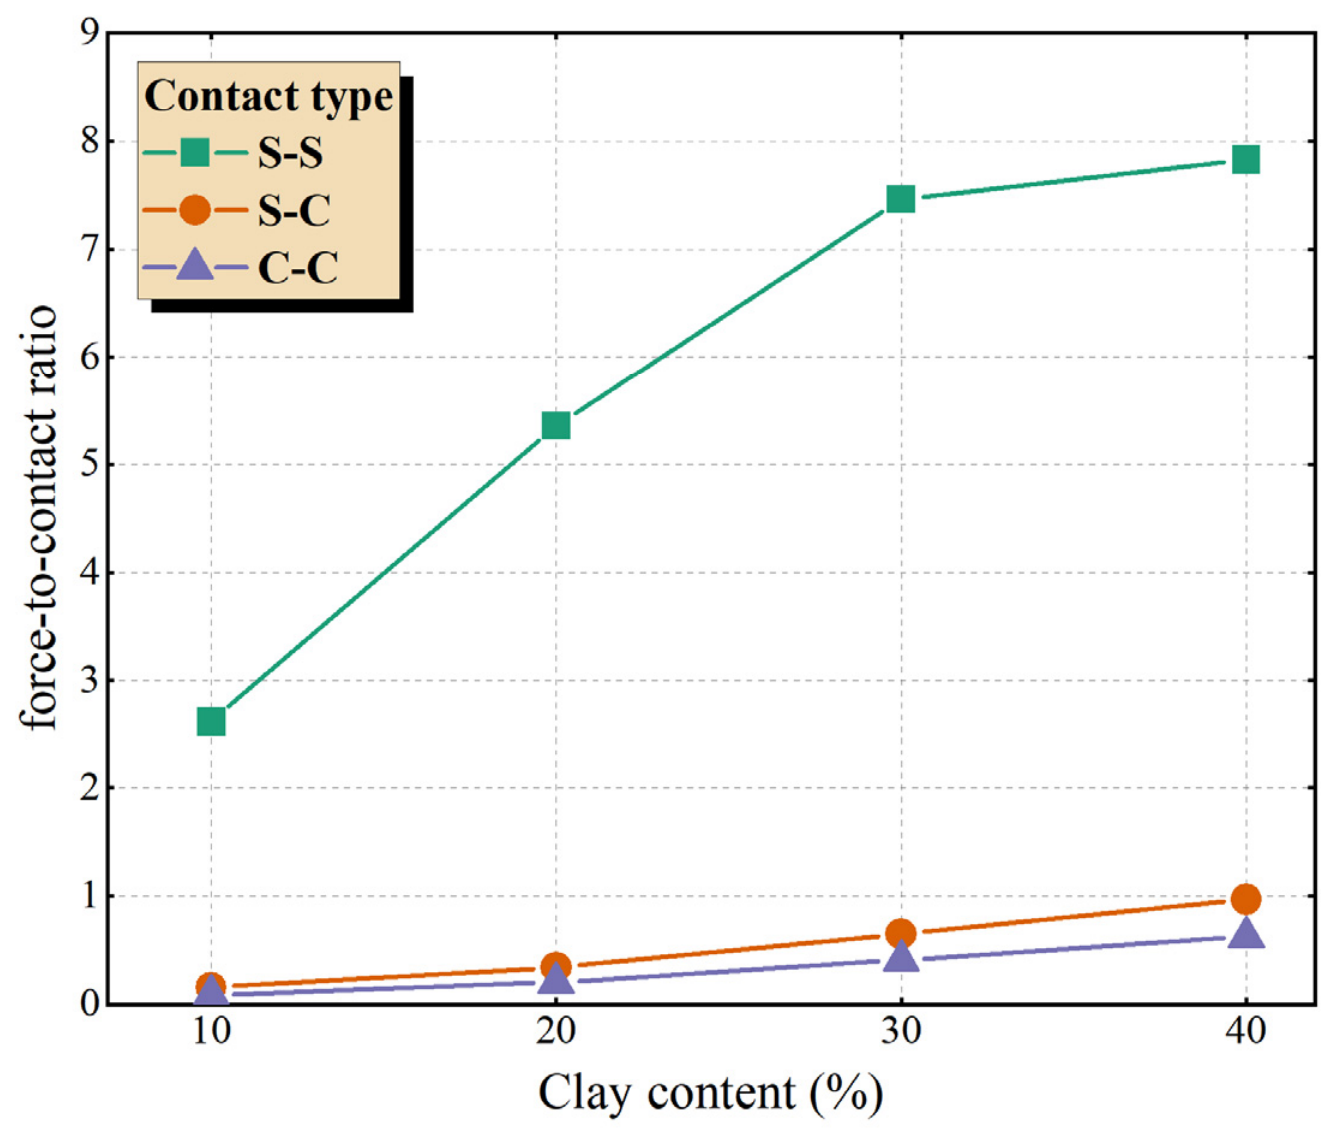
To compare the normal-force contribution of each contact type with its abundance, the force-to-contact ratio (Li) was defined as the ratio of the normal-force proportion to the contact-number proportion for that contact type. Thus, Li represents the mean normal force per contact of a given type relative to the mean over all contacts. A value greater than one indicates a higher-than-average mean normal force per contact. Because this ratio is affected by particle size and contact characteristics, it does not directly quantify mechanical efficiency or the contribution of that contact type to shear resistance.
Figure 12 shows that S–S contacts exhibit higher force-to-contact ratios than S–C and C–C contacts at a shear displacement of 4 mm. At high clay contents, however, S–S contacts represent only a small fraction of the total contacts. The ratio therefore describes the mean normal force of a sparse contact population and should be considered together with the S–S contact proportion and normal-force contribution. It does not, by itself, show that the remaining S–S contacts or the sand skeleton become more mechanically efficient. The increase in total coordination number with clay content reflects the development of additional clay-associated contacts but does not alone establish that the mechanically active load-bearing network has become stronger.
Figure 12.
Force-to-contact ratios of different contact types at a shear displacement of 4 mm for different clay contents.
4.2. Micromechanical Origin of Strength
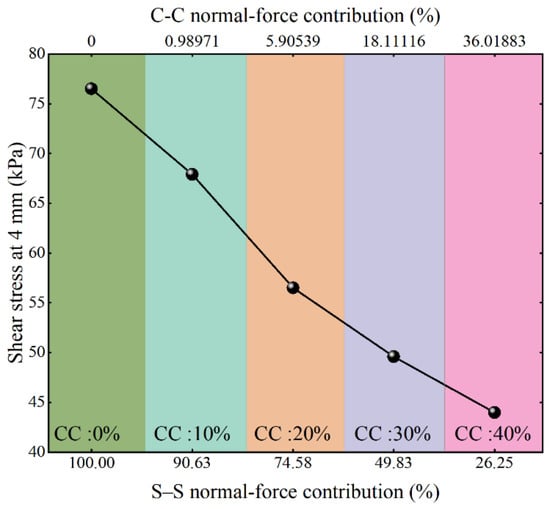
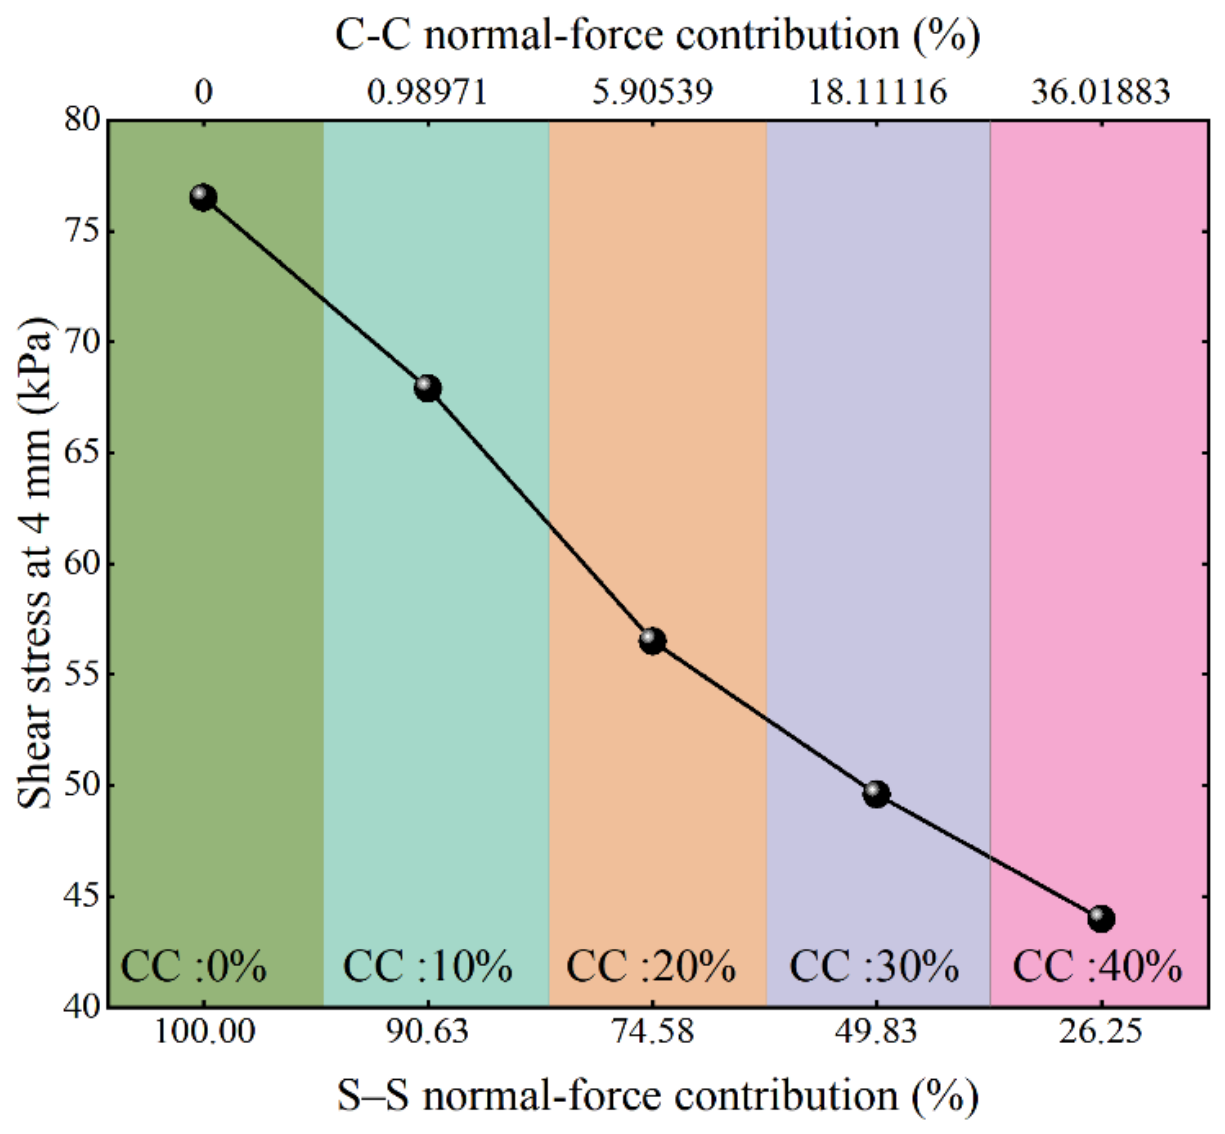
Figure 13 compares the macroscopic shear stress with the normal-force contributions of the different contact types. The observed association between shear stress and the S–S normal-force contribution indicates that changes in force partitioning accompany changes in shear response. The shear stress exhibits a clear positive relationship with the normal-force contribution of S–S contacts, with specimens characterized by a larger S–S force contribution generally exhibiting higher shear resistance. In contrast, increasing clay content progressively transfers the applied load from direct S–S contacts to S–C and C–C contacts, accompanied by a reduction in macroscopic shear strength. This relationship indicates that the shear resistance of the mixtures is governed not simply by the total number of contacts but, more importantly, by the extent to which the load is transmitted through the mechanically efficient S–S network. However, this comparison does not quantify the shear stress carried by each contact type because contact orientation, branch vectors, and tangential forces are not included. The results therefore show a relationship between normal-force partitioning and macroscopic shear response but do not establish the individual contribution of each contact subnetwork to shear resistance.
Figure 13.
Relationship between the normal-force contribution and macroscopic shear stress at a shear displacement of 4 mm.
4.3. Limitations and Implications
Several limitations of the present study should be acknowledged. First, the clay phase was represented by equivalent spherical particles, without explicitly accounting for its complex morphology or physicochemical interactions. Particle sizes were enlarged by approximately 3.73–4.67 times for sand and by at least 63 times for clay relative to its laboratory upper size limit. This unequal scaling changes the sand-to-clay size ratio and may affect packing, contact statistics, and skeleton structure. The inferred micromechanical trends should therefore be interpreted within the adopted numerical size representation.
Second, the microscopic parameters were calibrated against the macroscopic shear response under the investigated conditions, and their applicability to other sand–clay materials requires further validation. The effects of contact-property contrasts and particle arrangement were not separated through control simulations using a common contact law and identical parameters for all contact types. Their individual contributions to force partitioning and shear resistance therefore remain unresolved. Third, only one random packing was simulated for each clay content. The localization patterns and the statistics of sparse S–S contacts at high clay contents may consequently depend on the initial particle arrangement. Finally, only one normal stress and a limited range of clay contents were considered. Future studies will include multiple random realizations, additional stress levels, and more closely spaced clay contents to quantify variability, assess the reproducibility of the observed micromechanical trends, and investigate possible transition thresholds.
Despite these limitations, the results provide a useful micromechanical framework for interpreting the mechanical behavior of sand–clay mixtures. In particular, the distinction between contact abundance and load-bearing importance demonstrates that an increase in coordination number does not necessarily indicate a stronger granular skeleton. Instead, macroscopic shear resistance is closely associated with the connectivity and force-transmission role of direct sand–sand contacts, while increasing clay content progressively promotes a transition toward a clay-involved mixed force-transmission network. Together with the observed evolution of non-affine particle rearrangement and deformation localization, these findings provide a particle-scale basis for interpreting clay-content-dependent strength and deformation and may assist the development of constitutive descriptions that explicitly account for changes in internal contact structure and load-bearing mechanisms.
5. Conclusions
This study combined laboratory monotonic simple shear tests and three-dimensional DEM simulations to investigate the macroscopic response and underlying micromechanical mechanisms of sand–clay mixtures with clay contents ranging from 0% to 40%. Particular attention was given to the evolution of contact structure, force transmission, and non-affine particle rearrangement. The numerical model reasonably reproduced the experimentally observed shear responses and was subsequently used to establish the link between clay-content-induced changes in the internal load-bearing structure and macroscopic behavior. The main conclusions are as follows:
- (1)
- Increasing clay content significantly alters the contact topology of the mixtures. Both the total and sand-particle coordination numbers generally increase with clay content, whereas the proportion of direct S–S contacts decreases markedly and S–C and C–C contacts become increasingly dominant. During shearing, the coordination number tends to decrease at low clay contents but remains stable or increases slightly at higher clay contents, indicating a transition in contact-network evolution from contact loss and rearrangement toward the maintenance of a denser clay-associated contact configuration.
- (2)
- Contact abundance and normal-force contribution vary differently with clay content. At low clay content, S–S contacts carry most of the summed normal contact force. As clay content increases, their proportion decreases, and S–C and C–C contacts carry a larger share of the normal force, although the remaining S–S contacts retain a higher force-to-contact ratio. These numerical observations support qualitative descriptions of sand-dominated, transitional, and clay-involved contact configurations. The three configurations summarize contrasting microscopic states that accompany the variation in macroscopic shear resistance. Identifying transition thresholds requires simulations at more closely spaced clay contents and a quantitative criterion for skeleton connectivity or stress transmission.
- (3)
- The evolution of the load-bearing skeleton provides a micromechanical explanation for the clay-content-dependent shear strength. A clear positive relationship is observed between the S–S normal-force contribution and macroscopic shear stress. The progressive reduction in shear resistance with increasing clay content is therefore associated with the loss of continuous and mechanically efficient S–S force-transmission paths and the transition from a sand-skeleton-dominated structure toward a clay-involved mixed force-transmission network.
- (4)
- Shear deformation is characterized by pronounced spatial localization and stage-dependent particle rearrangement. Large normalized non-affine displacement measures are concentrated primarily in the lower portion of the specimens, demonstrating localized particle rearrangement during simple shear. The most pronounced non-affine deformation and force-network reorganization occur during the early stage of shearing, whereas subsequent deformation develops mainly within the established localized deformation zone. These results highlight the coupled evolution of particle rearrangement and internal force transmission during the development of macroscopic shear deformation.
Author Contributions
Conceptualization, K.L.; methodology, K.L.; software, K.L. and M.Z.; validation, K.L.; formal analysis, K.L.; investigation, A.Z.; resources, K.L.; data curation, K.L.; writing—original draft preparation, K.L.; writing—review and editing, M.Z.; visualization, K.L.; supervision, K.L.; project administration, K.L.; funding acquisition, K.L. and M.Z. All authors have read and agreed to the published version of the manuscript.
Funding
This research was funded by the National Natural Science Foundation of China, grant numbers 42607290 and 42602353.
Data Availability Statement
Data will be made available upon request.
Conflicts of Interest
The authors declare no conflicts of interest.
References
- Yin, K.; Fauchille, A.L.; Vasilescu, A.R.; Dano, C.; Kotronis, P. A review of sand–clay mixture and soil–structure interface direct shear test. Geotechnics 2021, 1, 260–306. [Google Scholar] [CrossRef] [Scilit]
- Yin, K.; Liu, J.; Vasilescu, A.R.; Di Filippo, E.; Othmani, K. A procedure to prepare sand–clay mixture samples for soil–structure interface direct shear tests. Appl. Sci. 2021, 11, 5337. [Google Scholar] [CrossRef] [Scilit]
- Shan, Y.; Cui, J.; Wen, H.; Yu, S.; Li, Y. Analysis of dynamic properties and transitional failure of clay–sand mixture in fine-grained soil based on mineral composition. Eng. Geol. 2022, 296, 106464. [Google Scholar] [CrossRef] [Scilit]
- Lü, X.; Xue, D.; Zhang, B.; Zhong, Q. Experimental studies and constitutive modeling of static liquefaction instability in sand–clay mixtures. Int. J. Geomech. 2022, 22, 04022142. [Google Scholar] [CrossRef] [Scilit]
- Yin, K.; Fauchille, A.L.; Vasilescu, A.R.; Dano, C.; Kotronis, P. Influence of clay fraction on the shear behavior of an interface between sand-clay mixture and concrete. Geomech. Energy Environ. 2024, 38, 100543. [Google Scholar] [CrossRef] [Scilit]
- Tao, Y.; Huang, S. Laboratory investigation of the unsaturated shear strength characteristics of sand–clay mixtures. Adv. Civ. Eng. 2024, 2024, 4757554. [Google Scholar] [CrossRef] [Scilit]
- Cheng, Z.; Wang, J.; Xu, D.S.; Fan, X. DEM study on the micromechanical behaviour of sand-clay mixtures. Powder Technol. 2024, 435, 119400. [Google Scholar] [CrossRef] [Scilit]
- Cheng, Z.; He, P.; Wang, J.; Xu, D.S.; Fan, X. Assessing the shear strength of sand-clay mixtures: A DEM analysis with realistic sand particle shapes. Mar. Georesources Geotechnol. 2025, 43, 2327–2339. [Google Scholar] [CrossRef] [Scilit]
- Liu, X.; Lu, Z.; Zhu, Y.; Le, Q.; Wei, J. Estimation of the shear strength of sand-clay mixtures based on the ANN and low-field NMR. Sci. Rep. 2025, 15, 71. [Google Scholar] [CrossRef] [Scilit] [PubMed]
- Li, T.; Lin, Y.; Zeng, L.; Tang, X.; Yang, G.; Liu, S. Influence of clay content on static shear strength of sand-clay mixture. Soil Dyn. Earthq. Eng. 2026, 200, 109721. [Google Scholar] [CrossRef] [Scilit]
- Shan, Y.; Tan, S.; Cui, J.; Yuan, J.; Li, Y.; Huang, Z. Effect of plastic fine particles on shear strength at the critical state of sand-clay mixture. Can. Geotech. J. 2025, 62. [Google Scholar] [CrossRef] [Scilit]
- Goudarzy, M.; Sarkar, D.; Wichtmann, T. Influence of plastic fines content on the liquefaction susceptibility of sands: Cyclic loading. Acta Geotech. 2022, 17, 4977–4988. [Google Scholar] [CrossRef] [Scilit]
- Tafili, M.; Knittel, L.; Gauger, V. Compression behavior of sand-silt mixtures. Geotechnik 2022, 45, 3–15. [Google Scholar] [CrossRef] [Scilit]
- Barnett, N.; Rahman, M.M.; Karim, M.R.; Nguyen, H.B.K.; Carraro, J.A.H. Equivalent state theory for mixtures of sand with non-plastic fines: A DEM investigation. Géotechnique 2021, 71, 423–440. [Google Scholar] [CrossRef] [Scilit]
- Zuo, K.; Gu, X.; Zhang, J.; Wang, R. Exploring packing density, critical state, and liquefaction resistance of sand-fines mixture using DEM. Comput. Geotech. 2023, 156, 105278. [Google Scholar] [CrossRef] [Scilit]
- Vahidi-Nia, F.; Bayesteh, H.; Khodaparast, M. Effect of particle size ratio and fines content on drained/undrained behavior of binary granular soil according to confining pressure and packing density: A DEM simulation. Comput. Part. Mech. 2024. [Google Scholar] [CrossRef] [Scilit]
- Liao, D.; Wang, H.; Wang, S.; Pan, K. A hypoplastic model for sand-fines mixtures. Comput. Geotech. 2024, 172, 106421. [Google Scholar] [CrossRef] [Scilit]
- Ouici, A.A.; Taiba, A.C.; Mahmoudi, Y.; Belkhatir, M. Influence of fines and gravel particles on strength-dilatancy of river sand: Effect of depositional conditions. Mar. Georesources Geotechnol. 2025, 43, 1388–1402. [Google Scholar] [CrossRef] [Scilit]
- Yao, Y.; Li, J.; Ni, J.; Liang, C.; Zhang, A. Effects of gravel content and shape on shear behaviour of soil-rock mixture: Experiment and DEM modelling. Comput. Geotech. 2022. [Google Scholar] [CrossRef] [Scilit]
- Wang, X.; Huang, B.; Tang, Y.; Hu, T.; Ling, D. Microscopic mechanism and analytical modeling of seepage-induced erosion in bimodal soils. Comput. Geotech. 2022, 141, 104527. [Google Scholar] [CrossRef] [Scilit]
- Xiong, H.; Zhang, Z.; Sun, X.; Yin, Z.Y.; Chen, X. Clogging effect of fines in seepage erosion by using CFD–DEM. Comput. Geotech. 2022, 152, 105013. [Google Scholar] [CrossRef] [Scilit]
- Ren, J.; Liu, Y.; Yu, P.; Zhang, Y.; Li, D. The influence of fines content on ground collapse due to internal erosion of sand-fines mixtures around defective pipes. Eng. Fail. Anal. 2024, 165, 108810. [Google Scholar] [CrossRef] [Scilit]
- Wu, K.; Lv, B.; Baoyin, H.; Li, D.; Yan, Z.; Yu, P.; Liu, Y. Experimental and DEM study on the mechanical behaviors of sand–fines mixtures with different fines contents and particle size ratios. Materials 2025, 18, 4929. [Google Scholar] [CrossRef] [Scilit] [PubMed]
- Sun, Z.C.; Chu, J.; Xiao, Y. Formulation and implementation of an elastoplastic constitutive model for sand-fines mixtures. Int. J. Numer. Anal. Methods Geomech. 2021, 45, 2682–2708. [Google Scholar] [CrossRef] [Scilit]
- Ghafarian, S.D.; Imam, R.; Zarei, M. Modeling the behavior of sand-fines mixtures using a critical state model. Soil Dyn. Earthq. Eng. 2020, 139, 106271. [Google Scholar] [CrossRef] [Scilit]
- Goudarzy, M.; Sarkar, D.; Lieske, W.; Wichtmann, T. Influence of plastic fines content on the liquefaction susceptibility of sands: Monotonic loading. Acta Geotech. 2022, 17, 1719–1737. [Google Scholar] [CrossRef] [Scilit]
- Krim, A.; Arab, A.; Chemam, M.; Brahim, A.; Sadek, M.; Shahrour, I. Experimental study on the liquefaction resistance of sand–clay mixtures: Effect of clay content and grading characteristics. Mar. Georesources Geotechnol. 2019, 37, 129–141. [Google Scholar] [CrossRef] [Scilit]
- Mohammadi, V.; Bahadori, H. Effects of low clay content on the anisotropic behavior of sand-clay mixtures: Laboratory investigation using TSHCA. Rev. Constr. 2024, 23, 317–334. [Google Scholar] [CrossRef] [Scilit]
- Reddy, N.S.C.; He, H.; Senetakis, K. DEM analysis of small and small-to-medium strain shear modulus of sands. Comput. Geotech. 2022, 141, 104518. [Google Scholar] [CrossRef] [Scilit]
- Gong, J.; Nie, Z.; Zhu, Y.; Liang, Z.; Wang, X. Exploring the effects of particle shape and content of fines on the shear behavior of sand-fines mixtures via the DEM. Comput. Geotech. 2019, 106, 161–176. [Google Scholar] [CrossRef] [Scilit]
- Zhu, Y.; Nie, Z.; Gong, J.; Zou, J.; Zhao, L.; Li, L. An analysis of the effects of the size ratio and fines content on the shear behaviors of binary mixtures using DEM. Comput. Geotech. 2020, 118, 103353. [Google Scholar] [CrossRef] [Scilit]
- Zhou, W.; Wu, W.; Ma, G.; Ng, T.T.; Chang, X. Undrained behavior of binary granular mixtures with different fines contents. Powder Technol. 2018, 340, 139–153. [Google Scholar] [CrossRef] [Scilit]
- Rahman, M.M.; Lo, S.R.; Baki, M.A.L. Equivalent granular state parameter and undrained behaviour of sand–fines mixtures. Acta Geotech. 2011, 6, 183–194. [Google Scholar] [CrossRef] [Scilit]
- Chang, C.S.; Yin, Z.Y. Micromechanical modeling for behavior of silty sand with influence of fine content. Int. J. Solids Struct. 2011, 48, 2655–2667. [Google Scholar] [CrossRef] [Scilit]
- Vallejo, L.E.; Mawby, R. Porosity influence on the shear strength of granular material–clay mixtures. Eng. Geol. 2000, 58, 125–136. [Google Scholar] [CrossRef] [Scilit]
- Cundall, P.A.; Strack, O.D.L. A discrete numerical model for granular assemblies. Géotechnique 1979, 29, 47–65. [Google Scholar] [CrossRef] [Scilit]
- GDR MiDi. On dense granular flows. Eur. Phys. J. E 2004, 14, 341–365. [Google Scholar] [CrossRef] [Scilit] [PubMed]
- Da Cruz, F.; Emam, S.; Prochnow, M.; Roux, J.-N.; Chevoir, F. Rheophysics of dense granular materials: Discrete simulation of plane shear flows. Phys. Rev. E 2005, 72, 021309. [Google Scholar] [CrossRef] [Scilit] [PubMed]
- Cheng, Z.; Wang, J. Experimental investigation of inter-particle contact evolution of sheared granular materials using X-ray micro-tomography. Soils Found. 2018, 58, 1492–1510. [Google Scholar] [CrossRef] [Scilit]
- Cheng, Z.; Wang, J.; Xiong, W. A machine learning-based strategy for experimentally estimating force chains of granular materials using X-ray micro-tomography. Géotechnique 2024, 74, 1291–1303. [Google Scholar] [CrossRef] [Scilit]
- Falk, M.L.; Langer, J.S. Dynamics of viscoplastic deformation in amorphous solids. Phys. Rev. E 1998, 57, 7192–7205. [Google Scholar] [CrossRef] [Scilit]





Disclaimer/Publisher’s Note: The statements, opinions and data contained in all publications are solely those of the individual author(s) and contributor(s) and not of MDPI and/or the editor(s). MDPI and/or the editor(s) disclaim responsibility for any injury to people or property resulting from any ideas, methods, instructions or products referred to in the content. |
© 2026 by the authors. Licensee MDPI, Basel, Switzerland. This article is an open access article distributed under the terms and conditions of the Creative Commons Attribution (CC BY) license.