


Simple Summary
Animals that cannot produce their own body heat must carefully regulate body temperature to survive. Snakes face particular constraints because their elongate, limbless bodies specifically influence rates of heat exchange with the environment. We investigated which environmental and biological factors influence body temperature in nose-horned vipers across three populations inhabiting distinct habitats. We investigated field body temperatures alongside 12 environmental, morphological, behavioral, and physiological variables. We found that air temperature at 5 cm above the snake’s position, humidity, and wind affected body temperatures in all populations. In contrast, microhabitat use and the time when each individual was found exerted population-specific effects on body temperature. Despite these differences, mean body temperatures were similar across populations and sexes. This demonstrates that vipers achieve similar thermal outcomes through population-specific regulatory pathways. These findings underscore the importance of maintaining structurally diverse habitats that enable behavioral thermoregulation under changing environmental conditions. Preserving such habitats is essential for the species’ long-term persistence.
Abstract
Body temperature regulation in ectotherms is influenced by numerous environmental, morphological, and physiological factors, some of which operate in population-specific ways. Understanding how these factors shape thermal biology is important for species conservation. The nose-horned viper, an ecologically significant yet understudied mesopredator of southeastern Europe and Asia Minor, occupies diverse ecosystems facing ongoing degradation. Over five years, we investigated how 12 environmental, behavioral, morphological, and physiological variables influenced field body temperature across three climatically distinct populations of nose-horned vipers. Using an information-theoretic approach with model averaging, we identified important predictors and assessed population-specific effects. Air temperature at 5 cm above the snake’s position, humidity, and wind were highly important predictors across all populations, whereas physiological states (shedding and digestion) exerted weaker effects. Microhabitat type and time of day emerged as highly important population-specific predictors, while body size showed weaker, population-dependent effects. Neither sex, cloud cover, nor behavioral state contributed meaningfully to model fit. Mean body temperatures were similar across populations and sexes. By integrating environmental, behavioral, physiological, and morphological variables, this study comprehensively identifies predictors of body temperature in nose-horned vipers. Site-tailored maintenance of structurally diverse habitats is essential for preserving thermoregulatory opportunities and ensuring long-term persistence of nose-horned vipers.
1. Introduction
Thermoregulation, the capacity of an organism to influence its body temperature, is fundamental to survival and physiological performance in many organisms [1,2,3]. In ectotherms, thermoregulation is governed by interacting internal (physiological, morphological) and external (environmental) factors. Because ectotherms cannot generate sufficient metabolic heat to maintain body temperature independently, they rely primarily on external heat sources [3,4]. Therefore, alterations in the thermal environment present substantial physiological and ecological challenges for ectotherms [5]. This is particularly true for terrestrial ectotherms in temperate zones, where pronounced diel and seasonal temperature fluctuations exist. These fluctuations pose a challenge for individuals to maintain body temperatures (Tb) within ranges that support survival and optimal performance [3,6].
Among ectotherms, reptiles are particularly well-studied models for thermoregulatory research [7,8,9,10,11]. Recent studies have increasingly addressed how climate change affects reptilian thermoregulation, emphasizing species-specific adaptability and vulnerability to thermal stress [12,13,14]. Reptilian thermoregulation can be influenced by numerous interacting factors, including morphometry, physiology, behavior, and environmental conditions, which essentially act as predictors of Tb. For instance, thermoregulatory patterns may differ between juveniles and adults, shift with feeding status, are affected by gravidity, and involve behavioral modifications mediated by habitat quality [7,8,15,16,17]. Indeed, behavioral thermoregulation is the primary mechanism by which reptiles regulate Tb. For example, for warming up, a reptile usually moves to a suitable basking spot, whereas for cooling off, it retreats into the shade. Additionally, reptiles modulate solar heat gain by adjusting body orientation relative to the sun [8]. Behavioral thermoregulation is now recognized not as a set of isolated actions but as an integrated response reflecting thermal tolerances and physiological constraints modulated at the individual level. Despite complex, context-dependent variation in individual measurements, mean Tb often remains consistent across populations within a species [18,19,20]. Identifying Tb predictors thus provides a framework for interpreting population-level thermal variation and assessing vulnerability to climate warming.
The elongate, limbless body plan of snakes poses distinct thermoregulatory challenges, including high surface-area-to-volume ratios and direct contact with substrate, both accelerating heat exchange [21]. Moreover, snakes have historically received less research attention than lizards in thermoregulation studies [21]. Comparative studies indicate that behavioral thermal responses vary little among viper species, suggesting that conserved thermal tolerances constrain realized niches and geographic distributions [22,23]. At the same time, studies of South American and African vipers show that local conditions—particularly ambient temperature and habitat structure—strongly modulate behavioral responses, underscoring the importance of context-dependent adjustment over fixed strategies [23,24].
The nose-horned viper, Vipera ammodytes (Linnaeus, 1758), represents an excellent model species for further examination of these dynamics. Its broad climatic and habitat distribution, combined with strong reliance on microhabitat use, makes it well-suited for testing how field Tb is influenced by various internal and external predictors. Vipera ammodytes (Viperidae) is a venomous snake distributed from northeastern Italy and southern Austria across the Balkans to the Caucasus [25,26,27,28]. As a mesopredator, V. ammodytes plays a crucial role in ecosystem function, notably by regulating populations of small mammals, its primary prey across much of its range (e.g., [27,29,30,31]). Its broad distribution and ecological adaptability make understanding its thermoregulatory strategies particularly important for predicting thermoregulatory responses to environmental change and for informing effective conservation planning [8,32].
Research on environmental determinants of Tb in V. ammodytes remains limited, with two recent papers focusing only on the northeastern (NE) clade [20,33]. Čubrić and Crnobrnja-Isailović [33] found a significant correlation between Tb and environmental temperatures, but detected no differences among locations or between sexes. Dyugmedzhiev et al. [20] showed that V. ammodytes in the northeastern Balkans achieves thermoregulation through behavioral adjustments in microhabitat use and activity timing, yet no taxonomic, physiological, age-related, or sex-specific differences in field Tb were detected. Indeed, populations of the same species do not always respond uniformly to environmental conditions [13,34,35,36], and similar thermal outcomes can arise from different predictor combinations. How field Tb is shaped across geographically distinct populations of other V. ammodytes clades remains poorly understood.
This study examined how external (environmental) and internal (morphological, behavioral, and physiological) factors influence field Tb of both active and inactive snakes in three populations of this species’ NW clade inhabiting contrasting climatic and vegetation zones. We hypothesized that abiotic, morphological, sex-specific, and physiological characteristics would act as consistent Tb predictors across populations, whereas behavioral mechanisms (including microhabitat and time of day) would function as population-specific buffers compensating for local environmental differences. Consequently, we predicted that these distinct regulatory pathways would ultimately converge, resulting in a conserved mean Tb across populations and sexes.
2. Materials and Methods
2.1. Focal Species
Vipera ammodytes is among the largest European vipers (Figure 1). Mean total length is approximately 65 cm; females average larger body sizes, though males attain greater maximum lengths [28,31]. Its elevational range spans from sea level to over 2000 m. It occupies diverse habitats, predominantly warm, dry areas such as rocky slopes, stone walls, and vegetated outcrops, but also cooler, more humid sites including open forests and montane grasslands [25,26,27,28]. The species is primarily diurnal but exhibits crepuscular and nocturnal activity when conditions allow [28,37]. Activity declines during midday, particularly in summer [31]. Females prefer slightly higher humidity than males [31]. The species avoids windy conditions (particularly wind speeds > 2 m/s) and cloud cover exceeding 60% [31]. Subspecific taxonomy has varied, with three to seven subspecies recognized in southeastern Europe [38,39]; the nominate subspecies, belonging to the northwestern (NW) clade, occurs in Croatia [19,40,41].
Figure 1.
Photographs showing characteristic nose-horned viper (Vipera ammodytes) individuals from the three biogeographical regions of Croatia: (a) male from Bizek (Medvednica Mt.), (b) male from Lika (Malo Kamensko), (c) male from Vir Island, (d) female from Bizek (Medvednica Mt.), (e) female from Lika (Malo Kamensko), (f) female from Vir Island. All photos by Mladen Zadravec.
2.2. Study Sites
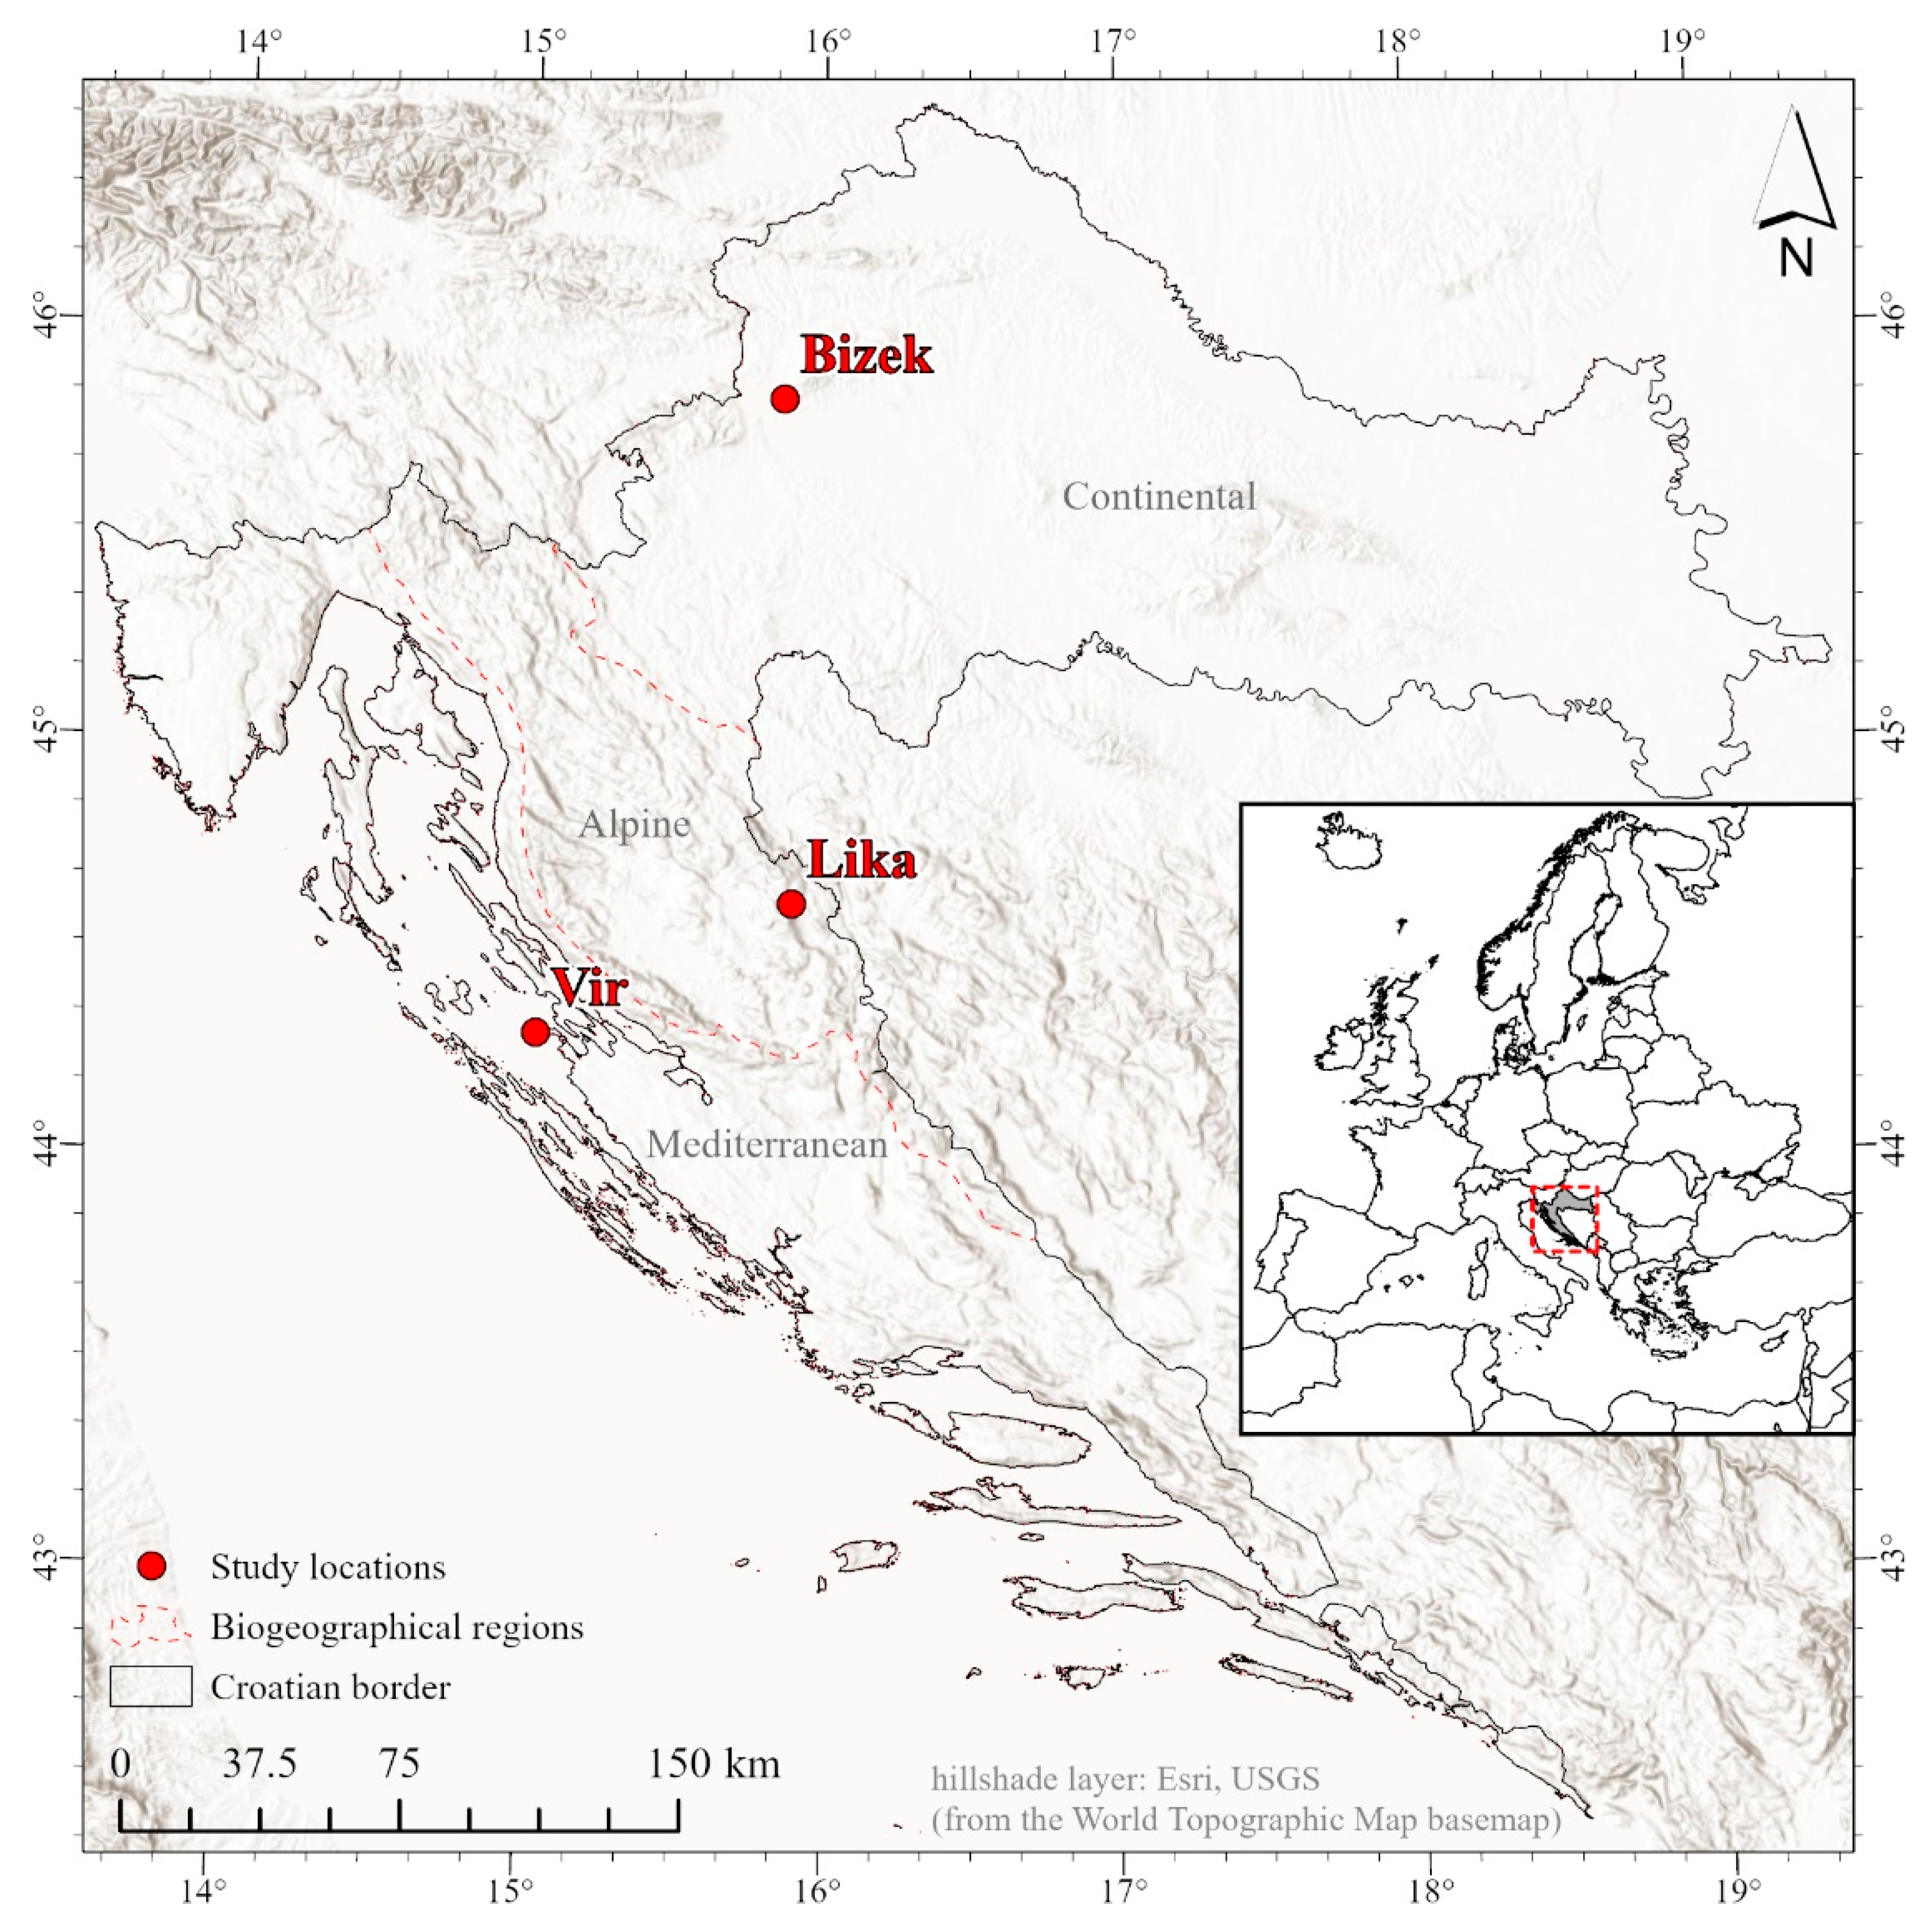
The study was conducted at three sites. All coordinates are in WGS 1984 (EPSG:4326); elevations are in meters above sea level (m a.s.l.): Bizek quarry on Medvednica Mt. (hereafter “Bizek”, N: 45.838997°, E: 15.858436° ≈ 250–370 m a.s.l.), Malo Kamensko in Lika (hereafter “Lika”, N: 44.619048°, E: 15.894599° ≈ 980–1050 m a.s.l.), and Vir Island (hereafter “Vir”, N: 44.301197°, E: 15.034497° ≈ 1–40 m a.s.l.). These sites were selected to span the geographic range of the NW clade in Croatia [40] and to represent distinct climatic and vegetation zones (Figure 2 and Figure 3).
Figure 2.
Photographs showcasing the three study sites: (a) Bizek (Medvednica Mt.), (b) Lika (Malo Kamensko), and (c) Vir Island. All photos by Mladen Zadravec.
The Bizek site is situated in the Continental biogeographical region, at the very edge of Croatia’s capital city, Zagreb, and is characterized by a temperate continental climate with pronounced seasonal variation. Following the cessation of mining, this abandoned quarry has undergone secondary succession by mixed deciduous trees (Fagus sylvatica, Quercus pubescens, Fraxinus sp., Populus sp., Salix sp., etc.), and thermophilic shrubs like Cronus sanguinea, Rubus sp., and Crataegus sp. It is the most closed of the three study sites. No livestock grazing or management is present.
The Lika site is situated in the Alpine biogeographical region and is characterized by cooler conditions associated with higher elevation and Alpine influence. It is a part of the Veliko and Malo Kamensko grasslands; therefore, it is the most open of the three sites. Small-to-medium-sized rock piles are localized, usually in combination with shrubbery, while more extensive rock formations are scarce. Perennial grazing by cattle and occasional mowing are both present (Ml. Zadravec, pers. obs. 2017–2021).
The Vir site is situated in the Mediterranean biogeographical region, on the southwestern side of Vir Island. The climate is characterized as moderately warm and humid, with a pronounced dry period during the warmest months [42]. The site itself is mostly a former grassland overgrown with maquis and garrigue, intersected by several dry-stone walls. The western and southwestern parts of the site are covered with a forest, consisting mostly of Quercus ilex and Pinus sp. More open spaces are still present in parts, but are becoming increasingly rare due to vegetation succession. In terms of habitat openness, it is between the two other sites. There is no livestock grazing nor mowing at the site.
Figure 3.
Map of Croatia with the locations where the research took place. Created in ArcGIS Pro (v. 3.5.4, Esri). The biogeographical regions layer according to the EEA [43]. Inset: position of Croatia in the Euro-Mediterranean area, with the extent of the main map indicated with the red dashed square.
2.3. Data Gathering
We followed the methods described by Zadravec [31] and Zadravec et al. [44]. Field surveys were conducted between 7:30 and 20:00 h, with additional surveys taking place until 23:00 h to assess nocturnal activity. All times are reported in Central European Summer Time (UTC + 2). Active or hidden snakes were captured by hand using welding gloves THT1 TER25010 (Delta Plus, Domus Sesvete d.o.o., Zagreb, Croatia) from May to September 2017–2021.
Within two minutes of capture, Tb of each viper was measured in shade by gently inserting the tip of a temperature probe 52226 Dual Temp Infrared Probe Thermometer (Mastercool, Con-testor, Zagreb, Croatia) into the cloacal opening. Each snake was then placed in an individually numbered cloth bag for subsequent data gathering. Concurrently, eight environmental parameters were measured and recorded: substrate temperature (TS), air temperature at 5 cm (TA5) above the snake’s position, air temperature at 60 cm (TA60), relative humidity, atmospheric pressure, cloud cover, wind speed, and microhabitat. Additional data recorded at capture included time of day, behavior, and GPS coordinates with elevation (Garmin eTrex 30x). Each capture location was marked with a uniquely numbered colored cloth ribbon. Between search intervals, snout–vent length (SVL) was measured, and sex was determined. Stomach contents were assessed by gentle palpation of the ventral surface to detect the presence or absence of palpable prey items (hereafter: food in stomach) [45,46,47]. Pre-ecdysis condition (opaque skin) was also recorded (see Table A1 in Appendix A for details). For reliable individual identification, the posterior margins of ventral scales were clipped [31,48]. As supplementary identification, standardized photographs (Canon PowerShot SX70HS, Canosa, Zagreb, Croatia) were obtained for each individual. Photographs documented the head (dorsal, ventral, anterior, and lateral views), dorsal pattern, and clipped scale markings.
2.4. Statistical Analysis
Statistical analyses were conducted in RStudio (v. 2023.06.0, Posit software) using R (v.4.4.2) [49,50], with packages MuMIn [51], dplyr [52], and car [53]. All plots were generated using the ggplot2 package [54]. Individuals that had not yet undergone their first hibernation were excluded from all analyses. Vipera ammodytes exhibits a berus-type spermatogenesis cycle, with mating restricted to spring and parturition occurring the subsequent autumn. Consequently, any snakes encountered in early spring were considered post-hibernation and included in the analyses. We excluded gravid animals from datasets, since only seven gravid females were caught during the study (two at Bizek, five at Lika, none at Vir). Substrate (TS), air temperature at 5 cm (TA5), and at 60 cm (TA60) were strongly correlated (Figure A1). Performed variance inflation factors with TA60 reached 5.62, which exceeds standard thresholds; therefore, we excluded TA60. Preliminary full model analysis with both TS and TA5 gives the same model output as the model presented in this manuscript, but the preliminary full model with TS included pushes the n/k ratio down to 3.1, which is well below what’s recommended for stable parameter estimation, and the added complexity buys us no new insight. Since TA5 had the larger effect in preliminary full model analysis (4.82 °C per 2SD vs 1.68 °C per 2SD for TS), we retained only TA5 as it captures the dominant thermal signal. Following data screening, we standardized continuous predictors and identified influential observations to ensure model stability. Prior to modeling, we calculated descriptive statistics (mean ± SD, range) for Tb and continuous predictors, stratified by categorical variables (location, sex, opaque, food in stomach). Descriptive summaries verified data quality and aided interpretation of model-averaged estimates, which are expressed relative to reference levels for categorical variables.
Prior to analysis, we identified influential observations using Cook’s distance with a threshold of 4/n, removing seven observations that disproportionately affected model estimates: four from Vir, two from Bizek, and one from Lika. Continuous variables were standardized by centering on the mean and dividing by two standard deviations, following Gelman [55]. This standardization places regression coefficients for continuous predictors on a comparable scale with coefficients for binary predictors, facilitating interpretation of relative effect sizes. Categorical variables (location, microhabitat, sex, behavior, opaque, and food in stomach) were retained on their original scales.
We used an information-theoretic approach with model averaging [56,57] to identify variables influencing Tb. This approach was chosen because multiple biologically plausible models exist for explaining thermoregulatory variation, and model averaging provides parameter estimates that account for model selection uncertainty.
The global linear model includes all measured biologically relevant predictors as main effects: location, air temperature at 5 cm above the snake’s location (TA5), relative humidity, wind speed, microhabitat type, time of day, snout–vent length (SVL), sex, behavioral state, pre-ecdysis condition (opaque), and presence of food in the stomach. We also included two-way interactions between location and all other predictors to test for location-specific effects.
All possible submodels were generated from this global model using the dredge function in the MuMIn package [51]. Models were ranked using the Akaike Information Criterion corrected for small sample size (AICc). We defined the top model set as all models with ΔAICc < 2, as models within this range have substantial empirical support. Relative variable importance was calculated as the sum of Akaike weights across all models in the top set containing each variable, providing a measure of how consistently each predictor improved model fit [56].
Model adequacy was assessed using residuals calculated from model-averaged predictions. We evaluated normality of residuals using Shapiro–Wilk tests and visual inspection of Q-Q plots, recognizing that formal tests are overly sensitive with moderate sample sizes. Homoscedasticity was assessed by examining residuals versus fitted values plots and testing the correlation between absolute residuals and fitted values. Multicollinearity among predictors was evaluated using variance inflation factors (VIF) calculated from a main-effects-only model to avoid artificial inflation from interaction terms; all VIF values were below 5, indicating no problematic collinearity. Model fit was quantified using the coefficient of determination (R2) calculated from model-averaged predictions and root mean square error (RMSE).
Parameter estimates were obtained by averaging across the top model set using the natural averaging method, whereby parameters are averaged only over models in which they appear [56,57]. Natural averaging was preferred because our primary interest was in estimating effect sizes conditional on predictor inclusion. Unconditional standard errors were calculated to incorporate both sampling variance and model selection uncertainty.
We assessed the robustness of our model-averaged inferences using sensitivity analyses with three model selection criteria: (1) models within ΔAICc < 2, (2) ΔAICc < 4, and (3) cumulative Akaike weight ≥ 95%. Model-averaged parameter estimates, relative variable importance, and predictions were compared across these three sets to verify that inferences were not sensitive to the choice of selection threshold. Based on ΔAICc < 2, we operationally classified predictors with relative importance 0.75–1.00 as highly important, 0.50–0.74 as moderately important, and 0.25–0.49 as weakly important. These categories are intended as interpretive aids rather than formal statistical thresholds; the limitations of interpreting summed Akaike weights as measures of variable importance have been discussed elsewhere [58]. Predictors with a relative importance score of less than 0.25 were discarded from further analyses. For methodology on model diagnostics, see Appendix B and Figure A3, Figure A4 and Figure A5.
To facilitate interpretation of interaction terms, we calculated post hoc contrasts using model-averaged estimates. Within-location contrasts compared variable levels (e.g., microhabitat types) at the same location, while between-location contrasts compared locations within the same variable level. For continuous predictors involved in interactions with location, we calculated location-specific slopes and pairwise differences between locations. Standard errors for all contrasts were calculated using the delta method with the full variance–covariance matrix from the averaged model, properly accounting for parameter covariance. Statistical support for effects was assessed by examining whether 95% confidence intervals (estimate ± 1.96 × unconditional SE) excluded zero. We emphasize effect estimation and evidence weights rather than null hypothesis significance testing, though we note when 95% CIs exclude zero as indicating non-zero effects reliably.
Relative variable importance and confidence intervals address different questions. Relative variable importance reflects how consistently a variable improves model fit across the candidate set, while the confidence interval reflects the precision of the estimated effect. A variable may be consistently retained in top models yet have a wide confidence interval when sample sizes for particular categories are small.
We assessed population-dependent effects in two steps. First, we used relative variable importance to evaluate whether each interaction term was consistently retained in well-supported models. Second, for interactions with adequate support, we used model-averaged pairwise contrasts to describe the direction and magnitude of location-specific effects. This two-step approach is necessary because the information-theoretic framework does not provide a single omnibus test for complex categorical interactions. For guidance on interpreting standardized effect sizes, interaction terms, and relative variable importance, see Appendix C.1.
In addition, we used ANOVA (aov function, stats package [50]), to test for differences in Tb among locations and between sexes, including their interaction.
3. Results
We captured 135 unique V. ammodytes individuals over five years. After excluding records with missing data, gravid females, and recaptures, the final dataset comprised 128 individuals.
Of the 12 investigated variables, model averaging identified nine supported predictors of Tb, including three location interactions (Figure 4). Relative humidity, TA5, wind speed, opaque condition, and food in the stomach acted independently of location, whereas microhabitat, time of day, and SVL showed location-dependent effects. Relative humidity, TA5, and wind speed were highly important (relative variable importance = 1 for all three predictors), while opaque condition was moderately important (0.65), and food in stomach was weakly important (0.34). Among interaction terms, location × microhabitat and location × time of day were highly important (relative variable importance = 1 for both interactions), indicating that these location-dependent effects were consistently present in the top model set. Location × SVL received weaker importance (0.41). These values, reported also in Figure A3, are included here to clarify the model-level evidence before presenting pairwise contrasts. For descriptive datasets, see Figure A2, and Table A2 and Table A3.
Figure 4.
Relative importance of predictors influencing body temperature (Tb) of Vipera ammodytes, including interactions, for models within ΔAICc < 2. TA5—air temperature at 5 cm above capture location; SVL—snout-to-vent length; Food—presence of food in stomach. Relative variable importance thresholds: 0.75–1.00: highly important, 0.50–0.74: moderately important, 0.25–0.49: weakly important.
Individuals found at higher relative humidity had lower Tb. In contrast, higher TA5 was associated with higher Tb, while wind speed showed a slight positive association with Tb (Figure A6). Although all three environmental predictors were retained with high consistency across the top model set, their effect sizes differed considerably. TA5 had the largest effect (≈6.5 °C per 2SD), while relative humidity and wind speed (≈1 °C per 2SD) had much smaller effects (Figure 5). A high variable importance means the variable consistently contributes to model fit; it does not necessarily mean the variable has a large biological effect.
Figure 5.
Model-averaged effects of air temperature at 5 cm (TA5), relative humidity, and wind speed on field body temperature (Tb) in Vipera ammodytes. Effect sizes represent the change in field body temperature (°C) associated with a two-standard-deviation increase in each predictor variable. This standardization permits direct comparison of effect magnitudes across predictors measured on different scales. Total sample size is indicated in parentheses following each variable name. Points represent model-averaged estimates from the top model set (ΔAICc < 2), with error bars indicating 95% confidence intervals calculated using unconditional standard errors. Green points and error bars denote effects where the 95% CI excludes zero, indicating a statistically supported effect.
The influence of physiological states (the opaque condition and presence of food in the stomach) on Tb did not vary among locations. Although the opaque condition was moderately important and the presence of food in the stomach was weakly important across all model sets (Figure A3), 95% CIs included zero, indicating an insubstantial biological effect for both conditions. (Figure 6 and Figure A7).
Figure 6.
Model-averaged effects of pre-ecdysis condition (opaque) and recent feeding (food in stomach) on field body temperature (Tb) in Vipera ammodytes. Effect sizes represent the difference in body temperature (°C) between individuals with and without each condition (i.e., the effect of ‘Yes’ relative to ‘No’). Sample sizes for each category are indicated in parentheses. Points represent model-averaged estimates from the top model set (ΔAICc < 2), with error bars indicating 95% confidence intervals. Red points and error bars denote effects where the 95% CI includes zero and indicate effects not statistically supported. Positive values indicate that individuals with the condition (opaque or food in the stomach) exhibited higher body temperatures than those without.
The influence of microhabitat on Tb varied among locations and was highly important across all models (Figure A3). At Bizek, Tb in closed microhabitats exceeded that in semi-open and open microhabitats. In contrast, at Lika, Tb in closed microhabitats was lower than in semi-open and open microhabitats. At Vir, Tb in semi-open microhabitats exceeded that in open microhabitats (Figure 7a and Figure A8a). Between-location comparisons indicated that Tb within the same microhabitat type varied among sites. Within closed microhabitats, Tb at Lika was lower than at Bizek and Vir. In semi-open microhabitats, Tb at Vir exceeded that at Bizek (Figure 7b and Figure A8b).
Figure 7.
Model-averaged contrasts for field body temperature (Tb) across locations and microhabitat types in Vipera ammodytes: (a) within-location microhabitat contrasts showing pairwise differences in Tb between microhabitat types within each study location. Each facet represents a single location, with sample size indicated in parentheses; (b) between-location contrasts showing pairwise differences in Tb among sites within each microhabitat type. Each facet represents a single microhabitat category, with sample size indicated in parentheses. In (a,b), contrast labels indicate the comparison (e.g., ‘Vir (n) − Bizek (n)’), where positive values indicate higher Tb at the first location/microhabitat type. Points represent model-averaged estimates from the top model set (ΔAICc < 2), and error bars indicate 95% confidence intervals calculated using unconditional standard errors. Green points and error bars indicate contrasts where the 95% CI excludes zero (statistically supported differences); red points and error bars indicate contrasts where the 95% CI includes zero (statistically unsupported differences).
Time of day was a highly important predictor, with location-dependent effects (Figure A3). At Bizek, Tb increased throughout the day, whereas at Lika, Tb decreased (Figure 8a and Figure A9). The temporal slope at Lika was lower than that at Bizek and Vir (Figure 8b).
Figure 8.
Location-specific effects of time of day on field body temperature (Tb) in Vipera ammodytes: (a) model-averaged slopes describing the relationship between time of day and Tb at each site. Positive slopes indicate that the field body temperature increases throughout the day; negative slopes indicate decreasing Tb. Slope magnitudes are expressed as a change in Tb (°C) per two standard deviations of time of day. Sample sizes for each location are indicated in parentheses. (b) Pairwise differences in time-of-day slopes between locations. Positive values indicate that the first location in each comparison exhibits a steeper (more positive) temporal slope than the second location. Contrast labels include sample sizes for each location. Points represent model-averaged estimates from the top model set (ΔAICc < 2), with error bars indicating 95% confidence intervals. Green points and error bars denote statistically supported effects (95% CI excludes zero); red points and error bars indicate effects not statistically supported.
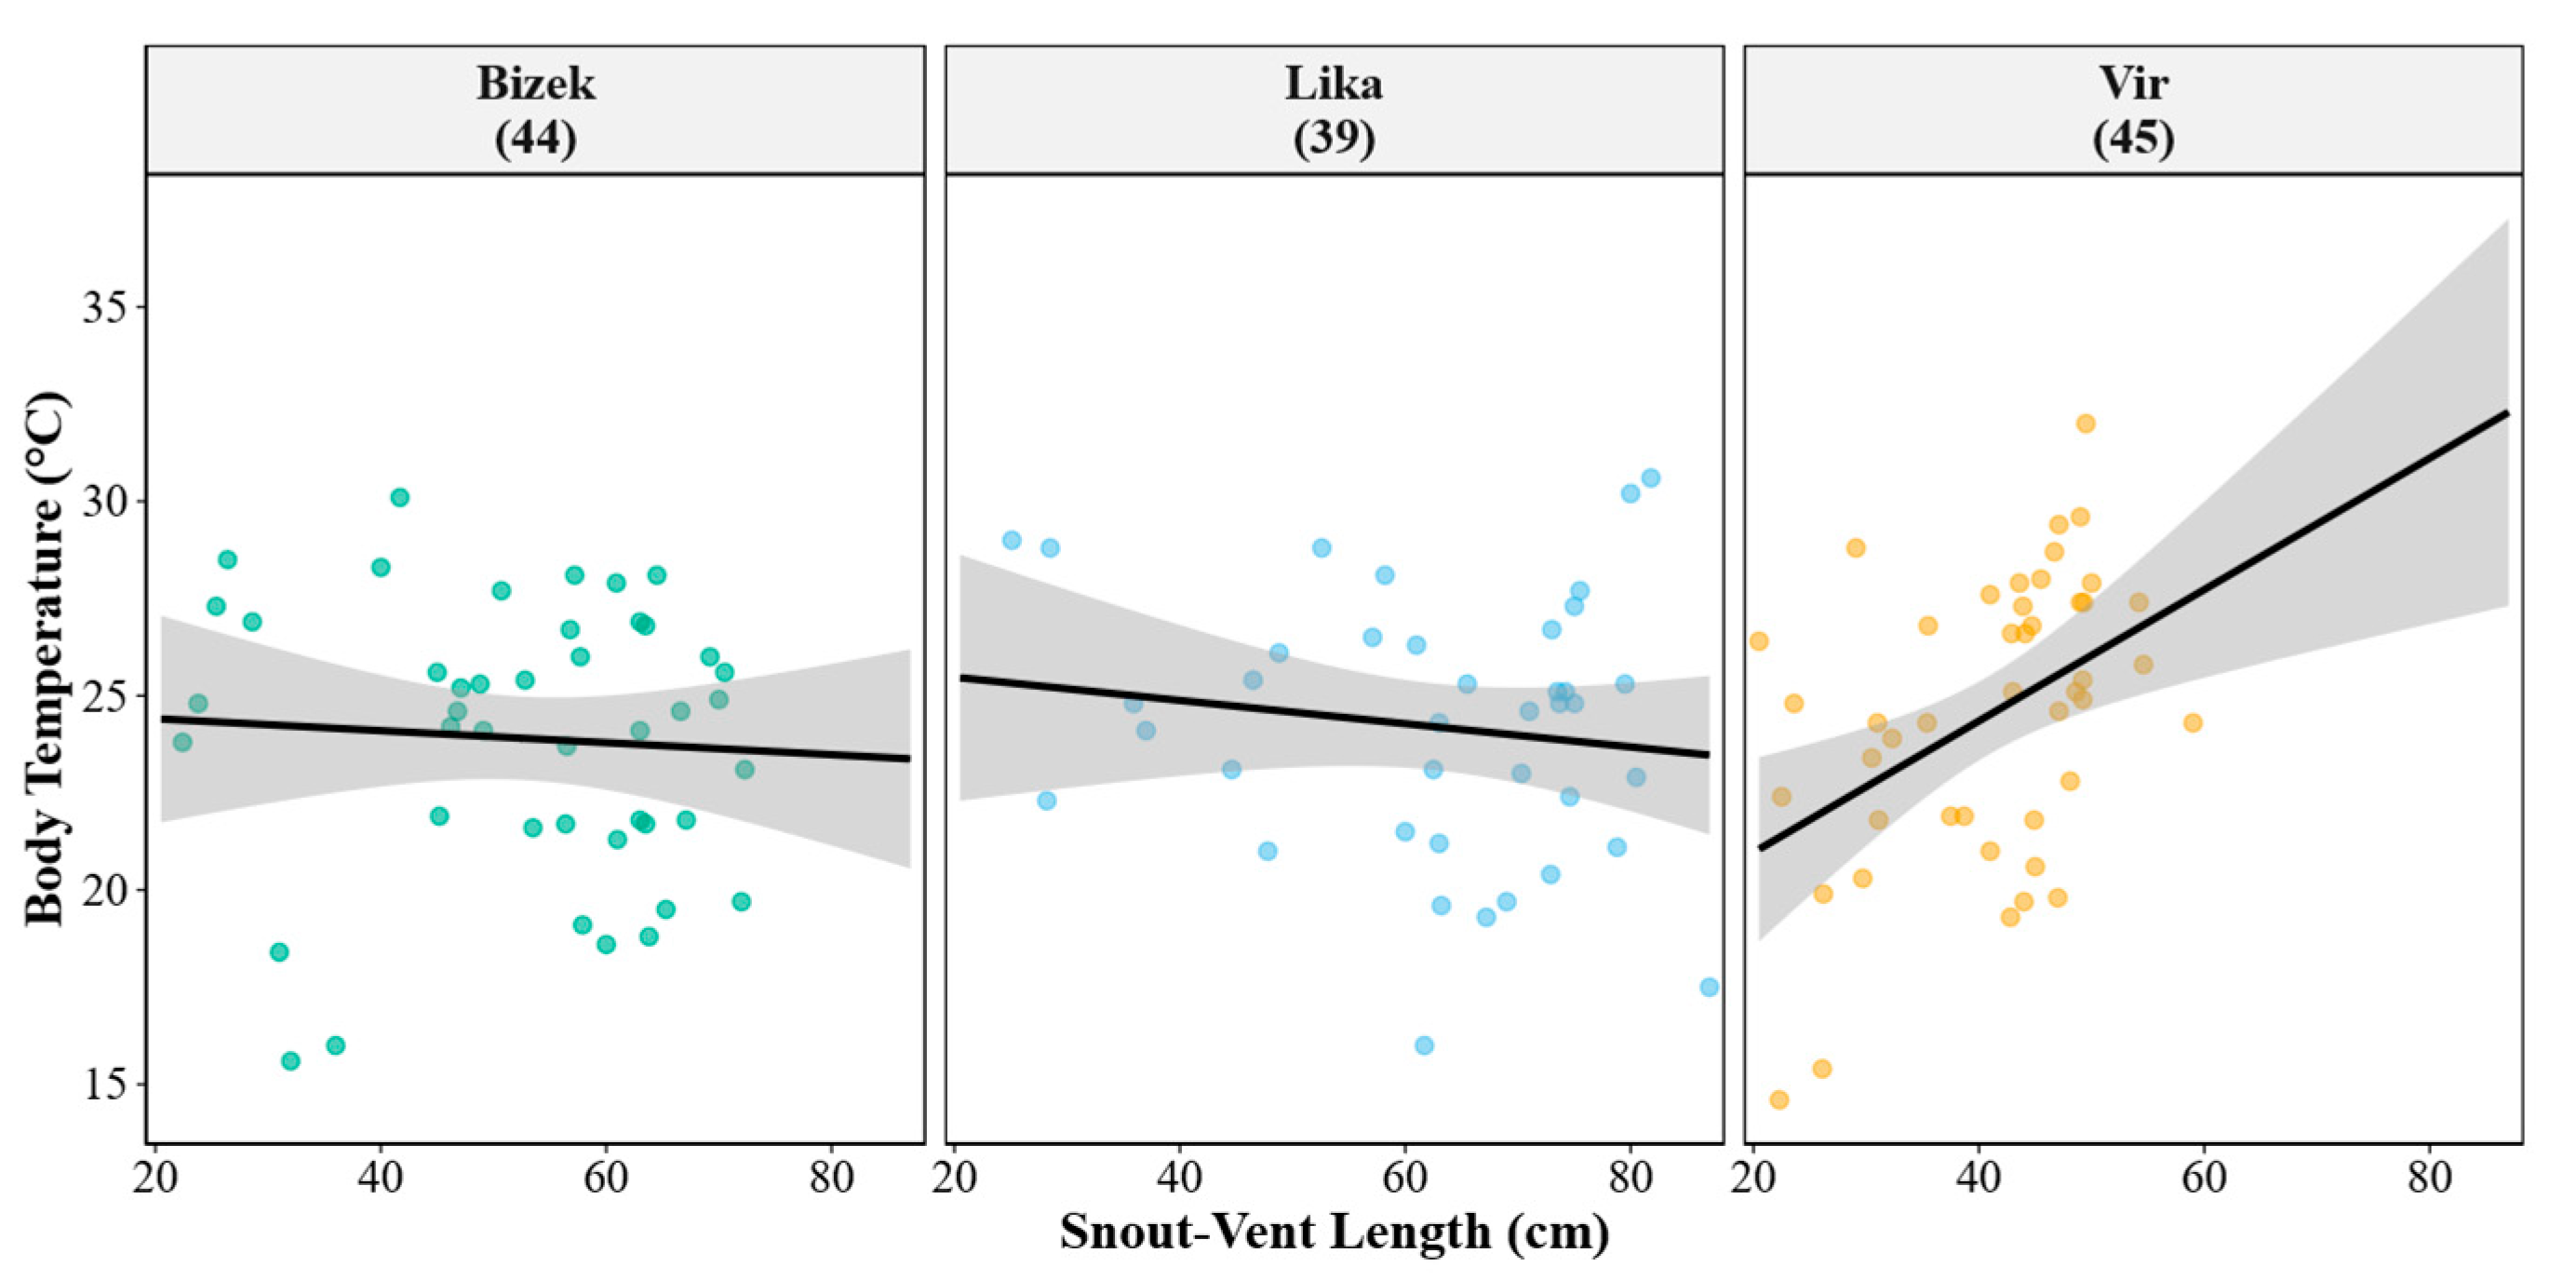
The effect of SVL on Tb varied among locations and was weak across all model sets (Figure A3). At Vir, larger individuals (greater SVL) exhibited higher Tb, but the effect was relatively weak (≈2 °C per 2SD) (Figure 9a and Figure A10). The SVL–Tb relationship differed among locations. Specifically, the positive SVL–Tb slope at Vir was steeper than at Bizek or Lika (Figure 9b and Figure A10).
Figure 9.
Location-specific effects of body size (SVL) on field body temperature (Tb) in Vipera ammodytes. (a) Model-averaged slopes describing the relationship between snout–vent length and Tb at each study location. Positive slopes indicate that larger individuals exhibit higher Tb; negative slopes indicate the opposite pattern. Slope magnitudes are expressed as a change in Tb (°C) per two standard deviations of SVL. Sample sizes for each location are indicated in parentheses. (b) Pairwise differences in SVL slopes between locations, testing the population × SVL interaction. Positive values indicate that the body size effect is stronger (more positive) at the first location relative to the second. Contrast labels include sample sizes for each location. Points represent model-averaged estimates from the top model set (ΔAICc < 2), with error bars indicating 95% confidence intervals. Green points denote statistically supported effects (95% CI excludes zero); red points indicate effects not statistically supported.
Cloud cover, sex, and behavior did not emerge as important predictors (Figure A3).
Mean field Tb was similar across sites (range: 23.4–25.4 °C). The lowest recorded Tb was 14.3 °C for a male from Lika, while the highest was 32.0 °C for a male from Vir (Figure 10 and Table A4).
Figure 10.
Distribution of field body temperature (Tb) by sex and population. Sample sizes (n) shown beneath each boxplot. Boxes show medians and interquartile ranges; whiskers extend to minimum and maximum values. No statistical difference was found between groups (ANOVA).
4. Discussion
In our study, nine of 12 variables were identified as predictors of Tb in V. ammodytes, including three with location-dependent effects. While abiotic and physiological constraints acted as predictors across populations, cloud cover and sex were not supported as important ones. Microhabitat use and activity timing functioned as population-specific buffers, as did SVL, but with a weak effect, whereas discrete behavioral categories did not. These results partially support our hypothesis. Ultimately, the hypothesis that Tb is conserved across populations and sexes was supported.
4.1. Abiotic Population-Independent Predictors
Body temperature closely tracks ambient temperature in reptiles, particularly species relying on basking and surface activity [3,6]. Indeed, TA5 was the most consistent predictor of Tb in our study, with individuals encountered at higher TA5 exhibiting higher Tb. This consistency of the TA5 effect across locations suggests that, despite substantial differences in vegetation structure and climate, V. ammodytes relies on broadly similar thermal cues to regulate Tb. A close relationship between Tb and environmental temperatures has been reported in other snake species [59,60]. However, single environmental variables often explain only part of the variation in Tb, reflecting the combined influence of multiple environmental and behavioral factors. In this context, it is important to note the significant correlation of TA5 with other temperatures measured in this study (TS and TA60), indicating possible high predictivity for other ambient temperatures as well. This reinforces the idea that ambient temperature acts as a universal constraint on thermoregulation, within which behavioral and habitat-mediated adjustments operate.
Relative humidity exerted a negative effect on Tb across all populations, with individuals in more humid conditions exhibiting lower Tb. Although humidity is often considered a secondary variable in reptile thermoregulation, it can substantially influence heat exchange by modulating evaporative cooling, boundary layer properties, and the thermal characteristics of substrates and vegetation [2,21]. In snakes, higher humidity is frequently associated with shaded or sheltered microhabitats that offer reduced solar radiation and lower operative temperatures [61] which may explain the negative effect humidity has on Tb observed in this study.
Wind speed enhances convective heat loss in ectotherms, with most studies testing this effect on lizards [59,60,62]. Empirical studies explicitly addressing wind effects on snake body temperature are scarce. Wind speed is commonly recorded as a contextual variable in viper field studies [31,63,64,65], but elapid studies report weak or unsupported relationships between wind and activity or detectability [66,67]. Nevertheless, practical field experience and monitoring guidelines commonly recommend avoiding surveys during strong wind conditions, reflecting a widespread perception that wind alters snake behavior or detectability [68]. Unexpectedly, we found not a negative, but a positive association between wind speed and body temperature across all locations, but its biological effect was slight. Interestingly, although extremely rare, some studies reported similar positive effects of wind on Tb or basking behavior, and have emphasized the need for further research to elucidate this phenomenon [69,70]. This counterintuitive pattern likely reflects complex interactions between heat exchange, environmental heterogeneity, and behavior rather than a direct thermal effect [3,6,59,71]. Our findings demonstrate that, although slightly significant, wind speed is not thermally neutral for V. ammodytes, but this effect needs to be studied further before suggesting any mechanistic interpretation. Incorporating wind into thermoregulation models may be particularly important as climate change alters wind regimes alongside temperature and humidity [72].
4.2. Physiological Population-Independent Predictors
Elevated body temperatures during pre-ecdysis and digestion have been reported in several reptile species. During the opaque phase, this is commonly interpreted as facilitating skin renewal through increased metabolic and enzymatic activity [8,21]. In snakes, the opaque phase is typically associated with reduced mobility, impaired vision, and increased vulnerability to predation, potentially constraining behavioral thermoregulation and limiting access to preferred thermal microhabitats [21]. Postprandial thermophily is also well documented in snakes and other reptiles, where elevated body temperatures enhance digestive efficiency by accelerating gastric emptying, enzymatic activity, and nutrient assimilation [17,73,74]. Experimental studies on European vipers have shown that digestion proceeds more rapidly at higher temperatures, highlighting the physiological benefits of maintaining elevated Tb following feeding. However, expression of postprandial thermophily in free-ranging snakes is often constrained by ecological factors, including predation risk, habitat structure, and limited access to suitable thermal microhabitats [21]. Our results showed a moderate association rather than a dominant thermoregulatory predictor for both conditions, yet it also showed uncertainty of their biological effects, meaning that our results do not clarify if shedding and food in the stomach are connected to higher or lower Tb. The weak and unsupported effect observed in this study suggests that although digestive state and opaque conditions may influence Tb opportunistically but do not dominate thermoregulation in V. ammodytes under field conditions.
4.3. Population-Dependent Predictors
Adjustments in microhabitat use and activity types (which acted as proxies of behavior) are reported as determinants of Tb in V. ammodytes in previous studies [20]. Microhabitat also emerged as an important population-dependent predictor in our study. Closed microhabitats were associated with higher Tb at Bizek but lower Tb at Lika, whereas semi-open microhabitats were associated with higher Tb at Vir. These contrasting patterns indicate that microhabitat categories must be interpreted relative to local vegetation structure, solar exposure, and thermal buffering capacity. Yet the differences among sites might be a reflection of uneven sample sizes. Indeed, some microhabitat categories (e.g., open and closed in Lika and Bizek) are represented with only a handful of records. This might indicate the rarity of those microhabitat categories at those sites, reflecting differences in habitat heterogeneity across locations. Another explanation could be that this is a reflection of the microhabitat preferences of the snakes, regardless of what is available at each location. A more detailed ecological study, which includes microhabitat and habitat preference analysis through the daytime cycle, would be useful to untangle microhabitat and Tb interaction in V. ammodytes. Nevertheless, those uncertainties do not diminish the significance of microhabitat as a predictor of Tb, since the microhabitat × location interaction appears across all models in our analysis. Similar context-dependent microhabitat effects on Tb are reported in other vipers and reptiles in general, where identical habitat categories function as heat sources or thermal refuges depending on the climate and vegetation density [3,6,20,61,75]. Our findings extend this concept by demonstrating that such effects persist even within a single clade and a relatively limited geographic range.
Time of day emerged as another important population-dependent predictor of Tb. At Bizek, Tb increased throughout the day, consistent with gradual warming in a forested environment where solar penetration is delayed. At Lika, Tb declined later in the day, likely reflecting the decrease in ambient temperatures that commonly occurs in mountain environments towards the evening. No statistically supported temporal effect was detected at Vir, suggesting that coastal conditions may dampen diel thermal gradients or constrain behavioral options. Temporal shifts in daily activity are key thermoregulatory mechanisms in reptiles [3,6,21,76], and our results show these mechanisms are expressed differently depending on local habitat characteristics for V. ammodytes as well.
Although behavior is widely recognized as a key component of snake thermoregulation [8,21,23], it did not emerge as an independent predictor of Tb in our models. In ectotherms, behavior often manifests through where and when individuals position themselves in the environment, rather than through discrete activity categories alone. Microhabitat selection and activity timing often determine exposure to TA5, humidity, wind, and solar radiation, thus capturing behavioral thermoregulation more effectively than the categorical behavioral variable. Similar patterns have been reported in other reptile studies, where environmental or spatial predictors outperformed explicit behavioral variables despite behavior being the underlying mechanism [3,6,61]. Together, these results suggest that behavioral thermoregulation in V. ammodytes may be expressed through spatial and temporal habitat use rather than as discrete behavioral states detectable as independent predictors. However, this finding must be interpreted with caution. The absence of a detectable effect among broad behavioral classes (e.g., basking, hiding, moving, resting, other) does not imply that behavioral thermoregulation is restricted exclusively to habitat selection and temporal activity. Field classifications of snake behavior used here lack the resolution to capture fine-scale postural adjustments. Ambush-foraging vipers frequently employ subtle mechanisms to manipulate heat exchange while remaining stationary, such as dorsoventral flattening to maximize solar absorption, altering the tightness of coils to minimize convective heat loss, or making minor adjustments in bodily orientation relative to the sun. Because these micro-behaviors were not distinctly categorized, their thermoregulatory contribution remains unquantified. Thus, while macro-scale spatial and temporal positioning are clearly vital, they likely operate in tandem with these more cryptic postural behaviors.
Body size effects on thermoregulation have been reported in several reptile taxa [77], including vipers [13,22], but their expression often depends on the environmental and ecological context. In our study, the relationship between SVL and Tb varied among populations and was statistically supported only at Vir, where larger individuals attained higher Tb. Although detectable, the effect was comparatively weak, reinforcing the view that body size acts as a secondary modifier of thermal state rather than a dominant predictor. Moreover, the restriction of this effect to a single population suggests that size-related influences on thermoregulation are context-dependent rather than universally expressed.
4.4. Similarity of Body Temperatures Across Populations and Sexes
Despite pronounced differences in climate, vegetation, and predictor effects, mean Tb was similar across populations, with no difference between sexes. These similarities in mean Tb may nevertheless arise through different thermoregulatory pathways, as suggested by the contrasting temporal and microhabitat-related patterns observed among sites. For example, Tb increased throughout the day at Bizek but declined at Lika, indicating that snakes in different environments may rely on distinct combinations of habitat use and daily activity to achieve comparable thermal outcomes. Comparable results have been reported in vipers and some other reptiles, where population-specific thermoregulatory strategies, such as behavioral shifts to different microhabitats, may produce similar body temperatures despite divergent environmental conditions [14,33,64,75,78]. Yet it remains unclear whether these similarities in Tb across different V. ammodytes populations reflect active thermoregulatory convergence or simply similar environmental conditions across sites. Therefore, this needs to be studied further. The absence of sex-specific differences in Tb further suggests that, except for gravidity (not tested in this paper), males and females operate within similar thermal constraints, as it is demonstrated for other reptile species as well [22,79,80].
4.5. Implications for Conservation
The presence of both population-independent and population-dependent predictors of Tb has potential implications for the conservation and management of V. ammodytes. Our results demonstrate that even within a single genetic clade, populations achieve similar thermal outcomes through different combinations of environmental and behavioral pathways. This pattern is observed in other reptiles as well, supporting the view that context-dependent thermoregulatory pathways may be a common feature across ectotherms [14,23,75].
Population-dependent predictors, specifically microhabitat use, time of day, and SVL, indicate that the relative importance of particular thermal pathways varies spatially. Habitat management targeting vegetation structure, openness, and rock availability, or managing human activity times, might therefore benefit from being informed by site-specific thermoregulatory data. Without such context, interventions intended to improve habitat quality could inadvertently reduce the availability of effective thermal refuges. Given contrasting land-use contexts among sites, uniform management actions may be less effective. Instead, managers should consider how local environmental and anthropogenic factors interact with diel activity patterns [81,82,83]. For instance, preserving a heterogeneous semi-open microhabitat structure would likely maintain current thermoregulatory opportunities across all three sites; however, achieving this may require different local approaches, such as preventing excessive succession at Bizek, adjusting the timing and intensity of livestock grazing at Lika, and maintaining the existing mosaic structure through selective clearing at Vir.
At the same time, environmental predictors consistent across populations (TA5, relative humidity, wind speed) highlight shared constraints operating throughout the species’ range. Yet these predictors are likely tied to habitat structure [3,76]. Microhabitat composition and heterogeneity strongly influence air temperatures, moisture retention, and airflow, thereby shaping the microclimatic conditions experienced by snakes at fine spatial scales. Heterogeneous habitats with open, semi-open, and closed structures provide thermal and hydric gradients. These gradients likely allow individuals to buffer against short-term environmental variation and select conditions meeting their targeted thermal ranges [21].
Ongoing global warming, increased frequency of heat extremes, and altered precipitation and wind regimes are expected to reduce the availability of suitable thermal conditions for many ectotherms [5,22,84,85]. Combined with findings from other clades [20], our results suggest that the capacity of V. ammodytes to adjust to regional climate trajectories may depend heavily on retention of already mentioned fine-scale habitat heterogeneity [86]. Therefore, habitats lacking structural complexity may limit options available to vipers to manage their heat exchange, potentially altering their activity windows and energy budgets even if average climatic conditions remain within tolerable limits.
4.6. Strengths, Limitations, and Future Directions
A major strength of this study lies in its multi-year, multi-population design and its use of an information-theoretic framework that accounts for model uncertainty. By concurrently evaluating the environmental, behavioral, physiological, and morphological factors, we comprehensively identified predictors of Tb in V. ammodytes. Given the centrality of thermoregulation to ectotherm fitness, our results highlight the importance of identifying specific Tb predictors as an important step for understanding reptile thermal physiology [22,23].
Nevertheless, some limitations warrant consideration. Sample sizes were uneven among time of day, microhabitats, and populations, potentially limiting inference for rare categories. Because our measurements lack key environmental drivers, such as solar radiation or operative temperature, this limits our ability to draw clear mechanistic conclusions about the observed relationships. Because the descriptive figures show unadjusted data while the model-averaged contrasts account for covariate imbalance and interactions, the two will not always align visually. We therefore present raw distributions to illustrate sampling structure, but base inference on model-averaged estimates that control for confounding predictors.
In future studies, direct measurements of operative environmental temperatures combined with microclimatic profiles and habitat preference, and long-term individual tracking would further refine the understanding of thermoregulatory decisions. Future studies should expand this approach across additional clades and regions, incorporate fine-scale thermal mapping, and explore fitness consequences of thermoregulatory strategies under projected climate scenarios [22,23]. A comprehensive assessment of habitat availability would strengthen inferences by enabling analysis of preferred vs. available habitat selection.
5. Conclusions
Our study demonstrates that TA5, wind speed, and relative humidity act as universal constraints on thermoregulation in V. ammodytes, whereas pre-ecdysis condition and the presence of food in the stomach exert weaker effects. In contrast, the importance of microhabitat use, time of day, and SVL varied among populations. Despite differing predictor effects, mean Tb was similar across populations, confirming that comparable thermal outcomes arise through population-specific ecological pathways.
These findings reveal a combination of conserved and population-specific regulatory mechanisms that enable V. ammodytes to occupy diverse environments. Such flexibility may facilitate persistence under ongoing environmental change. At the same time, this persistence depends on the availability of fine-scale habitat structures. From a broader perspective, this reinforces that thermal physiology in ectotherms must be interpreted in light of local adaptation and site-specific environmental conditions.
Conservation-wise, management strategies that account for population-specific thermoregulatory pathways are essential for the long-term persistence of V. ammodytes across its range, which may be applicable to other reptiles as well.
Author Contributions
Conceptualization, M.Z. (Mladen Zadravec), D.L.; methodology, M.Z. (Mladen Zadravec); formal analysis, T.G., M.G., M.Z. (Mladen Zadravec); investigation, M.Z. (Mladen Zadravec), R.C., B.S., M.Z. (Mario Zadravec); resources, M.Z. (Mladen Zadravec); data curation, M.Z. (Mladen Zadravec), T.G., M.G.; writing—original draft preparation, M.Z. (Mladen Zadravec), D.L., T.G., M.G.; writing—review and editing, M.Z. (Mladen Zadravec), D.L., T.G., M.G., R.C., B.S., M.Z. (Mario Zadravec); visualization, M.Z. (Mladen Zadravec), T.G.; supervision, D.L.; funding acquisition, M.Z. (Mladen Zadravec). All authors have read and agreed to the published version of the manuscript.
Funding
This paper was supported by the European Union—NextGenerationEU through the National Recovery and Resilience Plan 2021–2026 and institutional grants of the University of Zagreb Faculty of Science (AntroPOZ). Field research was funded by the first author.
Institutional Review Board Statement
Permits for conducting this research were obtained from the Croatian Ministry of Environmental Protection and Green Transition and its predecessors (CLASS: UP/I-612-07/17-48/142, REG.NO: 517-07-1-1-1-17-4, issued on 15 September 2017; CLASS: UP/I-612-07/19-48/12, REG.NO: 517-05-1-1-19-3, issued on 22 February 2019, CLASS: UP/I-612-07/20-48/37, REG.NO: 517-05-1-1-20-4, issued on 29 April 2020). The Faculty of Science ethics committee stated that, according to Croatian and EU regulations on the protection of animals used for scientific purposes, painless experiments and observations of vertebrates require neither permission nor disclosure.
Data Availability Statement
The dataset and R code for this paper are available at https://doi.org/10.6084/m9.figshare.28787801.v1.
Acknowledgments
Our thanks go to Antonio Golub, Mateja Ilinić, Mia Jakopović, Daria Kranželić, Đurđica Majetić, Kristian Medak, Paula Prpić, Nejc Rabuza, Darko Smutni, Paula Šimunčić, Katarina Terlević, and Lorena Vukić for their assistance during fieldwork. We are grateful to everyone from Public Institution Natura Jadera (Zadar County), Public Institution for the Protection and Conservation of Nature in Lika-Senj County, and especially Public Institution Nature Park Medvednica for logistical support.
Conflicts of Interest
The authors declare no conflicts of interest. The funders had no role in the design of the study; in the collection, analyses, or interpretation of data; in the writing of the manuscript; or in the decision to publish the results.
Appendix A
Appendix A.1. Supplementary Figures
Figure A1.
Pearson correlation matrix of body temperature (Tb), air temperature at 5 cm (TA5), substrate temperature (TS), and air temperature at 60 cm (TA60). Color intensity represents the strength of the correlation, ranging from blue (negative) to red (positive). Correlation coefficients are displayed within each cell, with significance levels indicated by asterisks (*** p < 0.001). All pairwise correlations were statistically significant (p < 0.001).
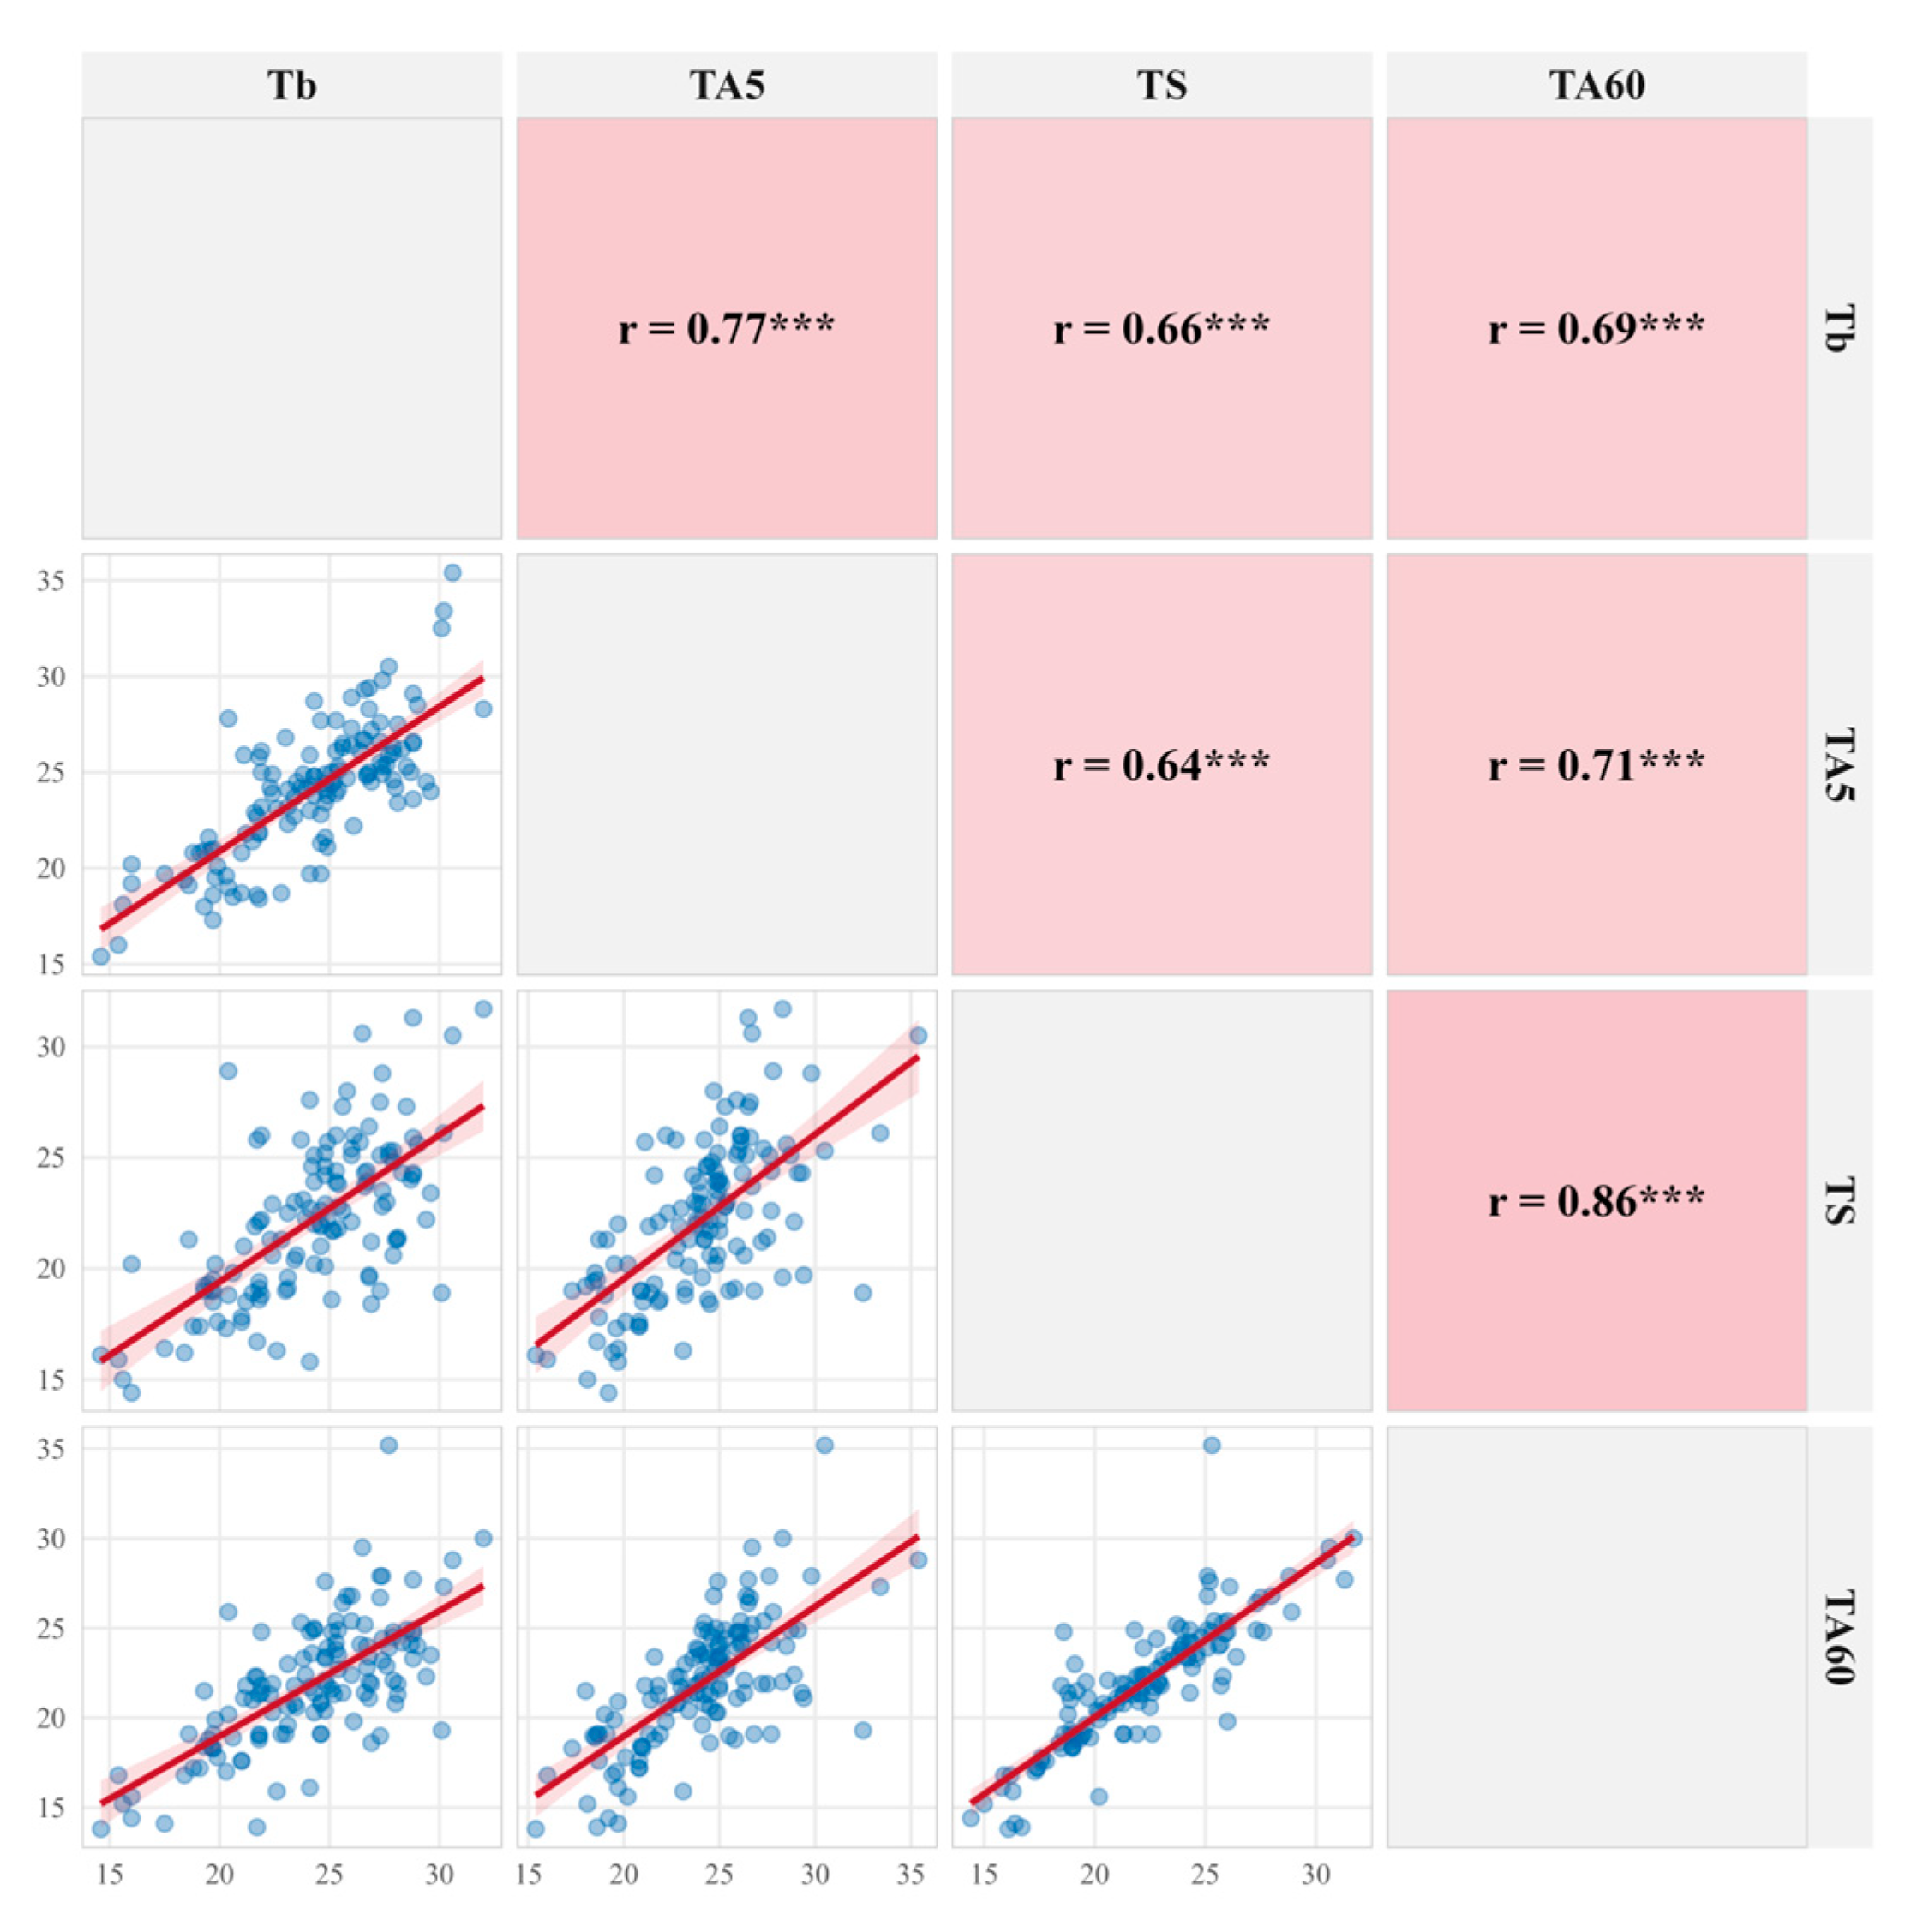
Figure A2.
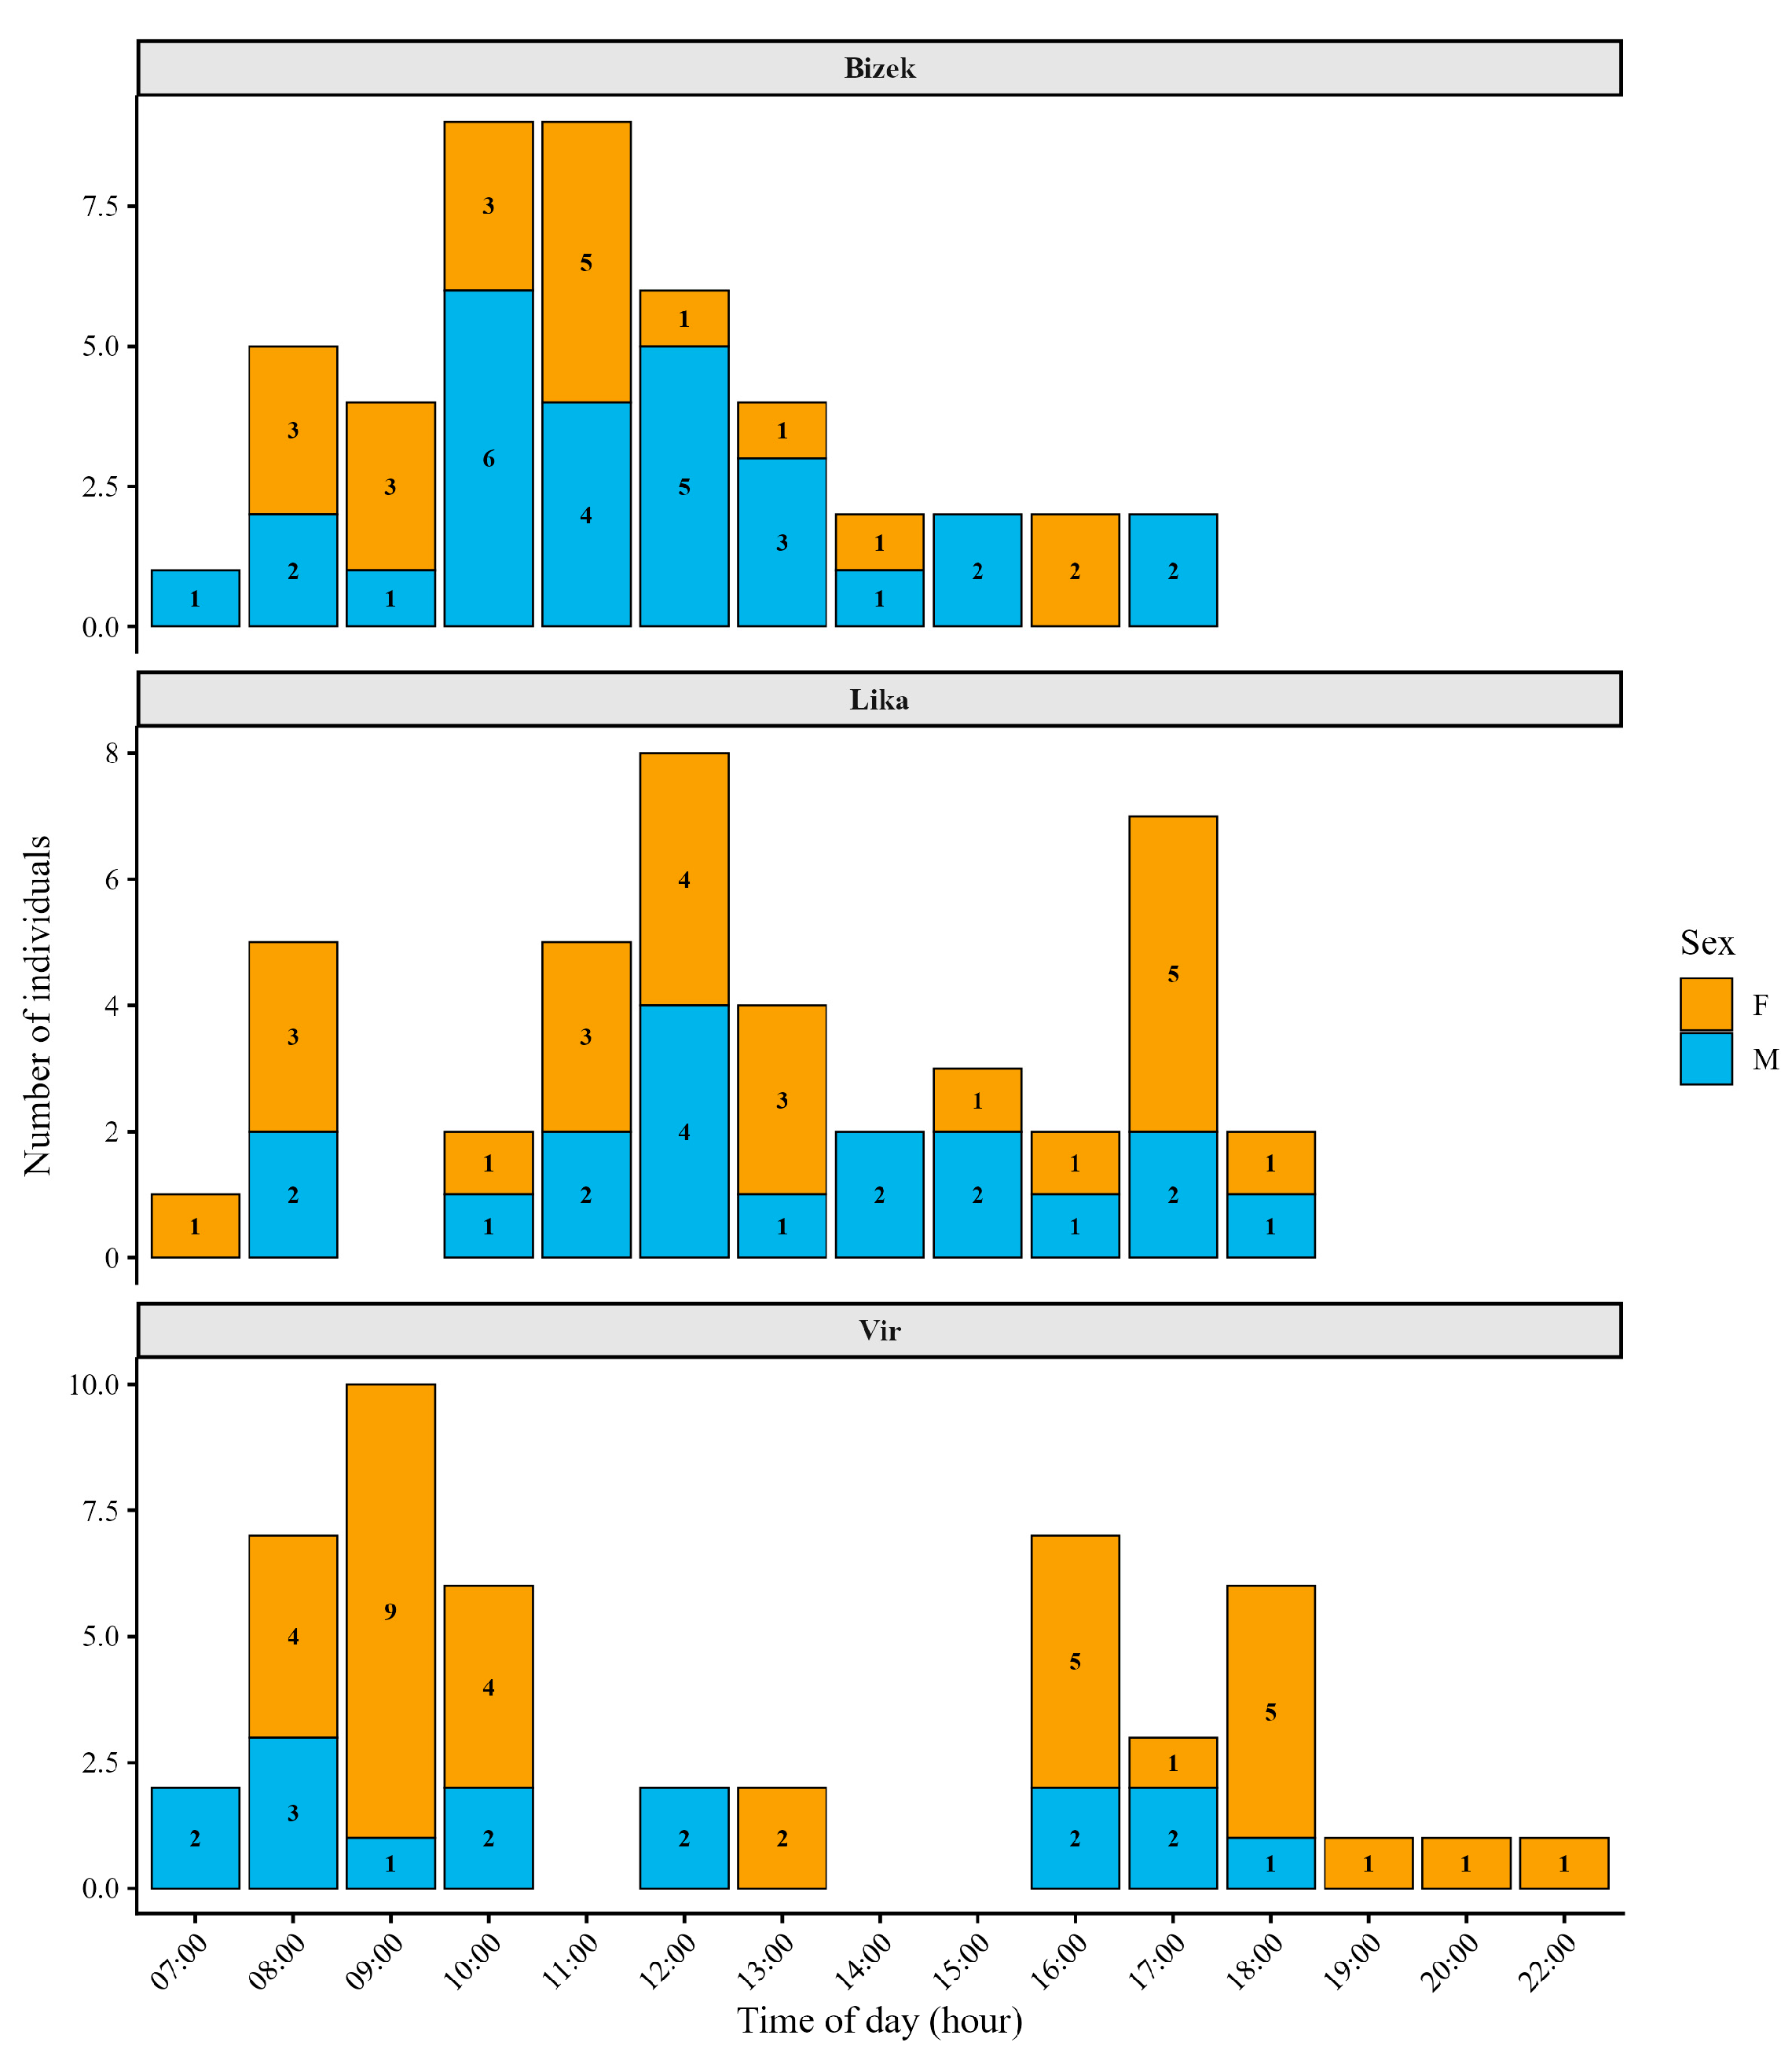
Number of individuals per sex and location found during each time slot, for all five years together.
Appendix A.2. Supplementary Tables
Table A1.
List and description of environmental, morphometric, physiological, and behavioral variables of snakes used in the analyses. *—parameters kept in further analyses after initial inspection for correlations and subsequent interpretation based on ΔAICc < 2.
Table A2.
Frequency of food presence and opaque condition by location and sex. Values are count/total (%).
Table A3.
Body temperature (Tb) and snout–vent length (SVL) by location, time of day, behavior, and sex.
Table A4.
Summary of body temperatures (Tb) for males and females per population. n—sample size; SD—standard deviation.
Appendix B
Appendix B.1. Supplementary Methods for Model Diagnostics
Model validation for the information-theoretic framework.
Standard diagnostic procedures for single-model inference require adaptation when applied to multi-model frameworks. Following recommendations for information-theoretic analyses, we assessed model adequacy using residuals derived from model-averaged predictions rather than from any single model [56].
Appendix B.1.1. Calculation of Model-Averaged Residuals
Model-averaged predictions were calculated as the weighted sum of predictions from all models in the top set (ΔAICc < 2), with weights proportional to each model’s Akaike weight renormalized to sum to unity. Residuals were then computed as the difference between observed Tb and these model-averaged predictions. This approach ensures that diagnostic assessments reflect the actual inferential framework employed rather than any single approximating model.
Appendix B.1.2. Assessment of Model Fit
Overall model fit was quantified using the coefficient of determination (R2) ± calculated from model-averaged predictions:
where SS_residual is the sum of squared model-averaged residuals and SS_total is the total sum of squares. We also report root mean square error (RMSE) as a measure of predictive accuracy in the original units of measurement. For comparison, we present the range of R2 values across individual models in the top set and the weighted mean R2 using Akaike weights.
Appendix B.1.3. Residual Diagnostics
Normality of model-averaged residuals was assessed using the Shapiro–Wilk test and visual inspection of quantile–quantile (Q-Q) plots. We note that with moderate to large sample sizes, the Shapiro–Wilk test may detect minor deviations from normality that have a negligible impact on inference; therefore, visual assessment of Q-Q plots was prioritized over formal test results.
Homoscedasticity was evaluated by plotting residuals against fitted values and by calculating the Spearman rank correlation between absolute residuals and fitted values. A significant correlation would indicate heteroscedasticity, potentially warranting variance-stabilizing transformations or alternative error structures.
Residuals were also examined separately for each location to verify that model predictions did not exhibit systematic bias at particular study sites.
Appendix B.1.4. Multicollinearity Assessment
Variance inflation factors (VIF) were calculated to assess multicollinearity among predictors. Because VIF values for main effects are artificially inflated when interaction terms are present, we calculated VIF from a reduced model containing main effects only. For categorical predictors with more than two levels, generalized VIF values were computed and adjusted for degrees of freedom following Fox and Monette [87]. VIF values exceeding 5 were considered indicative of problematic multicollinearity requiring remediation; values exceeding 10 would indicate severe multicollinearity.
Appendix B.1.5. Influential Observations
Influential observations were identified using Cook’s distance calculated from the best-supported model (lowest AICc) as an approximation, given the computational burden of calculating influence measures across all models in the averaged set. Observations with Cook’s distance exceeding 4/n, where n is the sample size, were flagged as potentially influential. We report the percentage of observations exceeding this threshold and conducted sensitivity analyses excluding these observations to verify that conclusions were robust to their inclusion.
Appendix B.1.6. Diagnostic Figures
Four diagnostic plots were generated to visualize model adequacy (Figure A4): (Figure A4a) residuals versus fitted values, with a LOESS smoother to detect non-linearity; (Figure A4b) normal Q-Q plot of standardized residuals; (Figure A4c) observed versus predicted values with 1:1 reference line and R2 annotation; and (Figure A4d) scale–location plot showing the square root of absolute standardized residuals versus fitted values to assess homoscedasticity.
Figure A3.
Importance of variables, including interactions, in the three model sets (AICc < 2, AICc < 4, and 95% weight) for all variables investigated for their influence on body temperature (Tb) of Vipera ammodytes. TA5—air temperature at 5 cm above the place where the snake was found; SVL—snout to vent length; Food—presence of food in stomach.
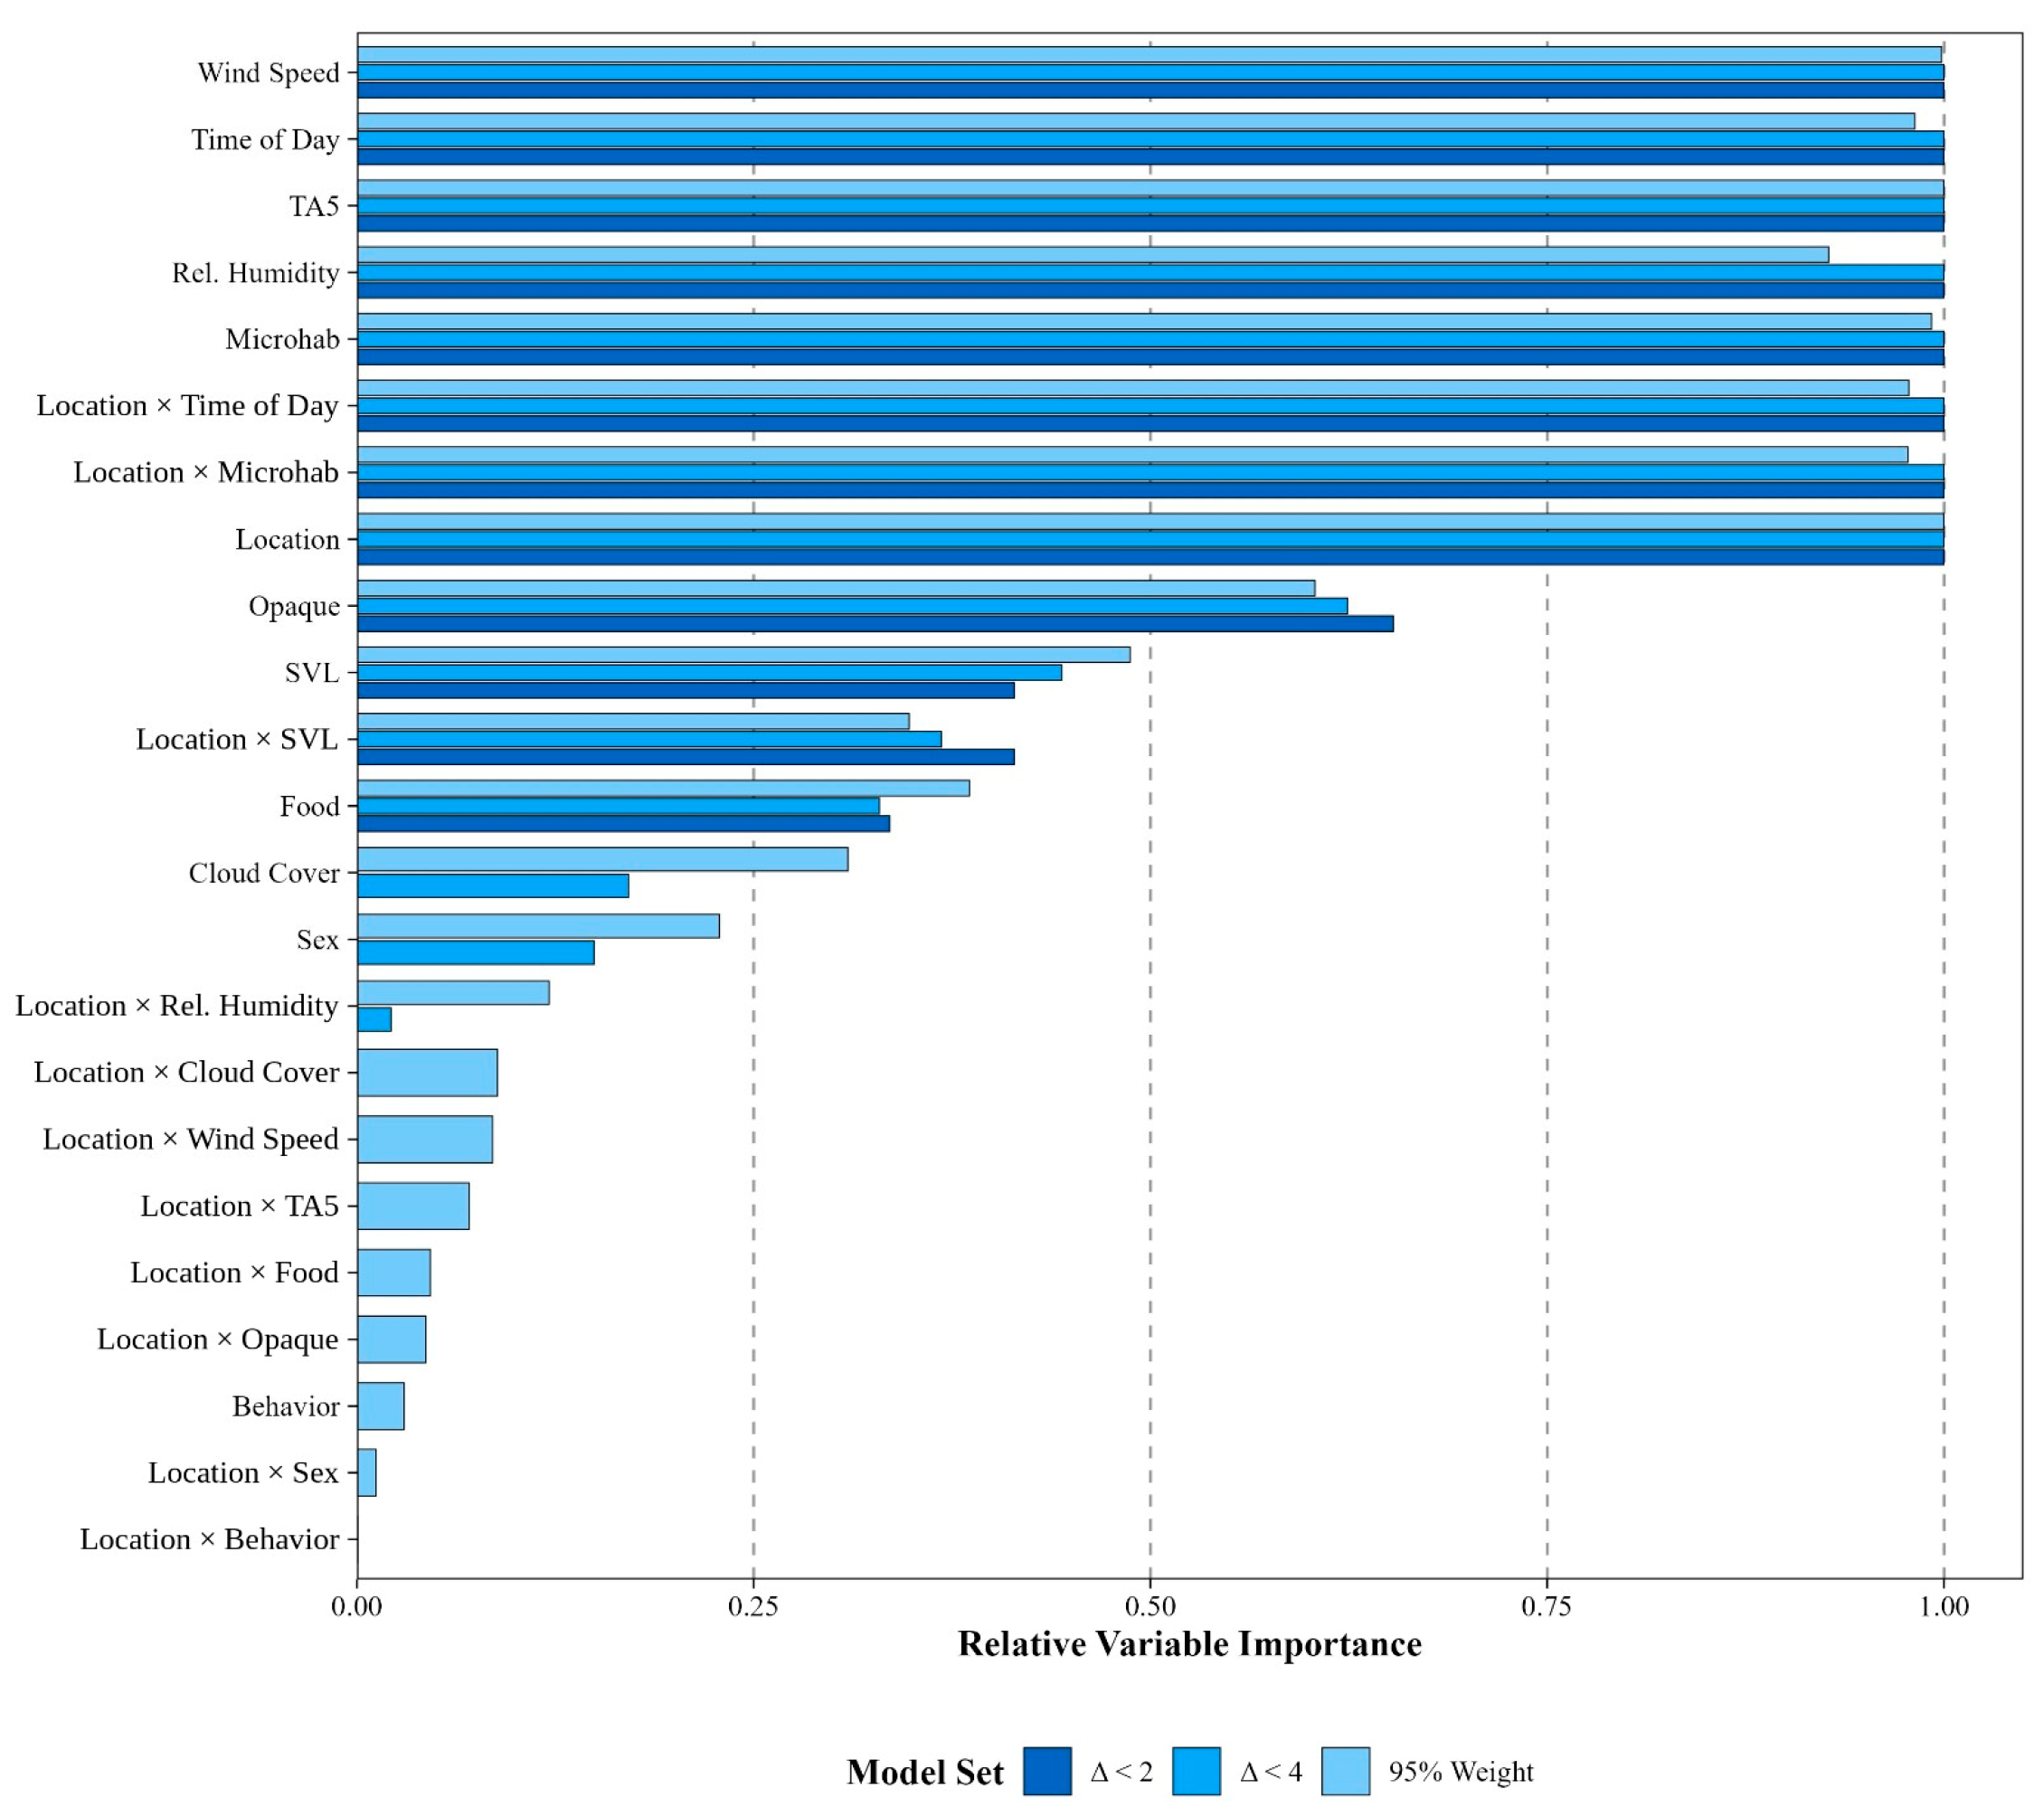
Figure A4.
Model diagnostics (model-averaged predictions) for the AICc < 2 model set: (a) residuals vs. fitted, (b) normal Q-Q plot, (c) observed vs. predicted field body temperature (Tb) values, (d) scale vs. location.
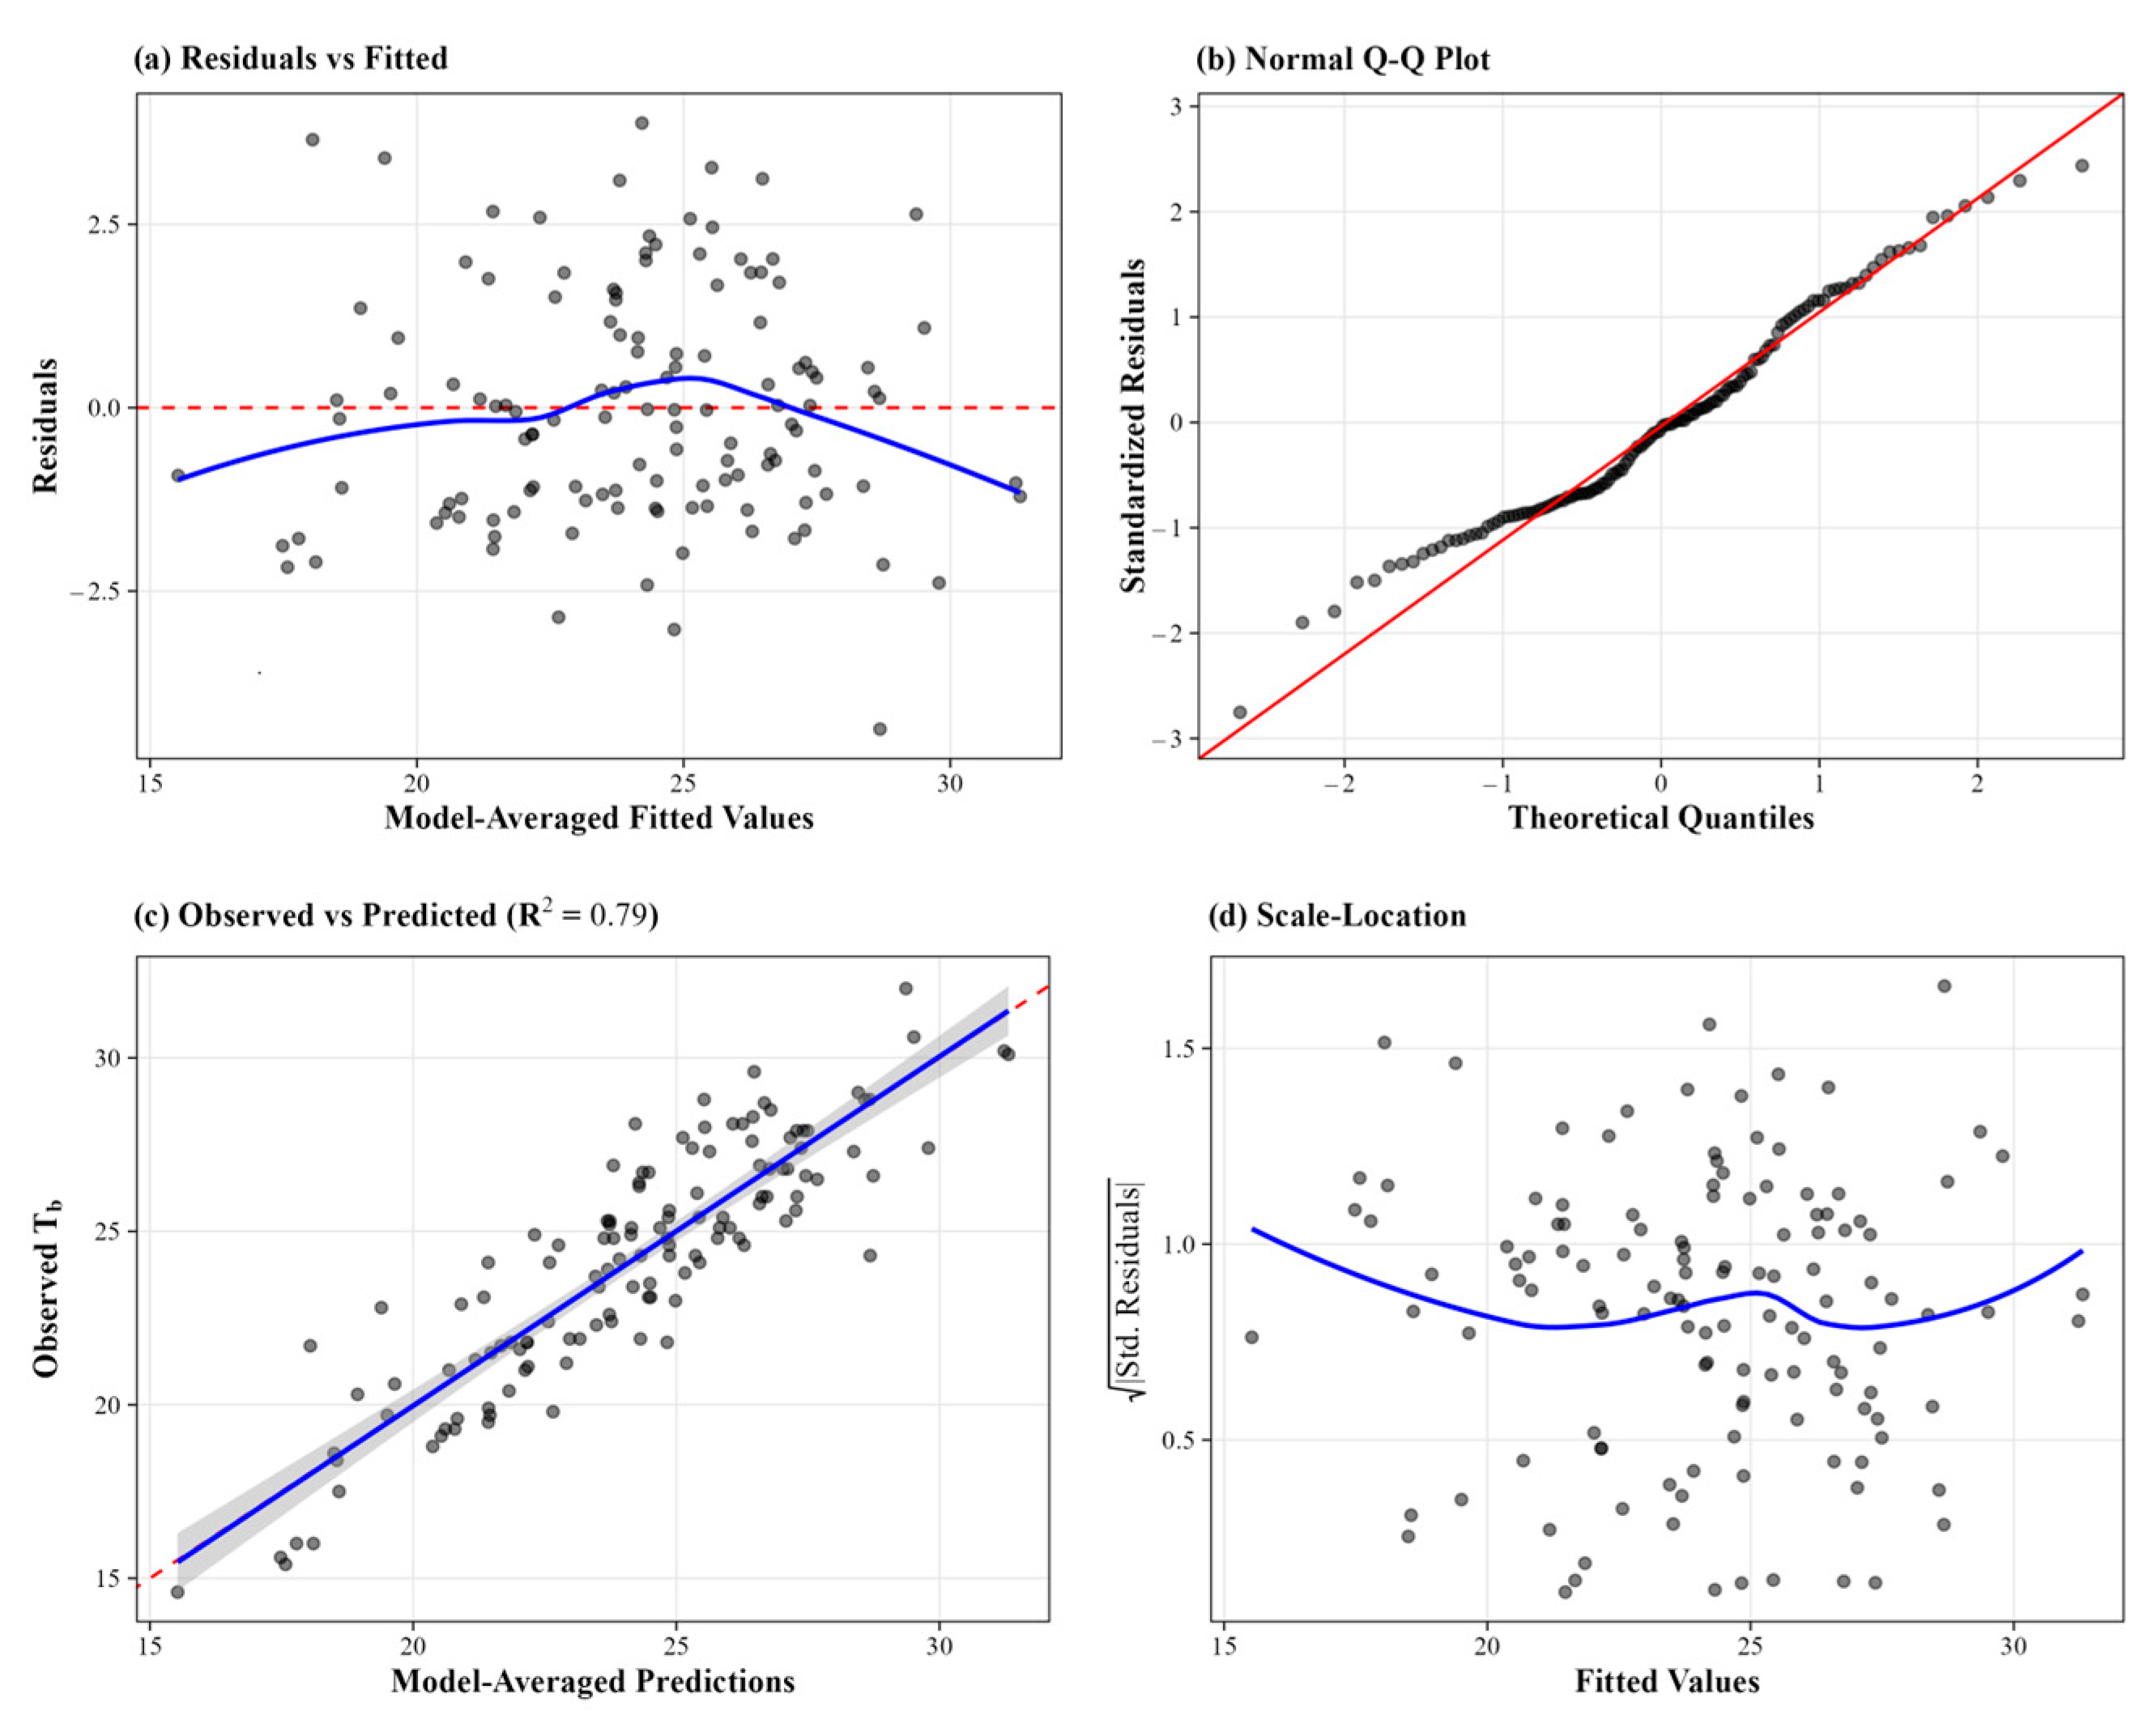
Figure A5.
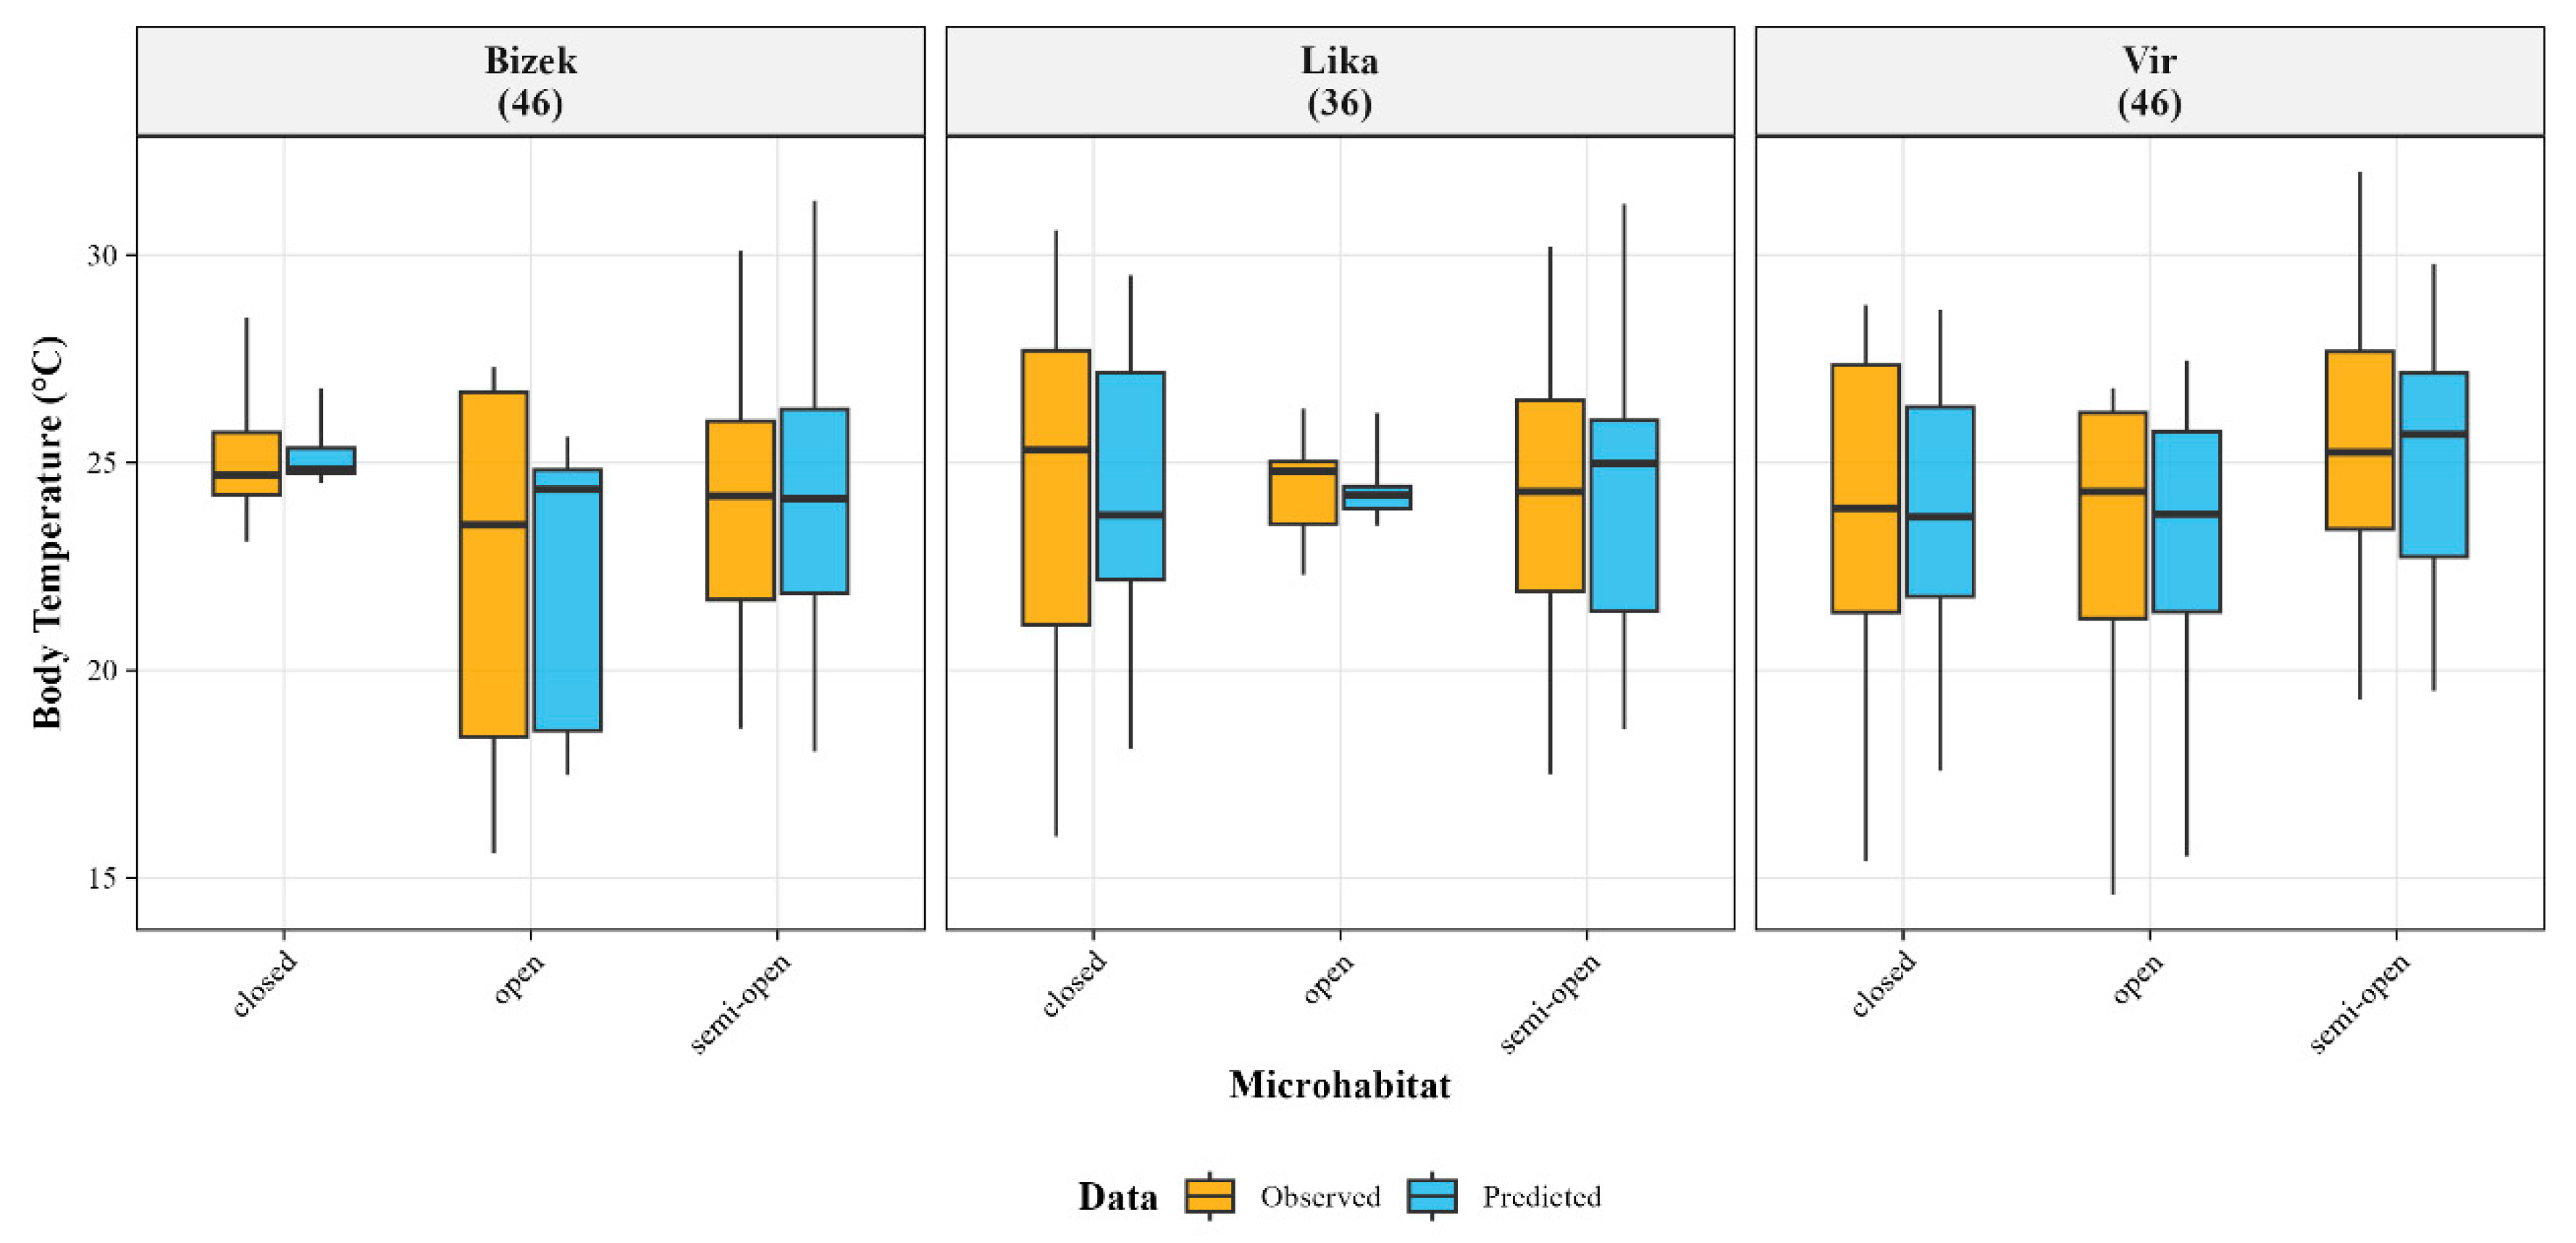
Raw field body temperature (Tb) data vs. model-predicted Tb values.
Appendix C
Appendix C.1. Interpretation of Model-Averaged Results
Appendix C.1.1. Understanding Effect Sizes from Standardized Predictors
Continuous predictor variables in this analysis were standardized by centering on their mean and dividing by two standard deviations prior to model fitting. Consequently, regression coefficients for continuous predictors represent the expected change in body temperature (°C) associated with an increase of two standard deviations in the predictor variable. This standardization approach, recommended by Gelman [55], offers two advantages: it places effect sizes for continuous predictors on a scale comparable to those for binary predictors (which inherently represent a one-unit change), and it facilitates comparison of effect magnitudes across predictors measured in different units.
To convert standardized effect sizes to the original measurement scale, divide the coefficient by two times the standard deviation of the predictor. For example, if ambient temperature has a standard deviation of 3.5 °C and the standardized coefficient is 6.0 °C per 2SD, the effect per 1 °C increase in ambient temperature is 6.0/(2 × 3.5) = 0.86 °C.
Appendix C.1.2. Interpretation of Interaction Terms
When a predictor is involved in an interaction with location, the main effect coefficient represents the effect of that predictor at the reference location (alphabetically first). The interaction coefficient represents the difference in slopes between a non-reference location and the reference location. To obtain the slope at a non-reference location, add the interaction coefficient to the main effect coefficient.
The within-location and between-location contrasts presented in the figures were calculated from these model-averaged coefficients to provide more directly interpretable comparisons. Standard errors for contrasts properly account for covariance between the main effect and interaction terms.
Appendix C.1.3. Relative Variable Importance
Variable importance values represent the sum of Akaike weights across all models in the top set that include the variable. Values range from 0 to 1, with higher values indicating that a variable consistently appeared in well-supported models. An importance value of 1.0 indicates the variable appeared in all models within the top set. Importance values should be interpreted as measures of predictor relevance rather than as probabilities or measures of statistical significance.
Appendix C.1.4. Statistical Support Versus Null Hypothesis Testing
We deliberately employ the language of ‘statistical support’ rather than ‘statistical significance’ to reflect the information-theoretic philosophy underlying this analysis. Effects are described as ‘supported’ when 95% confidence intervals exclude zero, indicating that the data provide evidence for a non-zero effect. Effects are described as ‘not supported’ when confidence intervals include zero, indicating insufficient evidence to conclude the effect differs from zero. This framing avoids the binary thinking associated with p-value thresholds while still providing clear guidance on which effects are reliably estimated [88].
Appendix C.2. Supplementary Figures—Descriptive Statistics
Differences between raw and model-predicted variable values reflect covariate adjustment. The model-averaged estimates provide accurate comparisons by controlling for such imbalances.
Figure A6.
Relationships between continuous environmental variables and field body temperature (Tb) in Vipera ammodytes. (a) Field Tb as a function of ambient temperature measured at 5 cm above substrate (TA5). (b) Field Tb as a function of relative humidity. (c) Field Tb as a function of wind speed. In all panels, points represent individual observations and lines indicate ordinary least squares regression fits with 95% confidence bands (shaded areas). Sample sizes are indicated in brackets on each x-axis label. The direction and magnitude of these relationships (positive vs. negative slopes) illustrate the raw correlational patterns in the data.
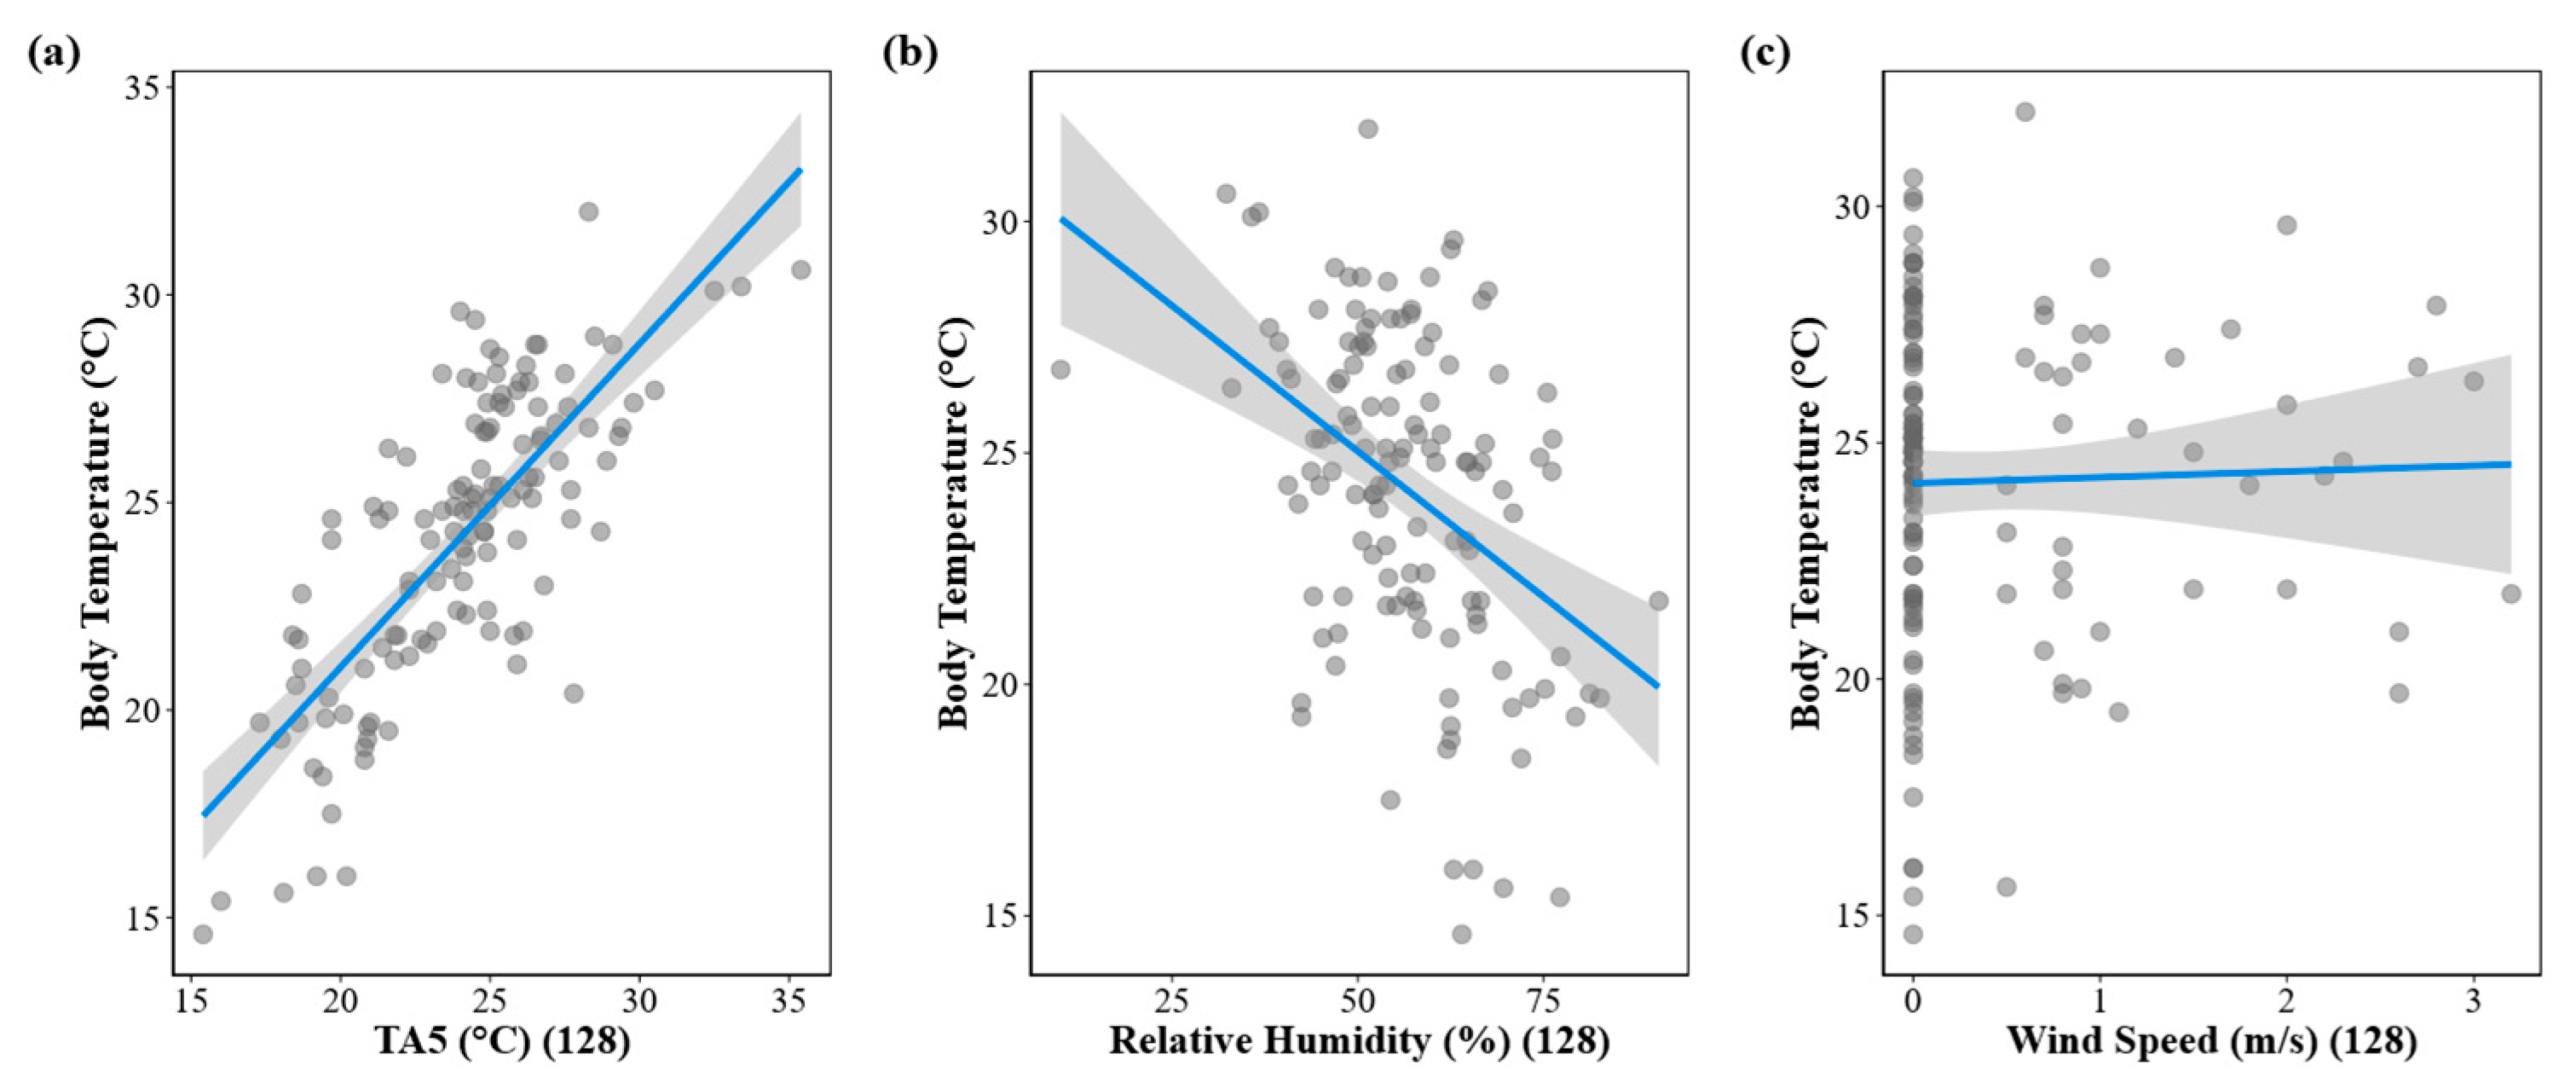
Figure A7.
Field body temperature (Tb) in relation to individual physiological state in Vipera ammodytes. (a) Field Tb distribution in individuals with and without signs of pre-ecdysis (opaque eyes and dull skin indicating imminent shedding). (b) Field Tb distribution in individuals with and without food in the stomach. Raincloud plots combine a half-violin showing the probability density (right), a box plot showing median (horizontal line), interquartile range (box), and min–max (whiskers), and individual observations as dots (left). Sample sizes for each category are indicated below the x-axis labels.
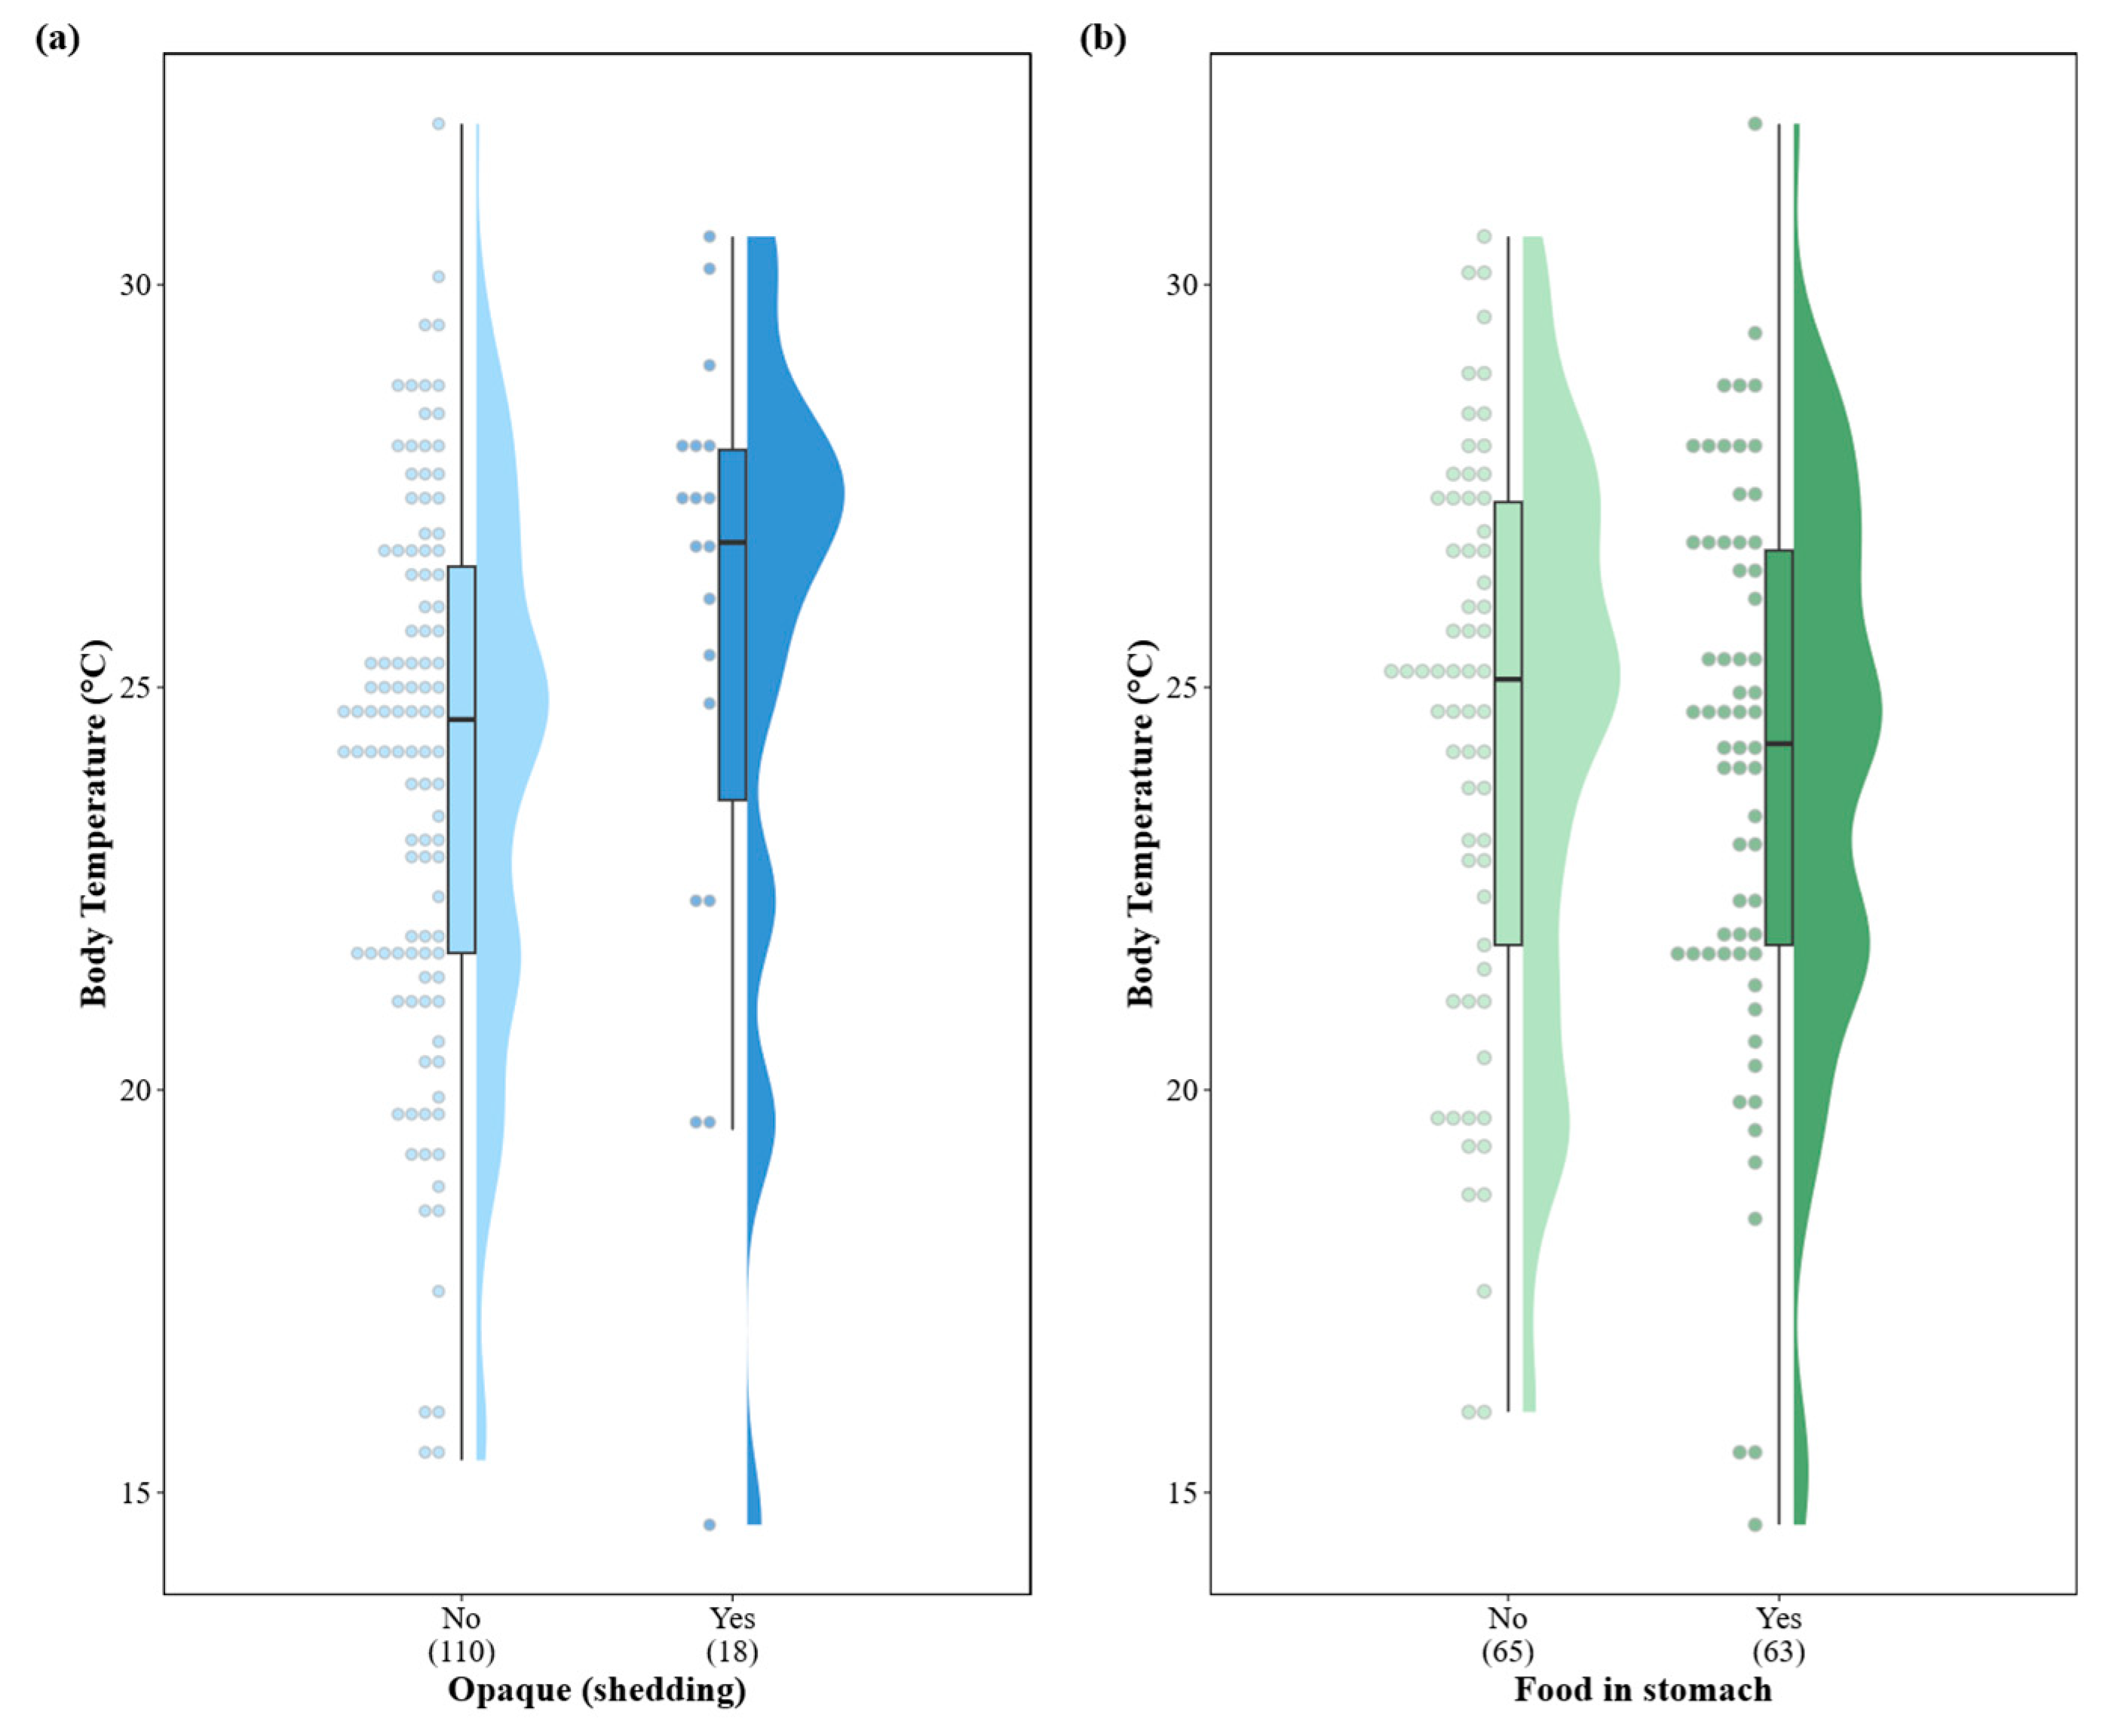
Figure A8.
Body temperature variation across locations and microhabitat types in Vipera ammodytes. (a) Distribution of field body temperature (Tb) by microhabitat type within each study location. (b) Distribution of field Tb by location within each microhabitat type. Raincloud plots combine a half-violin showing the probability density (right), a box plot showing median (horizontal line), interquartile range (box), and min–max (whiskers), and individual observations as dots (left). Each facet represents a single microhabitat category, with total sample size indicated in parentheses. Visualization elements as described for panel (a).
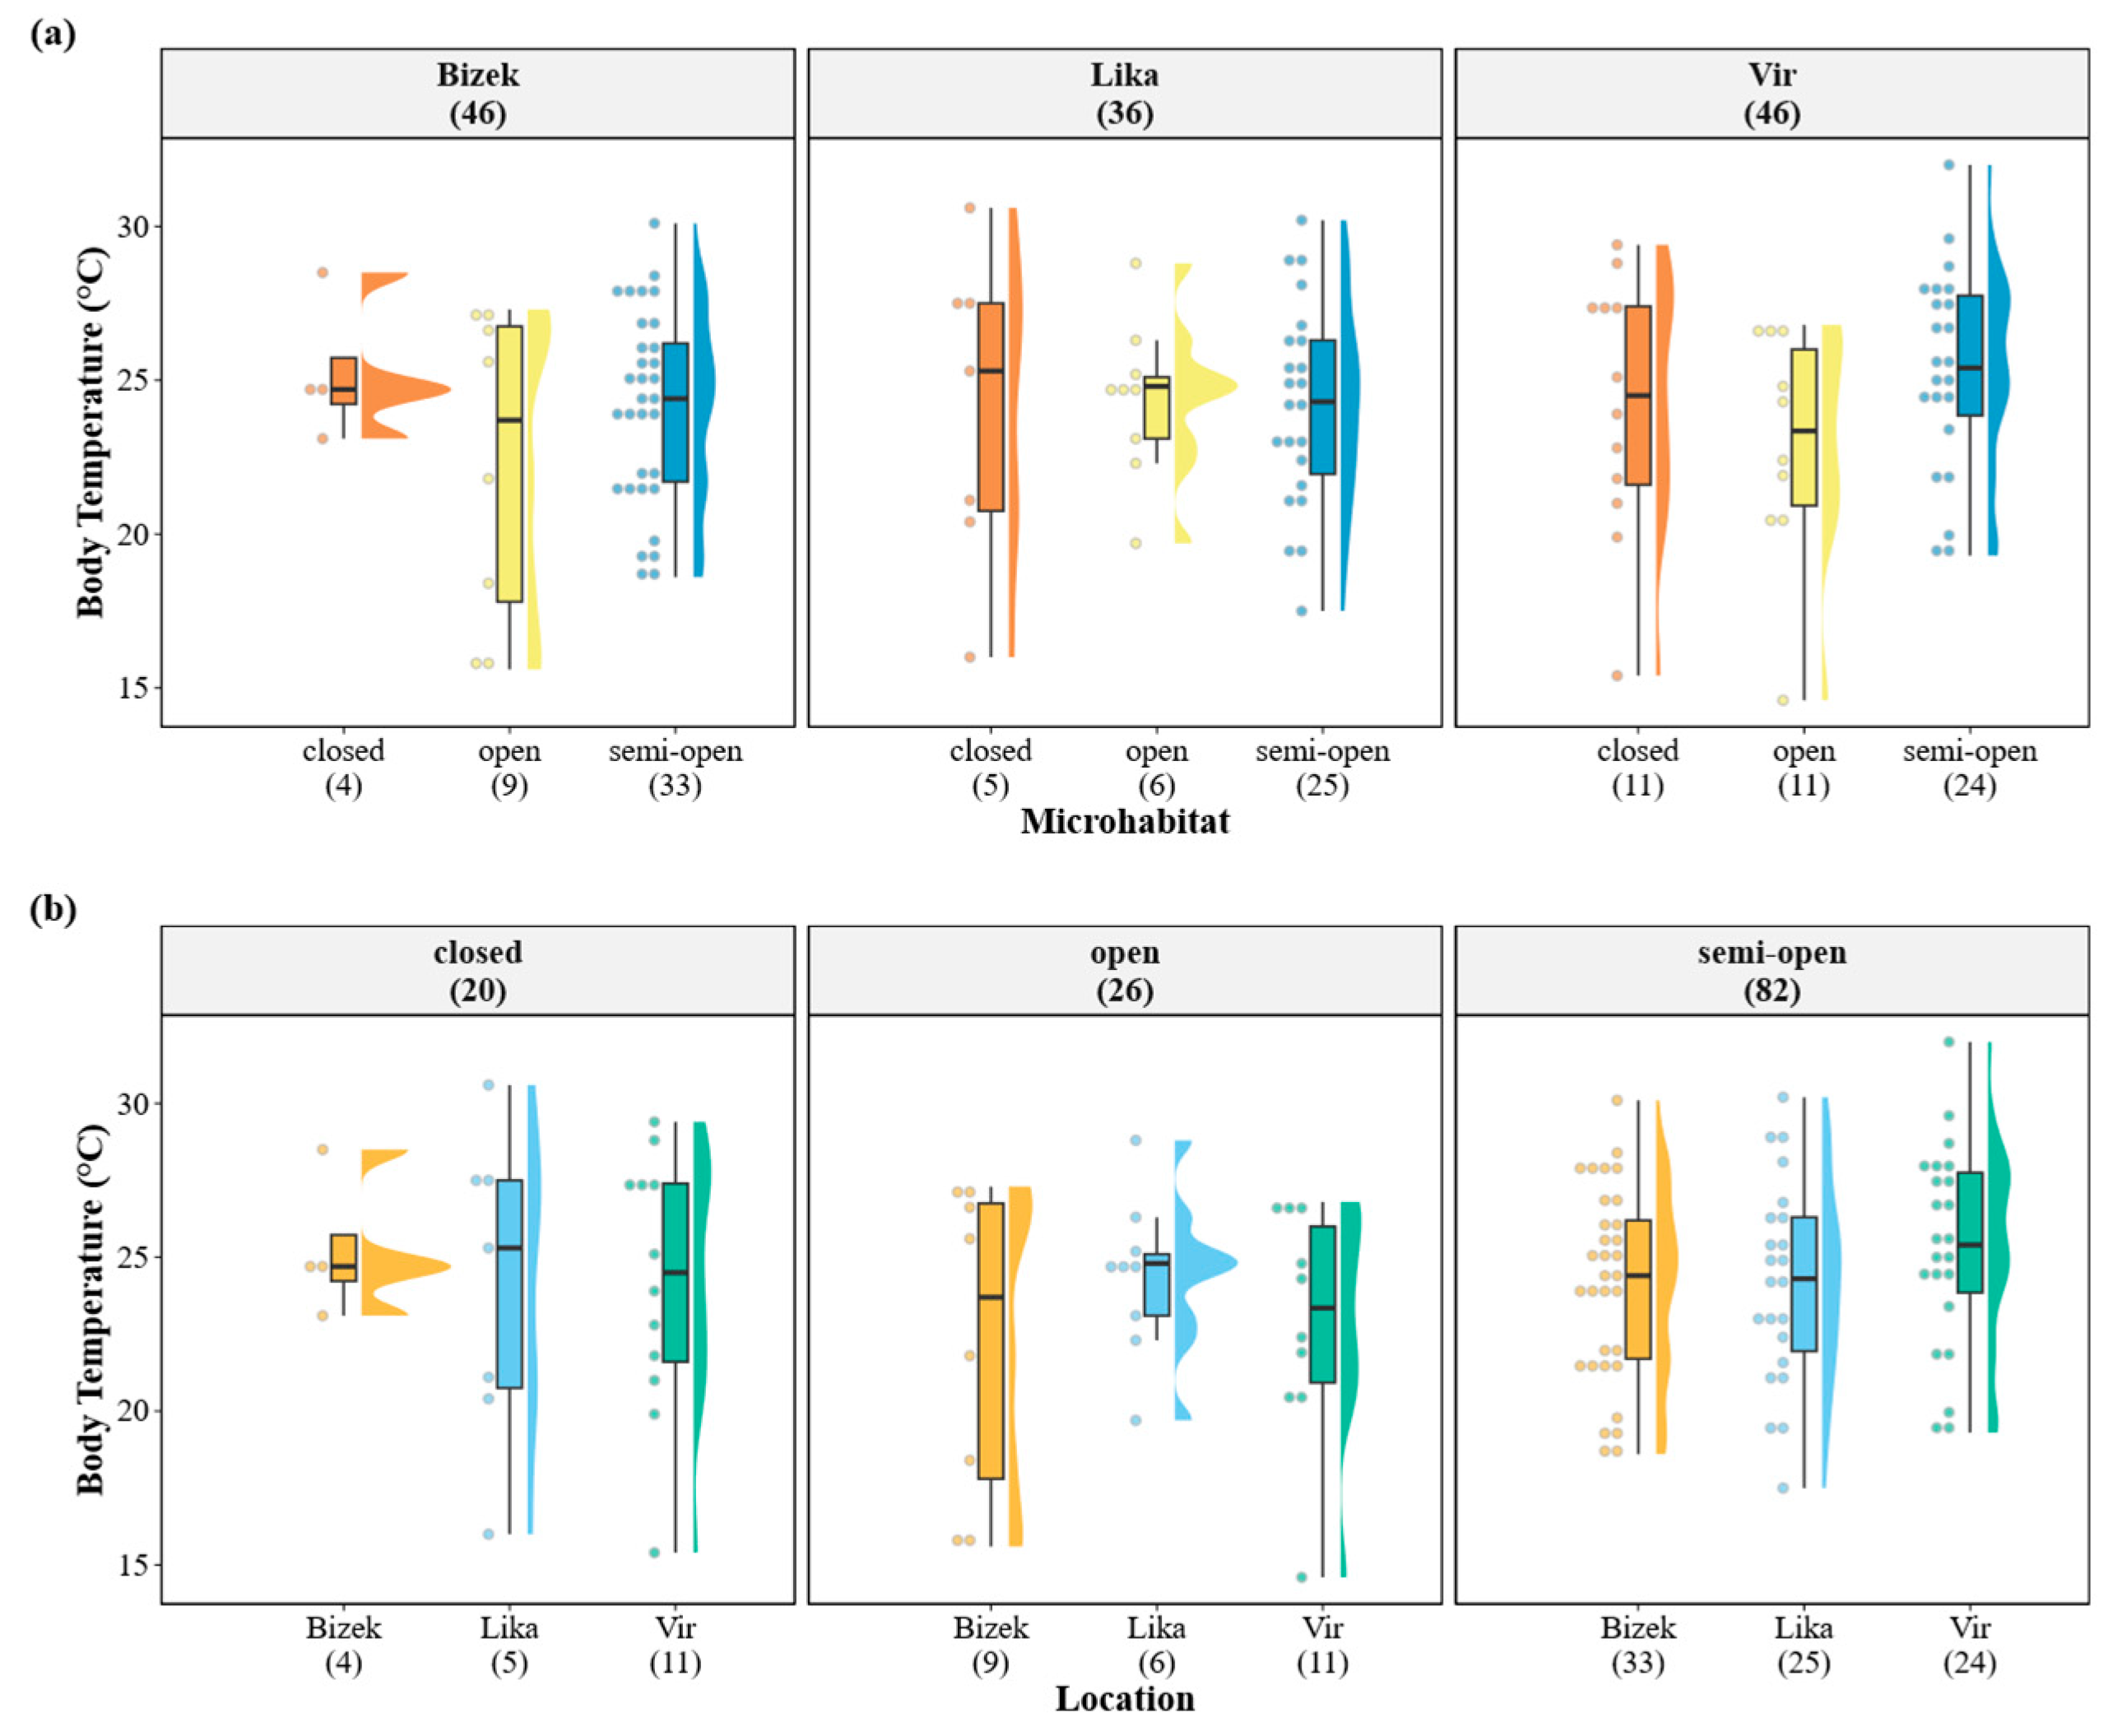
Figure A9.
Relationship between time of day and field body temperature (Tb) across locations in Vipera ammodytes. Each facet displays data from a single location (sample size in parentheses). Positive slopes indicate increasing field body temperature throughout the day; negative slopes indicate the opposite pattern. Points represent individual observations; lines indicate ordinary least squares regression fits with 95% confidence bands (shaded areas), extended across the full observed time range for visual comparison. Time of day is shown as decimal time.
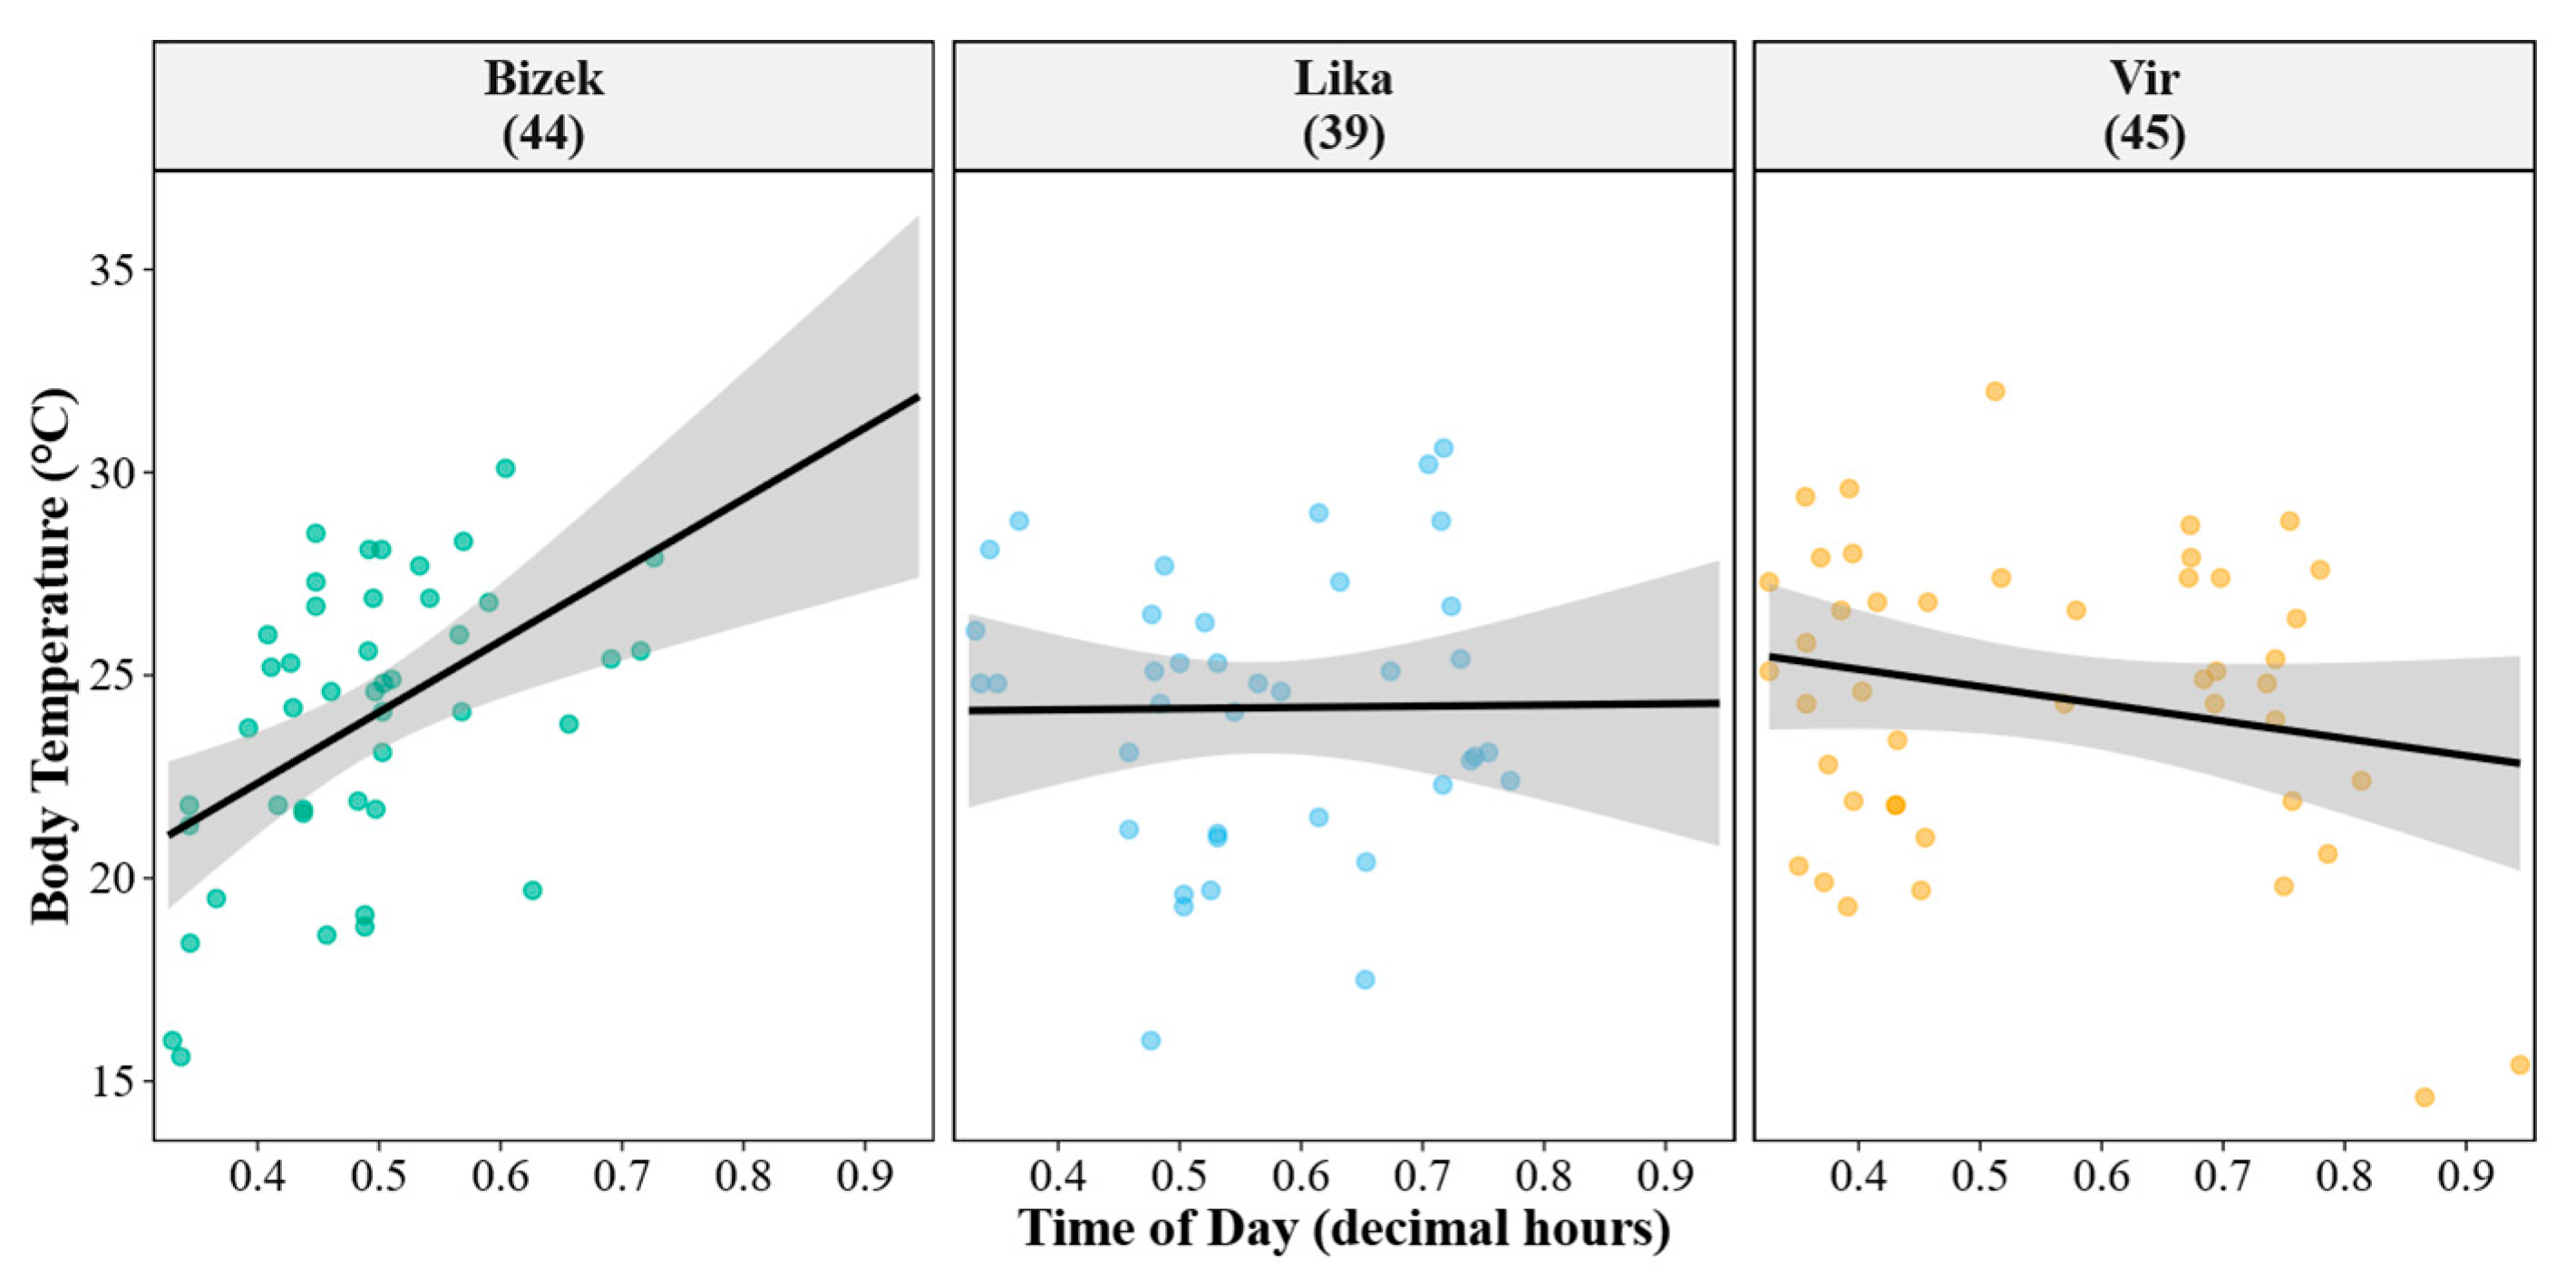
Figure A10.
Relationship between body size (SVL) and field body temperature (Tb) across locations in Vipera ammodytes. Each facet displays data from a single location (sample size in parentheses). Points represent individual observations; lines indicate ordinary least squares regression fits with 95% confidence bands (shaded areas). Positive slopes indicate that larger individuals exhibit higher field Tb; negative slopes indicate the opposite pattern.
References
- Barham, K.E.; Dwyer, R.G.; Frere, C.H.; Bentley, L.K.; Baker, C.J.; Campbell, H.A.; Irwin, T.R.; Franklin, C.E. Cooling down Is as Important as Warming up for a Large-Bodied Tropical Reptile. Proc. R. Soc. B Biol. Sci. 2024, 291, 20241804. [Google Scholar] [CrossRef] [Scilit] [PubMed]
- Flouris, A.D.; Piantoni, C. Links between Thermoregulation and Aging in Endotherms and Ectotherms. Temperature 2015, 2, 73–85. [Google Scholar] [CrossRef] [Scilit]
- Stevenson, R.D. The Relative Importance of Behavioral and Physiological Adjustments Controlling Body Temperature in Terrestrial Ectotherms. Am. Nat. 1985, 126, 362–386. [Google Scholar] [CrossRef] [Scilit]
- Andrade, D.V.; Gavira, R.S.B.; Tattersall, G.J. Thermogenesis in Ectothermic Vertebrates. Temperature 2015, 2, 454. [Google Scholar] [CrossRef] [Scilit]
- Parmesan, C. Ecological and Evolutionary Responses to Recent Climate Change. Annu. Rev. Ecol. Evol. Syst. 2006, 37, 637–669. [Google Scholar] [CrossRef] [Scilit]
- Huey, R.B.; Stevenson, R.D. Integrating Thermal Physiology and Ecology of Ectotherms: A Discussion of Approaches. Am. Zool. 1979, 19, 357–366. [Google Scholar] [CrossRef] [Scilit]
- Lailvaux, S.P. Interactive Effects of Sex and Temperature on Locomotion in Reptiles. Integr. Comp. Biol. 2007, 47, 189–199. [Google Scholar] [CrossRef] [Scilit]
- Pough, F.H.; Andrews, R.M.; Crump, M.L.; Savitzky, A.H.; Wells, K.D.; Brandley, M.C. Herpetology, 4th ed.; Sinauer Associates, Inc.: Sunderland, MA, USA, 2016. [Google Scholar]
- Lourdais, O.; Guillon, M.; DeNardo, D.; Blouin-Demers, G. Cold Climate Specialization: Adaptive Covariation between Metabolic Rate and Thermoregulation in Pregnant Vipers. Physiol. Behav. 2013, 119, 149–155. [Google Scholar] [CrossRef] [Scilit]
- Grbac, I.; Leiner, S.; Perović, F. Thermoregulation and Diet Composition of Insular Populations of Podarcis melisellensis and Lacerta oxycephala. In Proceedings of the Abstracts of the 3rd International Symposium on the Lacertids of the Mediterranean Basin; CHS–Hyla: Cres, Croatia, 1998; p. 38. [Google Scholar]
- Rajabizadeh, M.; Adriaens, D.; Kaboli, M.; Sarafraz, J.; Ahmadi, M. Dorsal Colour Pattern Variation in Eurasian Mountain Vipers (Genus Montivipera): A Trade-off between Thermoregulation and Crypsis. Zool. Anz. 2015, 257, 1–9. [Google Scholar] [CrossRef] [Scilit]
- Bennett, S.; Duarte, C.M.; Marbà, N.; Wernberg, T. Integrating Within-Species Variation in Thermal Physiology into Climate Change Ecology. Philos. Trans. R. Soc. B Biol. Sci. 2019, 374, 20180550. [Google Scholar] [CrossRef] [Scilit]
- Mizsei, E.; Radovics, D.; Rák, G.; Budai, M.; Bancsik, B.; Szabolcs, M.; Sos, T.; Lengyel, S. Alpine Viper in Changing Climate: Thermal Ecology and Prospects of a Cold-Adapted Reptile in the Warming Mediterranean. Sci. Rep. 2024, 14, 18988. [Google Scholar] [CrossRef] [Scilit] [PubMed]
- Rodríguez-Serrano, E.; Navas, C.A.; Bozinovic, F. The Comparative Field Body Temperature among Liolaemus Lizards: Testing the Static and the Labile Hypotheses. J. Therm. Biol. 2009, 34, 306–309. [Google Scholar] [CrossRef] [Scilit]
- Clarke, A. Principles of Thermal Ecology: Temperature, Energy, and Life; Oxford University Press: Oxford, UK, 2017; Volume 1. [Google Scholar]
- Sagonas, K.; Meiri, S.; Valakos, E.D.; Pafilis, P. The Effect of Body Size on the Thermoregulation of Lizards on Hot, Dry Mediterranean Islands. J. Therm. Biol. 2013, 38, 92–97. [Google Scholar] [CrossRef] [Scilit]
- Naulleau, G. The Effects of Temperature on Digestion in Vipera aspis. J. Herpetol. 1983, 17, 166–170. [Google Scholar] [CrossRef] [Scilit]
- Bowker, R.G.; Wright, C.L.; Bowker, G.E. Patterns of Body Temperatures: Is Lizard Thermoregulation Chaotic? J. Therm. Biol. 2010, 35, 1–5. [Google Scholar] [CrossRef] [Scilit]
- Čubrić, T.; Stamenković, G.; Ilić, M.; Crnobrnja-Isailović, J. Contribution to the Phylogeography of the Nose-Horned Viper (Vipera ammodytes, Linnaeus, 1758) in the Central Balkan Peninsula. Arch. Biol. Sci. 2019, 71, 463–468. [Google Scholar] [CrossRef] [Scilit]
- Dyugmedzhiev, A.; Naumov, B.; Tzankov, N. Thermal Ecology of the Nose-Horned Viper (Vipera ammodytes (Linnaeus, 1758)) under Natural Conditions. North-West. J. Zool. 2021, 17, 44–56. [Google Scholar]
- Lillywhite, H.B. How Snakes Work: Structure, Function and Behavior of the World’s Snakes; Oxford University Press: Oxford, UK; New York, NY, USA, 2014. [Google Scholar]
- Radovics, D.; Sos, T.; Mebert, K.; Üveges, B.; Budai, M.; Rák, G.; Szabolcs, M.; Lengyel, S.; Mizsei, E. Voluntary Thermal Maximum of Grassland Vipers (Vipera spp.): Environmental Drivers and Local Adaptation. Zool. J. Linn. Soc. 2024, 201, 159–168. [Google Scholar] [CrossRef] [Scilit]
- Diaz-Ricaurte, J.C.; Serrano, F.C.; Camacho, A.; de Nogueira, C.C.; Travaglia-Cardoso, S.R.; Martins, M. On the Brink of Change? Environmental Drivers of Voluntary Thermal Maximum in South American Pitvipers. J. Biogeogr. 2025, 52, 66–79. [Google Scholar] [CrossRef] [Scilit]
- DeNardo, D.F.; Luna, J.V.; Hwang, M. Ambient Temperature Activity of Horned Adders, Bitis caudalis: How Cold Is Too Cold? J. Herpetol. 2002, 36, 688–691. [Google Scholar] [CrossRef]
- Arnold, N.; Ovenden, D. Reptiles and Amphibians of Britain and Europe; Harper Collins Publishers: London, UK, 2004. [Google Scholar]
- Karaman, S. Über die Verbreitung der Reptilien in Jugoslavien; Annales Musei Serbiae Meridionalis: Skoplje, North Macedonia, 1939; Volume 1, pp. 1–20. [Google Scholar]
- De Smedt, J. The Vipers of Europe; JDS: Halblech, Germany, 2006. [Google Scholar]
- Speybroeck, J.; Beukema, W.; Bok, B.; van der Voort, J.; Velikov, I. Field Guide to the Amphibians and Reptiles of Britain and Europe; Bloomsbury Publishing Plc: London, UK, 2016. [Google Scholar]
- Bagnoli, C.; Cattaneo, A. Note sulla biologia di Vipera ammodytes (L.) in alcune località del Friuli (Italia NE). Bolletino Soc. Nat. “Silvia Zenari” 2008, 32, 103–119. [Google Scholar]
- Luiselli, L. Food Habits of an Alpine Population of the Sand Viper (Vipera ammodytes). J. Herpetol. 1996, 30, 92–94. [Google Scholar] [CrossRef] [Scilit]
- Zadravec, M. Biologija Poskoka Vipera ammodytes (Linnaeus, 1758) u Kamenolomu Bizek. Master’s Thesis, Sveučilište u Zagrebu, Prirodoslovno-Matematički Fakultet, Zagreb, Croatia, 2014. [Google Scholar]
- Díaz, J.A.; Izquierdo-Santiago, R.; Llanos-Garrido, A. Lizard Thermoregulation Revisited after Two Decades of Global Warming. Funct. Ecol. 2022, 36, 3022–3035. [Google Scholar] [CrossRef] [Scilit]
- Čubrić, T.; Crnobrnja-Isailović, J. Limited Body Temperature Variation in the Vipera ammodytes (Linnaeus, 1758) During Six Years Study; Program & Book of abstracts, 21st European Congress of Herpetology; Institute for Biological Research “Siniša Stanković”, National Institute of Republic of Serbia: Belgrade, Serbia, 2022. [Google Scholar]
- Čubrić, T.; Bonnet, X.; Crnobrnja-Isailović, J. Body Size and Body Condition in the Nose-Horned Viper (Vipera ammodytes): Effects of Sex and Populations. Herpetozoa 2023, 36, 53–58. [Google Scholar] [CrossRef] [Scilit]
- Dyugmedzhiev, A.V.; Naumov, B.Y.; Tzankov, N.D. Interpopulation and Seasonal Variations in Habitat and Microhabitat Use of Vipera ammodytes. Acta Herpetol. 2024, 19, 81–95. [Google Scholar] [CrossRef] [Scilit]
- Jaramillo-Alba, J.L.; Díaz de la Vega-Pérez, A.H.; Bucio-Jiménez, L.E.; Méndez-De la Cruz, F.R.; Pérez-Mendoza, H.A. Comparative Thermal Ecology Parameters of the Mexican Dusky Rattlesnake (Crotalus triseriatus). J. Therm. Biol. 2020, 92, 102695. [Google Scholar] [CrossRef] [Scilit]
- Zadravec, M.; Koren, T. Further Evidence of Nocturnal Activity of Vipera ammodytes (Linnaeus, 1758). Herpetozoa 2017, 30, 107–108. [Google Scholar]
- Wüster, W.; Böhme, W.; Denzer, W.; Kaiser, H. Nomenclatural Historians Are Kindly Requested to Respect the Intent of the Code: “Nomenclatural Parsimony” and the Case of the Nose-Horned Viper, Vipera ammodytes (Linnaeus, 1758). Zootaxa 2025, 5696, 385–397. [Google Scholar] [CrossRef] [Scilit] [PubMed]
- Krecsák, L.; Bauer, A.M.; Tomović, L.; Schweiger, S.; Westerström, A. A Valid Neotype Designation for Vipera illyrica Laurenti, 1768. Salamandra 2025, 61, 362–363. [Google Scholar]
- Ursenbacher, S.; Schweiger, S.; Tomović, L.; Crnobrnja-Isailović, J.; Fumagalli, L.; Mayer, W. Molecular Phylogeography of the Nose-Horned Viper (Vipera ammodytes, Linnaeus (1758)): Evidence for High Genetic Diversity and Multiple Refugia in the Balkan Peninsula. Mol. Phylogenet. Evol. 2008, 46, 1116–1128. [Google Scholar] [CrossRef] [Scilit]
- Tomović, L. Systematics of the Nose-Horned Viper (Vipera ammodytes, Linnaeus, 1758). Herpetol. J. 2006, 16, 191–201. [Google Scholar]
- Lozić, S.; Radoš, D. Klimatske značajke otoka Vira. In Otok Vir; Magaš, D., Ed.; Sveučilište u Zadru, Općina Vir: Zadar, Croatia, 2016; pp. 61–78. [Google Scholar]
- Zadravec, M.; Cesarec, R.; Tadić, Z. Biology of the Nose-Horned Viper in the Bizek Quarry. In Proceedings of the Croatian Biological Congress, Sv. Martin na Muri, Croatia, 18–23 September 2015. [Google Scholar]
- Mader, D.R. Reptile Medicine and Surgery, 2nd ed.; Elsevier Saunders: Philadelphia, PA, USA, 2006. [Google Scholar]
- Cruz, M.A. Effectiveness of Manual Palpation in the Northern Water Snake, Nerodia Sipedon Sipedon, as a Method to Extract Gut Contents for Dietary Studies. Master’s Thesis, Marshall University, Huntington, WV, USA, 2013. [Google Scholar]
- Fitch, H.S. Collecting and Life-History Techniques. In Life History of Snakes Snakes: Ecology and Evolutionary Biology; Seiel, R.A., Collins, J.T., Novak, S.S., Eds.; Macmillan Publishing Company: New York, NY, USA, 1988; Volume 38, pp. 716–717. [Google Scholar]
- Spellerberg, I.F. Marking Live Snakes for Identification of Individuals in Population Studies. J. Appl. Ecol. 1977, 14, 137–138. [Google Scholar] [CrossRef] [Scilit]
- EEA Biogeographical Regions in Europe. Available online: https://www.eea.europa.eu/en/analysis/maps-and-charts/biogeographical-regions-in-europe-2 (accessed on 30 October 2024).
- R Core Team R: The R Project for Statistical Computing. Available online: https://www.r-project.org/ (accessed on 11 December 2024).
- R Core Team. R A Language and Environment for Statistical Computing; R Core Team: Vienna, Austria, 2024. [Google Scholar]
- Bartoń, K. MuMIn: Multi-Model Inference; R Core Team: Vienna, Austria, 2020. [Google Scholar]
- Wickham, H.; François, R.; Henry, L.; Müller, K.; Vaughan, D. Dplyr: A Grammar of Data Manipulation; Posit: Boston, MA, USA, 2023. [Google Scholar]
- Fox, J.; Weisberg, S. An R Companion to Applied Regression; SAGE Publications, Inc.: Thousand Oaks, CA, USA, 2019. [Google Scholar]
- Wickham, H. Ggplot2: Elegant Graphics for Data Analysis; Springer: New York, NY, USA, 2016. [Google Scholar]
- Gelman, A. Scaling Regression Inputs by Dividing by Two Standard Deviations. Stat. Med. 2008, 27, 2865–2873. [Google Scholar] [CrossRef] [Scilit]
- Burnham, K.P.; Anderson, D.R. (Eds.) Model Selection and Multimodel Inference, 2nd ed.; Springer: New York, NY, USA, 2002. [Google Scholar]
- Grueber, C.E.; Nakagawa, S.; Laws, R.J.; Jamieson, I.G. Multimodel Inference in Ecology and Evolution: Challenges and Solutions. J. Evol. Biol. 2011, 24, 699–711. [Google Scholar] [CrossRef] [Scilit]
- Galipaud, M.; Gillingham, M.A.F.; David, M.; Dechaume-Moncharmont, F. Ecologists Overestimate the Importance of Predictor Variables in Model Averaging: A Plea for Cautious Interpretations. Methods Ecol. Evol. 2014, 5, 983–991. [Google Scholar] [CrossRef] [Scilit]
- Ortega, Z.; Mencía, A.; Pérez-Mellado, V. Wind Constraints on the Thermoregulation of High Mountain Lizards. Int. J. Biometeorol. 2017, 61, 565–573. [Google Scholar] [CrossRef] [Scilit] [PubMed]
- Campbell, G.S.; Norman, J.M. An Introduction to Environmental Biophysics; Springer: New York, NY, USA, 1998. [Google Scholar]
- Blouin-Demers, G.; Weatherhead, P.J. Habitat-Specific Behavioural Thermoregulation by Black Rat Snakes (Elaphe obsoleta obsoleta). Oikos 2002, 97, 59–68. [Google Scholar] [CrossRef] [Scilit]
- Maia-Carneiro, T.; Rocha, C.F.D. Wind Decreases Microhabitat and Body Temperature in Populations of Endangered Brazilian Sand Lizards. Herpetol. Conserv. Biol. 2025, 20, 12–18. [Google Scholar]
- Bovo, R.; Marques, O.; Andrade, D. When Basking Is Not an Option: Thermoregulation of a Viperid Snake Endemic to a Small Island in the South Atlantic of Brazil. Copeia 2012, 2012, 408–418. [Google Scholar] [CrossRef] [Scilit]
- Vilaj, I. Riđovka, Vipera berus (Squamata, Viperidae) u Hrvatskoj: Populacijska Ekologija, Odabir Mikrostaništa i Termoregulacija. Master’s Thesis, Sveučilište u Zagrebu, Prirodoslovno-Matematički Fakultet, Zagreb, Croatia, 2012. [Google Scholar]
- Burić, I. Populacijske, Merističke i Morfološke Značajke Svojte Vipera ursinii macrops (Mehely, 1911). Master’s Thesis, Sveučilište u Zagrebu, Sveučilište u Zagrebu Prirodoslovno-Matematički Fakultet, Biološki Odsjek, Zagreb, Croatia, 2012. [Google Scholar]
- Whitaker, P.B.; Shine, R. When, Where and Why Do People Encounter Australian Brownsnakes (Pseudonaja textilis: Elapidae)? Wildl. Res. 1999, 26, 675. [Google Scholar] [CrossRef] [Scilit]
- Butler, H.; Malone, B.; Clemann, N. Activity Patterns and Habitat Preferences of Translocated and Resident Tiger Snakes (Notechis scutatus) in a Suburban Landscape. Wildl. Res. 2005, 32, 157–163. [Google Scholar] [CrossRef] [Scilit]
- Burić, I.; Lauš, B.; Kranželić, D.; Koller Šarić, K. Program Praćenja Stanja Očuvanosti Zmija, Blavora i Kopnene Kornjače Na Području Hrvatske; Usluga Razvoja Programa Praćenja za vrste i Stanišne Tipove od Interesa za EU u Sklopu OPKK Projekta “Razvoj Sustava Praćenja Stanja Vrsta i Stanišnih Tipova”; Udruga Hyla: Zagreb, Croatia, 2023; p. 231. [Google Scholar]
- Gontijo, A.S.B.; Garcia, C.S.; Righi, A.F.; Galdino, C.A.B. To Warm on the Rocks, to Cool in the Wind: Thermal Relations of a Small-Sized Lizard from a Mountain Environment. J. Therm. Biol. 2018, 76, 52–57. [Google Scholar] [CrossRef] [Scilit]
- Spears, S.; Pettit, C.; Berkowitz, S.; Collier, S.; Colwell, C.; Livingston, E.H.; McQueen, W.; Vaughn, P.L.; Bodensteiner, B.L.; Leos-Barajas, V.; et al. Lizards in the Wind: The Impact of Wind on the Thermoregulation of the Common Wall Lizard. J. Therm. Biol. 2024, 121, 103855. [Google Scholar] [CrossRef] [Scilit] [PubMed]
- Fei, T.; Skidmore, A.K.; Venus, V.; Wang, T.; Schlerf, M.; Toxopeus, B.; Van Overjijk, S.; Bian, M.; Liu, Y. A Body Temperature Model for Lizards as Estimated from the Thermal Environment. J. Therm. Biol. 2012, 37, 56–64. [Google Scholar] [CrossRef] [Scilit]
- Virens, E.; Cree, A. Wind of Change: A Diurnal Skink Thermoregulates between Cooler Set-Points and for an Increased Amount of Time in the Presence of Wind. J. Exp. Biol. 2022, 225, jeb244038. [Google Scholar] [CrossRef] [Scilit] [PubMed]
- Secor, S.M. Regulation of Digestive Performance: A Proposed Adaptive Response. Comp. Biochem. Physiol. Part A Mol. Integr. Physiol. 2001, 128, 565–577. [Google Scholar] [CrossRef] [Scilit] [PubMed]
- Secor, S.M.; Nagy, K.A. Bioenergetic Correlates of Foraging Mode for the Snakes Crotalus Cerastes and Masticophis Flagellum. Ecology 1994, 75, 1600–1614. [Google Scholar] [CrossRef] [Scilit]
- Muñoz, M.M.; Losos, J.B. Thermoregulatory Behavior Simultaneously Promotes and Forestalls Evolution in a Tropical Lizard. Am. Nat. 2018, 191, E15–E26. [Google Scholar] [CrossRef] [Scilit]
- Row, J.R.; Blouin-Demers, G. Thermal Quality Influences Effectiveness of Thermoregulation, Habitat Use, and Behaviour in Milk Snakes. Oecologia 2006, 148, 1–11. [Google Scholar] [CrossRef] [Scilit]
- Olalla-Tárraga, M.Á.; Rodríguez, M.Á.; Hawkins, B.A. Broad-Scale Patterns of Body Size in Squamate Reptiles of Europe and North America. J. Biogeogr. 2006, 33, 781–793. [Google Scholar] [CrossRef] [Scilit]
- Fierro-Estrada, N.; González, Y.G.G.; Miles, D.B.; Gómez, M.M.; García, A.; Salgado-Ugarte, I.H.; Cruz, F.R.M. de la Thermoregulation of the Lizard Barisia Imbricata at Altitudinal Extremes. Amphibia-Reptilia 2019, 40, 349–360. [Google Scholar] [CrossRef] [Scilit]
- Gainsbury, A.M. Influence of Size, Sex, and Reproductive Status on the Thermal Biology of Endemic Florida Scrub Lizards. Ecol. Evol. 2020, 10, 13080–13086. [Google Scholar] [CrossRef] [Scilit] [PubMed]
- Huey, R.B.; Pianka, E.R. Lizard Thermal Biology: Do Genders Differ? Am. Nat. 2007, 170, 473–478. [Google Scholar] [CrossRef] [PubMed]
- Burić, I.; Kranželić, D.; Lauš, B. Izvješće o Terenskom Istraživanju u Okviru Testiranja Programa Praćenja i Ocjena Stanja Očuvanosti Vrste za Poskoka (Vipera ammodytes)—GRUPA 9: “Izrada i Razvoj Programa Praćenja Stanja za Herpetofaunu s Jačanjem Kapaciteta Dionika Sustava Praćenja i Izvješćivanja”; Usluga Razvoja Programa Praćenja za Vrste i Stanišne Tipove od Interesa za EU u Sklopu OPKK Projekta “Razvoj Sustava Praćenja Stanja Vrsta i Stanišnih Tipova”; Udruga Hyla: Zagreb, Croatia, 2023; p. 35. [Google Scholar]
- DG Environment Reporting Under Article 17 of the Habitats Directive: Guidelines on Concepts and Definitions—Article 17 of Directive 92/43/EEC, Reporting Period 2019–2024; European Environment Agency, European Topic Centre on Biological Diversity, European Topic Centre on Biodiversity and Ecosystems: Brussels, Belgium, 2023; p. 104.
- Zadravec, M.; Gambiroža, P. Prvo Izvješće o Stanju Očuvanosti Vrsta Vodozemaca i Gmazova u Republici Hrvatskoj; Zagreb, Croatia, 2019; p. 77. [Google Scholar]
- Huey, R.B.; Kearney, M.R.; Krockenberger, A.; Holtum, J.A.M.; Jess, M.; Williams, S.E. Predicting Organismal Vulnerability to Climate Warming: Roles of Behaviour, Physiology and Adaptation. Philos. Trans. R. Soc. B Biol. Sci. 2012, 367, 1665–1679. [Google Scholar] [CrossRef] [Scilit] [PubMed]
- Sinervo, B.; Méndez-de-la-Cruz, F.; Miles, D.B.; Heulin, B.; Bastiaans, E.; Villagrán-Santa Cruz, M.; Lara-Resendiz, R.; Martínez-Méndez, N.; Calderón-Espinosa, M.L.; Meza-Lázaro, R.N.; et al. Erosion of Lizard Diversity by Climate Change and Altered Thermal Niches. Science 2010, 328, 894–899. [Google Scholar] [CrossRef] [Scilit]
- Sunday, J.M.; Bates, A.E.; Kearney, M.R.; Colwell, R.K.; Dulvy, N.K.; Longino, J.T.; Huey, R.B. Thermal-Safety Margins and the Necessity of Thermoregulatory Behavior across Latitude and Elevation. Proc. Natl. Acad. Sci. USA 2014, 111, 5610–5615. [Google Scholar] [CrossRef] [Scilit]
- Fox, J.; Monette, G. Generalized Collinearity Diagnostics. J. Am. Stat. Assoc. 1992, 87, 178–183. [Google Scholar] [CrossRef]
- Anderson, D.R.; Burnham, K.P.; Thompson, W.L. Null Hypothesis Testing: Problems, Prevalence and Alternative. J. Wildl. Manag. 2000, 64, 912–923. [Google Scholar] [CrossRef] [Scilit]
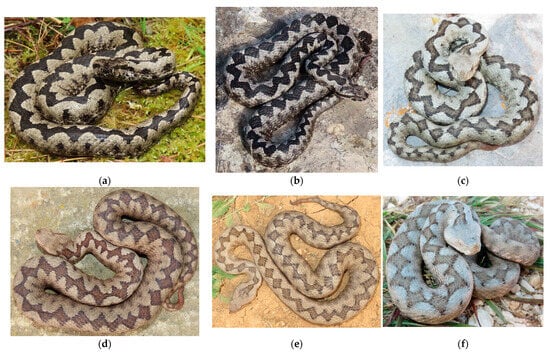
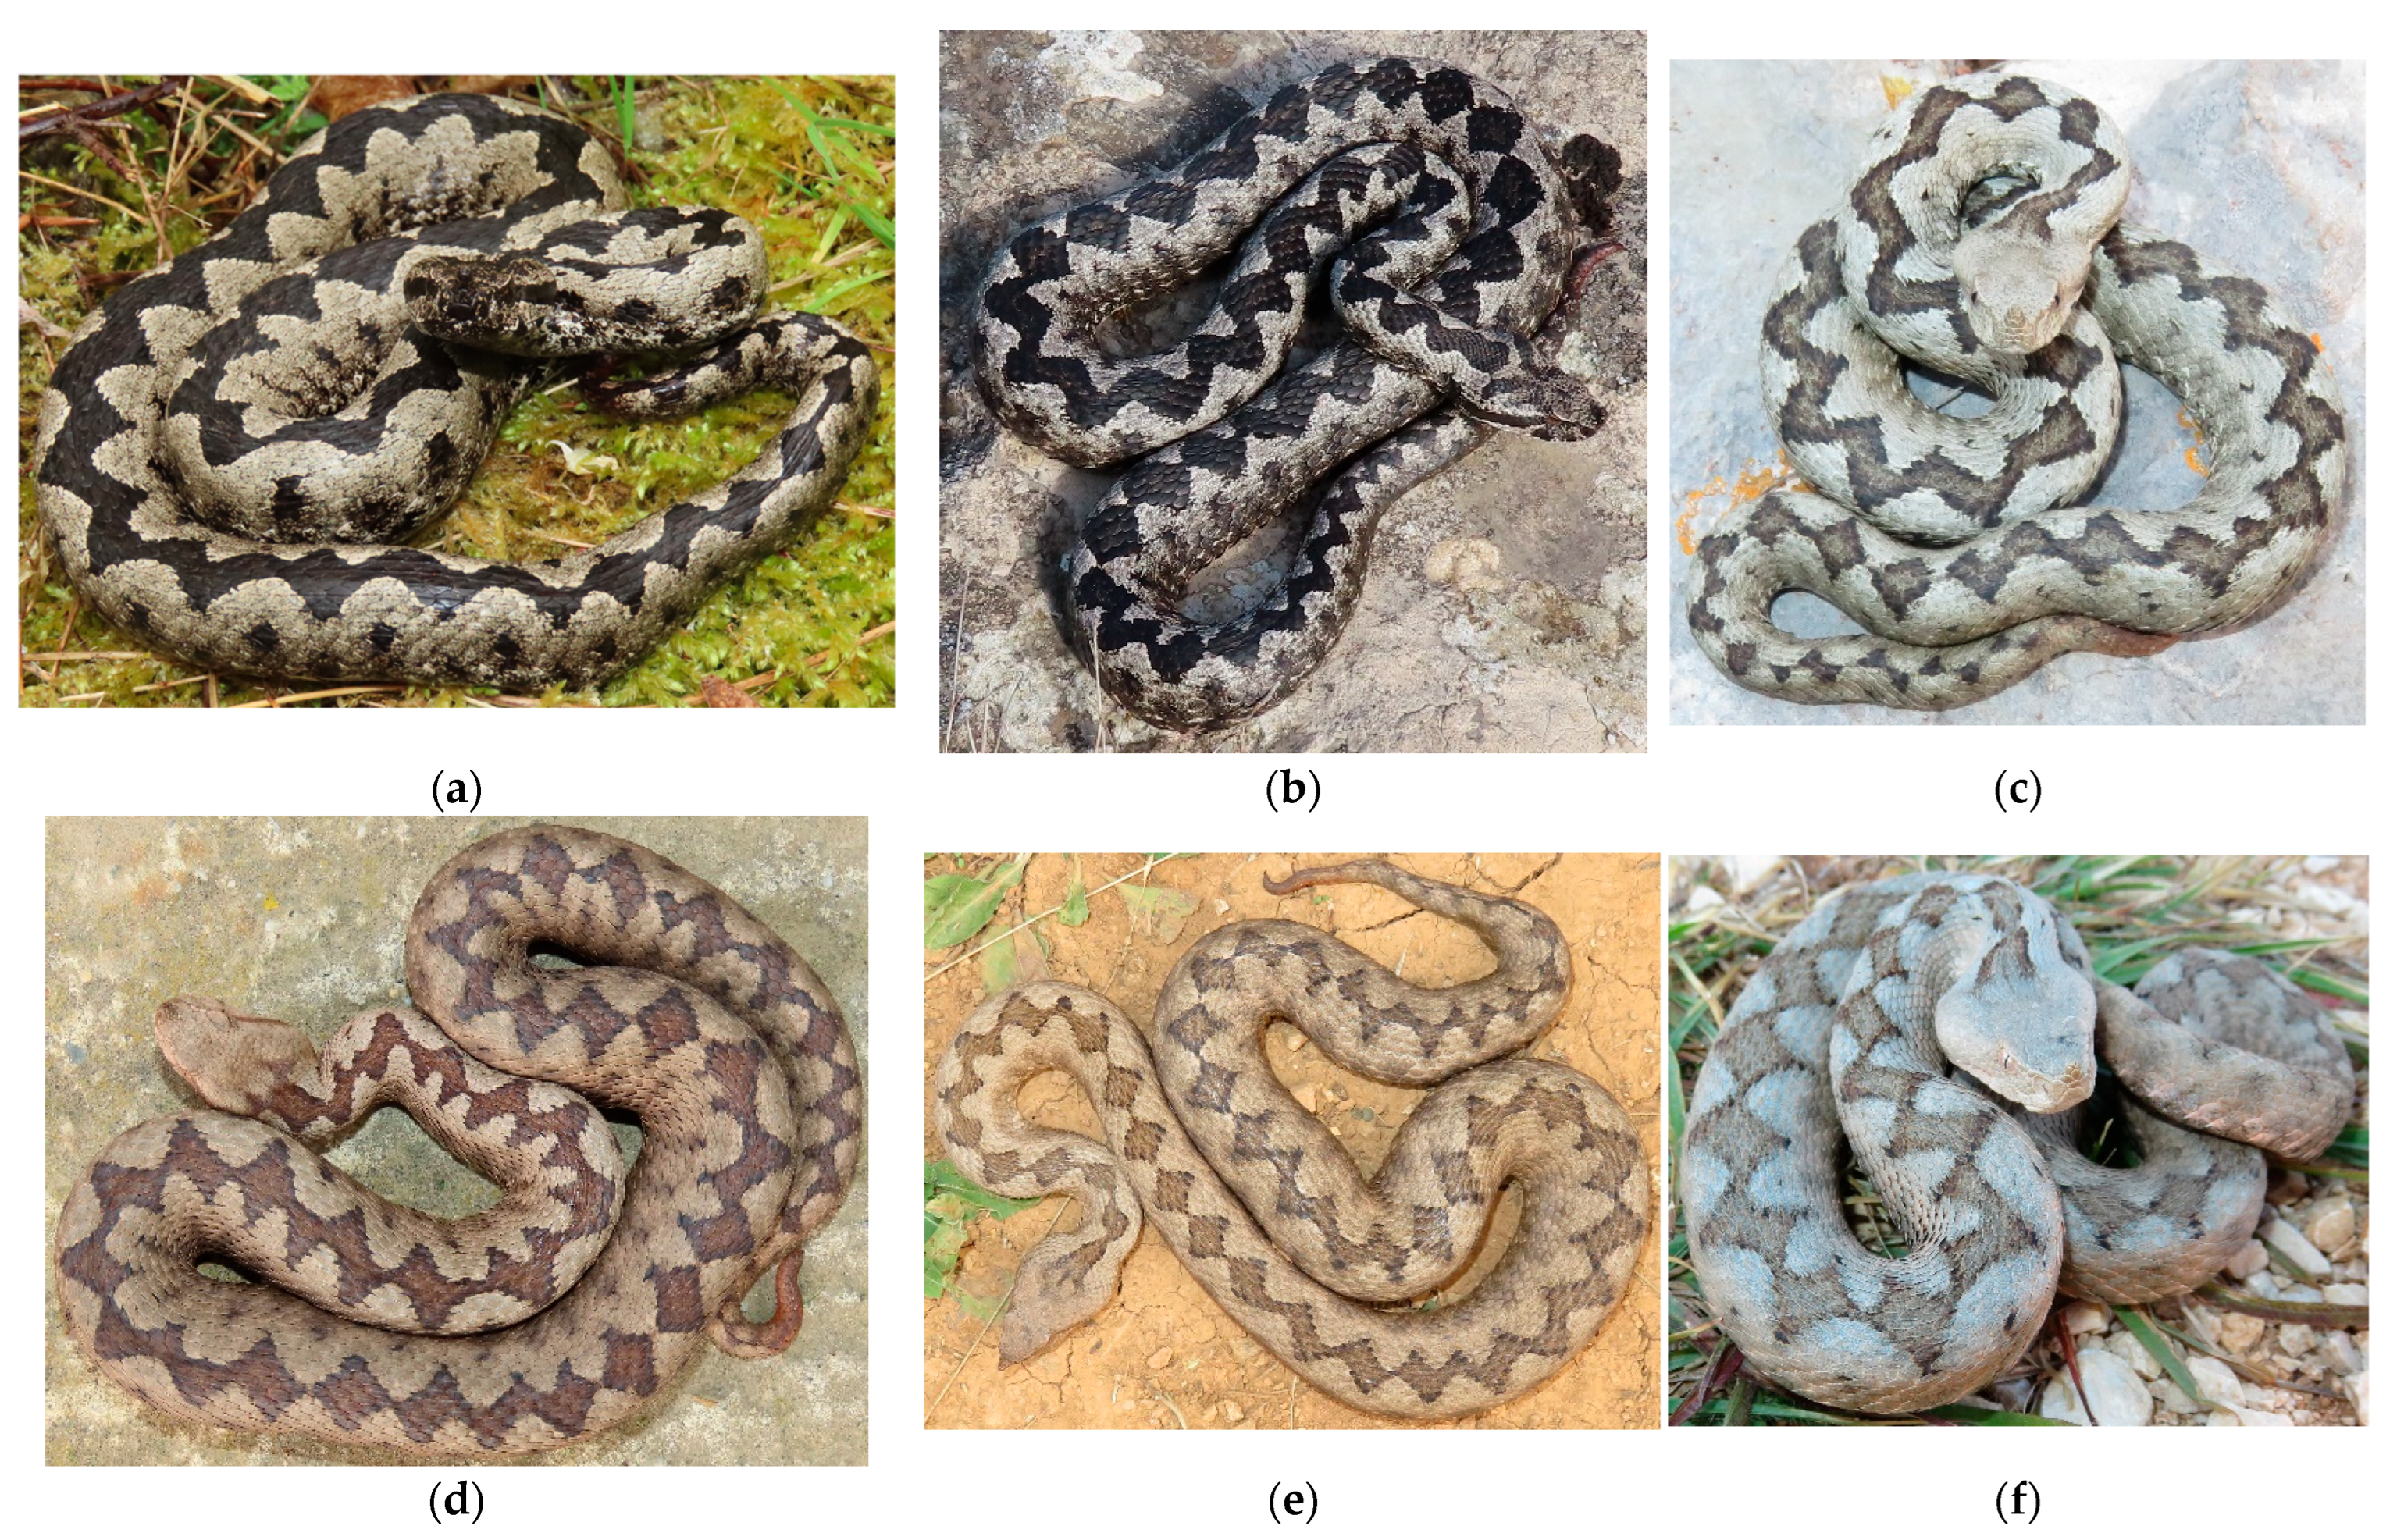
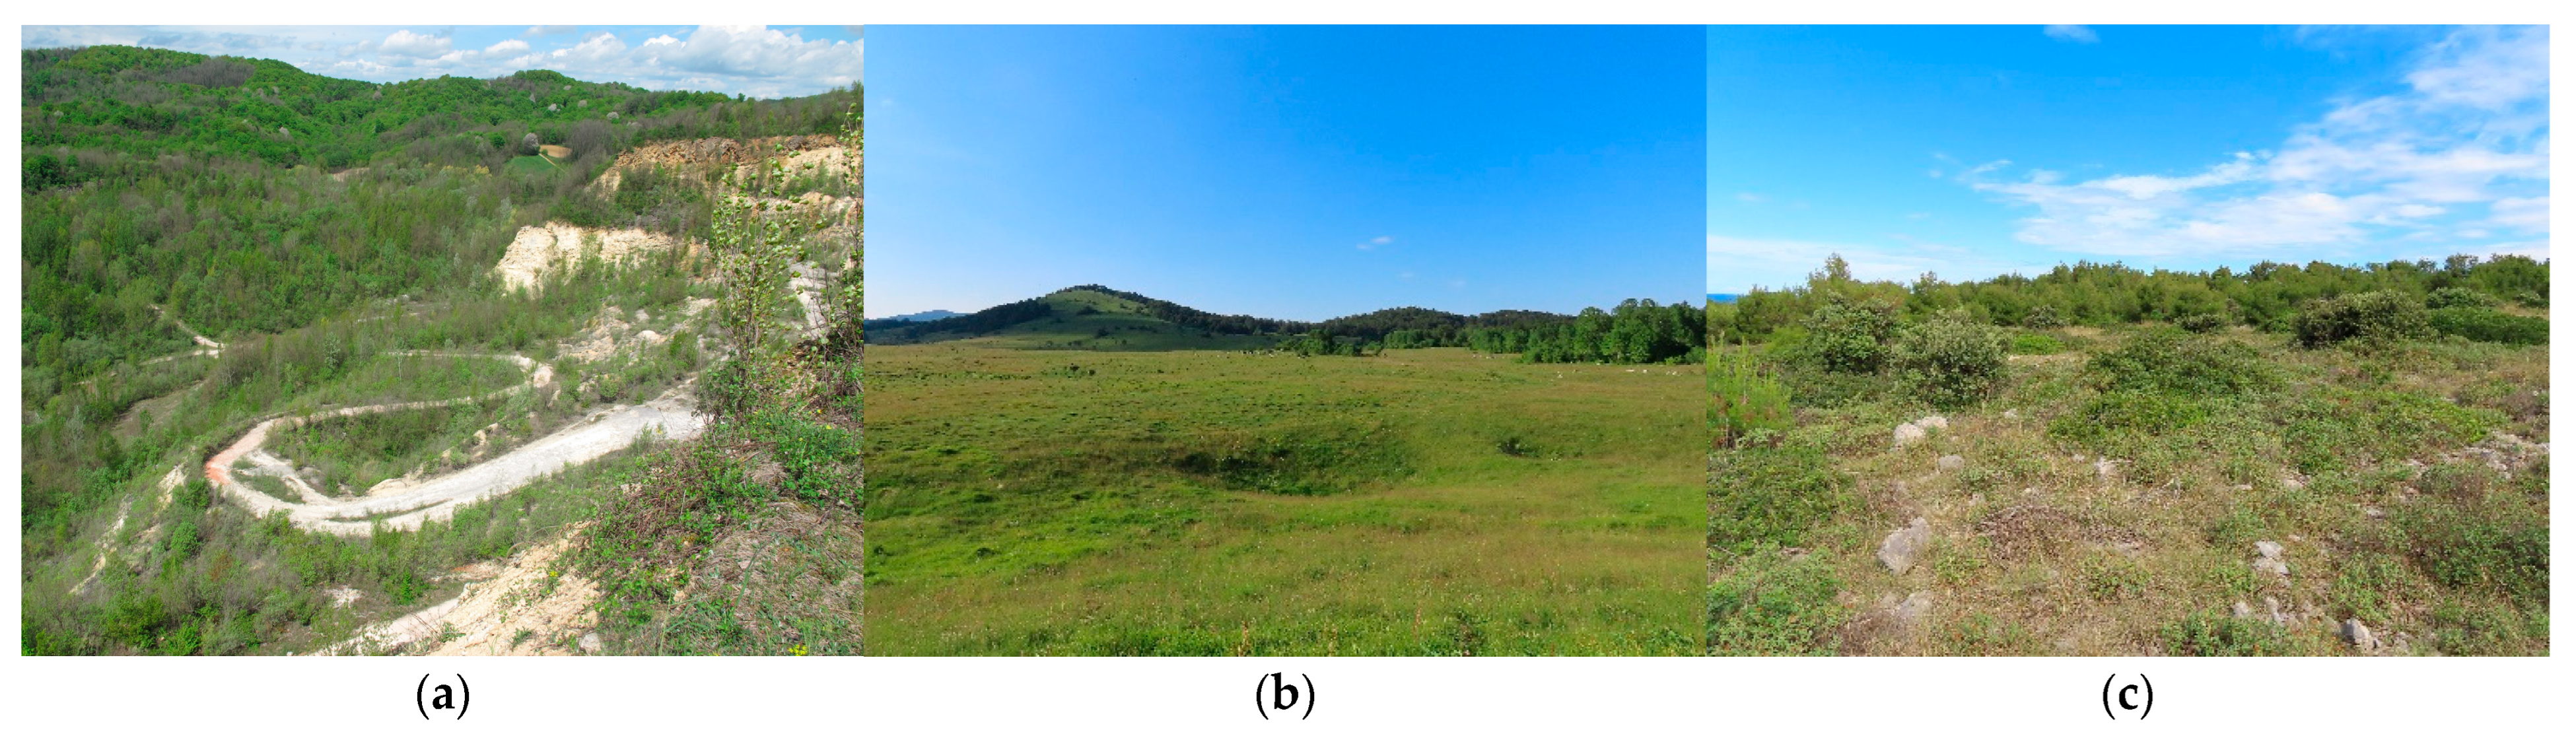
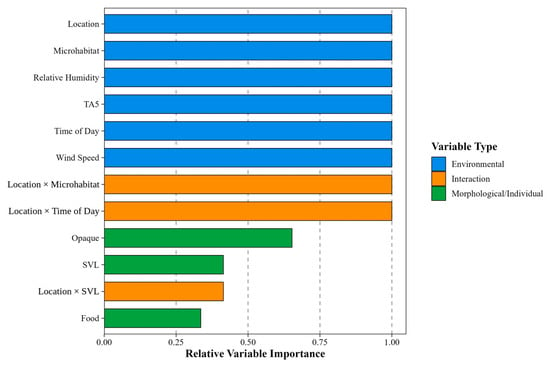
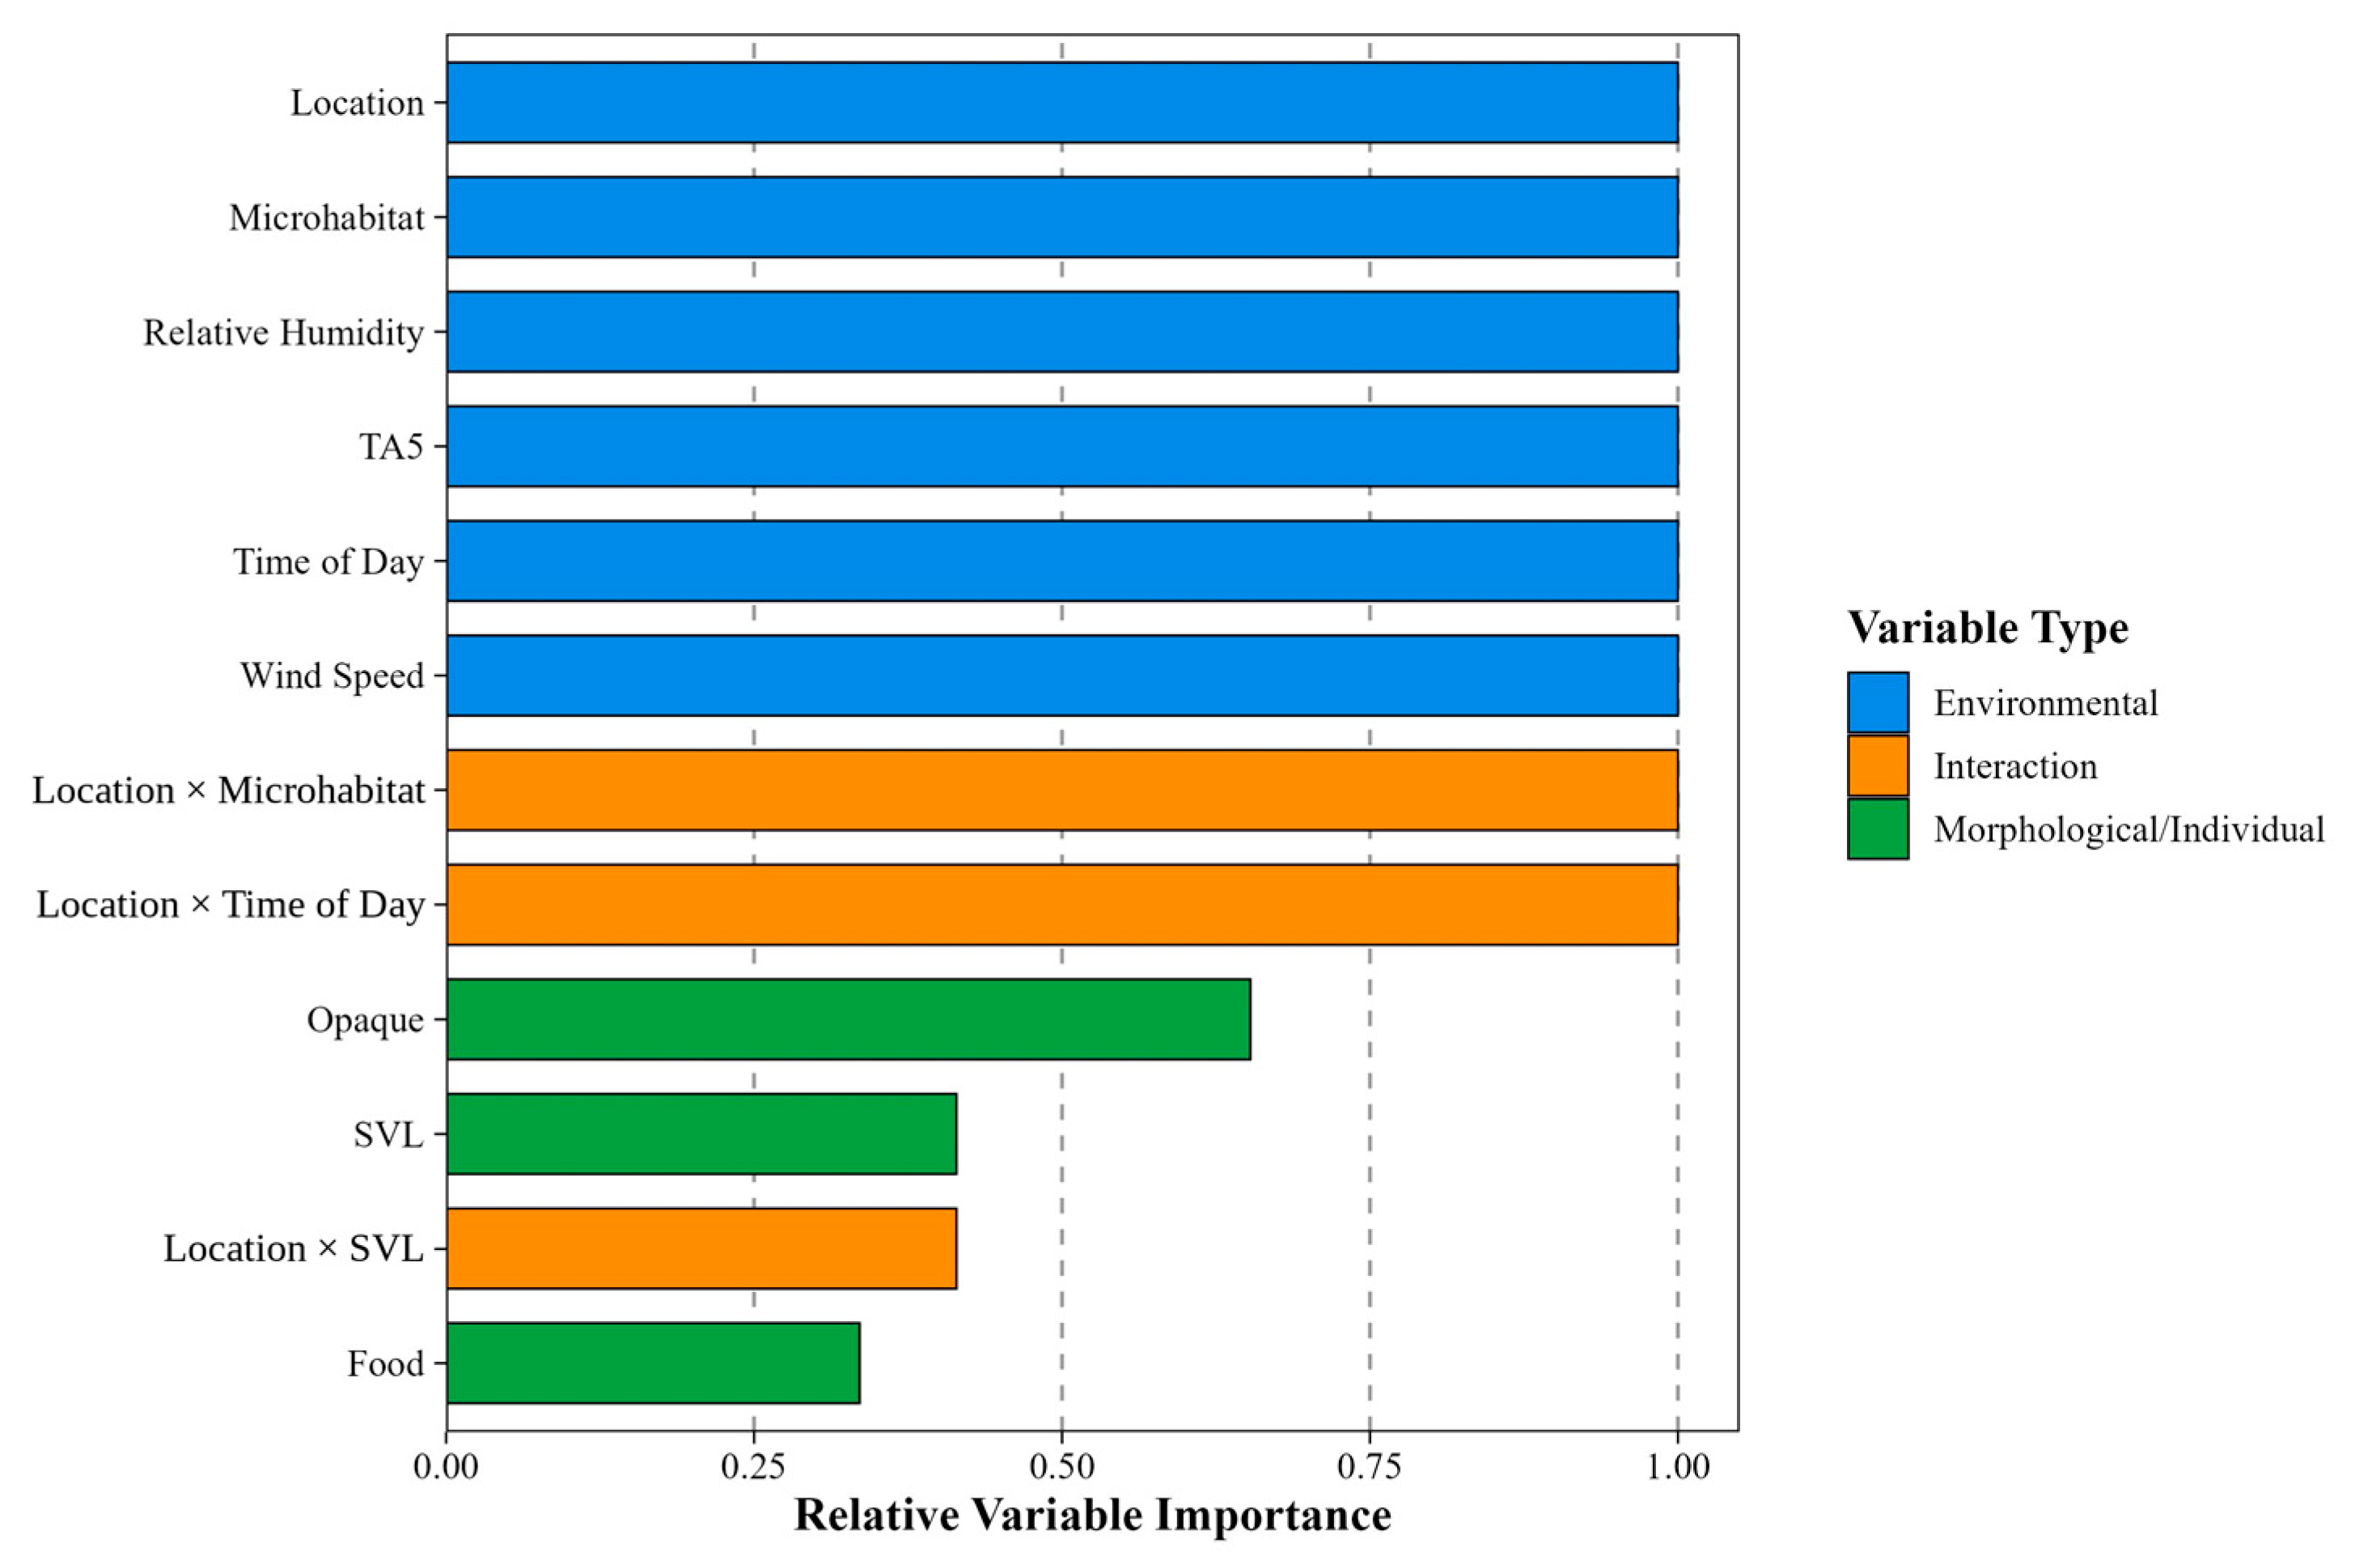
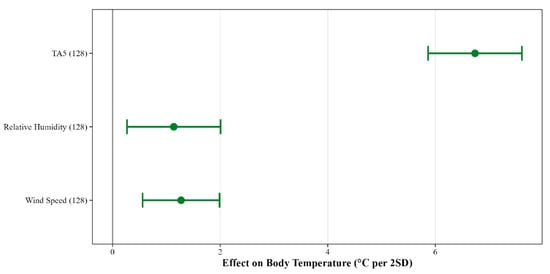
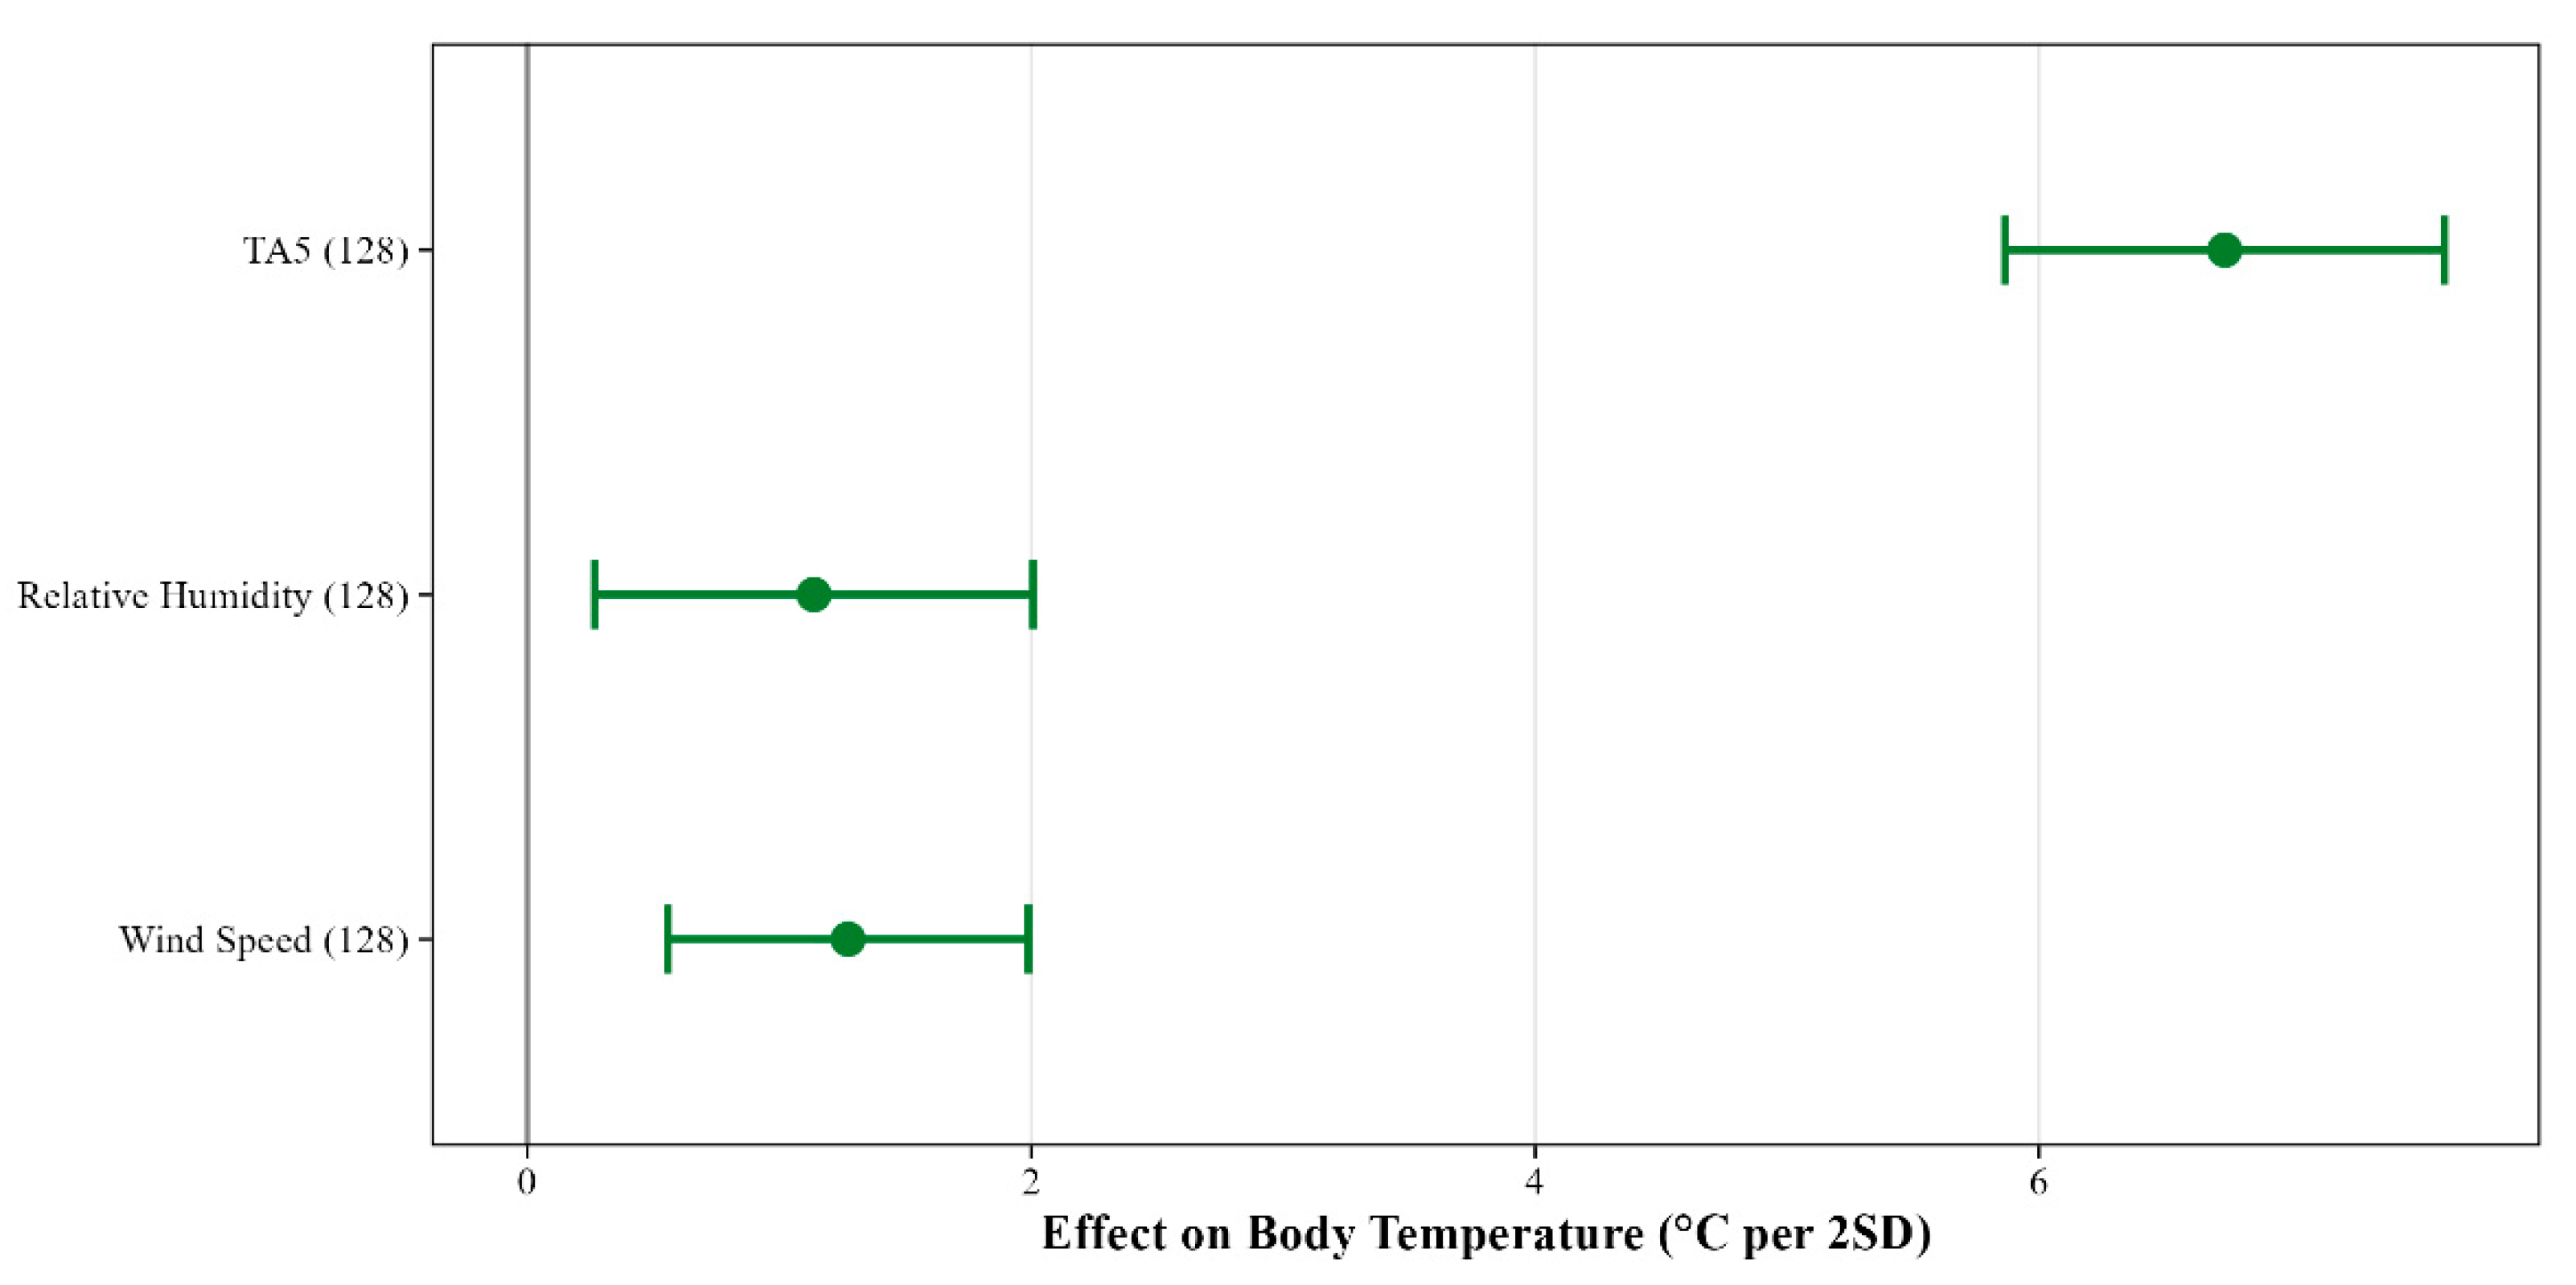
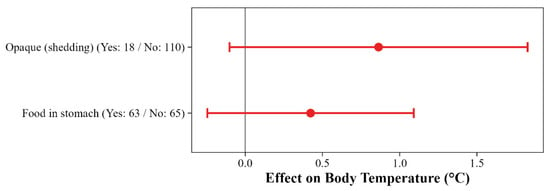
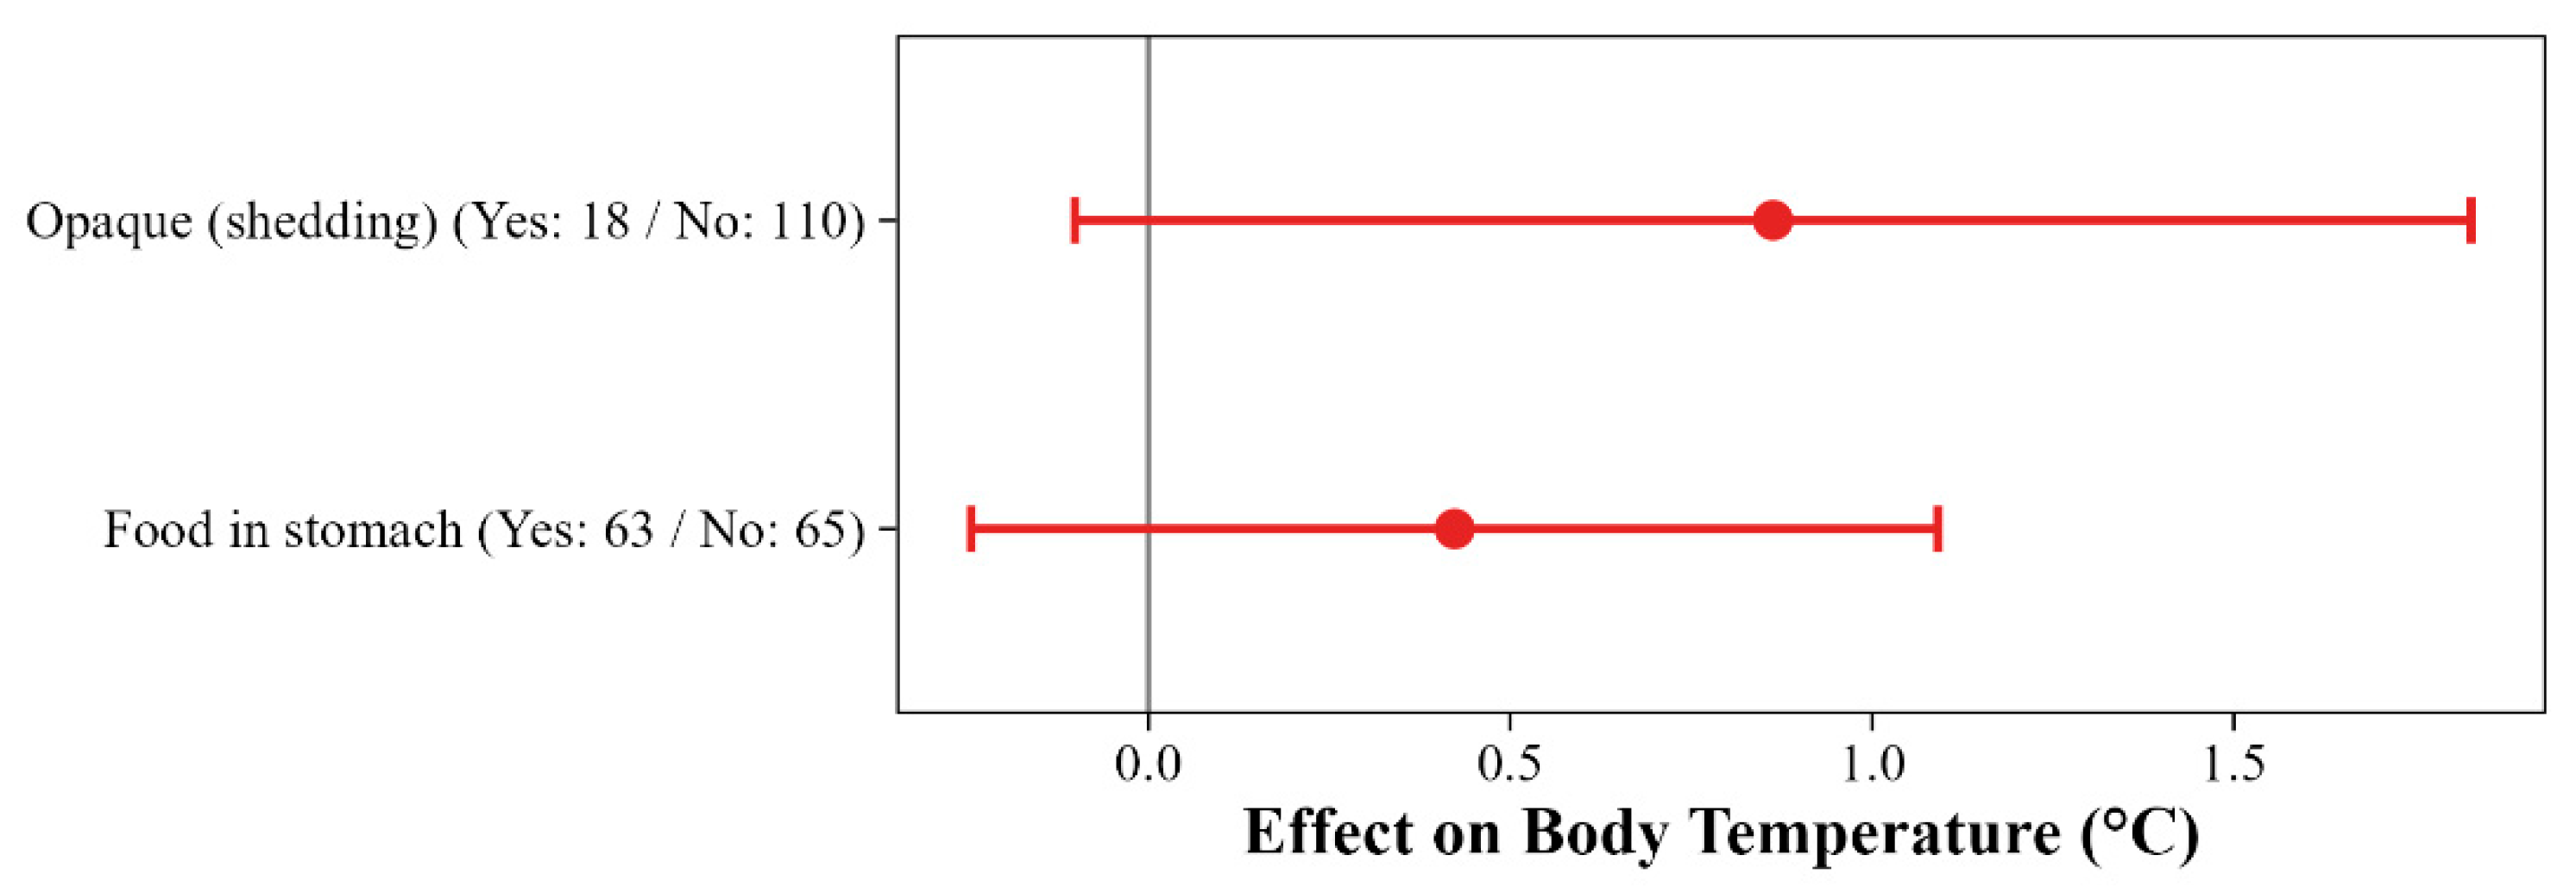
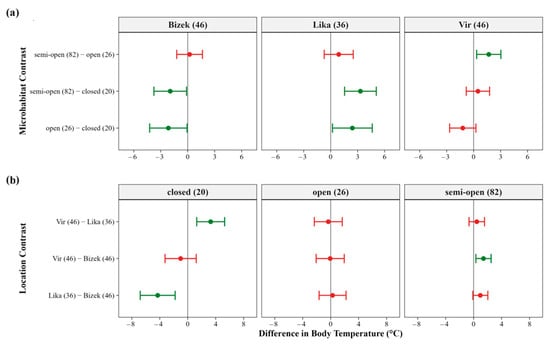
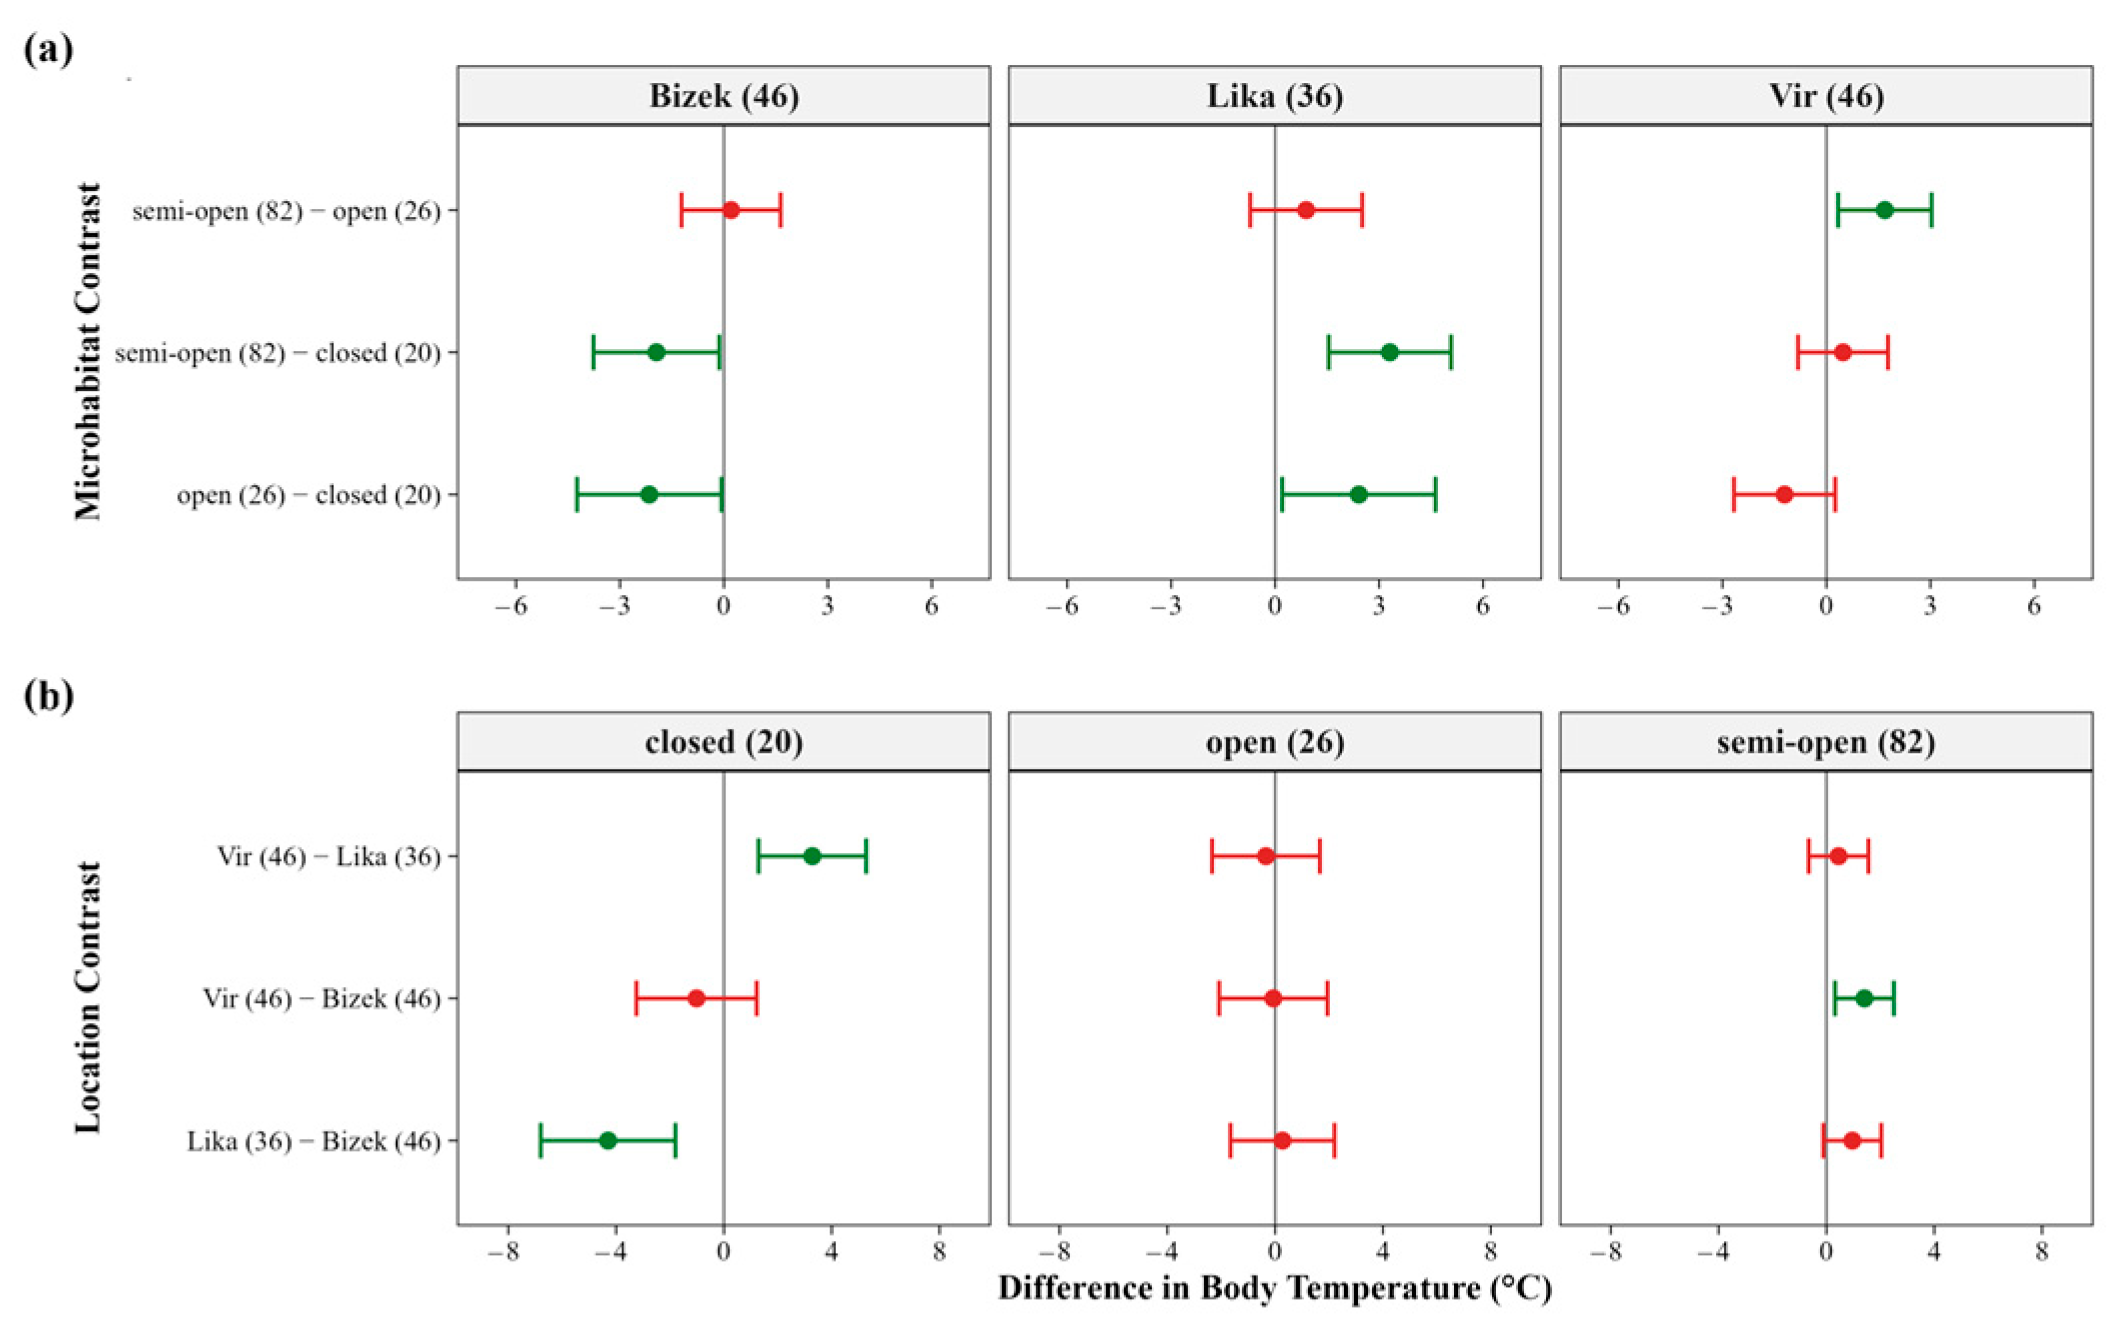
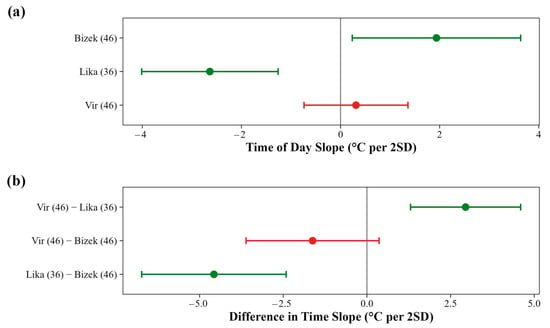
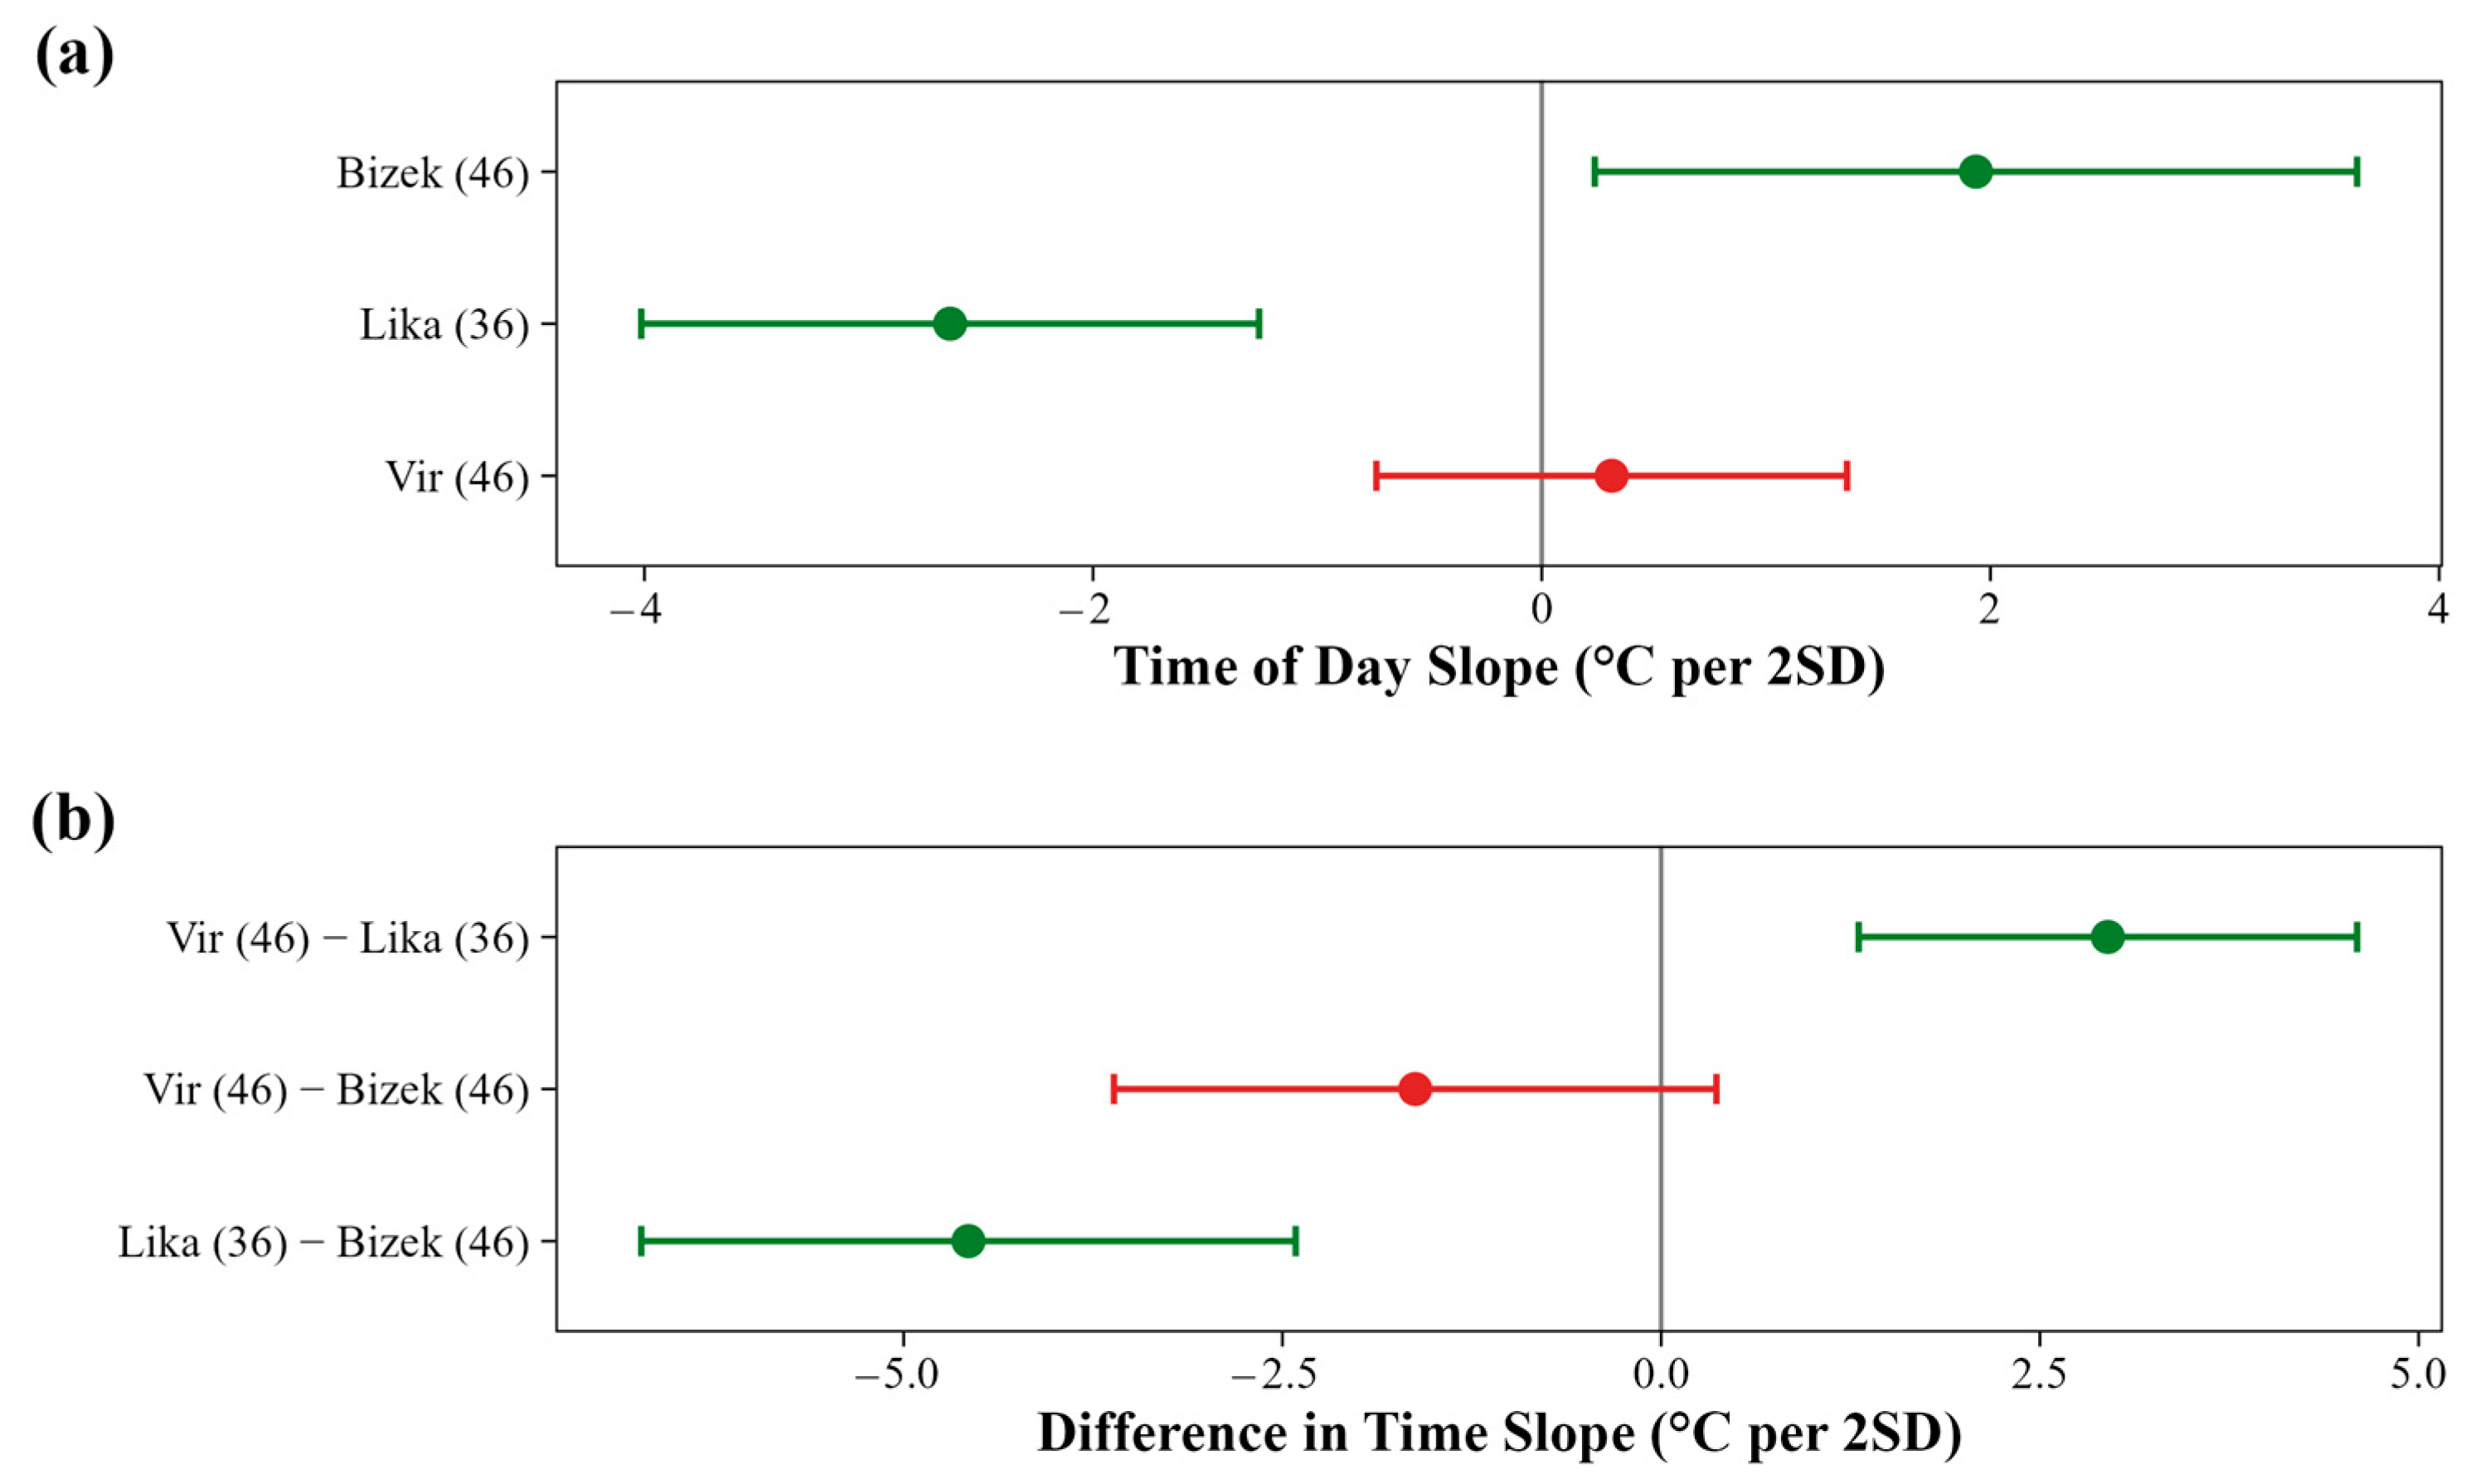
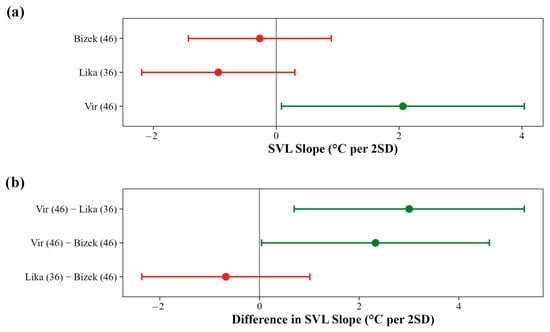
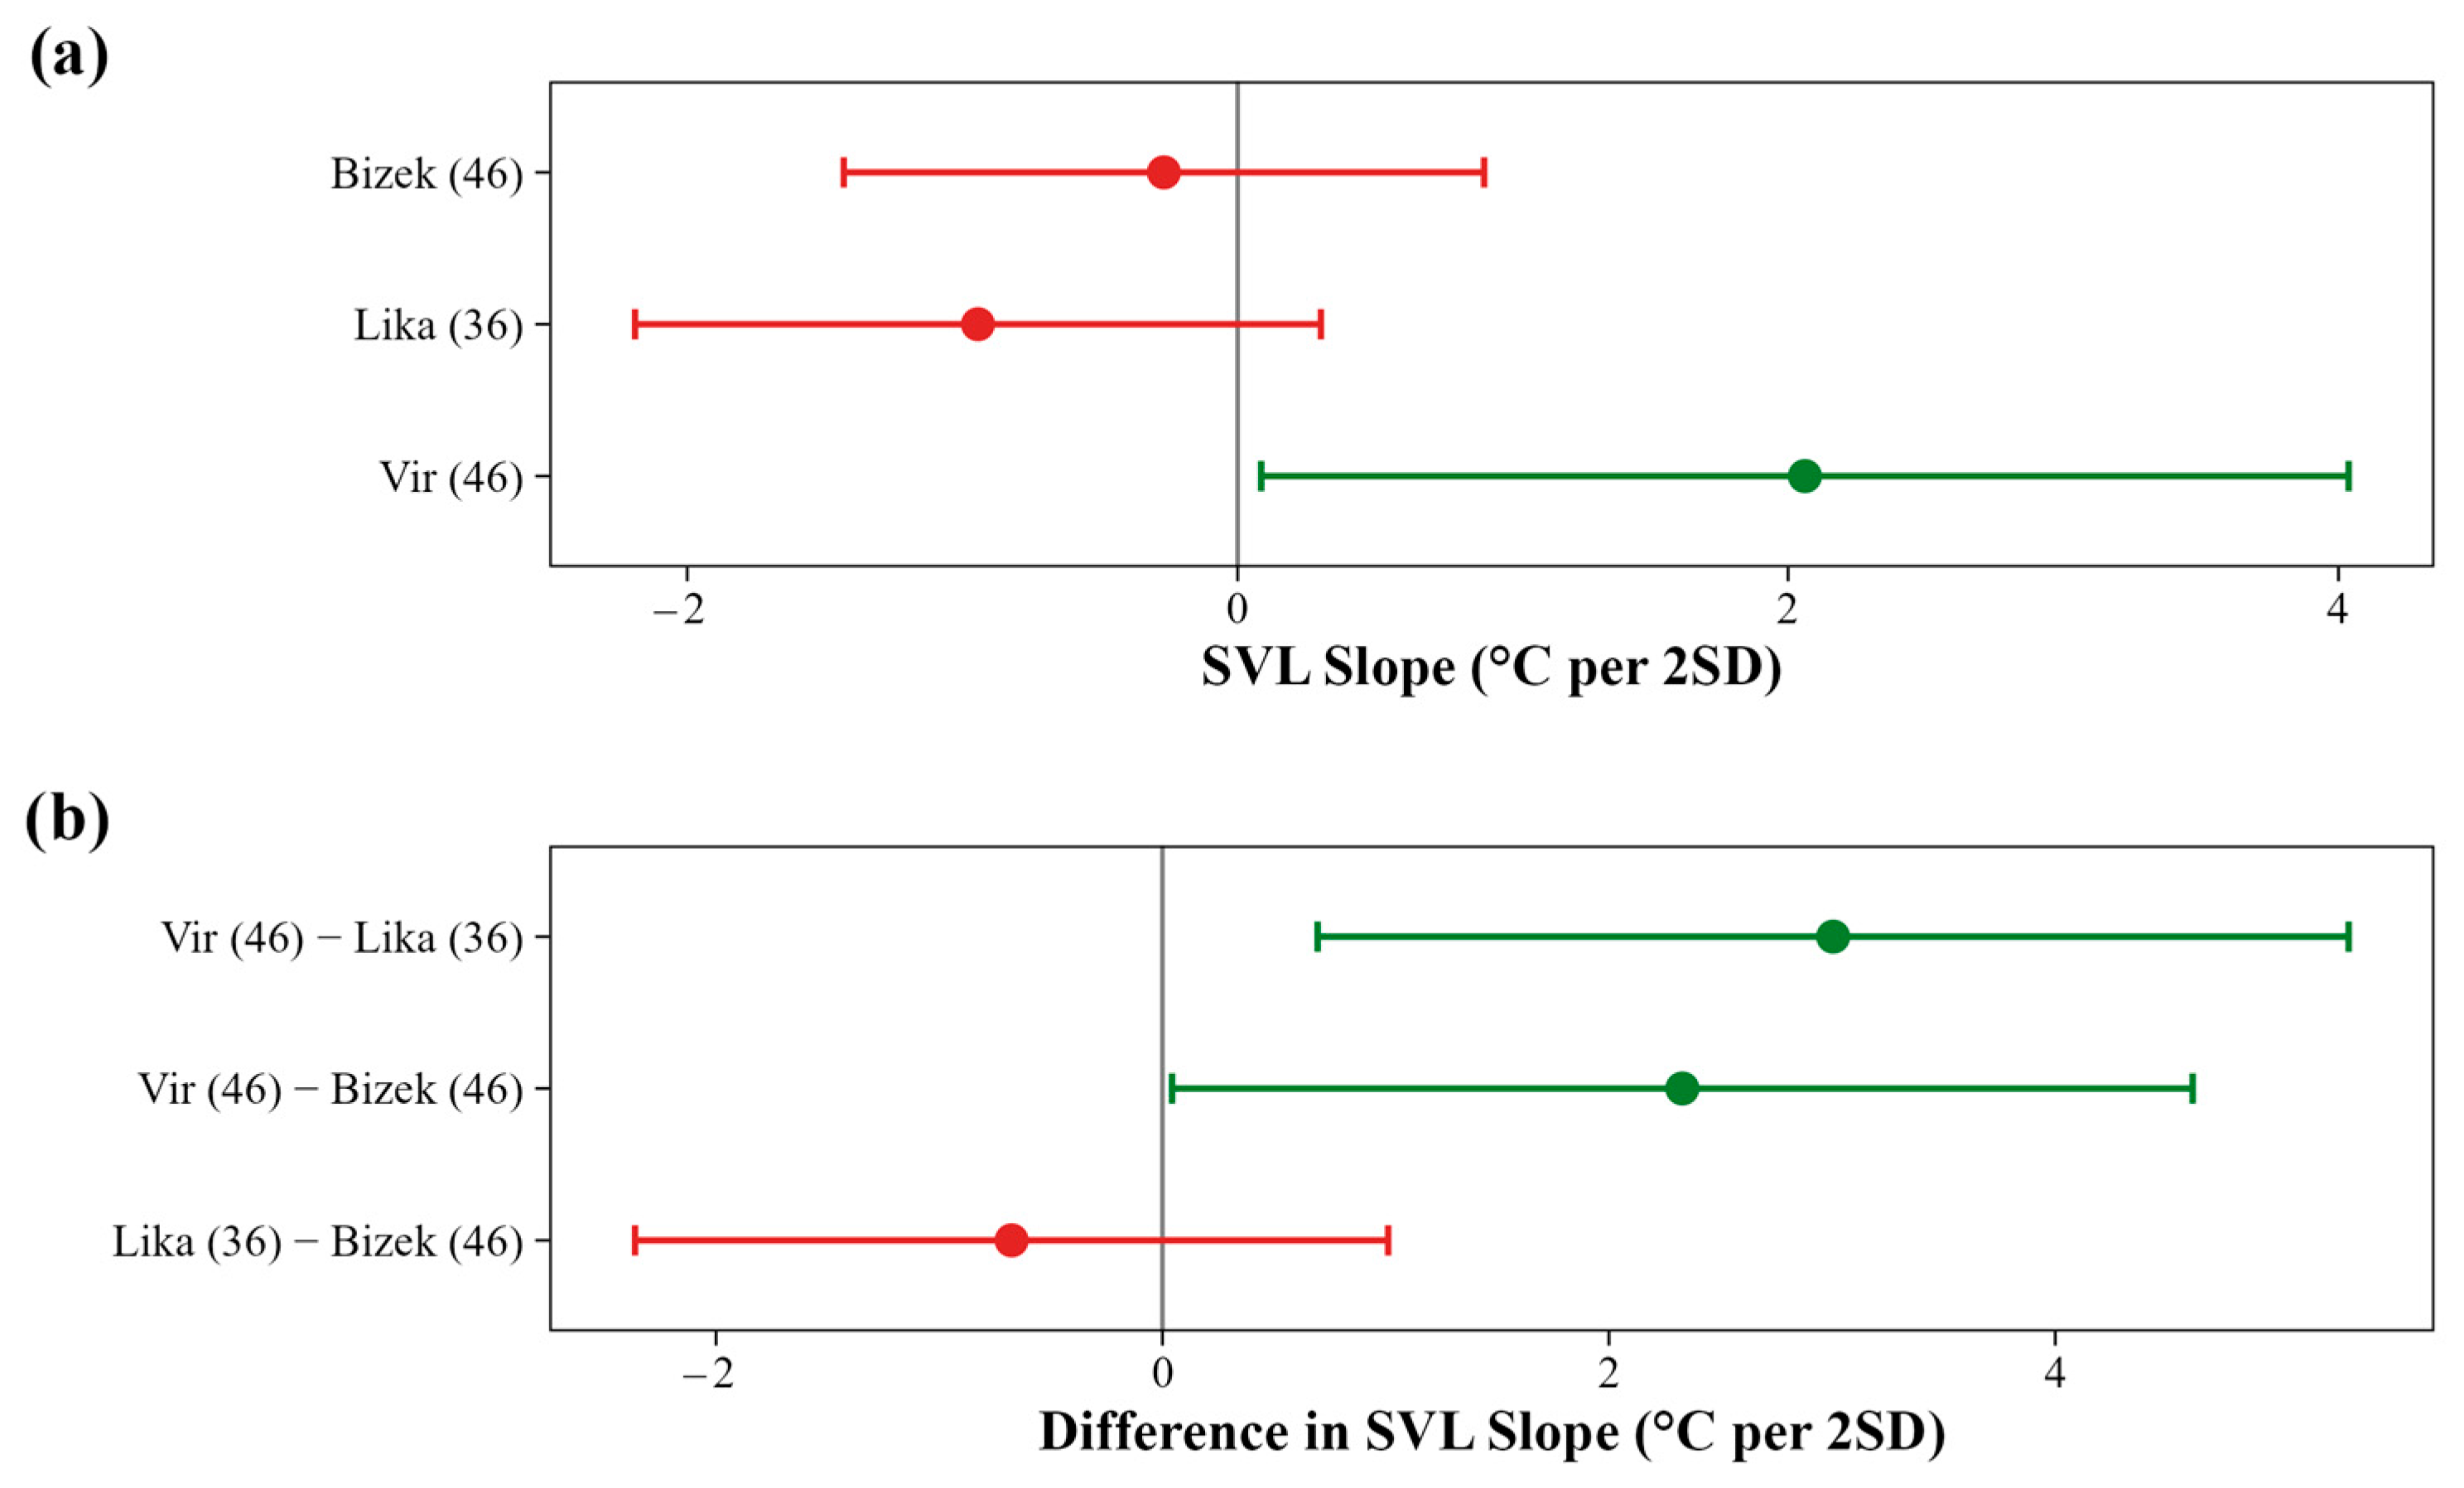
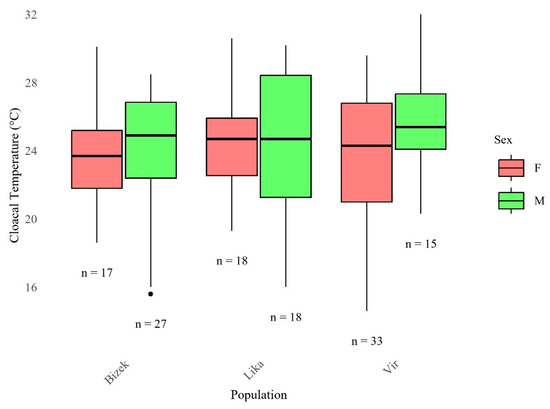
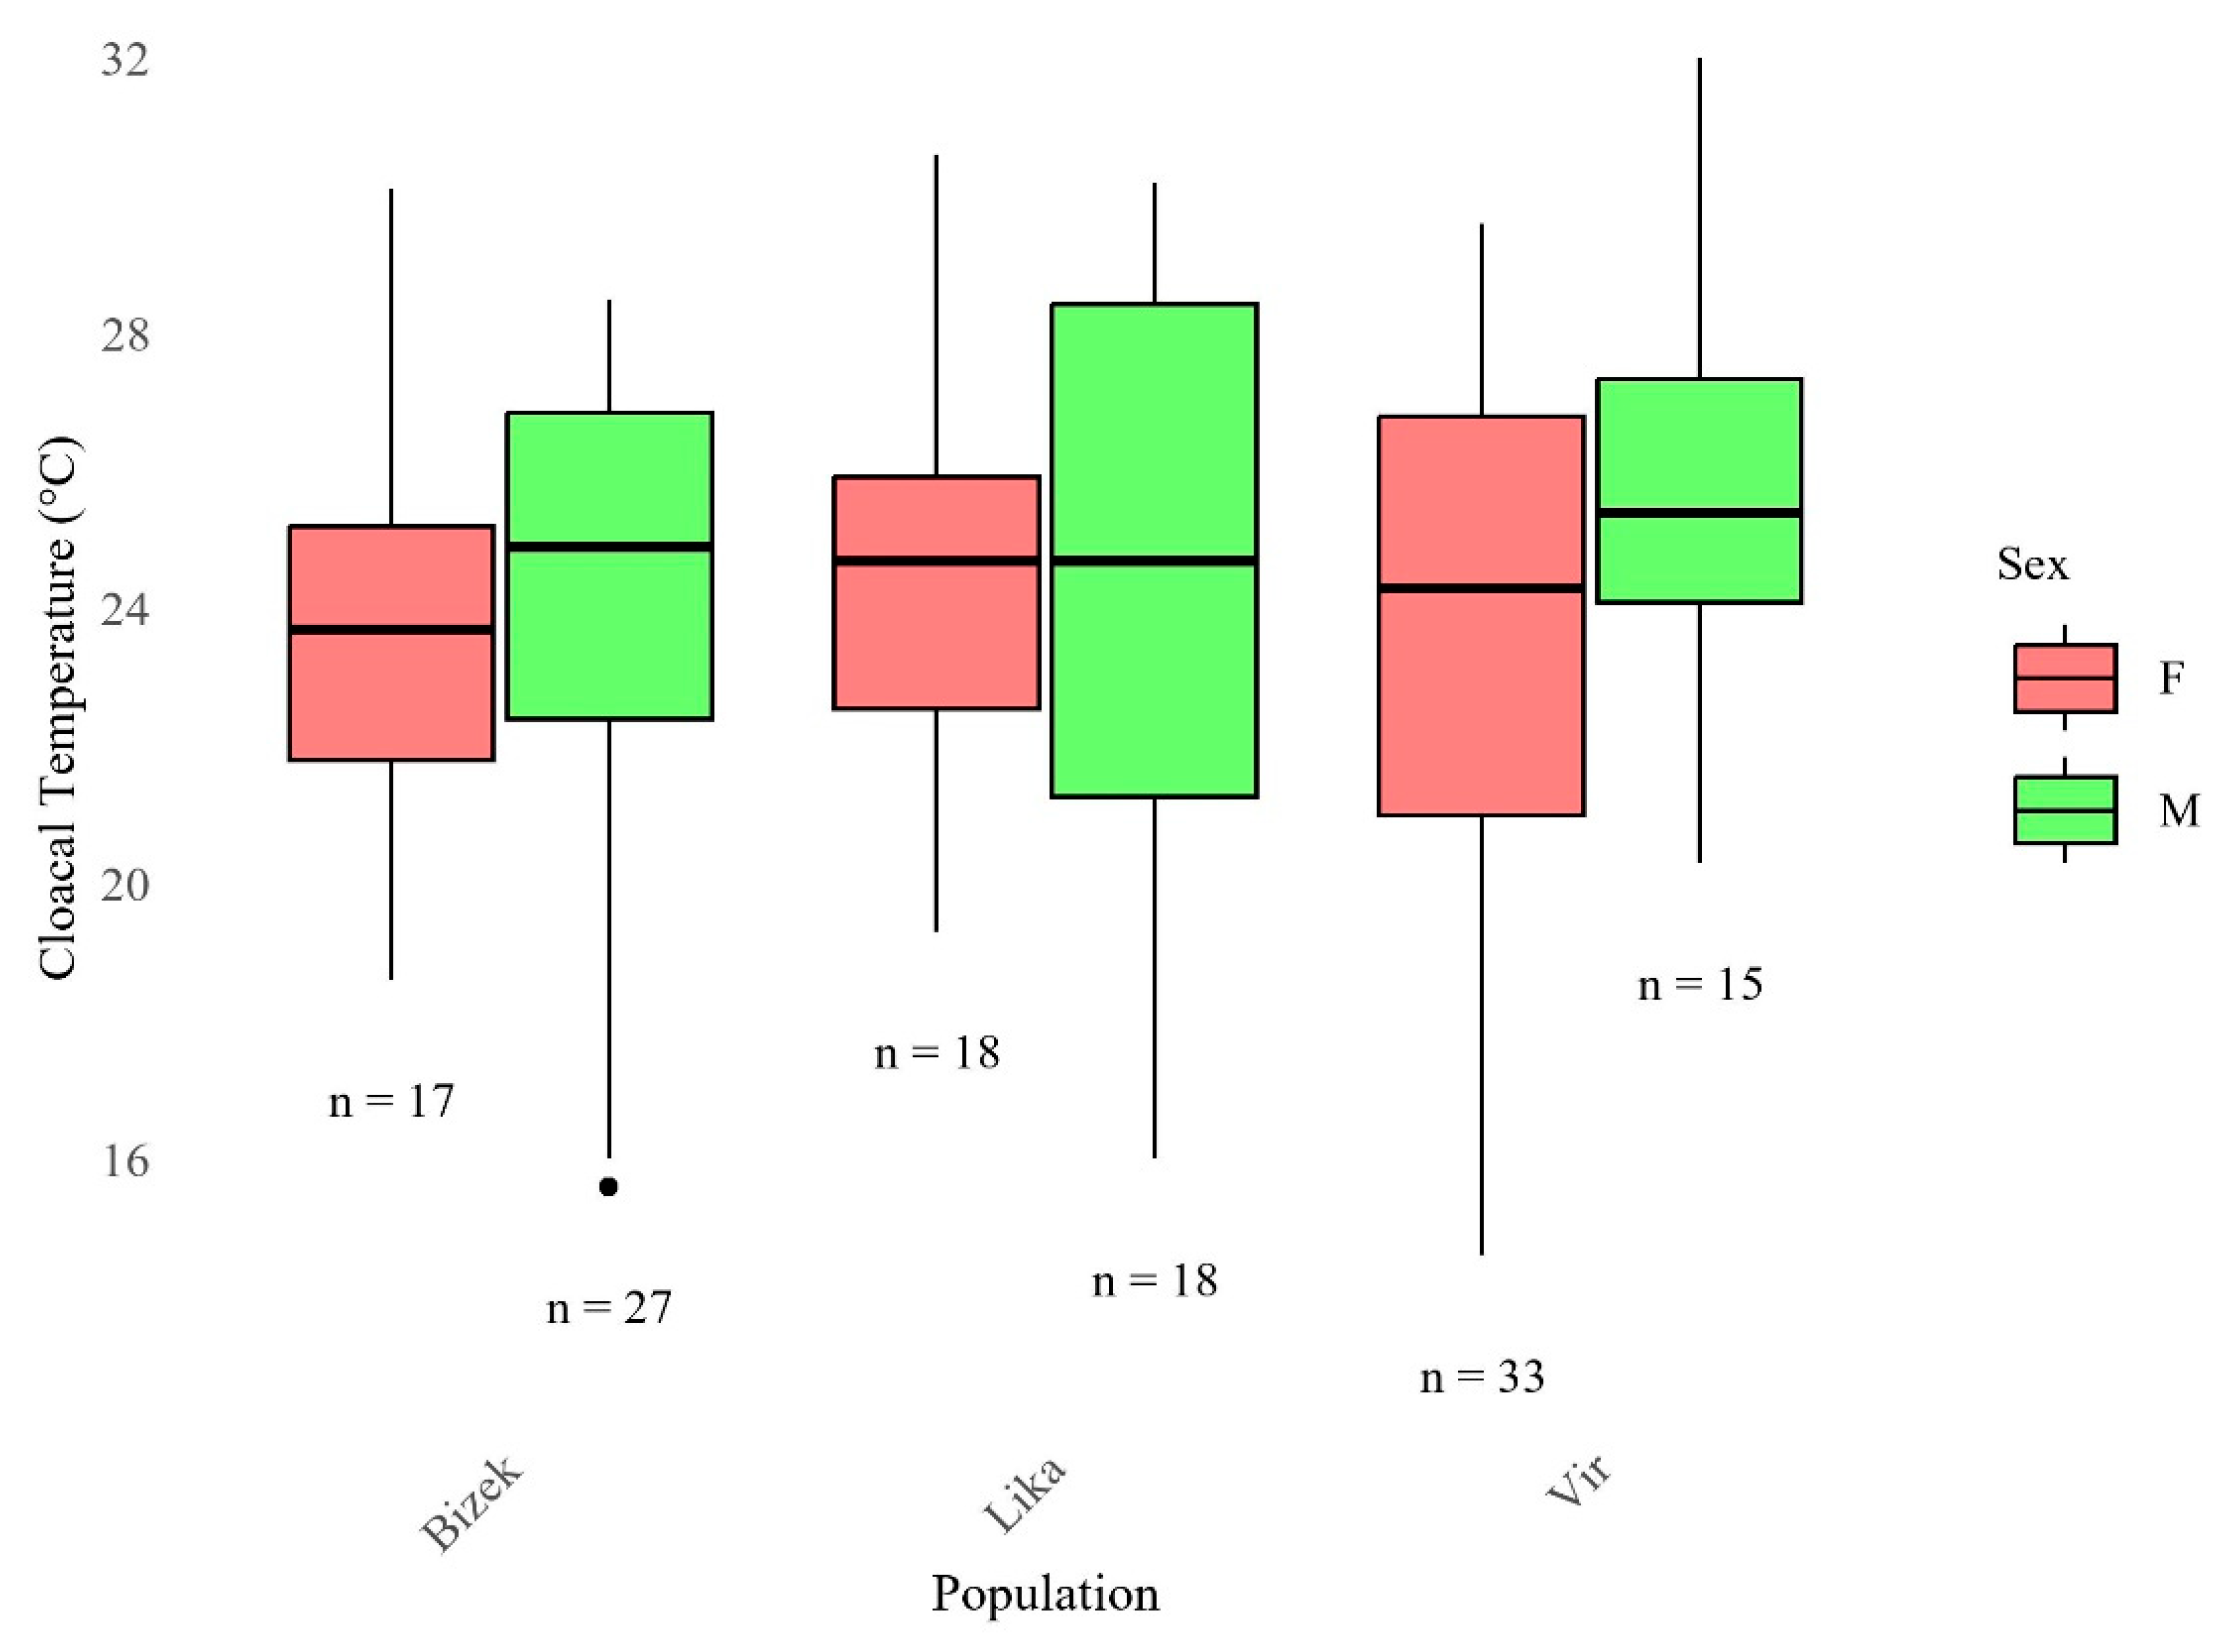
Disclaimer/Publisher’s Note: The statements, opinions and data contained in all publications are solely those of the individual author(s) and contributor(s) and not of MDPI and/or the editor(s). MDPI and/or the editor(s) disclaim responsibility for any injury to people or property resulting from any ideas, methods, instructions or products referred to in the content. |
© 2026 by the authors. Licensee MDPI, Basel, Switzerland. This article is an open access article distributed under the terms and conditions of the Creative Commons Attribution (CC BY) license.