


Simple Summary
Understanding why paired organs such as testes differ in size between the left and right sides is important for evolutionary biology, as asymmetry has long been used as an indicator of male quality and developmental stress. In this study, we measured 173 adult male plateau brown frogs (Rana kukunoris) from seven populations across the eastern Tibetan Plateau and tested five popular explanations for testis asymmetry, including compensatory growth, physical constraints from the liver, sperm competition, mating competition, and environmental stress along altitude and latitude gradients. None of these population-level factors explained the degree of asymmetry, but males in poorer body condition developed more asymmetric testes. We also found that the left and right testes grew together in a coordinated manner rather than one compensating for the other, a pattern that does not support the classic compensation hypothesis. Our results suggest that testis asymmetry in this high-altitude frog reflects individual physiological condition rather than adaptation to environmental or sexual selection, providing the first within-species test of these frameworks in a high-altitude endemic amphibian.
Abstract
Absolute testis asymmetry, the magnitude of bilateral mass disparity independent of directional bias, is widely interpreted as an indicator of developmental stability and male quality, yet its intraspecific drivers remain poorly understood, particularly in high-altitude ectotherms. Here, we tested five non-mutually exclusive hypotheses for the maintenance of absolute testis asymmetry using 173 adult male plateau brown frogs (Rana kukunoris) sampled from seven populations (2297–3441 m) across the eastern Tibetan Plateau. The hypotheses comprised compensatory overgrowth of the contralateral testis, spatial packaging constraints imposed by asymmetric liver mass, post-copulatory sperm competition indexed by residual total testis mass, pre-mating sexual selection indexed by the operational sex ratio, and environmental stress along altitudinal and latitudinal gradients. Linear mixed models with population identity as a random intercept revealed no significant association between absolute testis asymmetry (ATA) and any population-level predictor, with fixed effects explaining less than 4% of the variance in all five models. In contrast, individual body condition negatively predicted ATA, indicating that males in poorer somatic condition develop more asymmetric testes, although this individual-level effect explained only a modest proportion of variance (marginal R2 = 0.039). Subgroup comparisons further showed strong positive associations between contralateral testis masses in left-dominant (n = 86) and right-dominant (n = 85) males, indicating synchronous rather than antagonistic bilateral growth, which is not consistent with the mechanistic basis of the compensation hypothesis. Our findings provide the first intraspecific test of these frameworks in a high-altitude endemic amphibian and suggest that absolute testis asymmetry in R. kukunoris is shaped by individual physiological condition rather than by sexual or environmental selection.
1. Introduction
Testicular size asymmetry represents a widespread morphological trait across vertebrates, including birds, mammals and amphibians, and its intraspecific and interspecific variation has long been debated in evolutionary reproductive ecology [1,2,3]. Two core evolutionary hypotheses have been proposed to explain the emergence and variation in testis asymmetry, the compensation hypothesis (CH) and the packaging hypothesis (PH), which differ fundamentally in their predictive scales and mechanisms.
The CH predicts that unilateral developmental impairment of one testis triggers compensatory overgrowth of the contralateral gonad, rendering asymmetry a reliable proxy for male somatic quality and reproductive potential [1]. This theory was initially supported by avian research, where males with better body condition exhibited stronger directional testis asymmetry (DTA) [4]. However, accumulating intraspecific studies on anurans have yielded inconsistent results. Multiple frog species, such as Feirana quadranus, Hylarana guentheri and Rhacophorus omeimontis [5,6,7], failed to detect a positive correlation between testis asymmetry and body condition, challenging the universal applicability of compensatory testicular growth within species. A critical unaddressed prediction of this hypothesis remains: if compensation exists, elevated absolute asymmetry should not reduce total testicular reproductive investment, yet few population-level amphibian datasets explicitly test whether asymmetry correlates with total testis mass (TTM) after controlling for body size and population variation.
The PH attributes testicular asymmetry to abdominal spatial constraints imposed by asymmetric visceral organs, especially the liver, which occupies disproportionate space in the right abdominal cavity of amphibians [3,8]. Comparative analysis across 116 anuran species confirmed that relative liver mass positively predicted the magnitude of testis asymmetry at the interspecific level, consistent with packaging constraints shaping evolutionary divergence in gonad morphology [9]. Nevertheless, interspecific patterns cannot be directly extrapolated to intraspecific population variation. Within a single species, liver mass fluctuates primarily due to short-term pre-hibernation energy storage rather than stable anatomical differentiation [10,11], and it remains unknown whether intraspecific liver variation generates measurable testicular asymmetry at the population scale, a key gap this study addresses.
Sexual selection, particularly post-copulatory sperm competition and pre-breeding adult operational sex ratio (OSR), is another major driver proposed to modify testis asymmetry. High male-biassed OSR intensifies sperm competition, which theoretically favours symmetrical paired testes to maximize total sperm output without unilateral developmental trade-offs [12]. Cross-species anuran data indicated positive covariation between residual total testis size (a proxy of sperm competition intensity) and asymmetry, contradicting avian predictions [9]. Intraspecific evidence in amphibians is still scarce, especially for high-altitude endemic frogs with distinct breeding aggregation sex ratios. Meanwhile, environmental stress along altitudinal and latitudinal clines may alter developmental stability and generate fluctuating gonad asymmetry [13]. A previous population-level investigation of Rana kukunoris using identical seven altitudinal sampling populations focused exclusively on DTA (calculated as right minus left testis mass) to evaluate correlations with annual temperature, body age and body condition [14]. That prior work only examined thermal effects on directional gonad bias and did not incorporate geographic gradients (altitude, latitude) as independent predictors. More importantly, it lacked systematic tests of two core evolutionary frameworks that have been widely debated across amphibians: the PH and sexual selection-mediated variation in testicular asymmetry. Cross-species comparative analyses of anurans have demonstrated that relative liver mass (a proxy for abdominal spatial constraints under the PH) and post-copulatory sperm competition pressure jointly shape testis asymmetry magnitude [9], yet these selective and anatomical drivers were never quantified within R. kukunoris. The earlier study relied solely on directional asymmetry (DA), which reflects left/right mass bias rather than the absolute magnitude of bilateral disparity (ATA), and indeed the two metrics capture different developmental dimensions: DTA measures a signed left-right bias, whereas ATA quantifies the magnitude of disparity regardless of its direction. Beyond the change in response variable, the present contribution differs from Li et al. [14] in four substantive respects. First, the research question differs: Li et al. [14] asked a descriptive question—whether directional bias varies with ambient temperature—whereas we ask why paired testes differ in size at all, by subjecting ATA to formal tests of five a priori hypotheses (CH, PH, sperm competition, OSR-mediated sexual selection, and geographic environmental stress). Second, the predictors differ: rather than temperature alone, we test residual total testis mass, residual liver mass, OSR, altitude and latitude as independent focal predictors, together with total testis mass and body condition as individual-level covariates. Third, the analytical framework differs: our models include a baseline reference model, Holm correction across hypothesis tests, and two sensitivity analyses (Gamma GLMMs and exclusion of extreme residuals; Supplementary Table S1), with explanatory power quantified by marginal and conditional R2—none of which featured in the earlier analysis. Fourth, the conclusions differ and are complementary: where Li et al. [14] reported that directional bias increased marginally with temperature, we show that the magnitude of asymmetry is invariant along the same geographic gradients and instead tracks individual body condition, and we provide, to our knowledge, the first formal within-species test of the compensation hypothesis in any anuran.
The plateau brown frog (Rana kukunoris) is an endemic anuran distributed along the eastern Tibetan Plateau, occupying altitudes spanning 2200–4400 m with distinct thermal conditions, population densities and breeding adult sex ratios [14,15]. Populations of this species exhibit pronounced inter-population divergence in body size, pre-hibernation liver energy reserves and reproductive investment, making it an ideal model to disentangle the relative roles of natural and sexual selection in shaping testicular asymmetry. Consequently, several key evolutionary hypotheses for testicular asymmetry—compensation, packaging, sperm competition, OSR, and geographic stress—remain untested in this species. To address these gaps, we sampled 173 adult male R. kukunoris across seven populations spanning its altitudinal range on the eastern Tibetan Plateau and tested five non-mutually exclusive predictions derived from the compensation, packaging, sperm competition, OSR, and environmental stress frameworks. Specifically, we asked whether (i) testes exhibit compensatory growth that reduces absolute asymmetry when total gonadal investment is high; (ii) energy reserves (indexed by liver mass) constrain developmental stability and therefore shape asymmetry; (iii) sperm competition intensity, inferred from relative testis size, predicts the degree of asymmetry; (iv) OSR modulates the strength of pre-mating sexual selection on symmetric gonadal development; and (v) increasing environmental harshness (altitude and latitude) intensifies developmental perturbation and hence absolute asymmetry. In addition, we compared individuals whose left versus right testis was heavier to assess whether compensatory bilateral growth occurs within individuals, providing the first intraspecific test of these hypotheses in a high-altitude endemic amphibian.
2. Materials and Methods
2.1. Study Area and Sample Collection
Field sampling was conducted at seven populations of the plateau brown frog, Rana kukunoris Nikolskii, 1918, along an altitudinal gradient (2297–3441 m a.s.l. on the eastern Tibetan Plateau), following the sampling design of Yu et al. [16] and Li et al. [14]. Site names, geographic coordinates, altitudes and climatological data are given in Table 1. Field sampling was carried out in late March to mid-April 2012, during a breeding season lasting approximately two weeks at each site. At each population, frogs were captured by hand in the middle of the local spawning period—identified by the presence of amplectant pairs and freshly laid egg masses—following the protocol of Yu et al. [16], so that all populations were sampled at the same local phenological stage. Frogs were identified as adult males by the presence of nuptial pads on the foredigits; all captured females were released at their original spawning sites. To characterize the pre-mating sexual selection environment, the numbers of males and fertilizable females were counted at each breeding aggregation over 3–5 days [17], and the population-specific OSR was calculated as the number of males divided by the number of fertilizable females, under the assumption that this ratio reflects the average number of males competing per female [16]. Captured males were transported to a field laboratory close to the breeding sites and housed individually in 2.5 L plastic buckets containing 5 cm of pond water at ambient temperature (2.3–5.4 °C) until processing. In total, 173 adult males (10–53 per population) were retained for morphological measurement and dissection. Fieldwork was approved by the Gahai–Zecha National Nature Reserve Management Bureau (approval no. GHZCRMB/03-212014), and all procedures involving animal sacrifice were approved by the Animal Ethics Committee of Xinyang Normal University (AETXYEC; protocol number XYEC-2014–008), as reported in Yu et al. [16] and Li et al. [14].
Table 1.
Location, altitude, climate and sample size of the seven study populations of Rana kukunoris.
2.2. Morphological Measurements, Dissection and Organ Mass
Snout–vent length (SVL; nearest 0.1 mm) and body mass (nearest 0.01 g) were measured with a calliper and an electronic balance, respectively. Following the protocol of Liao et al. [18], males were euthanized, and dissection was completed within 24 h of collection [14,16]. Specimens were dissected along the ventral midline to expose the visceral cavity; the left testis, right testis and liver were carefully separated, with all attached fat bodies and connective tissue removed while preserving organ integrity [3]. The left (L) and right (R) testes and the liver were weighed fresh to the nearest 0.1 mg on an electronic balance. Hereafter, L and R denote fresh left and right testis mass, and TTM denotes L + R. Based on bilateral testis mass, males were assigned to three groups, left-dominant (LD; L > R, n = 86), right-dominant (RD; R > L, n = 85) and equal-mass individuals (n = 2), with the latter excluded from the bilateral trade-off tests.
2.3. Morphological Indices
All body, testicular and hepatic mass variables were log10-transformed prior to index construction to improve normality and homogeneity of variance for subsequent statistical modelling [13,14]; log10-transformed snout–vent length (SVL) served as the body-size covariate throughout. Four derived indices were calculated as follows:
(i) Absolute testis asymmetry (ATA) = |log10(L) − log10(R)| = |log10(L/R)|, quantifying the magnitude of bilateral testicular disparity independently of left–right directional bias [9];
(ii) Residual total testis mass (rTTM), extracted as the residuals of a linear regression of log10(TTM) on log10(SVL), with population identity entered as a fixed factor, used as a proxy for intraspecific sperm competition intensity [9];
(iii) Residual liver mass (rLM), extracted analogously from a regression of log10(liver mass) on log10(SVL), with population identity as a fixed factor, used to test the PH [3,8,9];
(iv) Body condition index (BCI), extracted as the residual of each male from a linear regression of log10(whole-body mass) on log10(SVL) across all 173 males, with population identity entered as a fixed factor; positive values indicate males heavier than expected for their body length, used exclusively in tests of the CH [1,7].
All three residual indices were constructed in the same way: log10-transformed mass variables (TTM, liver mass, whole-body mass) were each regressed on log10(SVL) with population identity as a fixed factor, and individual residuals served as rTTM, rLM and BCI, respectively. In subsequent linear mixed models, population identity was additionally fitted as a random intercept, so that individual-level inferences were not confounded by among-population variation.
2.4. Statistical Analyses
All analyses were performed in R v4.5.2 [19] using the packages lme4, lmerTest [20], MuMIn, tidyverse and ggplot2. Because individuals sampled from the same population cannot be assumed to be statistically independent, all models were linear mixed-effects models (LMMs), with population identity fitted as a random intercept. Unless stated otherwise, analyses of ATA used the full sample of 173 males, including the two equal-mass individuals (ATA = 0); only the bilateral trade-off models (n = 86 and n = 85) and the directionality tests were restricted to unequal-mass males. Models were fitted by restricted maximum likelihood (REML), and Satterthwaite’s approximation was used to estimate denominator degrees of freedom for t-tests of fixed effects. Multicollinearity among fixed predictors was assessed by inspecting the fixed-effect correlation matrix of each model; variance inflation factors were below 1.6 for all fixed predictors, indicating no problematic multicollinearity. Marginal R2 (variance explained by fixed effects alone) and conditional R2 (variance explained by fixed and random effects combined) were computed to quantify the explanatory power of each model [21], and random-intercept standard deviations were extracted to quantify among-population variation. Model assumptions were verified by visual inspection of Q–Q plots, scaled residual distributions and residual-versus-fitted plots for every model. Because ATA is non-negative and right-skewed (Figure 1b), and because some Q–Q plots showed mild tail departures from normality, we conducted two additional sensitivity analyses for all models with ATA as the response variable: (i) refitting each model as a generalized linear mixed model with a Gamma error distribution and log link (glmmTMB), which accommodates positive, right-skewed responses (a small constant of 10−6 was added to ATA to accommodate the two equal-mass individuals), and (ii) refitting each LMM after excluding observations with extreme residuals (|scaled residual| > 3, n = 6 excluded). Results are reported in Supplementary Table S1 and Figure S1. Effects were considered statistically significant at α = 0.05 (two-tailed); because the five hypotheses were specified a priori and tested in separate models, focal p-values were considered both unadjusted after Holm correction across the five population-level models; models (vi) and (vii) were supplementary, specified in response to the review process, and were not included in the Holm family; their p-values are reported unadjusted; results were qualitatively identical under both approaches.
Figure 1.
Bilateral testis asymmetry in 173 adult male Rana kukunoris. (a) Relationship between log10-transformed right and left testis masses; the dashed line is the 1:1 line, and left-dominant, right-dominant and equal-mass males are shown separately. The symmetric distribution of points along the identity line indicates synchronous bilateral growth rather than a trade-off between contralateral testes. (b) Frequency distribution of absolute testis asymmetry (ATA); the dashed line marks the population median (0.071).
2.4.1. Population-Level Drivers of ATA
Five LMMs were constructed to test five non-mutually exclusive hypotheses for the magnitude of ATA. All five models used ATA as the response variable, log10(SVL) as a fixed covariate, and population identity as a random intercept, with each model additionally including its own focal predictor (rTTM, rLM, OSR, altitude, or latitude). Because rTTM is derived from log10(TTM) and already encodes variation in TTM relative to body size, the sperm-competition model included only rTTM and log10(SVL) to avoid partial collinearity, whereas the other four models entered log10(TTM) as an additional fixed covariate; therefore, the focal predictors are not directly comparable as standardized effect sizes across the five models. In addition, a baseline model containing only log10(SVL) was fitted to provide a reference for the incremental contribution of each focal predictor. The focal predictor and directional prediction of each model were as follows:
(i) Sperm competition. ATA was predicted to increase with rTTM, as stronger post-copulatory sexual selection is expected to accentuate bilateral size disparity.
(ii) PH. ATA was predicted to increase with rLM, as a relatively larger liver is expected to constrain gonadal development within the body cavity.
(iii) Pre-mating sexual selection. ATA was predicted to be greater in populations with a more male-biassed OSR, reflecting intensified mating competition.
(iv) Altitudinal environmental stress. ATA was predicted to increase with altitude, reflecting stronger developmental stress under harsher high-elevation conditions.
(v) Latitudinal gradient. ATA was predicted to vary with latitude, reflecting latitudinal differences in resource availability and developmental stability.
Two additional supplementary LMMs were fitted with temperature and rainfall as focal predictors:
(vi) Thermal environment. ATA was predicted to vary with ambient temperature, given that temperature directly governs developmental rate and stability in ectotherms [13,14].
(vii) Precipitation. ATA was predicted to vary with rainfall, reflecting local moisture conditions that affect larval and adult physiological stress.
Because ambient temperature and precipitation are population-level constants, models (vi) and (vii) were fitted separately from models (iv) and (v) to avoid multicollinearity, as altitude and temperature are strongly collinear across our sites; temperature was modelled separately from latitude so that results are directly comparable to the DTA analysis of Li et al. [14]. In addition, as a supplementary population-level analysis that is not subject to the clustering of individual observations, we computed population means for ATA, body condition, total testis mass, OSR, altitude, latitude, temperature and rainfall and examined Spearman rank correlations between population-mean ATA and each population-level predictor. Because rLM and rTTM are residual indices defined relative to population means, they lack among-population variation by construction and were analyzed only at the individual level. Because these correlations are exploratory and based on only seven independent units, they are reported for descriptive purposes only (Supplementary Table S2), and no inferential significance is claimed.
2.4.2. Tests of the CH
Two additional sets of LMMs addressed the CH, which concerns within-individual physiological trade-offs and therefore required an analytical framework separate from the population-level models above.
(1) Total investment test. Log10(TTM) was modelled as the response variable, with ATA, BCI and log10(SVL) as fixed predictors and population identity as a random intercept. The a priori criterion was as follows: a non-significant coefficient of ATA would indicate that greater asymmetry is not associated with reduced total testicular investment (a necessary condition consistent with CH), whereas a significantly negative coefficient would is not consistent with CH.
(2) Bilateral trade-off tests. Among LD males, log10(L) was modelled as the response variable, with log10(R) and log10(SVL) as fixed predictors and population identity as a random intercept; the mirror-image model was fitted for RD males (log10(R) as response; log10(L) and log10(SVL) as predictors). A significantly negative coefficient of contralateral testis mass would indicate compensatory enlargement, whereas a positive coefficient would indicate synchronous bilateral growth with no developmental trade-off.
Additionally, to directly evaluate whether body condition influences ATA, we fitted a supplementary LMM with ATA as the response variable, BCI (see Section 2.3 for its construction) and log10(SVL) as fixed predictors, and population identity as a random intercept. To characterize the direction of testis asymmetry independently of its magnitude, we additionally fitted three LMMs using signed testis asymmetry (TA_signed = log10(L) − log10(R)) as the response variable, with rTTM, altitude, or latitude as the focal predictor, log10(SVL) as a covariate in all three models, log10(TTM) as an additional covariate in the altitude and latitude models, and population identity as a random intercept. Because rTTM is derived from log10(TTM), the two were not entered simultaneously. Non-significant focal predictors would indicate that the left–right bias does not vary systematically along geographic or energetic gradients. We further assessed the overall directionality of asymmetry using a Wilcoxon signed-rank test on paired log10-transformed testis masses, an exact binomial test on the proportion of left- versus right-dominant males, and a Fisher’s exact test of the homogeneity of directional composition among the seven populations. To test whether geographic variation in body condition could mediate any altitudinal effect on ATA, we additionally fitted an LMM with body BCI as the response variable, altitude as the focal predictor, log10(SVL) as a fixed covariate, and population identity as a random intercept. In addition, to examine whether body condition responds to direct climatic conditions rather than to altitude per se, we computed Spearman rank correlations between population-mean body condition and site-level ambient temperature and annual precipitation.
3. Results
3.1. Descriptive Statistics and Directionality Test
Across 173 adult males, the ATA ranged from 0.000 to 0.647 (median = 0.071, mean ± SD = 0.101 ± 0.104), with 86 LD, 85 RD and two equal-mass individuals. A Wilcoxon signed-rank test indicated no systematic left–right bias in paired log10-transformed testis masses (V = 7702.5, p = 0.59). An exact binomial test confirmed that the proportion of left- versus right-dominant males did not deviate from 1:1 (86:85 out of the 171 unequal-mass males, p = 1.00), and directional composition was homogeneous among the seven populations (Fisher’s exact test, p = 0.62). These results indicate that testis asymmetry in R. kukunoris is consistent with fluctuating asymmetry rather than directional bias, providing a valid basis for subsequent analyses of the absolute magnitude of bilateral disparity (Figure 1a,b).
The baseline model with log10(SVL) as the sole fixed predictor explained 0.7% of fixed-effect variance (marginal R2 = 0.007) and 6.7% including random effects (conditional R2 = 0.067), indicating that body size alone does not predict ATA. An exact restricted likelihood ratio test did not reject the model without the population random intercept (χ2 = 1.22, df = 1, p = 0.270); nevertheless, population identity was retained in all subsequent models because individuals from the same breeding site cannot be assumed to be statistically independent.
3.2. Sexual Selection Predictors
rTTM showed a weak, non-significant negative association with ATA after controlling for SVL (fixed covariate) and population identity (random intercept) (Est = −0.089, t = −1.551, p = 0.123; marginal R2 = 0.020, conditional R2 = 0.080; Table 2). No significant correlation was detected between adult OSR and ATA (log10(SVL) and log10(TTM) as fixed covariates; population identity as a random intercept; Est = 0.001, t = 0.027, p = 0.980; marginal R2 = 0.023, conditional R2 = 0.111). We note, however, that rTTM reflects both mating-system-level sperm competition and individual reproductive investment (see Section 4.6), so this test assesses the validity of the proxy within this species rather than sperm competition per se.
Table 2.
Linear mixed-effect models of absolute testis asymmetry (ATA) across the five population-level hypotheses, with the baseline model (M0) for reference. All models include log10(SVL) as a covariate; models (ii)–(v) additionally include log10(total testis mass); population identity is fitted as a random intercept; n = 173.
3.3. Natural Selection Predictors
3.3.1. PH Test
ATA was not associated with rLM (Est = −0.003, t = −0.057, p = 0.954; marginal R2 = 0.021, conditional R2 = 0.078). As liver mass is the key anatomical variable used to infer abdominal spatial constraints under the PH, our intraspecific dataset provides no empirical support for this hypothesis within R. kukunoris.
3.3.2. Geographic Gradient Analyses
After controlling for population identity, SVL and TTM, altitude showed no significant linear correlation with ATA (Est = −4.708 × 10⁻⁵, t = −1.268, p = 0.260; marginal R2 = 0.033, conditional R2 = 0.086). Similarly, latitude failed to predict ATA (Est = 0.011, t = 0.846; p = 0.446; marginal R2 = 0.029, conditional R2 = 0.101). Geographically mediated developmental stress along elevation and latitudinal gradients did not alter the degree of ATA in this high-altitude frog species (Figure 2, (1) and (2)). Ambient temperature (Est = 0.009, SE = 0.008, p = 0.337; Supplementary Table S1) and rainfall (Est = −0.0001, SE = 0.0001, p = 0.385) likewise showed no significant association with ATA. At the population level, mean ATA was also uncorrelated with population-mean temperature (ρ = 0.179) and rainfall (ρ = −0.393) (Supplementary Table S2). The standardized effect sizes of all five predictors are summarized in Figure 3.
Figure 2.
Geographic stability of absolute testis asymmetry (ATA) across the seven sampling populations. (1) ATA for each population, ordered by altitude (indicated beneath each population code); boxes show medians and interquartile ranges, and points are individual males (jittered horizontally). (2) Population median ATA plotted against altitude; circle area is proportional to sample size; ATA did not vary systematically across populations (see Table 2 for model results).
Figure 3.
Standardized effect sizes (β ± 95% CI) of the five population-level predictors on absolute testis asymmetry, from the models in Table 2. Continuous predictors were z-standardized for comparability; note that coefficients are comparable across predictors within a model but not across models; all confidence intervals include zero.
At the population level, Spearman rank correlations between population-mean ATA and each population-level predictor were weak and non-significant: altitude (ρ = −0.393), latitude (ρ = 0.214), OSR (ρ = −0.036), population-mean temperature (ρ = 0.179), population-mean rainfall (ρ = −0.393), population-mean body condition (ρ = −0.429) and population-mean total testis mass (ρ = 0.321) (all p ≥ 0.354; Supplementary Table S2). These exploratory analyses, based on only seven independent units, are consistent with the individual-level mixed-model results. Population-mean body condition was likewise uncorrelated with site-level temperature (ρ = −0.321, p = 0.498) and rainfall (ρ = 0.143, p = 0.783).
3.3.3. Independent Tests of the CH
- Association between ATA and TTM
ATA was not significantly associated with TTM (Est = −0.034, t = −0.370, p = 0.712; Table 3); that is, greater asymmetry was not accompanied by reduced total gonadal investment, satisfying the necessary condition specified in Section 2.4.2. Both body condition (Est = 0.943) and body size (Est = 2.806) were strong positive predictors of TTM (both p < 0.001; marginal R2 = 0.452, conditional R2 = 0.559; Figure 4a).
Table 3.
Linear mixed-effect models testing the compensation hypothesis (CH): total-investment test, bilateral trade-off tests, and the supplementary body-condition sensitivity analysis. Response variables are given in the Model column; all models included population identity as a random intercept. Estimates for the shared covariate baseline model (M0) are reported in Table 2.
Figure 4.
Opposite condition dependence of total testis mass and absolute testis asymmetry. Lines show model-adjusted predictions (±95% CI) from linear mixed models with population identity as a random intercept, with all other fixed covariates held at their means; grey points are raw observations. (a) Total testis mass increased with body condition index (BCI; Est = 0.943, p < 0.001). (b) ATA decreased with BCI (Est = −0.266, p = 0.014).
- No antagonistic developmental trade-off between contralateral testes
For LD individuals, right testis mass strongly positively predicted left testis mass (Est = 0.666, t = 9.973, p < 0.001; Table 3). For RD males, left testis mass was a significant positive predictor of right testis mass (Est = 0.699, t = 12.706, p < 0.001). In both subgroups, left and right testes exhibited synchronous, coordinated growth rather than compensatory antagonism. This bilateral co-development pattern is not consistent with the mechanistic premise of the CH, which assumes one testis overgrows to compensate for reduced development of the contralateral gonad.
Collectively, the bilateral trade-off models provide evidence against the compensatory mechanism as the dominant determinant of bilateral testis growth at the within-individual level, whereas the total-investment model indicates that absolute asymmetry entails no measurable gonadal cost; together with the negative condition dependence of asymmetry (Section 3.3.4), these results do not support the CH, although cross-sectional data cannot directly capture developmental compensation (Section 4.6).
3.3.4. Sensitivity of ATA to Body Condition
Body condition exhibited a significant negative effect on ATA (Est ± SE = −0.266 ± 0.107, t = −2.473, p = 0.014), whereas log10(SVL) was non-significant (p = 0.278). The model explained 3.9% of fixed-effect variance (marginal R2) and 10.1% including random effects (conditional R2 = 0.101), consistent with the trade-off evidence against the CH (Figure 4a,b); we note, however, that body condition accounts for only a modest proportion of the variance in asymmetry, and the association is correlative rather than demonstrably causal.
Sensitivity analyses confirmed the robustness of these inferences (Supplementary Table S1). Under Gamma GLMMs, all population-level predictors—including the supplementary climatic variables temperature (Est = 0.055, p = 0.382) and rainfall (Est = −0.0011, p = 0.244)—remained non-significant, and the negative effect of BCI on ATA persisted (Est = −2.731, p = 0.009). After excluding extreme observations (n = 167), all population-level predictors remained non-significant except rTTM, which became significantly negative (Est = −0.077, p = 0.048)—consistent with the weak negative trend in the full-sample model (p = 0.123) and reinforcing, rather than altering, the interpretation in Section 4.3 that the within-species rTTM–ATA association runs opposite to the positive interspecific pattern. The negative BCI effect also persisted (Est = −0.156, p = 0.034).
4. Discussion
4.1. Geographic Stability of ATA Versus Species-Specific Clines in Testis Mass
Our analysis revealed no significant associations between ATA and either altitude or latitude in R. kukunoris, despite substantial environmental variation across the seven sampling populations (2297–3441 m). This finding parallels the latitudinal stability of directional testis asymmetry (DA) reported for Rana temporaria across 22 European populations [13]. Within R. kukunoris itself, Li et al. [14] reported that directional testis asymmetry varies with environmental temperature rather than directly with altitude, suggesting that thermal conditions—not elevation per se—shape the direction of gonadal asymmetry. Together with Li et al. [14], the two analyses of the same dataset are thus complementary rather than redundant: the earlier work showed that the direction of testicular asymmetry varies (marginally) with ambient temperature, whereas the present study demonstrates that its magnitude does not vary along any geographic gradient—and, in contrast to the weak thermal signal in DTA, is instead predicted by individual body condition. Overall, these results suggest that the magnitude of testicular asymmetry, whether measured as directional or absolute disparity, is largely invariant along geographic gradients in explosive-breeding anurans.
The stability of ATA contrasts sharply with the species-specific clinal patterns observed for relative testis mass in anurans. In explosive breeders distributed across high-elevation or high-latitude environments—including R. kukunoris [15], R. temporaria [13], and the Tibetan toad Scutiger boulengeri [22]—relative testis mass consistently declines with increasing altitude or latitude, reflecting constrained resource allocation under shortened activity seasons and reduced pre-hibernation energy reserves. By contrast, two subtropical prolonged breeders show the opposite trend: relative testis mass and sperm length increase with elevation in Fejervarya limnocharis [23], and sperm length also differs between high- and low-altitude populations of the spot-legged treefrog Polypedates megacephalus [24]. Species with intermediate breeding phenologies, such as the Yunnan pond frog Dianrana pleuraden [17] and the swelled vent frog Feirana quadranus [25], exhibit no significant altitudinal clines in testis mass. Such interspecific inconsistency indicates that the direction of the testis-mass cline is co-determined by breeding type, seasonal resource supply, and OSR dynamics [23,26].
Why is ATA geographically stable while testis mass shows pronounced species-specific clines? One explanation lies in the developmental architecture underlying these two traits. TTM is a condition-dependent trait whose plastic response to environmental gradients is well documented [27,28], whereas bilateral asymmetry reflects the canalization of paired organ development—a trait governed primarily by genetic regulation rather than short-term environmental fluctuation [29]. Because asymmetric organ development requires coordinated regulation of both sides, stabilizing selection may favour a robust developmental programme that buffers environmental perturbations, thereby maintaining a stable asymmetry magnitude regardless of local ecological conditions.
Importantly, however, this null result applies only to geographic (extrinsic) stress; individual-level physiological condition did influence ATA (see Section 4.2), suggesting that the developmental stability of paired gonads responds to body condition but appears to be buffered against broad-scale environmental gradients. These findings are therefore not consistent with the classical prediction that environmental stress elevates developmental instability and hence absolute asymmetry [29,30], although the absence of a detectable association should be interpreted cautiously given the moderate altitudinal range sampled (2297–3441 m) and our sample size. Moreover, this null result is unlikely to be an artefact of using altitude as a coarse proxy for local conditions: supplementary models using directly measured site-level climate variables—ambient temperature and annual precipitation (Supplementary Table S1)—likewise detected no association with ATA. In agreement with Hettyey et al.’s [13] findings for R. temporaria, we find no evidence that geographic gradients of altitude or latitude—or directly measured site-level climate variables, namely ambient temperature and precipitation (Supplementary Table S1)—intensify testicular asymmetry in anurans. The bilateral development of testes in these species appears to be under strong stabilizing control, our data provide no detectable support, at the current sample size, for ATA as a general indicator of environmental harshness in high-altitude endemic frogs. This conclusion is further supported by exploratory population-level analyses (n = 7 population means), which likewise showed only weak, non-significant rank correlations between mean ATA and any geographic, climatic or mating-system variable (Supplementary Table S2).
4.2. Opposite Condition Dependence of TTM and ATA
Our analyses revealed a striking divergence in how body condition influences the two components of testicular morphology in R. kukunoris. TTM was strongly and positively predicted by both body condition (BCI) and body size, confirming the condition-dependent expression of male reproductive investment widely documented across vertebrates [27,28]. This finding is consistent with previous intraspecific studies on anurans, including Fejervarya limnocharis [23], Feirana quadranus [25], and Dianrana pleuraden [17]. The mechanistic basis lies in the energetic cost of spermatogenesis [31,32]: males with greater somatic reserves can allocate more energy to gamete production, thereby elevating competitive fertilization success under sperm competition.
In contrast, our sensitivity analysis revealed a significant negative association between body condition and ATA: males with higher BCI exhibited lower bilateral disparity. This pattern directly contradicts Møller’s [1] prediction that high-quality males should develop greater DA as a reliable signal of male quality. Instead, our results support the classical fluctuating asymmetry framework [29,30], which posits that poor developmental or physiological conditions destabilize the coordinated development of paired organs, thereby elevating asymmetry. Under this interpretation, low-BCI males may have experienced greater developmental or maintenance stress, compromising the precision of bilateral testicular growth; alternatively, more-asymmetric gonads may impose higher maintenance costs that erode somatic reserves, or both traits may covary through unmeasured factors such as age, parasitism or early developmental history. Because our design is cross-sectional, the data establish an association but not its direction. Critically, our finding extends this framework to a level of condition dependence that previous studies have not detected: while prior intraspecific work on anurans reported no association between body condition and testis asymmetry—including Rana omeimontis [6], Hylarana guentheri [5], Rana nigromaculata [33], Scutiger boulengeri [22], and Feirana quadranus [7]—we document a statistically significant negative relationship, albeit one of modest explanatory power (marginal R2 = 0.039). This difference may reflect our substantially larger sample size, which provides greater power to detect condition-dependent developmental effects, or species-specific differences in the sensitivity of bilateral gonadal development to body condition.
The apparently conflicting positive condition dependence of TTM and negative condition dependence of ATA can be reconciled within a single energetic framework. One parsimonious interpretation is that high-BCI males possess greater resource reserves, which simultaneously (i) permit increased allocation to spermatogenic tissue—hence larger testes—and (ii) buffer developmental instability during bilateral gonad growth—hence lower asymmetry. Under this reading, condition would influence testis size and asymmetry through distinct physiological pathways: mass would reflect resource allocation to reproduction, whereas asymmetry would reflect the developmental stability of the allocation process itself. We emphasize that this framework is offered as an interpretation of the observed covariation rather than an empirically established mechanism; distinguishing among its predictions—and from alternative explanations including reverse causality—requires experimental manipulation of physiological state or longitudinal data (Section 4.6).
Geographically, however, neither pathway appears to generate altitudinal variation in ATA. Elevation showed no significant effect on body condition in our dataset (Est ± SE = 0.003 ± 0.041 per 1000 m, t = 0.073, p = 0.944), indicating that the 2297–3441 m gradient across our seven sampling populations did not produce measurable differences in body condition. More broadly, this null result is unlikely to reflect the use of altitude as a coarse proxy for local conditions: population-mean body condition was likewise uncorrelated with directly measured site-level temperature and precipitation. Although precipitation co-varies perfectly with altitude along our transect and cannot be separated from it, ambient temperature—the one climatic variable that departs from a monotonic altitudinal trend in our sample—showed no association with body condition either, indicating that the local thermal regime, like altitude itself, did not predict among-population variation in body condition (though these correlations rest on only seven independent units and can detect only very strong associations). A broadly similar pattern has been reported for the Yunnan pond frog Dianrana pleuraden, in which body condition also showed no significant association with altitude across a comparable altitudinal transect [17]. This stability of body condition across altitude in two montane anuran species may reflect local physiological adaptation that buffers the energetic costs of high-altitude life [34], or, alternatively, the relatively narrow altitudinal ranges sampled in both studies—2297–3441 m in the present study and ~1150–2300 m in Mai et al. [17]—which may not capture the altitudinal extremes where energetic constraints are most severe. Because body condition is stable across altitude but strongly predicts ATA within populations, the geographic invariance of ATA we observed can be partially explained: if the primary individual-level driver of asymmetry does not vary among populations, then no altitudinal cline in asymmetry is expected.
Our results thus challenge Møller’s [1] interpretation of testis asymmetry as a male-quality signal and instead support the view that absolute asymmetry reflects developmental instability under physiological stress [29,30]. Within R. kukunoris, body condition emerges as the strongest individual-level correlate of both the magnitude of reproductive investment (TTM) and the precision of bilateral gonadal development (ATA), plausibly serving as a proximate link between energetic status and gonadal morphology, although its mechanistic role remains to be established experimentally.
It is worth noting that Hettyey et al. [13] reported a positive association between directional testis asymmetry (DA) and body mass in Rana temporaria, which appears superficially inconsistent with our finding. However, DA and ATA capture different developmental dimensions: DA measures a consistent left–right bias that may enlarge with overall organ size, whereas ATA reflects the magnitude of bilateral disparity independent of direction. Our results therefore do not contradict Hettyey et al. [13] but rather suggest that absolute and directional components of testicular asymmetry respond differently to individual condition.
4.3. Sperm Competition and OSR: No Detectable Effects on ATA
Classical sexual selection theory predicts that male-biassed OSR intensifies sperm competition risk, thereby selecting for increased ejaculate production [35,36,37]. In R. kukunoris, however, neither OSR nor rTTM—two complementary proxies of pre- and post-copulatory sperm competition—showed a significant association with ATA. The weak negative direction of the rTTM–ATA—which became statistically significant after excluding extreme observations (Supplementary Table S1)—is theoretically intriguing because it runs opposite to the interspecific pattern recently documented for anurans—and in contrast to the weak positive temperature effect on directional asymmetry reported for the same populations by Li et al. [14].
In a comparative analysis of 116 anuran species, Jiang et al. [9] found that residual combined testes mass was positively associated with the magnitude of testes size asymmetry, which the authors interpreted as evidence that post-copulatory sperm competition favours unilateral enlargement of one testis to achieve physiological efficiency: when sperm production demand is high, increasing the output of a single testis is metabolically cheaper than symmetrically expanding both [9,12]. By contrast, Calhim & Montgomerie [12] reported the opposite direction across 67 bird families—species with higher sperm competition show more symmetrical testes, presumably because symmetric paired testes maximize total sperm output without unilateral trade-offs. Our finding of a weakly negative rTTM–ATA association in R. kukunoris therefore appears more consistent with the avian pattern than with the anuran interspecific trend, suggesting that the direction of the sperm competition–asymmetry relationship is not taxonomically universal and may depend on the level of biological organization examined, although this inference rests on rTTM as a proxy whose intraspecific validity is itself uncertain (see below).
Why should intraspecific patterns diverge from interspecific ones? Two non-mutually exclusive explanations are plausible. First, interspecific comparisons capture the outcome of long-term evolutionary divergence, during which sperm competition has had sufficient time to shape developmental architecture; within a single species, however, contemporary variation in sperm competition intensity—as indexed by residual testis mass—may operate on timescales too short to alter bilateral coordination, which is buffered by canalized developmental programmes [29]. Second, our high-altitude sampling design introduces ecological constraints (shortened activity seasons, limited pre-hibernation energy storage) that may weaken the link between sperm competition proxies and actual mating success, thereby diluting any expected positive association. Under either interpretation, the weak negative direction we observed suggests that, within R. kukunoris, individuals with relatively larger testes do not exhibit elevated asymmetry—a pattern more consistent with the avian scenario of symmetrical maximization of sperm output than with the anuran interspecific pattern of unilateral enlargement.
The OSR pathway reinforces this conclusion. Across anuran species, the relationship between OSR and testis mass is heterogeneous: positive in the prolonged breeders Feirana quadranus [25] and Fejervarya limnocharis [23], absent in Dianrana pleuraden [17], and even reversed in the explosive breeder Rana temporaria, where a progressively more male-biassed OSR towards northern latitudes is accompanied by smaller rather than larger testes [13]. Because R. kukunoris is an explosive breeder closely related to R. temporaria, our finding that OSR does not predict ATA fits within this heterogeneous landscape and reinforces the interpretation that, in high-altitude explosive breeders, seasonal energetic constraints frequently override the predicted effects of mating competition on gonadal traits.
The non-significant associations of both sperm competition proxies with ATA—the pre-copulatory proxy (OSR) and the post-copulatory proxy (rTTM)—indicate that, within the limits of these proxies, we found no evidence that sexual selection shapes bilateral testicular coordination in this species. We emphasize that this is an absence of evidence rather than evidence of absence: rTTM in particular reflects individual reproductive investment as well as mating-system-level sperm competition (BCI and body size jointly explained 45% of the variance in TTM; Section 3.3.3), and the statistical power of population-level tests is limited (Section 2.4), so weaker effects of sperm competition on asymmetry cannot be excluded. This decoupling stands in sharp contrast to the strong condition dependence of TTM documented in our dataset, highlighting that the magnitude of reproductive investment and the precision of its bilateral deployment respond to different selective regimes. While classical theory predicts that sperm competition should shape how much testicular tissue is produced [37], our data provide no evidence that it shapes how symmetrically that tissue develops. This distinction—between the determinants of gonad size and those of gonad symmetry—has received little empirical attention in wild anurans, and our results suggest it deserves more explicit testing.
A further, currently unmeasured pathway deserves attention: variation in female fecundity among populations. Because body size and reproductive investment vary substantially among the seven R. kukunoris populations [16], and female fecundity in anurans is almost universally positively correlated with female body size [16], the average fecundity of females—and hence the total volume of eggs available for fertilization at a breeding aggregation—likely differs among our study populations. Under gamete-allocation theory, males should adjust sperm expenditure in relation to the fertilization opportunity provided by females: populations with higher per-female egg volumes may favour greater sperm production, which could in principle modulate total testis mass and potentially its bilateral coordination [12,37]. Conversely, whether sperm volume influences fertilization efficiency is debated: raffle models predict diminishing returns of sperm number once sperm-to-egg ratios exceed a threshold [37], and empirical studies suggest that fertilization success plateaus at moderate sperm concentrations. Because our dataset did not include female fecundity measures (all females were released unharmed at spawning sites), we could not incorporate egg volume as a covariate. We note, however, that OSR—the ratio of competing males to fertilizable females, which partly captures the per-male fertilization opportunity—was included and showed no association with ATA (Section 3.2). Future studies should jointly quantify female fecundity (egg number and volume) and male ejaculate traits to test whether inter-population variation in female gamete availability shapes testis size or asymmetry.
4.4. Adaptive Hypotheses of Testis Asymmetry: No Support Within a Species
4.4.1. CH: Refuted by Trade-Off and Condition-Dependence Tests, with No Measurable Gonadal Cost of Asymmetry
The CH posits that unilateral developmental impairment of one testis triggers compensatory overgrowth of the contralateral gonad, rendering asymmetry a reliable proxy for male somatic quality [1]. Our data provide no support for the CH across three complementary tests within R. kukunoris. First, the total-investment check showed that ATA was not significantly associated with TTM: highly asymmetric individuals maintained equivalent total gonadal investment, satisfying the necessary condition that asymmetry entails no measurable gonadal cost; although this null pattern alone does not refute CH, it establishes the premise under which the following remaining tests apply. Second, the bilateral trade-off tests—the most informative test available under our cross-sectional design— revealed strong positive relationships between contralateral testis masses in both LD and RD subgroups. This pattern is opposite in direction to the compensatory trade-off predicted by CH, in which the smaller testis would enlarge at the expense of the dominant one; instead, both testes grew synchronously, consistent with a developmental programme in which bilateral gonad growth is regulated by shared systemic factors rather than by unilateral feedback from the contralateral organ. However, we acknowledge that positive correlations between paired organs can also arise from among-individual variation in overall gonadal investment, which is substantial in our dataset (BCI and body size jointly explained 45% of the variance in TTM), and such correlations therefore do not by themselves exclude a compensatory component in testicular development. Directly detecting compensation would require experimental perturbation of one testis or sampling at developmental stages, which lies beyond our cross-sectional design (Section 4.6). Third—and opposite in direction to CH’s quality-signal prediction—our sensitivity analysis showed that body condition negatively predicted ATA, consistent with individuals in better condition having more symmetrical testes (see Section 4.2 for caveats). This finding runs opposite to Møller’s [1] prediction that high-quality males should exhibit larger asymmetry as a quality signal, and instead supports the fluctuating asymmetry framework [29,30].
Collectively, these tests do not support CH at its two directly testable levels—the proposed compensatory mechanism (synchronous bilateral growth rather than trade-off) and the proposed quality-signal function (negative rather than positive condition–asymmetry association)—while the total-investment null confirms that asymmetry carries no measurable gonadal cost, the very premise CH requires. Our results align with the growing body of intraspecific negative evidence from anurans, including Rana omeimontis [6], Hylarana guentheri [5], Rana nigromaculata [33], and Feirana quadranus [7]. Critically, however, our dataset is the first to combine all three test types within a single species, providing a more comprehensive assessment of CH than any previous intraspecific study on anurans.
4.4.2. PH: No Support Within a Species, but a Cautionary Note on Scale-Dependent Extrapolation
The PH attributes testicular asymmetry to abdominal spatial constraints imposed by asymmetric visceral organs, especially the liver [8,38]. Our analysis revealed no association between rLM and ATA in R. kukunoris, providing no empirical support for PH at the intraspecific level.
This finding contrasts sharply with the strong positive association reported by Jiang et al. [9] across 116 anuran species. The scale-dependent discrepancy is theoretically important for two reasons. First, PH is fundamentally an interspecific hypothesis: it was originally formulated to explain species-level divergence in gonad morphology arising from asymmetric visceral arrangements [38]. Within a single species, the relative position of the liver, gut and gonads is anatomically conserved; short-term liver mass variation reflects fluctuating pre-hibernation energy storage rather than stable anatomical differentiation [11]. Thus, intraspecific liver variation simply lacks the structural variation necessary to generate testicular asymmetry. Second, even if liver mass within a species were to influence testis growth, the direction of this effect would likely differ from that observed across species. Between species, larger liver size may reflect an evolutionarily stable anatomical arrangement that constrains one gonad; within species, larger liver mass may simply indicate recent feeding activity or pre-hibernation fat storage, which would either be neutral or even facilitate gonad growth through enhanced energetic reserves.
Our results therefore suggest that PH, while widely supported at the interspecific level [9], cannot be directly extrapolated to explain intraspecific variation in testicular asymmetry. This cautionary finding is important because previous intraspecific studies have implicitly assumed scale-dependent equivalence between the two levels of analysis. We argue that hypotheses derived from interspecific comparisons require independent validation before being applied to within-species contexts, a principle that extends to other morphological hypotheses in anuran reproductive ecology.
4.4.3. Synthesis: Why Do Adaptive Hypotheses Find No Support Within a Species?
The absence of support for both CH and PH within R. kukunoris can be reconciled within a broader evolutionary–ecological framework. Both hypotheses were originally derived from interspecific patterns, and their predictions rely on long-term evolutionary divergence in either developmental programmes (CH) or anatomical arrangements (PH). Within a single species, contemporary variation in gonad morphology is shaped primarily by three processes: (1) condition-dependent growth, whereby BCI and body size strongly predict TTM, confirming that reproductive investment is responsive to individual energetic status; (2) developmental stability, whereby BCI was negatively associated with ATA, suggesting that bilateral coordination is sensitive to individual physiological stress, consistent with fluctuating asymmetry theory [29]; and (3) species-specific anatomy, whereby interspecific variation in liver–gonad spatial relationships (PH) and compensatory mechanisms (CH) reflects evolutionary divergence; the developmental processes underlying CH in particular cannot be observed directly from cross-sectional adult measurements (Section 4.6), so within-species datasets such as ours are inherently limited in this respect.
Together, our results suggest that the two dominant adaptive hypotheses for testis asymmetry—compensation and packaging—explain between-species patterns rather than within-species variation, and that within-species asymmetry is better predicted by individual condition and developmental stability than by evolutionary selection on gonad architecture. Given the limited number of populations and the cross-sectional nature of our data (Section 4.6), this interpretation should be regarded as provisional pending broader sampling and experimental tests.
4.5. Inter-Specific Divergence of Altitudinal Life-History Clines in Anurans
Amphibian reproductive traits show highly variable altitudinal patterns driven by interactions among climate, resource availability, and mating strategy [39]. Drawing on published intraspecific studies, four distinct gonad clines can be recognized.
(i) Explosive ranids at high altitudes/latitudes: Relative testis mass declines with elevation or latitude in Rana kukunoris [15], Rana temporaria [13], and the Tibetan toad Scutiger boulengeri [22]—a consistent pattern attributed to shortened activity seasons and reduced pre-hibernation energy storage.
(ii) Subtropical/tropical prolonged breeders: Relative testis mass and sperm length increase with elevation in Fejervarya limnocharis [23], and sperm length is greater at high-altitude sites in Polypedates megacephalus [24]—a pattern interpreted as intensified sperm competition under synchronous breeding at higher elevations.
(iii) Intermediate montane breeders: Relative testis mass shows no significant altitudinal cline in Dianrana pleuraden [17] and Feirana quadranus [25]—a pattern attributed to energetic constraints that offset any selective advantage of larger testes at higher elevations.
(iv) The present study: ATA in R. kukunoris shows no significant change across 2297–3441 m, extending a pattern of geographic stability also reported for directional testis asymmetry in R. temporaria [13] and for the temperature-dependent directional bias in R. kukunoris [14].
No universal rule explains this interspecific divergence; key drivers include activity season length, breeding synchrony, thermal energy cost and somatic–reproductive trade-offs [11,34]. Critically, our findings suggest a hierarchical view of geographic variation in anuran testicular morphology: TTM responds to altitudinal gradients in a species-specific manner depending on breeding phenology and energetic constraints, whereas bilateral asymmetry magnitude remains buffered across altitudinal gradients irrespective of breeding system. This decoupling implies that the developmental stability of paired gonads is maintained by canalized programmes that are insensitive to the ecological factors driving condition-dependent variation in organ size [29], offering a unified explanation for the divergent clinal patterns we observe across traits within and among anuran species.
4.6. Limitations and Future Perspectives
Several limitations should be acknowledged. First, our sampling covered seven populations spanning 2297–3441 m, which represents the altitudinal range within which R. kukunoris is readily accessible but may not capture the full altitudinal extent of the species (2200–4400 m); broader geographic sampling, particularly at higher elevations, would strengthen inferences about altitudinal patterns. We note, however, that the site-level temperature and precipitation now included (Supplementary Table S1) are still single-point climatological means rather than microhabitat measurements; fine-scale thermal heterogeneity within breeding sites could influence developmental stability in ways our design cannot capture, and microclimate loggers at breeding pools would be needed to address this. A related statistical constraint is that population-level predictors (altitude, latitude, OSR, climate) vary only among populations, so the effective sample size for these tests is n = 7 rather than 173; with seven units, only correlations of |ρ| ≥ 0.71 would reach significance (α = 0.05, two-tailed), and even the strongest association we observed (ρ = 0.429 between population-mean body condition and ATA) remains non-significant (p = 0.354). Although the random intercept accounts for clustering, it does not increase the number of independent population-level observations. Consequently, the non-significant population-level associations should be interpreted as a failure to detect effects at this sample size rather than as evidence for their absence [40]; the population-level analysis (Supplementary Table S2) was likewise exploratory. Second, our data are cross-sectional, collected during a single breeding season; without interannual repeats or common-garden experiments, we cannot disentangle phenotypic plasticity from genetic adaptation in the observed morphological patterns. Moreover, developmental compensation is a dynamic process that cannot be observed directly from adult organ masses, and positive correlations between paired organs may partly reflect among-individual variation in overall gonadal investment; experimental perturbation or developmental-stage sampling would be required to test the compensatory mechanism directly. Third, although we measured liver mass as an index of energetic reserves for testing the PH, we did not quantify fat body mass, which serves as the primary pre-hibernation energy storage organ in anurans [11]; combined liver and fat body measurements would provide a more comprehensive index of somatic energy reserves. Fourth, the OSR was estimated from 3 to 5 days of sampling per population and serves only as an approximate proxy for pre-copulatory mating competition; direct measures of multiple paternity through genetic parentage analysis would be required to verify actual sperm competition intensity. Fifth, rTTM—our proxy for post-copulatory sperm competition—reflects both species-level mating system and individual condition, and its intraspecific validity is weaker than in comparative analyses [9]; in particular, because BCI and body size strongly predict TTM in our dataset, variation in rTTM among individuals may largely reflect physiological condition and reproductive investment rather than sperm competition intensity. Direct measures such as genetic paternity analysis (see Future Work, item iv) would be needed to establish the link between testis mass and actual sperm competition within populations. Sixth, female fecundity was not quantified in this study, so we could not test whether inter-population variation in female gamete availability affects male testis mass or asymmetry, even though such variation is expected from the pronounced divergence in female body size among populations. Paired measurements of female fecundity and male gonad traits are needed in future work. Finally, although our sensitivity analysis revealed a robust negative association between body condition and ATA, this effect was of modest explanatory power (marginal R2 = 0.039), its direction cannot be established from cross-sectional data (Section 4.2), and the residual-based BCI may retain residual covariance with body size; the underlying mechanism linking condition to bilateral developmental precision therefore remains speculative without experimental manipulation of physiological state.
Future work should address these gaps through (i) expanded sampling across the full altitudinal range, including populations above 3500 m; (ii) common-garden transplant or reciprocal-rearing experiments to separate plastic from genetic contributions to morphological variation; (iii) direct quantification of fat body mass and visceral energy storage alongside liver mass; (iv) genetic parentage analysis to estimate actual sperm competition intensity; (v) longitudinal sampling to track individual changes in body condition and testis morphology across breeding seasons; and (vi) comparative sampling across montane anuran genera to test whether the decoupling between condition-dependent testis mass and condition-independent asymmetry—a pattern first revealed in the present study—generalizes across high-altitude amphibian lineages, and (vii) paired measurements of female fecundity (clutch size and egg volume) and male testis mass and asymmetry, to test whether male gametic investment tracks female gamete availability.
5. Conclusions
This study provides the first intraspecific test of the major adaptive hypotheses for testis asymmetry in a high-altitude endemic amphibian. Across 173 adult male R. kukunoris from seven populations spanning 2297–3441 m, ATA was not explained by any population-level predictor, including rTTM, rLM, OSR, altitude, latitude, ambient temperature, or rainfall. In contrast, poorer body condition was associated with more asymmetric testes, an association of modest explanatory power whose causal basis cannot be resolved from cross-sectional data, and the left and right testes grew synchronously within individuals, a pattern not consistent with the mechanistic premise of the CH. Our results indicate that ATA in R. kukunoris is neither constrained by visceral packaging nor shaped by sexual or environmental selection, but instead reflects the developmental stability of paired gonad growth as modulated by individual physiological condition. More broadly, adaptive hypotheses derived from interspecific comparisons, namely compensation and packaging, appear to explain between-species patterns rather than within-species variation, and require independent validation before being applied within species.
Supplementary Materials
The following supporting information can be downloaded at https://www.mdpi.com/article/10.3390/ani16223701/s1: Figure S1. Residual diagnostics (normal Q–Q plots and residuals versus fitted values) for all linear mixed-effect models reported in Table 2 and Table 3, together with additional models based on the signed asymmetry index and body condition (see Results). Model labels follow those tables. Residuals were approximately homoscedastic for all models; Q–Q plots showed mild tail departures from normality in some models, as expected given the non-negative, right-skewed distribution of ATA. Because of this, all ATA models were additionally refitted as Gamma GLMMs and after excluding extreme residuals as sensitivity analyses (Supplementary Table S1); all inferences were qualitatively unchanged. Table S1. Sensitivity analyses of the nine mixed-effect models with absolute testis asymmetry (ATA) as the response variable. For each model, the focal predictor’s estimate (Est), standard error (SE), p-value and sample size (n) are shown under (i) the original LMM (Table 1 and Table 2), (ii) a Gamma GLMM with log link (a constant of 10-1 added to ATA), and (iii) an LMM refitted after excluding observations with |scaled residual| > 3. Gamma GLMM coefficients are on the log scale and are not directly comparable in magnitude to LMM estimates; direction and significance are the relevant comparisons. Population identity was fitted as a random intercept in all models. Table S2. Exploratory Spearman rank correlations between population-mean absolute testis asymmetry (ATA) and population-level predictors (n = 7).
Author Contributions
Conceptualization, L.-M.W. and T.-L.Y.; methodology, L.-M.W., Z.-Y.Z. and T.-L.Y.; formal analysis, L.-M.W. and T.-L.Y.; investigation, L.-M.W., Z.-Y.Z. and T.-L.Y.; writing—original draft, L.-M.W., Z.-Y.Z. and T.-L.Y.; supervision, L.-M.W. and T.-L.Y. All authors have read and agreed to the published version of the manuscript.
Funding
The field research on the plateau brown frog was funded by National Natural Science Foundation of China number 31741019 and Natural Science Foundation of Henan Province of China number 252300421429.
Institutional Review Board Statement
This study was approved by the Animal Ethics Committee of Xinyang Normal University, Xinyang, Henan, China, approval code: XYEC-2014-008, approval date: 1 January 2012–1 January 2014.
Informed Consent Statement
Not applicable.
Data Availability Statement
The data that support the findings of this study are available from the corresponding author upon reasonable request.
Acknowledgments
We acknowledge the support provided by the staff of the Gahai-Zecha National Nature Reserve, which was instrumental in the success of our field surveys. The Gahai-Zecha National Nature Reserve Management Bureau approved this project and gave permission for fieldwork. No. GHZCRMB/03-212012 (date of approval: 21 March 2012–21 March 2013).
Conflicts of Interest
The authors declare no conflicts of interest.
Abbreviations
The following abbreviations are used in this manuscript:
| ATA | Absolute testis asymmetry |
| BCI | Body condition index |
| CH | Compensation hypothesis |
| DA | Directional asymmetry |
| DTA | Directional testis asymmetry |
| LD | Left-dominant |
| LMM | Linear mixed-effects model |
| OSR | Operational sex ratio |
| PH | Packaging hypothesis |
| RD | Right-dominant |
| REML | Restricted maximum likelihood |
| rLM | Residual liver mass |
| rTTM | Residual total testis mass |
| SVL | Snout–vent length |
| TA_signed | Signed testis asymmetry |
References
- Møller, A.P. Directional selection on directional asymmetry: Testes size and secondary sexual characters in birds. Proc. R. Soc. B 1994, 258, 147–151. [Google Scholar] [CrossRef] [Scilit]
- Yu, Z. Asymmetrical testicular weights in mammals, birds, reptiles and amphibia. Int. J. Androl. 1998, 21, 53–55. [Google Scholar] [CrossRef] [Scilit]
- Dias, A.; de Oliveira, S.; Cerri, P.; Sasso-Cerri, E. Bilateral asymmetry in bullfrog testes and fat bodies: Correlations with steroidogenic activity, mast cells number and structural proteins. Acta Histochem. 2022, 124, 151873. [Google Scholar] [CrossRef] [Scilit]
- Birkhead, T.; Buchanan, K.; DeVoogd, T.; Pellatt, E.; Székely, T.; Catchpole, C. Song, sperm quality and testes asymmetry in the sedge warbler. Anim. Behav. 1997, 53, 965–971. [Google Scholar] [CrossRef] [Scilit]
- Liu, Y.; Liao, W.; Zhou, C.; Mi, Z.; Mao, M. Asymmetry of testes in Guenther’s frog, Hylarana guentheri (Anuar: Ranidae). Asian Herpetol. Res. 2011, 2, 234–239. [Google Scholar] [CrossRef] [Scilit]
- Mi, Z.; Liao, W.; Jin, L.; Lou, S.; Cheng, J.; Wu, H. Testis asymmetry and sperm length in Rhacophorus omeimontis. Zool. Sci. 2012, 29, 368–372. [Google Scholar] [CrossRef] [Scilit]
- Yue, Y.; Jin, L.; Mai, C.; Huang, X.; Liao, W. No evidence for the compensation hypothesis in the swelled vent frog (Feirana quadranus). Asian Herpetol. Res. 2020, 11, 225–229. [Google Scholar] [CrossRef]
- Zancanaro, C.; Merigo, F.; Digito, M.; Pelosi, G. Fat body of the frog Rana esculenta: An ultrastructural study. J. Morphol. 1996, 227, 321–334. [Google Scholar] [CrossRef] [Scilit]
- Chen, S.; Jiang, Y.; Jin, L.; Liao, W. Testing the role of natural and sexual selection on testes size asymmetry in anurans. Biology 2023, 12, 151. [Google Scholar] [CrossRef] [Scilit]
- Chen, W.; Zhang, L.; Lu, X. Higher pre-hibernation energy storage in anurans from cold environments: A case study on a temperate frog Rana chensinensis along a broad latitudinal and altitudinal gradient. Ann. Zool. Fenn. 2011, 48, 214–220. [Google Scholar] [CrossRef] [Scilit]
- Chen, W.; Wang, X.; Fan, X. Do anurans living in higher altitudes have higher pre-hibernation energy storage? Herpetol. J. 2013, 23, 45–49. [Google Scholar]
- Calhim, S.; Montgomerie, R. Testes asymmetry in birds: The influences of sexual and natural selection. J. Avian Biol. 2015, 46, 175–185. [Google Scholar] [CrossRef] [Scilit]
- Hettyey, A.; Laurila, A.; Herczeg, G.; Jónsson, K.; Kovács, T.; Merilä, J. Does testis weight decline towards the Subarctic? A case study on the common frog (Rana temporaria). Naturwissenschaften 2005, 92, 188–192. [Google Scholar] [CrossRef] [Scilit]
- Li, H.; Shang, M.; Guo, J.; Chen, B.; Chen, P.; Yu, T. The directional testes asymmetry increases with temperature in seven plateau brown frog (Rana kukunoris) populations. Acta Herpetol. 2022, 17, 5–11. [Google Scholar] [CrossRef] [Scilit]
- Chen, W.; Pike, D.; He, D.; Wang, Y.; Ren, L.; Wang, X.; Fan, X.; Lu, X. Altitude decreases testis weight of a frog (Rana kukunoris) on the Tibetan Plateau. Herpetol. J. 2014, 24, 183–188. [Google Scholar]
- Yu, T.; Li, H.; Chen, B.; Chen, P.; Liu, X.; Wang, Y. Geographic variation in reproductive investment of seven populations of male brown frog (Rana kukunoris), endemic to the eastern Tibetan Plateau. Anim. Biol. 2022, 72, 245–256. [Google Scholar] [CrossRef] [Scilit]
- Mai, C.; Liu, Y.; Jin, L.; Mi, Z.; Liao, W. Altitudinal variation in somatic condition and reproductive investment of male Yunnan pond frogs (Dianrana pleuraden). Zool. Anz. 2017, 266, 189–195. [Google Scholar] [CrossRef] [Scilit]
- Liao, W.; Lou, S.; Zeng, Y.; Kotrschal, A. Large brains, small guts: The expensive-tissue hypothesis supported within anurans. Am. Nat. 2016, 188, 693–700. [Google Scholar] [CrossRef] [Scilit]
- R Core Team. R: A Language and Environment for Statistical Computing; R Foundation for Statistical Computing: Vienna, Austria, 2025. [Google Scholar]
- Kuznetsova, A.; Brockhoff, P.; Christensen, R. lmerTest package: Tests in linear mixed effects models. J. Stat. Softw. 2017, 82, 1–26. [Google Scholar] [CrossRef] [Scilit]
- Nakagawa, S.; Schielzeth, H. A general and simple method for obtaining R² from generalized linear mixed-effects models. Methods Ecol. Evol. 2013, 4, 133–142. [Google Scholar] [CrossRef] [Scilit]
- Zhang, L.; An, D.; He, Y.; Li, Z.; Fang, B.; Chen, X.; Lu, X. Variation in testis weight of the Tibetan toad Scutiger boulengeri along a narrow altitudinal gradient. Anim. Biol. 2018, 68, 429–439. [Google Scholar] [CrossRef] [Scilit]
- Jin, L.; Yang, S.; Lüpold, S.; Liao, W. Altitude underlies variation in the mating system, somatic condition, and investment in male Asian grass frogs (Fejervarya limnocharis). Behav. Ecol. Sociobiol. 2016, 70, 1197–1208. [Google Scholar] [CrossRef] [Scilit]
- Chen, C.; Huang, Y.; Liao, W. A comparison of testes size and sperm length between Polypedates megacephalus populations at different altitudes. Herpetol. J. 2016, 26, 249–252. [Google Scholar]
- Tang, T.; Luo, Y.; Huang, C.; Liao, W.; Huang, W. Variation in somatic condition and testis mass in Feirana quadranus along an altitudinal gradient. Anim. Biol. 2018, 68, 277–288. [Google Scholar] [CrossRef] [Scilit]
- Lüpold, S.; Fitzpatrick, J. Sexual selection and the evolution of sperm quality. Mol. Hum. Reprod. 2014, 20, 1180–1189. [Google Scholar] [CrossRef] [Scilit]
- Simmons, L.; Kotiaho, J. Evolution of ejaculates: Patterns of phenotypic and genotypic variation and condition dependence in sperm competition traits. Evolution 2002, 56, 1622–1631. [Google Scholar] [CrossRef] [Scilit]
- Schulte-Hostedde, A.; Millar, J. Condition dependence of testis size in small mammals. Evol. Ecol. Res. 2005, 7, 143–149. [Google Scholar]
- Palmer, A.R.; Strobeck, C. Fluctuating asymmetry: Measurement, analysis, patterns. Annu. Rev. Ecol. Syst. 1986, 17, 391–421. [Google Scholar] [CrossRef] [Scilit]
- Møller, A.; Swaddle, J. Asymmetry, Developmental Stability, and Evolution; Oxford University Press: Oxford, UK, 1997. [Google Scholar]
- Dewsbury, D. Ejaculate cost and male choice. Am. Nat. 1982, 119, 601–610. [Google Scholar] [CrossRef] [Scilit]
- Olsson, M.; Madsen, T.; Shine, R. Is sperm really so cheap? Costs of reproduction in male adders, Vipera berus. Proc. R. Soc. Lond. B 1997, 264, 455–459. [Google Scholar] [CrossRef] [Scilit]
- Zhou, C.; Mao, M.; Liao, W.; Mi, Z.; Liu, Y. Testis asymmetry in the dark-spotted frog Rana nigromaculata. Herpetol. J. 2011, 21, 181–185. [Google Scholar]
- Naya, D.; Veloso, C.; Bozinovic, F. Gut size variation among Bufo spinulosus populations along an altitudinal (and dietary) gradient. Ann. Zool. Fenn. 2009, 46, 16–20. [Google Scholar] [CrossRef] [Scilit]
- Emlen, S.; Oring, L. Ecology, sexual selection, and the evolution of mating systems. Science 1977, 197, 215–223. [Google Scholar] [CrossRef] [Scilit]
- Kvarnemo, C.; Ahnesjö, I. The dynamics of operational sex ratios and competition for mates. Trends Ecol. Evol. 1996, 11, 404–408. [Google Scholar] [CrossRef] [Scilit]
- Parker, G.; Pizzari, T. Sperm competition and ejaculate economics. Biol. Rev. 2010, 85, 897–934. [Google Scholar] [CrossRef] [Scilit]
- Witschi, E. Origin of asymmetry in the reproductive system of birds. Am. J. Anat. 1935, 56, 119–141. [Google Scholar] [CrossRef] [Scilit]
- Morrison, C.; Hero, J. Geographic variation in life-history characteristics of amphibians: A review. J. Anim. Ecol. 2003, 72, 270–279. [Google Scholar] [CrossRef] [Scilit]
- Nakagawa, S.; Cuthill, I. Effect size, confidence interval and practical significance: A practical guide for biologists. Biol. Rev. 2007, 82, 591–605. [Google Scholar] [CrossRef] [Scilit]
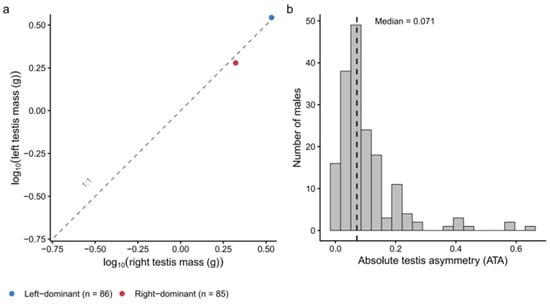
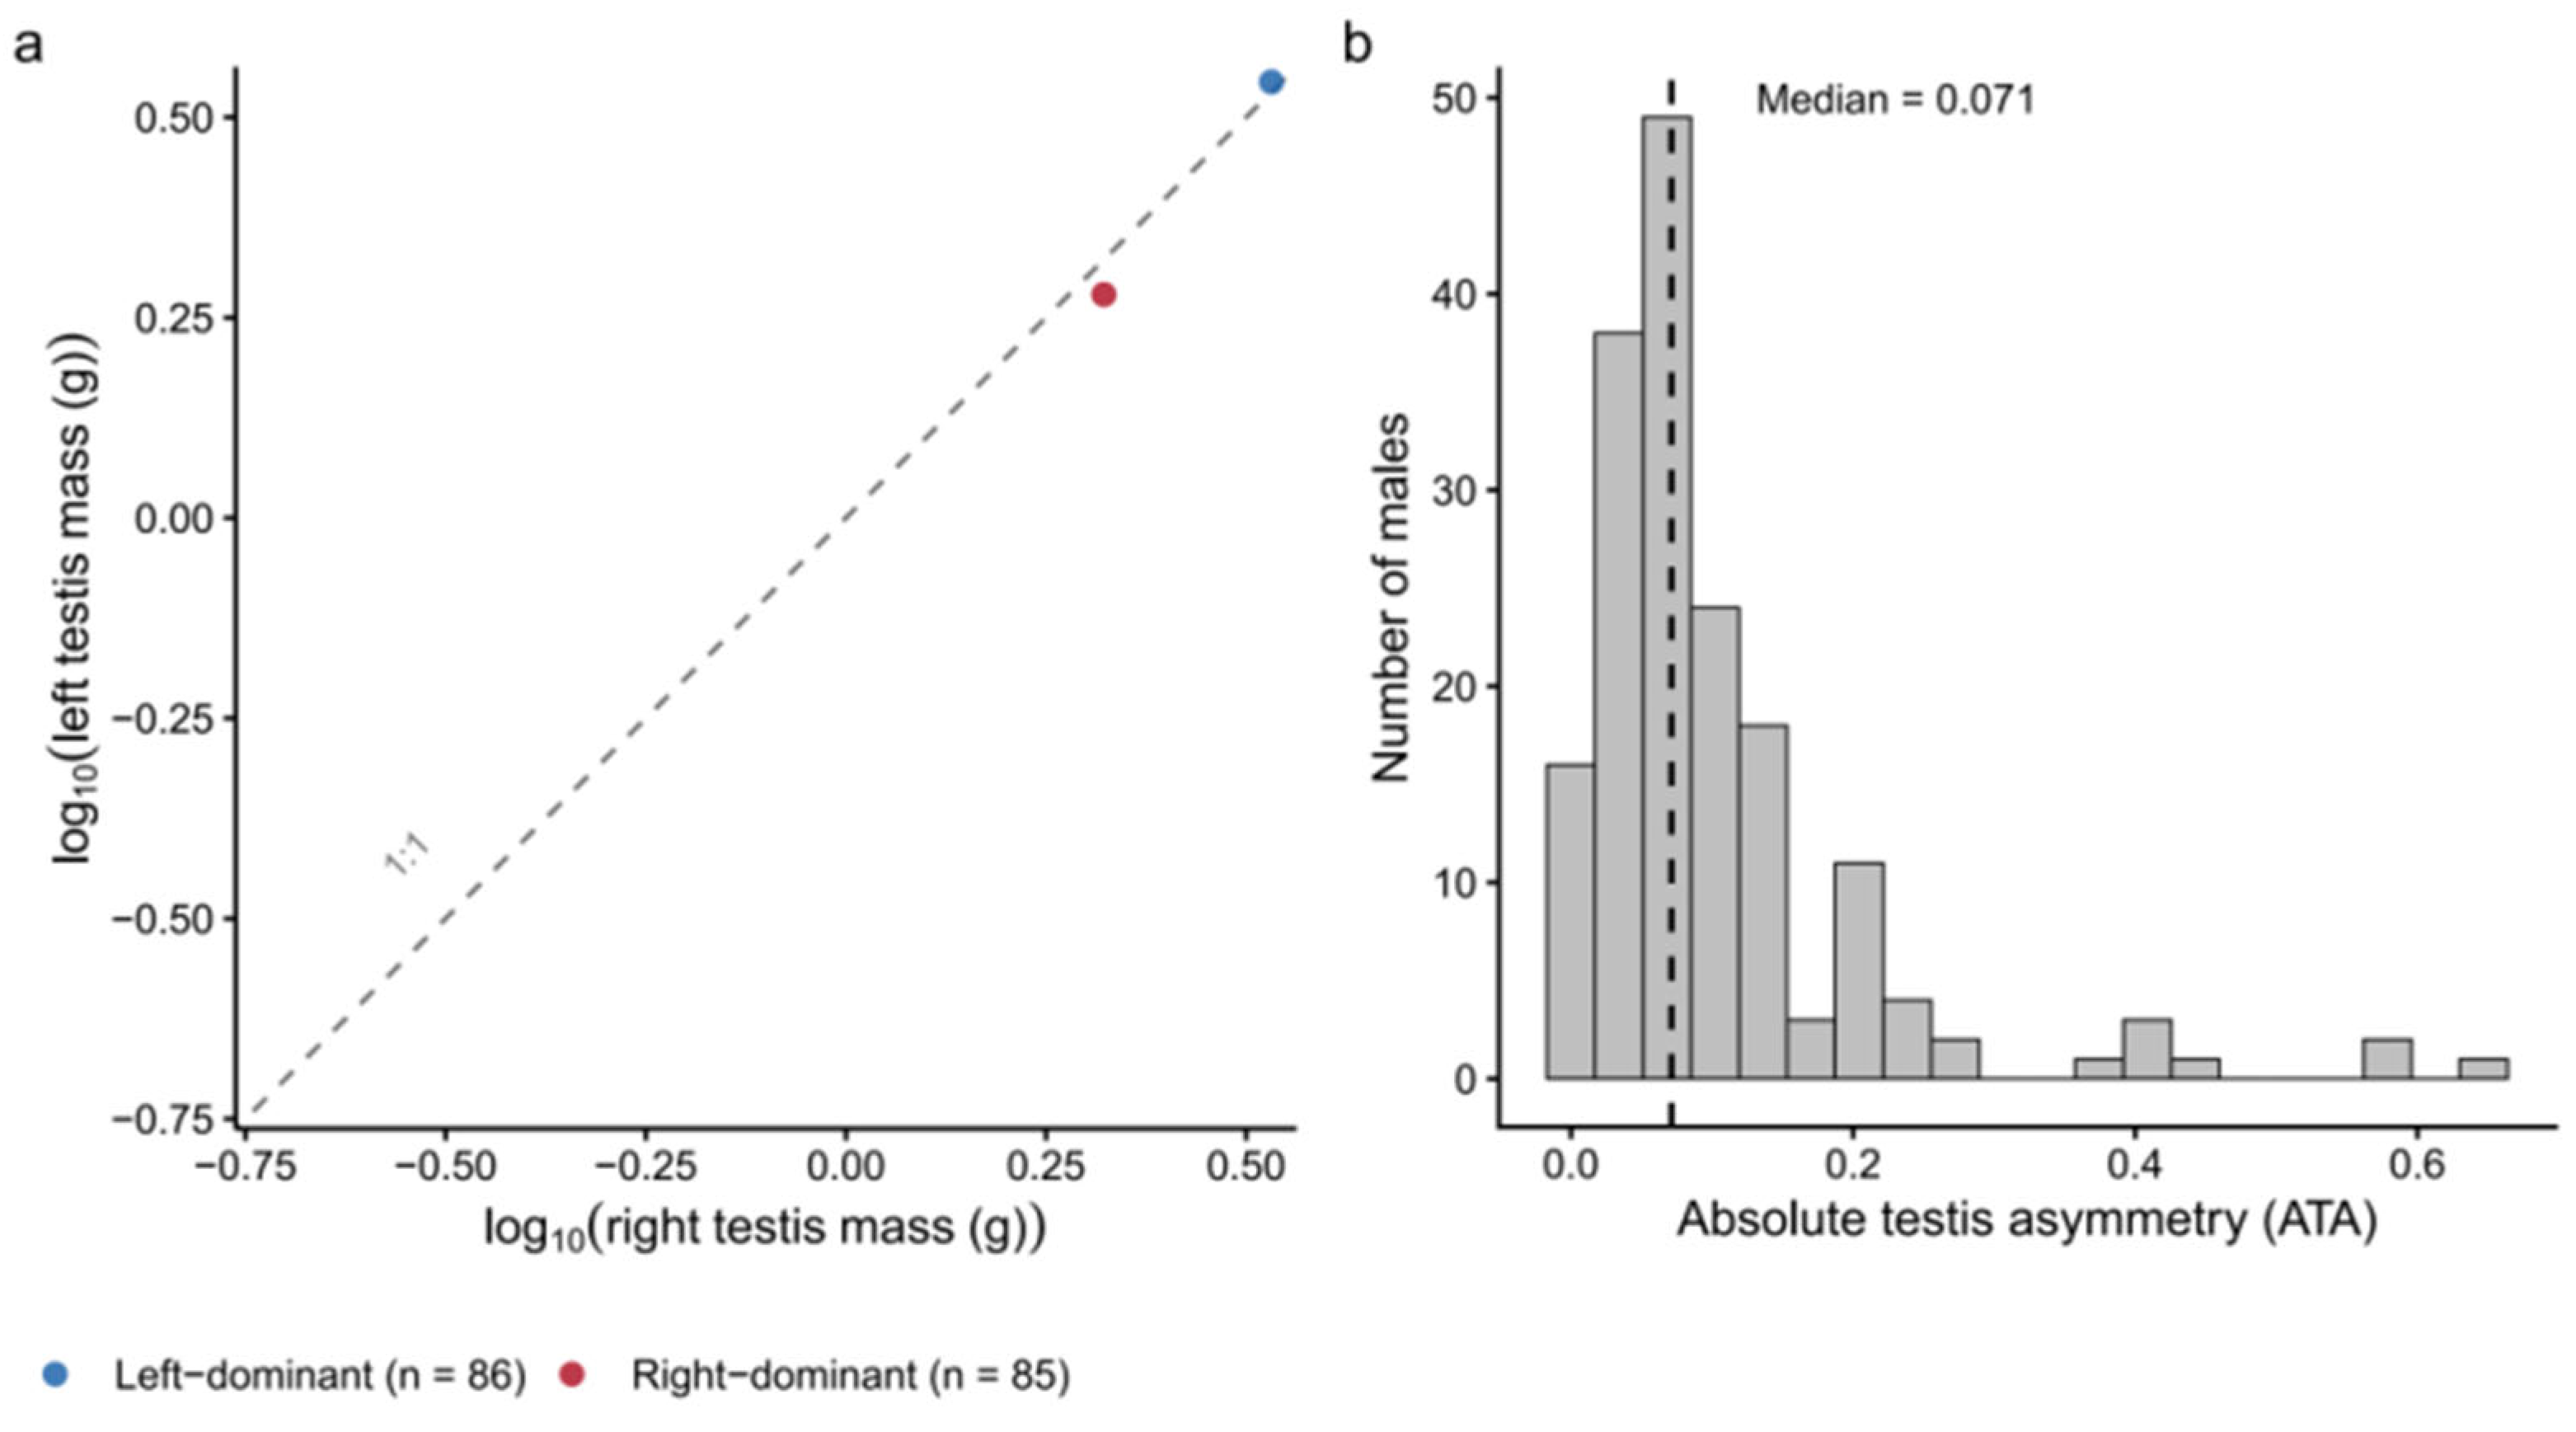
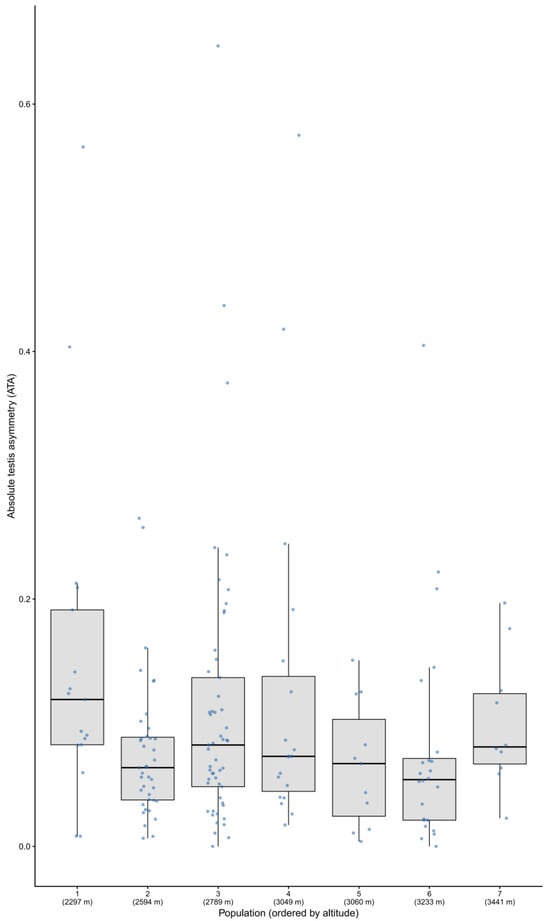
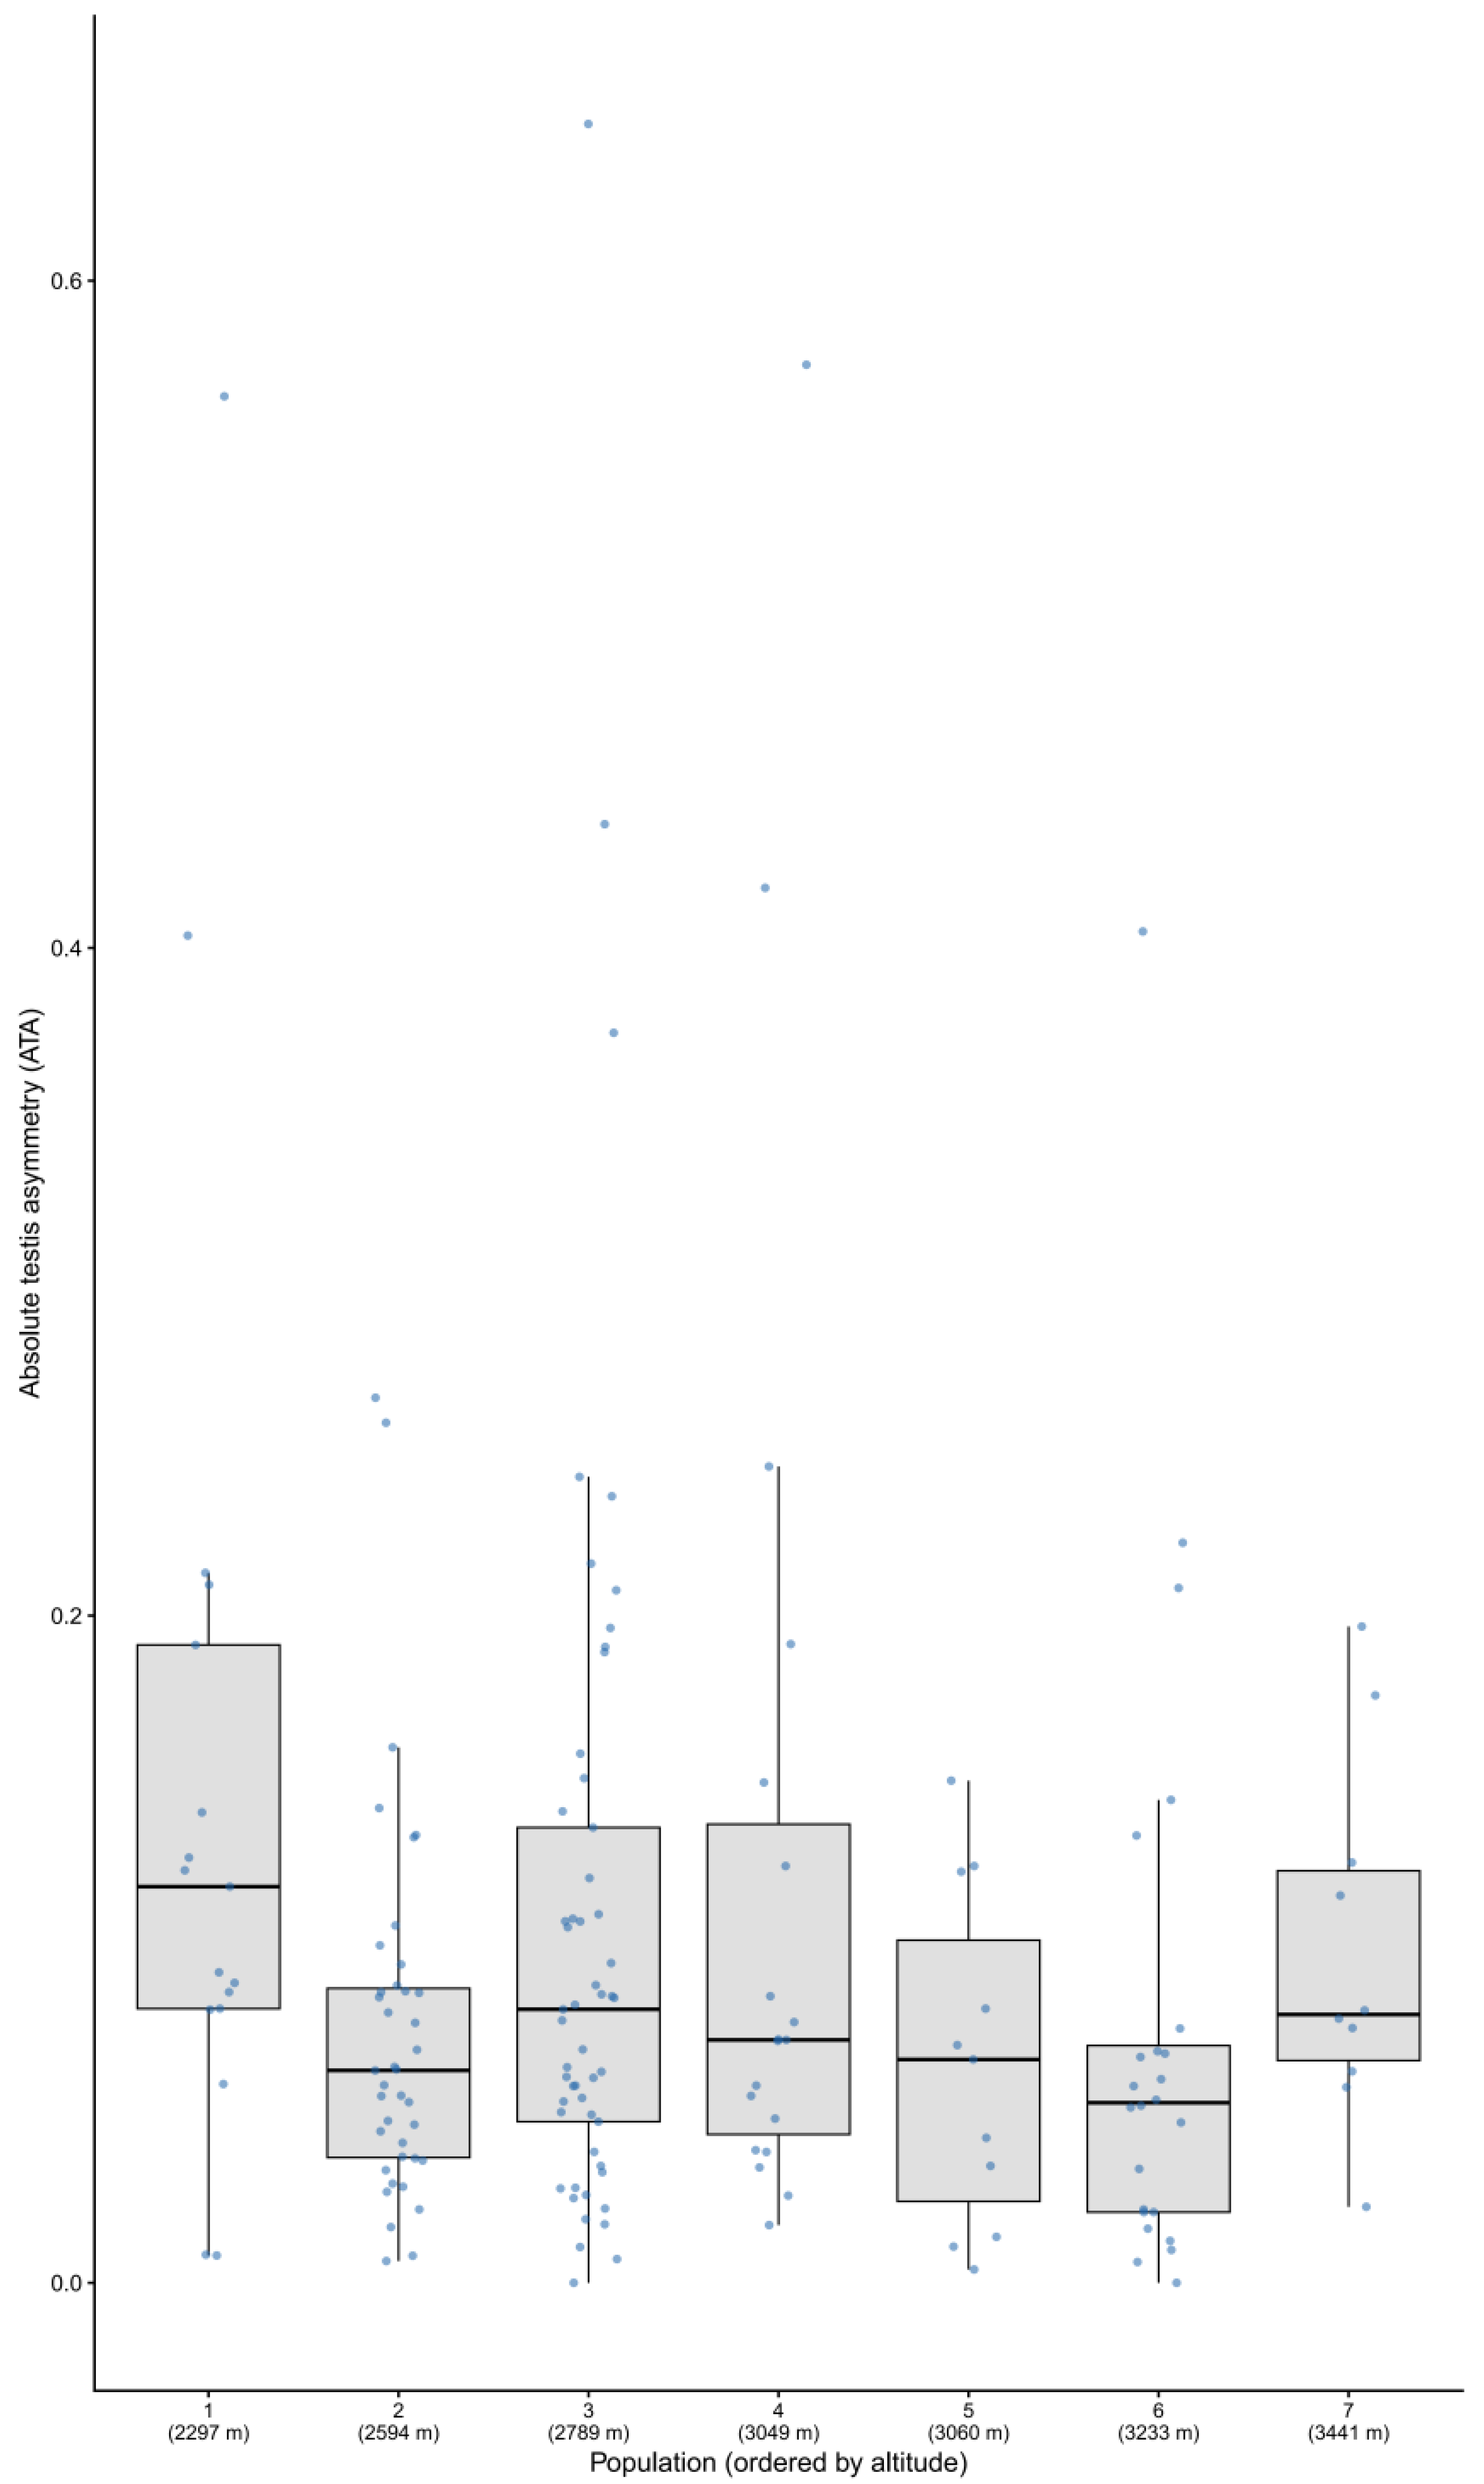
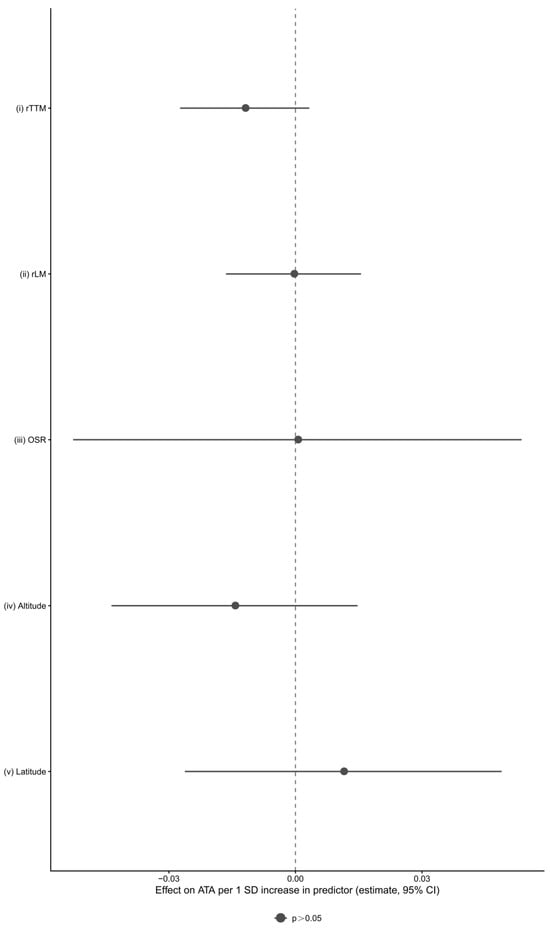
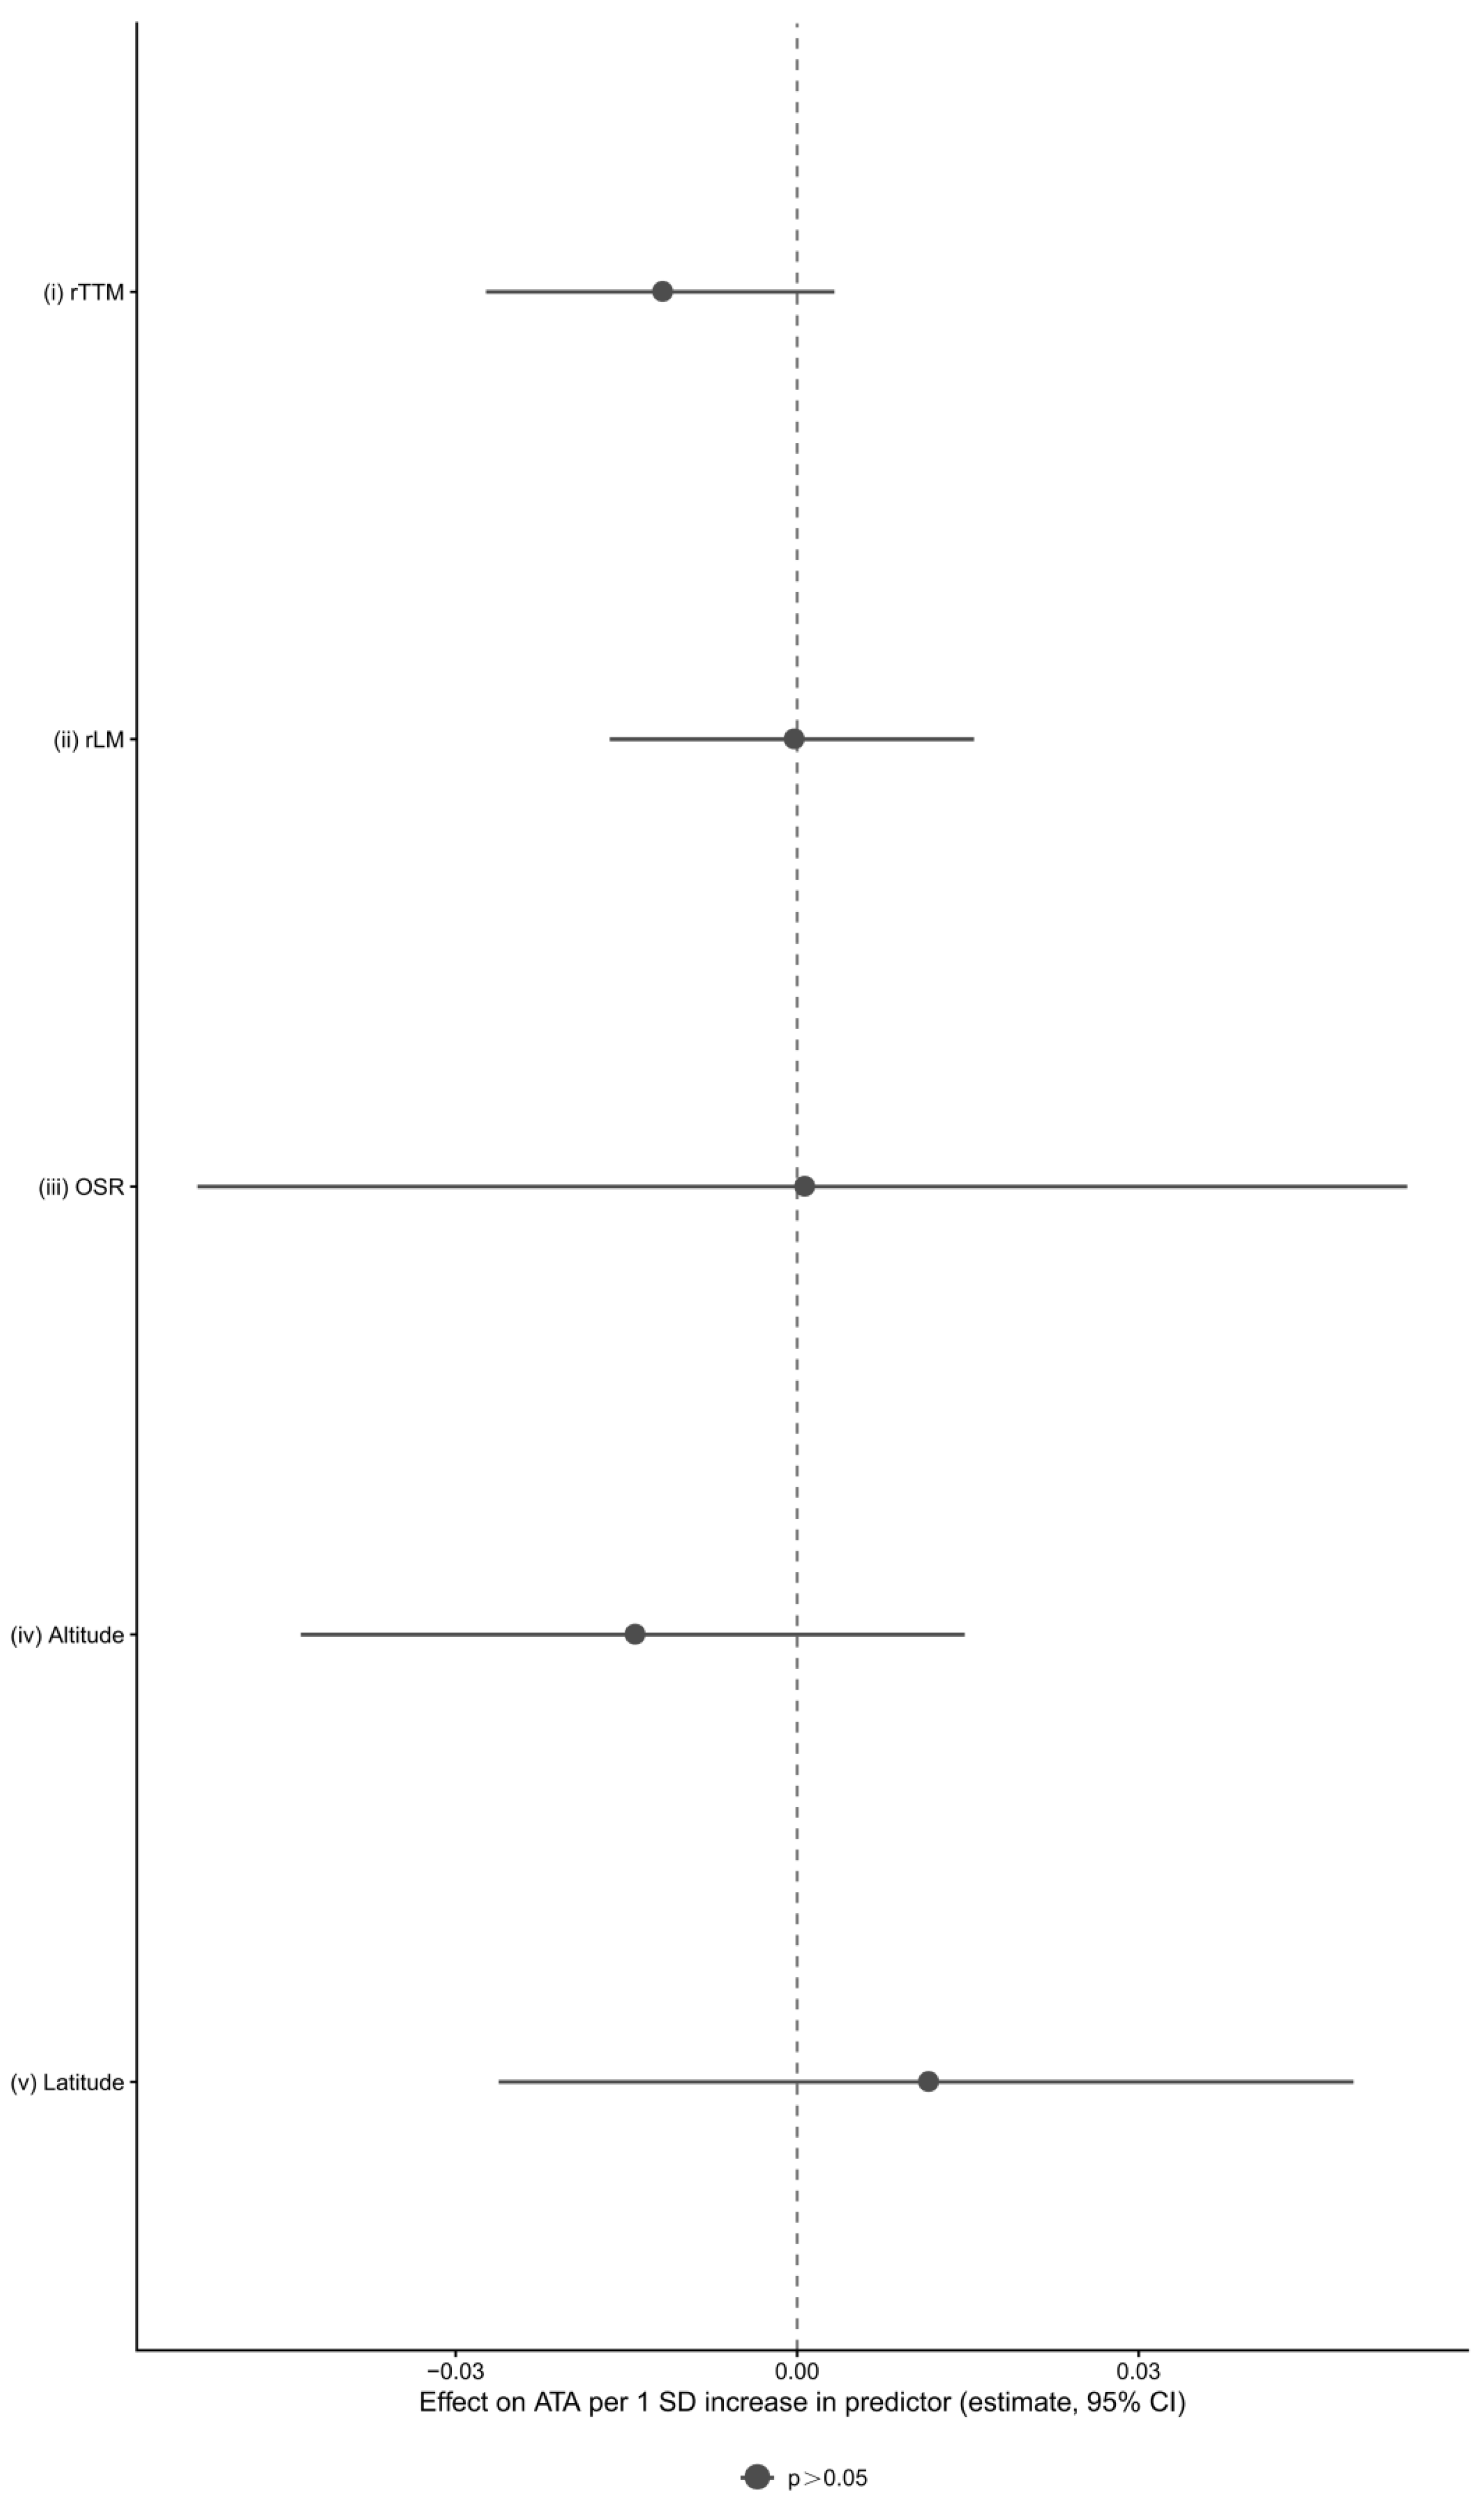
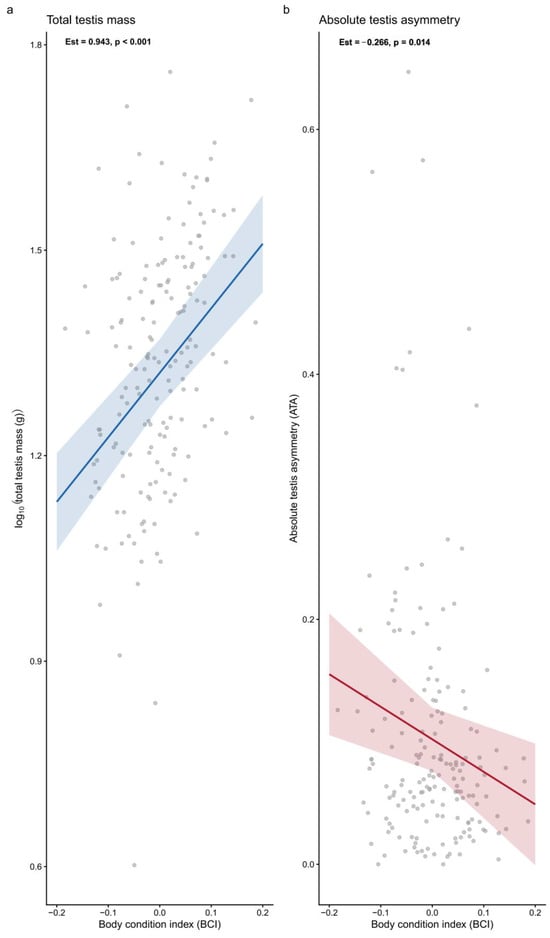
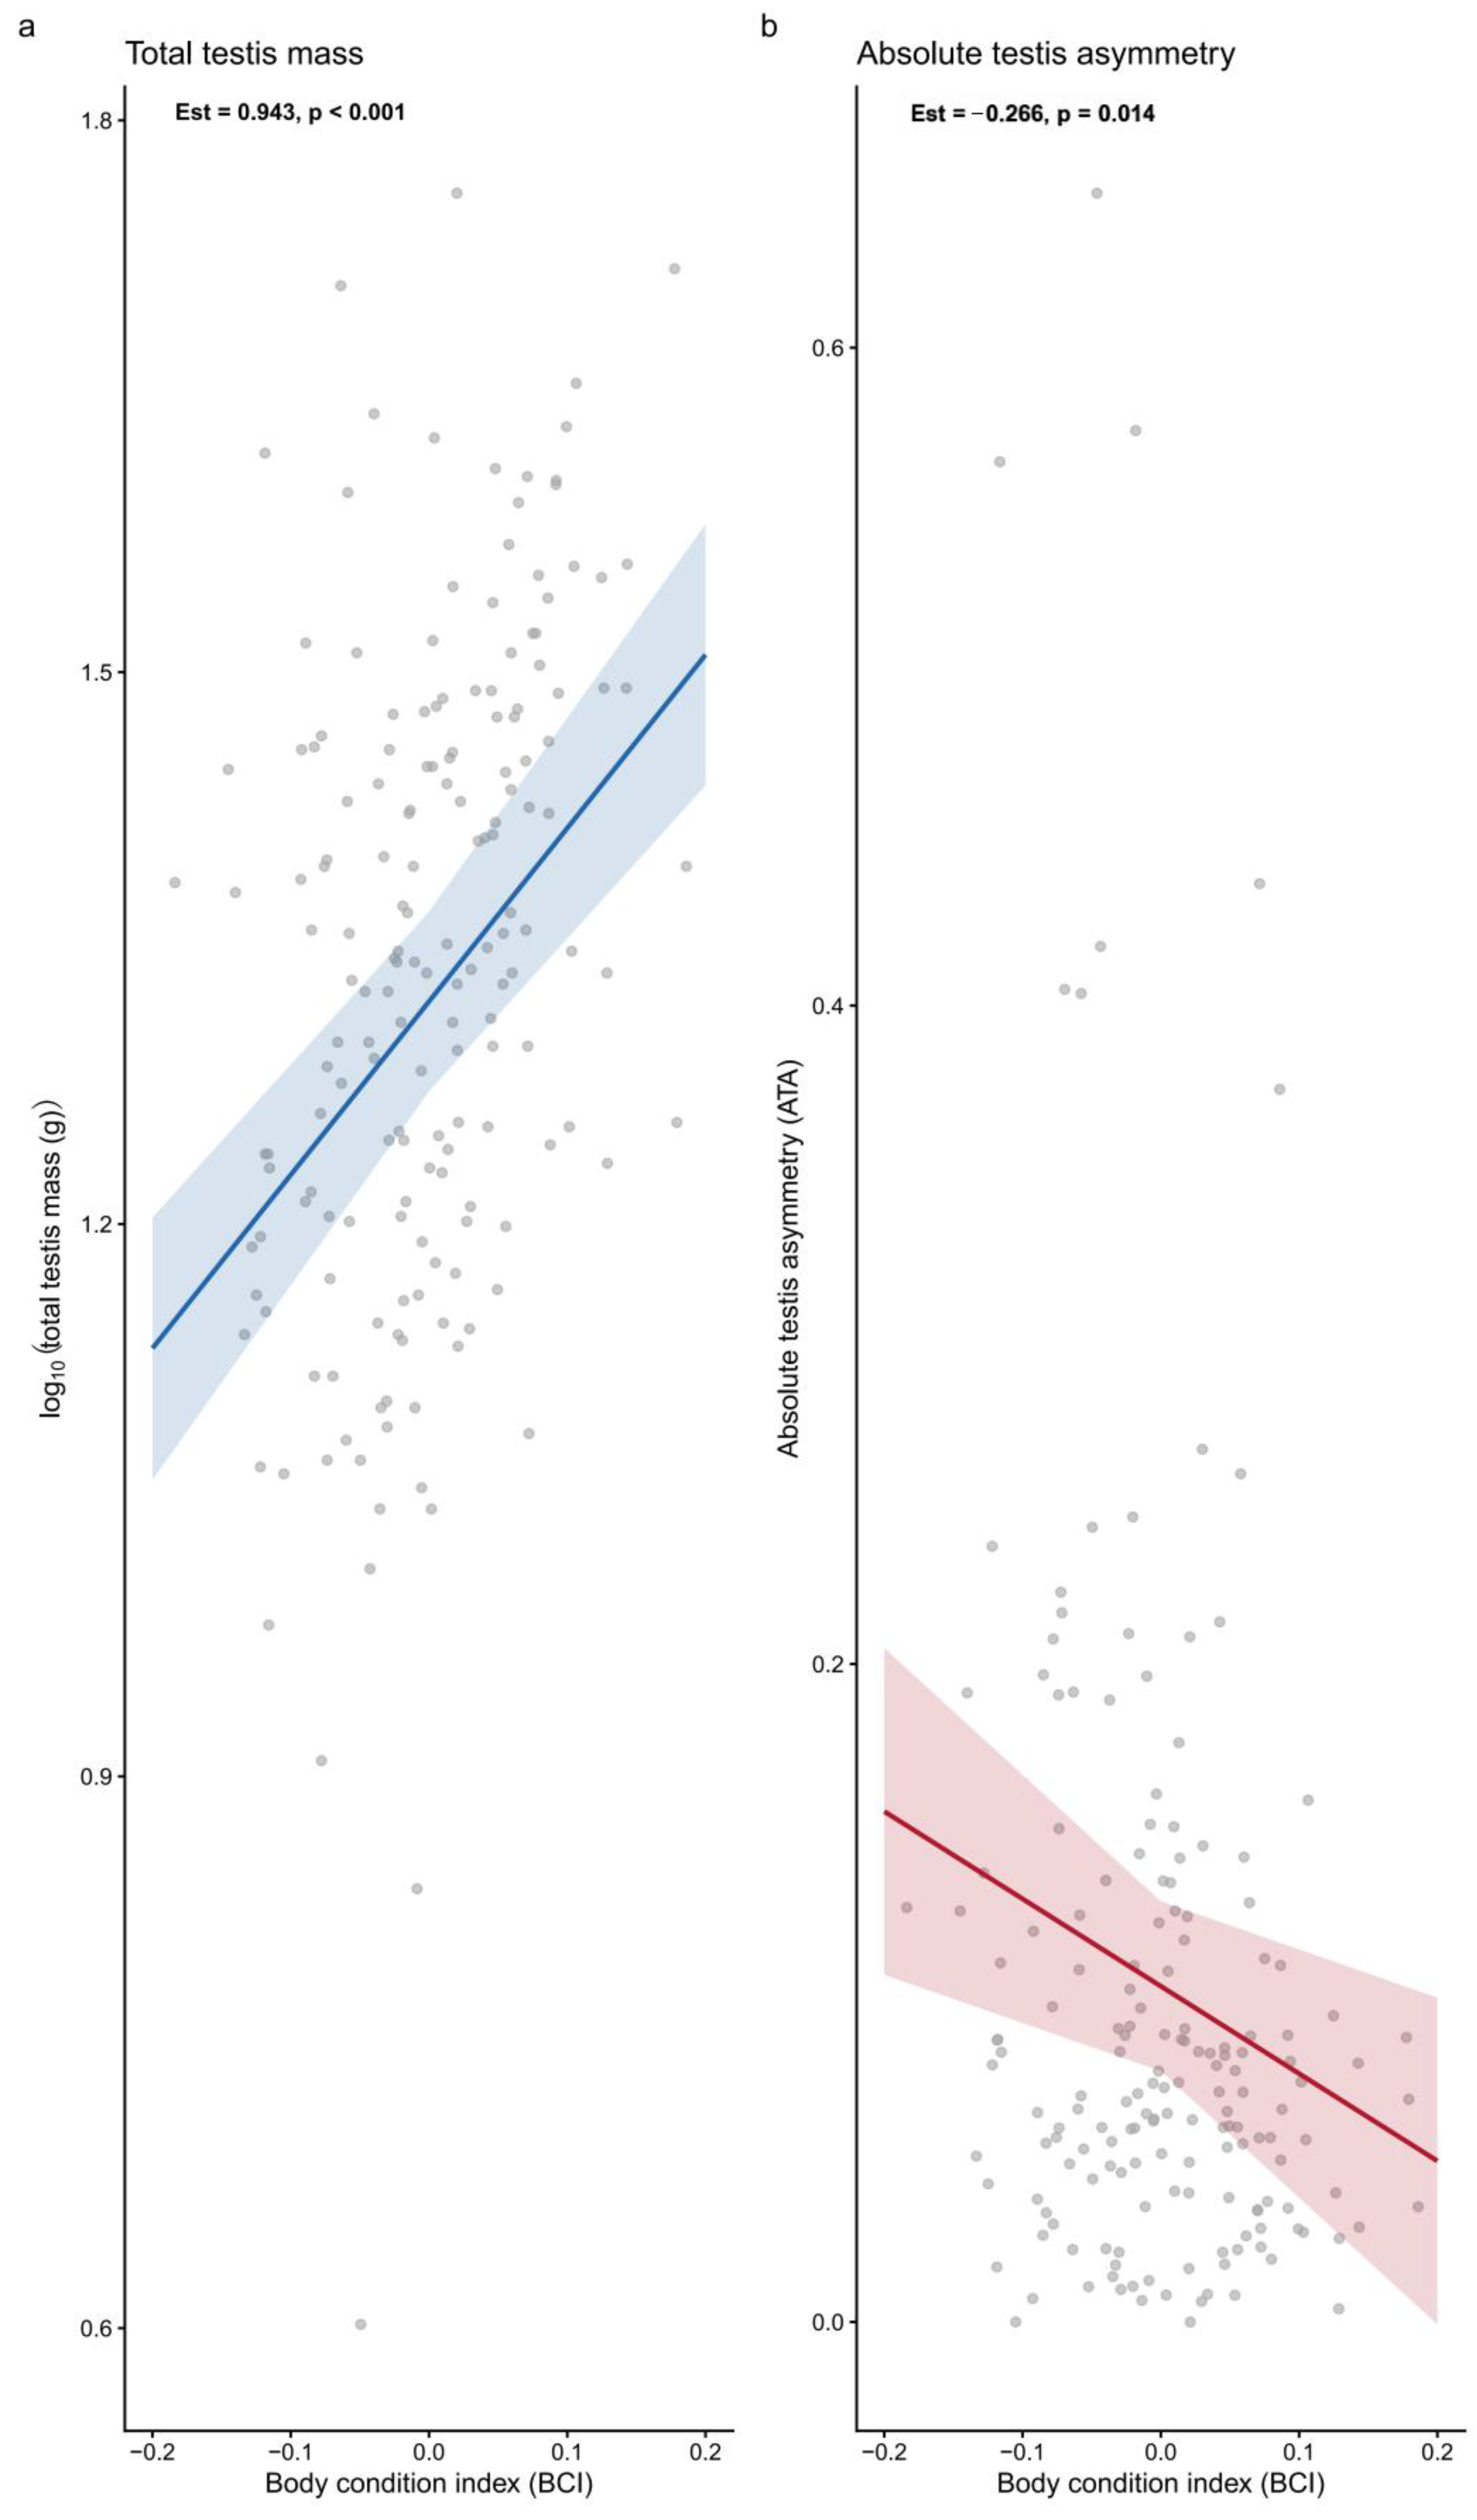

Disclaimer/Publisher’s Note: The statements, opinions and data contained in all publications are solely those of the individual author(s) and contributor(s) and not of MDPI and/or the editor(s). MDPI and/or the editor(s) disclaim responsibility for any injury to people or property resulting from any ideas, methods, instructions or products referred to in the content. |
© 2026 by the authors. Licensee MDPI, Basel, Switzerland. This article is an open access article distributed under the terms and conditions of the Creative Commons Attribution (CC BY) license.