


Simple Summary
To investigate the reprogramming mechanisms underlying the renewal of intestinal upper villus epithelial cells (IUVECs) in early-weaned piglets, we performed RNA-seq on IUVECs of piglets from 21-day-old suckling period (control) and at post-weaning days (PWD) 1, 3, 7, and 14. A total of 31, 77, 154 and 112 deferentially expressed genes (DEGs) were identified at PWD 1, 3, 7 and 14, respectively, which were functionally enriched in apoptosis, oxidative stress, immune regulation, metabolism and hormone signaling. Notably, PLA2G2A showed the largest expression fold, and CYCS reached its peak expression at PWD 7, indicating a coordinated activation of inflammation and apoptosis pathways under weaned stress. Temporal analysis revealed a sequential progression from early immune activation (PWD 1) through metabolic reprogramming (PWD 3–7) to the immunometabolic adaptation phase (PWD 14). Our results elucidate a staged transcriptional reprogramming from acute immunity towards immunometabolic rebalancing and provide potential candidate targets for alleviating post-weaning intestinal dysfunction in piglets.
Abstract
Early weaning often leads to intestinal dysfunction in piglets, while the molecular mechanisms underlying the epithelial cell renewal that is critical for maintaining intestinal mucosal homeostasis remain poorly understood. In this study, we isolated the IUVECs from the crypt–villus axis of piglet jejunum using divalent chelation-based precipitation technique. To capture the transcriptional dynamics of IUVECs under weaning stress, RNA-seq was performed on IUVECs at five time points, including 21-day-old suckling period (control) and PWD 1, 3, 7, and 14, with five biological replicates per time point (n = 5). A total of 18,852 genes were identified across all libraries. Compared with the control, we detected 31, 77, 154, and 112 DEGs at PWD 1, 3, 7, and 14, respectively, mainly involving apoptosis, oxidative stress, immune response, metabolic pathways, and hormone secretion regulation categories. Among these, PLA2G2A showed the greatest increase in expression, while CYCS expression levels rose significantly on PWD 3 and reached their peak on PWD 7; these transcriptional patterns suggest that weaning stress may drive transcriptional reprogramming in IUVECs through transcriptomic changes associated with inflammatory and apoptotic signaling. Gene Ontology (GO) analysis showed that the DEGs predominantly participate in cellular and metabolic processes, response to stimuli, and binding activities. KEGG pathway analysis revealed a temporal pattern of transcriptional changes characterized by an initial phase of enrichment of transcripts associated with immune activation (PWD 1–3), a subsequent phase reflecting transcriptional metabolic changes (PWD 7), and a final phase of transcripts associated with immune-metabolic processes (PWD 14). The qRT-PCR validation of eight DEGs associated with oxidative stress, inflammation, apoptosis, and metabolism supported the transcriptional patterns identified by RNA-seq. Taken together, our results reveal genome-wide transcriptional reprogramming of IUVECs from acute immune defense to metabolic-immune readjustment, and provide transcriptome-level insights into the adaptation of the piglet intestinal mucosa to early weaning stress.
1. Introduction
The mammalian intestine serves as the primary site for nutrient digestion and absorption, processes that depend on the continuous and meticulously regulated self-renewal of the intestinal epithelium. The crypt–villus axis (CVA) is the structural unit maintaining mucosal homeostasis. At the crypt base, intestinal stem cells (ISCs) drive renewal through proliferation and differentiation [1]. Their progeny undergo a transit-amplifying phase before becoming specialized intestinal epithelial cells (IECs), including absorptive enterocytes (>90% of villus cells) and secretory lineages (goblet, enteroendocrine, and Paneth cells) [2]. Enterocytes, enteroendocrine cells, and goblet cells migrate upward along the villus and undergo apoptotic shedding at the tip, whereas Paneth cells migrate downward to the crypt base [3]. In the mammalian intestine, this entire renewal cycle takes approximately 3–5 days under normal physiological conditions [4]. This process is regulated by canonical pathways (Wnt/β-catenin, Notch, BMP) and influenced by the intestinal micro-environment (diet, microbiota, and metabolites), forming an intricate network [3,5,6].
In modern swine production systems, early weaning at 21 days of age has been widely adopted to enhance breeding efficiency. However, weaning stress induces villous atrophy, crypt hyperplasia and impaired digestive and absorptive functions in the small intestinal epithelium of piglets [7]. Meanwhile, excessive reactive oxygen species (ROS) are generated in the intestinal mucosa, which damage proteins, DNA and lipids, disrupt cellular homeostasis and trigger autophagy, apoptosis and necrosis [8,9]. These events lead to inflammation, mucosal structural damage and barrier dysfunction, ultimately resulting in intestinal disease. Weaning stress enhances the activity of caspase-8/9 in piglet IECs, triggering a caspase cascade that activates executioner caspase-3, leading to DNA fragmentation and apoptosis at the small intestinal villus tip, thereby disrupting the dynamic balance between IEC proliferation and apoptosis [9]. The jejunal epithelium is particularly susceptible to oxidative stress because it is the main site for nutrient absorption [10].
The porcine small intestine serves as the principal determinant of growth efficiency in post-weaning piglets, prompting extensive investigation into both dietary interventions and cellular pathways involved in intestinal epithelial repair mechanisms [11,12]. IECs’ renewal is critical for repairing mucosal damage and reestablishing barrier integrity [6]. IUVECs, as a cell population migrating along the CVA to the villous tip, where they undergo terminal differentiation, directly mediate nutrient absorption and are first exposed to luminal stress after weaning [2]. Their survival and shedding directly determine villus length and absorptive surface area, making this population a critical entry point for elucidating mechanisms of intestinal epithelial renewal and barrier repair following weaning in piglets. However, previous transcriptomic studies on weaning relied on whole mucosal scrapings or mixed tissue homogenates [9], in which cell-type-specific signals are averaged across heterogeneous populations, potentially masking the responses of specific epithelial subpopulations that directly mediate mucosal repair. Consequently, the genomic dynamics and regulatory mechanisms of IUVECs’ renewal in post-weaning piglets remain poorly understood. To address this gap, we performed time-course RNA-seq on jejunal IUVECs isolated from early-weaned piglets to characterize the temporal transcriptional reprogramming during post-weaning. We hypothesized that weaning stress induces staged transcriptional reprogramming of IUVECs in the days following weaning, characterized by an initial shift towards a stress and immunity associated transcriptomic program followed by a later shift towards metabolic and immune homeostatic rebalancing.
2. Materials and Methods
2.1. Animals and Isolation of Intestinal Upper Villus Epithelial Cells
The animal experimental procedure was reviewed and approved by the Animal Care and Use Committee of the Institute of Subtropical Agriculture, the Chinese Academy of Sciences. The piglets used in this study were purchased from Xinwufeng Co., Ltd. (Changsha, Hunan, China). A total of 25 piglets (Duroc × [Landrace × Yorkshire], average body weight 7.26 ± 0.61 kg) from 25 litters (1 piglet per litter) were used in the present experiment. The piglets were randomly assigned by sex, with male piglets surgically castrated and female piglets left intact. One piglet was selected from each litter and randomly assigned to one of five sampling time points (21-day-old suckling period [PWD 0], PWD 1, 3, 7, and 14 days), with five piglets per time point. The piglets were weaned at the age of 21 d and fed a creep diet that met the National Research Council (NRC 2012) nutrient specifications for 5 to 10 kg body weight (BW) piglets; after weaning, they were housed under identical environmental conditions (temperature, lighting, and ventilation) with free access to water. At each designated time point, five piglets were anesthetized and sacrificed via an ear vein injection of 4% sodium pentobarbital solution (40 mg/kg BW), with anesthesia maintained until the completion of tissue collection. The isolation of jejunal IUVECs was performed using the intestinal chelating precipitation method as previously described in our previous study [6]. Briefly, for initial preparation (step 1), mid-jejunal segments (approximately 20 cm) were thoroughly rinsed with ice-cold 0.9% NaCl solution, followed by a 30 min oxygenation incubation in phosphate-buffered saline (PBS, pH 7.4) at 37 °C. For epithelial cells isolation (step 2), PBS was decanted and replaced with 200 mL of oxygenated chelation solution buffer (2.5 mmol/L d-glucose, 2.5 mmol/L l-glutamine, 0.5 mmol/L dl-β-hydroxybutyrate sodium salt, 5 mmol/L Na2EDTA, 0.5 mmol/L DTT, 10 mmol/L HEPES pH 7.4, 0.25% BSA, oxygenated with an O2/CO2 mixture (19:1, v/v), pH 7.4) at 37 °C for 40 min, and then, the solution buffer was collected in 50 mL centrifuge and centrifuged (400× g, 10 min, 4 °C) using an Eppendorf 5810 centrifuge (Eppendorf AG, Hamburg, Germany). This isolation process was triplicated to obtain three distinct cell populations (F1–F3). For cell washing (step 3), isolated cells were re-suspended in oxygenated washing buffer (1.5 mM CaCl2, 2.0 mM MgCl2, 10 mM HEPES, pH 7.4) and centrifuged (400× g, 10 min, 4 °C). The first collected fraction (F1) was enriched in IUVECs, whereas the final fraction (F3) harbored crypt epithelial cells. All cellular samples were flash-frozen in liquid nitrogen and maintained at −80 °C for subsequent analysis.
2.2. Measurement of Alkaline Phosphatase Activities
The enzymatic activities of alkaline phosphatase (ALP) was employed as a marker for mature villus cells to assess the activity of these fractions [6]. Enzymatic activities of ALP was assayed using commercial kits (Jiancheng Biotech, Nanjing, China) according to the manufacturer’s protocols. Briefly, the IUVEC samples were washed three times with PBS and lysed with 100 µL of lysis buffer for 10 min at 4 °C. Following lysis, the homogenates were centrifuged at 12,000× g for 10 min at 4 °C. The resulting supernatants were then collected for analysis. Spectrophotometric measurements were performed at 505 nm on an Agilent BioTek microplate reader (Winooski, VT, USA). Total protein content was quantified in parallel using a Bicinchoninic acid (BCA) assay kit (Biyotime Biotech, Shanghai, China). All enzymatic activities were normalized to the total protein and are expressed as μmol of product formed per minute per mg of protein (μmol/min/mg protein).
2.3. Total RNA Isolation
Total RNA was isolated from IUVECs using TRIZOL reagent (TaKaRa, Osaka, Japan) according to the manufacturer’s instructions. The extracted RNA underwent quality control using two complementary methods. RNA integrity was assessed by determining the RNA Integrity Number (RIN) with an Agilent 2100 Bioanalyzer (Agilent Technologies, Santa Clara, USA), while purity (A260/A280 ratio ≈ 2.0) and concentration were measured using a NanoDrop ND-2000 spectrophotometer (Thermo Fisher Scientific, Waltham, MA, USA).
2.4. Processing of High-Throughput Sequencing Data
The complementary DNA (cDNA) library was constructed employing a TruSeq®RNA sample prep kit (Illumina, San Diego, CA, USA) with five biological replicates per time point (n = 5), yielding 25 libraries in total (named A0-1 through E14-5, corresponding to PWD 0, 1, 3, 7, and 14, respectively). After the quality control of the cDNA, paired-end sequencing of all libraries was performed on the BGISEQ-500 platform (Beijing Genomics Institute, BGI, Shenzhen City, China). To guarantee precise de novo transcriptome assembly, we performed rigorous quality control on the raw sequencing data. This preprocessing step systematically removed several types of problematic sequences: (1) reads containing 5′ adapter contamination, (2) sequences lacking 3′ adapters or insert tags, (3) poly-N stretches (>5 consecutive Ns), and (4) low-quality reads (Q-score < 20). High-confidence reads were aligned to the Sus scrofa reference genome (Sscrofa 11.1, GCA_000003025.6). Samples meeting the quality thresholds (Q20 rate ≥ 90% and mapping rate > 70%) were retained for downstream differential expression analysis, thereby excluding samples with poor sequencing quality or abnormal alignment from confounding the differential expression results.
2.5. Screening and Profiling of Differentially Expressed Genes
Transcriptomic analysis was performed using rigorous normalization and statistical methods. Prior to differential expression analysis, genes with a raw count ≥ 10 in at least five samples were retained for downstream analysis. Differential expression analysis of these filtered gene-level counts was then performed with DESeq2 package [13] in R software (version 4.2.2). To account for library size and RNA composition bias, read counts were normalized using DESeq2′s median-of-ratios method. Gene-wise negative binomial dispersion was estimated from the five biological replicates per time point, with shrinkage toward the fitted mean-dispersion trend, thereby capturing the within-group biological variability across replicates. Principal component analysis (PCA) was performed on regularized-log (rlog)-transformed normalized counts using the DESeq2 package to visualize the overall variance structure and assess the consistency of biological replicates within each time point. Pairwise comparisons between each post-weaning time point and the control (PWD 0) were performed using the Wald test as implemented in DESeq2, and effect sizes are reported as log2 fold changes calculated from normalized counts. p values were adjusted using the Benjamini–Hochberg procedure. Genes with FDR < 0.05 and |log2 (fold change)| > 1 were defined as DEGs.
2.6. Clustering and Functional Annotation of Differentially Expressed Genes
To systematically characterize the molecular functions and key signaling pathways involved in the observed transcriptional changes, functional enrichment analysis was performed using clusterProfiler R software (version 4.2.2). The DEGs were used as the test gene set. The reference gene universe was defined as all genes that passed the low-count filtering and were therefore subjected to differential expression testing, which restricts the background to genes detectably expressed in IUVECs and avoids bias from genes not expressed in this cell population. Gene Ontology (GO) enrichment (Biological Process, Cellular Component, and Molecular Function) was performed using enrichGO with the Sus scrofa genome-wide annotation database (org.Ss.eg.db), and KEGG pathway enrichment was performed using enrichKEGG with the KEGG organism entry for Sus scrofa. Both analyses apply an over-representation test based on the hypergeometric distribution p values were adjusted for multiple testing across all tested terms using the Benjamini–Hochberg procedure, and terms with an adjusted p (Q) < 0.05 were considered significantly enriched.
2.7. qRT-PCR Validation of RNA-Seq Data
For mRNA quantification analysis, cDNA synthesis was carried out with the PrimeScript™ RT reagent Kit with genomic DNA Eraser (Takara, Osaka, Japan). The specific primers were designed using Primer-BLAST (http://www.ncbi.nlm.nih.gov/tools/primer-blast accessed on 16 March 2026) based on the Sus scrofa reference genome sequence, and their properties were evaluated by Primer Premier 5.0 software. GAPDH was used as an endogenous control for normalization. The resulting oligonucleotides were commercially synthesized by Tsingke Biotechnology Co., Ltd. (Changsha, China), and are listed in Table 1. As described in our previous study [6], the qRT-PCRs’ amplification was performed using SYBR Green method on a QuantStudio 5 platform (Applied Biosystems, Foster City, CA, USA). Reaction specificity was validated by single-peak melt curve profiles, and relative quantification was determined through comparative 2−ΔΔCt analysis [14]. Five biological replicates were used per time point (n = 5), corresponding to the same individual piglets from which the RNA-seq libraries were generated. Each biological sample was assayed in three replicates.
Table 1.
Primers used for qRT-PCR analysis.
2.8. Statistical Analyses
All experimental data were analyzed using the SPSS 22.0 statistical package (SPSS Inc., Chicago, IL, USA). The analyzed variable was the mRNA relative expression level of selected DEGs validated by qRT-qPCR. Normality and homogeneity of variance were using the Shapiro–Wilk test and Levene’s test, respectively. When these assumptions were met, one-way ANOVA followed by Duncan’s multiple comparison test was used; otherwise, the Kruskal–Wallis test followed by Dunn’s multiple comparison test was applied. Tukey’s HSD was chosen for its control of the family-wise Type I error rate. The results were presented as the mean ± standard error of the mean (SEM), with statistical significance established at p < 0.05.
3. Results
3.1. Validation of the CVA Epithelial Cells Grading Procedure
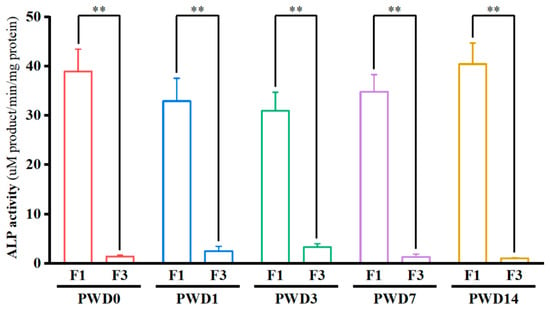
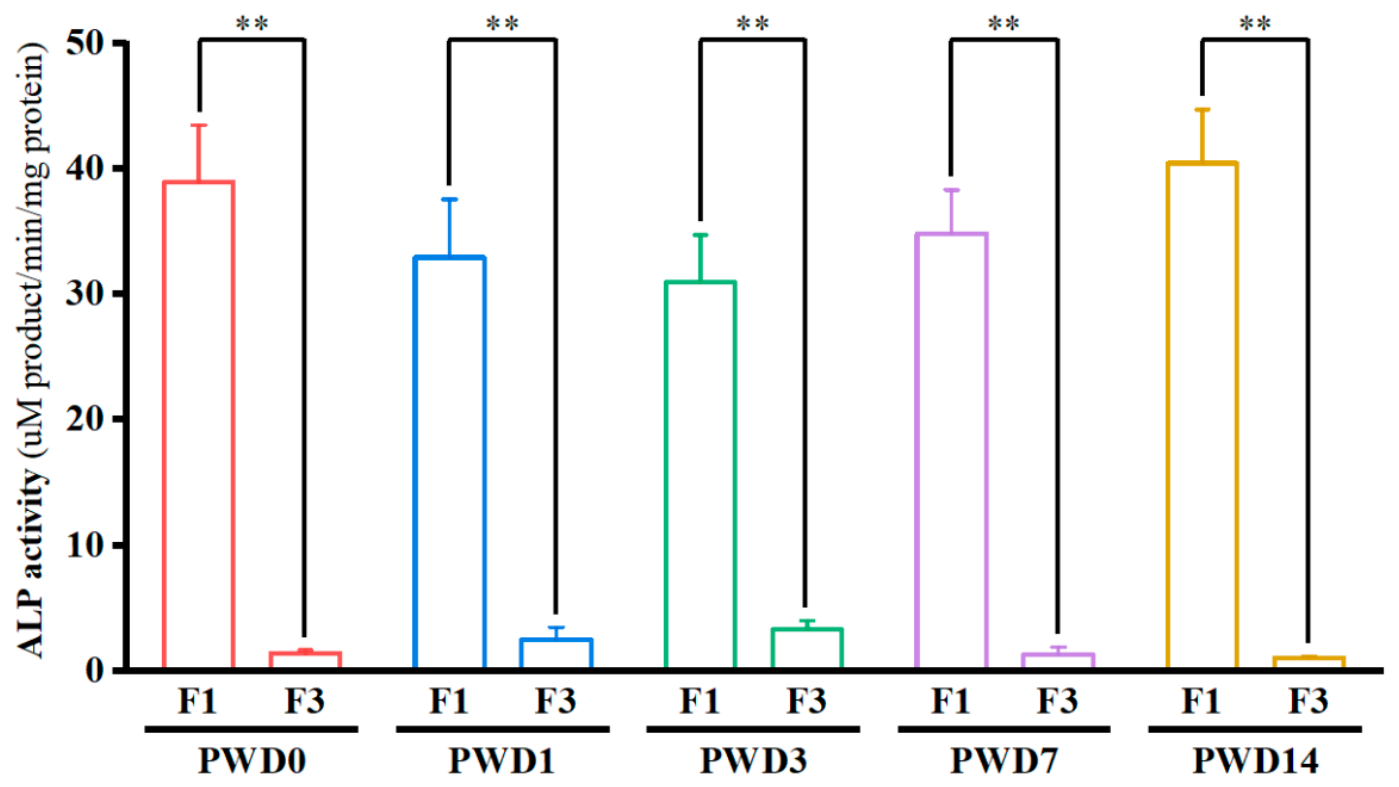
Using a standardized isolation protocol, we isolated IUVECs (F1) and crypt epithelial cell (F3) fractions from the jejunal CVA of piglets sampled at PWD 0, 1, 3, 7, and 14. The results showed that the ALP-specific activity in the F1 fraction was significantly higher than that in the F3 fraction at all time points (p < 0.01); the F1/F3 ratios were 27.67, 13.13, 9.33, 18.56, and 37.79, respectively (with baseline F3 values being 1.41, 2.51, 3.32, 1.88, and 1.07 U/g protein) (Figure 1), which is consistent with previous studies [6]. These results demonstrate that the divalent chelation-based precipitation technique is an effective means for isolating jejunal F1 and F3 fractions from piglets.
Figure 1.
Relative enrichments of ALP in the F1 and F3 isolated along the CVA at the PWD 0, 1, 3, 7, and 14 of piglets. Data with error bars represents means ± SEM, n = 5 for each group. ** p < 0.01.
3.2. Alignment of RNA-Seq Reads to the Sus scrofa Reference Genome
To identify key regulatory genes involved in IECs’ renewal during weaning, high-throughput RNA-sequencing was performed on IUVECs isolated from piglets at different time points post-weaning. An average of 23.95 million 150 bp paired-end reads were generated for each sample. After filtering out low quality and short reads, an average of 23.82 million clean reads (99% of the total reads) were retained for each sample. The percentages of bases with Q20 or higher ranged from 93.47% to 96.16% across all 25 samples. On average, 89.45% of the clean reads were successfully aligned to the pig reference genome, of which 71.34% were uniquely mapped and 19.08% were multi-position mapped. The sequencing statistics for all 25 individual samples are presented in Supplementary Table S1.
3.3. Principal Component Analysis and Clustering Analysis
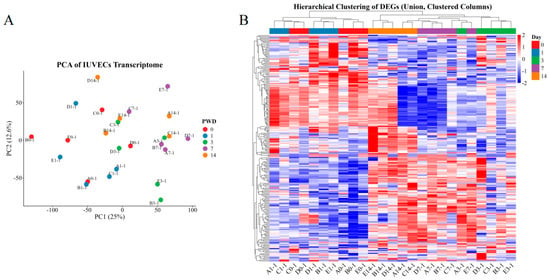
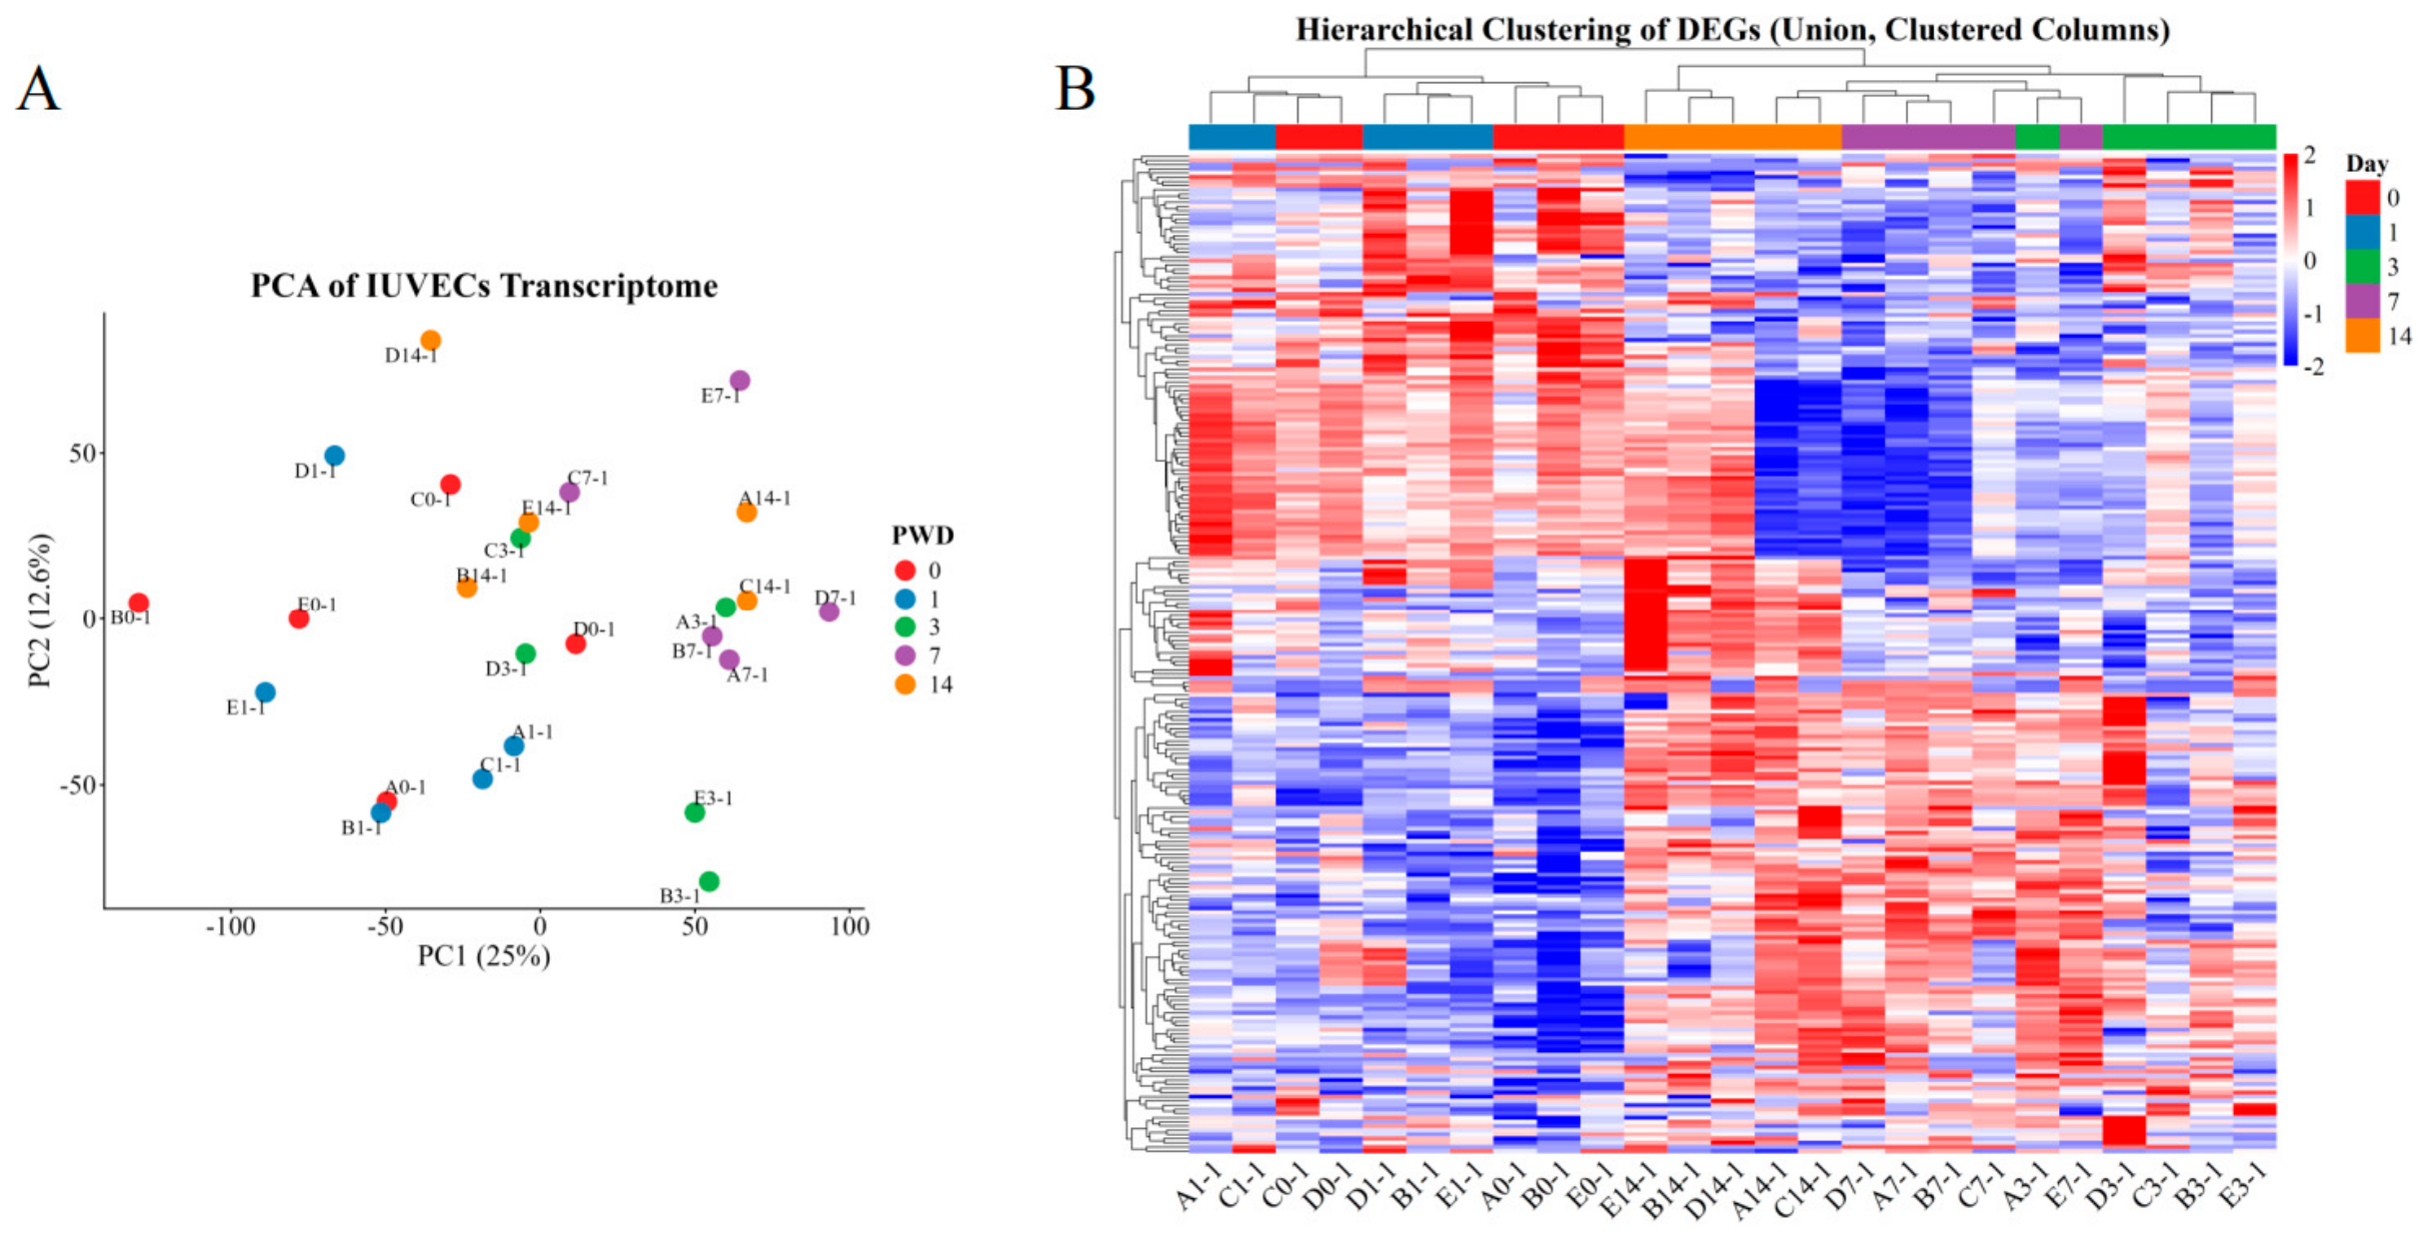
PCA showed that samples within the same group generally exhibited a relatively tight clustering tendency. PWD 0 and PWD 1 samples overlapped considerably and were located on the left side of the plot, whereas the PWD 7 samples shifted markedly to the right and were clearly separated from the PWD 0 and 1 samples, indicating distinct overall gene expression patterns between these groups. The PWD 3 and PWD 14 samples were positioned between these two clusters, showing partial overlap with both (Figure 2A). Hierarchical clustering of samples showed that PWD 3, PWD 7, and PWD 14 groups formed a single cluster, with highest similarity in expression pattern between PWD 3 and PWD 7 based on color intensity (Figure 2B). Clustering of DEGs classified them into four distinct groups; two large groups and two small groups. Notably, within the large groups, one subgroup was predominantly upregulated in response to weaning stress, whereas the other exhibited a consistently downregulated pattern. The two small groups contained DEGs that were massively upregulated or downregulated, respectively, in IUVECs upon weaning (Figure 2B). Overall, the results indicate that the overall expression profiles differ markedly among groups, with good reproducibility within groups, suggesting that the sample quality is adequate for subsequent differential expression analysis.
Figure 2.
PCA and hierarchical clustering analysis of IUVECs at five time points. (A) PCA of the 25 individual samples; each dot represents one biological replicate, colored by PWD 0, 1, 3, 7, and 14. (B) Hierarchical clustering heatmap of DEGs across the 25 samples. Rows represent genes and columns represent samples; color intensity indicates Z-score-standardized expression levels (blue, low; red, high). The top dendrogram shows sample clustering.
3.4. Transcriptomic Analysis of IUVECs During Post-Weaning Period
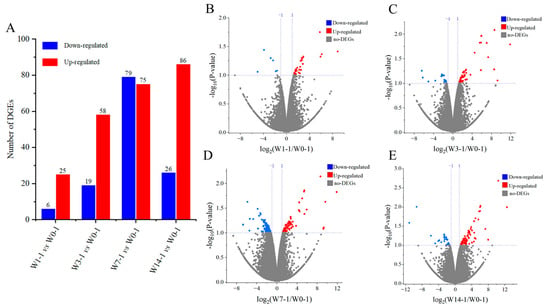
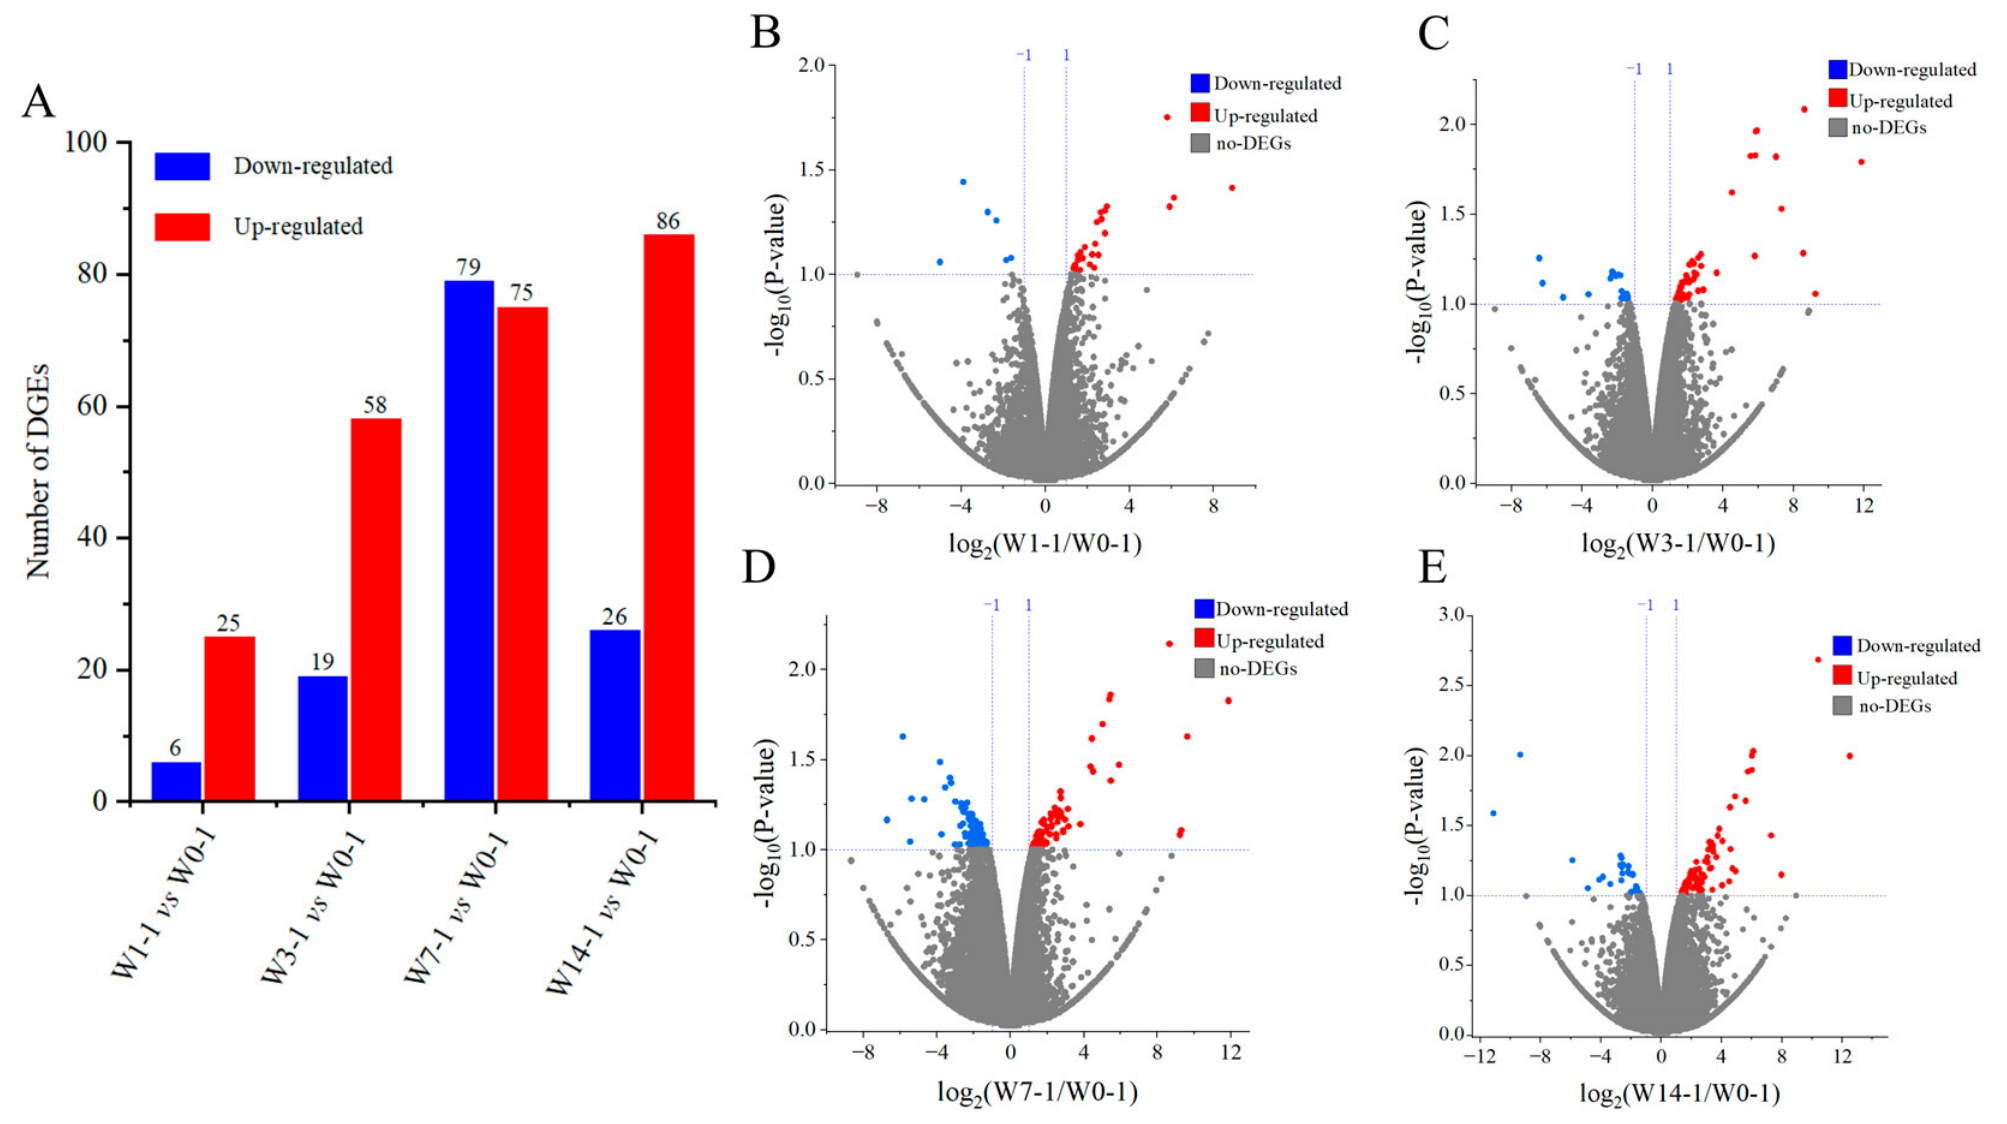
To elucidate the molecular mechanism of IUVECs’ renewal, we compared the transcriptional profiles of IUVECs from various post-weaning time points with that of the control group. The group labels W0-1, W1-1, W3-1, W7-1, and W14-1 refer to the IUVEC groups at PWD 0, 1, 3, 7, and 14, respectively. The analysis of clean data showed that there were 31, 77, 154, and 112 mRNAs that had differential expression levels in W1-1, W3-1, W7-1, and W14-1, respectively, compared with W0-1 (Figure 3A). Of these, 25 were highly expressed and six were minimally expressed DEGs in W1-1 compared with the control group (W0-1) (Figure 3B); 58 were highly expressed and 19 were minimally expressed DEGs in W3-1 compared with W0-1 (Figure 3C); 75 were highly expressed and 79 were minimally expressed DEGs in W7-1 compared with W0-1 (Figure 3D); 86 were highly expressed and 26 were minimally expressed DEGs in W14-1 compared with W0-1 (Figure 3E). Detailed information on the DEGs in IUVECs at four time points after weaning in piglets is presented in Supplementary Tables S2–S5.
Figure 3.
DEGs in IUVECs at four post-weaning time points compared with the control group. (A) Bar chart showing the number of up- and downregulated DEGs. The x-axis lists each comparison between the post-weaning group and the control (vs., versus), and the y-axis shows the number of DEG. (B–E) Volcano plots of DEGs in IUVECs at PWD 1 (B), PWD 3 (C), PWD 7 (D), and PWD 14 (E) compared with PWD 0. Blue represents downregulated genes, red represents upregulated genes, and brown is a no-significant-difference gene.
3.5. Expression Patterns and Functional Classification of Key DEGs
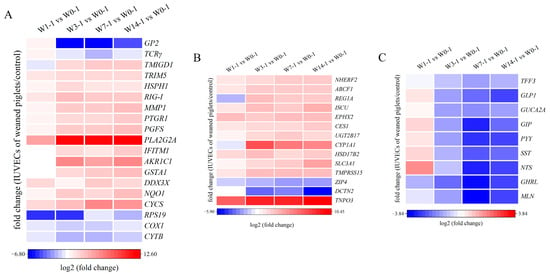
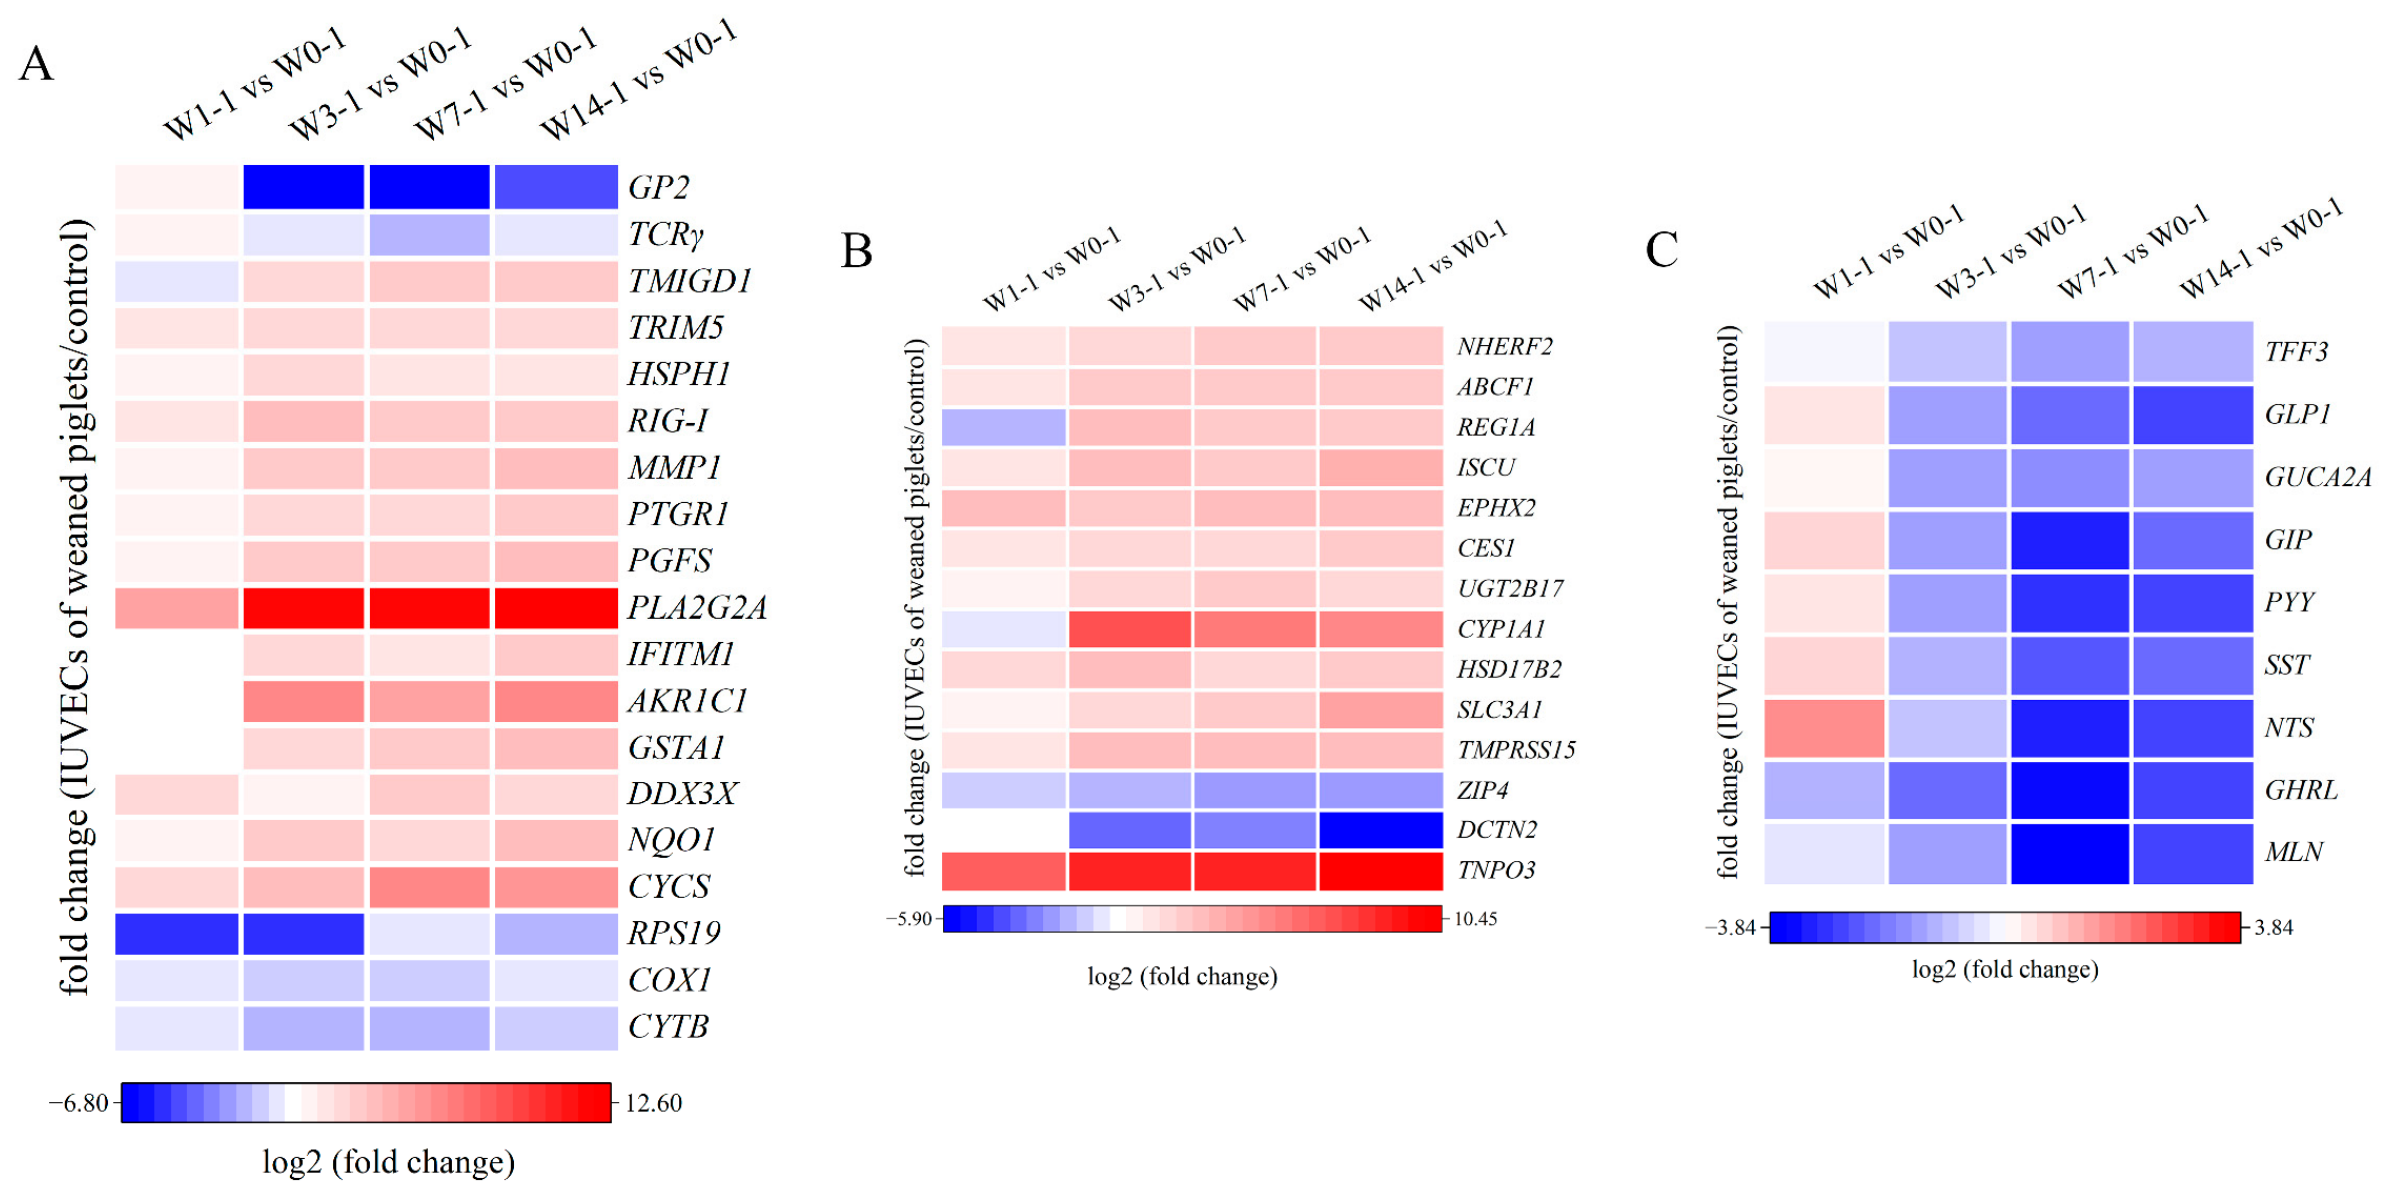
To elucidate the transcriptional adaptations of IUVECs to weaning stress, we classified the identified DEGs into functional categories based on their temporal expression profiles over the post-weaning period. In the category of apoptosis, constitutively downregulated genes associated with mitochondrial respiratory function cytochrome b (CYTB), cytochrome c oxidase subunit 1 (COX1), and 40S ribosomal protein S19 (RPS19), along with significantly upregulated cytochrome c, somatic (CYCS), exhibited a pattern consistent with mitochondria-associated apoptotic signaling. For oxidative stress responses, upregulated genes included NAD(P)H dehydrogenase [quinone] 1 (NQO1), DEAD-box helicase 3 X-linked (DDX3X), glutathione S-transferase A1 (GSTA1), and aldo-keto reductase family 1 member C1 (AKR1C1). This transcriptional pattern is consistent with enhanced antioxidant defense mechanisms; however, its functional significance remains to be validated. The immune response category comprised upregulated interferon-induced transmembrane protein 1 (IFITM1), phospholipase A2 group IIA (PLA2G2A), prostaglandin F synthase (PGFS), retinoic acid inducible gene-I (RIG-I), heat shock protein 110 kDa (HSPH1) and interstitial collagenase (MMP1), while T cell receptor gamma (TCRγ) and glycoprotein 2 (GP2) were downregulated (Figure 4A). Metabolic pathways were represented by upregulated genes such as transportin 3 (TNPO3), enteropeptidase (TMPRSS15), carboxylesterase 1 (CES1), and iron-sulfur cluster assembly enzyme (ISCU), etc., alongside downregulated genes, including dynactin (DCTN2) and solute carrier family 39 member 4 (ZIP4) (Figure 4B). DEGs involved in hormone secretion regulation, including ghrelin (GHRL), somatostatin (SST), trefoil factor 3 (TFF3), and glucagon-like peptide-1 (GLP1), etc., were continuously downregulated from PWD 3 (Figure 4C), suggesting that weaning stress may be associated with the inhibition of signaling pathways related to mucosal repair, appetite control and digestive fluid secretion, which in turn may contribute to intestinal epithelial cell injury and dysfunction.
Figure 4.
Spatiotemporal expression patterns of DEGs classified by functional category in IUVECs after weaning. (A) DEGs enriched in apoptosis, oxidative stress, and immune response. (B) DEGs enriched in metabolic pathways. (C) Gastrointestinal hormone-related DEGs. The horizontal axis represents the sample clusters, and colors from blue to red indicate gene expression from low to high.
Notably, PLA2G2A showed the highest fold change among all DEGs, and CYCS transcription was significant increased at PWD 3 and peaked at PWD 7 (p < 0.05). These changes represent transcriptomic associations that acute phase signaling and apoptotic pathways may be involved in early post-weaning IUVEC remodeling; however, their functional relevance needs to be validated by protein-level analysis and functional assays.
3.6. GO Functional Enrichment Analysis of DEGs
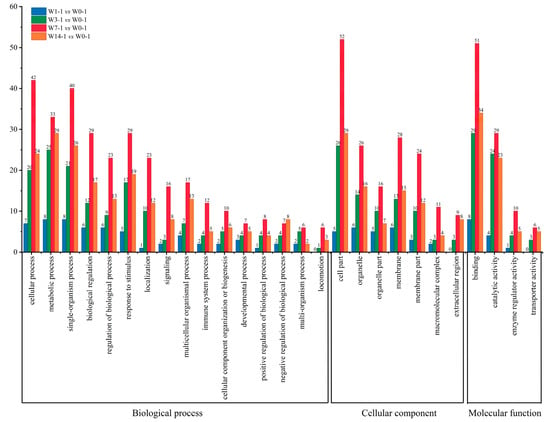
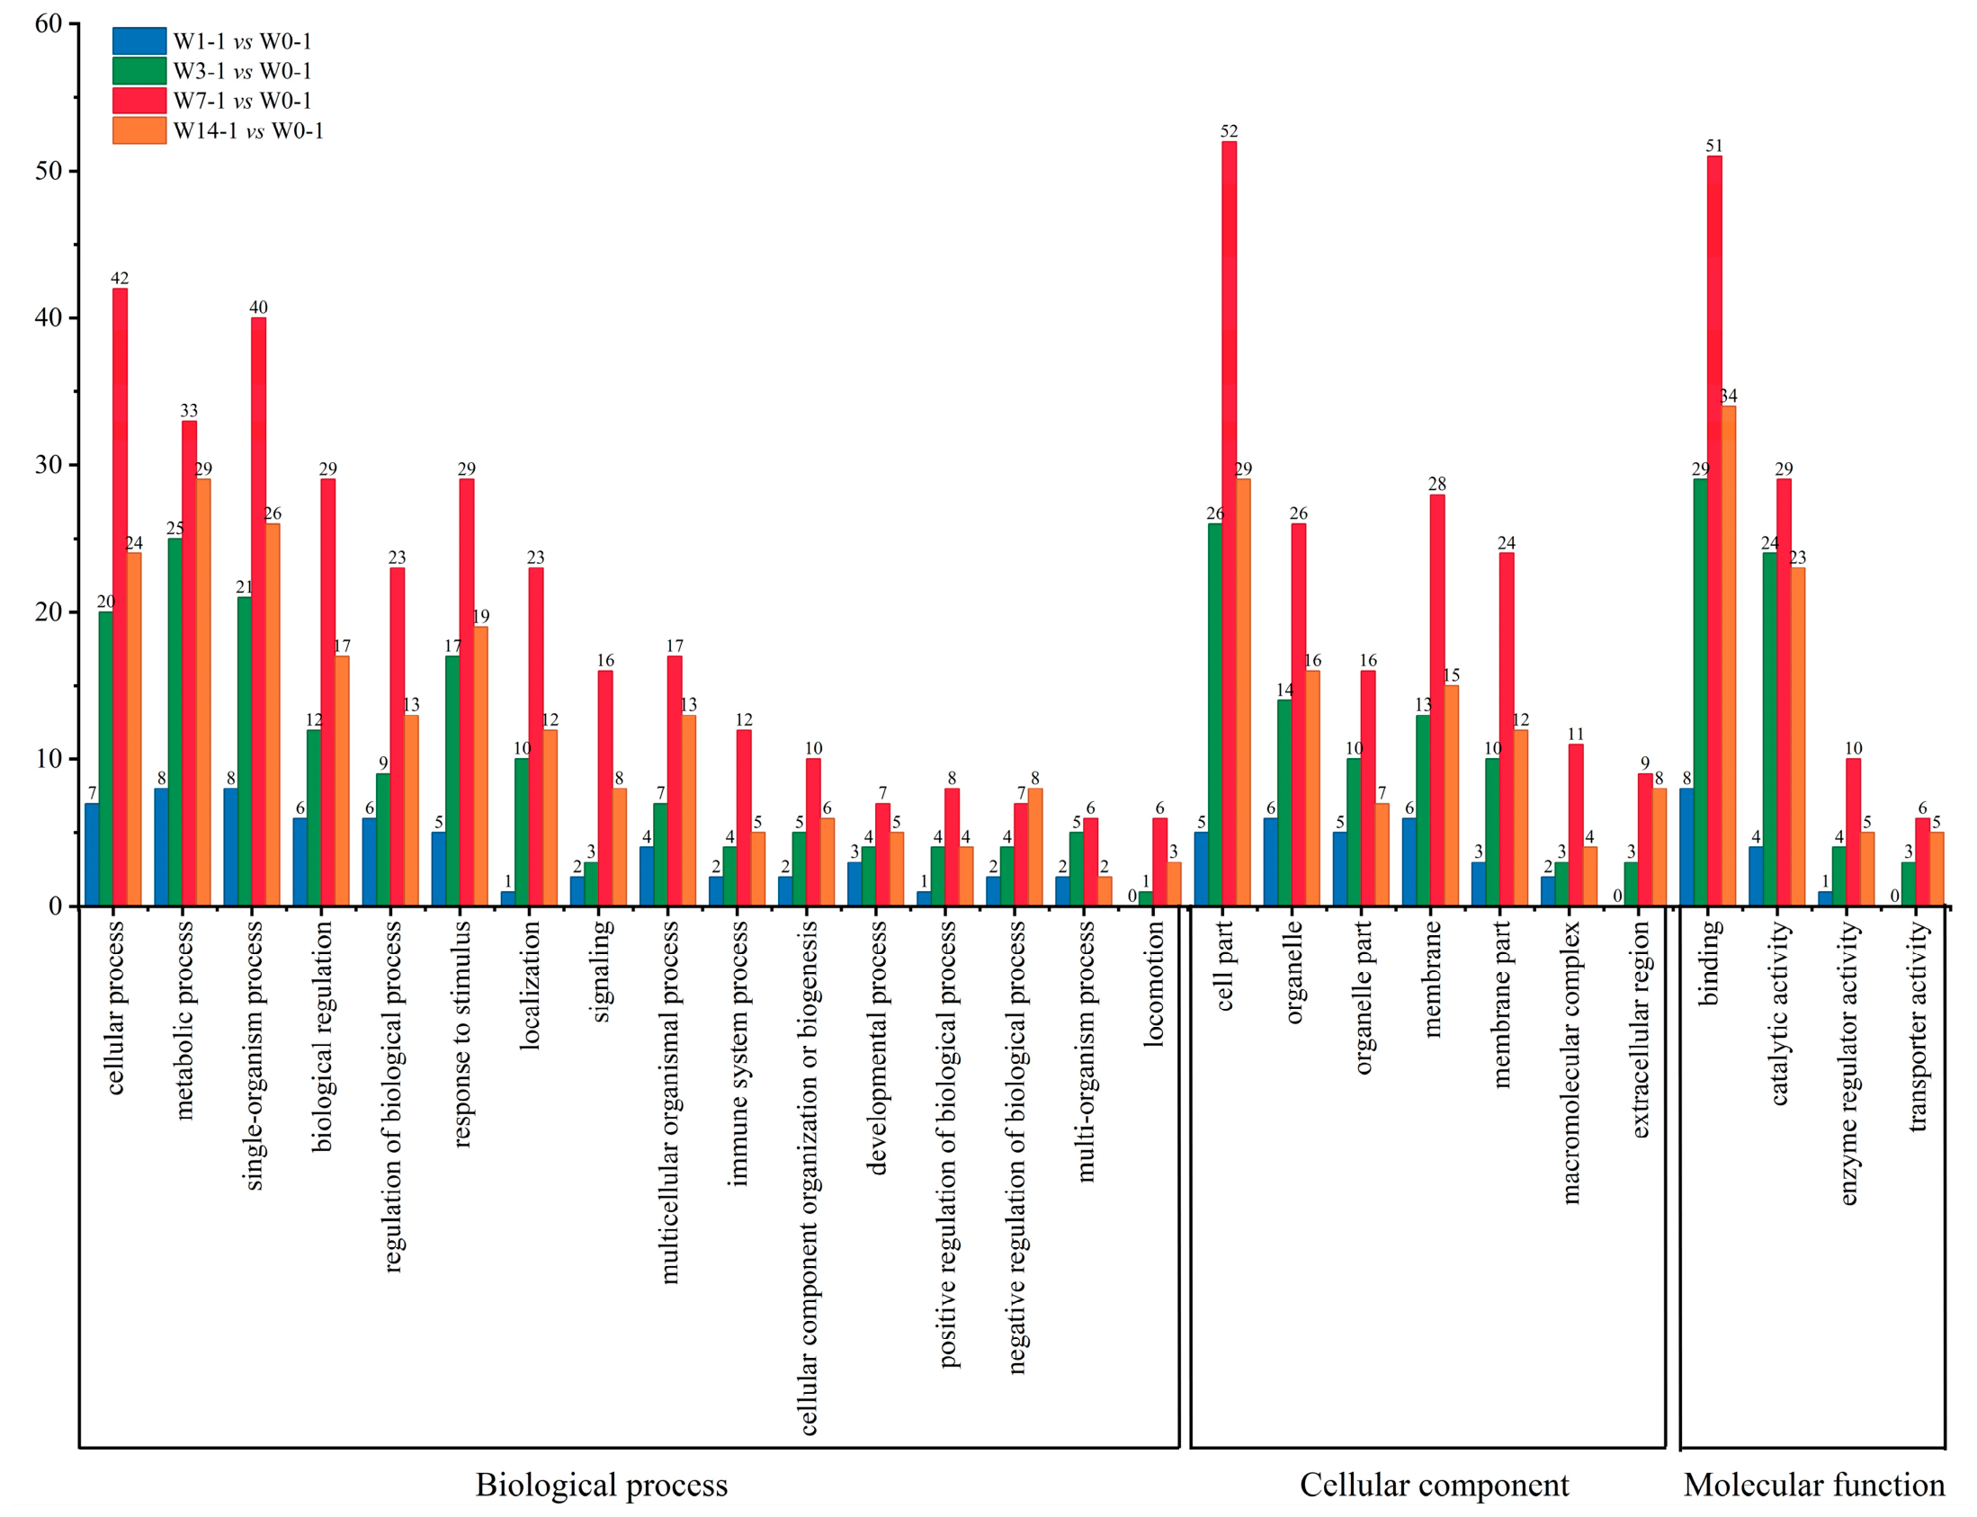
GO enrichment analysis identified 27 core functional terms significantly enriched (Q < 0.05) with DEGs in IUVECs from piglets at different PWD. These included 16 biological process terms, seven cellular component terms, and four molecular function terms, collectively covering approximately 93% of the DEG annotation information. The results revealed a distinct “single-peak” temporal pattern in the functional distribution of weaning-induced DEGs; the number of enriched DEGs for most GO terms increased as early as PWD 1, peaked at PWD 7 simultaneously, and decreased at PWD 14 but still remained higher than that at PWD 1, suggesting that PWD 7 represents the period with maximal transcriptional response in IUVECs (Figure 5). From the perspective of biological processes, DEGs were predominantly enriched in cellular process, metabolic processes, stimulus response and biological regulation. Cellular components were mainly localized to cell parts, membranes and organelles. Molecular functions were dominated by binding and catalytic activity, suggesting that the corresponding gene products are mainly proteins with catalytic or binding ability. Notably, immune system process was consistently annotated across all four time points, while extracellular region, transporter activity and locomotion emerged starting at PWD 3 and persisted through PWD 14, indicating that the expression of genes associated with immune response, extracellular matrix, and membrane transport in IUVECs changed during the post-weaning period. It should be noted that the above results are functional classification summaries based on differentially expressed gene annotation, which reflect the transcriptional changes of genes related to specific functions in intestinal epithelium after weaning.
Figure 5.
GO enrichment analysis of DEGs at four post-weaning time points compared with the control group. The core functional GO terms of DEGs at PWD 1, 3, 7, and 14 are presented in a single bar chart. The numbers on the bars indicate the number of DEGs that were enriched in each GO term.
3.7. KEGG Pathway Enrichment Analysis of DEGs
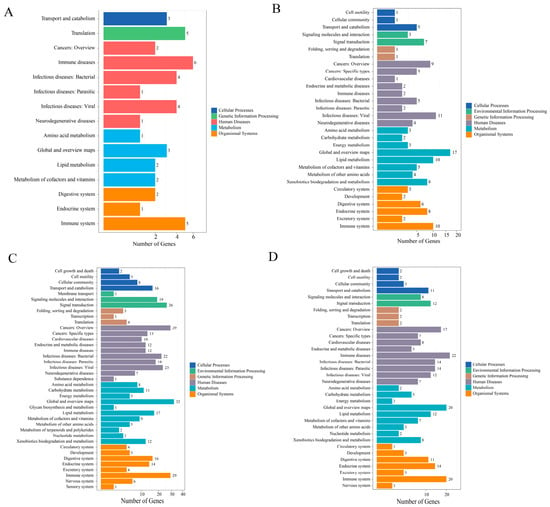
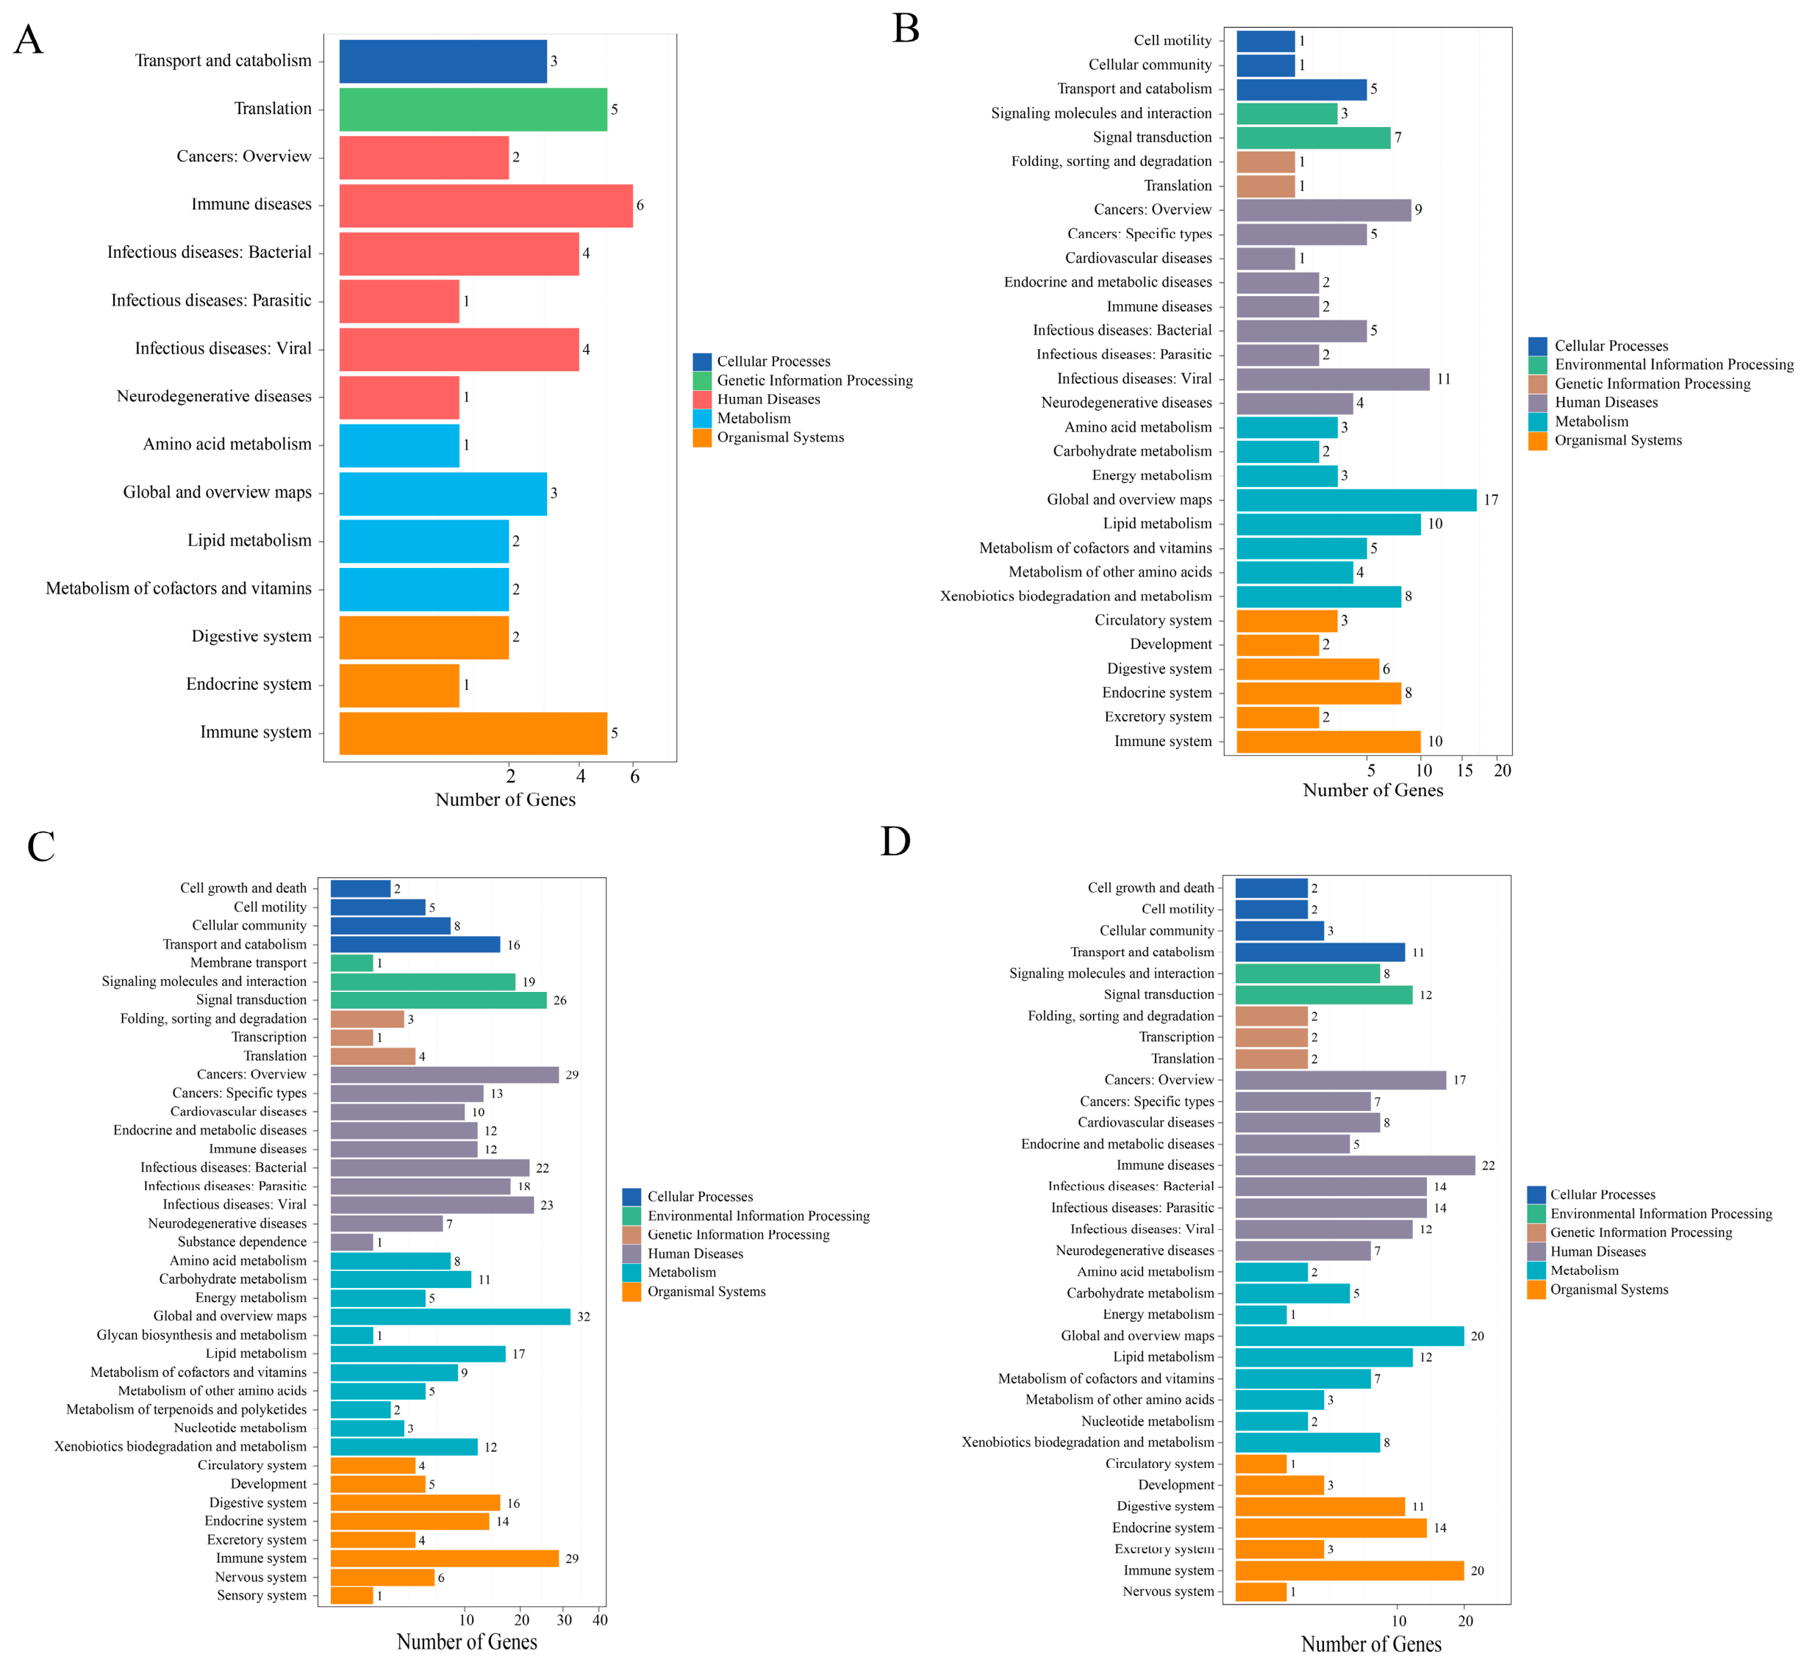
To obtain a global profile of the weaning-affected biological processes and identify signaling pathways involved in IUVEC renewal, all DEGs were mapped to the KEGG primary functional hierarchy. The results showed that PWD 1 had the fewest enriched pathways (n = 15), which were mainly associated with basal metabolism, translation, and immune/infection response (Figure 6A). The number of enriched pathways increased to 30 at PWD 3, with additional categories including endocrine and metabolic diseases, signal transduction, and energy metabolism (Figure 6B). PWD 7 showed the largest number of enriched pathways (n = 39) with additional categories covering cell growth and death, transcription, membrane transport, neural/sensory systems, and multiple metabolic pathways (Figure 6C). At PWD 14, the number of enriched pathways decreased to 34, retaining pathways related to cell growth and death, transcription, and nervous system pathways, while those for membrane transport and sensory system pathways were no longer enriched (Figure 6D). It should be noted that changes in the number of enriched pathways reflect an expanding coverage of biological processes represented by DEGs rather than a direct measure of pathway activation strength. This temporal pattern indicates that IUVECs undergo a shift in their transcriptional programs from an initial defense-oriented response toward broader metabolic–immune accommodation following weaning stress.
Figure 6.
Significantly enriched KEGG pathways of DEGs from IUVECs’ transcriptome between weaning and control group. (A) The enriched KEGG pathways for DEGs of W1-1 compared with W0-1. (B) The enriched KEGG pathways for DEGs of W3-1 compared with W0-1. (C) The enriched KEGG pathways for DEGs of W7-1 compared with W0-1. (D) The enriched KEGG pathways for DEGs of W14-1 compared with W0-1. The X-axis represents the number of the DEGs, the Y-axis represents the KEGG functional classification of DEGs.
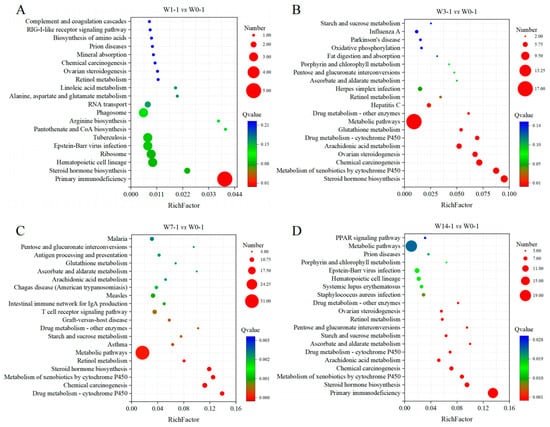
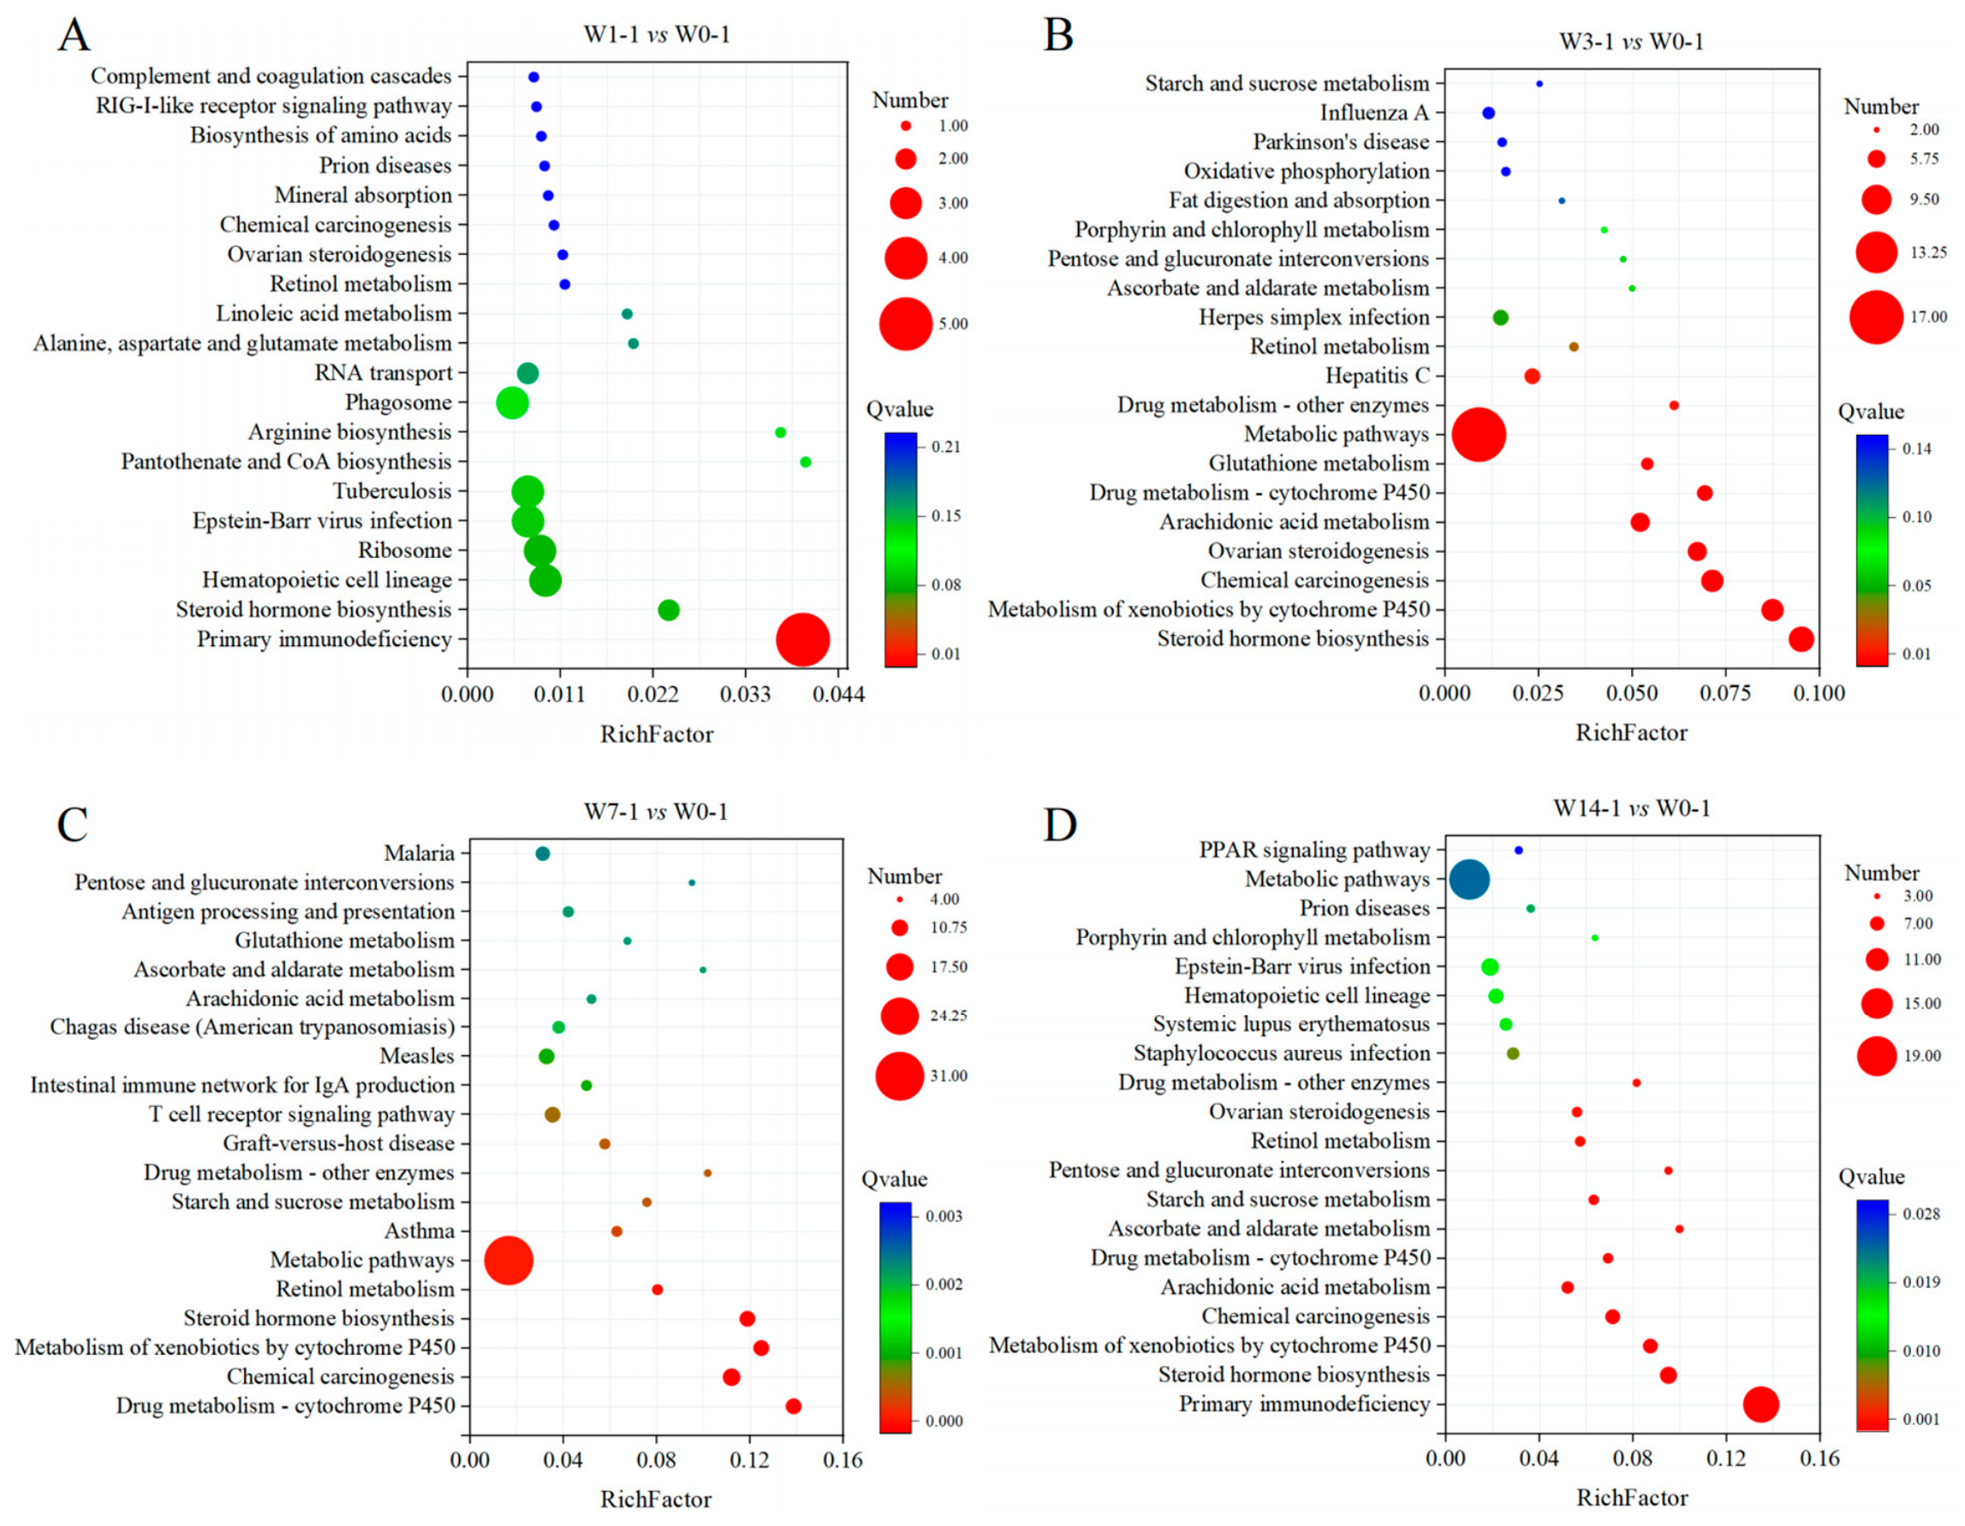
Subsequently, KEGG subpathway analysis of the DEGs at different post-weaning days revealed time-dependent changes in significantly enriched pathway categories (Figure 7A–D). At PWD 1, significantly enriched terms were predominantly annotated to immune-related pathways, including primary immunodeficiency (Q < 0.05), indicating differential expression of immune-related genes at this time point (Figure 7A). At PWD 3, the enriched terms shifted towards metabolism, with steroid hormone biosynthesis, metabolism of xenobiotics by cytochrome P450, and arachidonic acid metabolism among the most highly enriched (Figure 7B). At PWD 7, the significantly enriched terms were dominated by metabolic pathways, which contained the largest number of differentially expressed genes, while a subset of DEGs was concurrently enriched in drug metabolism and immune-related pathways (Q < 0.05) (Figure 7C). At PWD 14, immune-related terms including primary immunodeficiency reappeared as significant terms alongside several metabolic terms that remained significant (Q < 0.05). (Figure 7D). The dynamic changes described above suggest that the transcriptional profile of IUVECs undergoes a graduative temporal transition after weaning, characterized by an acute stress response at PWD 1, an expanded stress response coupled with initiation of metabolic activity at PWD 3, predominantly immune- and metabolism-related transcriptional responses at PWD 7, and adaptation-implicated transcriptional patterns at PWD 14. These associations are based on pathway enrichment analyses and should be further validated functionally.
Figure 7.
Significantly enriched top 20 KEGG subpathways of the DEGs between weaning and control group. (A) The enriched KEGG subpathways for DEGs of W1-1 compared with W0-1. (B) The enriched KEGG subpathways for DEGs of W3-1 compared with W0-1. (C) The enriched KEGG subpathways for DEGs of W7-1 compared with W0-1. (D) The enriched KEGG subpathways for DEGs of W14-1 compared with W0-1. The X-axis represents the enrichment factor value (Rich Factor), the Y-axis represents the pathway name. The color of the dots in the figure represents the Q-value, and the lighter the color, the greater the value, the deeper the smaller, with the latter representing more significant enrichment results; the size of the dots represents the number of DEGs, with larger dots representing larger numbers and smaller dots representing smaller numbers.
3.8. Experimental Validation of DEGs Expression Using qRT-PCR
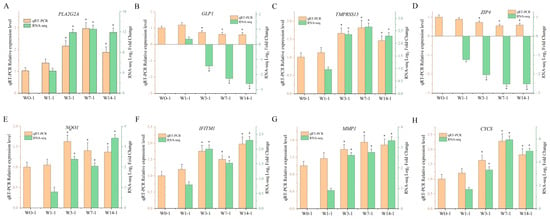
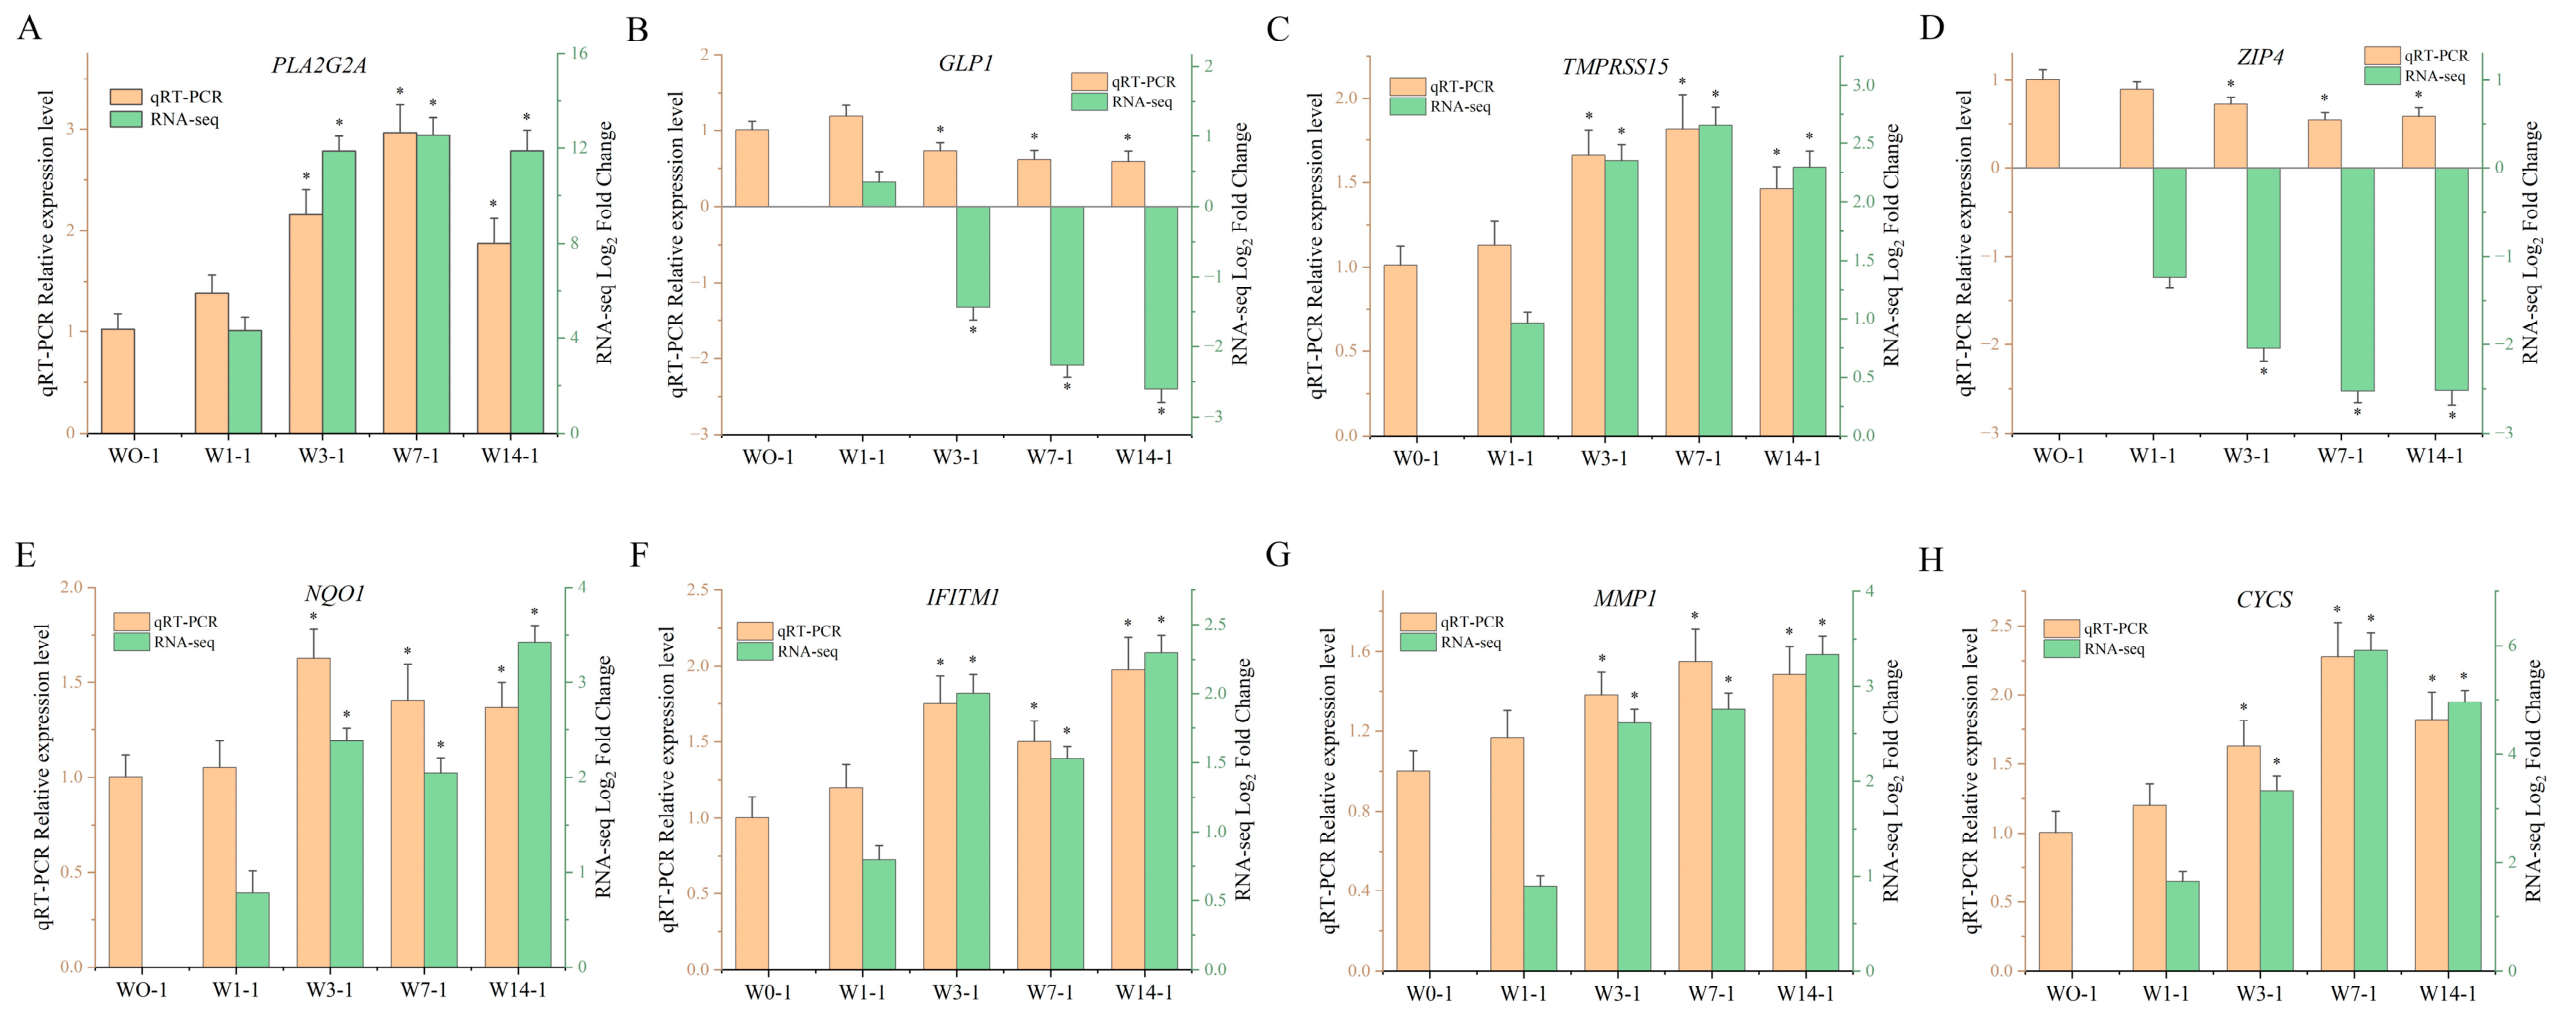
To validate the RNA-seq results, eight DEGs (PLA2G2A, GLP1, TMPRSS15, ZIP4, NQO1, IFITM1, MMP1, and CYCS) were examined by qRT-PCR. The results showed that, using the control group (W0-1) as a reference, the relative expression variation patterns of each DEG at different time points after weaning were consistent with the RNA-seq results (Figure 8). In addition, the significance of differential expression at each time point compared to the control group was also consistent with transcriptome analysis. These findings confirmed that the expression tendency obtained by qRT-PCR was highly consistent with RNA-seq data, which supported the reliability of transcriptome sequencing.
Figure 8.
Comparison of qRT-PCR and RNA-seq expression patterns for the eight DEGs. (A) PLA2G2A, phospholipase A2 group IIA. (B) GLP1, glucagon-like peptide-1. (C) TMPRSS15, enteropeptidase. (D) ZIP4, solute carrier family 39 member 4. (E) NQO1, NAD(P)H quinone dehydrogenase 1. (F) IFITM1, interferon-induced transmembrane protein 1. (G) MMP1, matrix metallopeptidase 1. (H) CYCS, cytochrome c, somatic. Dual Y-axis bar chart showing the relative expression levels determined (2−ΔΔCt) by qRT-PCR (left Y-axis, orange bars) and log2 FC obtained from RNA-seq (right Y-axis, green bars). In each panel, asterisk (*) denote statistically significant differences compared to the control group; for qRT-PCR, the significance threshold was set at p < 0.05; for RNA-seq, the significance threshold was set at FDR < 0.05. Values are expressed as means ± SEM, with n = 5 for each group.
4. Discussion
Early weaning is a critical stage of postnatal growth and gastrointestinal development in piglets. It usually results in alterations in the intestinal mucosal structure and function in post-weaning piglets [15,16]. Therefore, previous studies were mainly focused on testing the mucosal morphology, intestinal permeability, digestive enzyme activities and functional protein expression, anti- and proinflammatory cytokine gene expression, and microbiota of intestine of weaning piglets [17,18]. However, the effect of weaning stress on the dynamic changes of intestinal epithelial cells at the gene transcription level is not clear. Thus, the present study aims to help improve the understanding of the molecular mechanisms of gut health in weaned piglets by comprehensive analysis of the transcriptome of IUVECs during the early-weaning period.
The IUVECs primarily represent the differentiated absorptive cell lineage and play a key role in nutrient digestion and absorption. The IECs, particularly the brush border, are one of the key sites for the synthesis of ALP. Previous studies reported that ALP is highly enriched at the brush border of terminally differentiated IECs, and its expression activity increases as cells migrate along the CVA, serving as a reliable molecular marker for mature IECs [6]. During weaning stress, however, decreased ALP activity results in LPS accumulation and subsequent TLR4/NF-κB activation, driving a shift toward a pro-inflammatory cytokine profile characterized by increased TNF-α, IL-1β, and IL-6 and decreased IL-10 [19]. Kawano et al. [20] reported that enhancing intestinal ALP activity can effectively inhibit the production of IL-8 in IECs induced by LPS, thereby playing a role in maintaining intestinal homeostasis. In this study, ALP activity confirmed enrichment of mature IUVECs; however, their absolute purity remains to be determined. Future studies will utilize techniques such as immunohistochemical staining or single-cell analysis to further refine the characterization of cell populations.
In this study, PCA and clustering heatmaps revealed that the samples were not completely separated, which is biologically plausible. Post-weaning intestinal maturation is a gradual and continuous process, so adjacent time points are expected to share similar transcriptomic profiles. In addition, the conserved core transcriptome of IUVECs, which perform essential digestive and absorptive functions throughout the post-weaning period, likely accounts for a substantial proportion of the total variance, while individual variability in the pace of gut maturation further contributes to sample overlap [6]. Notably, despite the partial overlap in global expression profiles, differential expression analysis robustly identified time-point-specific genes. The number of DEGs in IUVECs increased significantly compared with the sucking period and showed a continuous upward trend on PWD 1, 3 and 7, with a slight decrease by PWD 14. This suggests that PWD 7 may represent a critical turning point for the dynamic changes in DEGs’ expression and functional restructuring. The above transcriptional pattern might indicate stress-induced intestinal epithelial injury occurring immediately after weaning, further deteriorating during the first post-weaning week, followed by gradual resolution. These findings are consistent with previous studies, which show that the most severe damage to the pig intestinal structure occurs during the first week after weaning [21,22]. To further elucidate the transcriptional mechanisms regulating the renewal of IUVECs, we systematically reviewed the literature and found several key DEGs that were closely related to intestinal epithelium development. These genes are mainly involved in inflammatory response, oxidative stress, tissue remodeling, hormonal regulation and energy metabolism.
PLA2G2A is one of the key enzymes that regulate the synthesis of arachidonic acid (AA) and lysophospholipids in the process of inflammation [23]. PGFS is key enzyme that catalyze the conversion of AA into prostaglandins, playing a central role in inflammatory responses, pain regulation, and blood vessel dilation and contraction [24]. The present study found that PLA2G2A was the most upregulated DEG during weaning, and its coordinated upregulation with PGFS suggests the possible involvement of the arachidonic acid cascade in the inflammatory transcriptional response of IUVECs, which requires functional validation. As an interferon-induced transmembrane protein, IFITM1 plays a key role in the immune response against porcine epidemic diarrhea virus (PEDV). In the cytoplasm surrounding the nucleus, IFITM1 colocalizes with PEDV virions, localizes on their surface, and directly binds to the N protein, which is likely responsible for its antiviral effect [25]. The porcine IFITM1 protein interacts with the S protein of PEDV, co-localizes in the perinuclear region, and enhances the infectivity of PEDV in porcine small intestinal organoids [26]. McCracken et al. [21] reported that elevated MMP1 activity in the intestinal mucosa disrupts the collagen structure of the villi and lamina propria, and that this ECM degradation is the key mechanism underlying villus shortening in post-weaning piglets. Our results show that the upregulation of IFITM1 and MMP1 indicates an increased capacity for immune response-related processes, tissue remodeling and ECM-related processes in IUVECs at the transcriptional level; these associations do not directly demonstrate immune activation or structural remodeling of the intestinal epithelium, which would require direct functional assessment.
The sustained and severe inflammatory response initiated by PLA2G2A invariably stimulates activated immune cells and distressed epithelial cells to produce substantial quantities of ROS, consequently leading to oxidative stress [27]. GSTA1 is a crucial detoxification enzyme involved in the body’s response to oxidative stress. It catalyzes the conjugation of glutathione with harmful electrophilic compounds, thereby facilitating the elimination of reactive oxygen species and protecting cells from damage [28]. NQO1 facilitates the two-electron reduction of quinones and their derivatives, preventing the one-electron reduction that leads to semiquinone radicals and fuels redox cycling and ROS production [29]. During the suckling period, the IUVECs increase their energy metabolism in order to meet the demands related to nutrient absorption and barrier renewal [30]. However, these cells instead enhance the glutathione-dependent antioxidant defense system under weaning stress [31]. Consequently, the upregulated expression of GSTA1 and NQO1 in this study represents a compensatory response to oxidative stress in IUVECs induced by weaning.
The downregulation of the CYTB (the core subunit of Complex III) and COX1 (the core subunit of Complex IV) directly disrupts the integrity of the mitochondrial electron transport chain, prevents the formation of a proton gradient, which in turn leads to the failure of oxidative phosphorylation and a significant reduction in ATP synthesis [32]. In this study, both CYTB and COX1 were significantly downregulated in IUVECs after weaning. This transcriptional-level alteration suggests that weaning stress may affect the transcriptional programs associated with mitochondrial oxidative phosphorylation in IUVECs, shifting the expression patterns of energy metabolism-related genes toward an energy supply-restricted direction. He et al. [33] found that oxidative stress can directly lead to a decrease in the expression of ZIP4 in the IECs, disrupting zinc influx and cellular zinc homeostasis; this in turn exacerbates oxidative damage, inhibits cell proliferation, and weakens the function of the intestinal barrier. Hu et al. [34] reported that the upregulation of SLC3A1 is a compensatory response by piglets in response to the reduced absorptive surface area within the CVA and increased substrate competition induced by weaning stress. At the transcriptomic level, our results suggest that the downregulation of ZIP4 and the upregulation of SLC3A1 reflect adaptive adjustments in the transcriptional programs associated with zinc homeostasis and amino acid transport in IUVECs under weaning stress.
CYCS binds to apoptotic protease-activating factor 1 (Apaf-1) to form apoptosome, which in turn activates the caspase-9 and caspase-3 cascade, ultimately leading to apoptosis [35]. Our results showed that the expression of CYCS began to elevate on PWD 3, peaking on PWD 7. This transcriptional change could be interpreted as a potential indicator of apoptosis-related processes, which may contribute to the gradual reduction in mature IUVECs after weaning; however, functional validation is needed for confirmation. Previous studies have reported increased CYCS expression during the first post-weaning week that promotes apoptosis [9]; the transcriptional pattern of CYCS observed in this study was consistent with these findings. Ribosomal proteins constitute the fundamental building blocks of ribosomes, the cellular organelles responsible for protein synthesis [36]. The sustained downregulation of RPS19 implies a global reduction in the IUVECs’ capacity to synthesize new proteins. Cells undergoing apoptosis actively suppress global protein synthesis to conserve energy and facilitate an orderly demise [31]. These observations suggest that the transcriptional changes associated with CYCS, together with the enrichment of pathways related to impaired energy metabolism and protein synthesis, may contribute to apoptosis-related processes in IUVECs, which could in turn underlie villus atrophy after weaning; direct evidence of apoptosis and villus morphometry would be required to confirm this mechanism.
Gut hormones, secreted by the intestinal endocrine cells, play a pivotal role in regulating digestion, absorption, appetite, metabolic equilibrium, and communication along the gut-brain axis [37]. Additionally, specific gut-derived hormones have been shown to augment small intestinal growth and bolster barrier function [38]. The signaling axis formed by SST and its receptor SSTR2 (a G protein-coupled receptor) not only plays a critical role in guiding the trafficking of developing lymphocytes into the intestine and in the early development of the intestinal immune system [39], but also increases the expression of the intestinal NHE8 protein via the SSTR2-p38 MAPK pathway, thereby promoting sodium absorption [40]. The sustained downregulation of TFF3 significantly impairs intestinal defense and repair mechanisms [41]. In particular, the post-weaning decrease in GLP1 levels promoted gastric emptying and increased intestinal peristalsis [42], which shortened the residence time of chyme in the small intestine, impaired net nutrient absorption and increased luminal osmolarity, ultimately triggering osmotic diarrhea. Furthermore, the sudden reduction in hormonal signaling together with the sustained transcription downregulation of TMPRSS15 severely compromised dietary protein digestive capacity. The resulting malabsorption of proteins provided substrates for fermentation by pathobionts in the distal gut, which is known to be a key etiological factor in the pathogenesis of post-weaning diarrhea [43]. Our results show a coordinated and sustained downregulation of several genes encoding gut hormones and peptides that are essential for digestive function, including GHRL, MLN, SST, GLP1, GIP, and TMPRSS15. The hypothesized link between these transcriptional changes and malabsorption and post-weaning diarrhea requires further experimental validation.
GO enrichment analysis revealed that DEGs were primarily associated with cellular, metabolic and immune processes. The number of DEGs increased during the first week and peaked on PWD 7, consistent with intestinal mucosal damage, digestive dysfunction and disruption of the immune barrier [44]. KEGG analysis revealed a temporal shift in pathway dominance from acute immune/infection pathways on PWD 1 to metabolism by PWD 3 and finally to an integrated immune system, lipid metabolism, and signal transduction network by PWD 7–14. During the early post-weaning period in piglets, a cessation of maternal IgG supply combined with their underdeveloped immune organs results in an immunodeficiency window [45]. The surge in steroid hormones further exacerbates intestinal mucosal atrophy and oxidative stress, leading to diarrhea and stunted growth [46]. CYP1A1, recognized as an indicator of oxidative stress, has the capacity to transform toxic metabolites into ROS such as superoxide anion, hydrogen peroxide, and hydroxyl radical, potentially leading to cellular injury [47]. Oxidative stress triggers the activation of PLA2G2A, resulting in the release of AA; through the COX/LOX pathway, this leads to the production of pro-inflammatory mediators such as PGE2 and LTB4 [48]. These mediators subsequently activate NF-κB signaling pathway, thereby intensifying the inflammatory response [49]. Therefore, our results indicated that weaning stress can induce a complex adaptive process in the intestinal epithelium, transitioning from local inflammatory defense to systemic immune-metabolic reprogramming. This transition follows a pathophysiological continuum that proceeds from stress perception and oxidative injury through energy crisis and cell apoptosis, ultimately reaching systemic adaptation, thereby corroborating the sequential cascade of weaning-induced intestinal injury. It should be noted that because the dietary transition from sow milk to solid feed and the continuous age-related intestinal maturation occur simultaneously at weaning, the transcriptional patterns observed in this study should be interpreted as reflecting the combined effects of weaning stress, diet change, and developmental maturation rather than weaning stress alone. Future studies should therefore adopt an age-matched suckling control group or a pair-feeding design to define the specific effect of weaning stress.
5. Conclusions
The present study provides a comprehensive transcriptomic atlas of porcine jejunal IUVECs across five post-weaning time points, characterizing a temporal sequence of transcriptional changes, an early phase dominated by immune-related pathways (PWD 1–3), a phase marked by enriched metabolism-related pathways (PWD 7), and a later phase where both immune- and metabolism-related pathways co-occurred (PWD 14). These exploratory transcriptomic findings are consistent with, but do not demonstrate, a transition of IUVECs from an immune-dominated to an immunometabolic transcriptional profile, which may reflect the combined effects of weaning stress and post-weaning maturation. The genes and pathways identified herein may serve as candidate leads for future nutritional or therapeutic intervention studies, subject to functional validation of their causality, functional significance, and therapeutic relevance.
Supplementary Materials
The following supporting information can be downloaded at: https://www.mdpi.com/article/10.3390/ani16223655/s1, Table S1: Statistics for filtering and mapping reads; Table S2: DEGs in IUVECs on PWD 1 compared with the 21-day-old suckling period; Table S3: DEGs in IUVECs on PWD 3 compared with the 21-day-old suckling period; Table S4: DEGs in IUVECs on PWD 7 compared with the 21-day-old suckling period; Table S5: DEGs in IUVECs on PWD 14 compared with the 21-day-old suckling period.
Author Contributions
Conceptualization, L.Z. and X.X.; methodology, L.Z., Y.S., Y.W. and X.X.; software, L.Z., S.L. and Y.C.; validation, L.Z. and X.X.; formal analysis, L.Z. and X.X.; investigation, L.Z., Y.S. and Y.W.; resources, X.X.; data curation, L.Z., S.L. and Y.S.; writing—original draft preparation, L.Z. and Y.S.; writing—review and editing, Y.S., Y.C. and X.X.; visualization, L.Z., S.L. and Y.C.; supervision, X.X.; project administration, L.Z. and X.X.; funding acquisition, L.Z. All authors have read and agreed to the published version of the manuscript.
Funding
This work was supported by the Hunan Provincial Natural Science Foundation of China (Grant No. 2026JJ81124).
Institutional Review Board Statement
Animal experimental procedure was reviewed and approved by the Animal Care and Use Committee of the Institute of Subtropical Agriculture, the Chinese Academy of Sciences (ISA-2025-127) on 19 October 2025.
Informed Consent Statement
Written informed consent was obtained from the owner of the animals involved in this study.
Data Availability Statement
Sequence data supporting the findings of this study have been deposited in the NCBI Sequence Read Archive (SRA) under BioProject accession PRJNA1558210.
Conflicts of Interest
The authors declare no conflicts of interest.
Abbreviations
The following abbreviations are used in this manuscript:
| IUVECs | Intestinal upper villus epithelial cells |
| PWD | Post-weaning day |
| CVA | Crypt–villus axis |
| IECs | Intestinal epithelial cells |
| ISCs | Intestinal stem cells |
| ROS | Reactive oxygen species |
| PLA2G2A | Phospholipase A2 group IIA |
| CYCS | Cytochrome c, somatic |
| GO | Gene Ontology |
| KEGG | Kyoto Encyclopedia of Genes and Genomes |
| AA | Arachidonic acid |
References
- van der Flier, L.G.; Clevers, H. Stem cells, self-renewal, and differentiation in the intestinal epithelium. Annu. Rev. Physiol. 2009, 71, 241–260. [Google Scholar] [CrossRef] [Scilit] [PubMed]
- Qi, Z.; Chen, Y.G. Regulation of intestinal stem cell fate specification. Sci. China Life Sci. 2015, 58, 570–578. [Google Scholar] [CrossRef] [Scilit] [PubMed]
- Beumer, J.; Clevers, H. Cell fate specification and differentiation in the adult mammalian intestine. Nat. Rev. Mol. Cell Biol. 2021, 22, 39–53. [Google Scholar] [CrossRef] [Scilit] [PubMed]
- Larue, A.E.M.; Atlasi, Y. The epigenetic landscape in intestinal stem cells and its deregulation in colorectal cancer. Stem Cells 2024, 42, 509–525. [Google Scholar] [CrossRef] [Scilit] [PubMed]
- Yin, X.; Farin, H.F.; van Es, J.H.; Clevers, H.; Langer, R.; Karp, J.M. Niche-independent high-purity cultures of Lgr5+ intestinal stem cells and their progeny. Nat. Methods 2014, 11, 106–112. [Google Scholar] [CrossRef] [Scilit] [PubMed]
- Zou, L.; Shao, Y.; Xu, Y.; Wu, Y.; Zhou, J.; Xiong, X.; Yin, Y. Transcriptome Profile Analysis of Intestinal Upper Villus Epithelial Cells and Crypt Epithelial Cells of Suckling Piglets. Animals 2022, 12, 2324. [Google Scholar] [CrossRef] [Scilit] [PubMed]
- Gu, X.; Li, D.; She, R. Effect of weaning on small intestinal structure and function in the piglet. Arch. Tierernahr. 2002, 56, 275–286. [Google Scholar] [CrossRef] [Scilit] [PubMed]
- Pistol, G.C.; Marin, D.E.; Bulgaru, V.C.; Anghel, A.C.; Saracila, M.; Vlassa, M.; Filip, M.; Taranu, I. Grape seed meal by-product is able to counteract oxidative stress induced by lipopolysaccharide and dextran sulphate in IPEC cells and piglets after weaning. PLoS ONE 2023, 18, e0283607. [Google Scholar] [CrossRef] [Scilit] [PubMed]
- Zhu, L.H.; Xu, J.X.; Zhu, S.W.; Cai, X.; Yang, S.F.; Chen, X.L.; Guo, Q. Gene expression profiling analysis reveals weaning-induced cell cycle arrest and apoptosis in the small intestine of pigs. J. Anim. Sci. 2014, 92, 996–1006. [Google Scholar] [CrossRef] [Scilit] [PubMed]
- Pluske, J.R. Feed- and feed additives-related aspects of gut health and development in weanling pigs. J. Anim. Sci. Biotechnol. 2013, 4, 1. [Google Scholar] [CrossRef] [Scilit] [PubMed]
- Liu, Z.; Li, N.; Wang, H.; Zhong, R.; Cao, S.; Zheng, Z.; Liu, J.; Chen, L.; Yan, J.; Mu, S. Multi-Omics Insights into the Role of Dulcitol in Weaned Piglets’ Growth Performance and Intestinal Health. Antioxidants 2025, 14, 1346. [Google Scholar] [CrossRef] [Scilit] [PubMed]
- Huting, A.M.S.; Middelkoop, A.; Guan, X.; Molist, F. Using Nutritional Strategies to Shape the Gastro-Intestinal Tracts of Suckling and Weaned Piglets. Animals 2021, 11, 402. [Google Scholar] [CrossRef] [Scilit] [PubMed]
- Love, M.I.; Huber, W.; Anders, S. Moderated estimation of fold change and dispersion for RNA-seq data with DESeq2. Genome Biol. 2014, 15, 550. [Google Scholar] [CrossRef] [Scilit]
- Livak, K.J.; Schmittgen, T.D. Analysis of relative gene expression data using real-time quantitative PCR and the 2−ΔΔCT Method. Methods 2001, 25, 402–408. [Google Scholar] [PubMed]
- Moeser, A.J.; Ryan, K.A.; Nighot, P.K.; Blikslager, A.T. Gastrointestinal dysfunction induced by early weaning is attenuated by delayed weaning and mast cell blockade in pigs. Am. J. Physiol. Gastrointest. Liver Physiol. 2007, 293, G413–G421. [Google Scholar] [CrossRef] [Scilit] [PubMed]
- Lackeyram, D.; Yang, C.; Archbold, T.; Swanson, K.C.; Fan, M.Z. Early weaning reduces small intestinal alkaline phosphatase expression in pigs. J. Nutr. 2010, 140, 461–468. [Google Scholar] [CrossRef] [Scilit] [PubMed]
- Hu, C.H.; Xiao, K.; Luan, Z.S.; Song, J. Early weaning increases intestinal permeability, alters expression of cytokine and tight junction proteins, and activates mitogen-activated protein kinases in pigs. J. Anim. Sci. 2013, 91, 1094–1101. [Google Scholar] [CrossRef] [Scilit] [PubMed]
- Fan, M.Z.; Stoll, B.; Jiang, R.; Burrin, D.G. Enterocyte digestive enzyme activity along the crypt-villus and longitudinal axes in the neonatal pig small intestine. J. Anim. Sci. 2001, 79, 371–381. [Google Scholar] [CrossRef] [Scilit] [PubMed]
- Vermeire, B.; Walsh, M.; Cox, E.; Devriendt, B. The lipopolysaccharide structure affects the detoxifying ability of intestinal alkaline phosphatases. BMC Vet. Res. 2024, 20, 358. [Google Scholar] [CrossRef] [Scilit] [PubMed]
- Kawano, M.; Arai, T.; Kabuki, T. Skim Milk Culture of Lactobacillus johnsonii SBT0309 Increases Intestinal Alkaline Phosphatase Activity and Inhibits Lipopolysaccharide-Induced Interleukin-8 Production in Intestinal Epithelial Cells. Cells 2025, 14, 358. [Google Scholar] [CrossRef] [Scilit] [PubMed]
- McCracken, B.A.; Spurlock, M.E.; Roos, M.A.; Zuckermann, F.A.; Gaskins, H.R. Weaning anorexia may contribute to local inflammation in the piglet small intestine. J. Nutr. 1999, 129, 613–619. [Google Scholar] [CrossRef] [Scilit] [PubMed]
- Shao, Y.; Xiong, X.; Wang, K.; Cheng, P.; Zou, L.; Zhou, J.; Qi, M.; Yin, Y. Early weaning leads to the remodeling of lipid profile in piglet jejunal crypt cells during post-weaning days. Anim. Nutr. 2022, 11, 102–111. [Google Scholar] [CrossRef] [Scilit] [PubMed]
- Lima, A.A.; Nascimento, N.R.; Fang, G.D.; Yotseff, P.; Toyama, M.H.; Guerrant, R.L.; Fonteles, M.C. Role of phospholipase A2 and tyrosine kinase in Clostridium difficile toxin A-induced disruption of epithelial integrity, histologic inflammatory damage and intestinal secretion. J. Appl. Toxicol. JAT 2008, 28, 849–857. [Google Scholar] [CrossRef] [Scilit] [PubMed]
- Wimuttisuk, W.; Yotbuntueng, P.; Deenarn, P.; Tobwor, P.; Kittiwongpukdee, K.; Jiemsup, S.; Vanichviriyakit, R.; Kasamechotchung, C.; Yongkiettrakul, S.; Munkongwongsiri, N.; et al. Differential regulation of the eicosanoid biosynthesis pathway in response to Enterocytozoon hepatopenaei infection in Litopenaeus vannamei. PLoS ONE 2025, 20, e0334906. [Google Scholar] [CrossRef] [Scilit] [PubMed]
- Cheng, J.; He, J.; Feng, S.; Tan, L.; Bai, B.; Dong, W.; Li, B.; Wen, L.; Wang, A.; Yuan, X. IFITM1 is a host restriction factor that inhibits porcine epidemic diarrhea virus infection. J. Nanobiotechnol. 2024, 22, 677. [Google Scholar] [CrossRef] [Scilit] [PubMed]
- Lv, L.; Luo, H.; Yi, J.; Zhang, K.; Li, Y.; Tong, W.; Jiang, Y.; Zhou, Y.; Tong, G.; Liu, C. IFITM proteins are key entry factors for porcine epidemic diarrhea coronavirus. J. Virol. 2025, 99, e0202824. [Google Scholar] [CrossRef] [Scilit] [PubMed]
- Ayvazyan, N.; Ghukasyan, G.; Ghulikyan, L.; Kirakosyan, G.; Sevoyan, G.; Voskanyan, A.; Karabekyan, Z. The Contribution of Phospholipase A(2) and Metalloproteinases to the Synergistic Action of Viper Venom on the Bioenergetic Profile of Vero Cells. Toxins 2022, 14, 724. [Google Scholar] [CrossRef] [Scilit]
- Yang, X.; Mao, Z.; Huang, Y.; Yan, H.; Yan, Q.; Hong, J.; Fan, J.; Yao, J. Reductively modified albumin attenuates DSS-Induced mouse colitis through rebalancing systemic redox state. Redox Biol. 2021, 41, 101881. [Google Scholar] [CrossRef] [Scilit] [PubMed]
- Nishida-Tamehiro, K.; Kimura, A.; Tsubata, T.; Takahashi, S.; Suzuki, H. Antioxidative enzyme NAD(P)H quinone oxidoreductase 1 (NQO1) modulates the differentiation of Th17 cells by regulating ROS levels. PLoS ONE 2022, 17, e0272090. [Google Scholar] [CrossRef] [Scilit] [PubMed]
- Xiong, X.; Yang, H.; Hu, X.; Wang, X.; Li, B.; Long, L.; Li, T.; Wang, J.; Hou, Y.; Wu, G.; et al. Differential proteome analysis along jejunal crypt-villus axis in piglets. Front. Biosci. 2016, 21, 343–363. [Google Scholar] [CrossRef] [Scilit] [PubMed]
- Xiong, X.; Yang, H.; Tan, B.; Yang, C.; Wu, M.; Liu, G.; Kim, S.W.; Li, T.; Li, L.; Wang, J.; et al. Differential expression of proteins involved in energy production along the crypt-villus axis in early-weaning pig small intestine. Am. J. Physiol. Gastrointest. Liver Physiol. 2015, 309, G229–G237. [Google Scholar] [CrossRef] [Scilit] [PubMed]
- Shakeri, M.; Kong, B.; Zhuang, H.; Bowker, B. Potential Role of Ribonucleotide Reductase Enzyme in Mitochondria Function and Woody Breast Condition in Broiler Chickens. Animals 2023, 13, 2038. [Google Scholar] [CrossRef] [Scilit] [PubMed]
- He, X.; Liang, Z.; Wu, Y.; Huang, J.; Pu, Y.; Liu, J.; Pi, J.; Zhang, H. Integration analysis of transcriptomics and proteomics reveals molecular pathways of duck intestinal epithelial cells in response to oxidative stress. Poult. Sci. 2025, 104, 106044. [Google Scholar] [CrossRef] [Scilit] [PubMed]
- Hu, N.; Mao, P.; Xiong, X.; Ma, Z.; Xie, Z.; Gao, M.; Wu, Q.; Ma, W. Effect of N-Carbamylglutamate Supplementation on Growth Performance, Jejunal Morphology, Amino Acid Transporters, and Antioxidant Ability of Weaned Pigs. Animals 2023, 13, 3183. [Google Scholar] [CrossRef] [Scilit] [PubMed]
- Ruan, J.; Wei, X.; Li, S.; Ye, Z.; Hu, L.; Zhuang, R.; Cao, Y.; Wang, S.; Wu, S.; Peng, D.; et al. Apaf-1 is an evolutionarily conserved DNA sensor that switches the cell fate between apoptosis and inflammation. Cell Discov. 2025, 11, 4. [Google Scholar] [CrossRef] [Scilit]
- Box, J.M.; Higgins, M.E.; Stuart, R.A. Importance of conserved hydrophobic pocket region in yeast mitoribosomal mL44 protein for mitotranslation and transcript preference. J. Biol. Chem. 2024, 300, 107519. [Google Scholar] [CrossRef] [Scilit]
- Khan, M.T.; Zohair, M.; Khan, A.; Kashif, A.; Mumtaz, S.; Muskan, F. From Gut to Brain: The roles of intestinal microbiota, immune system, and hormones in intestinal physiology and gut-brain-axis. Mol. Cell Endocrinol. 2025, 607, 112599. [Google Scholar] [CrossRef] [Scilit] [PubMed]
- Brubaker, P.L. Glucagon-like Peptide-2 and the Regulation of Intestinal Growth and Function. Compr. Physiol. 2018, 8, 1185–1210. [Google Scholar] [CrossRef] [Scilit]
- Ocon, B.; Brulois, K.F.; Hadeiba, H.; Gaafarelkhalifa, M.; Ayesha, A.; Bi, Y.; Xiang, M.; Gulman, J.; Kooshesh, M.; Pan, J.; et al. An SSTR2-somatostatin chemotactic axis drives T cell progenitor homing to the intestines. Nat. Immunol. 2025, 26, 607–618. [Google Scholar] [CrossRef] [Scilit]
- Wang, C.; Xu, H.; Chen, H.; Li, J.; Zhang, B.; Tang, C.; Ghishan, F.K. Somatostatin stimulates intestinal NHE8 expression via p38 MAPK pathway. Am. J. Physiol. Cell Physiol. 2011, 300, C375–C382. [Google Scholar] [CrossRef] [Scilit] [PubMed]
- Cui, H.Y.; Wang, S.J.; Song, F.; Cheng, X.; Nan, G.; Zhao, Y.; Qian, M.R.; Chen, X.; Li, J.Y.; Liu, F.L.; et al. CD147 receptor is essential for TFF3-mediated signaling regulating colorectal cancer progression. Signal Transduct. Target. Ther. 2021, 6, 268. [Google Scholar] [CrossRef] [Scilit] [PubMed]
- Bany Bakar, R.; Reimann, F.; Gribble, F.M. The intestine as an endocrine organ and the role of gut hormones in metabolic regulation. Nat. Rev. Gastroenterol. Hepatol. 2023, 20, 784–796. [Google Scholar] [CrossRef] [Scilit] [PubMed]
- Xia, J.; Fan, H.; Yang, J.; Song, T.; Pang, L.; Deng, H.; Ren, Z.; Deng, J. Research progress on diarrhoea and its mechanism in weaned piglets fed a high-protein diet. J. Anim. Physiol. Anim. Nutr. 2022, 106, 1277–1287. [Google Scholar] [CrossRef] [Scilit] [PubMed]
- Larsen, C.; Offersen, S.M.; Brunse, A.; Pirolo, M.; Kar, S.K.; Guadabassi, L.; Thymann, T. Effects of early postnatal gastric and colonic microbiota transplantation on piglet gut health. J. Anim. Sci. Biotechnol. 2023, 14, 158. [Google Scholar] [CrossRef] [Scilit] [PubMed]
- Rossi, L.; Turin, L.; Alborali, G.L.; Demartini, E.; Filipe, J.F.S.; Riva, F.; Riccaboni, P.; Scanziani, E.; Trevisi, P.; Dall’Ara, P.; et al. Translational Approach to Induce and Evaluate Verocytotoxic E. coli O138 Based Disease in Piglets. Animals 2021, 11, 2415. [Google Scholar] [CrossRef] [Scilit]
- Park, C.J.; Kim, H.; Jin, J.; Barakat, R.; Lin, P.C.; Choi, J.M.; Ko, C.J. Porcine intestinal lymphoid tissues synthesize estradiol. J. Vet. Sci. 2018, 19, 477–482. [Google Scholar] [CrossRef] [Scilit] [PubMed]
- He, L.; He, T.; Farrar, S.; Ji, L.; Liu, T.; Ma, X. Antioxidants Maintain Cellular Redox Homeostasis by Elimination of Reactive Oxygen Species. Cell Physiol. Biochem. 2017, 44, 532–553. [Google Scholar] [CrossRef] [Scilit] [PubMed]
- Chen, L.; Zhao, Q.; Du, X.; Chen, X.I.; Jiao, Q.; Jiang, H. Effects of oxidative stress caused by iron overload on arachidonic acid metabolites in MES23.5 cells. J. Biosci. 2022, 47, 83. [Google Scholar] [CrossRef] [Scilit]
- Keremane, V.R.; Yashwanthkumar, M.H.; Uppin, V.; Halami, P.; Talahalli, R.R. Lactobacillus fermentum MCC2760 Attenuates Heated Oil-Induced Brain Oxidative Stress and Inflammation via Modulation of NRF2 and NF-kB in Rats. Mol. Nutr. Food Res. 2024, 68, e2400656. [Google Scholar] [CrossRef] [Scilit] [PubMed]

Disclaimer/Publisher’s Note: The statements, opinions and data contained in all publications are solely those of the individual author(s) and contributor(s) and not of MDPI and/or the editor(s). MDPI and/or the editor(s) disclaim responsibility for any injury to people or property resulting from any ideas, methods, instructions or products referred to in the content. |
© 2026 by the authors. Licensee MDPI, Basel, Switzerland. This article is an open access article distributed under the terms and conditions of the Creative Commons Attribution (CC BY) license.