


Simple Summary
The Turpan Basin in western China is a desert region where water is scarce and the environment is fragile. Here lives a tiny fish, Phoxinus grumi Berg, which is found nowhere else on Earth. Despite being a protected species in Xinjiang since 2022, very little is known about its basic biology. To help protect this fish, we studied 527 individuals collected in late 2024 and early 2025. By examining their ear stones (otoliths)—which record age like tree rings—we determined their growth patterns. We found that most fish in the population are young (2–3 years old), with very few older individuals. While the population currently seems to be growing, this age structure is unstable and makes the species vulnerable to environmental changes, such as reduced water flow from glaciers due to climate change. This study provides the first detailed look at the growth of this little-known species. Our findings offer essential information for conservationists to help safeguard this unique fish and its fragile desert oasis home in the Turpan Basin.
Abstract
P. grumi Berg, an endemic species of the Turpan Basin, constitutes an important component of the local aquatic biodiversity. This study aimed to identify the growth model that best describes the growth characteristics of P. grumi Berg and provide baseline biological information on this poorly studied species in Turpan. The research was conducted in the Turpan Basin in November 2024 and March 2025. A total of 527 specimens were collected, with body lengths ranging from 39.0 to 96.0 mm and body weights ranging from 0.69 to 16.00 g. The female-to-male sex ratio was 3.6:1. Age determination based on otolith analysis indicated that individuals ranged from 1 to 5 years old, with age groups 2–3 years predominating in the population, with age groups 2–3 years predominating in the population. The length–weight relationship for females was W = 4.0674 × 10⁻⁵L2.7695 (R2 = 0.8028), for males was W = 1.2645 × 10⁻⁵L3.02 (R2 = 0.9103), and for the combined population was W = 1.9513 × 10⁻⁵L2.9321 (R2 = 0.8221). The von Bertalanffy growth parameters were estimated as follows: L∞ = 102.25 mm, k = 0.331, t0 = −0.7548, Φ = 2.3297, ti = 3.5392; L∞ = 105.82 mm, k = 0.2157, t0 = −0.6737, Φ = 4.4503, ti = 3.3829. The results suggest that the P. grumi Berg population may currently exhibit an increasing population trend; however, the age structure was dominated by younger individuals, indicating a relatively unstable population structure. These findings enrich the basic biological information available for P. grumi Berg and provide an important scientific basis for future conservation and management strategies.
1. Introduction
The Turpan Basin is a relatively enclosed inland basin located in the extremely arid region of northwestern China [1]. Characterized by a continental desert climate and surrounded by high mountain ranges, the basin reaches a maximum elevation of 5445 m above sea level, whereas its lowest point lies 154.31 m below sea level [2,3]. The Turpan watershed is among the driest and most water-insecure areas in China [3]. Its rivers and water sources primarily derive from snowmelt in the mountains, which flows through surface streams and the Karez system [4]. Fish diversity within this watershed is low, with only four native species recorded: B. microphthalma, T. yarkandensis, T. minuta, and P. grumi Berg [5]. Owing to its desert climate and strong dependence on glacial and snowmelt water, the Turpan watershed is particularly vulnerable to climate change. Future warming is expected to be more pronounced in high-latitude and high-mountain regions than the global average, potentially intensifying hydrological instability and ecological vulnerability in arid freshwater ecosystems [4,6,7,8,9]. This vulnerability is further exacerbated by ongoing land degradation, desertification, and increasing water demands associated with agricultural irrigation [10]. Consequently, existing lakes and oases face threats to their ecological balance [11,12]. Under these severe environmental conditions, the risk of declining fish populations in the region continues to rise [13]. Among the native fish species, P. grumi Berg appears to be particularly vulnerable to these environmental changes.
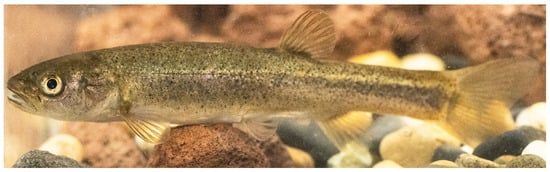
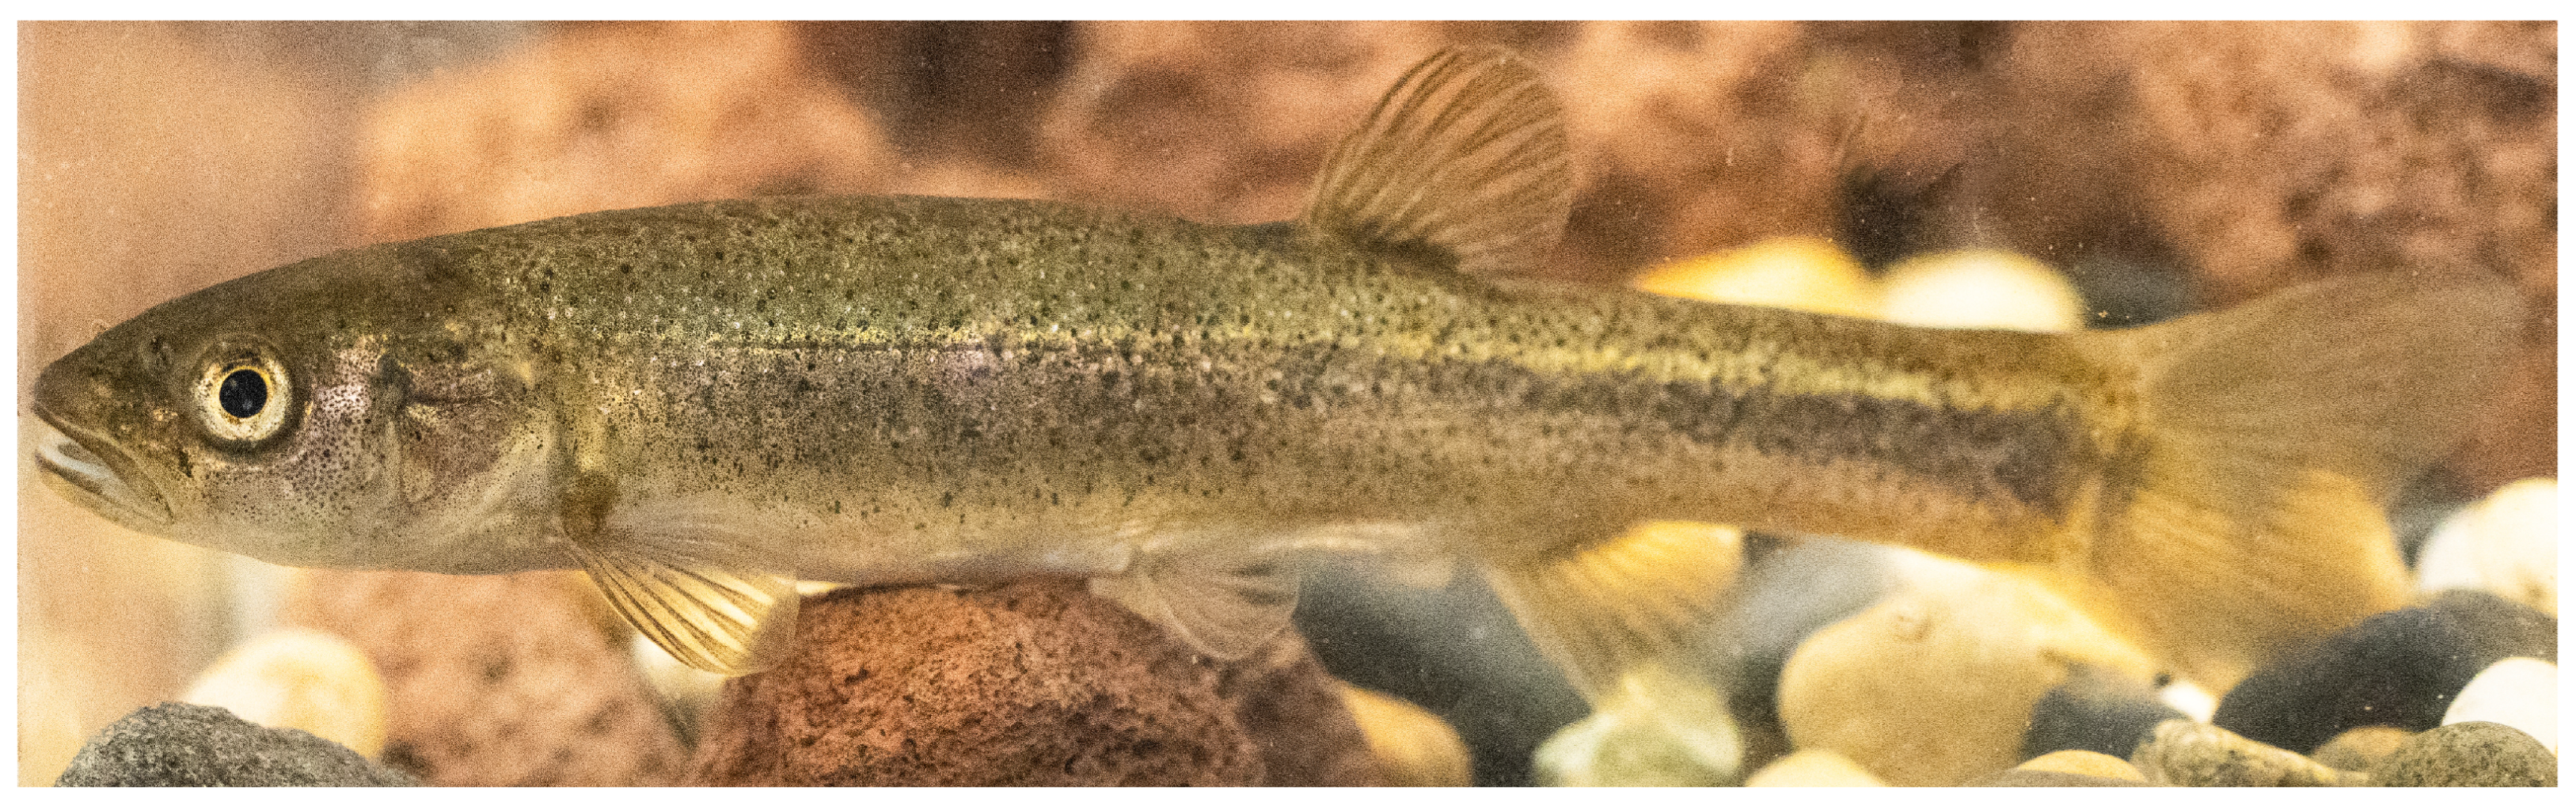
P. grumi Berg (Figure 1) belongs to the order Cypriniformes, family Cyprinidae, subfamily Leuciscinae, and genus Phoxinus. It is a small oxyphilic cold-water fish species with a maximum body length of 11.7 cm. The body length is 4.15–5.41 times the body height and 3.61–4.80 times the head length. The dorsal surface is gray-brown with numerous small black spots, whereas the ventral surface is white. A dark longitudinal stripe extends along the dorsal midline and the lateral side of the body, which is also marked by larger purple spots [5,14]. Due to its distinctive characteristics and limited habitat, this species is endemic to the Turpan Basin, occurring exclusively in oasis regions such as Dacaohu and Grape Valley [5]. In 2022, it was designated as a Class II Protected Animal in the Key Protected Wildlife Inventory of the Xinjiang Uygur Autonomous Region. The species was first described by the Soviet scholar Berg in 1907 and later documented by Li Sizhong et al. in 1966 [14]. No specimens were collected between 1967 and 2012 [5] until Xie Peng successfully gathered samples in 2019 [15].
Figure 1.
P. grumi Berg.
The study of fish age and growth is fundamental to the fields of fish biology and ecology [16]. Accurate determination of fish age is a critical prerequisite for evaluating population dynamics and population structure [17,18]. Age data provide the basis for estimating key demographic parameters, including growth rate, mortality, and recruitment. Growth performance is crucial for fish survival and serves as a significant indicator for evaluating the abundance of aquatic resources [19]. Furthermore, age and growth information can assist fishery managers in evaluating the effectiveness of catch quotas and other fishery management strategies [20].
Ongoing research has resulted in the development of an increasing number of direct and indirect methods for estimating fish age and growth. However, identifying the most appropriate method remains challenging, as different techniques may yield inconsistent results when applied to the same population [21]. Among these methods, otoliths are generally considered the most reliable structures for age determination because they are widely believed to preserve the complete growth history of an individual [22,23]. Compared with scales and vertebrae, otoliths are metabolically inert and are less susceptible to resorption, regeneration, or environmental influences, thereby providing more stable and accurate annuli for age determination [23,24]. In small-bodied cyprinid fishes such as P. grumi Berg, scales often exhibit indistinct annuli due to slow growth and crowding of circuli in older individuals, while vertebral annuli may be difficult to interpret consistently. By contrast, otoliths generally provide clearer and more reliable growth increments, improving the precision and consistency of age estimation [25,26]. Currently, the von Bertalanffy growth model [27] is the most commonly utilized framework [28,29]. This model, grounded in bioenergetics, seeks to describe how catabolism and anabolism influence growth throughout a fish’s life cycle from a biological perspective [27,30]. Analyzing the age structure and growth rates of fish can unveil critical characteristics, such as life history and population structure, which are essential for assessing population health and maintaining ecosystem stability and biodiversity [31,32,33]. Investigating the age and growth of fish enhances the understanding of their resource status and establishes a foundation for conducting fishery resource assessments [34].
This study conducted sampling surveys of the P. grumi Berg population in the Turpan Basin from 2024 to 2025. Age was determined through otolith annuli analysis, and body lengths at age were back-calculated from otolith radius measurements. The von Bertalanffy growth parameters were then estimated using back-calculated length-at-age data to characterize the growth pattern of the species. The objective of this research was to comprehensively investigate the individual biological traits of this species, thereby addressing the existing knowledge gap and elucidating its age and growth patterns.
2. Materials and Methods
2.1. Sampling
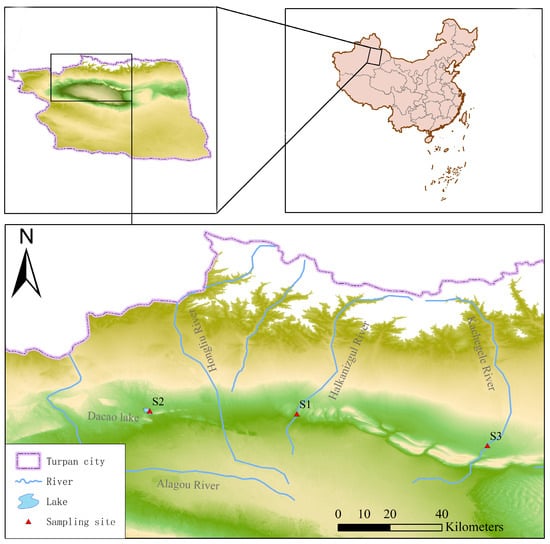
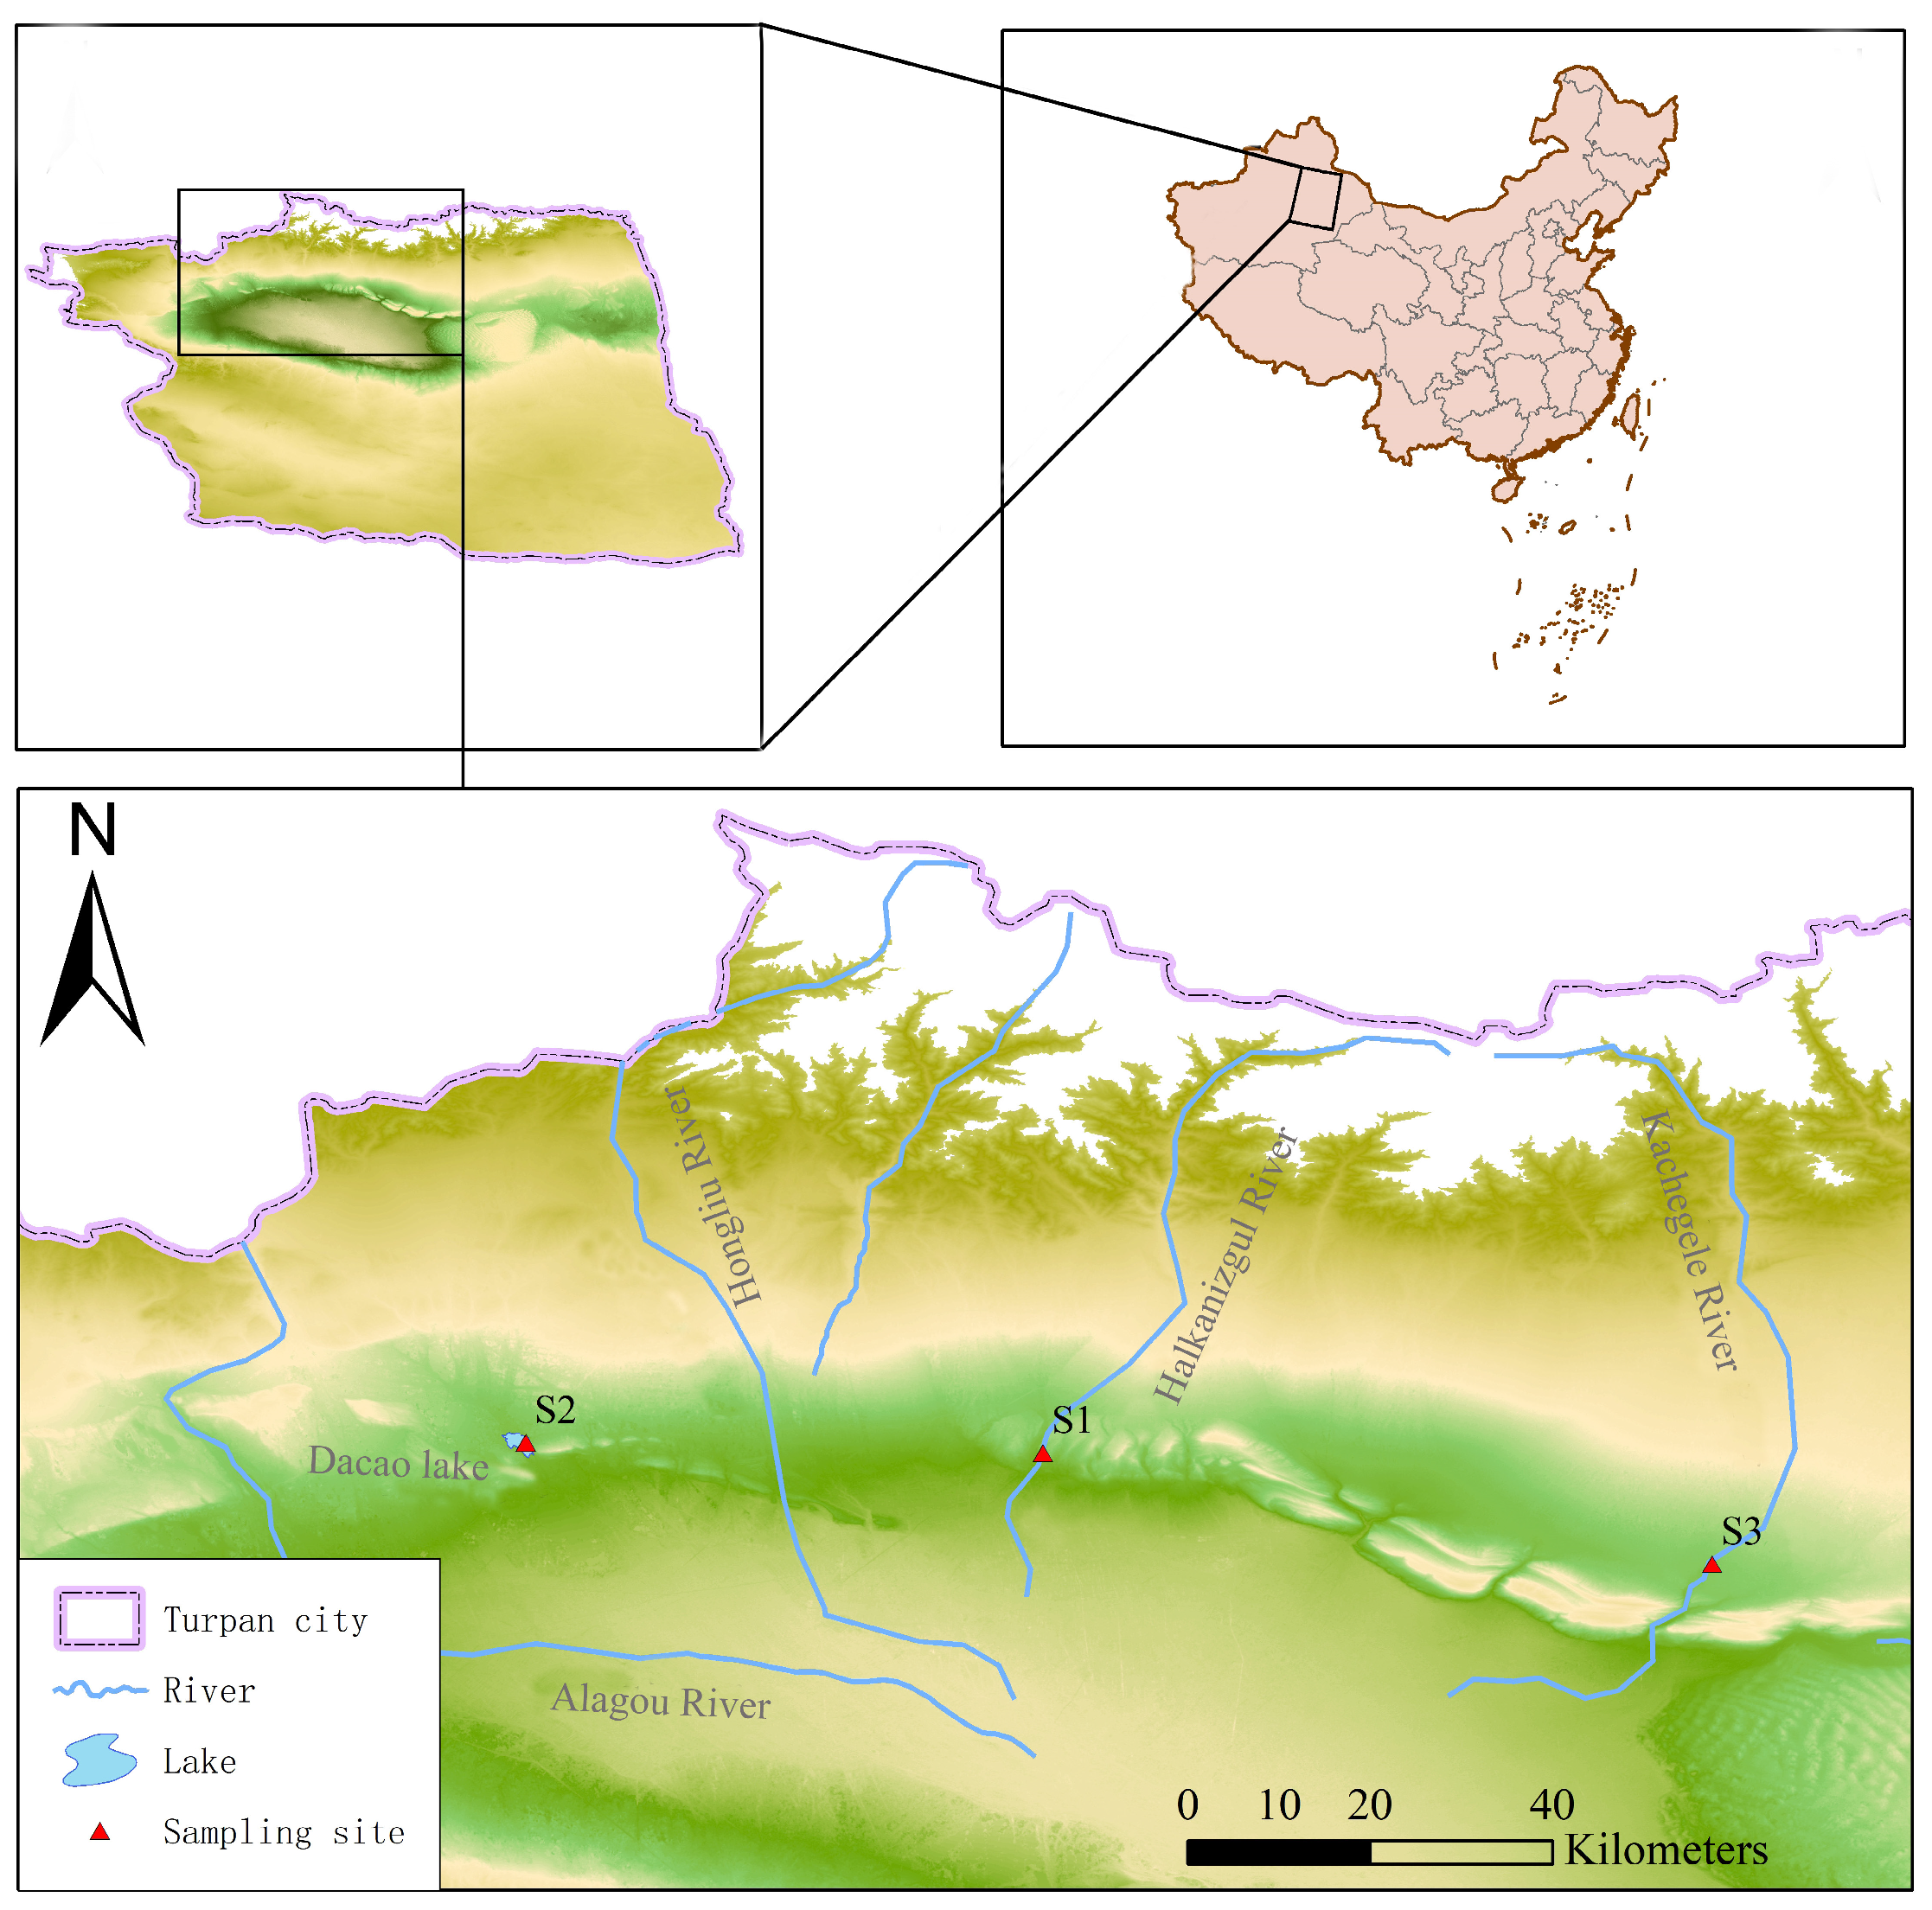
Sampling occurred in November 2024 and March 2025. To ensure comparability among sites and seasons, all surveys were performed at the same sampling sites using identical fishing gear and standardized sampling duration throughout the study period. A variety of fishing gear, including drift gillnets (mesh size: 2 cm), customized gillnets (mesh size: 2 cm), and minnow traps (mesh size: 2 cm), facilitated the collection of 527 specimens of P. grumi Berg from sites within the Turpan Basin. These sites included Grape Valley (89.2501° E, 43.0134° N), Dacaohu (88.7424° E, 43.0116° N), and Lianmuqin Bazaar Village (89.9123° E, 42.8901° N), as illustrated in Figure 2.
Figure 2.
The sampling areas for P. grumi Berg in Turpan were S1 (Grape Valley), S2 (Dacaohu), and S3 (Lianmuqin Bazaar Village).
The total body length (L, mm) and body weight (W, g) of all specimens were measured on-site. Length measurements were taken with an accuracy of 1.0 mm, while weight measurements were recorded with an accuracy of 0.1 g. Specimens were fixed and preserved in a 10% formaldehyde solution and subsequently transported to the laboratory for immediate processing. In this species, gonadal development is not entirely synchronized among individuals of similar size, and some individuals remain at immature or resting stages despite having comparable body lengths. During these stages, gonadal characteristics are often poorly differentiated, which hinders reliable sex determination. In addition, because part of the sampling was conducted near the breeding season, post-spawning gonadal regression further reduced the distinguishability of sexual characteristics in some individuals. Therefore, specimens with insufficiently developed or ambiguous gonadal characteristics were conservatively classified as “undetermined sex”. Microotoliths served as the materials for age determination. Of the 527 collected specimens, otoliths were successfully extracted from 116 individuals for further analysis.
2.2. Otoliths
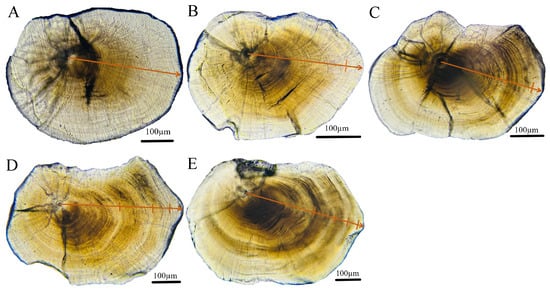
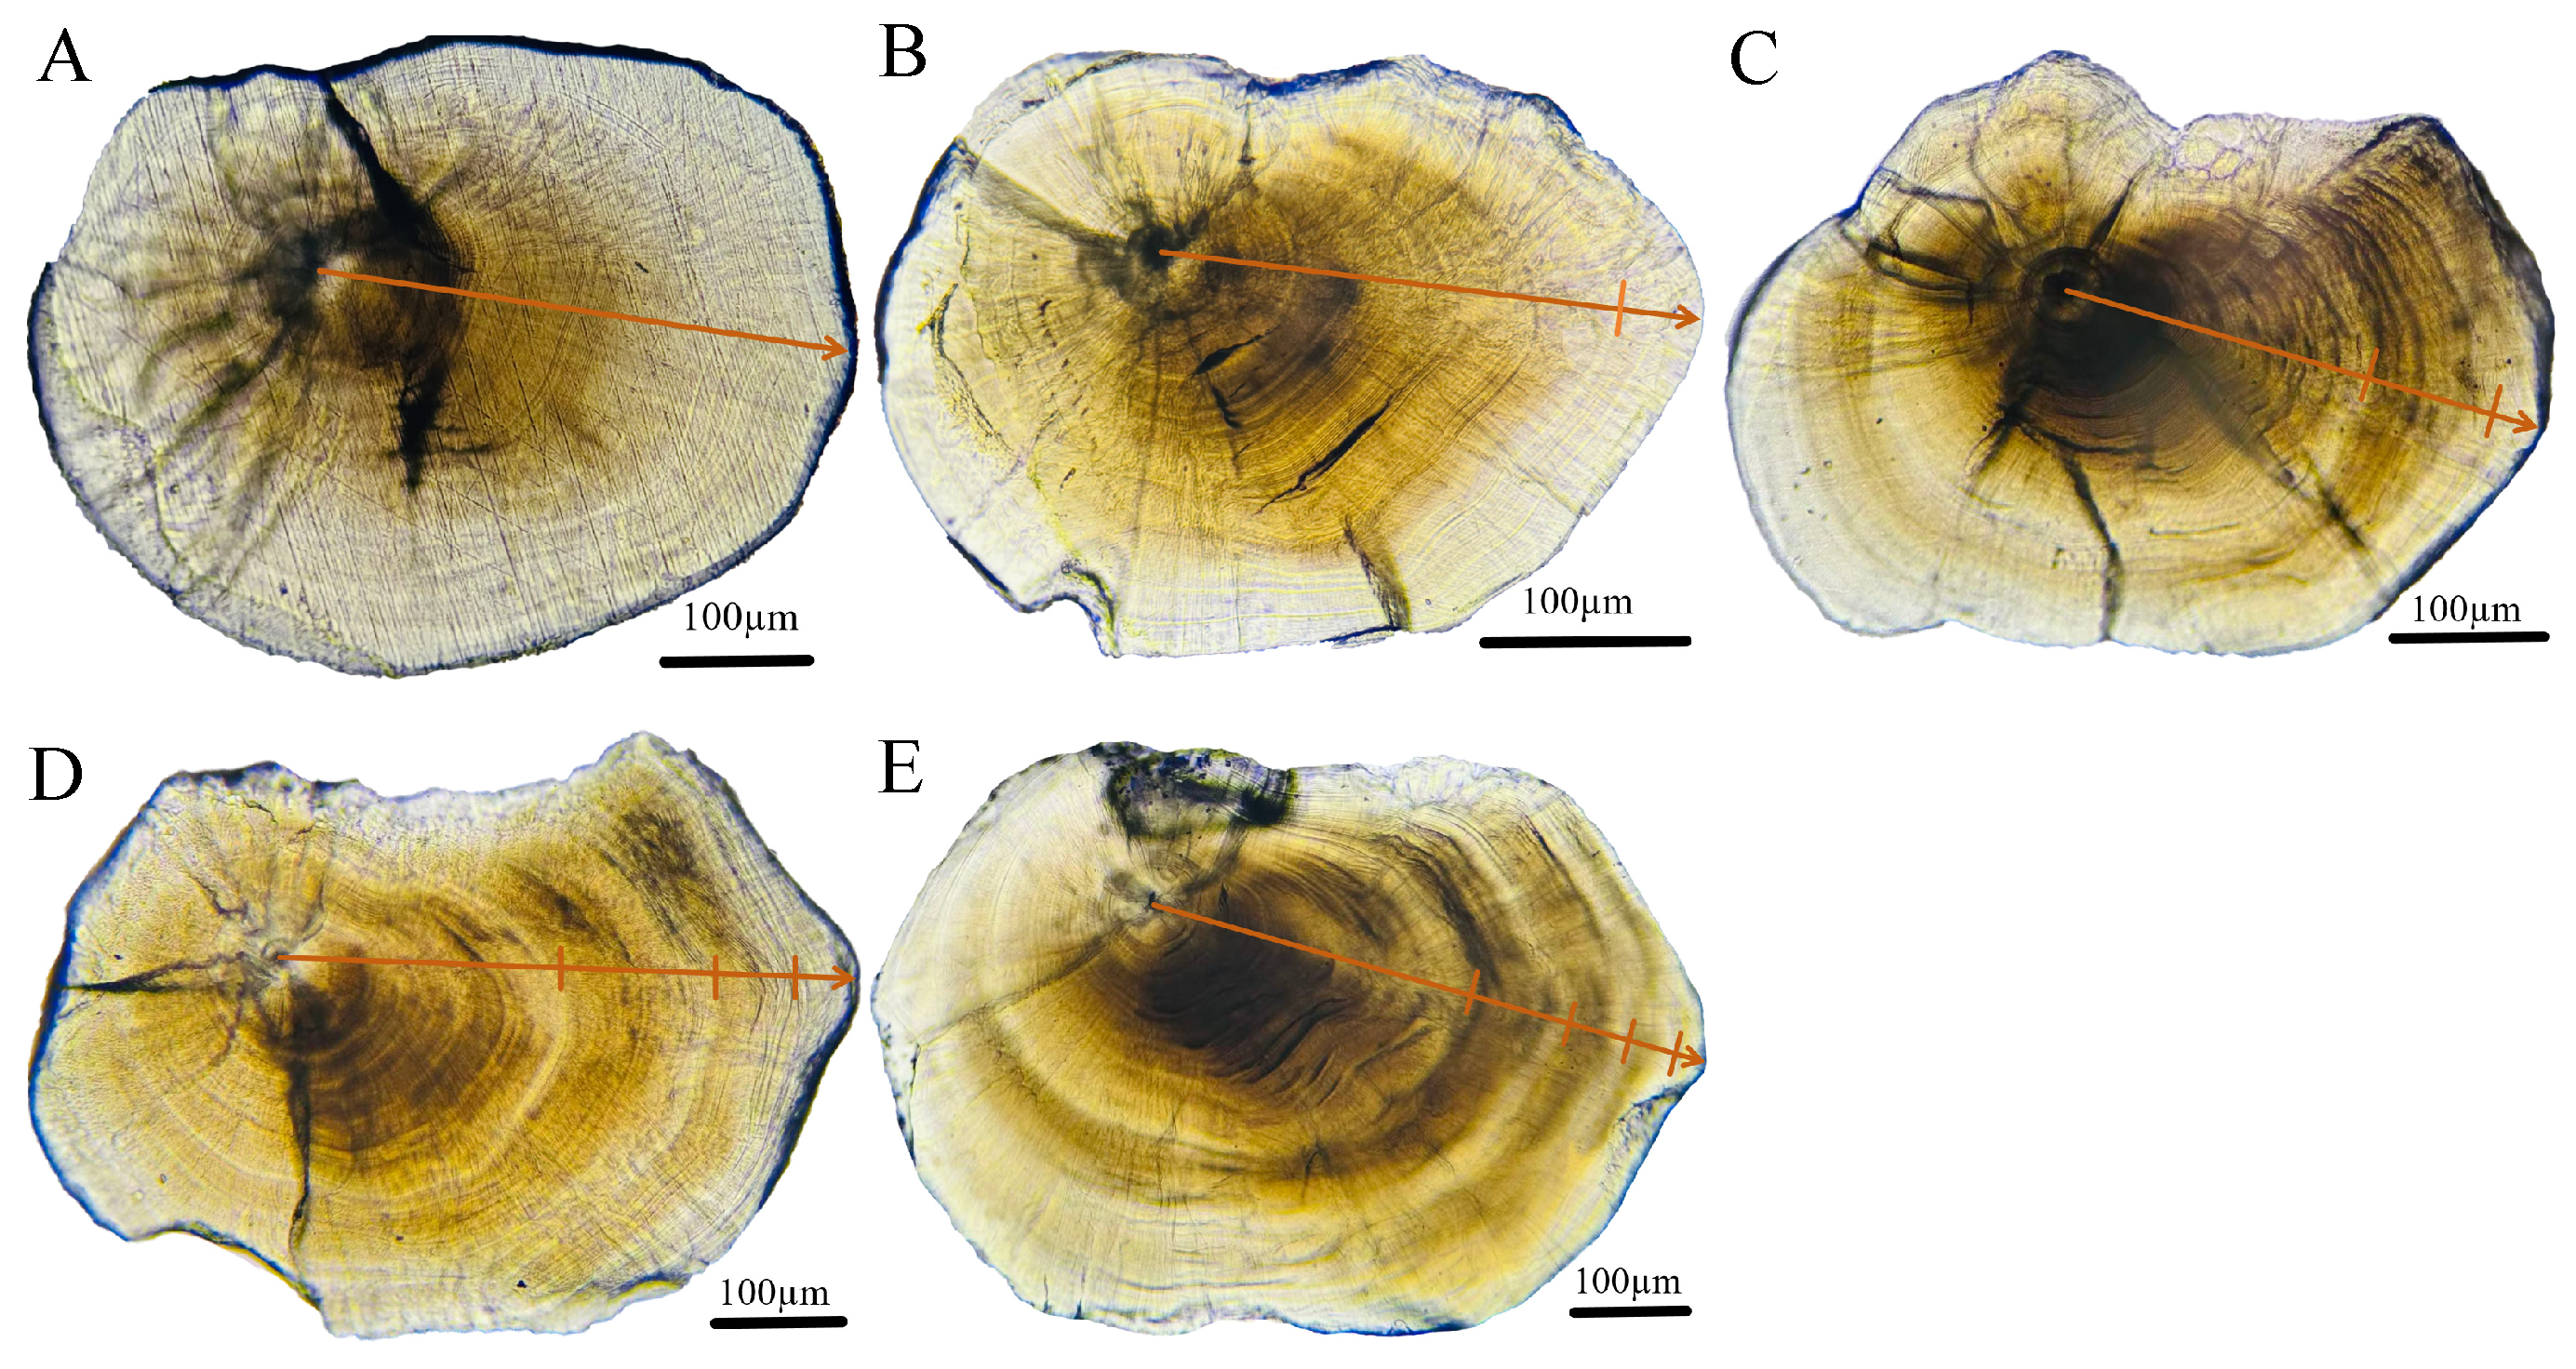
The micro-otoliths were embedded in GTS polyester resin (manufactured by Woss Chemical Company, Morbi, India, styrene content 35–40%) mixed with MEKP hardener, mounted on glass slides with their convex side facing upward. After drying for 12 h, the otoliths were ground using waterproof abrasive papers with grit sizes ranging from 1500 to 3000 (Kafuwell (Hangzhou) Industrial Co., Ltd., Hangzhou, China). This grinding process necessitated frequent observation and adjustment under a microscope until the otolith core was reached [35,36]. Once the growth center became distinctly visible, images were captured using a digital camera (MicroPublisher 5.0 Real-Time Viewing, Qimaging, Surrey, BC, Canada) attached to an Olympus BX53 microscope (Olympus, Tokyo, Japan), and the otolith radius was measured, with the measurement direction indicated in Figure 3. Ages were determined by examining the transition between translucent and opaque zones, which are assumed to be deposited annually. These annuli were designated as 0+, 1+, 2+, and so forth. For age-group analysis, these designations (0+, 1+, 2+, …) were statistically treated as ages 1, 2, 3, and so on, respectively. In addition, samples with damaged or severely blurred otoliths were classified as unsuccessful age readings. Age-reading precision was evaluated using the Coefficient of Variation (CV) method recommended by Campana (2001) [24]. Two readers independently performed blind readings based on unified criteria. Individual and mean CV values were then calculated from the paired readings.
Figure 3.
Measurement orientation of otoliths in P. grumi Berg, where images (A, B, C, D and E) correspond to otoliths of age groups 0+, 1+, 2+, 3+ and 4+, respectively. The arrows indicate the longitudinal axis of the otolith, and the lines mark the boundary between the light and dark bands.
2.3. Relationship Between Radius of Auricle and Body Length
The relationship between body length (L, mm) and otolith radius (OR, μm) was evaluated using five models: linear, power, exponential, logarithmic, and quadratic. The optimal regression equation was determined by identifying the model with the highest coefficient of determination (R2). To assess differences in otolith morphometric characteristics between females and males, analysis of covariance (ANCOVA) was conducted with body length as the covariate [37]. The modified Lee equation was utilized to back-calculate body length at specific ages [38]. The reliability of the back-calculated length-at-age estimates was assessed by comparing observed and back-calculated length-at-age values. Differences between the two datasets were analyzed using paired-samples t-tests, with statistical significance defined as p < 0.05. This equation is expressed as follows:
L represents the measured body length (mm), OR denotes the otolith radius (μm), Li indicates the back-calculated body length at age i (mm), ORi refers to the radius corresponding to annulus i (μm), and α and β are the intercept and slope of the body length–otolith radius regression equation, respectively.
2.4. Relationship Between Length and Weight
Common growth equations were employed to examine the growth characteristics. A two-sample Kolmogorov–Smirnov test was performed to determine whether the body length and body weight distributions differed between female and male individuals [39,40]. Parameters a and b were estimated by fitting the log-transformed data through the least-squares method.
The power–law relationship between body length and weight is described by the following equation:
The parameters a and b were derived by fitting the log-transformed data using the least-squares method. An analysis of covariance (ANCOVA) was conducted to assess differences in the estimated slopes between female and male samples [37] (p < 0.05). Additionally, a t-test [41] was performed to evaluate whether the allometric coefficient b significantly deviated from the theoretical isometric value of b = 3. A significant difference indicated allometric growth, while a lack of difference suggested isometric growth.
The t-test formula is as follows:
Here, SD(L) and SD(W) represent the standard deviations of the logarithm of body length and body weight, respectively; n is the sample size, and R2 is the coefficient of determination.
2.5. Growth Equation
The growth parameters were estimated using back-calculated body lengths at age derived from otolith annuli measurements. The Ford–Walford transformation was applied as a linearization procedure to obtain the initial estimates of the von Bertalanffy growth parameters based on age–length data. The von Bertalanffy growth model was subsequently fitted using linear least-squares regression. Its equation is:
To further predict growth trends, the first and second derivatives of the growth equation were calculated, resulting in the growth rate equation, the growth acceleration equation, and the equation for the inflection point of growth [41,42]. The growth rate equation is:
The growth acceleration equation is:
The inflection point age of growth was estimated based on the body weight growth equation derived from the von Bertalanffy growth model. The inflection point corresponds to the age at which the growth rate of body weight reaches its maximum. It was calculated according to the following equation:
In the equation, Lt represents the body length of an individual at age t, while Wt denotes the body weight of the individual at the same age. L∞ indicates the asymptotic length, and W∞ signifies the asymptotic weight. The parameter t0 refers to the theoretical age at which both length and weight are zero, representing a hypothetical age. The curvature parameter of the growth curve is denoted by k, and b represents the exponent of the length–weight relationship. The term dL/dt indicates the growth rate in body length, whereas dW/dt reflects the growth rate in body weight. Additionally, d2L/dt2 represents the acceleration in body length growth, and d2W/dt2 denotes the acceleration in body weight growth.
The growth performance index was calculated using the formula [43]:
3. Results
3.1. Frequency Distributions of Length and Weight
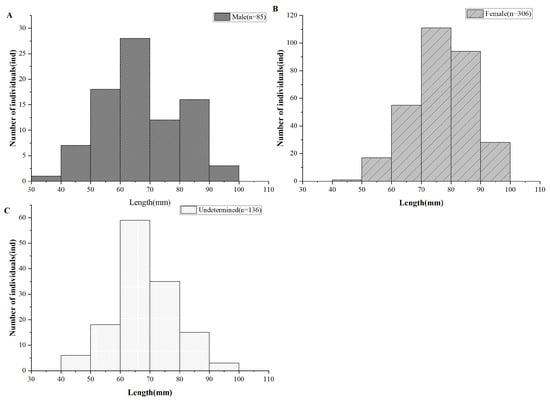
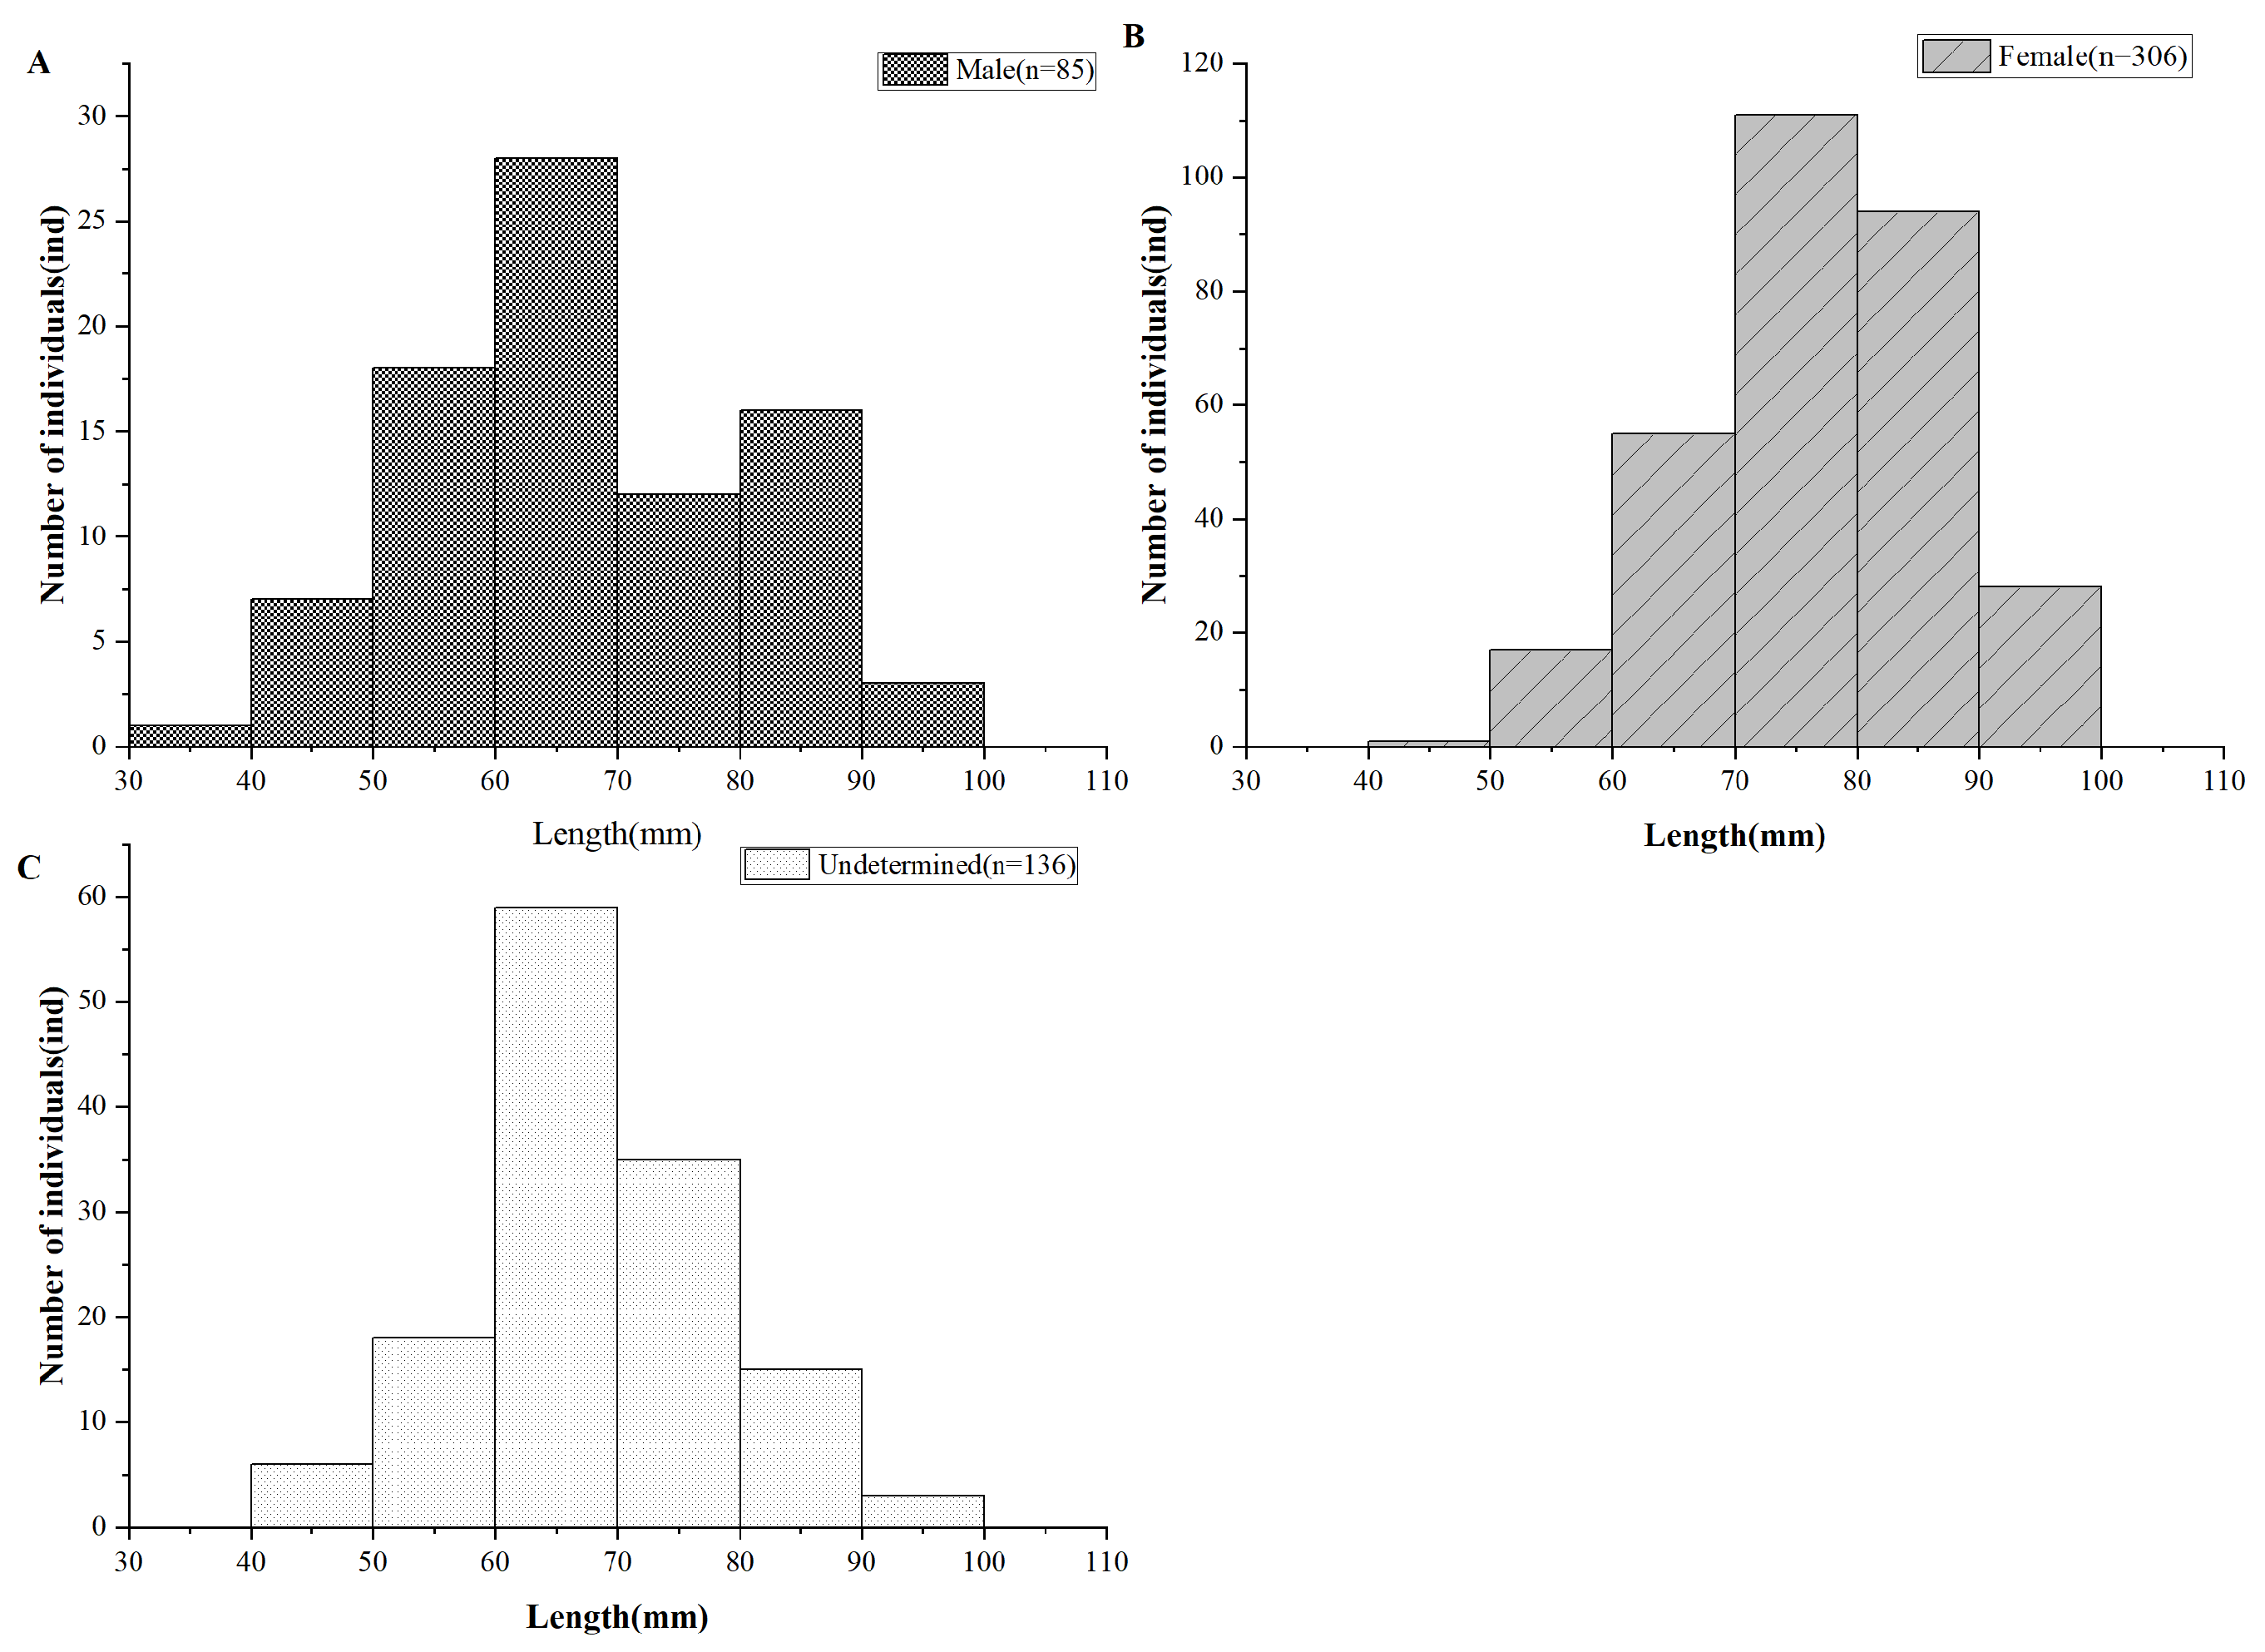
Among the 527 specimens of P. grumi Berg collected, 85 were male, 306 were female, and 136 were of undetermined sex, yielding a sex ratio of 3.6:1 (♀:♂). The frequency distribution of body length (L) is illustrated in Figure 4. The total length of the specimens ranged from 39.0 to 96.0 mm, with a mean length of 71.7 ± 11.4 mm. The predominant length class was 60.0–90.0 mm, which comprised 90.70% of the total samples. Males exhibited a length range of 39.0–95.0 mm, while females ranged from 48.0 to 96.0 mm. A significant difference in body length was detected between females and males (two-sample Kolmogorov–Smirnov test, D = 0.397, p < 0.001).
Figure 4.
Distributions of the frequencies of L of P. grumi Berg, where (A) represents male population, (B) represents the female population, and (C) represents an undetermined gender group.
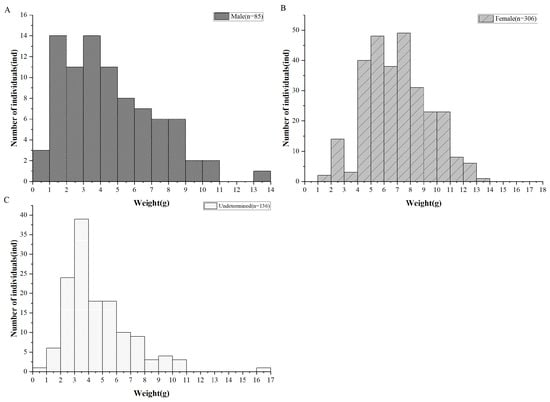
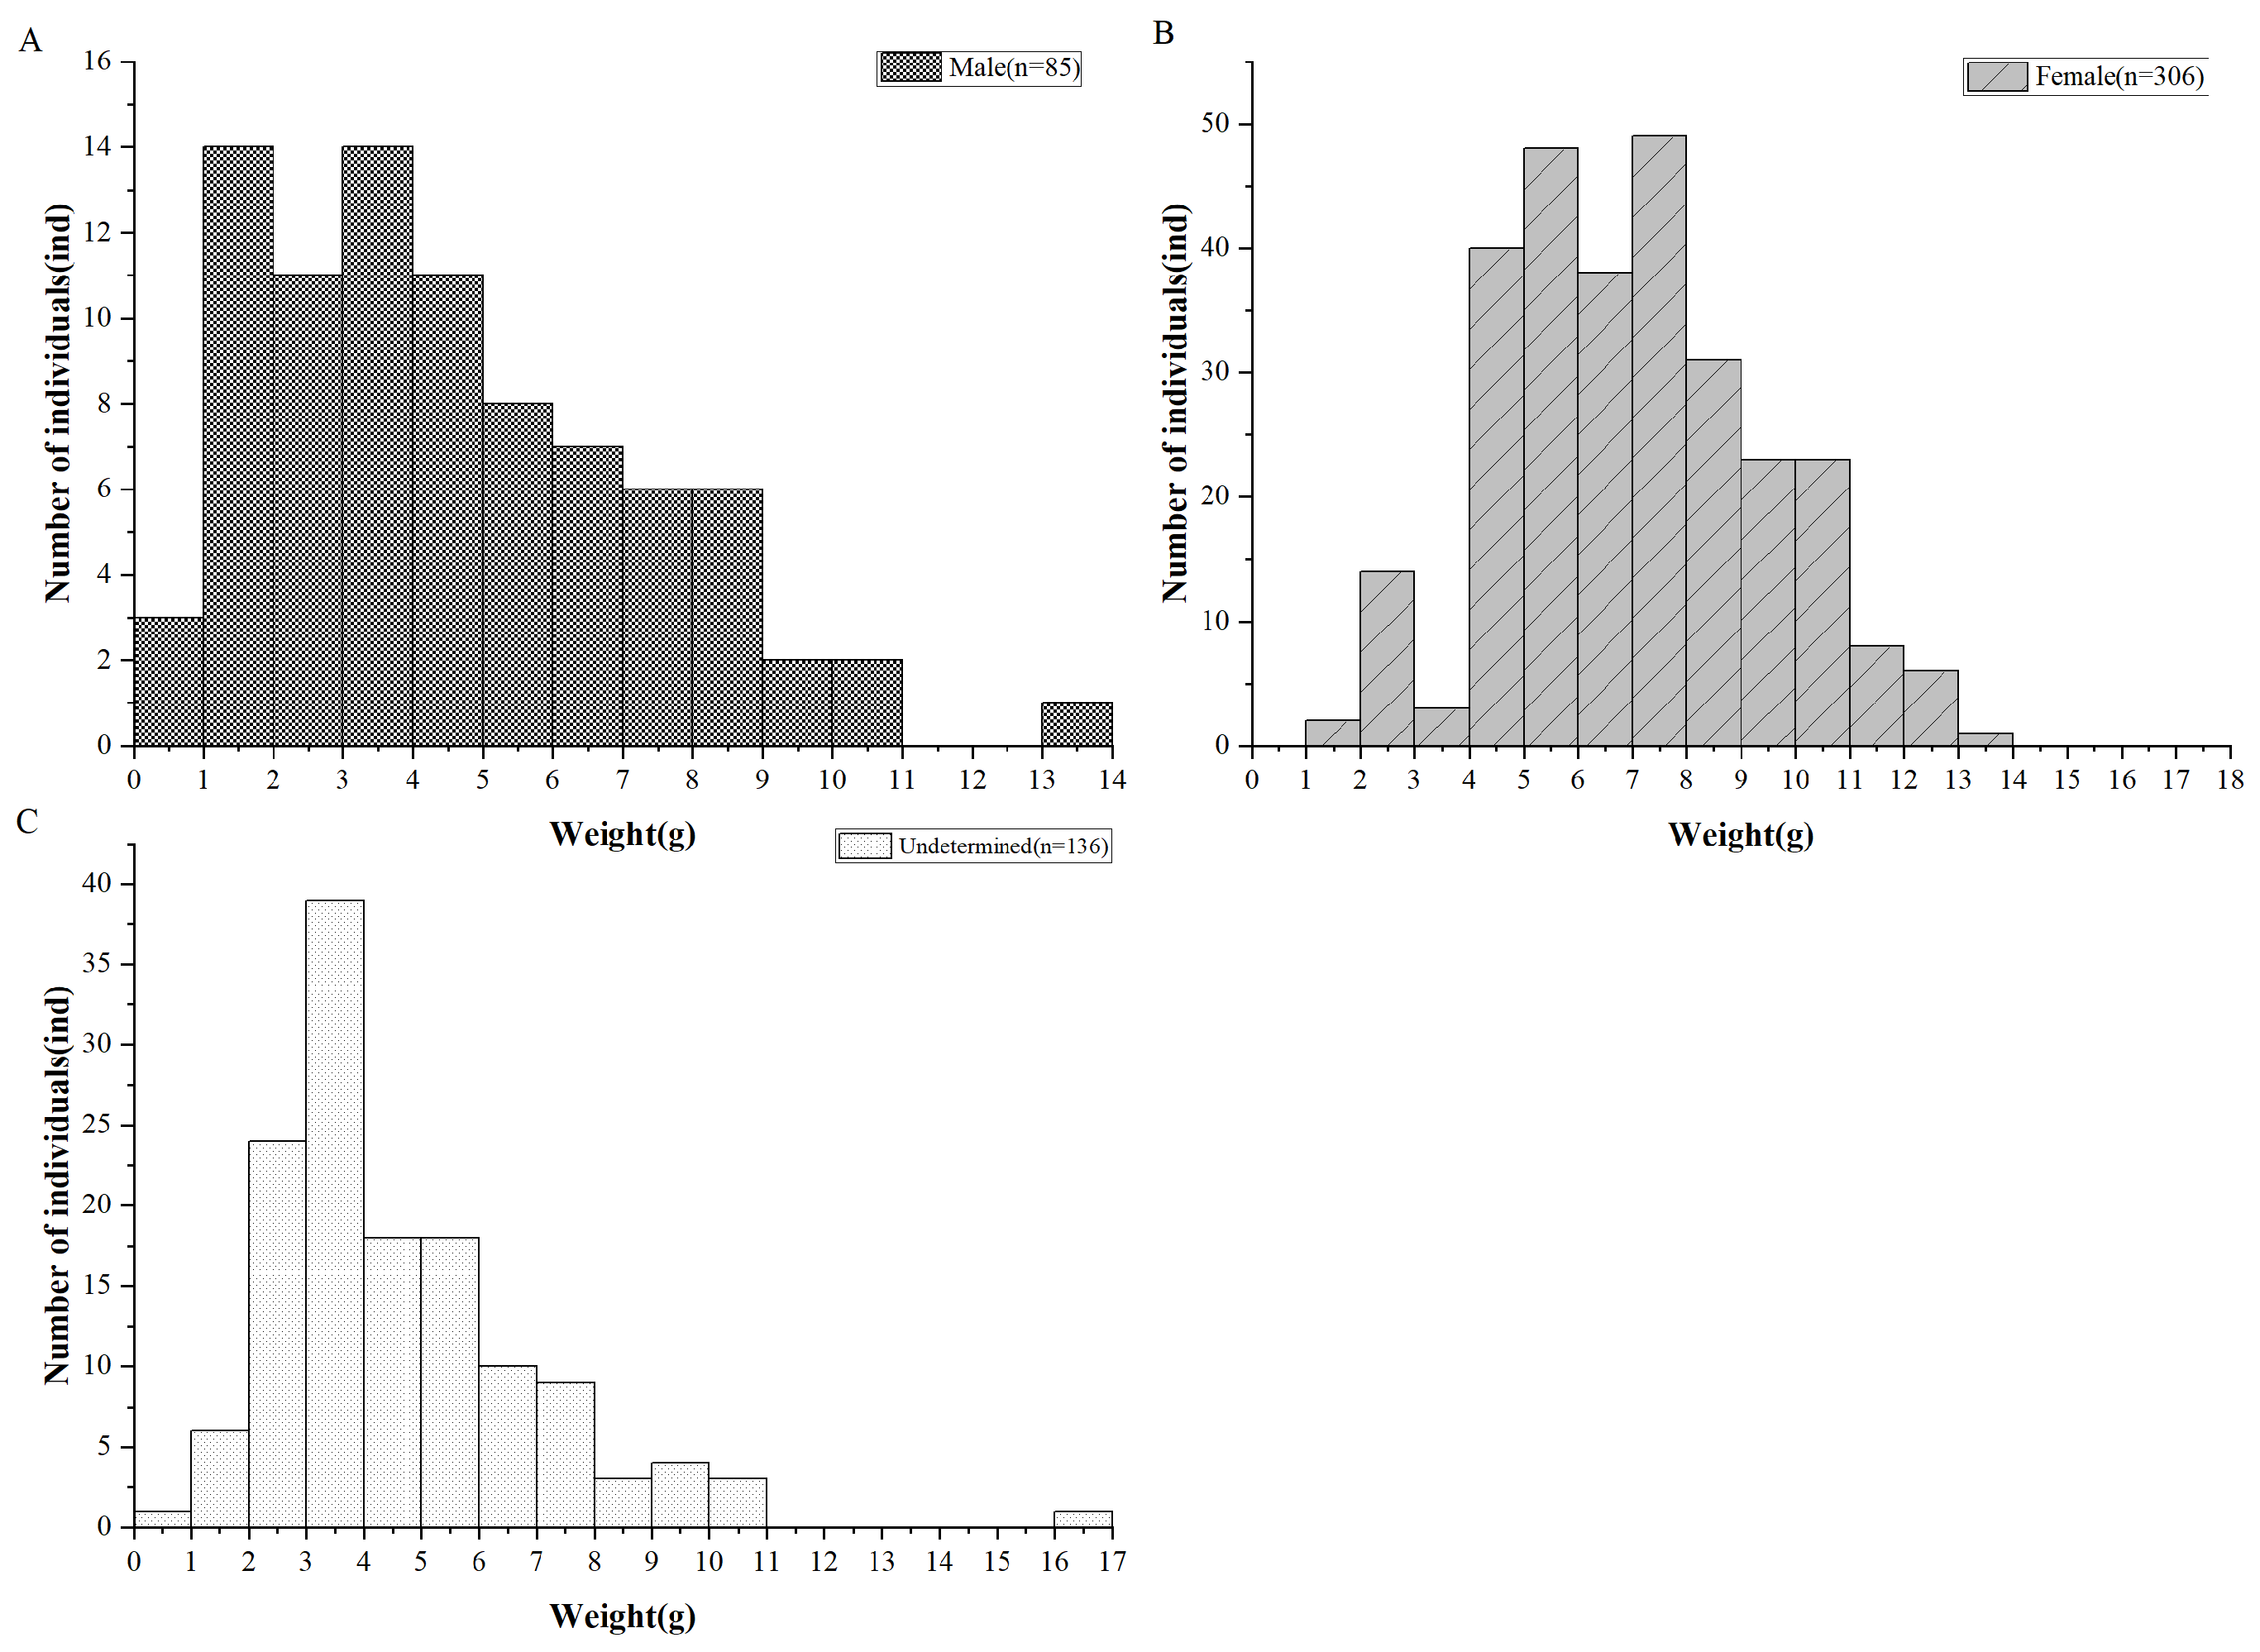
The frequency distribution of body weight (W) is illustrated in Figure 5. Sample weights varied from 0.69 to 16.00 g, with a mean weight of 5.81 ± 2.69 g. The predominant weight class was 2.00–9.00 g, which constituted 77.23% of the total samples. The weight range for females was 1.87–13.60 g, while for males it was 0.69–13.80 g. A significant difference in body weight between females and males was identified (two-sample Kolmogorov–Smirnov test, D = 0.388, p < 0.001).
Figure 5.
Distributions of the frequencies of W of P. grumi Berg, where (A) represents male population, (B) represents the female population, and (C) represents an undetermined gender group.
3.2. Frequency Distributions of Age
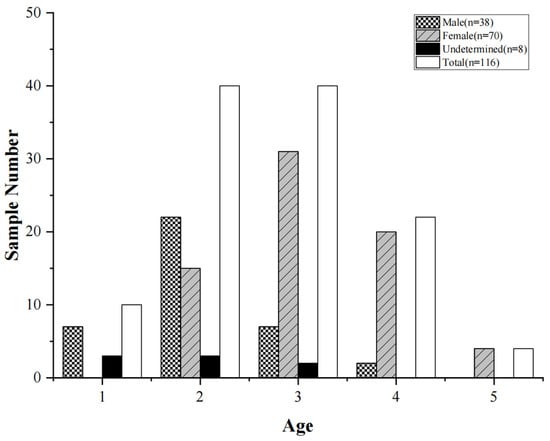
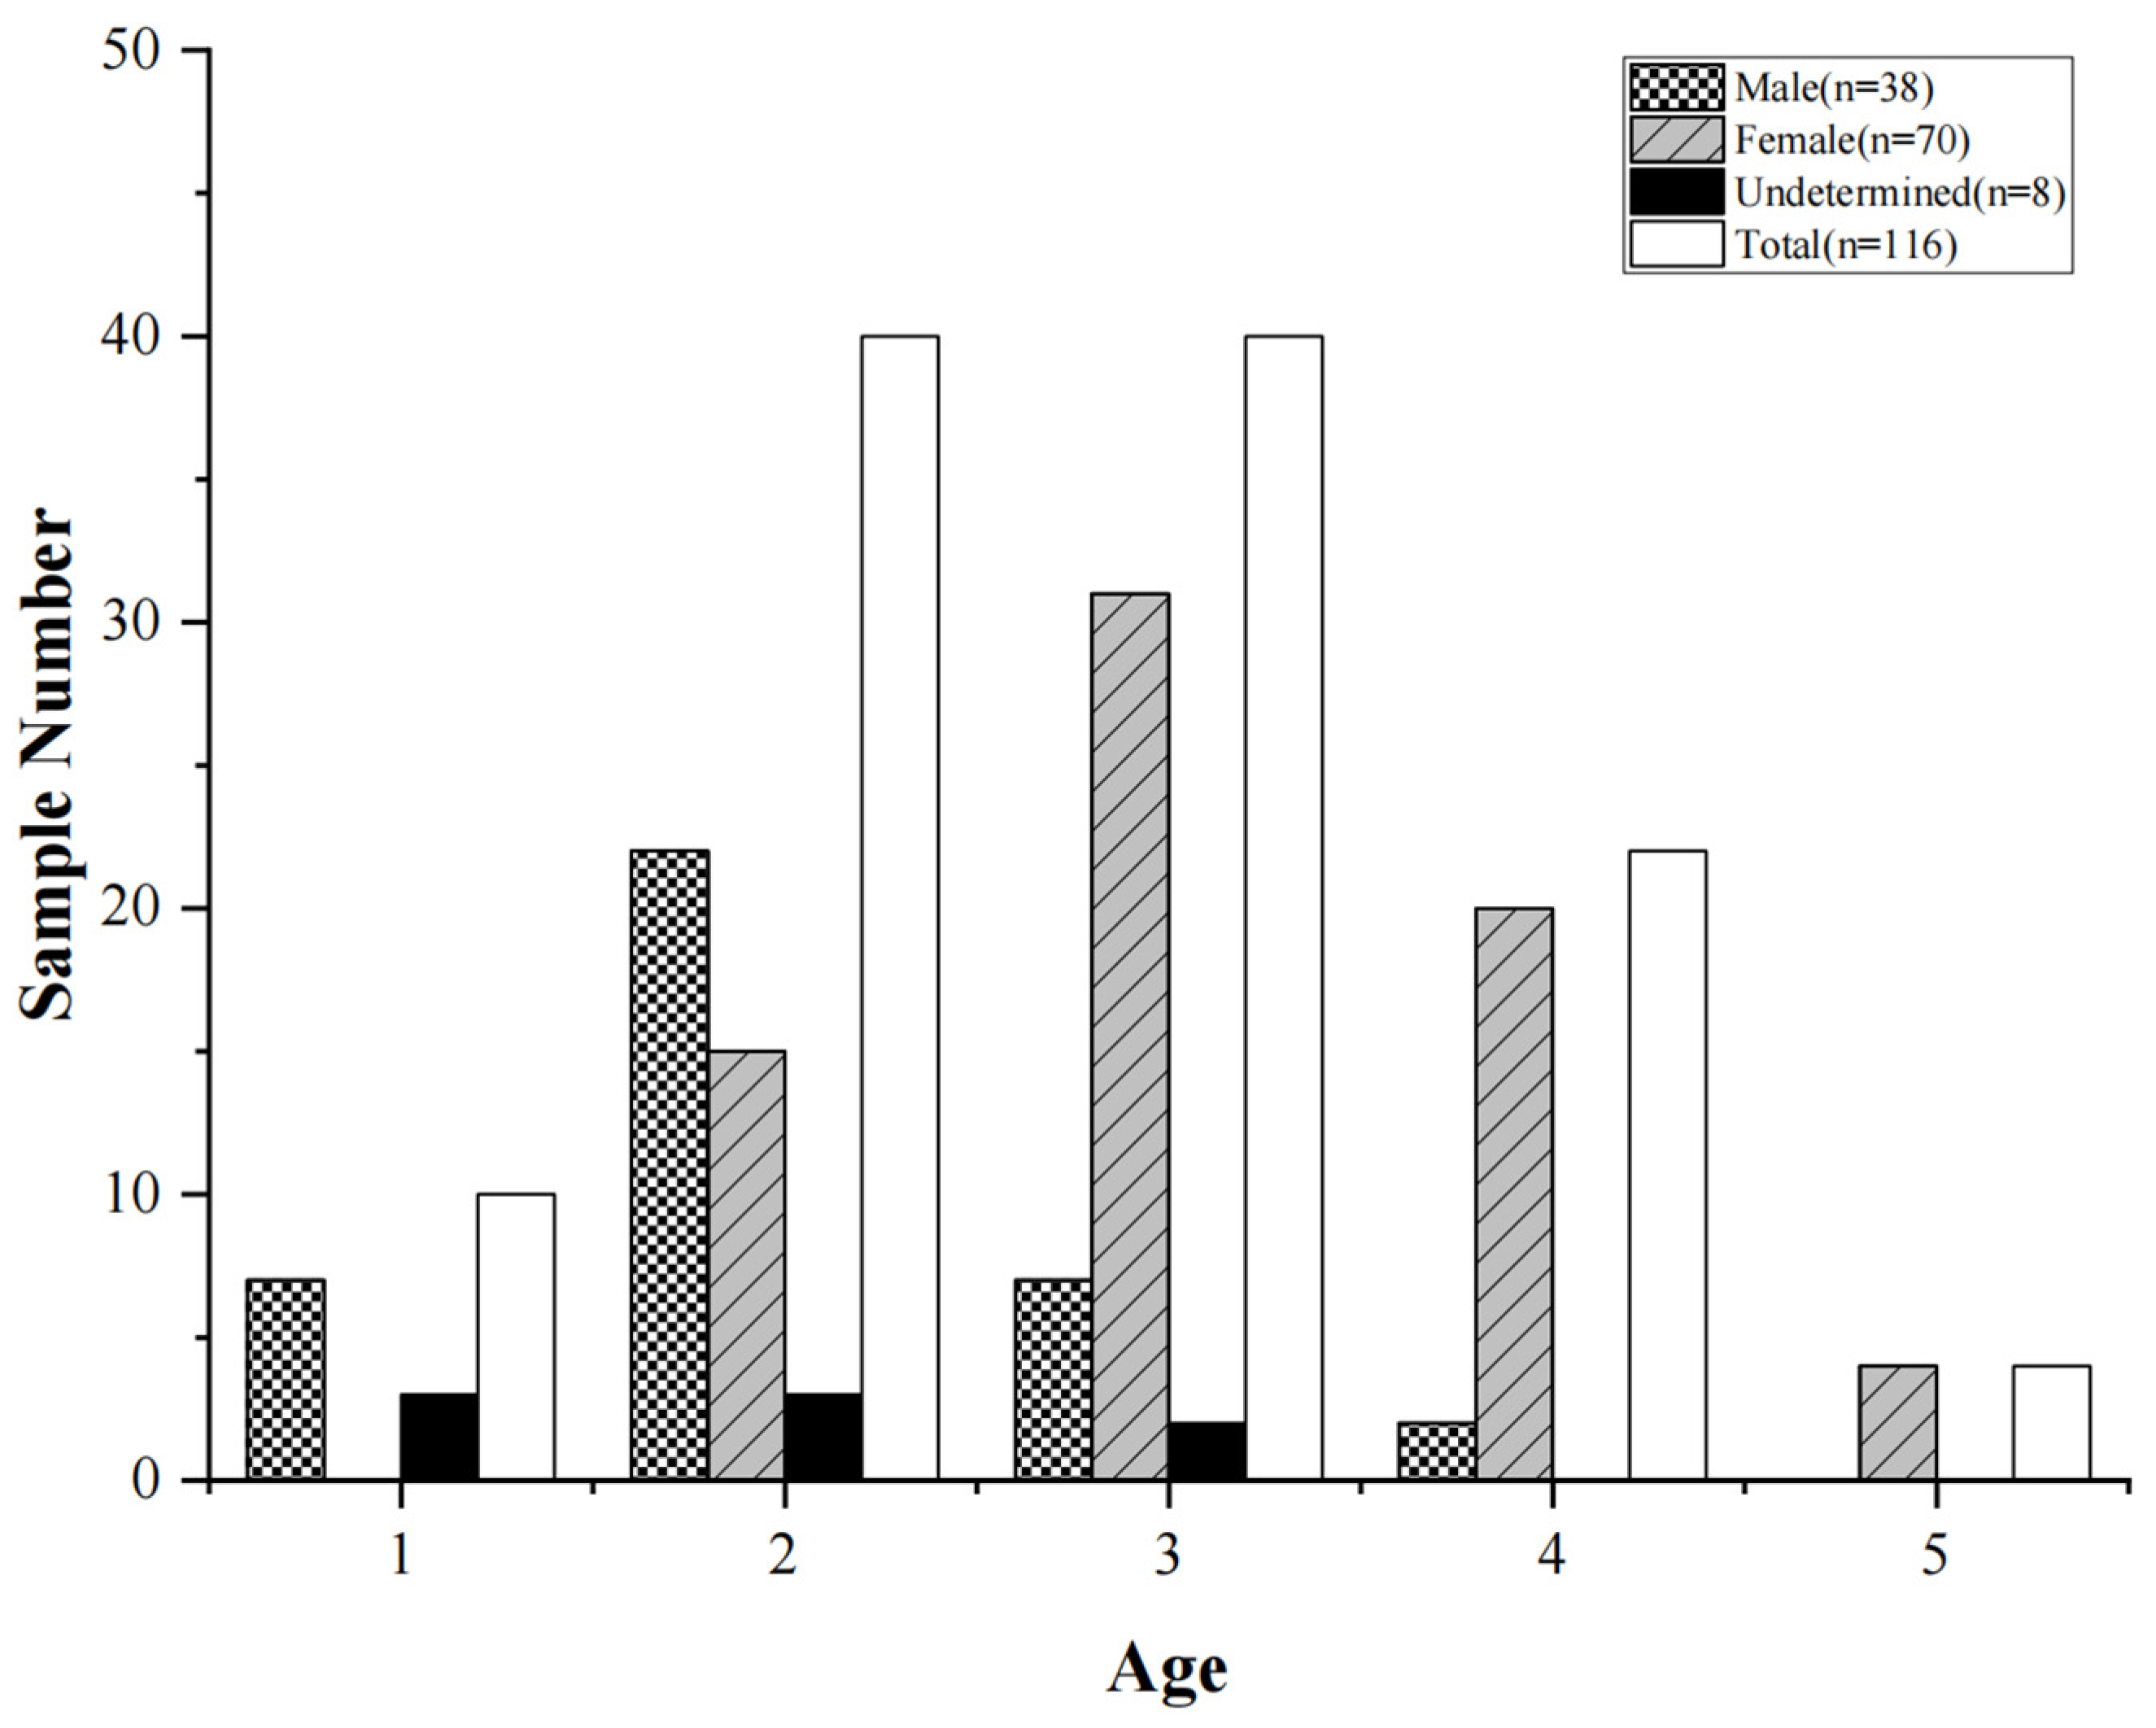
Age was determined via otolith examination for 137 of the 527 collected specimens. Among these, age was successfully undetermined for 116 individuals, while the determination was unsuccessful for the remaining 21 individuals (11 females and 10 males). The average coefficient of variation (CV) between the two readers was 5.4%, indicating high precision and consistency in age determination. The age composition of the P. grumi Berg population is illustrated in Figure 6. The youngest captured individual was 1 year old, and the oldest was 5 years old, with the predominant age class being 2–3 years. For males, the dominant age class was 1–3 years, whereas for females, it was 2–4 years. The mean age was 2.11 years for males and 3.19 years for females.
Figure 6.
Distributions of the frequencies of Age of P. grumi Berg, where  represents male population,
 represents the female population,
 represents an undetermined gender group, and
 represents the whole group.
represents male population, represents the female population, represents an undetermined gender group, and represents the whole group.
3.3. Length–Weight Relationship
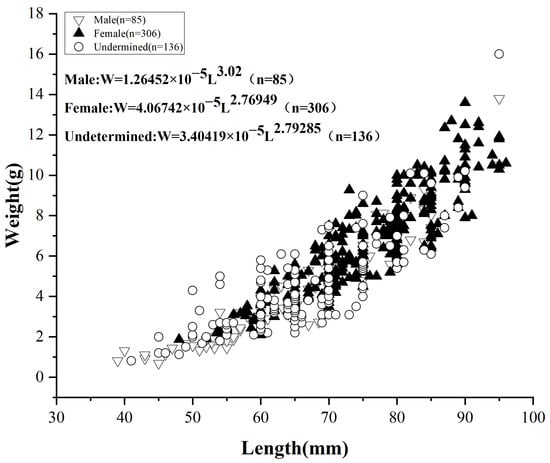
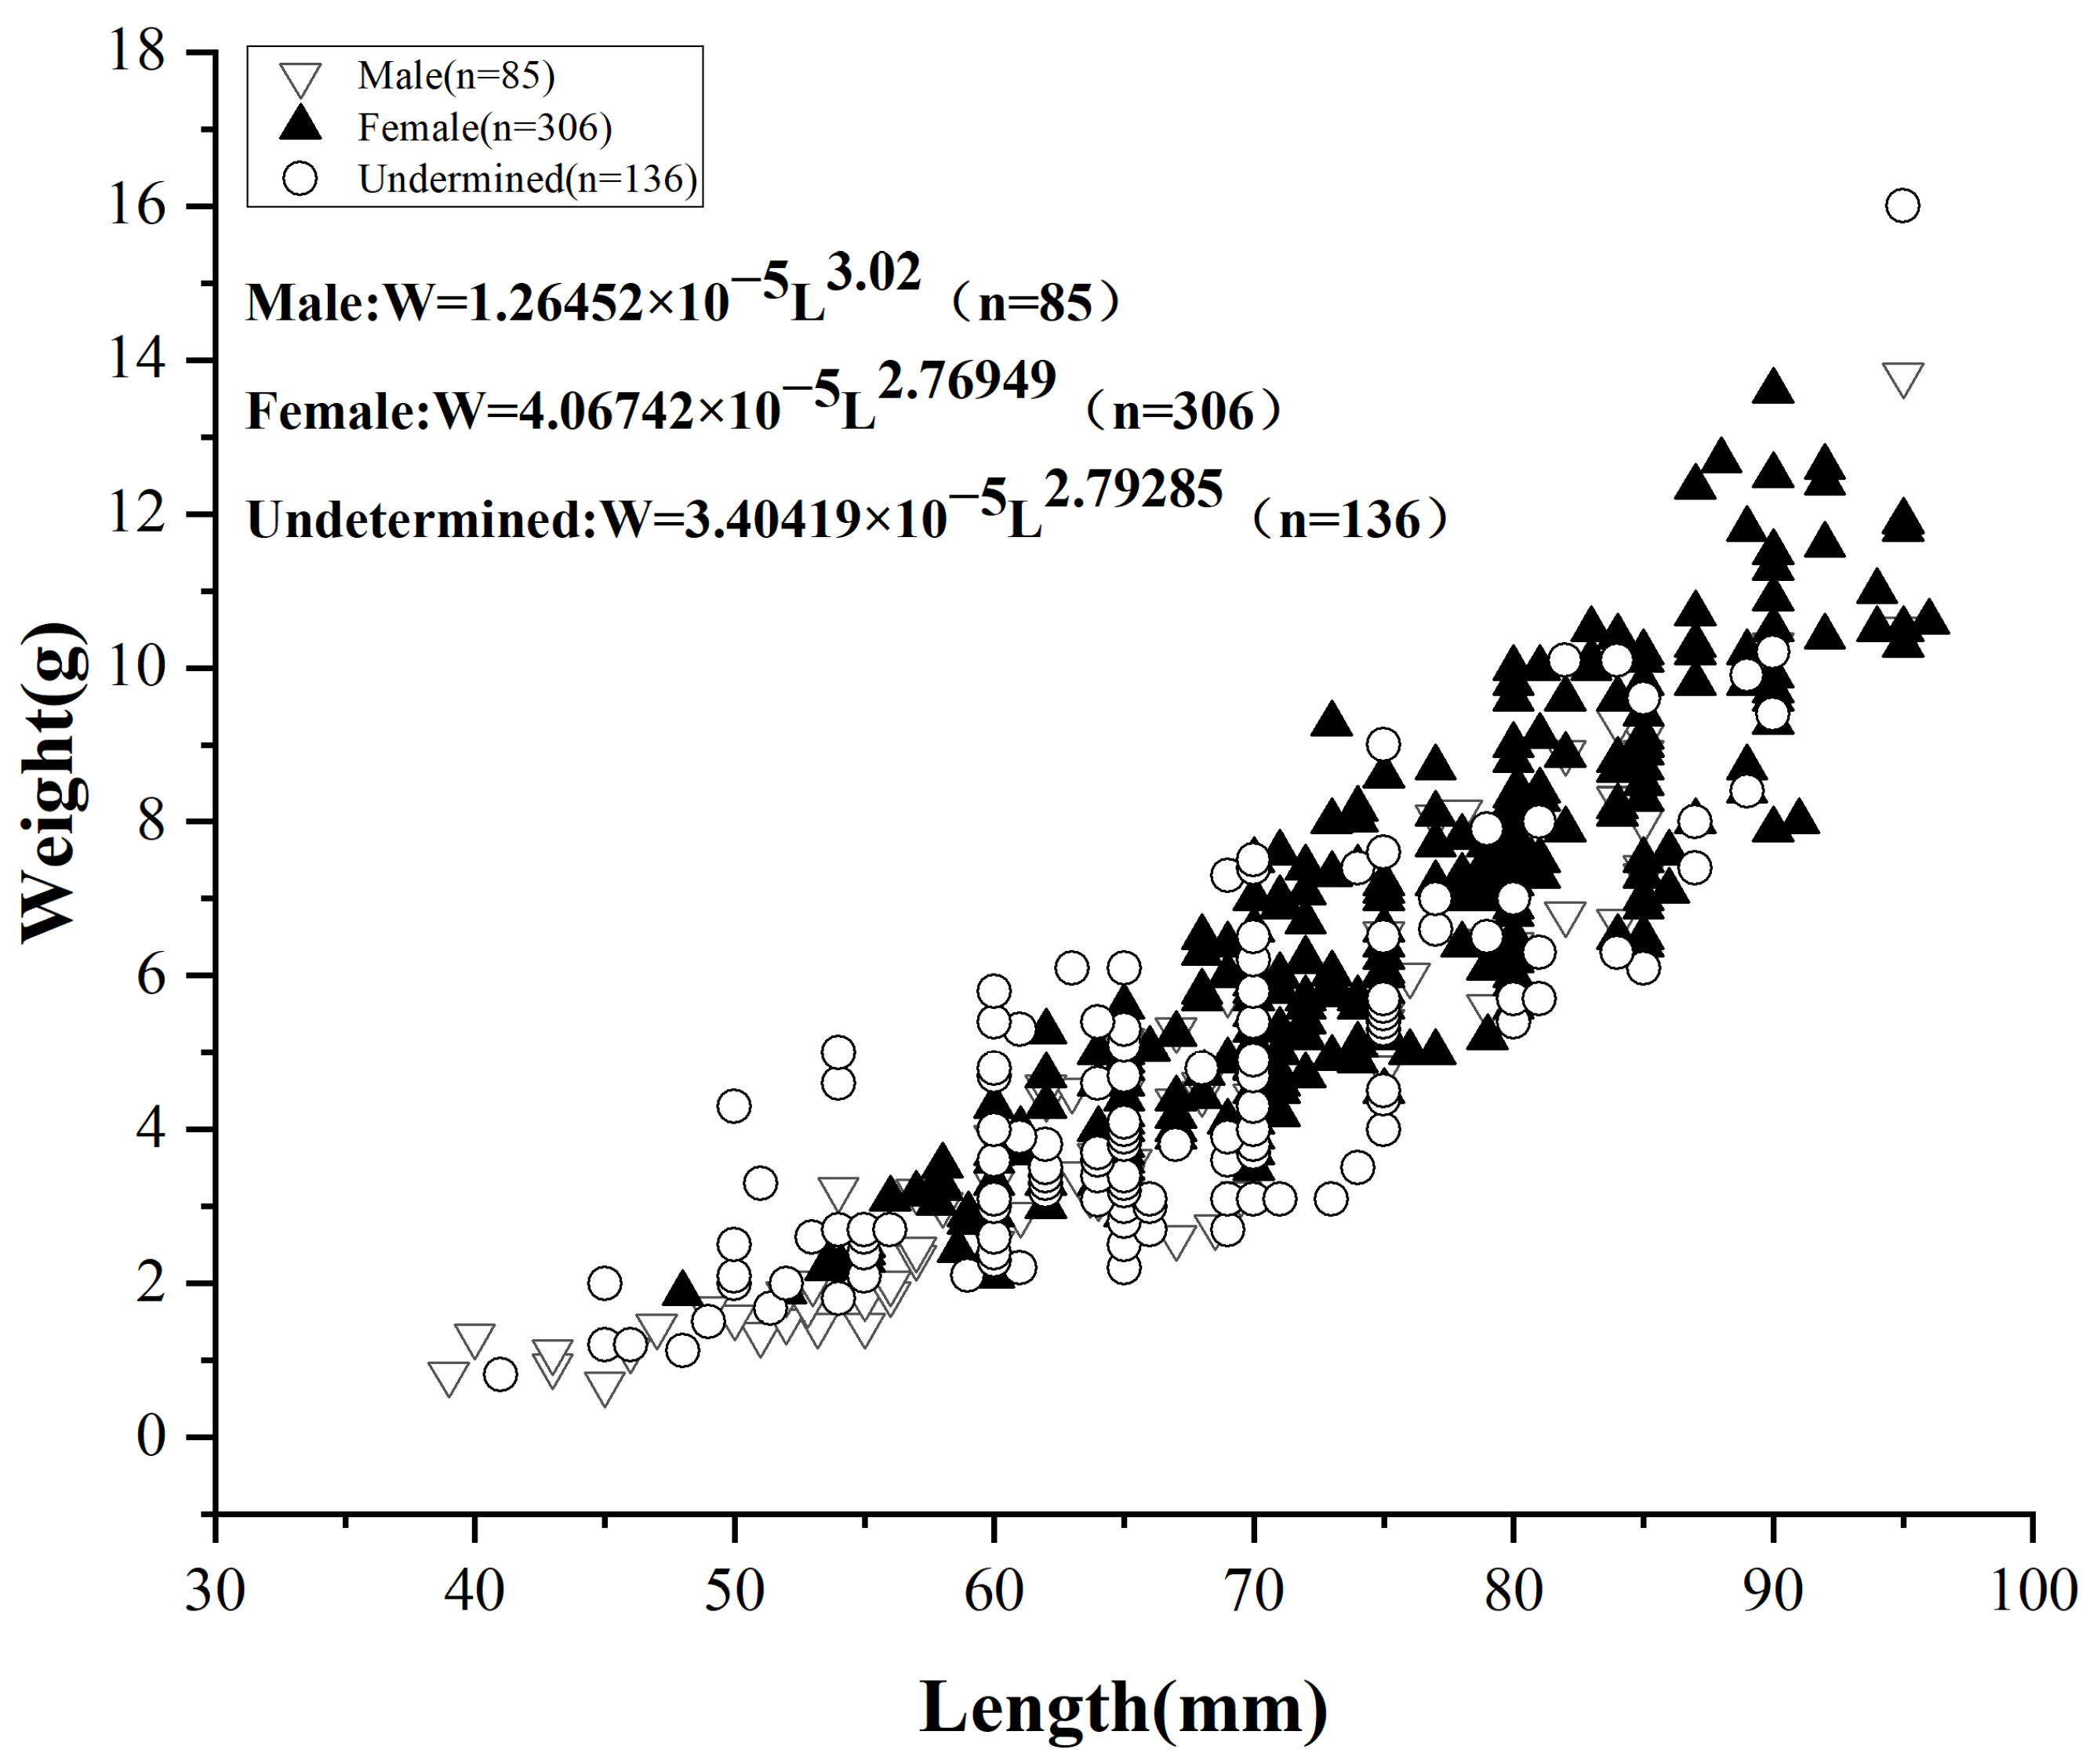
For all 527 specimens, the power function relationship between body length (L) and body weight (W) is represented by the following equation (Figure 7):
Figure 7.
Length–weight relationship of male and female P. grumi Berg, where  represents male population,
 represents the female population, and
 represents undetermined population.
represents male population, represents the female population, and represents undetermined population.
Overall population:
ANCOVA demonstrated a significant difference in the length–weight relationship between male and female P. grumi Berg (F = 10.827, p < 0.05). Males exhibited isometric growth, as the estimated b-value did not differ significantly from the theoretical value of 3 (t = 0.549, p > 0.05). Conversely, females showed negative allometric growth, with the estimated b-value being significantly lower than 3 (t = 3.577, p < 0.05). Here, allometric growth refers specifically to the proportional relationship between body length and body weight rather than age-related population growth patterns.
3.4. Relationship Between Otolith Radius and Age of Fish
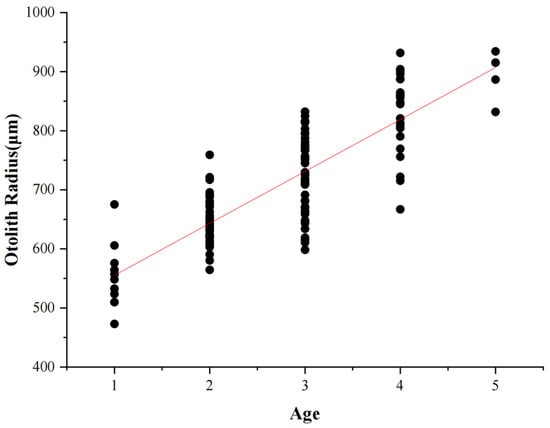
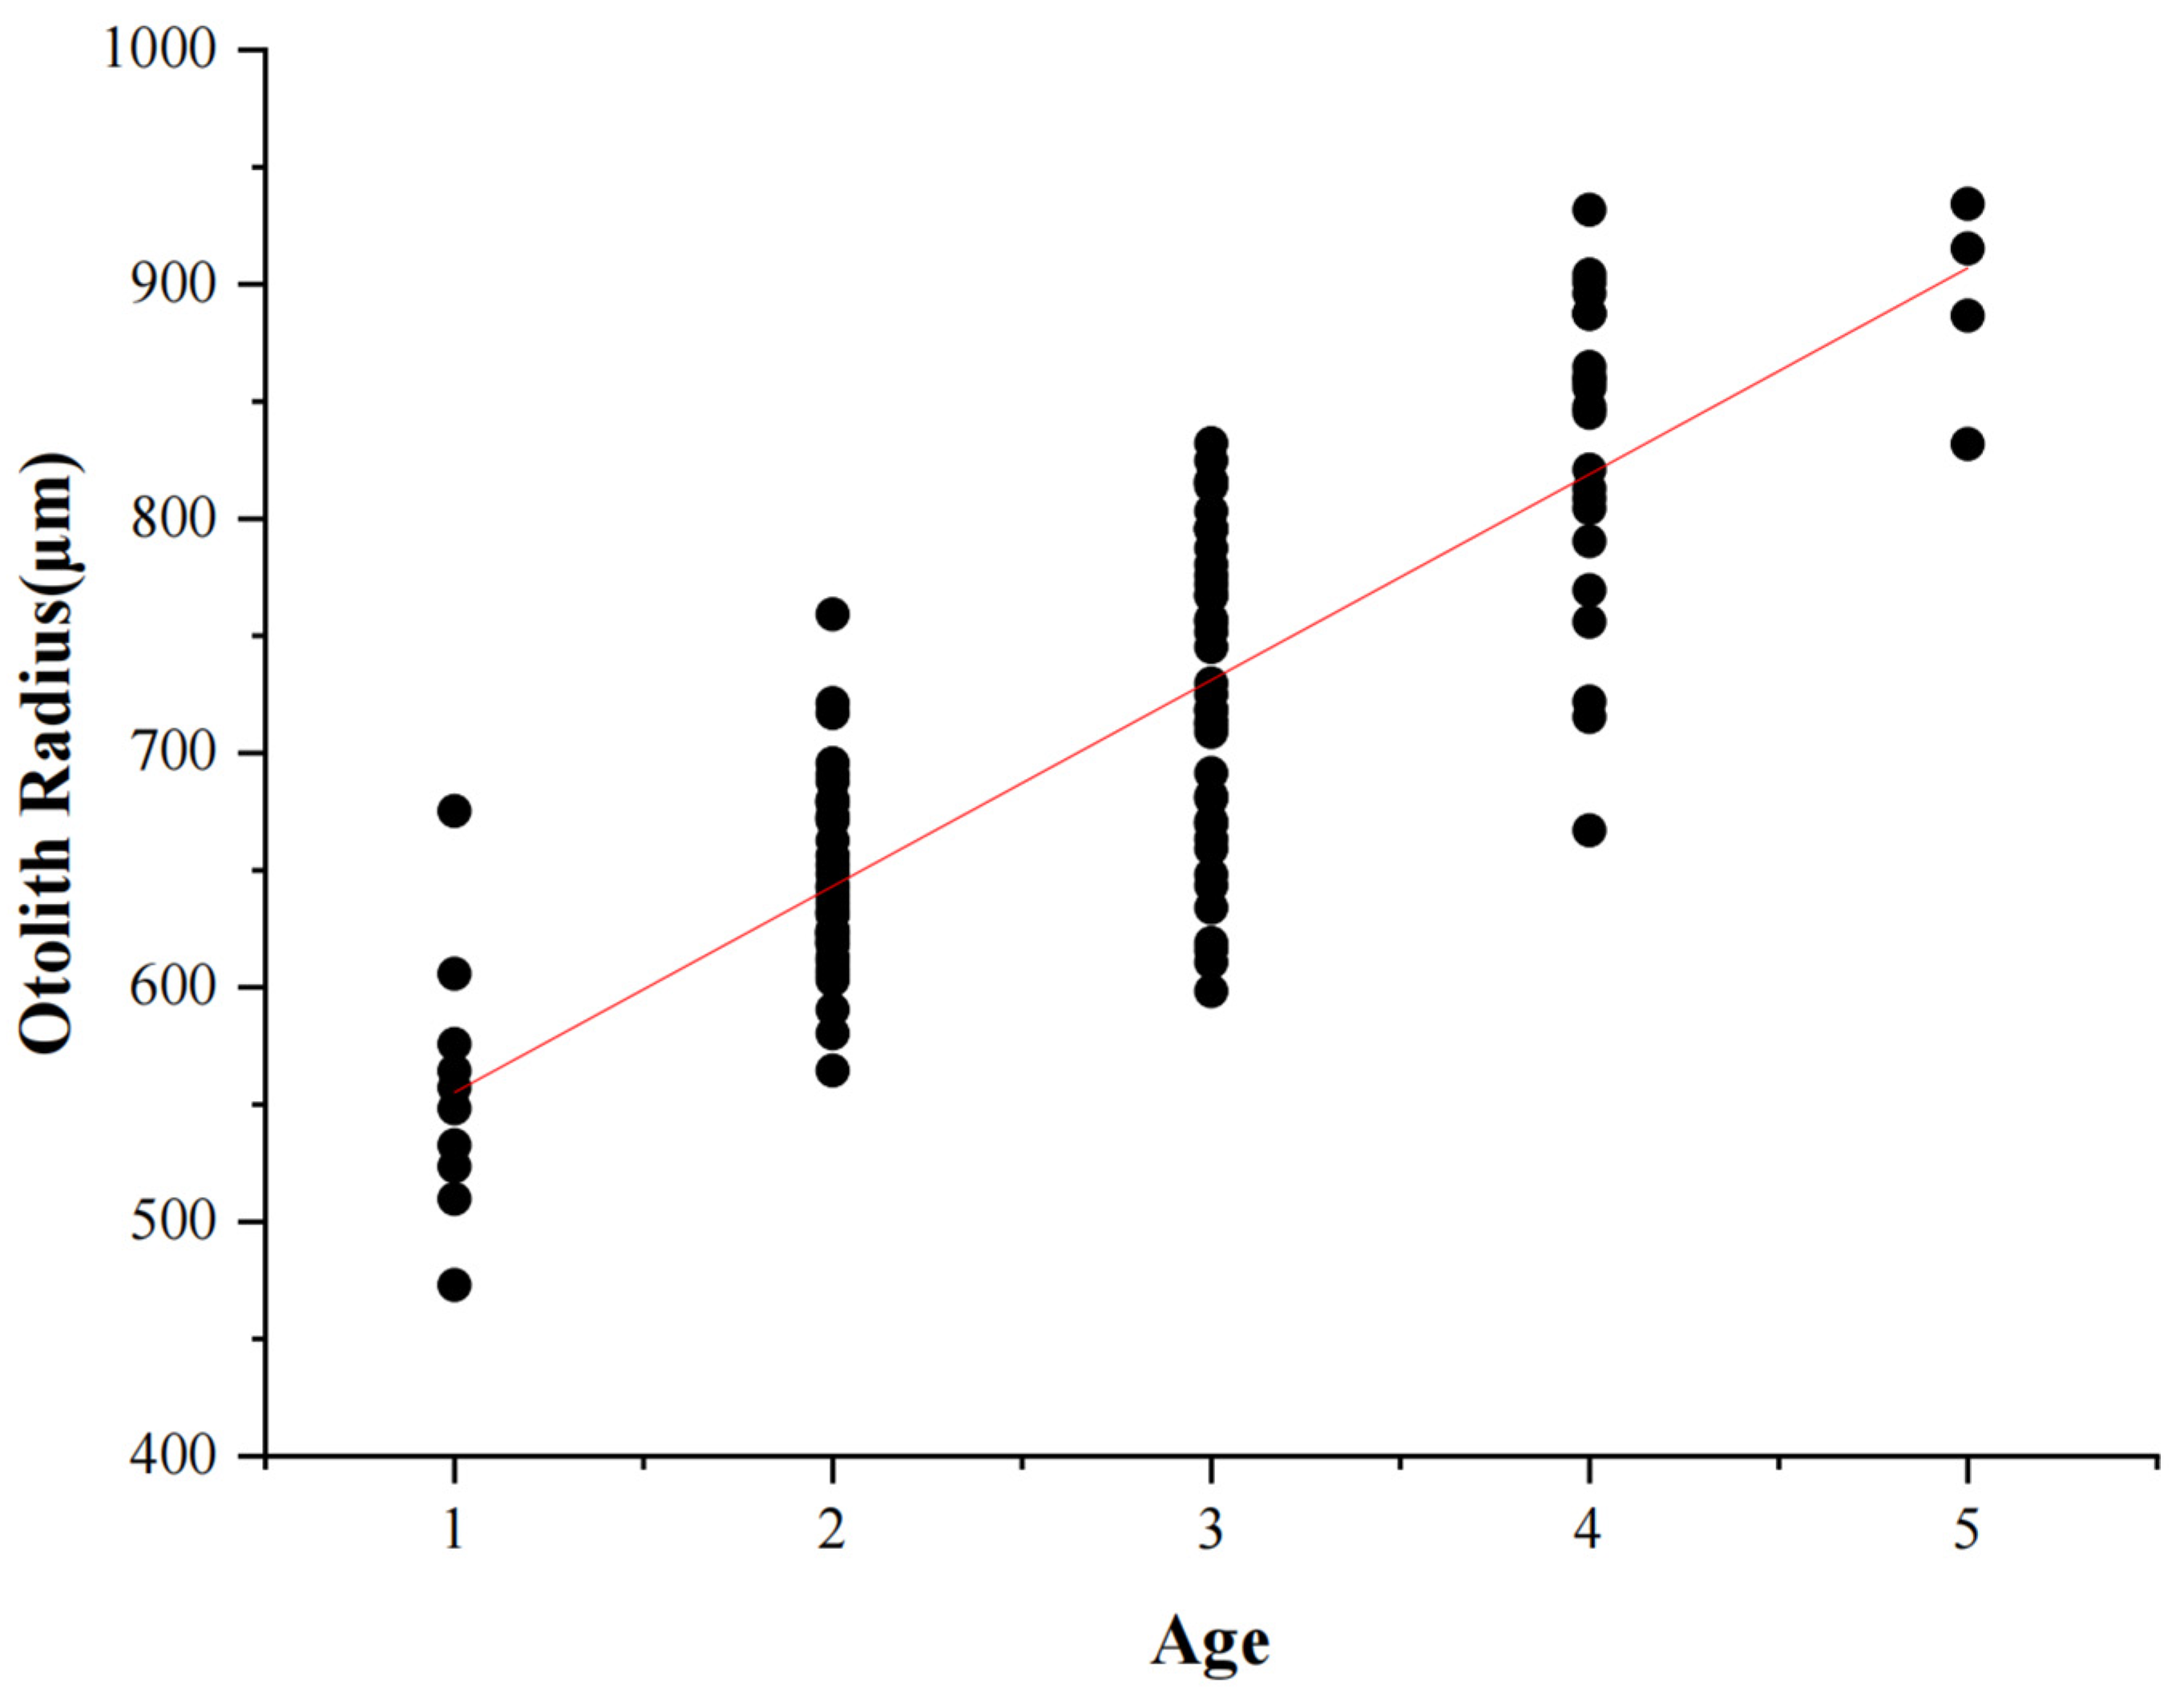
The relationship between otolith radius along the major axis and age was examined (Figure 8). A linear model was fitted to the data, revealing a relationship between otolith radius and log-transformed age: OR = 87.9243A + 467.343 (. These findings suggest that otolith radius increases with age.
Figure 8.
Relationships between otolith radius and age of fish.  represents the samples, and the solid line indicates the fitted relationship.
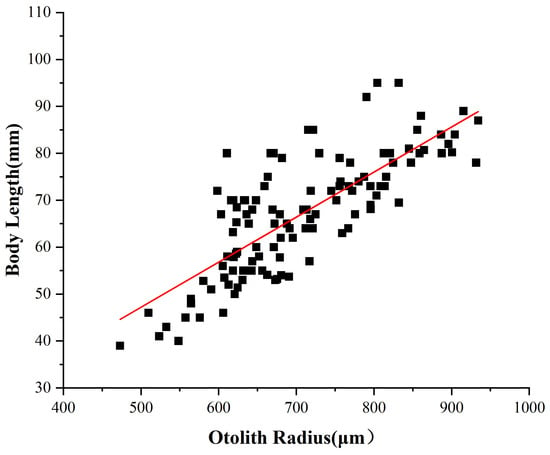
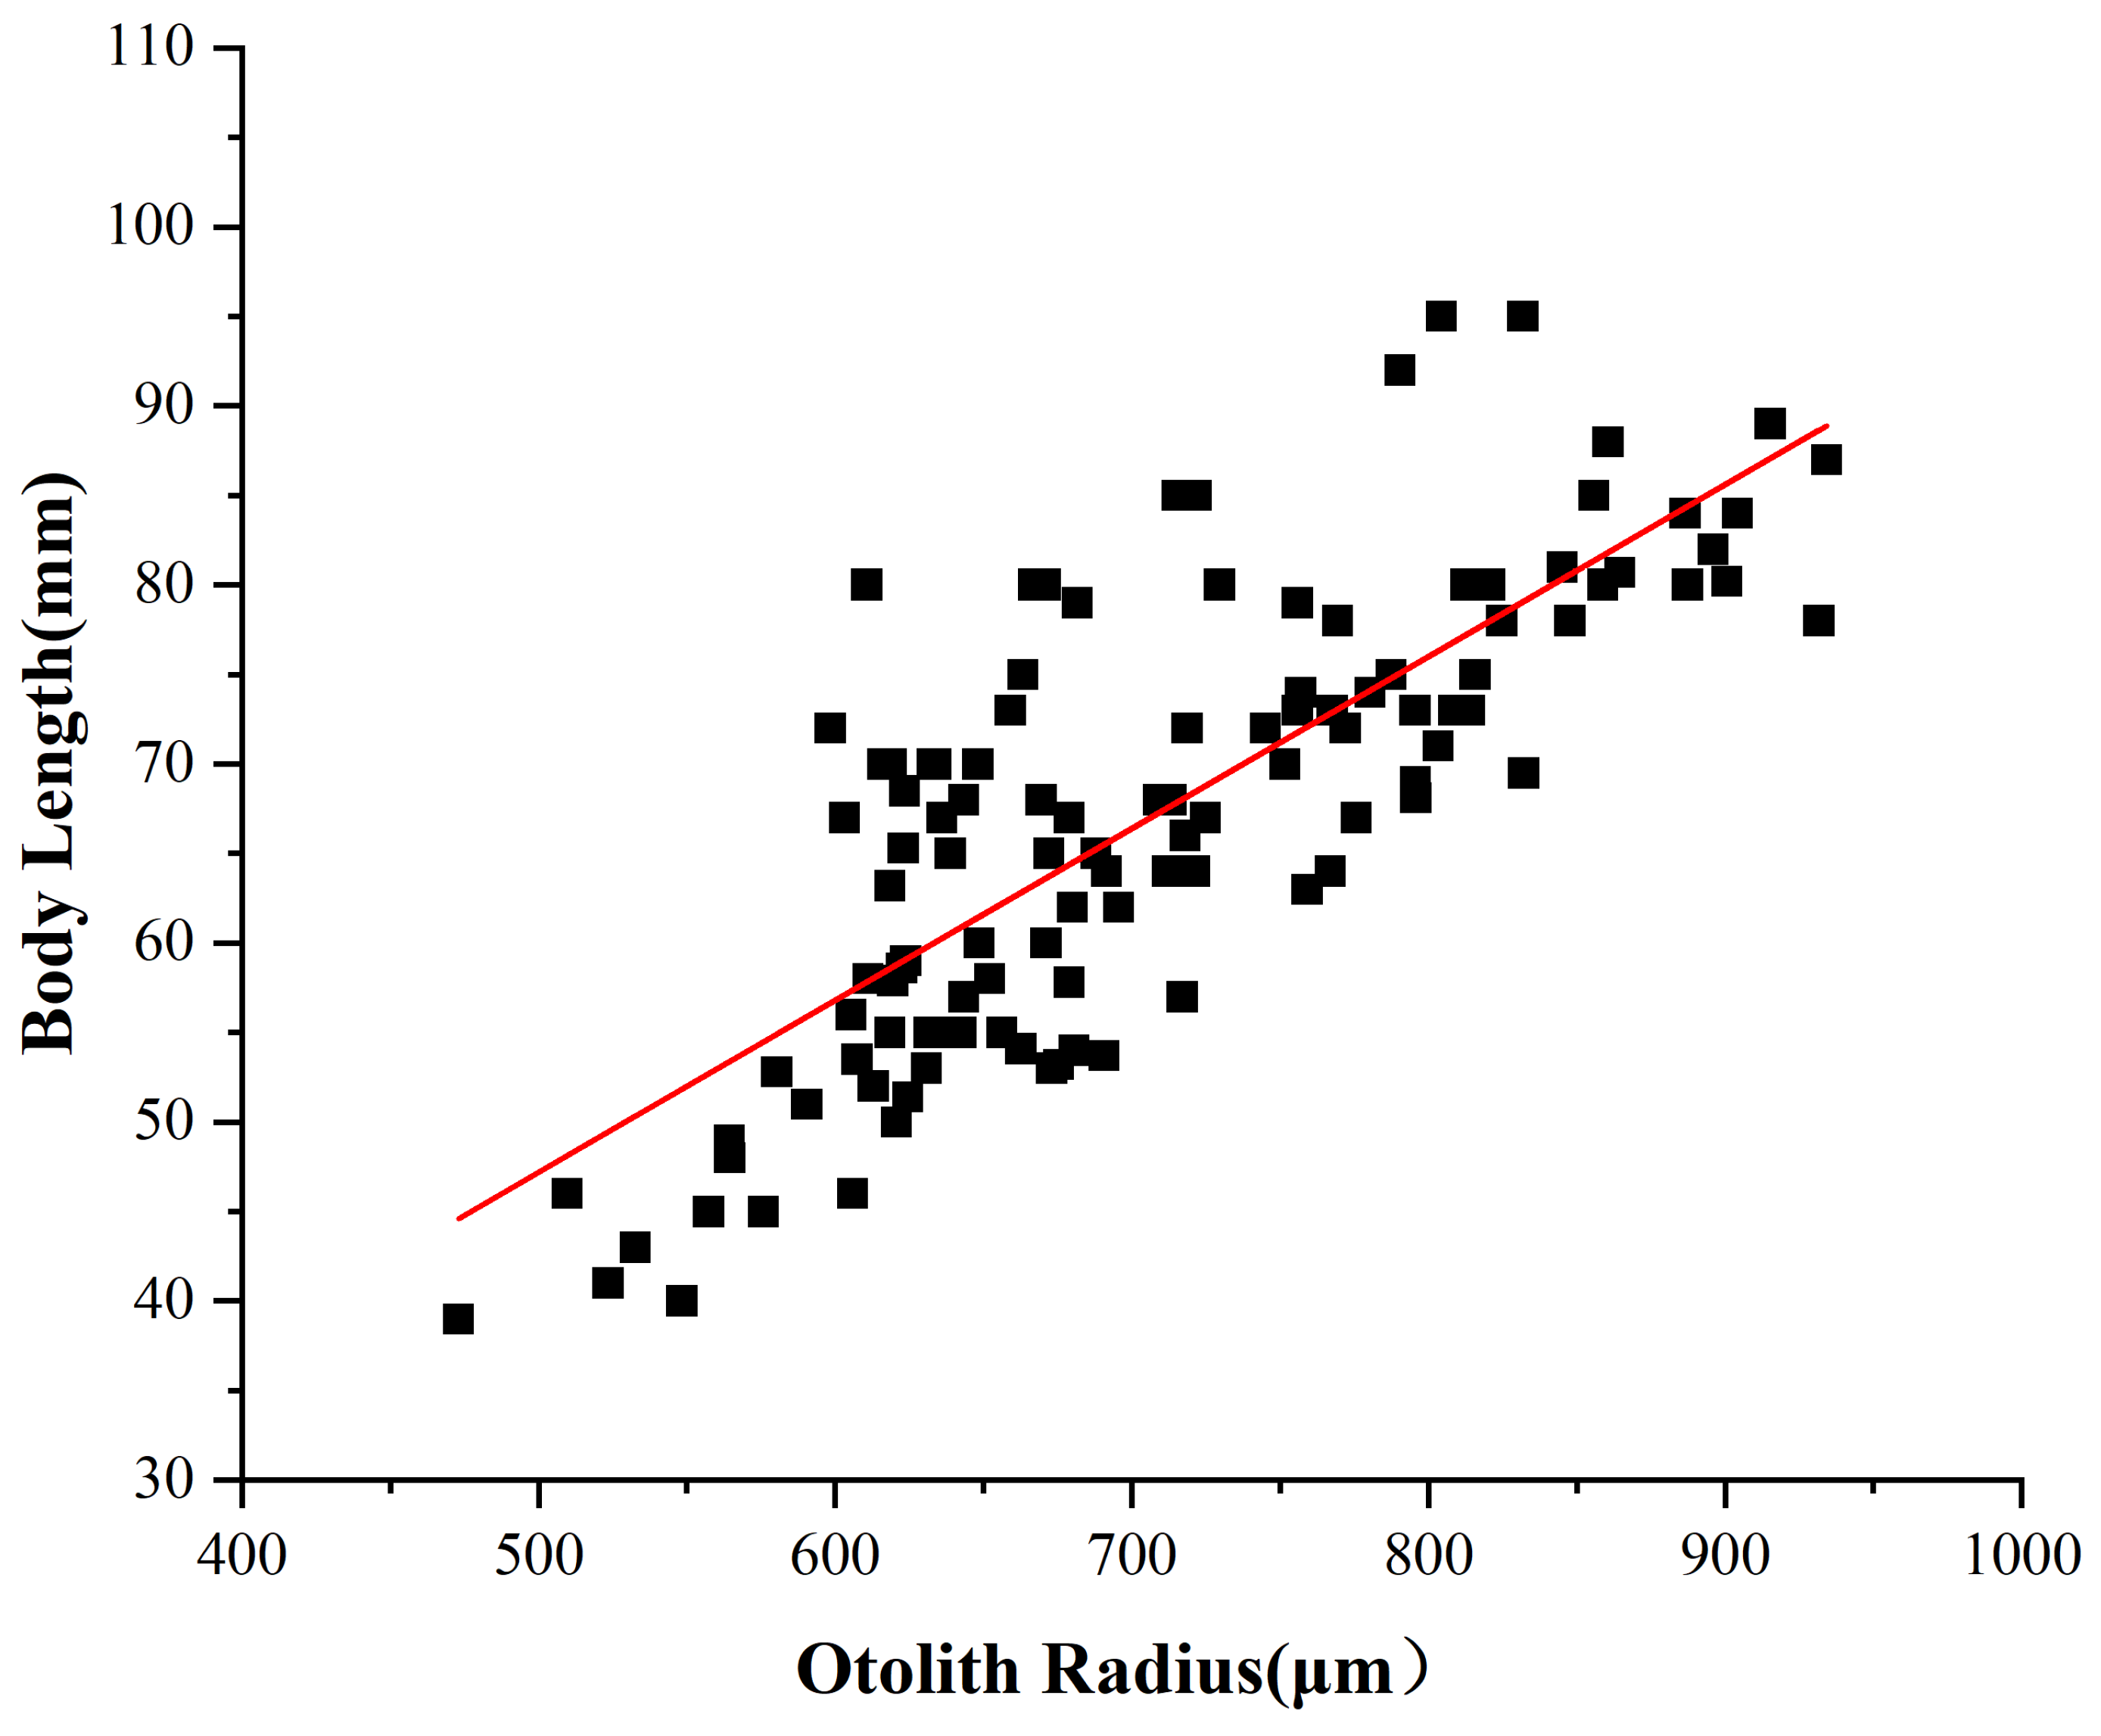
3.5. Relationship Between Otolith Radius and Body Length
In examining the relationship between body length (L) and otolith radius (OR), five regression equations were constructed using various mathematical models. Among these, the linear regression model demonstrated the highest coefficient of determination for fitting the relationship between L and OR. The resulting equation is expressed as L = 0.0096OR − 0.0784, (Figure 9).
Figure 9.
Relationships between otolith radius and body length of fish.  represents the samples, and the solid line indicates the fitted relationship.
3.6. Back-Calculation of Growth
Analysis of covariance revealed no significant difference in otolith radius between females and males (ANCOVA, F = 1.167, p > 0.05); consequently, female and male data were pooled for further analysis. The total length and otolith radius measurements of the 116 P. grumi Berg specimens were incorporated into the following formula:
The back-calculated body lengths at each age are presented in Table 1. A paired t-test was conducted to compare the observed body lengths with the back-calculated length-at-age values. No significant difference was detected between the two datasets (t = −2.40, df = 2, p > 0.05), indicating that the back-calculated length-at-age values were generally consistent with the observed body lengths.
Table 1.
Measured body length and back-calculated body length at each age class of P. grumi Berg.
3.7. Growth Equation, Growth Rate, and Growth Acceleration Equation
Because significant differences were detected in the body length and body weight distributions between females and males, the two sexes were analyzed separately in this section (see Section 3.1 and Section 3.2 for the results of the significance tests). Using the back-calculated body length data for each age group of P. grumi Berg, linear equations were fitted relating Lt+1 to Lt and ln(L∞ − Lt) to t through the least-squares method. The following parameters were derived:
♂:
♀:
The following parameters can be derived. ♂: L∞ = 105.82 mm, k = 0.2157, t0 = −0.6737; ♀: L∞ = 102.25 mm, k = 0.331, t0 = −0.7548.
The growth performance index and the age at the inflection point for P. grumi Berg are detailed in Table 2.
Table 2.
P. grumi Berg growth performance index and growth inflection age.
Based on the established length–weight relationships—♂: W = 1.2646 × 10⁻⁵L3.02 and ♀: W = 3.9607 × 10⁻⁵L2.7695—the corresponding asymptotic weights were calculated as ♂: W∞ = 16.45 g and ♀: W∞ = 14.57 g. Consequently, the von Bertalanffy growth equations for P. grumi Berg ware derived as follows:
♂:
♀:
The first and second derivatives of the growth equations for body length and weight with respect to time yielded the growth rate and acceleration equations for body length and weight, respectively:
♂:
♀:
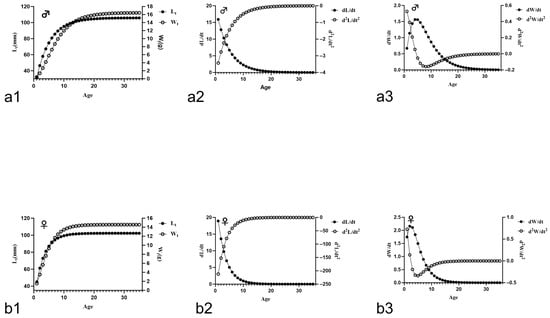
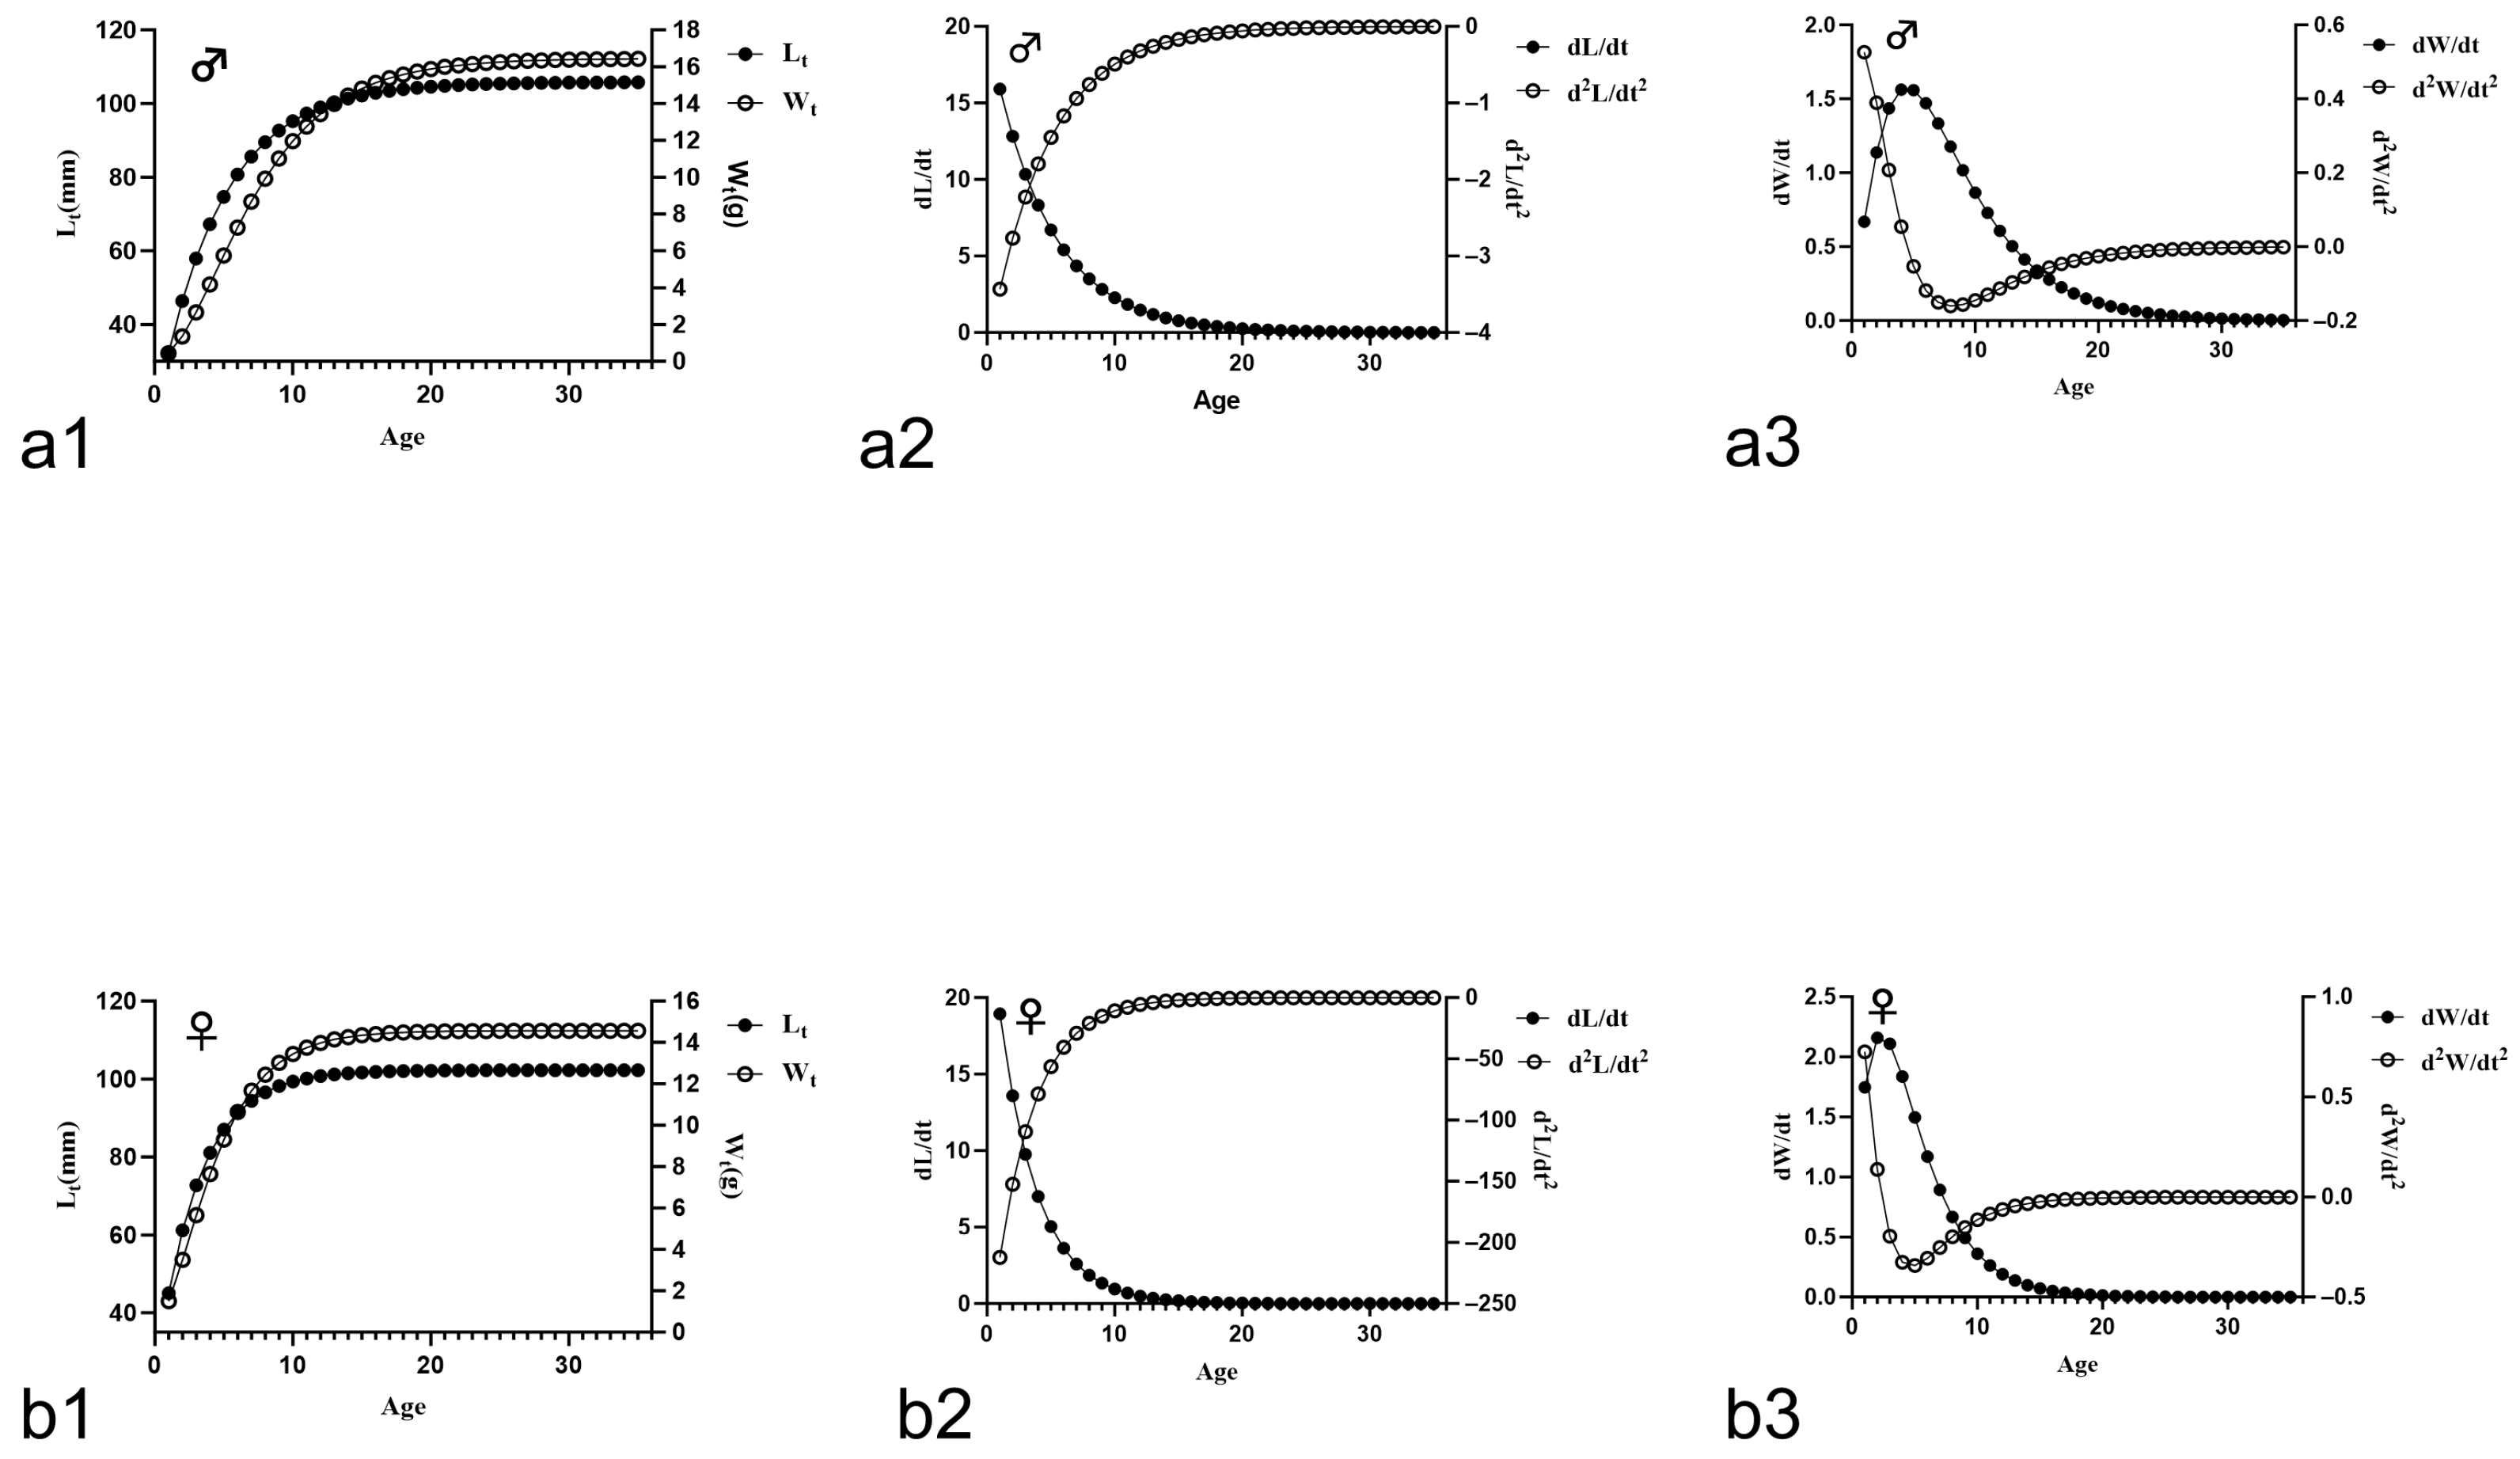
Figure 10 illustrates the von Bertalanffy growth curve, as well as the growth rate and growth acceleration for body length (L) and body weight (W) of P. grumi Berg.
Figure 10.
The von Bertalanffy growth curve, along with the growth rate and acceleration of P. grumi Berg, is illustrated. The parameters (a) and (b) denote male and female, respectively. Curve (1) represents the von Bertalanffy growth curve, Curve (2) depicts the growth rate, and Curve (3) illustrates the growth acceleration.
4. Discussion
This study systematically investigated the age and growth characteristics of P. grumi Berg for the first time, providing essential baseline data for understanding the life-history traits and population structure of this species.
4.1. Population Structure
This study demonstrated that the body length distribution and age composition of P. grumi Berg comprised individuals ranging from 1 to 5 years of age, with the 2–3 year age group predominating and accounting for 68.3% of the sampled population. These results are consistent with previous studies on P. phoxinus ujmonensis, P. percnurus, P. lagowskii, and P. oxycephalus [15,44,45]. Among the 527 specimens examined, body lengths ranged from 39 to 96 mm, with 425 individuals (80.6%) concentrated within the 60–90 mm size class. Notably, both the maximum (96 mm) and minimum (39 mm) body lengths recorded in the present study were markedly smaller than those previously reported for this species [5,14]. The asymptotic lengths (L∞) derived from model fitting were 102.25 mm for males and 105.82 mm for females in this study, which are lower than the maximum body length reported for this species in the mid-20th century [14]. However, these differences should be interpreted with caution, as they may reflect differences in sampling methods, sample size, or sampling locations among studies. Additional long-term monitoring data and comparisons with historical population size distributions are required before drawing conclusions regarding temporal changes in body size.
The growth rate analysis demonstrated that P. grumi Berg exhibited relatively rapid growth during the juvenile stage, followed by a gradual decline with increasing age. Furthermore, the growth rate of younger females was significantly higher than that of males. Rapid early growth is generally regarded as an adaptive strategy that enhances juvenile survival and ecological competitiveness during vulnerable early developmental stages, particularly in cold-water or environmentally constrained habitats [46,47]. In contrast, the decline in growth rate during later life stages may reflect a progressive shift in energy allocation from somatic growth toward maintenance metabolism and reproductive development, which is commonly observed in fishes undergoing life-history transitions [48].
The growth acceleration curve showed an initial increase followed by a gradual decrease after reaching its peak, indicating that the efficiency of somatic growth declined with age. The occurrence of peak growth acceleration may correspond to a critical life-history transition stage during which individuals allocate substantial energy to somatic growth before progressively shifting physiological investment toward maturation-related processes, a pattern commonly associated with biphasic growth in fishes [49]. Similar growth dynamics and ontogenetic transitions have also been reported in cyprinid fishes, in which inflection points and changes in allometric growth are considered indicators of developmental and ecological adaptation [50].
Although the observed body size reduction and population structure may suggest potential environmental pressure or ecological changes affecting the population, caution is required when interpreting long-term population trends. Because the present study was based primarily on age and growth characteristics from a limited sampling period, additional long-term monitoring and reproductive investigations are necessary to further evaluate the population dynamics and ecological status of P. grumi Berg.
4.2. Growth Characteristics
The b value reflects the relationship between body length and body weight. This parameter varies not only among different species but also among populations of the same species and across different developmental stages. Such variation is commonly associated with differences in stomach fullness, feeding conditions, and gonadal development status [51]. In the present study, the b value was estimated at 3.02 for male P. grumi Berg and 2.7695 for females, indicating evident sexual differences in growth patterns. Males exhibited isometric growth, whereas females showed negative allometric growth.
The growth coefficient k serves as a key indicator of population growth rate. Branstetter (1987) [52] categorized growth coefficients into three classifications: 0.05–0.1 for slow-growing species, 0.1–0.2 for moderately growing species, and 0.2–0.5 for fast-growing species. The k values for male and female P. grumi Berg were 0.2157 and 0.331, respectively, indicating that this population can be classified as fast-growing. Notably, the k value for males surpassed the previously reported range for the genus Phoxinus (0.101–0.251), while the k value for females fell within the medium-to-high range of this spectrum [15,44]. The asymptotic length L∞ for males (105.82 mm) exceeded that for females (102.25 mm), although the corresponding k value was relatively lower. Consequently, males require a longer duration to attain their asymptotic length compared to females. This observation indirectly implies that females prioritize energy allocation for fecundity and reproductive success, resulting in a more rapid somatic growth rate [53,54,55]. In contrast, males may allocate more resources to growth and competition, contributing to a comparatively slower growth rate [54,56]. Beyond habitat factors, the size range of captured specimens can also affect k estimation. Therefore, adjusting fishing gear and selecting suitable sampling sites are essential for obtaining accurate parameter estimates [24].
The growth performance index (Φ) serves as a tool for comparing growth performance among species within the same genus [57,58]. In this study, the growth performance indices (Φ) for female and male P. grumi Berg were found to be 2.3297 and 4.4503, respectively. The index for females is significantly lower than the previously reported range for the genus Phoxinus (3.47–4.09), whereas the index for males exceeds this range [14,44]. Consequently, males within the P. grumi Berg population demonstrated superior growth performance compared to females. However, because the sample sizes differed between males and females, the potential influence of sampling imbalance on growth parameter estimation cannot be completely excluded. Therefore, the sex-specific differences in Φ values should be interpreted with caution. In addition, the growth performance index is highly sensitive to the estimation of von Bertalanffy growth parameters, particularly L∞ and K, and relatively small variations in these parameters may substantially affect Φ values [59,60]. Thus, the unusually high Φ value observed in males may partly reflect uncertainty in parameter estimation and should be interpreted conservatively.
The inflection point age serves as a reliable framework for understanding the transition from early to late life stages in fish. Research indicates that the inflection point age in fish correlates closely with the age at sexual maturity and the onset of senescence, while also being influenced by factors such as fluctuations in water temperature and food availability [61,62]. Mathematical calculations determined the inflection point ages for female and male P. grumi Berg to be 3.5392 and 3.3829 years, respectively. Among the catch, 36 male individuals (94.74%) were below their inflection point age of 3.3829 years, while 46 female individuals (65.71%) were below their inflection point age of 3.5392 years. Both proportions exceeded 60%. Additionally, the mean ages of the male and female P. grumi Berg populations (♂: 2.11 years; ♀: 3.19 years) were lower than their respective inflection point ages, suggesting a current trend toward a younger age structure within the P. grumi Berg population.
The sex ratio serves as a critical indicator of the population structure in fish. By influencing the reproductive potential and spawning behavior of the breeding population, it indirectly impacts population dynamics [63]. Typically, an increase in the proportion of males within a fish population can result in a decline in reproductive potential and efficiency [64]. In the P. grumi Berg population examined in this study, the female-to-male sex ratio was 3.6:1. This ratio exceeds the previously reported female-to-male sex ratios for P. oxycephalus (1:2.08), P. lagowskii (1:1.33), and P. percnurus (1:2.08) [44,45]. Consequently, it can be inferred that the current P. grumi Berg population exhibits relatively high reproductive potential and efficiency. This may reflect an ecological adaptation aimed at maintaining population stability amidst harsh and variable habitat conditions, as well as various anthropogenic disturbances [62]. However, sex determination was unsuccessful for 136 specimens, which may have affected the representativeness and accuracy of the estimated sex ratio. Therefore, the observed female-to-male ratio should be interpreted cautiously.
Although 527 otolith samples were collected in this study, only 116 were successfully used for age determination because many otoliths were damaged during preparation or exhibited severely blurred annuli that prevented reliable interpretation. Although age-reading precision was evaluated using independent blind readings and the coefficient of variation (CV) method, the relatively low success rate may still have introduced potential sampling bias and affected the representativeness of the estimated age structure and growth parameters. Therefore, the present results should be interpreted with caution. Future studies employing improved otolith preparation techniques and larger effective sample sizes are needed to further validate the age structure and growth characteristics of P. grumi Berg.
5. Conclusions
The investigation into the age determination and growth characteristics of P. grumi Berg revealed that the current population demonstrates a relatively rapid growth rate and a high female-to-male ratio, which may indicate relatively strong reproductive capacity and active population recruitment. However, the population structure is predominantly composed of younger individuals, suggesting a potentially unstable age distribution. These findings not only enhance the fundamental biological data available for P. grumi Berg but provide valuable reference information for future conservation and management efforts.
Author Contributions
Conceptualization, W.G. and Z.L.; methodology, X.L. and M.G.; software, X.L. and M.G.; validation, X.L. and M.G.; formal analysis, X.L. and M.G.; investigation, X.L., M.G., Z.L. and X.W.; resources, W.G.; data curation, X.L. and M.G.; writing—original draft preparation, X.L. and M.G.; writing—review and editing, X.L., M.G. and W.G.; visualization, X.L. and M.G.; supervision, Z.L. and X.W. and W.G.; project administration, W.G.; funding acquisition, W.G. All authors have read and agreed to the published version of the manuscript.
Funding
This study was financially supported by the Basic Research Expenses of Colleges and Universities from the Education Department of the Xinjiang Uygur Autonomous Region (No. XJEDU2025P025).
Institutional Review Board Statement
All animal experiments were approved by the Institutional Animal Care and Use Ethics Committee of Xinjiang Agricultural University (2024049), approval date: 23 January 2024.
Informed Consent Statement
Not applicable.
Data Availability Statement
Data will be made available on request.
Conflicts of Interest
Author Zhiyuan Luo was employed by the Xinjiang Shuifa Ecology Technology Co., Ltd. The remaining authors declare that the research was conducted in the absence of any commercial or financial relationships that could be construed as a potential conflict of interest.
References
- Chen, L.; Wang, G.; Hu, F.; Wang, Y.; Liu, L. Groundwater hydrochemistry and isotope geochemistry in the Turpan Basin, northwestern China. J. Arid. Land 2014, 6, 378–388. [Google Scholar] [CrossRef] [Scilit]
- Ling, H.; Xu, H.; Fu, J. Temporal and spatial variation in regional climate and its impact on runoff in Xinjiang, China. Water Resour. Manag. 2013, 27, 381–399. [Google Scholar] [CrossRef] [Scilit]
- Du, L.; Wong, S.J.; Li, Z.; Chen, L.; Zhang, B.; Lei, B.; Peng, Z. Hydroclimatic Change in Turpan Basin under Climate Change. Water 2023, 15, 3422. [Google Scholar] [CrossRef] [Scilit]
- Li, Y.; Li, Z.; Zhang, Z.; Chen, L.; Kurkute, S.; Scaff, L.; Pan, X. High-resolution regional climate modeling and projection over western Canada using a weather research forecasting model with a pseudo-global warming approach. Hydrol. Earth Syst. Sci. 2019, 23, 4635–4659. [Google Scholar] [CrossRef] [Scilit]
- Guo, Y. Fauna of Xinjiang Fishes; Xinjiang Science and Technology Publishing House: Urumqi, China, 2012; pp. 1–12. [Google Scholar]
- Stocker, T.F.; Qin, D.; Plattner, G.-K.; Tignor, M.M.B.; Allen, S.K.; Boschung, J.; Nauels, A.; Xia, Y.; Bex, V.; Midgley, P.M. (Eds.) Climate Change 2013—The Physical Science Basis: Working Group I Contribution to the Fifth Assessment Report of the Intergovernmental Panel on Climate Change; Cambridge University Press: Cambridge, UK, 2013; pp. 1–1552. [Google Scholar] [CrossRef] [Scilit]
- Kurkute, S.; Li, Z.; Li, Y.; Huo, F. Assessment and projection of the water budget over western Canada using convection-permitting weather research and forecasting simulations. Hydrol. Earth Syst. Sci. 2020, 24, 3677–3697. [Google Scholar] [CrossRef] [Scilit]
- Tonkin, J.D.; Siqueira, T.; Merder, J.; Datry, T.; Poff, N.L.; Talbot-Jones, J.; Olden, J.D. Extreme events and river biodiversity under climate change. Nat. Rev. Biodivers. 2026, 2, 150–169. [Google Scholar] [CrossRef] [Scilit]
- Timis-Gansac, V.; Dinca, L.; Constandache, C.; Murariu, G.; Cheregi, G.; Timofte, C.S.C. Conservation biodiversity in arid areas: A review. Sustainability 2025, 17, 2422. [Google Scholar] [CrossRef] [Scilit]
- Kong, Y.; Abliz, A.; Guo, D.; Liu, X.; Li, J.; Nurahmat, B. Coupling Coordination Development Between Cultivated Land and Agricultural Water Use Efficiency in Arid Regions: A Case Study of the Turpan–Hami Basin. Agriculture 2025, 15, 1153. [Google Scholar] [CrossRef] [Scilit]
- Pei, H.; Fang, S.; Lin, L.; Qin, Z.; Wang, X. Methods and applications for ecological vulnerability evaluation in a hyper-arid oasis: A case study of the Turpan Oasis, China. Environ. Earth Sci. 2015, 74, 1449–1461. [Google Scholar] [CrossRef] [Scilit]
- Fang, S.; Pei, H.; Liu, Z.; Beven, K.; Wei, Z. Water resources assessment and regional virtual water potential in the Turpan Basin, China. Water Resour. Manag. 2010, 24, 3321–3332. [Google Scholar] [CrossRef] [Scilit]
- Vázquez-Rowe, I. A fine kettle of fish: The fishing industry and environmental impacts. Curr. Opin. Environ. Sci. Health 2020, 13, 1–5. [Google Scholar] [CrossRef] [Scilit]
- Li, S.-Z.; Dai, D.-Y.; Zhang, S.-Y.; Wang, Q. An Investigation on the Fishes from North Xinjiang. Acta Zool. Sin. 1966, 12, 41–56. [Google Scholar]
- Xie, P. Comparative Morphology and Thermal Adaptation of the Genus Phoxinus in China. Ph.D. Thesis, Huazhong Agricultural University, Wuhan, China, 2019. [Google Scholar] [CrossRef]
- Beamish, R.J.; Mcfarlane, G.A. The Forgotten Requirement for Age Validation in Fisheries Biology. Trans. Am. Fish. Soc. 1983, 6, 735–743. [Google Scholar] [CrossRef] [Scilit]
- Jakes-Cota, U.; Chavz-Arellano, R.; Sepulveda, C.; Aalbers, S.; Ortega-Garcia, S. Estimating age and growth of roosterfish (Nematistius pectoralis) from otoliths. Fish. Res. 2021, 240, 105958. [Google Scholar] [CrossRef] [Scilit]
- Silva, M.I.; Martins, R.; Sequeira, V.; Silva, D.; Farias, I.; Assis, C.A.; Gordo, L.S.; Vieira, A.R. Struggling with fish age, a comparison of otolith preparation techniques to unravel age and growth of boarfish, Capros aper (Linnaeus, 1758). Sci. Rep. 2024, 14, 20282. [Google Scholar] [CrossRef] [Scilit]
- Kerns, J.A.; Lombardi-Carlson, L.A. History and importance of age and growth information. In Age and Growth of Fishes: Principles and Techniques; American Fisheries Society: Bethesda, MD, USA, 2017; pp. 1–8. [Google Scholar]
- Zale, A.V.; Parrish, D.L.; Sutton, T.M. Conducting fisheries investigations. In Fisheries Techniques, 3rd ed.; Zale, A.V., Parrish, D.L., Sutton, T.M., Eds.; American Fisheries Society: Bethesda, MD, USA, 2012; pp. 1–31. [Google Scholar] [CrossRef] [Scilit]
- De Santana, H.S.; Minte-Vera, C.V. Age and growth of Prochilodus lineatus in a spatially structured population: Is there concordance between otoliths and scales? Environ. Biol. Fishes 2017, 100, 223–235. [Google Scholar] [CrossRef] [Scilit]
- Hopper, A.G. Deep-Water Fisheries of the North Atlantic Oceanic Slope; NATO ASI Series; Springer: Berlin/Heidelberg, Germany, 1995; Volume 296. [Google Scholar] [CrossRef] [Scilit]
- Campana, S.E.; Thorrold, S.R. Otoliths, increments, and elements: Keys to a comprehensive understanding of fish populations? Can. J. Fish. Aquat. Sci. 2001, 58, 30–38. [Google Scholar] [CrossRef]
- Campana, S.E. Accuracy, precision and quality control in age determination, including a review of the use and abuse of age validation methods. J. Fish Biol. 2001, 59, 197–242. [Google Scholar] [CrossRef]
- Vilizzi, L.; Walker, K.F. Age determination in common carp Cyprinus carpio: History, relative utility of ageing structures, precision and accuracy. Rev. Fish Biol. Fish. 2018, 28, 617–658. [Google Scholar] [CrossRef] [Scilit]
- Long, J.M.; Fisher, W.L. Precision and bias of largemouth, smallmouth, and spotted bass ages estimated from scales, whole otoliths, and sectioned otoliths. N. Am. J. Fish. Manag. 2001, 21, 636–645. [Google Scholar] [CrossRef] [Scilit]
- Von Bertalanffy, L. A quantitative theory of organic growth (inquiries on growth laws II). Hum. Biol. 1938, 10, 181–213. [Google Scholar]
- Chen, Y.; Jackson, D.A.; Harvey, H.H. A comparison of von Bertalanffy and poly-nomial functions in modelling fish growth data. Can. J. Fish. Aquat. Sci. 1992, 49, 1228–1235. [Google Scholar] [CrossRef] [Scilit]
- Kimura, D.K. Extending the von Bertalanffy growth model using explanatory variables. Can. J. Fish. Aquat. Sci. 2008, 65, 1879–1891. [Google Scholar] [CrossRef] [Scilit]
- Pauly, D. Gasping fish and panting squids: Oxygen, temperature and the growth of water breathing animals. In Excellence in Ecology; Kinne, O., Ed.; International Ecology Institute: Oldendorf/Luhe, Germany, 2010; Volume 22, pp. 1–216. [Google Scholar]
- Rochet, M.J.; Trenkel, V.M. Which community indicators can measure the impact of fishing? A review and proposals. Can. J. Fish. Aquat. Sci. 2003, 60, 86–99. [Google Scholar] [CrossRef] [Scilit]
- Mercier, L.; Panfili, J.; Paillon, C.; N’diaye, A.; Mouillot, D.; Darnaude, A.M. Otolith reading and multi-model inference for improved estimation of age and growth in the gilthead seabream Sparus aurata (L.). Estuar. Coast. Shelf Sci. 2011, 92, 534–545. [Google Scholar] [CrossRef] [Scilit]
- Rountrey, A.N.; Coulson, P.G.; Meeuwig, J.J.; Meekan, M. Water temperature and fish growth: Otoliths predict growth patterns of a marine fish in a changing climate. Glob. Change Biol. 2014, 20, 2450–2458. [Google Scholar] [CrossRef] [Scilit] [PubMed]
- Zhan, B.Y. (Ed.) Fishery Resource Assessment; China Agriculture Press: Beijing, China, 1995. [Google Scholar]
- Xiong, F.; Chen, D.Q.; Liu, S.P.; Duan, X.B.; Shi, J.Q. Annuli characteristics of the different ageing materials of Gymnocypris przewalskii przewalskii (Kessler). Acta Hydrobiol. Sin. 2006, 30, 185–191. [Google Scholar] [CrossRef] [Scilit]
- Disspain, M.C.; Ulm, S.; Gillanders, B.M. Otoliths in archaeology: Methods, applications and future prospects. J. Archaeol. Sci. Rep. 2016, 6, 623–632. [Google Scholar] [CrossRef] [Scilit]
- Underwood, A.J. Experiments in Ecology: Their Logical Design and Interpretation Using Analysis of Variance; Cambridge University Press: Cambridge, UK, 1997. [Google Scholar] [CrossRef] [Scilit]
- Bailey, C.J.; Wilson, K.L.; More O’Ferrall, M.; Moore, J.W. Fish length back-calculation from scales: Advancing methodology and correction of bias. Can. J. Fish. Aquat. Sci. 2022, 79, 1780–1797. [Google Scholar] [CrossRef] [Scilit]
- Cazorla, A.L.; Sidorkewicj, N. Age and growth of the largemouth perch Percichthys colhuapiensis in the Negro river, Argentine Patagonia. Fish. Res. 2008, 92, 169–179. [Google Scholar] [CrossRef] [Scilit]
- Ma, B.S. Study on the Biology and Population Dynamics of Schizothorax o’connori. Ph.D. Thesis, Huazhong Agricultural University, Wuhan, China, 2011. [Google Scholar] [CrossRef]
- Pauly, D. The relationship between gill surface area and growth performance in fish: A generalization of von Bertalanffy’s theory of growth. Meeresforschung 1981, 28, 251–282. [Google Scholar]
- Yin, M.C. Fish Ecology; China Agriculture Press: Beijing, China, 1995. [Google Scholar]
- Pauly, D. Recent developments in the methodology available for the assessment of exploited fish stocks of reservoirs. In Status of African Reservoir Fisheries (CIFA Technical Paper No. 10); Kapetzky, J.M., Petr, T., Eds.; FAO: Rome, Italy, 1984; Volume 10, pp. 322–325. Available online: https://hdl.handle.net/20.500.12348/3437 (accessed on 7 June 2026).
- Liang, Y.Y.; Sui, X.Y.; Chen, Y.F.; Jia, Y.T.; He, D.K. Life history traits of the Chinese minnow Rhynchocypris oxycephalus in the upper branch of Yangtze River, China. Zool. Stud. 2014, 53, 36–45. [Google Scholar] [CrossRef] [Scilit]
- Wang, W.; Jia, Y.T.; Chen, Y.F. Studies on the biological characteristics of three economic fish species in the Suifen River. J. Anhui Norm. Univ. Nat. Sci. 2012, 35, 466–470. [Google Scholar] [CrossRef]
- Houlihan, D.F.; Boujard, T.; Jobling, M. The cost of growth in young fish larvae: A review of new hypotheses. Aquaculture 1997, 155, 259–269. [Google Scholar] [CrossRef] [Scilit]
- Kupren, K.; Mamcarz, A.; Żarski, D.; Krejszeff, S.; Targońska, K.; Czarkowski, T.K. Early development and allometric growth patterns of rheophilic cyprinid common dace Leuciscus leuciscus. Ichthyol. Res. 2016, 63, 382–390. [Google Scholar] [CrossRef] [Scilit]
- Burril, S.E.; Sather, N.K.; Stuber, R.J.; Evans, A.F. Energy allocation and feeding ecology of juvenile chum salmon (Oncorhynchus keta) in the northeastern Bering Sea. Polar Biol. 2019, 42, 1447–1461. [Google Scholar] [CrossRef] [Scilit]
- Quince, C.; Abrams, P.A.; Shuter, B.J.; Lester, N.P. Biphasic growth in fish I: Theoretical foundations. J. Theor. Biol. 2008, 254, 197–206. [Google Scholar] [CrossRef] [Scilit]
- Kupren, K.; Nowosad, J.; Kucharczyk, D. Growth priorities of the four riverine cyprinids during early ontogeny. Animals 2023, 13, 2345. [Google Scholar] [CrossRef] [Scilit]
- Flura, M.Z.; Rahman, B.S.; Rahman, M.A.; Ashraful, M.; Alam, M.; Pramanik, M.H. Length-weight relationship and GSI of hilsa, Tenualosa ilisha (Hamilton, 1822) fishes in Meghna river, Bangladesh. Int. J. Nat. Soc. Sci. 2015, 2, 82–88. [Google Scholar]
- Branstetter, S. Age and growth estimates for blacktip shark (Carcharhinus limbatus) and spinner shark (Carcharhinus brevipinna) from the northwestern Gulf of Mexico. Copeia 1987, 1987, 964–974. [Google Scholar] [CrossRef] [Scilit] [PubMed]
- Wootton, R.J. Ecology of Teleost Fishes, 2nd ed.; Kluwer Academic Publishers: Dordrecht, The Netherlands, 1998. [Google Scholar]
- Stearns, S.C. The Evolution of Life Histories; Oxford University Press: Oxford, UK, 1992. [Google Scholar]
- Luo, Z.J.; Wang, P.; Peng, N.; Li, X.; Wang, X.Q. Research progress on growth sexual dimorphism of aquatic animals. Chin. J. Fish. 2017, 30, 56–60. Available online: https://www.scxzz.ac.cn/CN/Y2017/V30/I6/56 (accessed on 7 June 2026).
- Nikolsky, G.V. The Ecology of Fishes; Academic Press: London, UK, 1963. [Google Scholar]
- Munro, J.L.; Pauly, D. A simple method for comparing the growth of fishes and invertebrates. Fishbyte 1983, 1, 5–6. [Google Scholar]
- Pauly, D. A review of the ELEFAN system for analysis of length-frequency data in fish and aquatic invertebrates. In ICLARM Conference Proceedings; ICLARM: Manila, Philippines, 1987; Volume 13, pp. 7–34. Available online: https://hdl.handle.net/20.500.12348/3366 (accessed on 7 June 2026).
- Pauly, D.; Munro, J.L. Once more on the comparison of growth in fish and invertebrates. Fishbyte 1984, 2, 21. [Google Scholar]
- Sparre, P.; Venema, S.C. Introduction to Tropical Fish Stock Assessment; FAO: Rome, Italy, 1998. [Google Scholar]
- Hao, H.Z. Study on Age and Growth of Schizothorax waltoni. Ph.D. Thesis, Huazhong Agricultural University, Wuhan, China, 2005. [Google Scholar]
- Skeeles, M.R.; Clark, T.D. Evidence for energy reallocation, not oxygen limitation, driving the deceleration in growth of adult fish. J. Exp. Biol. 2023, 226, jeb246012. [Google Scholar] [CrossRef] [Scilit]
- Alonzo, S.H.; Mangel, M. The effects of size-selective fisheries on the stock dynamics of and sperm limitation in sex-changing fish. Fish. Bull. 2004, 102, 1–13. [Google Scholar]
- Smith, G.H.; Murie, D.J.; Parkyn, D.C. Effects of sex-specific fishing mortality on sex ratio and population dynamics of Gulf of Mexico greater amberjack. Fish. Res. 2018, 208, 219–228. [Google Scholar] [CrossRef] [Scilit]

Disclaimer/Publisher’s Note: The statements, opinions and data contained in all publications are solely those of the individual author(s) and contributor(s) and not of MDPI and/or the editor(s). MDPI and/or the editor(s) disclaim responsibility for any injury to people or property resulting from any ideas, methods, instructions or products referred to in the content. |
© 2026 by the authors. Licensee MDPI, Basel, Switzerland. This article is an open access article distributed under the terms and conditions of the Creative Commons Attribution (CC BY) license.