


Abstract
Antimicrobial resistance (AMR) may alter bacterial traits beyond antibiotic susceptibility, but its physiological consequences remain unclear. This study investigated whether these outcomes in Salmonella Typhimurium depend on the antibiotic, ampicillin (AMP) or gentamicin (GEN), and the selection regimen. Two adaptive laboratory evolution (ALE) strategies were compared: constant subinhibitory exposure (Assay A) and stepwise increasing antibiotic exposure (Assay B). Minimum inhibitory concentrations, whole-genome sequencing, cross-resistance profiles, and growth kinetics were evaluated across at least three biological replicates. Assay A produced resistance increases up to 8-fold, with only one variant reaching the resistance breakpoint, whereas Assay B yielded increases up to 128-fold for AMP-resistant variants (RVs) and 16-fold for GEN-RVs. AMP resistance was associated with mutations in acrB and ramR, and broader cross-resistance, with generally unchanged lag phases but strain-dependent reductions in maximum growth rates. In contrast, GEN resistance involved mutations related to respiration and energy production (cydA, hemL, etc.), limited cross-resistance and growth impairment across GEN-RVs, including small-colony variant (SCV)-like phenotypes. In an exploratory assay, one GEN-RV showed delayed plaque expansion during Dictyostelium discoideum predation, suggesting altered interactions with phagocytic predators. Overall, AMR-associated phenotypes depend on both antibiotic and selection regimen, underscoring the importance of physiological changes when assessing resistant foodborne pathogens.
1. Introduction
Beyond the concerning life-threatening and economic consequences of antimicrobial resistance (AMR) in Salmonella enterica [1,2], resistance acquisition can also trigger broader physiological adaptations extending beyond antibiotic susceptibility itself [3]. Increasing evidence indicates that AMR-associated mutations may alter bacterial growth performance, virulence, persistence and cross-protections [4,5], potentially affecting the ecology and dissemination of resistant pathogens in the food chain [6,7].
The generation and characterization of microbial resistant variants (RVs) derived from adaptive laboratory evolution (ALE) has become a widely used experimental approach for investigating the mechanisms underlying AMR and bacterial adaptation [8,9]. By enabling direct comparisons between RVs and their susceptible parental counterparts under defined selective conditions, ALE provides a robust framework for identifying the genetic determinants of resistance and characterizing its physiological consequences, while also allowing evolutionary responses to different antibiotic exposure regimens to be systematically investigated [8,10,11,12,13]. Antibiotic-RVs are predominantly generated through three general ALE approaches:
- (A).
- Prolonged exposure to subinhibitory concentrations, favoring the gradual enrichment of adapted subpopulations [10,13];
- (B).
- Sequential exposure to progressively increasing antibiotic concentrations, ultimately reaching levels well above the initial MIC [8];
- (C).
- Exposure to lethal treatments, allowing the selection of rare survivors [11,14].
Ampicillin (AMP, a β-lactam) and gentamicin (GEN, an aminoglycoside) are mechanistically distinct antibiotics widely used in human and veterinary medicine and are classified by the World Health Organization as Highly Important and Critically Important antimicrobials for human medicine, respectively [15]. AMP exerts its bactericidal activity by inhibiting cell wall synthesis through binding to penicillin-binding proteins, whereas GEN is also bactericidal but acts by binding to the 30S ribosomal subunit, disrupting protein synthesis [16]. Among the potential phenotypic consequences of resistance acquisition, alterations in virulence are particularly relevant, as AMR-associated adaptations may reduce, preserve or enhance bacterial virulence depending on the underlying genetic determinants and their physiological costs [4]. Indeed, altered virulence phenotypes have been reported for Salmonella RVs in Caenorhabditis elegans and Galleria mellonella infection models [17,18,19]. However, whether resistance acquisition also affects interactions with phagocytic predators, a simplified proxy for innate immune-like processes [20,21], remains unexplored.
Although similar ALE approaches have been applied to Salmonella enterica [5,22,23], the influence of the exposure regimen on the phenotypic consequences of resistance, beyond the resistance level attained, has not been addressed. Moreover, neither of these two antibiotics has been evaluated under such regimens, and aminoglycosides in particular remain unexplored. To address how the selecting antibiotic and evolutionary regimen influence AMR development and its associated genetic and phenotypic outcomes, AMP- and GEN-RVs were generated using constant subinhibitory exposure (Assay A) or stepwise increasing antibiotic concentrations (Assay B). Lethal exposure was not included in this work, as sublethal concentrations better reflect those encountered along the food chain and select for gradual adaptation rather than for rare pre-existing survivors. Specifically, we aimed to: (A) compare the extent of resistance acquisition under both evolutionary regimens; (B) identify the genetic determinants and adaptive pathways underlying resistance evolution; (C) determine whether adaptation to AMP and GEN promotes distinct patterns of cross-resistance that could compromise the efficacy of other clinically relevant antimicrobials; (D) assess whether AMR acquisition imposes growth performance costs; and (E) evaluate whether resistance acquisition alters susceptibility to amoebal predation by Dictyostelium discoideum as a proxy for host–pathogen interactions.
2. Materials and Methods
2.1. Microorganisms and Growth Conditions
For this study, Salmonella enterica subsp. enterica serovar Typhimurium str. LT2 from the Spanish Type Culture Collection (CECT 722) was selected as the parental strain (SeT). This strain is widely used in molecular studies due to its well-characterized and extensively annotated genome [24]. Throughout the study, all strains were stored at −80 °C in cryovials containing glycerol (20%, v/v). For routine use, cultures were obtained by weekly streaking onto tryptone soya agar (Oxoid, Basingstoke, UK) supplemented with 6 g/L yeast extract (Oxoid; TSAYE). Working bacterial cultures were prepared following the standard procedure detailed in our previous studies [22,25]. Bacterial counts were verified by dilution in phosphate-buffered saline (Sigma-Aldrich, Steinheim, Germany; PBS) and spread-plating on TSAYE.
2.2. Minimum Inhibitory Concentration (MIC)
The minimum inhibitory concentration (MIC) of ampicillin (anhydrous, ≥96%; Sigma-Aldrich, Saint Louis, MO, USA; AMP) and gentamicin sulphate (Sigma-Aldrich; GEN), was determined by the broth microdilution method in cation-adjusted Mueller Hinton broth (Sigma-Aldrich; MHB), following CLSI guidelines [26]. Briefly, stock solutions were prepared at 1280 μg/mL for AMP and 640 μg/mL for GEN. Two-fold serial dilutions of each antibiotic were distributed into 96-well microplates to a final volume of 100 μL per well, resulting in final tested concentrations ranging from 128 to 0.06 μg/mL for AMP and from 64 to 0.03 μg/mL for GEN, respectively. Each microplate included inoculated antibiotic-free wells as growth control and non-inoculated wells with each antibiotic concentration as negative controls. After inoculation, microplates were incubated for 20 h, and bacterial growth was quantified by measuring optical density at 595 nm (OD595) using a microplate reader (Genios, Tecan, Männedorf, Switzerland), after subtracting the absorbance of the corresponding negative control. The MIC was defined objectively from these readings as the lowest concentration reducing OD595 by at least 90% relative to the antibiotic-free growth control [13]. MIC values obtained by this method were used for MIC quantification and susceptibility classification throughout the study.
2.3. Adaptive Laboratory Evolution (ALE) Experiments: Assay A and Assay B
Antibiotic-resistant variants (RVs) were obtained from SeT through two adaptive laboratory evolution (ALE) approaches using either AMP or GEN (Figure 1).
Figure 1.
Experimental design for resistant variant generation using two adaptive evolution assays. (A) Assay A (constant subinhibitory antibiotic exposure) and (B) Assay B (stepwise increasing antibiotic exposure). Both assays were initiated from the Salmonella Typhimurium LT2 parental strain (SeT). Assay A was conducted for 13 exposure cycles, whereas Assay B followed a predefined concentration scheme starting at 0.085× MIC and increasing 1.85-fold per cycle up to approximately 40× MIC (cycle 11). Three evolution lines were conducted in Assay A, and five in Assay B. MIC: minimum inhibitory concentration.
Both assays were initiated from overnight subcultures (Section 2.1), which were diluted 1:1000 in 50 mL of fresh MHB and incubated at 37 °C with shaking at 130 rpm for 3.5 h to obtain actively growing populations. Following this pre-enrichment step, cultures were transferred to test tubes containing 5 mL of MHB supplemented with the corresponding antibiotic concentration. In Assay A, three independent lineages were propagated in parallel for each antibiotic (AMP or GEN), with daily exposure to a constant subinhibitory concentration equivalent to 0.5× MIC of SeT, following an approach adapted from previous studies [10,13]. In Assay B, five independent lineages per antibiotic were subjected to a stepwise-increasing antibiotic gradient, following previously described approaches [8,9,22]. The number of lineages was increased with respect to Assay A to capture the greater heterogeneity expected between lineages under stepwise increasing exposure. The initial antibiotic concentration was set at 0.085× the parental MIC and increased daily by a factor of 1.85×. As the MIC of SeT was 1 μg/mL for both antibiotics, the resulting concentrations were 0.085, 0.16, 0.29, 0.54, 1.00, 1.85, 3.42, 6.33, 11.71, 21.67, and 40 µg/mL for cycles 1 to 11, respectively, following the scheme previously applied [5,22]. In both assays, each exposure cycle was initiated by transferring an aliquot of the preceding culture into fresh MHB containing the appropriate antibiotic concentration at an approximate dilution of 1:1000, yielding an initial bacterial population of approximately 106 colony-forming units per milliliter (CFU/mL). Each exposure cycle consisted of incubation at 37 °C with shaking at 130 rpm for 24 h. The number of generations was estimated for each lineage from the increase in bacterial population during each exposure cycle, based on viable counts for Assay A and OD595 measurements for Assay B.
After each daily exposure step, aliquots from all lineages were taken and mixed with glycerol (20%, v/v) for storage at −80 °C. Evolutionary dynamics were monitored after each exposure cycle: in Assay A, cultures were plated on selective and non-selective Mueller-Hinton agar (MHA), where selective plates were supplemented with the MIC of the selective antibiotic, allowing enumeration of the antibiotic-resistant subpopulation. In Assay B, bacterial growth was assessed by measuring OD595 after each exposure cycle and comparing it with the antibiotic-free control.
In Assay A, a lineage was considered ready for variant isolation at the first exposure cycle in which the log10 viable count on selective medium reached at least 95% of the log10 count on non-selective medium. In Assay B, the equivalent criterion was the first exposure cycle showing ≥95% growth inhibition based on OD595. One colony was randomly selected from each lineage for subsequent analyses, with isolation deferred to the following exposure cycle when multiple lineages reached the threshold simultaneously to capture heterogeneity. Evolved strains were randomly selected from individual colonies from every lineage and designated according to the selecting antibiotic, assay, and lineage number (e.g., SeTAMP-A1 for AMP-RV from Assay A lineage 1). MICs of all evolved strains were then determined and compared with SeT to determine resistance increases and determine whether they exceed clinical breakpoints [26,27]. Parallel domestication controls were previously conducted [22] to account for adaptation to the growth medium, consisting of five additional lineages propagated in antibiotic-free MHB for eleven exposure cycles and subjected to whole-genome sequencing.
2.4. Whole-Genome Sequencing and Mutation Identification
DNA extraction, whole-genome sequencing (WGS) and bioinformatic analyses were conducted as detailed elsewhere [22]. Briefly, genomic DNA was extracted from SeT and its RVs using the DNeasy Blood & Tissue Kit (Qiagen, Hilden, Germany), and subjected to whole-genome sequencing using the Illumina NovaSeq 6000 platform (PE150; Novogene, Cambridge, UK). Raw reads were quality-filtered with fastp (v0.20.0), and the resulting high-quality reads from both SeT and the RVs were mapped against the Salmonella enterica serovar Typhimurium LT2 reference genome (NCBI Reference Sequence: NC_003197.2) using the Burrows-Wheeler Aligner (v0.7.17), after duplicate removal with Picard (v2.18.9-2). Variant calling and annotation were performed by Novogene. SNVs and InDels of up to 50 bp were called with GATK, structural variants larger than 50 bp with BreakDancer (v1.4.4), and copy-number variations with CNVnator (v0.3), and all variants were annotated with ANNOVAR (2015Mar22). Reported variants were systematically compared across the RVs and SeT to distinguish mutations associated with antibiotic adaptation from pre-existing differences relative to the reference genome. Sequencing metrics for the RVs, including read depth and genome coverage, are summarized in Table S1. Sequences of genomic regions containing selected variants were aligned and compared using BioEdit software (v.7.2.5) [28]. All mutations of interest were further inspected manually using the Integrative Genomics Viewer software (IGV, v.2.14.1; Broad Institute, Cambridge, MA, USA). Mutations showing ambiguous nucleotide calls in the WGS data were further validated by Sanger sequencing using the primers listed in Table S2, whereas all remaining variants were present in essentially all reads at the corresponding position. Raw sequencing data of the RVs were deposited in the NCBI Sequence Read Archive (BioProject ID: PRJNA1539015). The BioSample accession numbers are listed as follows: SeT (SAMN63983448), SeTAMP-A1 (SAMN63983449), SeTAMP-A2 (SAMN63983450), SeTAMP-A3 (SAMN63983451), SeTGEN-A1 (SAMN63983452), SeTGEN-A2 (SAMN63983453), SeTGEN-A3 (SAMN63983454), SeTAMP-B1 (SAMN63983455), SeTAMP-B2 (SAMN63983456), SeTAMP-B3 (SAMN63983457), SeTAMP-B4 (SAMN63983458), SeTAMP-B5 (SAMN63983459), SeTGEN-B1 (SAMN63983460), SeTGEN-B2 (SAMN63983461), SeTGEN-B3 (SAMN63983462), SeTGEN-B4 (SAMN63983463), and SeTGEN-B5 (SAMN63983464).
To facilitate the visualization of mutational patterns across experimental conditions, mutated genes in the evolved variants were grouped according to their biological function. Each mutated gene was manually assigned, based on its KEGG (Kyoto Encyclopedia of Genes and Genomes) annotation, to one of five simplified functional categories: Genome, Transport, Regulation, Envelope, and Metabolism. Genes suitable for more than one category were assigned according to their primary function. This grouping is therefore a simplification intended for visualization purposes only.
2.5. Determination of Cross-Resistance Patterns by VITEK 2 System
The VITEK 2 Compact system (bioMérieux, Marcy-l’Étoile, France) was used as a phenotypic screening tool to characterize cross-resistance patterns in SeT and its RVs, as previously applied to other antibiotic-RVs [5,25].
Fresh colonies grown at 37 °C on TSAYE for 24 h were suspended in sterile saline and adjusted to 0.5 McFarland turbidity according to manufacturer’s instructions. Suspensions were used to inoculate AST-GN96 cards, specifically conceived for clinically significant aerobic Gram-negative bacilli. Cards were incubated and automatically monitored until completion of the analysis, following the manufacturer’s recommended incubation time (10–18 h). In the present study, analysis times ranged from 10.88 to 17.95 h. A total of 15 antimicrobial agents were evaluated: ampicillin (AMP), amoxicillin/clavulanic acid (AMC), cephalothin (CEF), cefoperazone (CFP), ceftiofur (EFT), cefquinome (CEQ), imipenem (IPM), gentamicin (GEN), neomycin (NEO), flumequine (FLU), enrofloxacin (ENR), marbofloxacin (MAR), tetracycline (TET), florfenicol (FFC), and trimethoprim/sulfamethoxazole (SXT).
Raw MIC values were interpreted as Resistant (R), Intermediate (I), or Susceptible (S) according to CLSI M100 breakpoints for Enterobacterales [26]. For agents without such breakpoints (CEF, CFP, EFT, CEQ, NEO, FLU, ENR, MAR and FFC), the category assigned by the system software (CLSI + Natural Resistance parameter set) was retained. Because aminoglycosides and first- and second-generation cephalosporins may appear active in vitro against Salmonella spp. without being clinically effective [26], Susceptible results for GEN, NEO and CEF were not taken as clinical susceptibility.
2.6. Growth Kinetics and Relative Performance Evaluation
We characterized the growth kinetics of SeT and the evolved strains as previously assessed [19], with minor adjustments. Briefly, sterile 96-well microplates were inoculated from working bacterial cultures (Section 2.1) to an initial concentration of approximately 3 × 10⁵ CFU/mL in a final volume of 200 μL of fresh TSBYE per well. Plates were sealed with a transparent adhesive film to minimize evaporation, and subsequently pierced with sterile needles to facilitate gas exchange and prevent condensation during incubation.
Plates were incubated under controlled conditions (37 °C, intermittent shaking) in a microplate reader (Genios, Tecan, Männedorf, Switzerland), and OD595 was recorded every 15 min. OD595 values at time 0, corresponding to the absorbance of uninoculated medium, were subtracted from subsequent measurements.
Growth curves were graphically represented from OD595 data and fitted to the modified Gompertz equation (Equation (1), as previously described [29]:
where y represents OD595 at time t (h), A the asymptotic increase in OD595 above the initial absorbance (i.e., difference between upper asymptote and baseline), μmax the maximum OD595 increase rate (OD595/h), and λ the lag phase (i.e., time to detection) duration (h).
Model fitting and estimation of kinetic parameters (A, μmax, and λ) were performed by least-squares regression using GraphPad Prism (GraphPad Software, San Diego, CA, USA). Given the objectives of the study, only λ and μmax were considered for comparative analyses, as these parameters directly describe lag phase duration and maximum growth rate. Furthermore, A is more strongly influenced by stationary-phase variability and the inherent limitations of optical density measurements at high cell densities. Goodness of fit was expressed using the coefficient of determination (R2) and the root mean square error (RMSE). Growth curves were fitted independently for each biological replicate using the modified Gompertz model. Growth parameters were estimated separately for each replicate and subsequently used to calculate mean values and standard deviations and to perform statistical comparisons between strains.
2.7. Dictyostelium discoideum Phagocytosis Model
Virulence-associated phenotypes were evaluated using Dictyostelium discoideum as a surrogate phagocytic model, which shares conserved mechanisms of bacterial uptake and killing with professional phagocytes [20,21].
To assess susceptibility to amoebal predation, we performed an adapted version of the Dictyostelium discoideum plaque formation assay previously described [30]. D. discoideum AX2 cells were first propagated for 2–3 days at 22 °C on SM/5 agar plates (Formedium, Hunstanton, UK) spread with a lawn of E. coli B/r, as described in DictyBase protocols with minor modifications [31,32]. Amoebae were harvested, washed twice with KK2 phosphate buffer and adjusted to 2 × 10⁷ cells/mL using a Countess III automated cell counter (Thermo Fisher Scientific, Waltham, MA, USA). Ten-fold dilutions were then prepared in KK2 phosphate buffer.
Bacterial lawns were prepared on SM/5 agar plates by spreading 100 µL of overnight bacterial cultures, previously washed with KK2 phosphate buffer and adjusted to an OD600 of 2.0. The suspension was allowed to soak into the plates for an hour. Then, 5 µL of the D. discoideum dilutions were spotted onto sectors of the plate, resulting in spots with 105–100 amoebae each. Plates were incubated upright at 22 °C for 5 days and photographed every 24 h using a digital camera mounted on a fixed stand under controlled lighting conditions.
Phagocytic plaque development was quantified from digital images using Fiji (ImageJ, National Institutes of Health, Bethesda, MD, USA; v1.54p). Images were spatially calibrated using a reference distance of known length included in each image. Plaque diameter was measured across the widest point using the line tool and automatically converted to centimeters after calibration. Only plaques with clearly defined boundaries and diameters ≤3 cm were included in the analysis. Representative plaque images are provided in Figures S2–S5.
2.8. Statistical Analysis
Statistical analyses and graph construction were performed using GraphPad Prism (v8.4.2; GraphPad Software, San Diego, CA, USA) and R (v4.3.1; R Foundation for Statistical Computing, Vienna, Austria). MIC values were expressed as the modal concentration and observed range across five independent replicates. Growth parameters and phagocytic plaque measurements, obtained from at least three independent biological replicates, were analyzed using one-way ANOVA followed by Tukey’s and Dunnett’s multiple-comparisons tests, respectively, with SeT as the reference for the latter. To compare growth parameters between selecting antibiotics and between evolution assays, λ and μmax were additionally analyzed by two-way ANOVA with antibiotic (AMP, GEN) and assay (Assay A and Assay B) as factors, using the mean value of each evolved strain as a single data point. When the interaction was significant, assays were compared within each antibiotic by unpaired t-tests. Differences were considered statistically significant when p ≤ 0.05.
3. Results
3.1. Progressive Adaptation Under Ampicillin Selection Contrasts with Constrained Adaptation to Gentamicin
Throughout the evolution process toward resistance, lineage progression was monitored after each exposure cycle by quantifying either the viable counts on selective and non-selective media in Assay A, or the relative OD595 compared with antibiotic-free control in Assay B (Figure 2).
Figure 2.
Lineage progression during adaptive laboratory evolution under ampicillin (AMP) and gentamicin (GEN) selection across successive exposure cycles. (A) Assay A (constant subinhibitory antibiotic exposure), expressed as the log10 viable counts on selective medium of each evolving population in AMP (AMP-A1 to AMP-A3) and GEN (GEN-A1 to GEN-A3) evolutionary lineages, with the grey band showing the range of the corresponding counts on non-selective medium. (B) Assay B (stepwise increasing antibiotic exposure), expressed as the relative OD595 of each evolving population compared with the corresponding antibiotic-free control in AMP (AMP-B1 to AMP-B5) and GEN (GEN-B1 to GEN-B5) evolutionary lineages. Symbols indicate the cycle at which a resistant variant was isolated from each lineage. The horizontal dashed line in (B) marks the corresponding selection threshold. Different colors represent independent evolutionary lineages within each antibiotic group.
In Assay A (Figure 2A), AMP evolution lines showed a progressive increase in the resistant counts across successive cycles, whereas the GEN ones displayed a markedly sharper transition toward resistance. All GEN lineages reached the predefined isolation threshold between cycles 3 and 5 (cycle 4 for GEN-A1, cycle 5 for GEN-A2, and cycle 3 for GEN-A3). In contrast, AMP lineages required substantially more cycles before a resistant variant could be isolated (cycle 11 for AMP-A1, cycle 12 for AMP-A2, and cycle 9 for AMP-A3). In Assay B (Figure 2B), AMP lineages generally sustained detectable growth over more selection cycles than GEN lineages. AMP-B1 to AMP-B4 reached the maximum scheduled cycle (cycle 11; 40× MIC), whereas AMP-B5 reached cycle 9. By contrast, GEN lineages ceased growth at earlier stages: GEN-B1 and GEN-B3 reached cycle 9 (~11.7× MIC), while GEN-B2, GEN-B4 and GEN-B5 terminated at cycle 7 (~3.5× MIC).
In Assay A, AMP-A1, AMP-A2, and AMP-A3 underwent ~110, 120, and 90 generations, respectively, compared with ~40, 50, and 30 for GEN-A1, GEN-A2, and GEN-A3 (≈10 generations per cycle). In Assay B, AMP-B1 to AMP-B4 underwent ~100 generations and AMP-B5 ~90, while GEN-B1 and GEN-B3 underwent ~90 and GEN-B2, GEN-B4, and GEN-B5 ~70 generations.
Overall, the two ALE approaches revealed contrasting adaptive dynamics under the two antibiotic selection regimes. Under the fixed-concentration conditions of Assay A, GEN lineages reached the predefined resistance-isolation threshold earlier than AMP lineages. In contrast, under the stepwise concentration-increase conditions of Assay B, AMP lineages generally sustained growth over more selection cycles than GEN lineages.
3.2. Ampicillin Adaptation Results in Stronger Resistance Increases than Gentamicin
To further evaluate the adaptive outcomes of both ALE approaches, MIC fold changes relative to SeT were compared across all evolution lines, using one random resistant isolate per lineage (Figure 3).
Figure 3.
Relative changes and minimum inhibitory concentration (MIC) of resistant variants (RVs) compared with Salmonella Typhimurium LT2 parental strain (SeT). MIC values were determined by broth microdilution for (A) Ampicillin-selected RVs (AMP; SeTAMP-A1-SeTAMP-A3 and SeTAMP-B1-SeTAMP-B5), and (B) gentamicin-selected RVs (GEN; SeTGEN-A1-SeTGEN-A3 and SeTGEN-B1-SeTGEN-B5). The left y-axis shows the log2-transformed MIC fold change relative to SeT, whereas the right y-axis indicates the corresponding absolute MIC values (µg/mL) for the selecting antibiotic on a log2 (2-fold dilution) scale. Background colors indicate CLSI susceptibility breakpoints for Susceptible (green) and Resistant (red) categories. Intermediate category is indicated by a dotted line (yellow). Within each panel, RVs derived from Assay A and Assay B are separated by a vertical line.
Under constant antibiotic exposure (Assay A), AMP- and GEN-RVs displayed comparable resistance increases, with AMP-RVs showing 1 to 2 log2-fold increases (2- to 4-fold MIC increases) and GEN-RVs showing 2 to 3 log2-fold increases (4- to 8-fold MIC increases) relative to SeT. In contrast, clear differences emerged under increasing antibiotic exposure (Assay B), where AMP-RVs exhibited markedly greater MIC increases, from 4 to 7 log2-fold (16- to 128-fold MIC increases), than GEN-RVs, which remained within a range of 2 to 4 log2-fold (4- to 16-fold MIC increases). Detailed MIC values, including the mode and range across replicates and the corresponding susceptibility interpretation, are provided in Table S3.
Overall, both selection regimes allowed generation and isolation of RVs, although their MIC distributions differed by antibiotic: AMP-RVs reached markedly higher MIC values under stepwise increasing exposure, whereas GEN-RVs showed smaller differences between constant and increasing antibiotic exposure.
3.3. Ampicillin and Gentamicin Resistance Involve Distinct Mutations and Functional Targets
Following phenotypic characterization, WGS was performed to elucidate the genetic basis of the RVs. As detailed in Table 1, the RVs carried multiple spontaneous single-nucleotide variants (SNVs) and insertions/deletions (InDels).
Table 1.
Genetic variations detected by whole-genome sequencing in ampicillin (AMP)- and gentamicin (GEN)-resistant variants (RVs) relative to the Salmonella Typhimurium LT2 parental strain (SeT). RVs were generated through adaptive laboratory evolution under constant subinhibitory antibiotic exposure (Assay A; SeTAMP-A1-SeTAMP-A3; SeTGEN-A1-SeTGEN-A3) or stepwise increasing antibiotic exposure (Assay B; SeTAMP-B1-SeTAMP-B5; SeTGEN-B1-SeTGEN-B5).
To facilitate the interpretation of the mutational profiles, all mutated genes were compiled into a color-coded matrix and grouped according to their predicted biological functions (Figure 4). This representation summarizes the distribution of mutations across the different RVs, allowing the identification of recurrent mutational targets and functional categories associated with each antibiotic and adaptive evolution assay.
Figure 4.
Functional classification of mutations identified in ampicillin (AMP)- and gentamicin (GEN)-resistant variants (RVs). AMP-RVs (SeTAMP-A1-SeTAMP-A3; SeTAMP-B1-SeTAMP-B5) and GEN-RVs (SeTGEN-A1-SeTGEN-A3; SeTGEN-B1-SeTGEN-B5) were grouped according to their biological functions. Mutated genes were manually assigned, based on KEGG annotations, to one of five simplified functional categories: Genome, Transport, Regulation, Envelope, and Metabolism. Colored dots indicate the presence of a mutation in the corresponding RV. Two dots within the same box indicate the presence of two mutations in the same gene. This grouping is a simplification intended for visualization purposes only.
Given the different numbers of lineages sequenced in Assay A and Assay B, mutation recurrence was interpreted in the context of the number of lineages analysed in each assay. Additionally, each lineage experienced a different number of generations before it reached the threshold for sequencing an RV. AMP lineages underwent approximately 90–120 generations in Assay A and 90–100 generations in Assay B, whereas GEN lineages underwent approximately 30–50 and 70–90 generations, respectively. The mutational landscape differed markedly between antibiotics and experimental approaches. Under AMP selection, mutations predominantly affected genes involved in transport, envelope structure, and gene regulation. Assay A RVs carried only two mutations per strain, with acrB and gyrB each mutated in two of three RVs (67%). In contrast, Assay B RVs accumulated three to six mutations per strain and showed greater convergence, with acrB and ramR mutated in all five RVs (100%), alongside mutations in several envelope-associated genes. These results indicate convergence towards efflux regulation and cell envelope remodeling under AMP selection, particularly in Assay B.
In contrast, GEN selection showed a distinct profile dominated by genes associated with energy metabolism. Assay A RVs carried a single mutation each, affecting either respiratory metabolism (cydA/cydB; 2/3, 67%) or atpG (1/3, 33%). Assay B RVs accumulated one to five mutations, with recurrent alterations mainly affecting heme biosynthesis (hemL/hemB; 3/5, 60%) and respiratory metabolism (cydA; 2/5, 40%). Other mutations occurred only in individual lineages. Thus, convergence under GEN selection was less pronounced than under AMP and was mainly associated with energy metabolism. None of the genes mutated in the RVs matched with those previously detected in the domestication controls performed under the same conditions [22], which were restricted to O-antigen biosynthesis, suggesting that the mutations reported here are unlikely to reflect adaptation to the growth medium.
3.4. Broader Cross-Resistance Patterns Under Ampicillin Selection than with Gentamicin
The acquisition of resistance to one antibiotic often has consequences on the susceptibility to other antibiotics. This can be through either direct (e.g., target-related) or indirect (e.g., efflux overexpression or changes in physiology) routes, resulting in increased susceptibility (cross-sensitivity) or decreased susceptibility (cross-resistance) [33]. Antibiotic susceptibility profiles of AMP- and GEN-RVs relative to SeT are summarized in Figure 5.
Figure 5.
Cross-resistance patterns determined by the VITEK 2 system in ampicillin (AMP)- and gentamicin (GEN)-resistant variants (RVs) relative to the Salmonella Typhimurium LT2 parental strain (SeT). AMP-RVs (SeTAMP-A1-SeTAMP-A3; SeTAMP-B1-SeTAMP-B5) and GEN-RVs (SeTGEN-A1-SeTGEN-A3; SeTGEN-B1-SeTGEN-B5) are shown on the horizontal axis, and the tested antibiotics on the vertical axis. Susceptibility categories follow CLSI M100 Enterobacterales breakpoints applied to VITEK 2 minimum inhibitory concentrations (MIC) values. Asterisks (*) mark agents lacking such breakpoints, for which the VITEK 2 category (CLSI + Natural Resistance parameter set) is shown. As aminoglycosides and first- and second-generation cephalosporins may appear active in vitro against Salmonella spp. without clinical efficacy [26], susceptible results for GEN, NEO and CEF do not imply clinical susceptibility (CEF is therefore reported as R regardless of MIC). Numbers indicate the MIC values (μg/mL) reported by the VITEK 2 system, and the colour indicates the susceptibility category assigned. Values falling outside the concentration range of the AST-GN96 card are reported as below or above the corresponding panel limit.
In Assay A, both AMP- and GEN-RVs showed relatively limited changes in susceptibility, with modest increases mainly restricted to the selecting antibiotic and a few additional compounds. In contrast, Assay B produced more pronounced resistance phenotypes, particularly among AMP-RVs, which showed increased MICs to multiple β-lactams as well as tetracycline and, in most cases, florfenicol. Notably, SeTAMP-B5, which displayed the lowest MIC to AMP among Assay B AMP-RVs, also showed the least extensive cross-resistance profile. Conversely, GEN-RVs from Assay B exhibited a more restricted phenotype, with increased resistance largely confined to GEN and susceptibility to most other antibiotic families remaining similar to SeT.
MIC values determined by broth microdilution were consistent with those previously obtained with the VITEK 2 system. For AMP, both methods agreed in all strains except SeTAMP-A3, which differed by a single two-fold dilution. For GEN, the VITEK 2 system returned equal or lower values, differing by one two-fold dilution in SeTGEN-A1, SeTGEN-B4 and SeTGEN-B5, and by two dilutions in SeTGEN-A2 and SeTGEN-B2. These deviations fall within the variability expected between methods that differ in medium, inoculum, incubation time and read-out criteria, and broth microdilution was taken as the reference throughout the study.
3.5. Ampicillin and Gentamicin Resistance Acquisition Differentially Affects Growth Performance
To further characterize the phenotypic consequences of AMP and GEN resistance, growth kinetics at 37 °C were generated and compared with that of SeT to assess the growth performance of the evolved variants (Figure 6).
Figure 6.
Growth curves of the Salmonella Typhimurium LT2 parental strain (SeT) and its ampicillin (AMP)- and gentamicin (GEN)-resistant variants (RVs) in TSBYE at 37 °C. Curves correspond to (A) AMP-RVs obtained under constant subinhibitory antibiotic exposure (Assay A; SeTAMP-A1-SeTAMP-A3), (B) AMP-RVs obtained under stepwise increasing antibiotic exposure (Assay B; SeTAMP-B1-SeTAMP-B5), (C) GEN-RVs obtained under Assay A (SeTGEN-A1-SeTGEN-A3), and (D) GEN-RVs obtained under Assay B (SeTGEN-B1-SeTGEN-B5). Optical density was measured at 595 nm (OD595). Results are expressed as mean ± standard deviation of at least three replicates, and growth curves were fitted to the modified Gompertz equation (Equation (1)). MIC, minimum inhibitory concentration.
To ensure consistency, growth parameters were derived by fitting the experimental data of each strain to the modified Gompertz model (Equation (1)) and are summarized in Table S4, revealing distinct patterns depending on the selecting antibiotic and evolution regime. The high R2 (0.995–0.999) and low RMSE (0.007–0.020) indicated a good fit of the modified Gompertz model to the experimental data.
Under Assay A conditions, AMP-RVs showed lower max growth rate (μmax) compared to SeT (0.290–0.323 vs. 0.408; p < 0.05), while lag time (λ) remained unchanged (p > 0.05). In contrast, GEN-RVs exhibited a marked increase in λ values (~5.1–5.7 h vs. ~3.5 h in SeT; p < 0.05), accompanied by moderate changes in μmax (p < 0.05 for SeTGEN-A1 and SeTGEN-A3).
Under Assay B conditions, AMP-RVs showed moderate variability in both λ and μmax values. While most variants displayed μmax values comparable to SeT, SeTAMP-B2 showed a significant reduction and SeTAMP-B5 exhibited the lowest μmax among all strains (p < 0.05). λ values did not differ significantly from SeT for any AMP-RVs (p > 0.05), although significant differences were detected among the variants. In contrast, all GEN-RVs from Assay B exhibited λ values higher than SeT (~4.0-4.6 h vs. ~3.5 h; p < 0.05) but were, interestingly, consistently lower than those observed under Assay A (p < 0.05). μmax values showed moderate variation, with most GEN-RVs displaying values comparable to SeT, while SeTGEN-B1, SeTGEN-B3 and SeTGEN-B4 showed significantly lower μmax (p < 0.05).
Growth parameters were also compared between antibiotics and between evolution assays using the means of each strain as a single datapoint. λ was affected by the selecting antibiotic, by the evolution Assay And by their interaction (p < 0.05 in all cases). GEN-RVs obtained under Assay A showed longer lag phases than those obtained under Assay B (5.36 ± 0.35 h vs. 4.31 ± 0.21 h, p < 0.05). AMP-RVs did not differ between assays (p > 0.05). In contrast, μmax was not affected by the antibiotic, the assay or their interaction (p > 0.05).
Overall, the impact of resistance acquisition on growth-associated parameters was variable among variants and depended on both the antibiotic and the selection regime. In AMP-RVs, lag phase duration generally remained similar to that of SeT, whereas changes in μmax were more strain-dependent, with significant reductions observed in all Assay A variants and in SeTAMP-B5. In contrast, GEN-RVs showed a more consistent alteration of growth kinetics, mainly reflected in prolonged lag phases, with this effect being more pronounced under constant antibiotic exposure (Assay A). The most pronounced reduction in μmax was observed in SeTAMP-B5, which carried a unique mutation in rfaI. Similarly, SeTGEN-A3 showed the longest lag phase and a reduced μmax, and carried a unique mutation in atpG. Additionally, small-colony morphologies were observed among GEN-RVs (Figure S1), consistent with a small-colony variant (SCV)-like phenotype.
3.6. Delayed Plaque Expansion in a Gentamicin-Resistant Variant During Amoebal Predation
Based on the above outcomes, only RVs obtained under the increasing antibiotic exposure regime (Assay B) were selected for further phenotypic characterization against D. discoideum amoebal predation (Figure 7). Ten-fold dilutions of amoebae were spotted on lawns of the RVs and feeding plaque expansion was recorded over time. Representative images are provided in Figures S2–S5.
Figure 7.
Susceptibility of the Salmonella Typhimurium LT2 parental strain (SeT) and its resistant variants (RVs) obtained under stepwise increasing antibiotic exposure conditions (Assay B) with ampicillin (AMP) and gentamicin (GEN) to predation by Dictyostelium discoideum (2 × 10⁷ cells/mL). Plaque diameters were measured after 24, 48, 72, 96 and 120 h of incubation for (A) AMP-RVs (SeTAMP-B1-SeTAMP-B5); and (B) GEN-RVs (SeTGEN-B1-SeTGEN-B5). Plaque diameter was used as an indicator of amoebal predation and bacterial susceptibility. The dashed horizontal line indicates the upper quantification limit of the assay (3.0 cm). Values are expressed as mean ± standard deviation.
AMP-RVs displayed plaque expansion dynamics largely comparable to those of SeT throughout the experiment. Although minor differences were observed at individual sampling times, none of the quantifiable comparisons differed significantly from SeT (p > 0.05), and all RVs followed a similar progression, reaching the upper limit of quantification (3.0 cm) by 96–120 h. No relevant alterations in susceptibility to amoebal predation were observed among AMP-RVs.
Similarly, most GEN-RVs exhibited plaque diameters comparable to those of SeT, with no significant differences detected at quantifiable time points (p > 0.05). However, SeTGEN-B1 displayed a distinct phenotype, showing moderately smaller plaques from 96 h onwards. At 96 h, plaque diameter reached approximately 2.0 cm in SeTGEN-B1 compared with >3.0 cm in SeT and the remaining GEN-RVs, which had already reached the quantification limit. Additionally, fruiting body formation, used as an indicator of amoeba growth and development, was markedly delayed in SeTGEN-B1. Together, these results indicate that the acquisition of AMP resistance had little effect on susceptibility to amoebal predation, whereas adaptation to GEN generated strain-specific phenotypes, overall showing no alteration. However, SeTGEN-B1 appeared less susceptible to amoebal predation, suggesting a moderately enhanced ability to withstand phagocytic pressure under the conditions tested, although this difference could not be statistically confirmed at quantifiable time points.
4. Discussion
During the last decades, AMR in bacterial pathogens has attracted increasing attention from a food safety perspective, as the consequences of resistance acquisition often extend beyond antibiotic treatment failure. For instance, AMR-associated mutations have been linked to alterations in virulence, biofilm-forming ability and overall metabolic state, although these effects are heterogeneous and may result in increased, reduced or unaltered phenotypes [4,34,35]. Furthermore, increasing evidence suggests that AMR acquisition can also confer cross-protection against microbial control strategies used throughout the food chain. To date, such phenomena have been described in RVs to phleomycin [36], ciprofloxacin [18,37], meropenem [25], colistin, erythromycin, and amoxicillin [5].
To evaluate the adaptive potential of both antibiotics, we compared the levels of resistance achieved under the ALE strategies (Figure 3). In a similar study [38], fixed sublethal and progressively increasing antibiotic exposures were compared, showing that adaptation occurred under both regimes, while progressively increasing concentrations allowed populations to reach very high resistance levels (20- to 128-fold MIC increases) and were associated with a greater accumulation of mutations. Consistent with this, the stepwise increasing regimen (Assay B) consistently promoted greater resistance increases than constant subinhibitory exposure (Assay A) in the present study. The main genetic and phenotypic outcomes associated with both evolutionary regimes are summarized in Figure 8.
Figure 8.
Schematic summary of the main genetic and phenotypic outcomes associated with ampicillin (AMP) and gentamicin (GEN) resistance evolution under the two adaptive laboratory evolution regimes. Assay A represents constant subinhibitory antibiotic exposure, whereas Assay B represents stepwise increasing antibiotic exposure. The scheme summarizes the predominant functional categories associated with the genes in which mutations were identified and the main phenotypic outcomes observed for each condition, including maximum increases in the minimum inhibitory concentration (MIC) values, cross-resistance profile, growth performance, and susceptibility to D. discoideum predation.
Beyond the effect of the evolution regime, the magnitude of resistance acquisition also differed markedly between antibiotics, with AMP selecting for substantially higher resistance levels than GEN. These differences are broadly consistent with previous ALE studies conducted in Salmonella. A previous study [5] reported MIC increases of up to 16-fold in amoxicillin-RVs, with only one isolate surpassing CLSI resistance breakpoints, a different pattern to that observed here for AMP-RVs generated under similar conditions (i.e., increasing antibiotic exposure), but with another β-lactam. Likewise, colistin- and erythromycin-RVs obtained under comparable selection conditions exhibited MIC increases ranging from 4- to 8-fold, whereas ciprofloxacin-RVs from a similar ALE assay [22] frequently achieved substantially higher resistance levels, with most isolates exceeding clinical breakpoints by a considerable margin. Collectively, these findings suggest that the magnitude of resistance acquisition may differ markedly among antibiotic families and that the ability to reach clinically relevant resistance levels is strongly influenced by the specific resistance mechanisms available during adaptation. The contrasting outcomes observed here suggest that resistance evolution towards AMP may be subjected to fewer evolutionary constraints than resistance evolution towards GEN, allowing the progressive accumulation of adaptive changes and the attainment of substantially higher resistance levels, as reflected by the continued adaptation of AMP populations during ALE compared with the rapid plateau reached by GEN populations (Figure 2).
The mutational profiles identified by WGS (Table 1) were consistent with the resistance phenotypes observed during susceptibility testing. AMP-RVs evolved under increasing antibiotic exposure (Assay B), which exhibited the largest MIC increases (16- to 128-fold), also accumulated the highest mutational burden and showed strong convergence towards mutations affecting the AcrAB-TolC efflux system and its regulation (Figure 4). In particular, the recurrent occurrence of mutations in acrB and ramR suggests that enhanced efflux activity may represent an important adaptive route under AMP selection. Likewise, the repeated targeting of additional envelope-associated genes, including envZ, ftsI, rfaI, tolQ and nlpD, is consistent with the involvement of changes in antibiotic intake, efflux and cell envelope architecture during adaptation. These genes have been implicated in porin regulation, peptidoglycan biosynthesis, lipopolysaccharide assembly and envelope integrity [12,39,40,41,42,43]. Two of the three AMP-RVs obtained under constant exposure also carried mutations in gyrB (Val97Ala and Arg190Cys). Both substitutions lie outside the quinolone resistance-determining region of GyrB [44], and none of these variants showed changes in susceptibility to the quinolone and fluoroquinolones tested (Figure 5). Their contribution to the AMP phenotype therefore remains unclear, although mutations in gyrB may disrupt DNA supercoiling homeostasis and thereby modulate gene expression [3]. In this regard, the MIC increases attained in Assay A were small and similar across variants (2- to 4-fold) and did not track the presence of mutations in gyrB or acrB. However, the mechanistic interpretation of these mutations in the present study should be considered with caution, as neither efflux pump expression or activity nor intracellular antibiotic accumulation was directly evaluated. In contrast, AMP-RVs obtained under constant exposure carried overall fewer mutations and achieved substantially lower MIC increases, suggesting that more limited genetic adaptation was associated with modest resistance gains under stable selective pressure.
A markedly different pattern was observed for GEN-RVs. Despite acquiring resistance levels comparable to or slightly higher than AMP-RVs under Assay A, and lower resistance levels than AMP-RVs under Assay B, GEN-RVs accumulated relatively few mutations (Table 1). Moreover, these mutations predominantly affected genes involved in energy production and central metabolism, including cydA, cydB, atpG, hemL, hemB and ppc (Figure 4). Such mutations are consistent with previous observations showing that aminoglycoside resistance can emerge through metabolic adaptations that reduce respiratory activity, membrane potential and consequently antibiotic uptake, as aminoglycoside transport depends on the proton motive force generated by cellular respiration [45,46]. Notably, several of the affected genes, particularly hemB and hemL, have also been associated with SCV-like phenotypes in different bacterial species [47,48]. SCVs are characterized by impaired electron transport, slow growth, altered metabolism and reduced susceptibility to aminoglycosides [49,50,51]. This interpretation is further supported by the prolonged lag phases (Table S4) and the observation of small-colony morphologies, consistent with an SCV-like phenotype (Figure S1). Additional mutations affecting metabolic functions (malP, ppc), transport (sbmA) and transcriptional regulation (crl), together with an intergenic insertion between the type III secretion system effector genes gogB and sarA/steE in SeTGEN-B5 whose relevance remains unknown, suggest a broader physiological reorganization, potentially involving stringent response-like adaptations that have previously been linked to enhanced tolerance to environmental stresses [52,53].
The distinct evolutionary outcomes among antibiotics likely explain why stepwise increasing exposure produced markedly higher resistance gains for AMP than for GEN. Whereas AMP resistance could be achieved through multiple complementary mechanisms affecting efflux and envelope permeability, GEN resistance appeared to rely on a more restricted set of metabolic adaptations, resulting in lower mutational complexity and smaller increases in MIC. Differences in cumulative generations should also be considered, although AMP and GEN lineages in Assay B underwent broadly comparable evolutionary times (~90–100 and ~70–90 generations, respectively). This pattern is also consistent with previous observations in E. coli, where AMP exposure increased mutant frequency, whereas gentamicin did not produce a significant increase under the same experimental framework [54]. Under the conditions evaluated in this study, AMP populations remained responsive to successive increases in AMP concentration throughout ALE and ultimately achieved substantially higher MIC increases than GEN populations. In contrast, GEN populations ceased to respond to further increases in antibiotic concentration at an earlier stage, reaching an apparent resistance ceiling. Although the relationship between selection regime and mutational burden is not always straightforward [55,56], these findings suggest that progressive antibiotic exposure enabled broader adaptive trajectories during AMP selection than during GEN selection under the experimental conditions tested.
The cross-resistance profiles further supported the distinct adaptive trajectories identified by WGS. While GEN-RVs remained largely susceptible to non-selecting antibiotics, AMP-RVs exhibited broader resistance patterns affecting multiple β-lactams, tetracycline and, in most cases, florfenicol (Figure 5). The extensive cross-resistance of AMP-RVs was accompanied by recurrent mutations in acrB, ramR, and additional alterations affecting cell envelope-associated functions, consistent with possible changes in efflux activity and membrane permeability [57,58,59,60]. Conversely, GEN-RVs predominantly carried mutations affecting energy metabolism and respiratory functions, pathways previously linked to reduced aminoglycoside uptake through alterations in proton motive force [45,46]. This may explain why resistance in GEN-RVs remained largely restricted to the selecting antibiotic. However, neither efflux activity nor respiratory activity, membrane potential or antibiotic uptake were directly evaluated in the present study, so both interpretations remain inferred from the mutational profiles. In addition, most RVs carried several concurrent mutations, so the contribution of individual genes cannot be established from these data.
The contrasting genotypic backgrounds were also reflected in the growth-associated costs of resistance acquisition (Figure 6). AMP-RVs from both evolution regimes showed lag phase durations largely comparable to SeT, whereas μmax was generally reduced, with the most pronounced decrease observed in SeTAMP-B5 (Table S4). Similar observations have been reported for other stress-resistant S. Typhimurium variants, in which increased resistance was associated with relatively minor changes in growth parameters [5,19].
In contrast, GEN-RVs consistently exhibited prolonged lag phases, particularly those evolved under constant antibiotic exposure, indicating a greater physiological cost associated with adaptation. This phenotype is consistent with the mutational profiles identified by WGS, which predominantly affected genes involved in respiration and central metabolism. As discussed previously, these mutational profiles are compatible with SCV-like metabolic adaptations [47,48,49,50,51]. This interpretation is supported by colony morphology and lag phase duration, and was not confirmed by respiratory or membrane potential measurements. Interestingly, GEN-RVs evolved under increasing antibiotic concentrations (Assay B) exhibited shorter lag phases than those obtained under constant exposure, suggesting that the genetic adaptations selected under the two evolutionary regimes imposed different physiological costs. Together, these results indicate that AMP resistance can be acquired with relatively limited growth penalties, whereas GEN resistance appears to involve a more pronounced trade-off between resistance and growth performance.
Given the relevance of SCV-like adaptations in persistence and pathogenicity [61], we further assessed whether resistance acquisition influenced susceptibility to amoebal predation as a proxy for survival against phagocytic cells involved in innate immune defense [30,62]. Most RVs exhibited susceptibility to amoebal predation comparable to that of SeT (Figure 7), suggesting that the acquisition of AMP or GEN resistance generally did not substantially alter interactions with phagocytic predators. However, SeTGEN-B1 consistently developed smaller plaques than the remaining strains, suggesting a reduced susceptibility to amoebal phagocytosis.
Amoebae, including D. discoideum, share highly conserved mechanisms of bacterial recognition, engulfment and intracellular killing with professional phagocytes, including macrophages, making them useful surrogate models for studying host–pathogen interactions [20,21]. Consequently, increased resistance to amoebal predation may reflect alterations affecting bacterial recognition or intracellular survival following phagocytosis. As previously discussed, SeTGEN-B1 displayed SCV-like traits, a phenotype that has been associated with enhanced persistence during infection, increased tolerance to host defenses and improved survival within biofilms and intracellular environments [63,64]. Although these observations are compatible with the lower susceptibility to amoebal predation observed for SeTGEN-B1, this difference could not be statistically confirmed at the later time point and does not allow conclusions regarding persistence or pathogenic potential in the host. Furthermore, the apparent differences in predation susceptibility may partly reflect growth performance costs associated with resistance acquisition, as slower-growing bacteria can influence plaque development [30]. Nevertheless, this factor is unlikely to fully explain the observed phenotype, since SeTGEN-B1 and SeTGEN-B3 displayed comparable growth parameters (p > 0.05 for lag phase and μmax) but differed markedly in their susceptibility to amoebal predation. Although both variants carried mutations affecting energy metabolism, their distinct mutational backgrounds may also contribute to this phenotypic difference. Therefore, these findings should be regarded as exploratory and require validation using complementary infection models, such as Caenorhabditis elegans and Galleria mellonella [18,65] together with isogenic mutant construction to determine the contribution of the individual mutations [66].
Overall, our results indicate that the broader consequences of AMR acquisition are strongly influenced by both the selecting antibiotic and the evolutionary pathway leading to resistance. Whereas AMP resistance was associated with broad cross-resistance profiles and limited growth performance costs, GEN resistance involved more restricted adaptive trajectories characterized by metabolic trade-offs and occasional persistence-associated traits. Previous studies have similarly shown that the effects of AMR-associated mutations on growth performance, virulence and stress tolerance vary depending on the genetic background and resistance determinant involved [5,19,22]. The acquisition of AMR may therefore have broader implications beyond resistance to the selecting antibiotic, including changes in cross-resistance, growth performance and host-associated phenotypes. Understanding these associated effects across different resistance backgrounds is important for assessing the public health implications of AMR in foodborne pathogens.
5. Conclusions
Resistance evolution in S. Typhimurium differed according to both the selecting antibiotic and the evolutionary regime. Under constant subinhibitory exposure (Assay A), resistance increases remained relatively modest, whereas stepwise increasing exposure (Assay B) promoted higher resistance levels, particularly in AMP-RVs, which reached up to 128-fold increases in MIC to AMP and developed broader cross-resistance profiles. These phenotypic differences were accompanied by distinct mutational patterns: AMP adaptation showed strong convergence involving acrB and ramR, particularly in Assay B, whereas GEN adaptation predominantly affected genes related to respiration and energy metabolism, including cydA/cydB and hemL/hemB. Despite their higher resistance levels and broader cross-resistance, AMP-RVs showed relatively limited growth-associated costs. In contrast, GEN-RVs displayed more pronounced growth alterations, including prolonged lag phases and smaller colony sizes. Most RVs showed amoebal predation comparable to SeT, although one GEN-RV exhibited reduced predation by D. discoideum, suggesting that resistance-associated adaptations may also affect host-related phenotypes, although this observation requires further validation. Overall, these findings indicate that the consequences of AMR acquisition depend on the selecting antibiotic, evolutionary regime and resulting mutational background. Considering cross-resistance, growth performance and host-associated phenotypes alongside resistance levels may therefore provide a more comprehensive understanding of the biological and potential public health implications of AMR evolution in foodborne pathogens.
Supplementary Materials
The following supporting information can be downloaded at: https://www.mdpi.com/article/10.3390/microorganisms14112587/s1, Data S1: raw data for minimum inhibitory concentrations, growth kinetics and plaque diameters. Table S1: Sequencing quality metrics of the Salmonella enterica subsp. enterica serovar Typhimurium LT2 parental strain (SeT) and its ampicillin (AMP)- and gentamicin (GEN)-resistant variants (RVs); Table S2: Specific primers for PCR amplification and Sanger sequencing of the intergenic region between gogB and sarA/steE present in Salmonella enterica subsp.; Table S3: Minimum inhibitory concentrations (MIC, μg/mL) of the parental Salmonella enterica subsp. enterica serovar Typhimurium LT2 strain (SeT) and its ampicillin (AMP)- and gentamicin (GEN)-resistant variants (RVs); Table S4: Parameters of the modified Gompertz equation (Equation (1)) obtained from fitting the experimental growth curves of the parental Salmonella enterica subsp. enterica serovar Typhimurium LT2 strain (SeT) and its ampicillin (AMP)- and gentamicin (GEN)-resistant variants (RVs). Figure S1: Representative colony morphology of the Salmonella enterica subsp. enterica serovar Typhimurium LT2 parental strain (SeT) and gentamicin-resistant variants obtained under the stepwise increasing exposure regime (Assay B); Figure S2: Representative images of Dictyostelium discoideum predation plaques formed on lawns of the Salmonella enterica subsp. enterica serovar Typhimurium LT2 parental strain (SeT) and its resistant variants (RVs) after 24 h; Figure S3: Representative images of Dictyostelium discoideum predation plaques formed on lawns of the Salmonella enterica subsp. enterica serovar Typhimurium LT2 parental strain (SeT) and its resistant variants (RVs) after 48 h; Figure S4: Representative images of Dictyostelium discoideum predation plaques formed on lawns of the Salmonella enterica subsp. enterica serovar Typhimurium LT2 parental strain (SeT) and its resistant variants (RVs) after 72 h; Figure S5: Representative images of Dictyostelium discoideum predation plaques formed on lawns of the Salmonella enterica subsp. enterica serovar Typhimurium LT2 parental strain (SeT) and its resistant variants (RVs) after 96 h.
Author Contributions
Conceptualization, R.C., R.P. and D.G.-G.; methodology, R.C., A.M.H., R.P. and D.G.-G.; formal analysis, R.C.; investigation, R.C.; resources, R.P. and D.G.-G.; writing—original draft preparation, R.C. and D.G.-G.; writing—review and editing, I.G.-P., A.M.H., D.B. and R.P.; supervision, R.P. and D.G.-G.; funding acquisition, R.P. and D.G.-G. All authors have read and agreed to the published version of the manuscript.
Funding
This research was supported by Grants PID2021-123404NB-I00 and PID2024-156601NA-I00 funded by MICIU/AEI/10.13039/501100011033, as well as by “ERDF: A way of making Europe”, and the Government of Aragón (Grant Grupo AESA grant A06_23R). The Department of Science, Technology, and University Education of the Government of Aragón (Spain) provided R. Campillo and I. García-Penas with a contract to conduct their PhD theses. R. Campillo also acknowledges the University of Zaragoza, Fundación Ibercaja, Fundación CAI (grant ref. CA 3/25), and Instituto Agroalimentario de Aragón (IA2) for the mobility grants supporting part of his research.
Institutional Review Board Statement
Not applicable.
Informed Consent Statement
Not applicable.
Data Availability Statement
Raw sequencing data have been deposited in the NCBI Sequence Read Archive under BioProject ID PRJNA1539015. Raw data for minimum inhibitory concentrations, growth kinetics and plaque diameters are provided in the Supplementary Materials (Data S1).
Acknowledgments
The authors would like to thank Jordi van Gestel for hosting R. Campillo in his laboratory and providing the opportunity to conduct research at EMBL Heidelberg. During the preparation of this manuscript, the authors used ChatGPT 5.2 (OpenAI) solely for the purposes of improving spelling, grammar, and readability. The authors have reviewed and edited the output and take full responsibility for the content of this publication.
Conflicts of Interest
The authors declare no conflicts of interest.
Abbreviations
The following abbreviations are used in this manuscript:
| ALE | Adaptive laboratory evolution |
| AMC | Amoxicillin/clavulanic acid |
| AMP | Ampicillin |
| AMR | Antimicrobial resistance |
| CEF | Cephalothin |
| CEQ | Cefquinome |
| CFP | Cefoperazone |
| CFU | Colony-forming units |
| CLSI | Clinical and Laboratory Standards Institute |
| Del | Deletion |
| EFT | Ceftiofur |
| ENR | Enrofloxacin |
| FFC | Florfenicol |
| FLU | Flumequine |
| GEN | Gentamicin |
| Ins | Insertion |
| IPM | Imipenem |
| KEGG | Kyoto Encyclopedia of Genes and Genomes |
| MAR | Marbofloxacin |
| MHA | Mueller-Hinton agar |
| MHB | Mueller-Hinton broth |
| MIC | Minimum inhibitory concentration |
| NCBI | National Center for Biotechnology Information |
| NEO | Neomycin |
| OD | Optical density |
| PBS | Phosphate-buffered saline |
| RMSE | Root mean square error |
| RVs | Resistant variant |
| SCV | Small-colony variant |
| SeT | Salmonella enterica subsp. enterica serovar Typhimurium LT2 parental strain |
| SNV | Single-nucleotide variant |
| SXT | Trimethoprim/sulfamethoxazole |
| TET | Tetracycline |
| TSAYE | Tryptone soya agar supplemented with yeast extract |
| TSBYE | Tryptic soy broth supplemented with yeast extract |
| WGS | Whole-genome sequencing |
References
- European Food Safety Authority and European Centre for Disease Prevention and Control. The European Union summary report on antimicrobial resistance in zoonotic and indicator bacteria from humans, animals and food in 2022–2023. EFSA J. 2025, 23, e9237. [Google Scholar] [CrossRef] [Scilit]
- Pulingam, T.; Parumasivam, T.; Gazzali, A.M.; Sulaiman, A.M.; Chee, J.Y.; Lakshmanan, M.; Chin, C.F.; Sudesh, K. Antimicrobial resistance: Prevalence, economic burden, mechanisms of resistance and strategies to overcome. Eur. J. Pharm. Sci. 2022, 170, 106103. [Google Scholar] [CrossRef] [Scilit] [PubMed]
- Campillo, R.; García-Penas, I.; Berdejo, D.; García-Gonzalo, D.; Pagán, R. Antimicrobial resistance as a potential gateway to cross-protection against food-related stressors in Salmonella enterica. J. Agric. Food Res. 2026, 29, 103114. [Google Scholar] [CrossRef] [Scilit]
- Cepas, V.; Soto, S.M. Relationship between virulence and resistance among Gram-negative bacteria. Antibiotics 2020, 9, 719. [Google Scholar] [CrossRef] [Scilit] [PubMed]
- García-Penas, I.; Campillo, R.; Berdejo, D.; Espina, L.; Conchello, P.; Pagán, R.; García-Gonzalo, D. Evolution of Salmonella Typhimurium under antibiotics from distinct classes reveals variant-dependent cross-protection against food preservation treatments. Food Microbiol. 2026, 139, 105138. [Google Scholar] [CrossRef] [Scilit] [PubMed]
- Bergspica, I.; Kaprou, G.; Alexa, E.A.; Prieto-Maradona, M.; Alvarez-Ordoñez, A. Identification of risk factors and hotspots of antibiotic resistance along the food chain using next-generation sequencing. EFSA J. 2020, 18, e181107. [Google Scholar] [CrossRef] [Scilit] [PubMed]
- Hudson, J.A.; Frewer, L.J.; Jones, G.; Brereton, P.A.; Whittingham, M.J.; Stewart, G. The agri-food chain and antimicrobial resistance: A review. Trends Food Sci. Technol. 2017, 69, 131–147. [Google Scholar] [CrossRef] [Scilit]
- Lopatkin, A.J.; Bening, S.C.; Manson, A.L.; Stokes, J.M.; Kohanski, M.A.; Badran, A.H.; Earl, A.M.; Cheney, N.J.; Yang, J.H.; Collins, J.J. Clinically relevant mutations in core metabolic genes confer antibiotic resistance. Science 2021, 371, eaba0862. [Google Scholar] [CrossRef] [Scilit] [PubMed]
- García-Penas, I.; Campillo, R.; Berdejo, D.; Espina, L.; García-Gonzalo, D.; Pagán, R. Adaptive evolution assays using increasing concentration of antibiotics to isolate resistant bacterial variants and determination of genetic changes via whole genome sequencing. In Detection and Quantification of Bacteria, Yeast, Viruses, and Protozoan in Foods and Freshwater; Magnani, M., Targino de Souza Pedrosa, G., Eds.; Springer: New York, NY, USA, 2026; pp. 31–44. [Google Scholar]
- Andersson, D.I.; Hughes, D. Microbiological effects of sublethal levels of antibiotics. Nat. Rev. Microbiol. 2014, 12, 465–478. [Google Scholar] [CrossRef] [Scilit] [PubMed]
- Levin-Reisman, I.; Ronin, I.; Gefen, O.; Braniss, I.; Shoresh, N.; Balaban, N.Q. Antibiotic tolerance facilitates the evolution of resistance. Science 2017, 355, 826–830. [Google Scholar] [CrossRef] [Scilit] [PubMed]
- Trampari, E.; Zhang, C.; Gotts, K.; Savva, G.M.; Bavro, V.N.; Webber, M. Cefotaxime exposure selects mutations within the CA-domain of envZ which promote antibiotic resistance but repress biofilm formation in Salmonella. Microbiol. Spectr. 2022, 10, e02145-21. [Google Scholar] [CrossRef] [Scilit] [PubMed]
- Kohanski, M.A.; DePristo, M.A.; Collins, J.J. Sublethal antibiotic treatment leads to multidrug resistance via radical-induced mutagenesis. Mol. Cell 2010, 37, 311–320. [Google Scholar] [CrossRef] [Scilit] [PubMed]
- Berdejo, D.; Gayan, E.; Pagan, E.; Merino, N.; Campillo, R.; Pagan, R.; Garcia-Gonzalo, D. Carvacrol selective pressure allows the occurrence of genetic resistant variants of Listeria monocytogenes EGD-e. Foods 2022, 11, 3282. [Google Scholar] [CrossRef] [Scilit] [PubMed]
- World Health Organization. WHO’s List of Medically Important Antimicrobials: A Risk Management Tool for Mitigating Antimicrobial Resistance Due to Non-Human Use; WHO: Geneva, Switzerland, 2024. [Google Scholar]
- Kohanski, M.A.; Dwyer, D.J.; Collins, J.J. How antibiotics kill bacteria: From targets to networks. Nat. Rev. Microbiol. 2010, 8, 423–435. [Google Scholar] [CrossRef] [Scilit] [PubMed]
- Campillo, R.; García-Penas, I.; Rodrigo, D.; Berdejo, D.; García-Gonzalo, D.; Pagán, R. Ciprofloxacin resistance in Salmonella drives cross-protection to UV-C and HHP via rpoD mutation. Food Microbiol. 2026, 140, 105177. [Google Scholar] [CrossRef] [Scilit] [PubMed]
- Campillo, R.; García-Penas, I.; Pardos, C.; Gimeno, P.; Berdejo, D.; Pagán, R.; García-Gonzalo, D. Reduced efficacy of food-chain biocides and preservatives against ciprofloxacin-resistant Salmonella Typhimurium. Appl. Microbiol. Biotechnol. 2026, 110, 319. [Google Scholar] [CrossRef] [Scilit] [PubMed]
- Pagán, E.; López, N.; Sánchez, A.; Campillo, R.; Berdejo, D.; García-Gonzalo, D.; Pagán, R. Growth fitness, virulence, and heat tolerance of Salmonella Typhimurium variants resistant to food preservation methods. Int. J. Food Microbiol. 2024, 422, 110810. [Google Scholar] [CrossRef] [Scilit] [PubMed]
- Bozzaro, S.; Bucci, C.; Steinert, M. Chapter 6 phagocytosis and host–pathogen interactions in Dictyostelium with a look at macrophages. In International Review of Cell and Molecular Biology; Academic Press: Cambridge, MA, USA, 2008; Volume 271, pp. 253–300. [Google Scholar]
- Mesquita, A.; Cardenal-Muñoz, E.; Dominguez, E.; Muñoz-Braceras, S.; Nuñez-Corcuera, B.; Phillips, B.A.; Tábara, L.C.; Xiong, Q.; Coria, R.; Eichinger, L.; et al. Autophagy in Dictyostelium: Mechanisms, regulation and disease in a simple biomedical model. Autophagy 2017, 13, 24–40. [Google Scholar] [CrossRef] [Scilit] [PubMed]
- Campillo, R.; García-Penas, I.; López, N.; Sánchez, A.; Fau, A.; Gómez, D.; Berdejo, D.; García-Gonzalo, D.; Pagán, R. Ciprofloxacin-resistant Salmonella Typhimurium demonstrates cross-tolerance to heat treatments in liquid food matrices. Food Res. Int. 2025, 210, 116330. [Google Scholar] [CrossRef] [Scilit] [PubMed]
- Shen, C.; Ma, F.; Deng, S.; Zhong, L.; El-Sayed, M.; Zhang, G.; Yan, B.; Dai, M.; Yang, F.; Xia, Y.; et al. Prevalence, genomic characteristics, and transmission dynamics of MCR-1-positive Salmonella enterica Typhimurium from patients with infectious diarrhea. Int. J. Med. Microbiol. 2021, 311, 151501. [Google Scholar] [CrossRef] [Scilit] [PubMed]
- McClelland, M.; Sanderson, K.E.; Spieth, J.; Clifton, S.W.; Latreille, P.; Courtney, L.; Porwollik, S.; Ali, J.; Dante, M.; Du, F.; et al. Complete genome sequence of Salmonella enterica serovar Typhimurium LT2. Nature 2001, 413, 852–856. [Google Scholar] [CrossRef] [Scilit] [PubMed]
- Tavares da Silva, R.; García-Penas, I.; Espina, L.; Garcia-Gonzalo, D.; Magnani, M.; Pagan, R. Meropenem-induced cross-protection in Salmonella enterica resistant variants: Insights from adaptive laboratory evolution and whole genome sequencing. Food Microbiol. 2025, 132, 104823. [Google Scholar] [CrossRef] [Scilit] [PubMed]
- CLSI Supplement M100. In Performance Standards for Antimicrobial Susceptibility Testing, 33rd ed.; Clinical and Laboratory Standards Institute: Wayne, NY, USA, 2023.
- European Committee on Antimicrobial Susceptibility Testing. Breakpoint Tables for Interpretation of MICs and Zone Diameters Version 16.0. Available online: http://www.eucast.org (accessed on 26 June 2026).
- Hall, T.A. BioEdit: A user-friendly biological sequence alignment editor and analysis program for Windows 95/98/NT. Nucleic Acids Symp. Ser. 1999, 41, 95–98. [Google Scholar]
- Zwietering, M.H.; Jongenburger, I.; Rombouts, F.M.; van ‘t Riet, K. Modeling of the bacterial growth curve. Appl. Environ. Microbiol. 1990, 56, 1875–1881. [Google Scholar] [CrossRef] [Scilit] [PubMed]
- Froquet, R.; Lelong, E.; Marchetti, A.; Cosson, P. Dictyostelium discoideum: A model host to measure bacterial virulence. Nat. Protoc. 2009, 4, 25–30. [Google Scholar] [CrossRef] [Scilit] [PubMed]
- Fey, P.; Kowal, A.S.; Gaudet, P.; Pilcher, K.E.; Chisholm, R.L. Protocols for growth and development of Dictyostelium discoideum. Nat. Protoc. 2007, 2, 1307–1316. [Google Scholar] [CrossRef] [Scilit] [PubMed]
- Garriga-Canut, M.; Cannon, N.; Benton, M.; Zanon, A.; Horsfield, S.T.; Scheurich, J.; Remans, K.; Lees, J.; Paix, A.; van Gestel, J. Selection-free CRISPR-Cas9 editing protocol for distant Dictyostelid species. bioRxiv 2025. [Google Scholar] [CrossRef] [Scilit]
- Abushaheen, M.A.; Muzaheed; Fatani, A.J.; Alosaimi, M.; Mansy, W.; George, M.; Acharya, S.; Rathod, S.; Divakar, D.D.; Jhugroo, C.; et al. Antimicrobial resistance, mechanisms and its clinical significance. Disease-a-Month 2020, 66, 100971. [Google Scholar] [CrossRef] [Scilit] [PubMed]
- Ahmad, M.; Aduru, S.V.; Smith, R.P.; Zhao, Z.; Lopatkin, A.J. The role of bacterial metabolism in antimicrobial resistance. Nat. Rev. Microbiol. 2025, 23, 439–454. [Google Scholar] [CrossRef] [Scilit] [PubMed]
- Vareschi, S.; Jaut, V.; Vijay, S.; Allen, R.J.; Schreiber, F. Antimicrobial efflux and biofilms: An interplay leading to emergent resistance evolution. Trends Microbiol. 2025, 33, 1018–1032. [Google Scholar] [CrossRef] [Scilit] [PubMed]
- Collis, C.M.; Grigg, G.W. An Escherichia coli mutant resistant to phleomycin, bleomycin, and heat inactivation is defective in ubiquinone synthesis. J. Bacteriol. 1989, 171, 4792–4798. [Google Scholar] [CrossRef] [Scilit] [PubMed]
- de Zuazo, M.; Andaluz-Arbe, J.; Fau, A.; García-Penas, I.; Pagán, R.; García-Gonzalo, D.; Merino, N. Ciprofloxacin-resistant variants of Listeria monocytogenes EGD-e show increased heat resistance in buffer and milk. Appl. Food Res. 2026, 6, 101933. [Google Scholar] [CrossRef] [Scilit]
- Lázár, V.; Pal Singh, G.; Spohn, R.; Nagy, I.; Horváth, B.; Hrtyan, M.; Busa-Fekete, R.; Bogos, B.; Méhi, O.; Csörgő, B.; et al. Bacterial evolution of antibiotic hypersensitivity. Mol. Syst. Biol. 2013, 9, MSB201357. [Google Scholar] [CrossRef] [Scilit] [PubMed]
- Adler, M.; Anjum, M.; Andersson, D.I.; Sandegren, L. Combinations of mutations in envZ, ftsI, mrdA, acrB and acrR can cause high-level carbapenem resistance in Escherichia coli. J. Antimicrob. Chemother. 2016, 71, 1188–1198. [Google Scholar] [CrossRef] [Scilit] [PubMed]
- Cascales, E.; Bernadac, A.; Gavioli, M.; Lazzaroni, J.-C.; Lloubes, R. Pal lipoprotein of Escherichia coli plays a major role in outer membrane integrity. J. Bacteriol. 2002, 184, 754–759. [Google Scholar] [CrossRef] [Scilit] [PubMed]
- Gerken, H.; Shetty, D.; Kern, B.; Kenney, L.J.; Misra, R. Effects of pleiotropic ompR and envZ alleles of Escherichia coli on envelope stress and antibiotic sensitivity. J. Bacteriol. 2024, 206, e00172-24. [Google Scholar] [CrossRef] [Scilit] [PubMed]
- Pagnout, C.; Sohm, B.; Razafitianamaharavo, A.; Caillet, C.; Offroy, M.; Leduc, M.; Gendre, H.; Jomini, S.; Beaussart, A.; Bauda, P.; et al. Pleiotropic effects of rfa-gene mutations on Escherichia coli envelope properties. Sci. Rep. 2019, 9, 9696. [Google Scholar] [CrossRef] [Scilit] [PubMed]
- Yano, H.; Nakata, N.; Yahara, K.; Sugai, M.; Sato, Y. Specific variants in ftsI reduce carbapenem susceptibility in Pseudomonas aeruginosa. Microbiol. Spectr. 2025, 13, e01027-25. [Google Scholar] [CrossRef] [Scilit] [PubMed]
- Shaheen, A.; Tariq, A.; Iqbal, M.; Mirza, O.; Haque, A.; Walz, T.; Rahman, M. Mutational diversity in the quinolone resistance-determining regions of type-II topoisomerases of Salmonella serovars. Antibiotics 2021, 10, 1455. [Google Scholar] [CrossRef] [Scilit] [PubMed]
- Lang, M.; Carvalho, A.; Baharoglu, Z.; Mazel, D. Aminoglycoside uptake, stress, and potentiation in Gram-negative bacteria: New therapies with old molecules. Microbiol. Mol. Biol. Rev. 2023, 87, e00036-22. [Google Scholar] [CrossRef] [Scilit] [PubMed]
- Vakulenko, S.B.; Mobashery, S. Versatility of aminoglycosides and prospects for their future. Clin. Microbiol. Rev. 2003, 16, 430–450. [Google Scholar] [CrossRef] [Scilit] [PubMed]
- Hubbard, A.T.M.; Bulgasim, I.; Roberts, A.P. A novel hemA mutation is responsible for a small colony variant phenotype in Escherichia coli. Microbiology 2020, 167, 000962. [Google Scholar] [CrossRef] [Scilit] [PubMed]
- Komeda, T.; Hishinuma, T.; Kirikae, T.; Tada, T. Escherichia coli with increased aminoglycoside resistance due to an amino acid substitution at position 85 of HemC. J. Infect. Chemother. 2025, 31, 102536. [Google Scholar] [CrossRef] [Scilit] [PubMed]
- Kakatkar, A.S.; Das, A.; Shashidhar, R. Ciprofloxacin induced antibiotic resistance in Salmonella Typhimurium mutants and genome analysis. Arch. Microbiol. 2021, 203, 6131–6142. [Google Scholar] [CrossRef] [Scilit] [PubMed]
- Nandy, P.; Chib, S.; Seshasayee, A. A mutant RNA polymerase activates the general stress response, enabling Escherichia coli adaptation to late prolonged stationary phase. mSphere 2020, 5, e00092-20. [Google Scholar] [CrossRef] [Scilit] [PubMed]
- Pränting, M.; Andersson, D.I. Mechanisms and physiological effects of protamine resistance in Salmonella enterica serovar Typhimurium LT2. J. Antimicrob. Chemother. 2010, 65, 876–887. [Google Scholar] [CrossRef] [Scilit] [PubMed]
- Álvarez-Molina, A.; de Toro, M.; Ruiz, L.; López, M.; Prieto, M.; Alvarez-Ordóñez, A. Selection for antimicrobial resistance in foodborne pathogens through exposure to UV light and nonthermal atmospheric plasma decontamination techniques. Appl. Environ. Microbiol. 2020, 86, e00102-20. [Google Scholar] [CrossRef] [Scilit] [PubMed]
- Das, B.; Bhadra, R.K. (p)ppGpp metabolism and antimicrobial resistance in bacterial pathogens. Front. Microbiol. 2020, 11, 563944. [Google Scholar] [CrossRef] [Scilit] [PubMed]
- Thi, T.D.; López, E.; Rodríguez-Rojas, A.; Rodríguez-Beltrán, J.; Couce, A.; Guelfo, J.R.; Castañeda-García, A.; Blázquez, J. Effect of recA inactivation on mutagenesis of Escherichia coli exposed to sublethal concentrations of antimicrobials. J. Antimicrob. Chemother. 2011, 66, 531–538. [Google Scholar] [CrossRef] [Scilit] [PubMed]
- Jahn, L.J.; Munck, C.; Ellabaan, M.M.H.; Sommer, M.O.A. Adaptive laboratory evolution of antibiotic resistance using different selection regimes lead to similar phenotypes and genotypes. Front. Microbiol. 2017, 8, 816. [Google Scholar] [CrossRef] [Scilit] [PubMed]
- Oz, T.; Guvenek, A.; Yildiz, S.; Karaboga, E.; Tamer, Y.T.; Mumcuyan, N.; Ozan, V.B.; Senturk, G.H.; Cokol, M.; Yeh, P.; et al. Strength of selection pressure is an important parameter contributing to the complexity of antibiotic resistance evolution. Mol. Biol. Evol. 2014, 31, 2387–2401. [Google Scholar] [CrossRef] [Scilit] [PubMed]
- Abouzeed, Y.M.; Baucheron, S.; Cloeckaert, A. ramR mutations involved in efflux-mediated multidrug resistance in Salmonella enterica serovar Typhimurium. Antimicrob. Agents Chemother. 2008, 52, 2428–2434. [Google Scholar] [CrossRef] [Scilit] [PubMed]
- Blair, J.M.; Bavro, V.N.; Ricci, V.; Modi, N.; Cacciotto, P.; Kleinekathöfer, U.; Ruggerone, P.; Vargiu, A.V.; Baylay, A.J.; Smith, H.E. AcrB drug-binding pocket substitution confers clinically relevant resistance and altered substrate specificity. Proc. Natl. Acad. Sci. USA 2015, 112, 3511–3516. [Google Scholar] [CrossRef] [Scilit] [PubMed]
- Trampari, E.; Prischi, F.; Vargiu, A.V.; Abi-Assaf, J. Functionally distinct mutations within AcrB underpin antibiotic resistance in different lifestyles. npj Antimicrob. Resist. 2023, 1, 2. [Google Scholar] [CrossRef] [Scilit] [PubMed]
- Zhang, L.; Guan, Y.; Cheng, Y.Y.; Cokcetin, N.N.; Bottomley, A.L.; Robinson, A.; Harry, E.J.; van Oijen, A.; Su, Q.P.; Jin, D. Fast evolution of SOS-independent multi-drug resistance in bacteria. eLife 2025, 13, RP95058. [Google Scholar] [CrossRef] [Scilit]
- Proctor, R.A.; von Eiff, C.; Kahl, B.C.; Becker, K.; McNamara, P.; Herrmann, M.; Peters, G. Small colony variants: A pathogenic form of bacteria that facilitates persistent and recurrent infections. Nat. Rev. Microbiol. 2006, 4, 295–305. [Google Scholar] [CrossRef] [Scilit] [PubMed]
- Riquelme, S.; Varas, M.; Valenzuela, C.; Velozo, P.; Chahin, N.; Aguilera, P.; Sabag, A.; Labra, B.; Álvarez, S.A.; Chávez, F.P.; et al. Relevant genes linked to virulence are required for Salmonella Typhimurium to survive intracellularly in the social amoeba Dictyostelium discoideum. Front. Microbiol. 2016, 7, 1305. [Google Scholar] [CrossRef] [Scilit] [PubMed]
- Saravanan, V.; Kanagaraj, P.; Chandrasekaran, M.; Muthu, S.; Kadirvelu, L.; Govindarajan, D.K.; Kandaswamy, K. Small colony variants and their role in biofilm associated infections. Microbe 2025, 8, 100538. [Google Scholar] [CrossRef] [Scilit]
- Syed Khaja, A.S.; Moursi, S.; Saleem, M.; Alshurtan, K.; Abboh, E.; Alshammari, A.D.; Almalaq, H.; Alshammari, M.; Almarshedy, S.M. Small-colony variants of Staphylococcus aureus: Hidden threat in chronic and recurrent infections. Naunyn-Schmiedeberg’s Arch. Pharmacol. 2026, 399, 7727–7739. [Google Scholar] [CrossRef] [Scilit] [PubMed]
- Pagán, E.; Merino, N.; Berdejo, D.; Campillo, R.; Gayán, E.; García-Gonzalo, D.; Pagán, R. Adaptive evolution of Salmonella Typhimurium LT2 exposed to carvacrol lacks a uniform pattern. Appl. Microbiol. Biotechnol. 2024, 108, 38. [Google Scholar] [CrossRef] [Scilit] [PubMed]
- Campillo, R.; García-Penas, I.; Merino, N.; Berdejo, D.; Pagán, R.; García-Gonzalo, D. Generation of custom antibiotic-resistant variants of Salmonella Typhimurium by genetic engineering-Chapter 2. In Detection and Quantification of Bacteria, Yeast, Viruses, and Protozoan in Foods and Freshwater; Magnani, M., Targino de Souza Pedrosa, G.S., Eds.; Humana: New York, NY, USA, 2026. [Google Scholar]
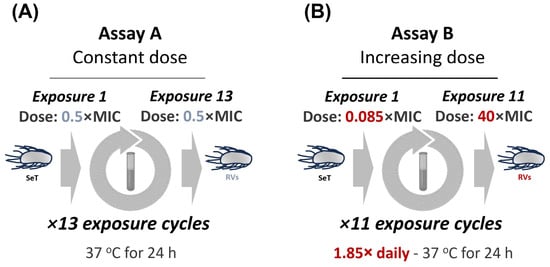
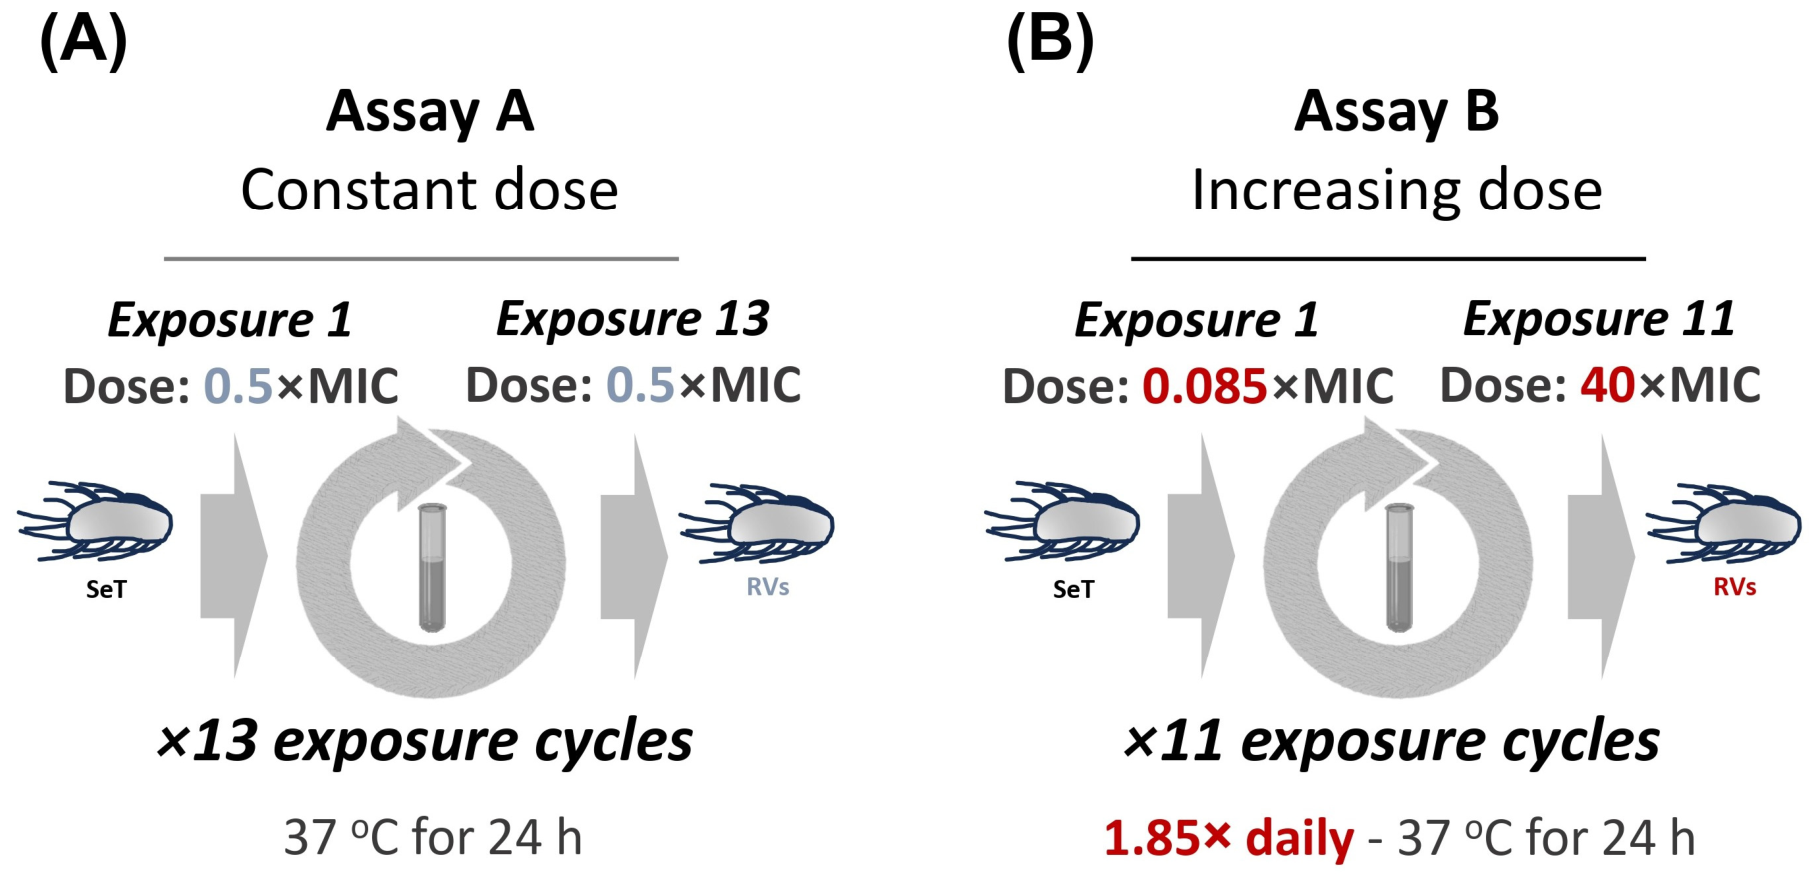
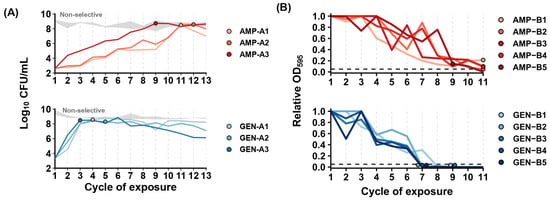
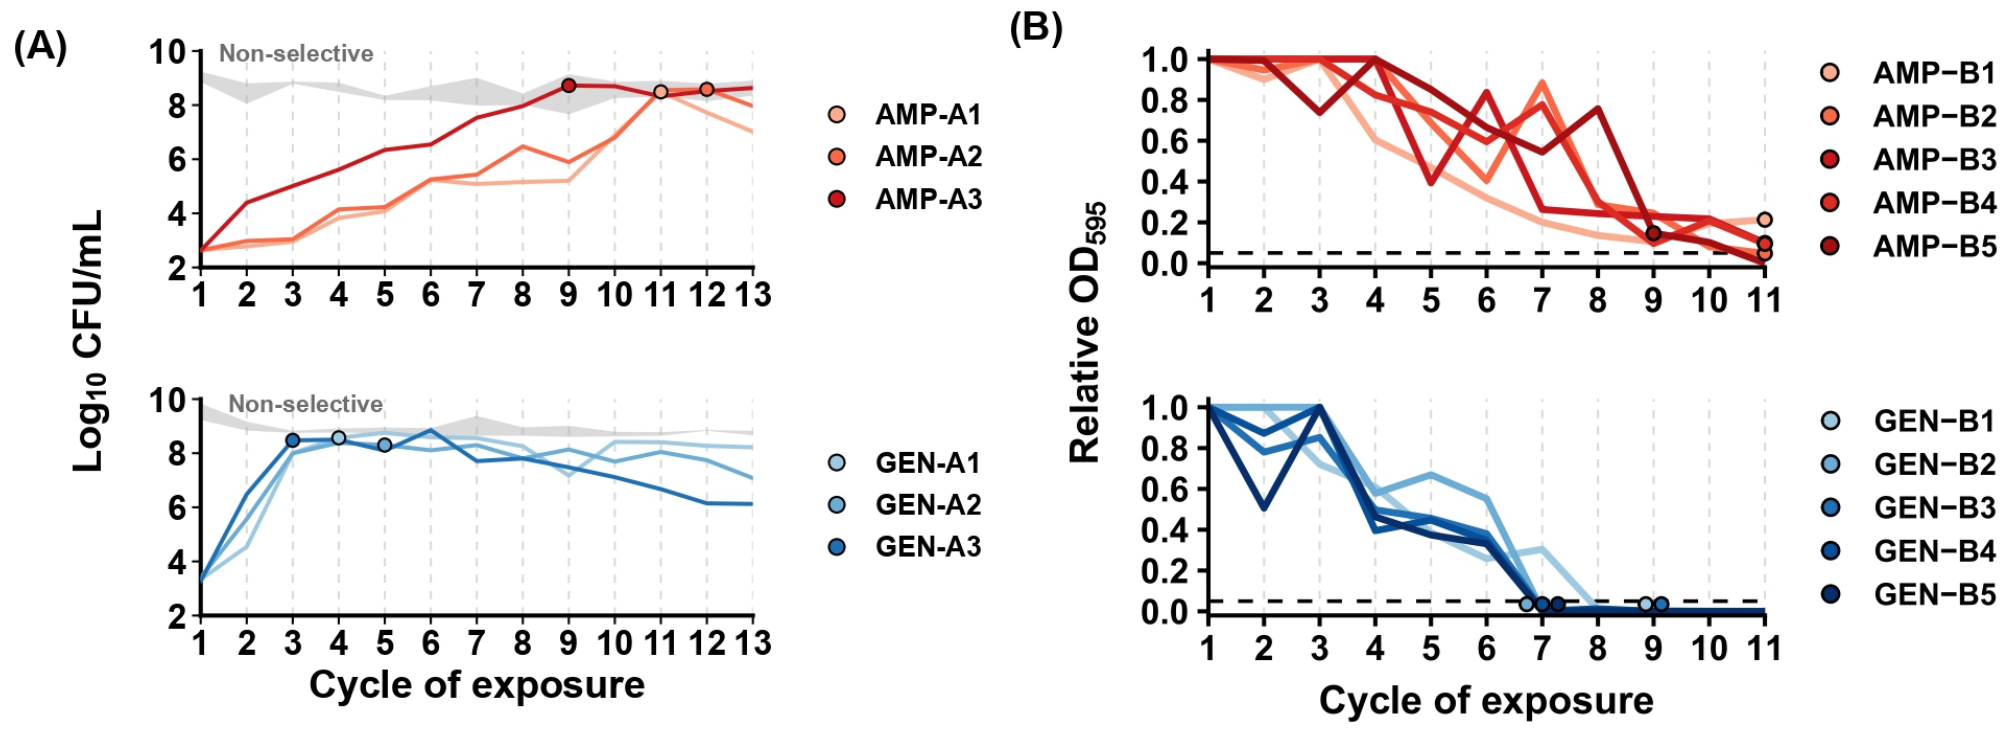
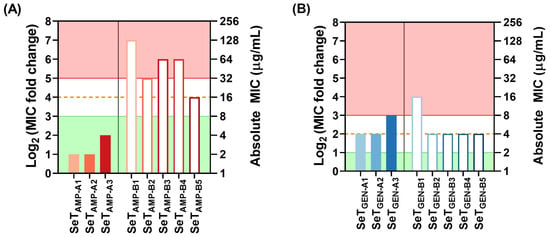
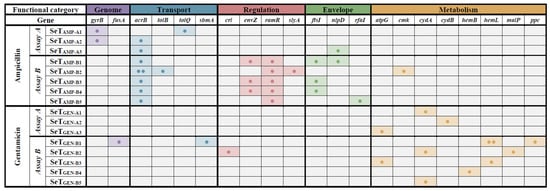
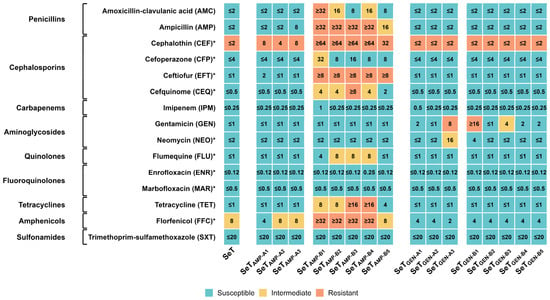
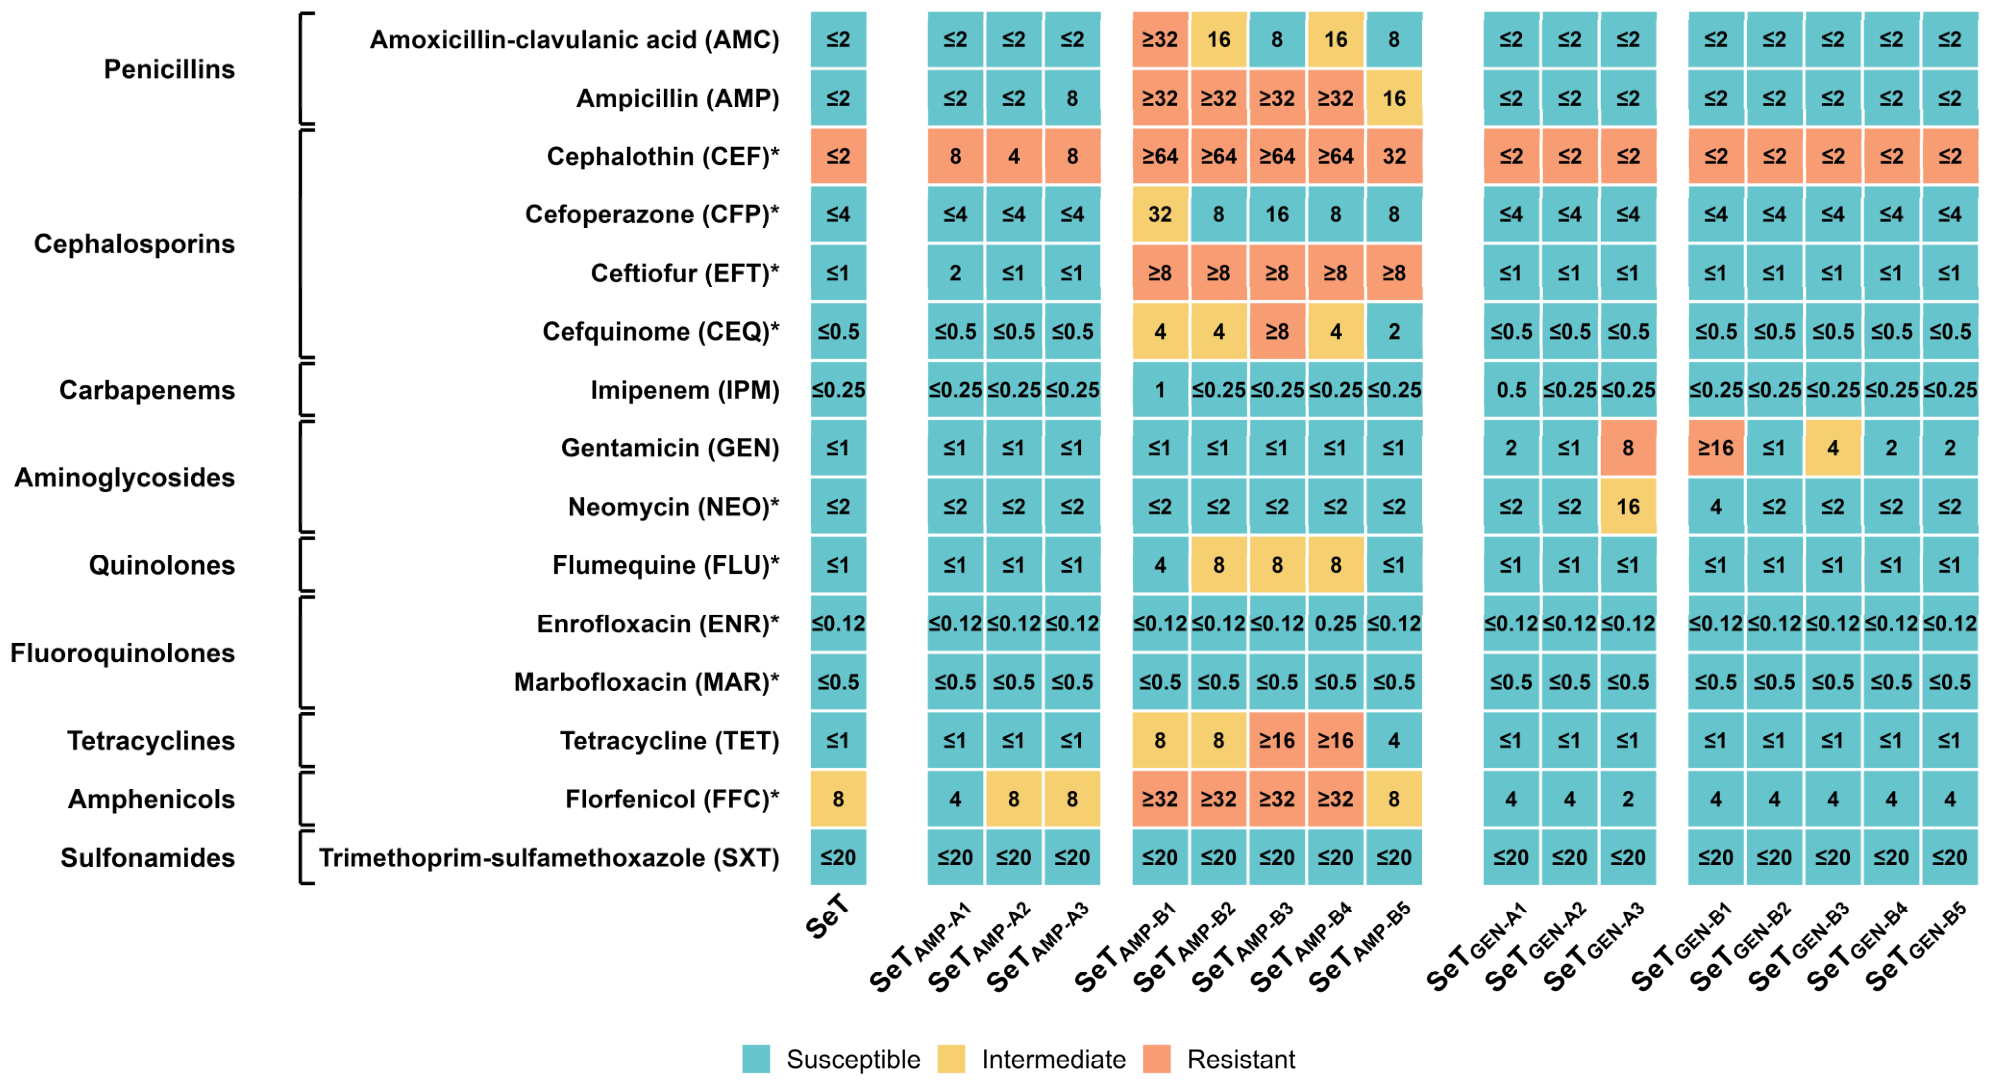
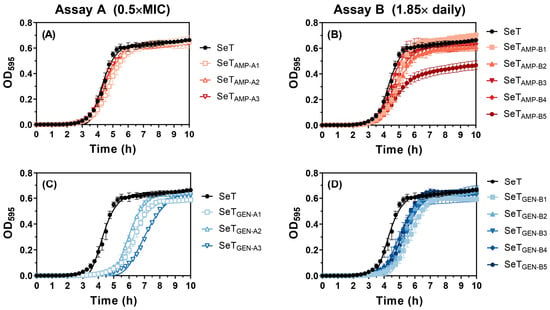
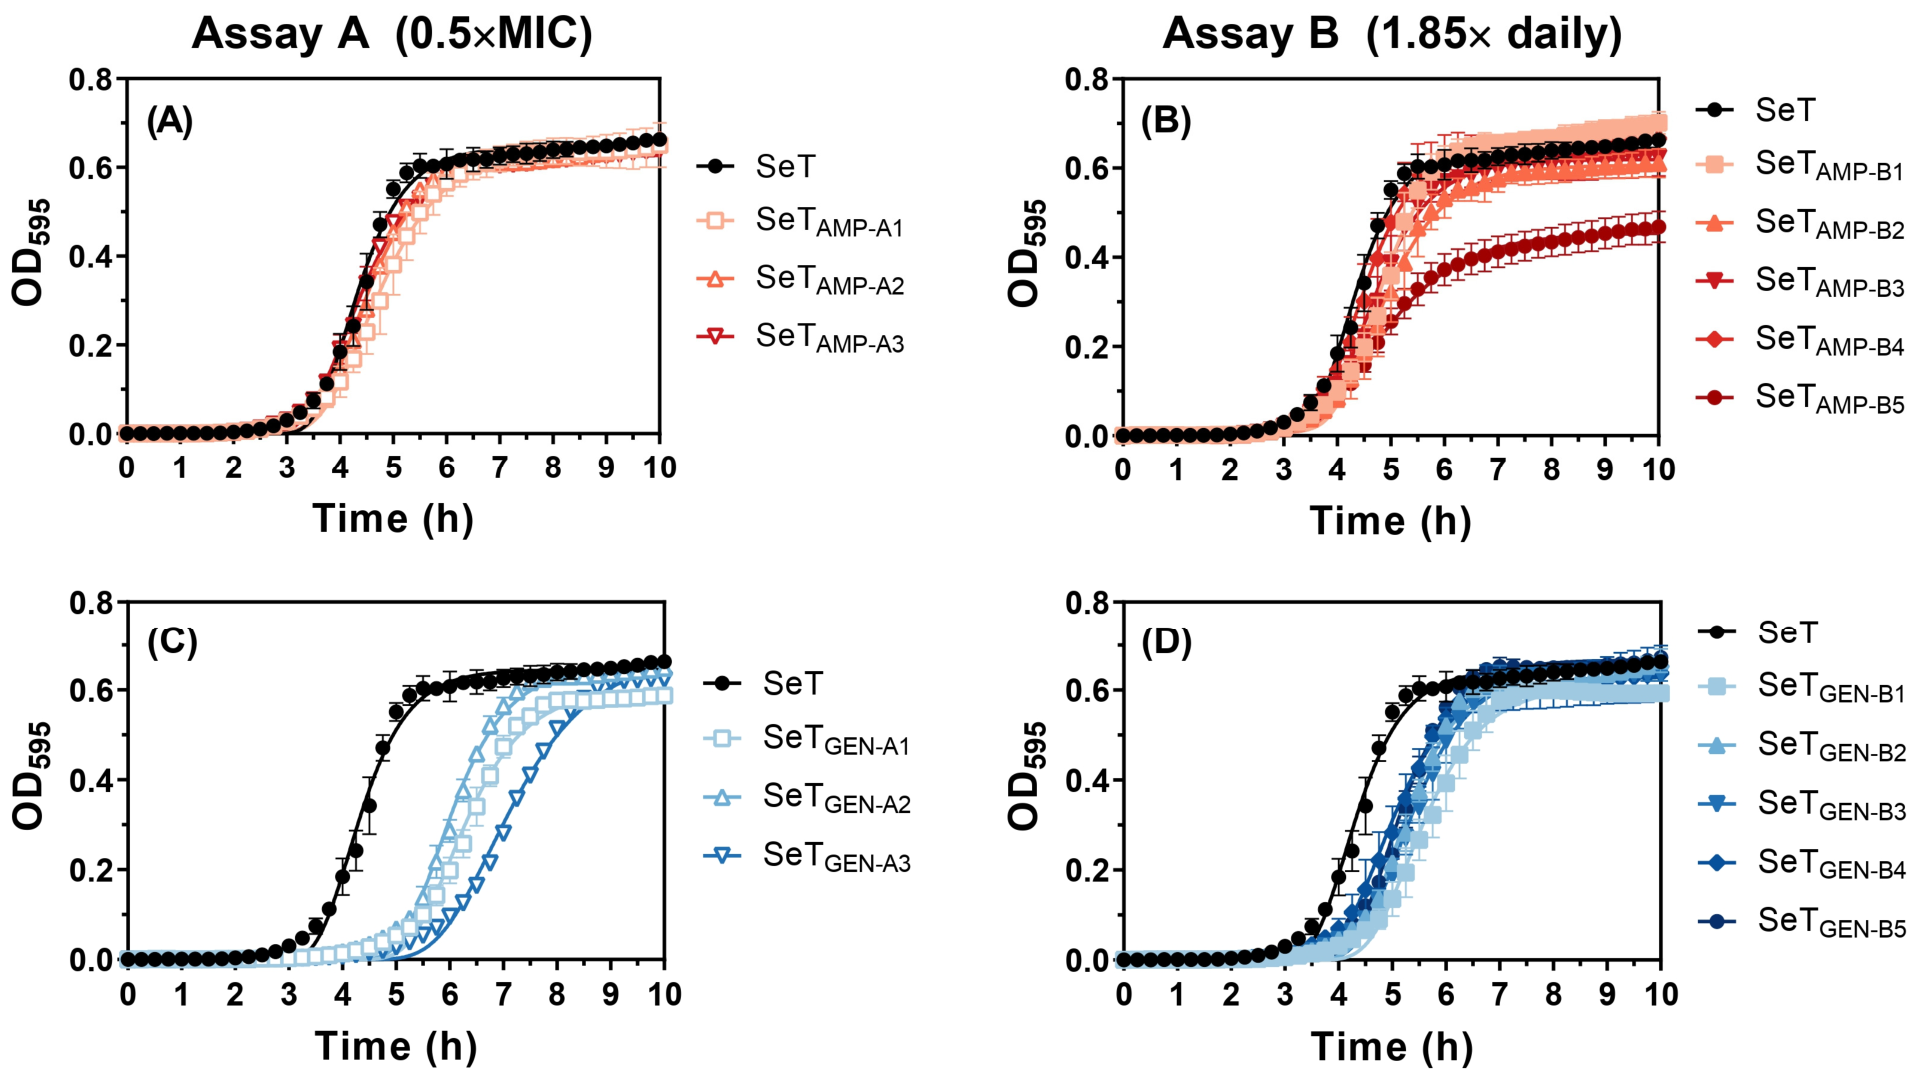
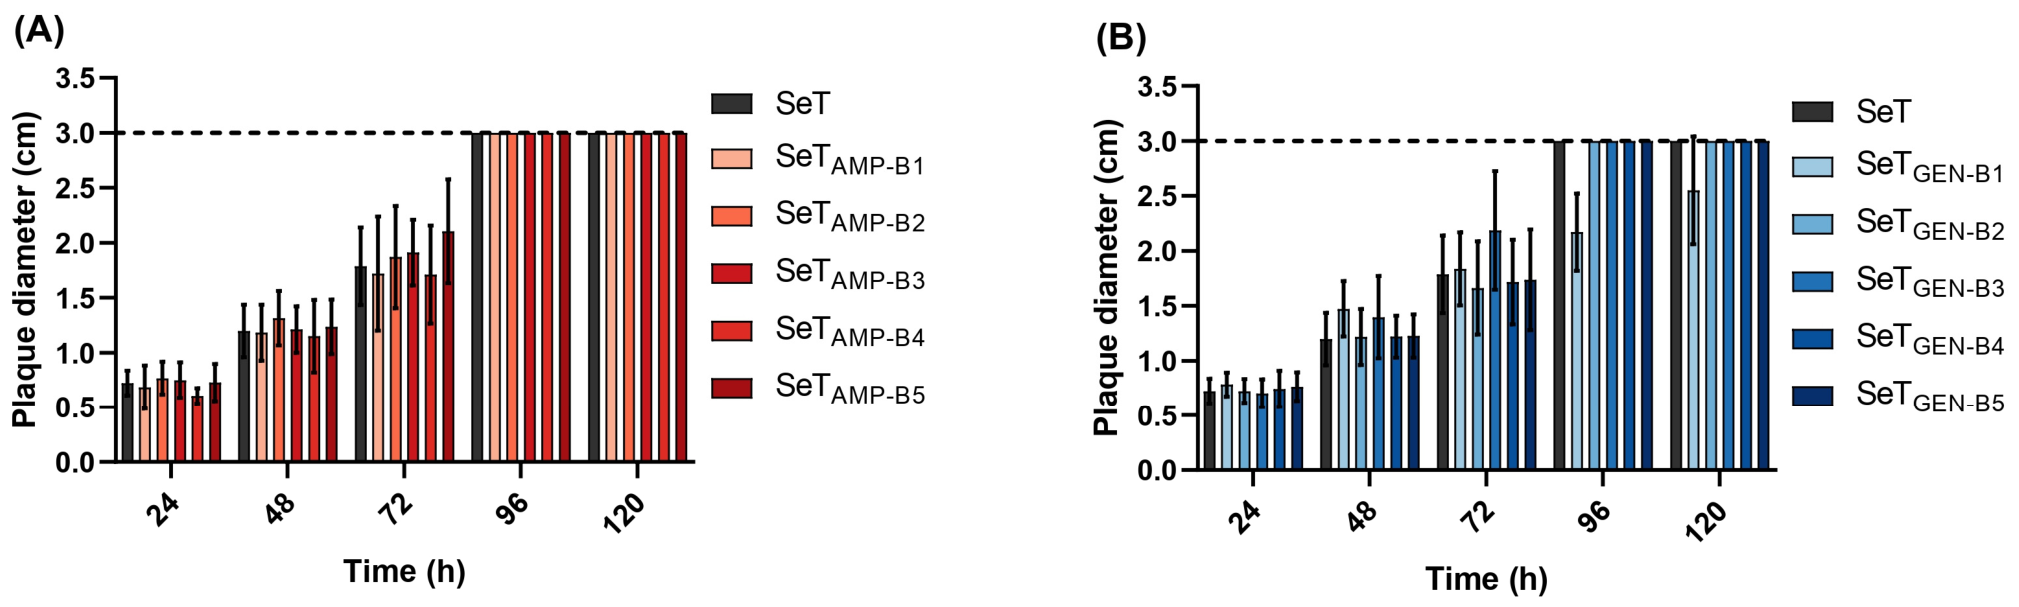
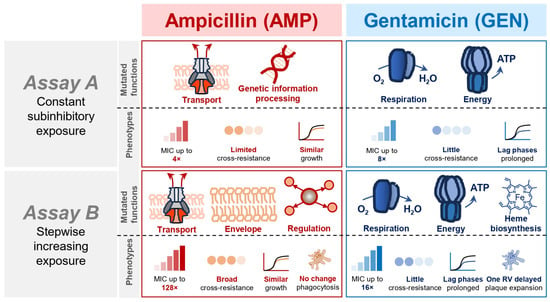
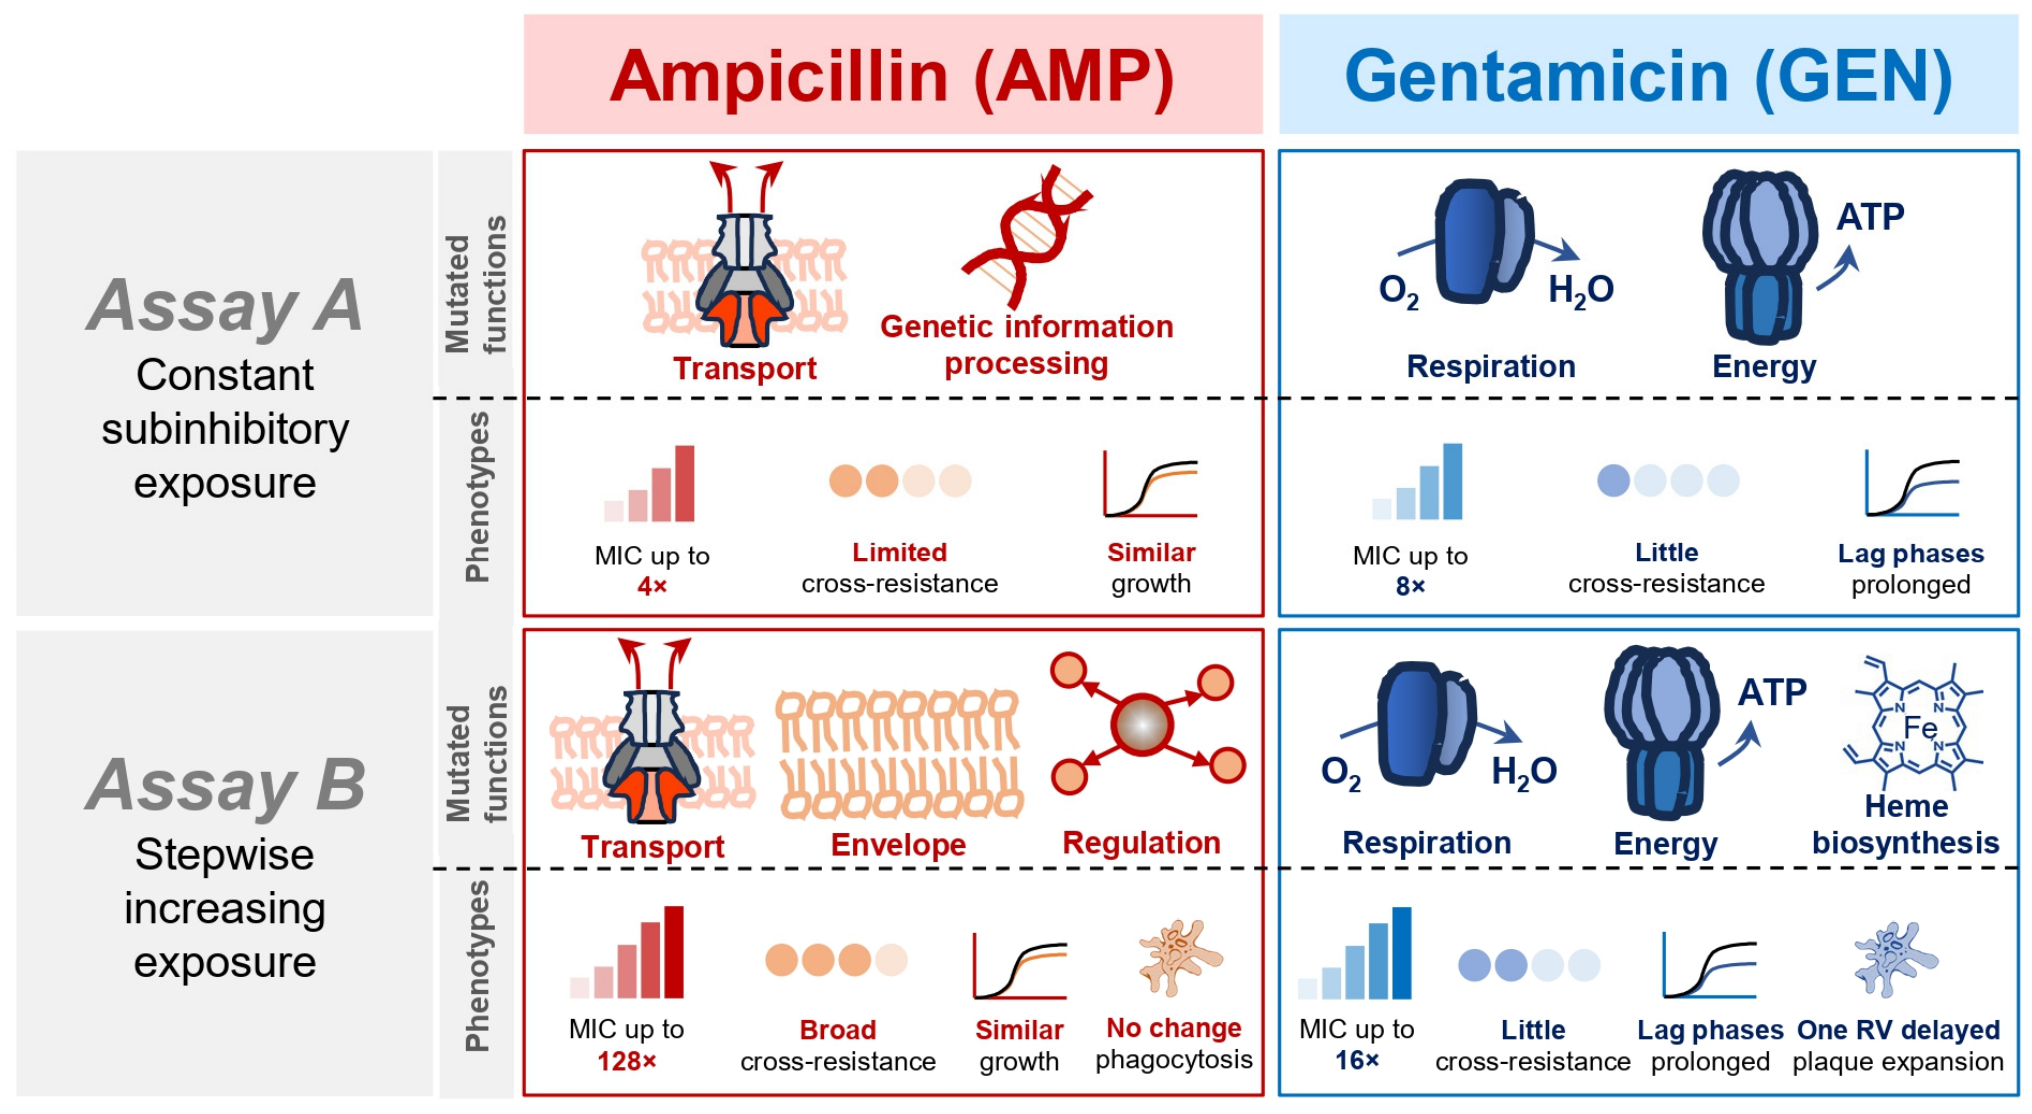

Disclaimer/Publisher’s Note: The statements, opinions and data contained in all publications are solely those of the individual author(s) and contributor(s) and not of MDPI and/or the editor(s). MDPI and/or the editor(s) disclaim responsibility for any injury to people or property resulting from any ideas, methods, instructions or products referred to in the content. |
© 2026 by the authors. Licensee MDPI, Basel, Switzerland. This article is an open access article distributed under the terms and conditions of the Creative Commons Attribution (CC BY) license.