


Abstract
Chronic bee paralysis virus (CBPV) is a serious pathogen of honey bees and has expanded across major beekeeping regions in recent years. Understanding viral connectivity between apiaries is therefore essential for disease control. However, consensus-based phylogenetic analysis has limited power to resolve epidemiological links between closely managed colonies. To address this, we applied virome sequencing and intra-host single-nucleotide variant (iSNV) profiling to investigate shared variation and possible viral exchange between two apiaries across two consecutive years. One apiary was translocated ~80 km away each spring and returned each winter to within ~1 km of a stationary apiary. This seasonal translocation mirrors the long-distance movements and winter aggregations common in commercial beekeeping operations in China and the United States, providing a natural microcosm of the migratory practices that drive large-scale viral connectivity. Parallel 16S rRNA gene profiling of the midgut microbiota revealed no detectable association between bacterial community composition and CBPV infection status. iSNV analysis identified extensive shared low-frequency variants between the two apiaries across both years, including formerly private variants that became detectable in both sites after winter co-location. In contrast, consensus phylogenies placed two co-located apiaries in separate clades, suggesting that standard surveillance may underestimate cryptic viral connectivity. We cannot rule out the possibility that the observed shared iSNVs reflect shared ancestry, earlier contact, or common external sources. Furthermore, the direction of viral exchange cannot be determined from observational data with limited replication and uneven sequencing depth. These results show that finer-scale iSNV profiling highlights patterns of viral connectivity in managed bee systems, providing a model for high-resolution surveillance of RNA viruses in mobile managed host populations where conventional methods underestimate connectivity, though validation in controlled experimental settings is needed to establish causal transmission pathways.
1. Introduction
Chronic bee paralysis virus (CBPV) is a significant pathogen of honey bees, causing trembling wings, crawling behavior, and loss of foraging ability in infected individuals [1,2]. Severe infections can lead to notable colony losses [3]. The virus has a positive-sense single-stranded RNA genome consisting of two major segments and has been reported with increasing frequency in managed honey bee populations worldwide [3,4]. Routine surveillance has relied mainly on PCR-based detection and, more recently, consensus genome sequencing [4,5]. While these approaches are valuable for defining major viral lineages, they reflect only the most abundant sequence and have limited power to resolve transmission routes between epidemiologically linked colonies [6]. This limitation is particularly relevant for viruses circulating within connected apiaries, where the dominant sequence may be shared across colonies and fail to reveal the direction or timing of spread [6].
RNA viruses replicate with high mutation rates and exist within hosts as complex quasispecies, with low-frequency variants that can serve as markers for recent transmission events [7,8]. In human and animal viruses, sub-consensus variant analysis has improved the resolution of transmission chain reconstruction beyond what consensus sequences alone can provide [9,10]. In bee viruses, analogous approaches have so far been limited to deformed wing virus (DWV) under controlled conditions [11]. Whether iSNV profiling can resolve transmission between epidemiologically linked apiaries under natural migratory beekeeping conditions remains untested, especially for CBPV, whose multipartite genome and fecal–oral transmission route differ from those of Varroa-vectored DWV [1]. In commercial beekeeping, apiaries are frequently moved over long distances to provide pollination services and placed near other apiaries during certain seasons [12]. This practice, common in major beekeeping regions such as China and the United States, creates opportunities for viral exchange between otherwise separated colonies. Beekeeping management involving colony movement facilitates viral transmission [13]. How the viral quasispecies responds to such contact events is not well understood.
CBPV is transmitted primarily through the fecal–oral route [14], making the midgut the first tissue barrier and directly exposing it to the gut microbiota. Previous work has shown that CBPV can alter the hindgut microbiota [15], but whether the midgut microbiota changes during natural CBPV outbreaks has not been examined. Given the midgut’s role as the entry site for CBPV, this question is relevant to understanding virus–host interactions during outbreaks.
In this study, we used two apiaries with a known history of seasonal separation and winter co-location as a natural experiment. We combined virome sequencing and iSNV profiling to investigate shared CBPV variation across two consecutive years. Our results show that shared iSNVs can link apiaries across years and highlight possible viral exchange that consensus phylogenies may not resolve. Midgut microbiota profiling from the same sampling batches showed no clear association with CBPV outbreak status.
2. Materials and Methods
2.1. Study Design and Sample Collection
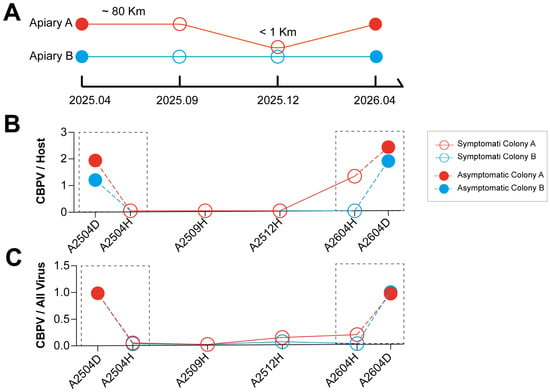
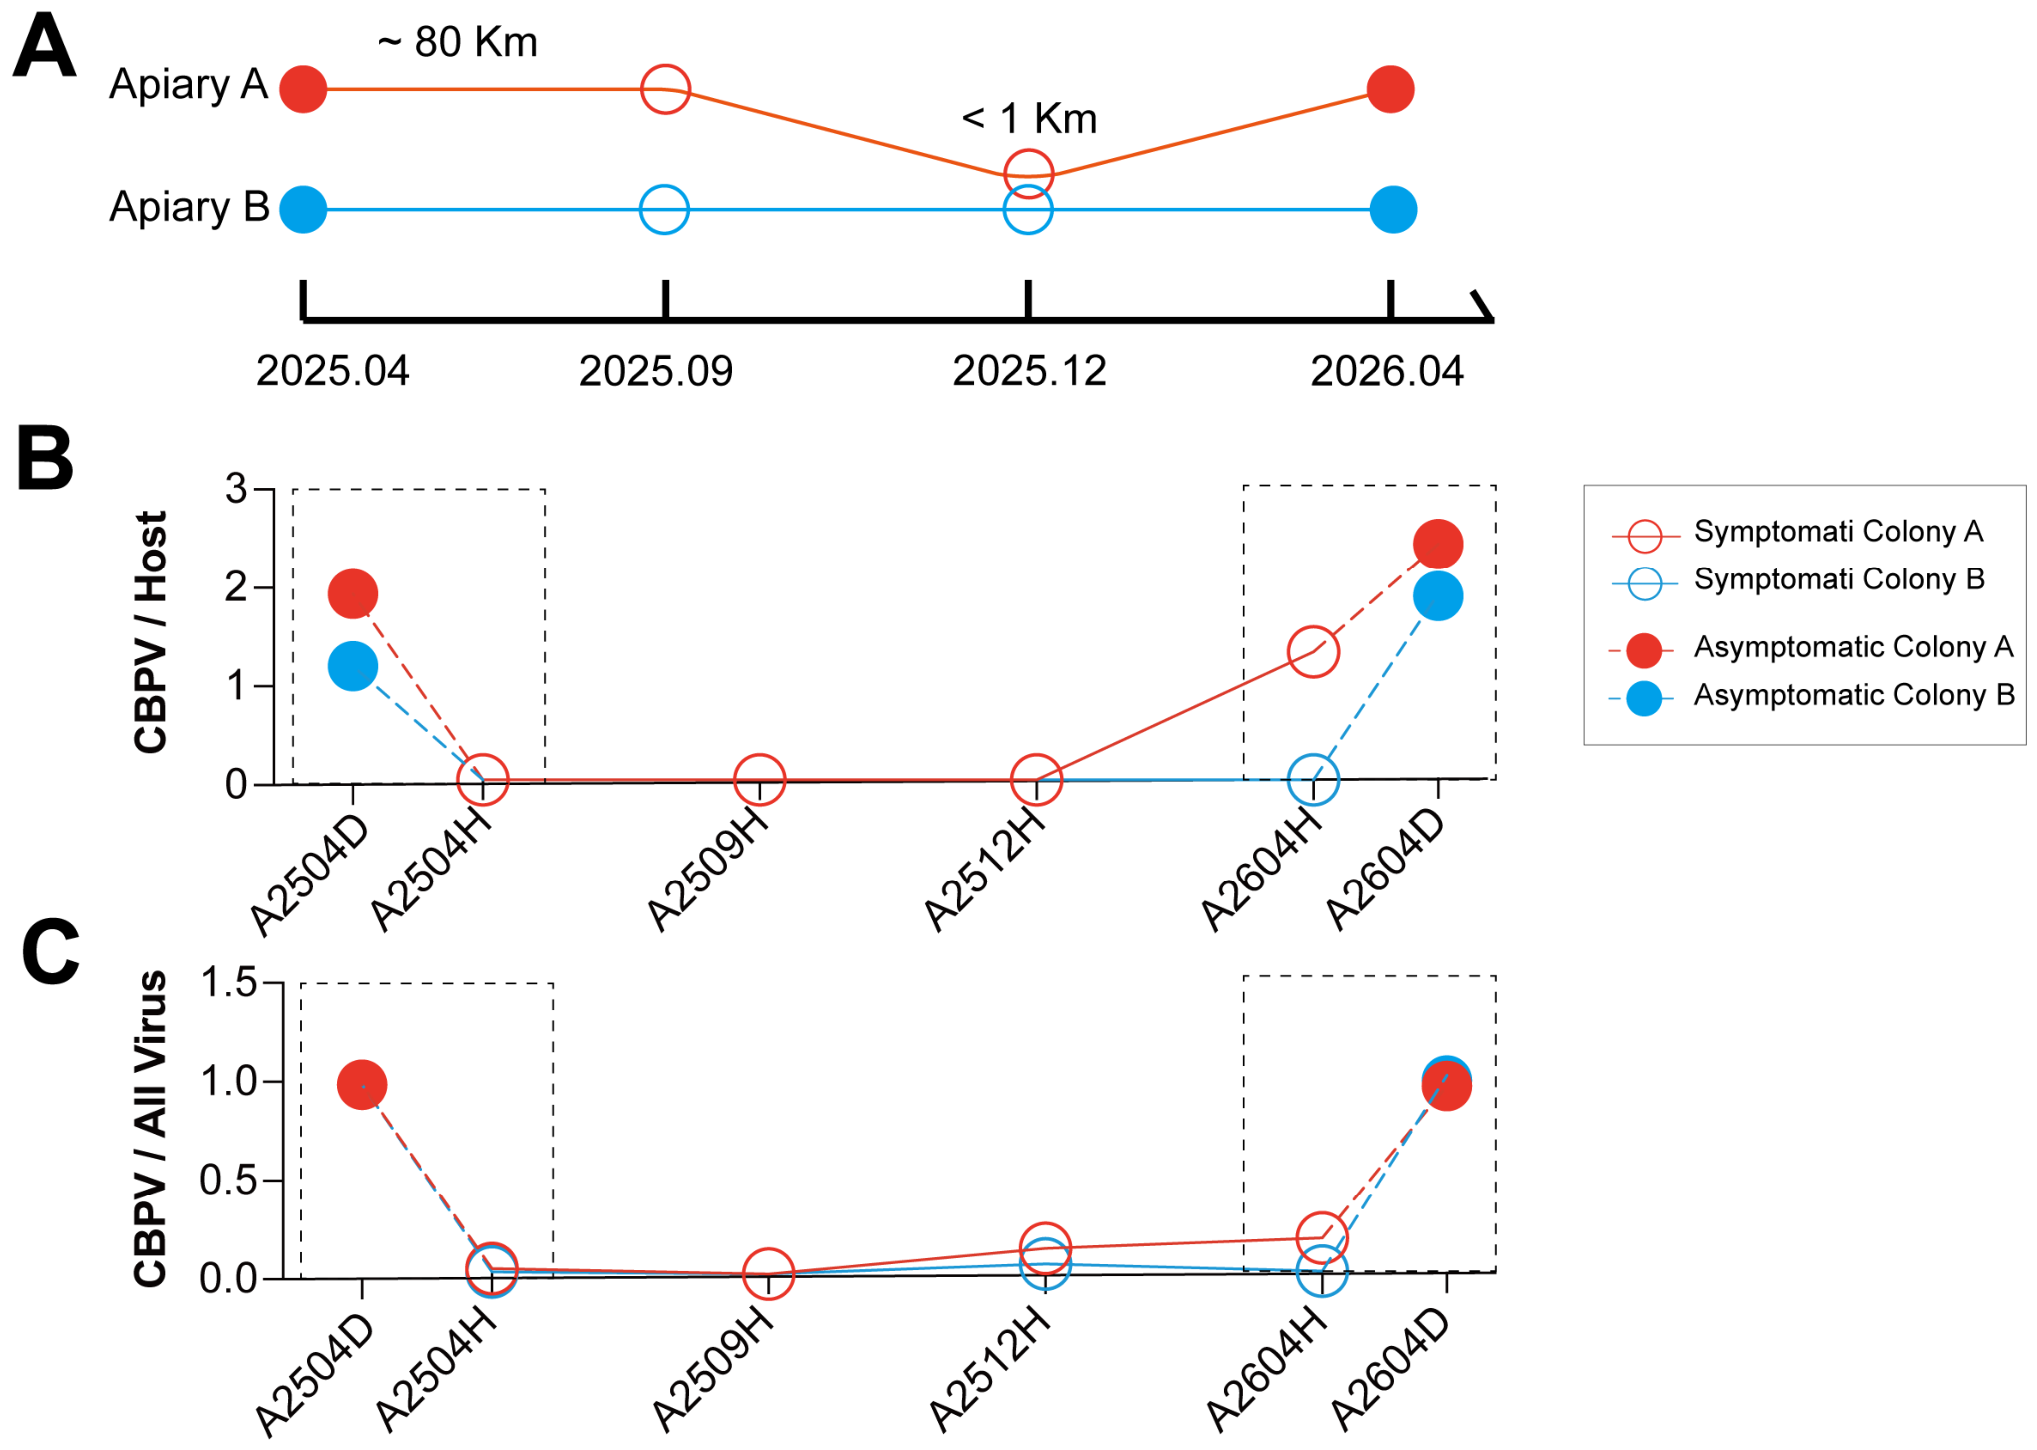
Two apiaries (Apis mellifera ligustica) managed by local beekeepers in Weifang, Shandong Province, China, were monitored across four time points from April 2025 to April 2026. Apiary A was kept approximately 80 km away in Weicheng during spring and summer, and was moved to an overwintering site within 1 km of Apiary B in December 2025. Apiary B remained at the same location in Linqu throughout the study. Foraging bees were collected from each apiary at every time point. In April 2025 and April 2026, bees showing typical signs of CBPV infection, including trembling wings, crawling behavior, and loss of foraging ability, were collected as symptomatic samples. Symptomatic bees were collected from the symptomatic colony in each apiary. Asymptomatic foragers were collected concurrently from a single colony (the one with the most pronounced CBPV signs). Notably, the single selected colony per apiary was treated as representative of that apiary’s viral population for the purpose of this observational comparison. In September and December 2025, no typical CBPV symptoms were observed, and only asymptomatic foragers were collected from the same colony that provided symptomatic samples during the symptomatic sampling periods. All samples were stored at −80 °C until processing. For virome sequencing, one pooled sample per colony per time point per symptom status was prepared, with each pool comprising three adult bees.
2.2. Virome Sequencing and Analysis
For virome profiling, adult bees were collected from each colony in the two apiaries, sampling date, and symptom group. Each virome library represented a pooled sample of three whole adult bees. Total RNA was isolated and ribosomal RNA was depleted, and strand-specific sequencing libraries were constructed according to the manufacturer’s protocol, with unique index sequences assigned to each sample. To minimize the risk of index hopping, libraries were sequenced in three separate batches. Batch 1 contained samples collected in April 2025. Batch 2 contained samples collected in September and December 2025. Batch 3 contained samples collected in April 2026. Paired-end sequencing (150 bp × 2) was performed on the Illumina NovaSeq platform; a total of 1.37 billion clean reads were obtained after quality filtering.
Reads of virome sequencing data were trimmed and quality-filtered by Fastp (version 1.0.1) [16]. Host reads were quantified by mapping clean reads to the honey bee reference genome GCF_003254395.2. Viral reads were identified through a de novo assembly and annotation pipeline: clean reads were first assembled using Trinity (v2.15.2) [17], annotated against the NCBI nr database with DIAMOND (v2.1.9.163, e-value ≤ 0.05) [18], and contigs assigned to viral taxa were retained as viral references. Clean reads were then mapped to these viral contigs using Bowtie2 (v2.5.4) [19], and the number of mapped reads was used as a proxy for viral abundance (Table S1).
2.3. 16S rRNA Amplicon Sequencing and Analysis
Bees from the same sampling cohort were partitioned for parallel analyses: three individuals were used for viral screening and fifteen individuals were allocated to 16S profiling, with the latter grouped into three pools of five midguts each. This yielded 36 pools across two years (2025–2026) and three seasons (autumn, spring, winter) (Table S2). DNA was extracted. The V3–V4 region of the bacterial 16S rRNA gene was amplified with primers 341F (5′-CCTACGGGNGGCWGCAG-3′) and 806R (5′-GACTACHVGGGTATCTAAT-3′), and amplicons were sequenced on the Illumina NovaSeq X platform using a paired-end strategy (2 × 250 bp). The raw paired-end reads were merged into full-length V3–V4 amplicon sequences using FLASH (v1.2.11) [20].
Merged reads were quality-filtered and denoised using the DADA2 plugin in QIIME 2 (version 2025.7) [21] with a maximum expected error threshold of 2 (maxEE = 2), retaining the full length of the ~420 bp merged reads. Chimera removal was performed de novo, yielding an amplicon sequence variant (ASV) table. Taxonomy was assigned using a SILVA (release 138.2) [22] naive Bayes classifier trained specifically on the V3–V4 region (341F/806R), with sequences unresolved to genus labeled at the highest resolvable rank.
Alpha diversity was assessed using the Shannon index on the ASV table rarefied to a depth of 13,000 reads per sample. Differences in Shannon diversity between symptomatic and asymptomatic spring pools were tested using the Wilcoxon rank-sum test, with effect size estimated as Cliff’s delta and 95% confidence intervals computed by exact methods. Beta diversity was assessed using Bray–Curtis dissimilarities, and community composition was visualized by principal coordinates analysis (PCoA). Permutational multivariate analysis of variance (PERMANOVA; adonis2 function in the vegan package, 999 permutations, seed = 20,251,021) was used to test the effects of symptom status, colony, year, and season on microbial community structure. Homogeneity of multivariate dispersions was evaluated using PERMDISP (betadisper function, 999 permutations). All statistical analyses beyond QIIME 2 were performed in R (version 4.3.3). Because pools represent subsamples rather than independent colony replicates, PERMANOVA was conducted on the pool-level distance matrix and interpreted as exploratory.
2.4. Consensus Sequence Reconstruction and Phylogenetic Analysis
Clean reads from the A2504D library were aligned to the CBPV reference sequences (MZ821981.1 for RNA1 and MF175174.1 for RNA2) using Bowtie2. Consensus sequences were generated from the CBPV alignments using SAMtools (version 1.21) [23] (mode: simple) with a minimum mapping quality of 20, minimum base quality of 20, and heterozygous fraction of 0.5. Positions with sequencing depth below 10× were treated as missing data (Ns) and excluded from phylogenetic analysis, with no imputation performed. This A2504D-derived consensus sequence was then used as the reference for the subsequent alignment of clean reads from all other libraries. Consensus sequences for RNA1 and RNA2 were aligned separately using MUSCLE (version 5.1) [24]. Maximum-likelihood phylogenetic trees were inferred using IQ-TREE (version 3.1.3) [25] with automatic model selection (TN + F for RNA1 and TPM2u + F + I for RNA2) and 1000 ultrafast bootstrap replicates. Trees were visualized and annotated using FigTree (version 1.4.4) [26].
2.5. iSNV Calling and Filtering
iSNVs were called from CBPV-mapped reads using LoFreq (version 2.1.5) [27] with the following parameters: --min-cov 50, --min-bq 30, --min-mq 30, --min-alt-bq 30. Raw variant calls were subjected to stringent filtering. A variant was retained only if it satisfied all of the following criteria: (i) it passed LoFreq’s internal quality filters, (ii) the alternative allele was supported by at least one read on each strand, (iii) the position met minimum depth thresholds of ≥50× in asymptomatic libraries and ≥1000× in symptomatic libraries, and (iv) a non-reference allele was independently detected at that position in at least three samples after applying the above filters.
To evaluate the impact of sequencing depth on iSNV detection, clean reads from the four symptomatic samples were randomly subsampled to 10%, 1%, 0.1%, 0.01%, and 0.001% of the original depth using SAMtools. iSNVs were re-called from each subsampled dataset using identical parameters and filters as described above. The number of LoFreq PASS iSNVs detected at each depth was recorded.
2.6. iSNV Sharing Network and Upset Analysis
A binary presence/absence matrix of high-confidence iSNVs across samples was constructed, where a value of 1 indicates detection of a non-reference allele at that position in that sample. The Upset plot was generated using ComplexUpset (version 1.3.3), and hierarchical clustering was performed and visualized using pheatmap (version 1.0.13) in R (version 4.3.3). For the sharing network, nodes represented samples, and an edge was drawn between two samples when they shared the same alternative base at the same position. Edge weights were set as the total number of positions at which the same alternative base was shared between each sample pair. The network was constructed and visualized in Gephi (version 0.11.2) [28] using the Force Atlas 2 layout.
2.7. Filter Stringency Sensitivity Analysis
To assess whether the shared iSNV pattern was an artefact of permissive calling parameters, a conservative post-call re-analysis was performed directly on the LoFreq 2.1.5 output VCFs without re-calling. Per-strand alternate read counts were extracted from the DP4 field. Progressive depth thresholds were applied: DP ≥ 1000, ≥2000, ≥4000, ≥8000, and ≥16,000. At DP ≥ 1000, the original per-strand filter was retained (minimum 1 alternate read on each strand). At all higher thresholds (DP ≥ 2000 to ≥16,000), the per-strand requirement was increased to a minimum of 10 alternate reads on both sense and anti-sense strands. Only the four symptomatic libraries (A2504D, A2604D, B2504D, B2604D) were included in this analysis, as asymptomatic samples had substantially lower CBPV read counts and did not meet the higher depth thresholds. For each filter setting, the number of retained iSNV positions and their associated alternate bases were tallied, together with their distribution across the four libraries.
2.8. Variant Quality Assessment and Independent Cross-Validation
To evaluate the reliability of low-frequency iSNV calls, ten sites were randomly selected from the 924 high-confidence positions retained under the original filtering criteria (random seed = 1). At each site, we examined variant-level quality metrics including reference and alternative read counts, forward and reverse strand counts, base quality (BQ), mapping quality (MQ), and the relative position of alternative alleles within reads. Median BQ and MQ at called sites were 40 and 42, respectively. The median relative position of alternative alleles within reads was intermediate rather than restricted to the 3′ end, consistent with a biological rather than artefactual origin.
To further assess the reproducibility of detected iSNVs, we performed cross-validation using an independent tissue-specific dataset generated from the same colony and sampling period. In that study [29], five bees were dissected into head, thorax, and abdomen, and each tissue was sequenced as a separate library. Merging iSNV sites across the three tissue libraries yielded 689 unique sites. Querying these 689 sites against the discovery library A2504D (one of the four symptomatic pools in this study) returned 430 concordant sites (62.4%, 430/689). This cross-validation provides support for the reproducibility of iSNV calls across individuals, tissues, and independent library preparations.
2.9. Re-Analysis of Private iSNV Persistence Without the ≥3-Sample Recurrence Filter
To assess whether the ≥3-sample retention criterion inflated cross-year detection of private variants, we performed a separate analysis restricted to the four symptomatic pools from both colonies across both years (A2504D, B2504D, A2604D, B2604D). All original variant detection criteria were retained except the ≥3-sample filter. Specifically, variants were called using LoFreq with a minimum depth of 1000× per position, at least one alternate read on the sense strand, and at least one on the antisense strand. Private variants were identified from 2025 data alone and were defined as those detected in the 2025 sample(s) of only one colony with zero detections in the 2025 sample(s) of the other colony. Recurrence in 2026 was assessed by querying the same genomic coordinates and alternative bases in the opposite colony. A variant was considered recurrent if both the same coordinate and the same alternate allele were present in 2026. For each 2025-private variant not detected in 2026, per-base read counts at the corresponding position in the 2026 libraries were obtained using samtools mpileup. LoFreq FILTER status (PASS or UN-PASS) was recorded for each position. No custom or additional filtering was applied beyond the criteria listed above.
2.10. Chemicals and Reagents
Total RNA was isolated using the RNApure Total RNA Kit (catalog No. RN0302; Aidlab Bio-technologies Co., Ltd., Beijing, China). Strand-specific sequencing libraries were constructed using the VAHTS mRNA-seq v2 Library Prep Kit for Illumina (catalog No. NR601-01; Vazyme, Nanjing, China), which includes random hexamer primers (N6) for first-strand cDNA synthesis. Genomic DNA was extracted using the Wizard Genomic DNA Purification Kit (catalog No. A1125; Promega, Madison, WI, USA). The V3–V4 region of the bacterial 16S rRNA gene was amplified with primers 341F (5′-CCTACGGGNGGCWGCAG-3′) and 806R (5′-GACTACHVGGGTATCTAAT-3′), synthesized by a commercial oligonucleotide vendor. All bioinformatics analyses were performed using publicly available tools as detailed in the relevant sections above.
2.11. Data Availability
Raw sequencing data have been deposited in the NCBI Sequence Read Archive under BioProject accession number PRJNA1513716; assembled genome sequences of CBPV have been deposited in GenBank under accession numbers PZ849770-PZ849789.
3. Results
3.1. Cross-Year CBPV Sampling and Virome Validation
We monitored two managed apiaries in Weifang across four time points from April 2025 to April 2026 (Figure 1A). Symptomatic CBPV cases were observed only during the April surveys, whereas asymptomatic foragers were collected at all time points. Virome sequencing data results (Table S1) were consistent with these field observations. The ratio of CBPV to host reads (Figure 1B) was markedly elevated in symptomatic individuals from April 2025 and April 2026 compared to asymptomatic individuals from the same sampling periods and healthy individuals from other seasons. Similarly, the ratio of CBPV to all viral reads (Figure 1C) revealed a distinct dichotomy: CBPV dominated the virome in symptomatic pools, whereas its relative abundance was low in healthy individuals. Notably, CBPV levels remained minimal in the healthy samples from September and December 2025. In the September samples specifically, CBPV reads were entirely undetectable in the sampled colonies from Apiary A and Apiary B.
Figure 1.
Spatial dynamics and virome profiles of CBPV in two managed apiaries. (A) Sampling timeline and spatial design. Apiary A remained stationary in Linqu, while Apiary B was translocated ~80 km to Weicheng during spring and summer, returning within 1 km of Linqu for overwintering. (B) Ratio of CBPV reads to host reads. Solid circles, symptomatic pools; open circles, asymptomatic pools. (C) Ratio of CBPV reads to all viral reads. Dashed boxes denote concurrent collection of symptomatic and asymptomatic samples within a single sampling event.
3.2. Discordant Phylogenies and Intra-Host iSNV Landscape
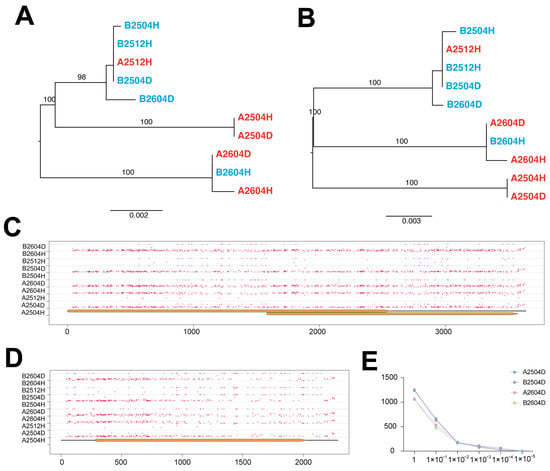
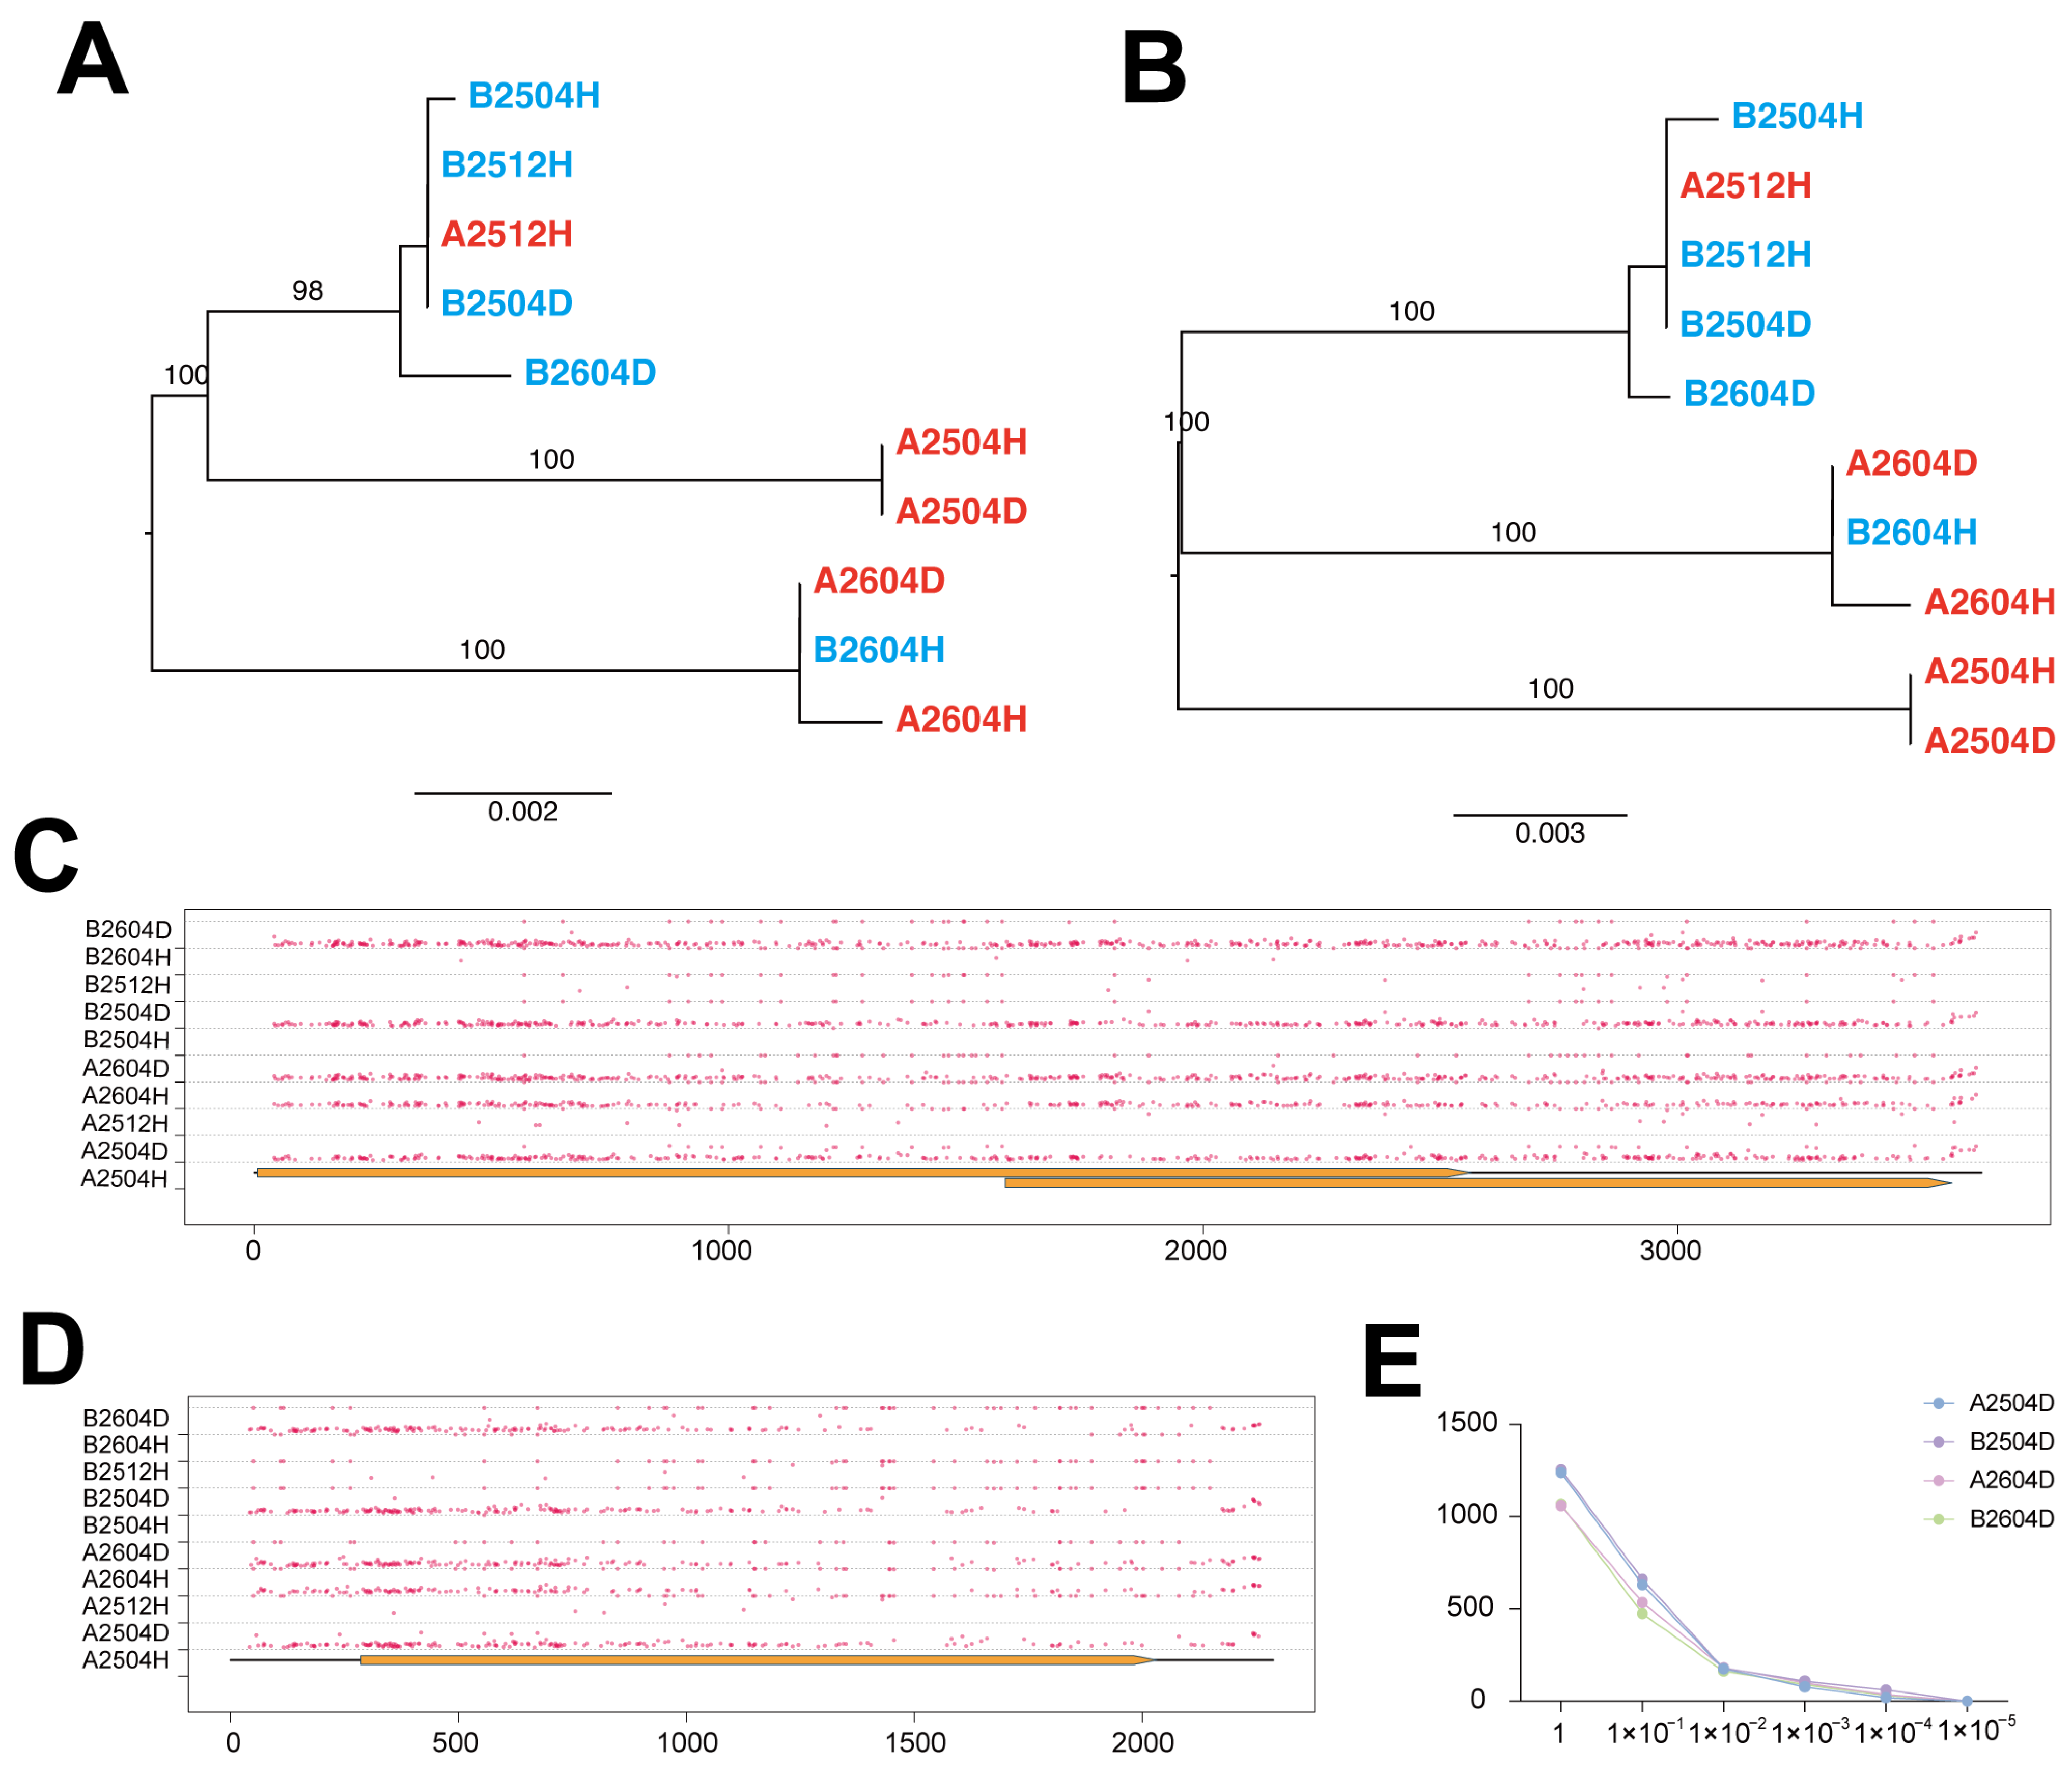
To trace CBPV connectivity between the two apiaries, we assembled genomes from sufficiently covered samples and constructed phylogenies based on these consensus sequences (Figure 2A,B). Both RNA1 and RNA2 yielded congruent topologies, each resolving into three primary clades. However, these clades did not partition strictly by apiary or year; instead, samples from Apiary A and Apiary B were intermingled across multiple clades (Figure 2A,B). This decoupling of phylogenetic placement from known epidemiological linkages indicates that consensus-level sequences do not strictly reflect the geographic origin or sampling year of the viruses. To assess the reliability of these branching patterns, we performed ultra-deep variant calling with stringent filters: variants were retained only if they passed LoFreq’s internal quality control, were supported by alternative alleles on both strands, met minimum depth thresholds (≥50× in asymptomatic libraries, ≥1000× in symptomatic libraries), and were detected in at least three independent samples (Figure 2E, Tables S3 and S4).
Figure 2.
Discordant phylogenies and intra-host iSNV landscape of CBPV. (A,B) Maximum-likelihood phylogenies based on consensus genomes of RNA1 (A) and RNA2 (B). (C,D) Genome-wide distribution of high-confidence iSNVs in RNA1 (C) and RNA2 (D). Each row is one sample; each dot is an iSNV. The y-axis is the allele frequency of the alternative allele, log10-transformed (i.e., log10(AF)). (E) In silico subsampling analysis of iSNV detection in four symptomatic samples. The number of LoFreq PASS iSNVs declines non-linearly with decreasing CBPV reads fraction.
High-confidence iSNVs were detected across all samples, with symptomatic individuals harboring significantly more variants than their asymptomatic counterparts (Figure 2C,D). To further evaluate the reliability of low-frequency iSNV calls, we performed three complementary assessments. First, ten sites were randomly selected from the 924 high-confidence positions (random seed = 1) and examined at the variant level. Alternative-allele reads were distributed across both forward and reverse strands, with absolute read counts ranging from 3 to 1509 (median 195). The median base and mapping qualities for these alternative alleles were 40 and 42, respectively, and the median relative position within reads was intermediate (0.53), rather than restricted to the 3′ end. This profile is inconsistent with sequencing error or mapping artefacts (Table S5). Second, a subsampling benchmark was conducted on the A2504D library. The number of called iSNVs declined non-linearly with decreasing read depth: high-frequency mutations persisted even at extremely low depths, whereas low-frequency variants disappeared progressively, and all iSNVs collapsed to zero precisely at the 0.001% threshold. While this benchmark alone cannot definitively exclude technical errors, it is consistent with, though does not independently establish, the biological authenticity of the detected iSNVs (Figure 2E). Third, independent cross-validation was performed using a tissue-specific dataset generated from the same colony and sampling period, in which five bees were dissected into head, thorax, and abdomen, and each tissue was sequenced as a separate library. Merging iSNV sites across the three tissue libraries yielded 689 unique sites, of which 430 (62.4%) were detected in A2504D, supporting the reproducibility of iSNV calls across individuals, tissues, and independent library preparations (Table S6). Together, these three lines of evidence support the general reliability of the detected iSNV signals.
Under progressive depth filtering (Table S7), the total number of retained iSNV position–alternate base combinations across the four symptomatic libraries decreased from 2090 at DP ≥ 1000 to 2016 at DP ≥ 16,000, a 3.5% reduction. Position–alternate base pairs shared across three or more of the four libraries declined from 892 to 843 (5.5% reduction). Those shared across all four libraries declined from 610 to 573 (6.1% reduction), with only one pair lost between DP ≥ 8000 and DP ≥ 16,000. The shared iSNV pattern among the four symptomatic libraries remained stable across all tested thresholds, indicating that it is not driven by permissive calling parameters.
3.3. iSNVs Link Epidemiologically Related Apiaries Across Years
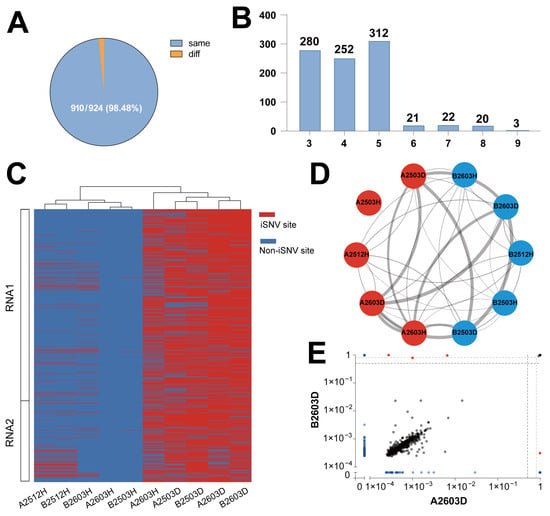
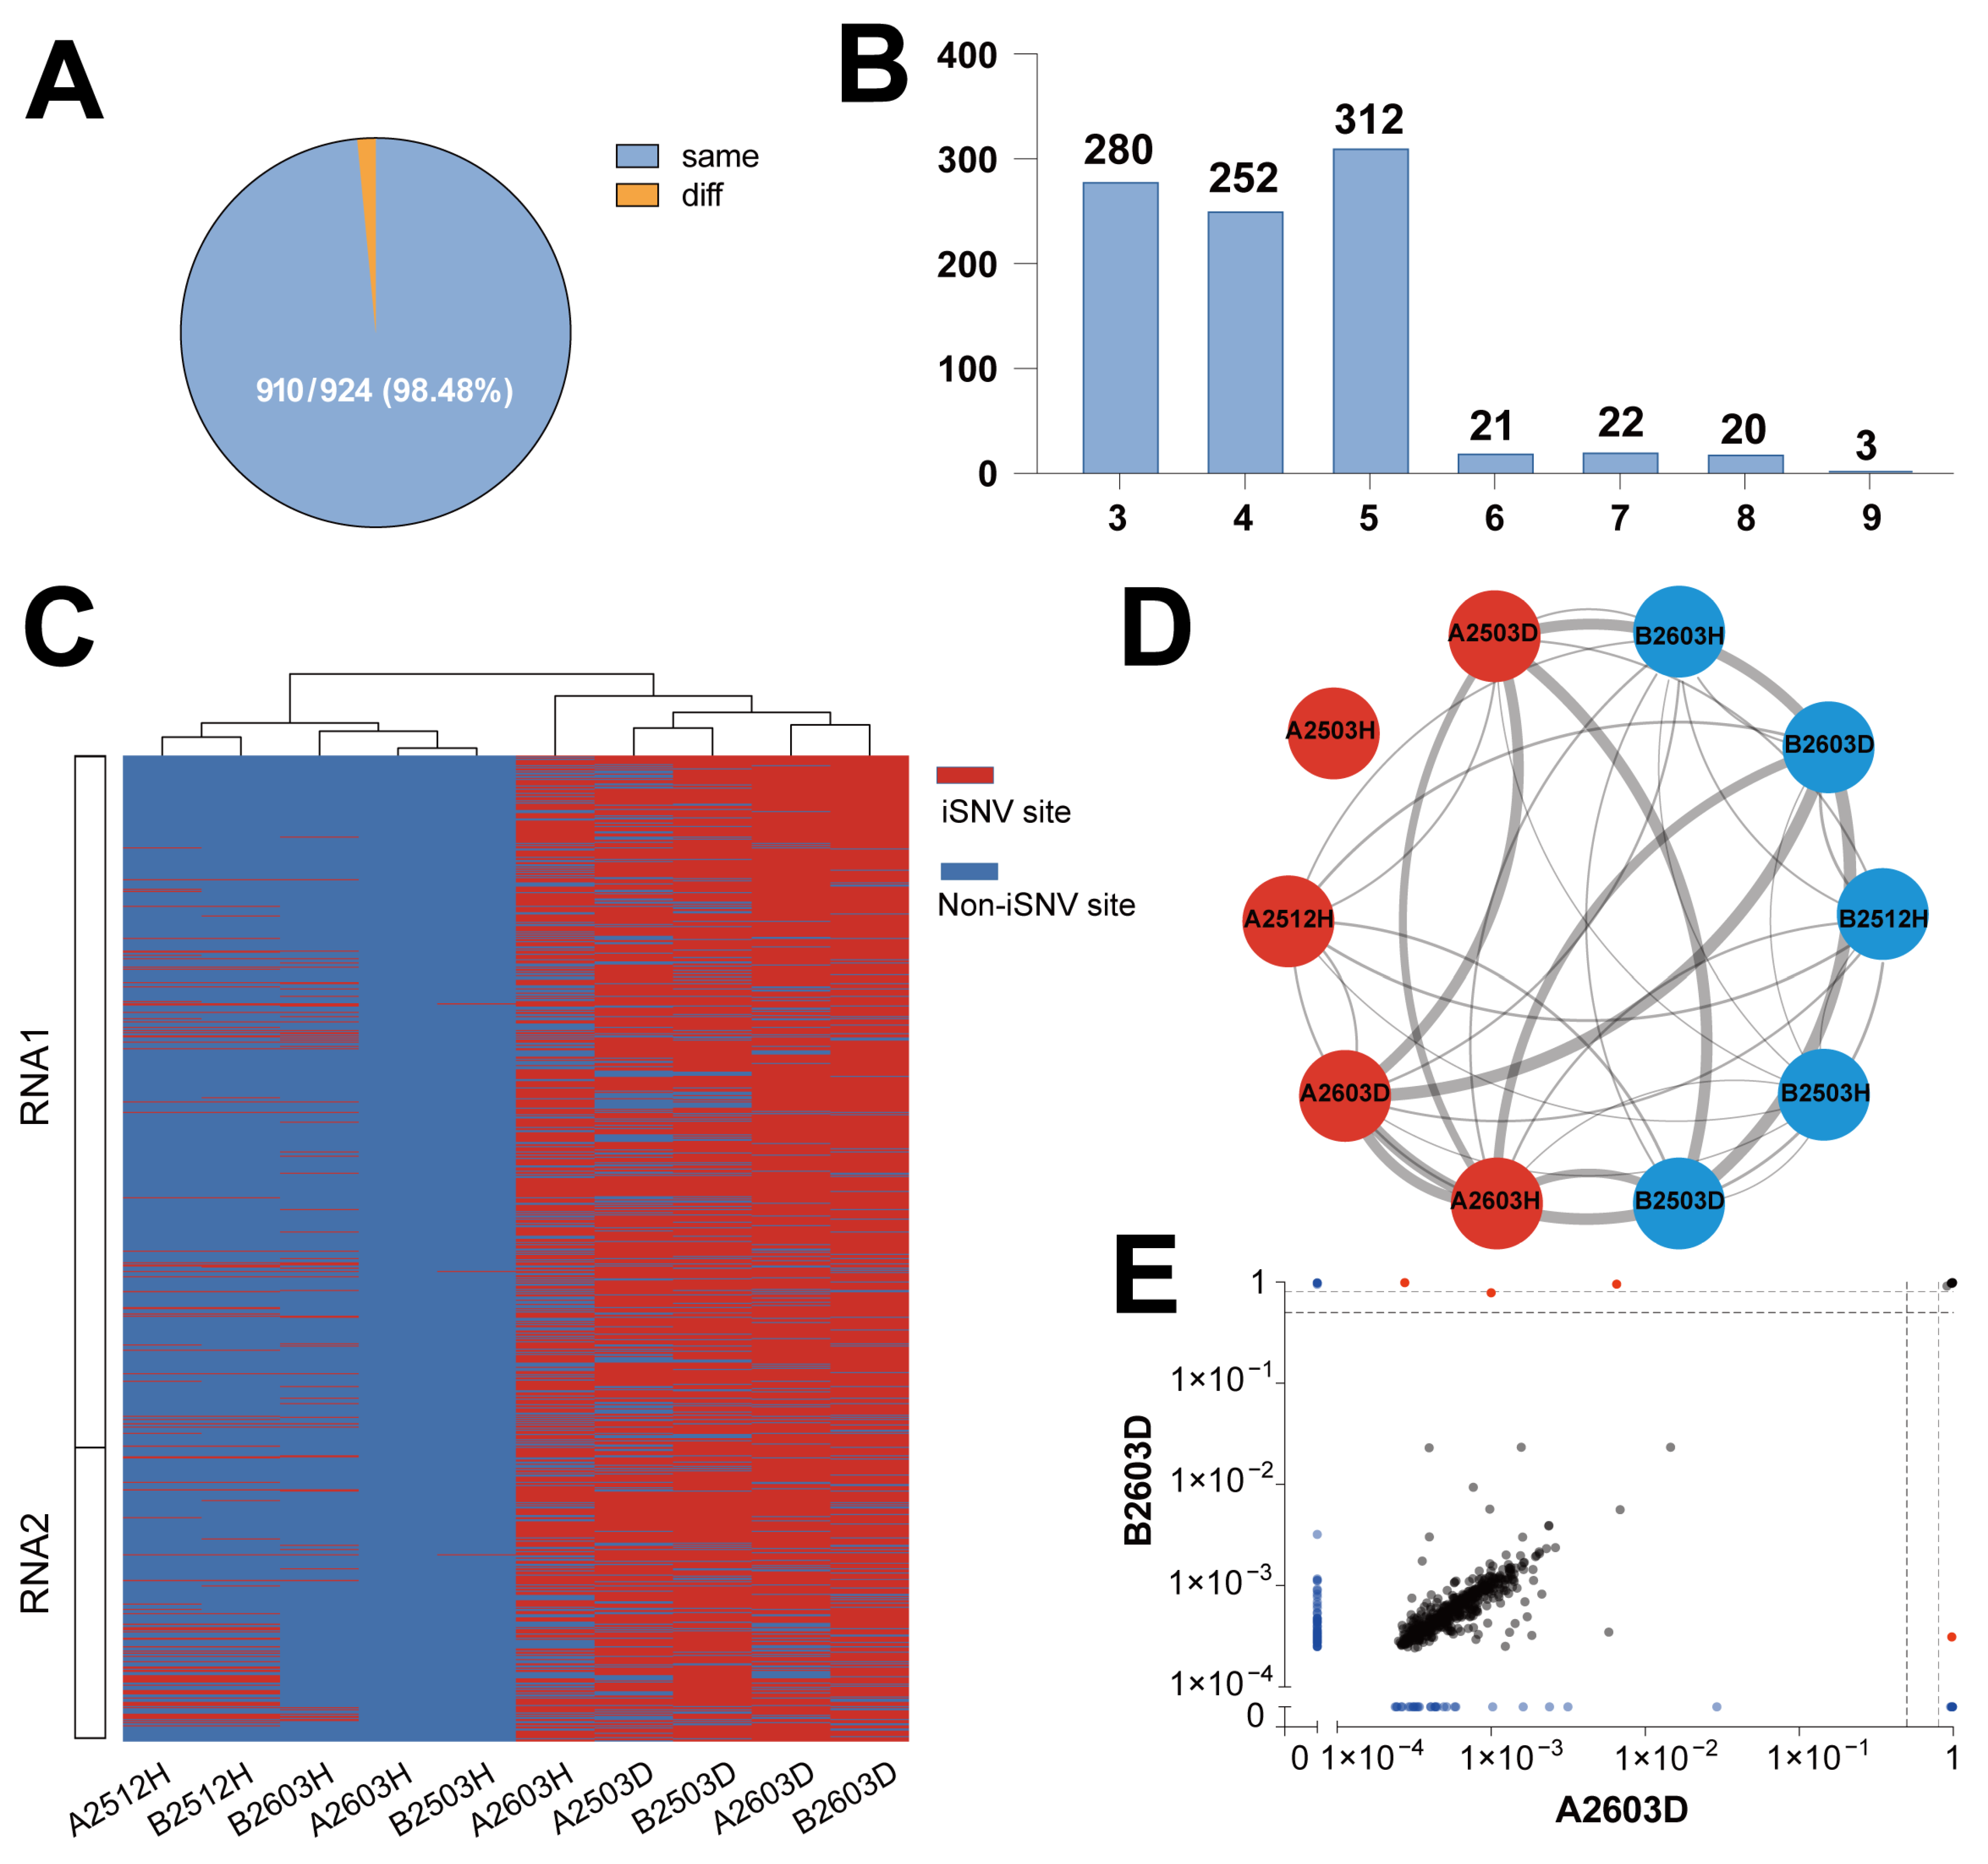
We performed stringent variant calling to connect iSNV variation with epidemiological relationships among colonies. A total of 924 high-confidence iSNV positions were retained across the CBPV genome. At 910 positions (98.48%), all carriers shared the identical alternative base; the remaining 14 positions showed allelic heterogeneity and were excluded from downstream analyses (Figure 3A). The number of carrier samples per position ranged from 3 to 9, peaking at five samples (312 sites) (Figure 3B). This high cross-sample allelic congruence supports the authenticity of our iSNV calls and indicates that these variants were predominantly acquired through shared ancestry or recent viral exchange, rather than arising independently in individual hosts.
Figure 3.
iSNV dynamics of CBPV across apiaries and years. (A) Proportion of identical versus differential iSNV call sites across all samples. (B) Frequency distribution of sites sharing the same iSNVs across different numbers of samples. (C) Shared iSNV connectivity between pools, with Colony A and Colony B distinguished by color. Upset plot showing the sharing status of iSNVs across four symptomatic samples (A2504D, B2504D, A2604D, B2604D). (D) Clustering heatmap based on binary values (0 and 1) representing the presence (1, red) or absence (0, blue) of iSNV sites across RNA1 and RNA2 segments. (E) Pairwise comparison of iSNV allele frequencies between A2604D and B2604D (RNA1 segment). iSNVs with a frequency < 1 × 10⁻⁴ in any sample are shown as blue dots, and those with a frequency > 0.5 are shown as red dots.
We next used all recurrent iSNVs to construct an undirected sharing network (Figure 3C). Symptomatic samples were densely interconnected, whereas asymptomatic samples showed markedly fewer edges, reflecting their low CBPV read depth and consequently limited iSNV detection (Figure 2E). Among the four symptomatic samples, 475 positions were shared by all four samples (Figure 3C). None reached 100% allele frequency in any symptomatic sample (maximum site-specific allele frequency = 0.993), confirming that these shared iSNVs represent true intra-host polymorphisms rather than fixed differences. The absence of 100% allele frequency also argues against shared reference genome errors or reference-mapping artefacts, both of which would be expected to appear at consistently high frequencies across carriers. Instead, median allele frequencies of these shared variants ranged from 0.046% to 0.057% and occupied a consistent low-frequency band across both years, supporting their identity as persistent, low-abundance members of the CBPV quasispecies.
Beyond the 475-core iSNVs, we traced the fates of colony-private variants from 2025 (Figure 3C). Under the ≥3-sample retention rule 923 sites were detected in asymptomatic samples. All 107 iSNVs uniquely detected in colony B in 2025 were present in both colonies in 2026. Similarly, 39 iSNVs uniquely detected in colony A in 2025 were detected in both colonies in 2026. To assess whether this filter inflated cross-year detection, we re-identified private variants from 2025 data alone without the ≥3-sample criterion, restricting this analysis to the four symptomatic pools across both colonies and both years (Tables S8 and S9). This yielded 381 variants private to colony A and 399 to colony B. Recurrence counted by position plus alternative base showed that 63 of 381 A-private variants (16.5%) and 130 of 399 B-private variants (32.6%) were detected in the opposite colony in 2026. These lower rates indicate that the ≥3-sample filter amplified apparent cross-year persistence, while still indicating measurable quasispecies exchange. This cross-year, cross-colony detection of formerly private variants supports active quiescence’s exchange during the overwintering period. Because each library represents a pool of only three bees, these numbers may reflect genuine selective loss or stochastic dropouts from limited sampling; we therefore do not draw further transmission inferences from them.
We next examined whether iSNV variation could resolve relationships that were ambiguous at the consensus level. Hierarchical clustering of iSNV presence/absence patterns produced a topology distinct from the consensus phylogeny (Figure 3D). Symptomatic samples clustered by year. Asymptomatic samples grouped together regardless of year or colony, a pattern attributable to their low iSNV counts from limited CBPV depth. To further examine the discordant phylogenetic placement on the consensus tree, we focused on A2604D and B2604D. These two samples fell into separate major clades in both RNA1 and RNA2 phylogenies. However, they shared a substantial number of low-frequency variants (Figure 3E). This sharing indicates that sequences placed in different consensus clades can remain closely connected at the quasispecies level.
We also examined whether consensus changes between consecutive outbreaks could be linked to frequency shifts in existing variants. Twelve iSNVs that were present at frequencies below 0.5 in A2504D and B2504D rose above 0.5 in A2604D the following year (Table 1). These twelve positions show that frequency shifts in pre-existing variants can occur and contribute to consensus sequence changes between years. Such frequency changes are not equivalent to the appearance of new mutations. Together, these two results show that iSNVs can connect samples that consensus sequences separate, and that their frequency shifts can influence subsequent consensus sequences. Our data do not allow us to estimate the relative contribution of this process, because the rate of de novo mutation in natural outbreaks was not measured. Furthermore, since each library represented a pool of only three bees, the detected frequency shifts may not fully represent the entire colony’s virome, and could partly reflect stochastic sampling effects.
Table 1.
iSNV frequency shifts from low to high between 2025 and 2026.
3.4. Midgut Microbiota Shows No Detectable Association with CBPV Outbreaks
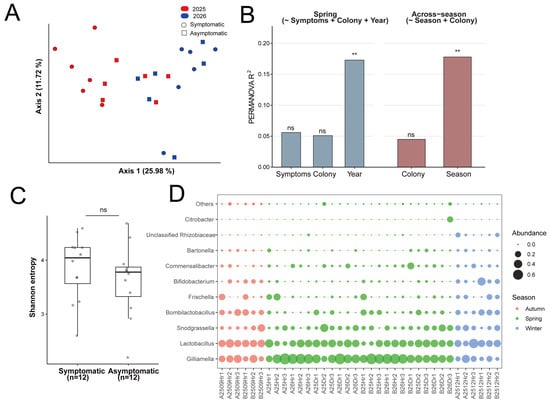
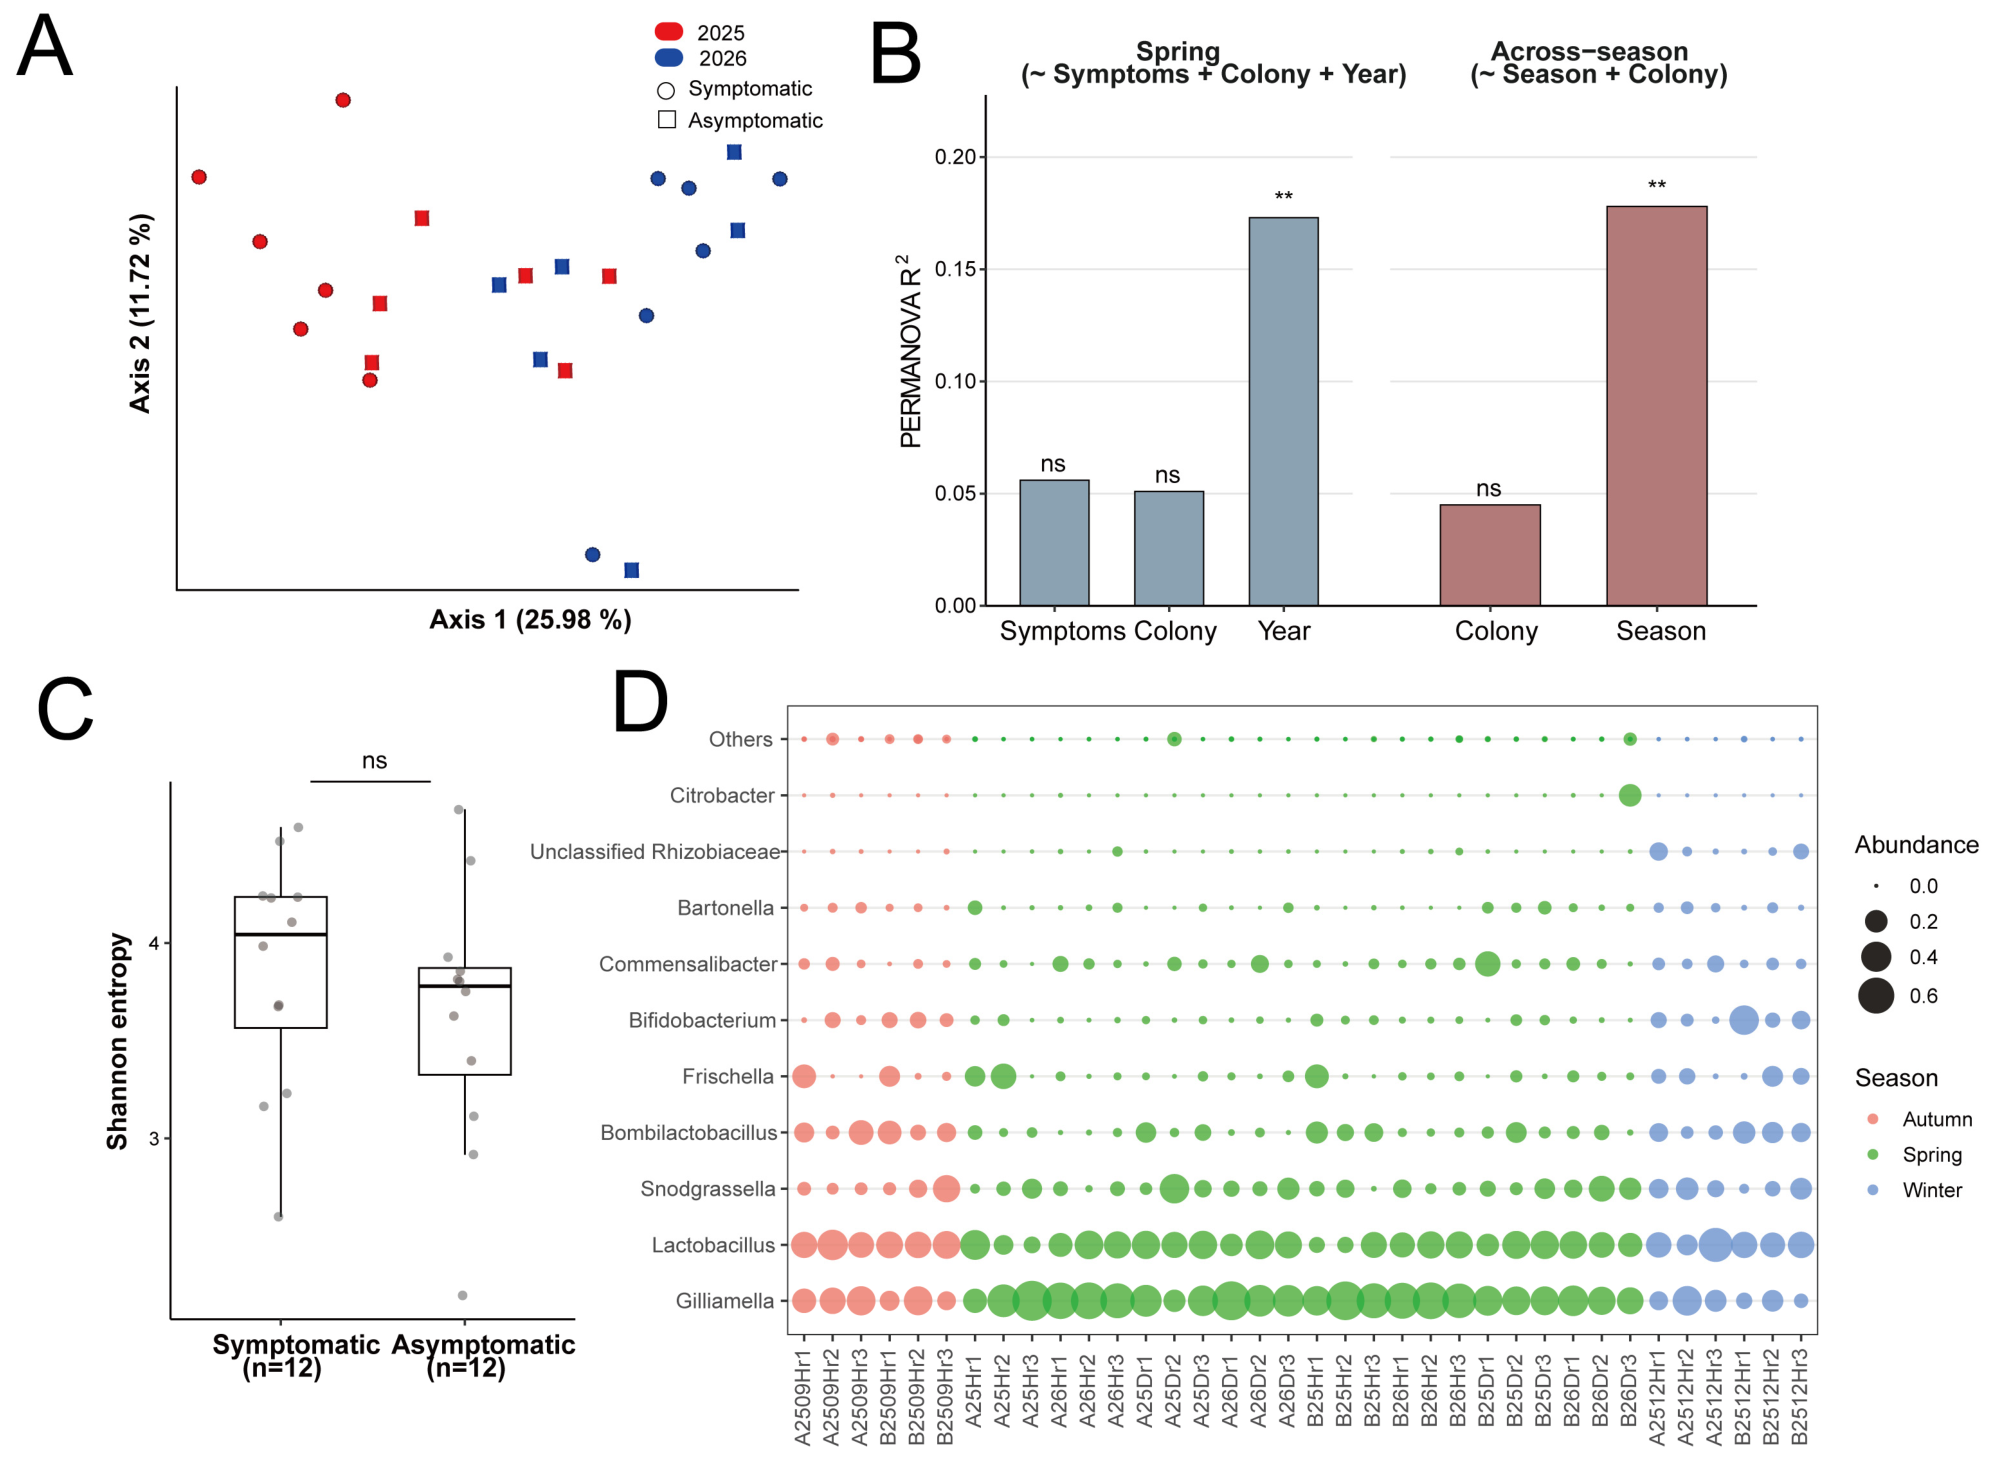
We next profiled the midgut bacterial communities of the same colony samples to ask whether the observed viral dynamics were accompanied by gut microbiota changes. PCoA of Bray–Curtis dissimilarities showed no clear separation between symptomatic and asymptomatic spring pools (Figure 4A). Consistently, PERMANOVA on spring samples (n = 24 pools; model: Symptoms + Colony + Year) showed no significant effect of symptom status on community composition (R2 = 0.056, p = 0.092), nor of colony (R2 = 0.051, p = 0.127), whereas sampling year explained a significant fraction of variation (R2 = 0.173, p = 0.001; Figure 4B). PERMDISP supported that dispersion was homogeneous for both Symptoms (p = 0.131) and colony (p = 0.383), indicating that the non-significant symptom effect is not an artefact of unequal group dispersion. Shannon diversity also did not differ between spring symptomatic (median = 4.04) and asymptomatic (median = 3.78) pools (Wilcoxon test p = 0.347; Cliff’s delta = −0.236, 95% CI [−0.634, 0.261]; Figure 4C).
Figure 4.
Gut microbiota composition is driven by temporal variation rather than CBPV symptom status. (A) Principal coordinates analysis (PCoA) of Bray–Curtis dissimilarities (Axis 1: 25.98%, Axis 2: 11.72%) for spring pools. Samples are colored by sampling year (red: 2025; blue: 2026) and shaped by symptom status (circles: symptomatic; squares: asymptomatic). (B) PERMANOVA effect sizes (R2) for the spring (~Symptoms + Colony + Year) and across-season (~Season + Colony) models. Asterisks denote significance (** p < 0.01; ns, not significant). PERMDISP results for dispersion homogeneity are indicated above the bars. (C) Shannon entropy boxplots for spring symptomatic (n = 12) and asymptomatic (n = 12) pools. No significant difference was detected (median 4.04 vs. 3.78; Wilcoxon test p = 0.347; Cliff’s delta = −0.236, 95% CI [−0.634, 0.261]). (D) Bubble plot showing the relative abundance of dominant genus-level midgut taxa across samples. Bubble size represents relative abundance, and color indicates the season (Autumn: orange, Spring: green, Winter: blue). Taxa unresolved to genus are labeled at the highest resolvable rank (e.g., Unclassified Rhizobiaceae).
The relative abundances of dominant genus-level taxa, including Gilliamella, Lactobacillus, Snodgrassella, and Bombilactobacillus, remained comparable between groups (Figure 4D). Instead, compositional variation was primarily associated with season. Across healthy samples, season was significantly associated with community composition (R2 = 0.178, p = 0.002), although PERMDISP indicated non-homogeneous seasonal dispersion (p = 0.011), requiring cautious interpretation. Exploratory analysis of the full dataset provides evidence for this seasonal signal (R2 = 0.146, p = 0.001) with no colony effect (R2 = 0.032, p = 0.211; Figure 4B). Because each health group in each season contains three pools (each pool = five bees), and these represent pool-level rather than independent colony replicates, the statistical tests should be interpreted as exploratory. Overall, we did not detect a clear association between CBPV outbreaks and midgut microbiota dysbiosis in our study population, consistent with the possibility that any such effect, if present, is subtle relative to temporal variation.
4. Discussion
We used the seasonal separation and winter co-location of two apiaries to partially mimic the long-distance translocation and winter aggregation common in commercial beekeeping. This design allowed us to track, over two consecutive years, how CBPV variants were shared between apiaries under migratory management, and to reconstruct this pattern of viral connectivity at finer resolution by combining consensus sequences with iSNVs.
CBPV viral load showed clear seasonal variation. CBPV read counts were highest in symptomatic samples in spring; no CBPV reads were detected in either sampled colony in September, and low levels of reads were present in winter, followed by a resurgence the next spring. This pattern is broadly consistent with the strong seasonality reported for CBPV [3,30]. However, the absence of reads in September likely reflects a detection limitation rather than true viral clearance. The virus may persist at very low abundance below the capture threshold of our sampling design, or sampling bias may have missed individuals carrying CBPV. The presence of abundant shared iSNVs among symptomatic samples across consecutive years supports this interpretation. Therefore, future CBPV surveillance should take into account the possibility of false negative results caused by extremely low viral loads in summer.
This study showed that CBPV harbors abundant low-frequency iSNVs within apiaries. Consensus phylogenies captured the broad population structure but did not fully resolve epidemiological linkages. Samples placed in different consensus clades in fact shared substantial numbers of low-frequency iSNVs. These shared variants remained at low frequencies, and no position reached fixation in all carriers, ruling out reference-mapping artefacts. This indicates that, for apiaries with close epidemiological links, low-frequency iSNVs are better suited than consensus sequences for resolving viral connectivity. Similar observations have been reported in Influenza A virus, Hepatitis C Virus (HCV), and SARS-CoV-2, where iSNV analysis uncovered transmission links missed by consensus phylogenies [31,32,33]. In honey bees, iSNV analysis has been used to trace DWV spread under controlled conditions [11]. The present study extends this approach to CBPV under natural beekeeping conditions. However, we note that each library represented a pool of only three bees, which may underestimate within-colony quasispecies diversity, particularly for low-abundance variants. Moreover, although annual batch sequencing prevented index hopping, sequencing year and batch remain inherently linked, limiting our ability to fully separate technical batch effects from biological temporal variation.
Colony-private iSNVs appeared in both apiaries the following year in an asymmetric pattern, indicating viral exchange between the two sites and a possible difference in the magnitude of exchange between directions. However, symptomatic samples from consecutive years alone cannot establish the directionality of viral spread. Furthermore, shared iSNVs between the two colonies may reflect not only direct viral exchange but also shared ancestry, earlier contact, or introduction from common external sources such as neighboring apiaries, which were not monitored in this study. During periods without clinical disease, the number of detectable iSNVs is limited by read depth and cannot provide more detailed information. The subsampling results showed that iSNV detection increased substantially only when read counts reached the million level. This threshold is readily achieved for symptomatic samples, but is difficult to reach for asymptomatic samples using conventional sequencing. This limitation constrains the use of iSNVs to reconstruct the full pattern of viral connectivity with greater precision. For asymptomatic samples, viral particle enrichment or targeted amplicon sequencing may be worthwhile strategies to explore.
Some low-frequency iSNVs increased to high or near-fixed frequencies in the corresponding season of the following year, indicating that persistent low-abundance variants within the quasispecies do not always remain at low frequency. They can contribute to subsequent consensus changes through frequency shifts, and this process does not necessarily require the appearance of new mutations. Similar dynamics have been reported in West Nile virus (WNV) [34]. The present study provides field evidence that this process also occurs in CBPV. Together, these results show that consensus sequences capture only the dominant alleles at a given moment and do not reflect the persistent low-frequency variation within the quasispecies. These low-frequency variants can connect samples that are separated at the consensus level, and can later rise to consensus level. As an observational field study, these results highlight the value of iSNV profiling for detecting cryptic viral connectivity, but controlled experimental validation is needed to establish causal pathways.
We observed no consistent difference in midgut microbiota composition between symptomatic and asymptomatic samples. Because PERMDISP was also significant, the seasonal differences detected may reflect both differences in centroid location and multivariate dispersion; therefore, this result should not be interpreted solely as a shift in community composition. The midgut is the first tissue barrier encountered by CBPV during fecal–oral transmission and is a major site of antimicrobial peptide production in the insect gut. It can therefore be regarded as a potential sentinel of early host responses to viral infection. However, our data did not reveal a detectable association between CBPV infection and midgut microbiota composition. This result differs from a previous report showing that CBPV infection correlates with changes in the hindgut microbiota [15]. The discrepancy may be explained by fundamental differences between the midgut and hindgut in microbial composition, immune environment, and viral load.
This study has four main limitations. First, Low CBPV read counts in asymptomatic and winter samples limited the detection of low-frequency iSNVs. Viral particle enrichment or targeted sequencing may improve sensitivity in future studies. Second, each library represented a pool of only three bees, which may underestimate the true quasispecies diversity within colonies. Moreover, although samples were sequenced in separate batches across years to prevent index hopping, sequencing year and batch remain inherently linked, limiting our ability to fully disentangle technical batch effects from biological temporal variation. Third, as an observational case study, shared viral variants indicate viral connectivity, but we cannot rule out shared ancestry, earlier contact, or common external sources, nor can we determine the direction of viral spread. Fourth, at the methodological level, no independent negative extraction control libraries were included, and overlapping paired-end reads were not specifically processed; these omissions may leave residual amplification or sequencing errors at read termini, and the absence of negative controls cannot formally exclude contamination. In addition, PCR duplicate removal was not performed because the high viral load in symptomatic libraries precluded reliable discrimination between amplification artefacts and genuine CBPV-derived reads.
5. Conclusions
In summary, this study suggests that consensus CBPV phylogenies and intra-host iSNV profiles capture distinct layers of viral variation in a migratory beekeeping system. While consensus sequences reflected broad population-level relationships, shared low-frequency iSNVs revealed patterns of viral connectivity that standard surveillance would not detect. These findings indicate that surveillance relying exclusively on consensus genomes may underestimate the extent of viral sharing between managed apiaries. However, we emphasize that shared iSNVs alone cannot distinguish direct viral connectivity from shared ancestry, earlier contact, or common external sources, nor can they determine the direction of viral sharing. Furthermore, the limited number of bees per pool and uneven sequencing depth between symptomatic and asymptomatic samples constrain the sensitivity of iSNV detection in low-titer individuals. Future investigations incorporating individual-level sampling, broader spatial replication, and controlled experimental designs will be required to move from detecting viral connectivity to establishing causal pathways. More broadly, depth-aware variant calling and explicit technical controls should be considered when applying iSNV profiling to other RNA viruses in mobile or high-density host populations.
Supplementary Materials
The following supporting information can be downloaded at: https://www.mdpi.com/article/10.3390/microorganisms14112561/s1, Table S1. Sample metadata, sequencing statistics, and viral read counts. Table S2. Sample metadata and 16S sequencing statistics. Table S3. CBPV iSNV sites across all libraries. Table S4. Allele frequencies of CBPV iSNVs at each site. Table S5. Variant-level quality metrics for ten randomly selected iSNV sites. Table S6. Cross-validation of iSNV sites between the A2504D library and the independent tissue-specific dataset. Table S7. Number of iSNV sites retained under progressive filter stringency. Table S8. Detection of 2025 A colony private variants in the 2026 B colony libraries. Table S9. Detection of 2025 B colony private variants in the 2026 A colony libraries.
Author Contributions
Conceptualization, N.L. and H.Q.; methodology, N.L., H.Q. and F.C.; software, N.L.; validation, H.Q., F.C. and X.M.; formal analysis, N.L.; investigation, H.Q. and X.M.; writing—original draft preparation, N.L., H.Q. and Z.L.; writing—review and editing, H.Q. and B.X.; visualization, N.L. and Z.L.; funding acquisition, N.L. All authors have read and agreed to the published version of the manuscript.
Funding
This research was funded by Shandong Provincial Natural Science Foundation, grant number ZR2023QC129, and the 2025 Education and Teaching Reform and Research Project of the National Food Industry Vocational Education Teaching Steering Committee (SHK2025052).
Institutional Review Board Statement
Ethical review and approval were waived for this study due to the Article 2 of China’s Regulations on the Administration of Laboratory Animals (State Council Order No. 676, 2017 revision), “experimental animals” means artificially bred animals with controlled microbiological flora and a defined genetic background used for scientific research. The honeybees in this study were free-foraging worker bees collected at the hive entrance of commercial apiaries and immediately immersed in liquid nitrogen upon collection (instantaneous euthanasia). They do not constitute experimental animals as defined by this regulation, and no experimental manipulation, artificial infection, or controlled housing was performed. Our institution, Shandong Vocational Animal Science and Veterinary College, implements this national framework and classifies this work as non-regulated field sampling, exempt from institutional animal-ethics review.
Informed Consent Statement
Informed consent for participation was obtained from all subjects involved in the study.
Data Availability Statement
Raw sequencing data have been deposited in the NCBI Sequence Read Archive under BioProject accession number PRJNA1513716. The assembled genome sequences of CBPV have been deposited in GenBank under accession numbers PZ849770-PZ849789. All raw and filtered iSNV files generated by LoFreq have been deposited on GitHub (https://github.com/lihannan/CBPV-iSNV-data, accessed on 17 October 2026).
Acknowledgments
During the preparation of this manuscript, the authors used DeepSeek web-based version (accessed 1 July to 29 October 2026) for language editing and logic checking. The authors have reviewed and edited the output and take full responsibility for the content of this publication.
Conflicts of Interest
The authors declare no conflicts of interest.
Abbreviations
The following abbreviations are used in this manuscript:
| ASVs | amplicon sequence variants |
| CBPV | Chronic bee paralysis virus |
| DWV | Deformed wing virus |
| HCV | Hepatitis C Virus |
| PCoA | Principal Coordinates Analysis |
| iSNV | intra-host single-nucleotide variant |
| WNV | West Nile virus |
References
- Ribiere, M.; Olivier, V.; Blanchard, P. Chronic bee paralysis: A disease and a virus like no other? J. Invertebr. Pathol. 2010, 103, S120–S131. [Google Scholar] [CrossRef] [Scilit] [PubMed]
- Amiri, E.; Meixner, M.; Buchler, R.; Kryger, P. Chronic bee paralysis virus in honeybee queens: Evaluating susceptibility and infection routes. Viruses 2014, 6, 1188–1201. [Google Scholar] [CrossRef] [Scilit] [PubMed]
- Budge, G.E.; Simcock, N.K.; Holder, P.J.; Shirley, M.D.F.; Brown, M.A.; Van Weymers, P.S.M.; Evans, D.J.; Rushton, S.P. Chronic bee paralysis as a serious emerging threat to honey bees. Nat. Commun. 2020, 11, 2164. [Google Scholar] [CrossRef] [Scilit] [PubMed]
- Olivier, V.; Blanchard, P.; Chaouch, S.; Lallemand, P.; Schurr, F.; Celle, O.; Dubois, E.; Tordo, N.; Thiery, R.; Houlgatte, R.; et al. Molecular characterisation and phylogenetic analysis of Chronic bee paralysis virus, a honey bee virus. Virus Res. 2008, 132, 59–68. [Google Scholar] [CrossRef] [Scilit] [PubMed]
- Blanchard, P.; Olivier, V.; Iscache, A.L.; Celle, O.; Schurr, F.; Lallemand, P.; Ribiere, M. Improvement of RT-PCR detection of chronic bee paralysis virus (CBPV) required by the description of genomic variability in French CBPV isolates. J. Invertebr. Pathol. 2008, 97, 182–185. [Google Scholar] [CrossRef] [Scilit] [PubMed]
- Li, N.; Li, C.; Hu, T.; Li, J.; Zhou, H.; Ji, J.; Wu, J.; Kang, W.; Holmes, E.C.; Shi, W.; et al. Nationwide genomic surveillance reveals the prevalence and evolution of honeybee viruses in China. Microbiome 2023, 11, 6. [Google Scholar] [CrossRef] [Scilit] [PubMed]
- Domingo, E.; Sheldon, J.; Perales, C. Viral quasispecies evolution. Microbiol. Mol. Biol. Rev. 2012, 76, 159–216. [Google Scholar] [CrossRef] [Scilit] [PubMed]
- Gregori, J.; Salicru, M.; Ibanez-Lligona, M.; Colomer-Castell, S.; Campos, C.; Gonzalez-Camuesco, A.; Quer, J. Viral Quasispecies Inference from Single Observations-Mutagens as Accelerators of Quasispecies Evolution. Microorganisms 2025, 13, 2029. [Google Scholar] [CrossRef] [Scilit] [PubMed]
- Jary, A.; Leducq, V.; Malet, I.; Marot, S.; Klement-Frutos, E.; Teyssou, E.; Soulie, C.; Abdi, B.; Wirden, M.; Pourcher, V.; et al. Evolution of viral quasispecies during SARS-CoV-2 infection. Clin. Microbiol. Infect. 2020, 26, 1560 e1–1560 e4. [Google Scholar] [CrossRef] [Scilit] [PubMed]
- Zeuzem, S. Hepatitis C virus: Kinetics and quasispecies evolution during anti-viral therapy. Forum 2000, 10, 32–42. [Google Scholar] [PubMed]
- Yanez, O.; Chavez-Galarza, J.; Tellgren-Roth, C.; Pinto, M.A.; Neumann, P.; de Miranda, J.R. The honeybee (Apis mellifera) developmental state shapes the genetic composition of the deformed wing virus-A quasispecies during serial transmission. Sci. Rep. 2020, 10, 5956. [Google Scholar] [CrossRef] [Scilit] [PubMed]
- Alger, S.A.; Burnham, P.A.; Lamas, Z.S.; Brody, A.K.; Richardson, L.L. Home sick: Impacts of migratory beekeeping on honey bee (Apis mellifera) pests, pathogens, and colony size. PeerJ 2018, 6, e5812. [Google Scholar] [CrossRef] [Scilit] [PubMed]
- Lin, Z.; Shen, S.; Wang, K.; Ji, T. Biotic and abiotic stresses on honeybee health. Integr. Zool. 2024, 19, 442–457. [Google Scholar] [CrossRef] [Scilit] [PubMed]
- Ribiere, M.; Lallemand, P.; Iscache, A.L.; Schurr, F.; Celle, O.; Blanchard, P.; Olivier, V.; Faucon, J.P. Spread of infectious chronic bee paralysis virus by honeybee (Apis mellifera L.) feces. Appl. Environ. Microbiol. 2007, 73, 7711–7716. [Google Scholar] [CrossRef] [Scilit] [PubMed]
- Deng, Y.; Yang, S.; Zhang, L.; Chen, C.; Cheng, X.; Hou, C. Chronic bee paralysis virus exploits host antimicrobial peptides and alters gut microbiota composition to facilitate viral infection. ISME J. 2024, 18, wrae051. [Google Scholar] [CrossRef] [Scilit] [PubMed]
- Chen, S.F. fastp 1.0: An ultra-fast all-round tool for FASTQ data quality control and preprocessing. Imeta 2025, 4, e70078. [Google Scholar] [CrossRef] [Scilit] [PubMed]
- Grabherr, M.G.; Haas, B.J.; Yassour, M.; Levin, J.Z.; Thompson, D.A.; Amit, I.; Adiconis, X.; Fan, L.; Raychowdhury, R.; Zeng, Q.; et al. Full-length transcriptome assembly from RNA-Seq data without a reference genome. Nat. Biotechnol. 2011, 29, 644–652. [Google Scholar] [CrossRef] [Scilit] [PubMed]
- Buchfink, B.; Reuter, K.; Drost, H.G. Sensitive protein alignments at tree-of-life scale using DIAMOND. Nat. Methods 2021, 18, 366–368. [Google Scholar] [CrossRef] [Scilit] [PubMed]
- Langmead, B.; Salzberg, S.L. Fast gapped-read alignment with Bowtie 2. Nat. Methods 2012, 9, 357–359. [Google Scholar] [CrossRef] [Scilit] [PubMed]
- Magoc, T.; Salzberg, S.L. FLASH: Fast length adjustment of short reads to improve genome assemblies. Bioinformatics 2011, 27, 2957–2963. [Google Scholar] [CrossRef] [Scilit] [PubMed]
- Bolyen, E.; Rideout, J.R.; Dillon, M.R.; Bokulich, N.A.; Abnet, C.C.; Al-Ghalith, G.A.; Alexander, H.; Alm, E.J.; Arumugam, M.; Asnicar, F.; et al. Reproducible, interactive, scalable and extensible microbiome data science using QIIME 2. Nat. Biotechnol. 2019, 37, 852–857, Erratum in Nat. Biotechnol. 2019, 37, 1091. https://doi.org/10.1038/s41587-019-0252-6. [Google Scholar] [CrossRef] [Scilit] [PubMed]
- Quast, C.; Pruesse, E.; Yilmaz, P.; Gerken, J.; Schweer, T.; Yarza, P.; Peplies, J.; Glockner, F.O. The SILVA ribosomal RNA gene database project: Improved data processing and web-based tools. Nucleic Acids Res. 2013, 41, D590–D596. [Google Scholar]
- Danecek, P.; Bonfield, J.K.; Liddle, J.; Marshall, J.; Ohan, V.; Pollard, M.O.; Whitwham, A.; Keane, T.; McCarthy, S.A.; Davies, R.M.; et al. Twelve years of SAMtools and BCFtools. Gigascience 2021, 10, giab008. [Google Scholar] [CrossRef] [Scilit] [PubMed]
- Edgar, R.C. Muscle5: High-accuracy alignment ensembles enable unbiased assessments of sequence homology and phylogeny. Nat. Commun. 2022, 13, 6968. [Google Scholar] [CrossRef] [Scilit] [PubMed]
- Nguyen, L.T.; Schmidt, H.A.; von Haeseler, A.; Minh, B.Q. IQ-TREE: A fast and effective stochastic algorithm for estimating maximum-likelihood phylogenies. Mol. Biol. Evol. 2015, 32, 268–274. [Google Scholar] [CrossRef] [Scilit] [PubMed]
- Rambaut, A. FigTree, version 1.4.4; Institute of Evolutionary Biology, University of Edinburgh: Edinburgh, UK, 2018. Available online: https://github.com/rambaut/figtree (accessed on 1 December 2025).
- Wilm, A.; Aw, P.P.; Bertrand, D.; Yeo, G.H.; Ong, S.H.; Wong, C.H.; Khor, C.C.; Petric, R.; Hibberd, M.L.; Nagarajan, N. LoFreq: A sequence-quality aware, ultra-sensitive variant caller for uncovering cell-population heterogeneity from high-throughput sequencing datasets. Nucleic Acids Res. 2012, 40, 11189–11201. [Google Scholar] [CrossRef] [Scilit] [PubMed]
- Cherven, K. Mastering Gephi Network Visualization, 1st ed.; Packt Publishing: Birmingham, UK, 2015. [Google Scholar]
- Li, N.; Wang, D.; Yu, H.; Xu, Z.; Qin, H.; Li, W. Tissue-Resolved Virome Analysis of Natural Chronic Bee Paralysis Virus Outbreak in Apis mellifera Reveals Segment Stoichiometry Shifts and Divergent Covert Infections. Viruses 2026, 18, 938. [Google Scholar] [CrossRef] [Scilit] [PubMed]
- Zavatta, L.; Bortolotti, L.; Catelan, D.; Granato, A.; Guerra, I.; Medrzycki, P.; Mutinelli, F.; Nanetti, A.; Porrini, C.; Sgolastra, F.; et al. Spatiotemporal evolution of the distribution of Chronic bee paralysis virus (CBPV) in honey bee colonies. Virology 2024, 598, 110191. [Google Scholar] [CrossRef] [Scilit] [PubMed]
- Larouche, A.; Milton McSween, K.A.; Calderon, V.; Fauteux-Daniel, S.; Boulais, J.; Ransy, D.G.; Boucher, M.; Lamarre, V.; Lapointe, N.; Boucoiran, I.; et al. Quasispecies Diversity Is a Major Risk Factor for Vertical Hepatitis C Virus Transmission. J. Infect. Dis. 2019, 219, 760–771. [Google Scholar] [CrossRef] [Scilit] [PubMed]
- Ghafari, M.; Kemp, S.A.; Hall, M.; Clarke, J.; Ferretti, L.; Thomson, L.; Studley, R.; Walker, A.S.; Golubchik, T.; Lythgoe, K. SARS-CoV-2 genomic diversity and within-host evolution in individuals with persistent infection in the UK: An observational, longitudinal, population-based surveillance study. Lancet Microbe 2025, 6, 101154. [Google Scholar] [CrossRef] [Scilit] [PubMed]
- Lin, P.; Jin, T.; Yu, X.; Liang, L.; Liu, G.; Jovic, D.; Sun, Z.; Yu, Z.; Pan, J.; Fan, G. Composition and Dynamics of H1N1 and H7N9 Influenza A Virus Quasispecies in a Co-infected Patient Analyzed by Single Molecule Sequencing Technology. Front. Genet. 2021, 12, 754445. [Google Scholar] [CrossRef] [Scilit] [PubMed]
- Caldwell, H.S.; Lasek-Nesselquist, E.; Follano, P.; Kramer, L.D.; Ciota, A.T. Divergent Mutational Landscapes of Consensus and Minority Genotypes of West Nile Virus Demonstrate Host and Gene-Specific Evolutionary Pressures. Genes. 2020, 11, 1299. [Google Scholar] [CrossRef] [Scilit] [PubMed]

Disclaimer/Publisher’s Note: The statements, opinions and data contained in all publications are solely those of the individual author(s) and contributor(s) and not of MDPI and/or the editor(s). MDPI and/or the editor(s) disclaim responsibility for any injury to people or property resulting from any ideas, methods, instructions or products referred to in the content. |
© 2026 by the authors. Licensee MDPI, Basel, Switzerland. This article is an open access article distributed under the terms and conditions of the Creative Commons Attribution (CC BY) license.