


Abstract
Hashimoto’s thyroiditis (HT) is one of the most prevalent autoimmune disorders worldwide, yet the environmental triggers driving its progression, especially in the euthyroid state, remain largely elusive. This cross-sectional study investigates the gut–thyroid axis in 20 euthyroid HT patients and 20 matched healthy controls using 16S rRNA gene ribotyping and PICRUSt2 functional profiling. HT patients exhibited significant intestinal dysbiosis, characterized by a marked reduction in microbial diversity and a distinct community structure relative to controls. Taxonomic analysis revealed an expansion of potentially pathogenic taxa, including Staphylococcus aureus, Lawsonella clevelandensis, Prevotella VZCB and Acinetobacter plantarum. Conversely, a significant depletion was observed in key short-chain fatty acid (SCFA)-producing bacteria, specifically within the Faecalibacterium genus (Faecalibacterium PRLD, F. duncaniae, F. prausnitzii, F. hattorii, F. longum). Functional inference using PICRUSt2 suggested an enrichment of predicted pathways involved in bacterial virulence and antimicrobial resistance, including those associated with Staphylococcus aureus infection, staphylococcal enterotoxin production, and β-lactam resistance. Euthyroid HT patients displayed distinct gut microbial alterations and pro-inflammatory functional profiles, suggesting that microbial dysbiosis occurs independently of overt thyroid hormone dysfunction. Targeting the gut microbiome may offer novel avenues for diagnosis, risk stratification, and targeted therapeutic interventions in autoimmune thyroid diseases.
1. Introduction
Hashimoto’s thyroiditis (HT) is one of the most prevalent autoimmune endocrine disorders worldwide [1]. It is characterized by chronic thyroid inflammation, lymphocytic infiltration, and the production of autoantibodies targeting thyroglobulin (TG) and thyroid peroxidase (TPO) [2]. Although often asymptomatic in its early stages, HT may present with thyroid enlargement and progress to overt hypothyroidism [3], which generally requires lifelong levothyroxine replacement therapy. If inadequately managed, hypothyroidism may lead to serious complications [4,5], including malignancies [6]. HT represents a substantial public health burden, although reported prevalence estimates vary according to population characteristics, geographic region, and diagnostic criteria, ranging from 0.2% to 5.3% in European populations and reaching 14.2% in some African countries [7,8]. Notably, women are affected approximately ten times more frequently than men [9,10].
The pathogenesis of HT involves complex interactions between genetic susceptibility and environmental exposures [3]. Twin studies have reported a concordance rate of approximately 55% in monozygotic twins, compared with 0% in dizygotic twins [11,12]. Genetic factors, including variants in the human leukocyte antigen (HLA) class I and II regions and the cytotoxic T-lymphocyte-associated protein 4 (CTLA-4) gene, are implicated in the loss of immune tolerance associated with HT [3]. Environmental factors, including excessive iodine intake, smoking, vitamin D deficiency, and certain infections, such as Helicobacter pylori and Epstein–Barr virus, have also been implicated in disease development [13]. Nevertheless, the precise mechanisms through which these exposures may contribute to the breakdown of thyroid immune tolerance remain incompletely understood.
The gut microbiota has attracted increasing attention because of its pivotal role in immune regulation and endocrine physiology [14]. The concept of the “gut–thyroid axis” describes a bidirectional relationship in which thyroid hormones influence gastrointestinal motility and intestinal physiology, while gut microorganisms may affect the bioavailability of iodine and other micronutrients relevant to thyroid function [15,16,17]. Alterations in gut microbial composition have been reported in autoimmune thyroid diseases, including HT [18,19], and have been associated with increased intestinal permeability, often referred to as “leaky gut” [18,20,21]. These alterations may drive disease pathogenesis through several proposed mechanisms, including modulation of immune responses, disruption of immune tolerance, and perturbations of thyroid hormone homeostasis. The latter may involve microbial influences on iodothyronine metabolism and deiodinase activity, although the underlying mechanisms remain incompletely established [22,23].
Impairment of the intestinal barrier may also facilitate the translocation of microbial components, including lipopolysaccharides (LPS), and dietary antigens across the intestinal epithelium [21]. Increased systemic exposure to these components may activate innate and adaptive immune responses, contribute to low-grade systemic inflammation, and disrupt immune homeostasis [21,24]. In genetically susceptible individuals, persistent immune activation and potential molecular mimicry between microbial and thyroid antigens may further contribute to the loss of immune tolerance and the initiation or maintenance of thyroid autoimmunity [18,19,20].
In addition to immunological effects, the gut microbiota influences the absorption, metabolism, and bioavailability of key micronutrients, including iodine, selenium, zinc, and iron, which are crucial for physiological thyroid function and the activity of thyroid-associated enzymes, such as thyroid peroxidase. Associations between micronutrient deficiencies and thyroid dysfunction have been established, although the extent to which microbiota-mediated changes contribute to these relationships requires further elucidation [17,18,25]. Short-chain fatty acids (SCFAs), particularly butyrate, are key microbial metabolites involved in colonocyte energy metabolism, mucus layer maintenance, intestinal tight-junction assembly, and systemic immune regulation. Consequently, depletion of SCFA-producing bacterial populations may lead to compromised intestinal barrier integrity, heightened permeability, and aberrant immune activation [18,22].
Despite growing interest in the gut–thyroid axis, the specific relationships between gut microbial composition, microbial functional potential, and HT remain incompletely understood. The present study aimed to characterize gut microbial composition and predicted functional potential in euthyroid patients with HT compared to healthy controls. By examining these features, this work seeks to improve our understanding of the microbial contributions to HT pathogenesis and to provide a foundation for future diagnostic and mechanistic studies.
2. Materials and Methods
2.1. Subjects
The study protocol was approved by the Ethics Committee of the University Hospital of Constantine, Algeria (approval no. CE/CHUC/21/03/2025). Written informed consent was obtained from all participants prior to sample collection. A total of 40 participants were recruited from the Department of Endocrinology at the University Hospital of Constantine. The cohort comprised 20 patients with Hashimoto’s thyroiditis and 20 healthy controls matched for age, sex, and body mass index (BMI). HT diagnosis was confirmed by a board-certified endocrinologist based on clinical history, physical examination, biochemical and thyroid autoantibody testing, and thyroid ultrasonography. Inclusion criteria for patients were an age of 20–79 years and elevated serum autoantibodies against thyroid peroxidase (TPOAb) and/or thyroglobulin (TGAb). Exclusion criteria for all participants included pregnancy or lactation, active smoking, alcohol dependency, antibiotic, probiotic or prebiotic use within the preceding three months, and a history of other autoimmune disorders. All HT patients were receiving levothyroxine replacement therapy and maintained TSH levels within the normal reference range that did not differ significantly from controls; thus, the HT group was clinically euthyroid at the time of sampling.
2.2. Sample Collection
Fecal samples were collected by participants using disposable sterile swabs and collection tubes prefilled with a DNA stabilization buffer, following detailed standardized instructions provided prior to sampling. Participant metadata, including a unique anonymized identifier and the exact time of collection, were recorded directly on each sample vial. Samples were promptly transported to the laboratory, aliquoted, snap-frozen on dry ice, and stored at −80 °C until DNA extraction.
2.3. DNA Extraction
Total bacterial genomic DNA was extracted from fecal samples using a modified phenol-chloroform extraction protocol (P method), as previously described [26]. Both organic extraction and subsequent ethanol precipitation were performed at the Center for Biotechnology Research (CRBt, Constantine, Algeria). DNA yield and purity were evaluated using a NanoDrop 2000 spectrophotometer (Thermo Fisher Scientific, Waltham, MA, USA). DNA structural integrity was verified by 2% agarose gel electrophoresis. Concentrated DNA samples were normalized to a final concentration of 10 ng/μL in nuclease-free water and stored at −20 °C until library preparation and downstream sequencing analysis.
2.4. 16S rRNA Gene Amplification
To profile bacterial community composition, the hypervariable V3–V4 regions of the 16S rRNA gene were amplified using universal primers containing Illumina adapters:
Forward primer (S-D-Bact-0341-b-S-17, 5′→3′):
TCGTCGGCAGCGTCAGATGTGTATAAGAGACAGCCTACGGGNGGCWGCAG
Reverse primer (S-D-Bact-0785-a-A-21, 5′→3′):
GTCTCGTGGGCTCGGAGATGTGTATAAGAGACAGGACTACHVGGGTATCTAATCC.
Primary PCR amplification was conducted in a total reaction volume of 25 μL containing 5 μL of template genomic DNA, 12.5 μL of NEBNext® Ultra™ II Q5® Master Mix (New England Biolabs, Frankfurt, Germany), 10 pmol/μL of each locus-specific primer, and 5 μL of nuclease-free water. Thermal cycling conditions consisted of an initial denaturation at 98 °C for 30 s; 20 cycles of denaturation at 98 °C for 10 s, annealing at 60 °C for 30 s, and extension at 72 °C for 30 s; followed by a final extension at 72 °C for 2 min. A secondary index PCR was subsequently performed to attach dual-index barcodes and Illumina sequencing adapters using the Nextera XT Index Kit v2 Set A (Illumina, San Diego, CA, USA). Purified amplicons were combined with Illumina indices and NEBNext Ultra II Q5 Master Mix under the following indexing program: 98 °C for 30 s; 8 cycles of 98 °C for 10 s, 55 °C for 30 s, and 72 °C for 30 s; and a final extension at 72 °C for 2 min. The resulting indexed amplicons were purified using CleanNGS beads (CleanNA, Waddinxveen, The Netherlands). DNA concentrations were quantified using the QuantiFluor® dsDNA System (Promega, Madison, WI, USA). Equimolar amounts of each indexed sample were pooled to construct a composite library normalized to a final concentration of 4 nM. Negative control samples, which yielded no detectable amplification, were included in the library pool at equal volumes. Sequencing was performed on an Illumina MiSeq platform using a v3 reagent cartridge (2 × 300 bp paired-end reads). Amplification, library preparation, sequencing, and primary processing were executed as previously reported [27].
2.5. 16S Downstream Sequence Processing
The resulting raw reads were processed using the Integrated Microbial Next Generation Sequencing (IMNGS) online platform [28]. Within this workflow, primer and barcode sequences were trimmed, and low-quality or chimeric reads were removed. The remaining reads were denoised to generate zero-radius operational taxonomic units (ZOTUs), representing sequence variants that accurately reflect the microbial diversity present in the samples. Taxonomic classification of generated ZOTUs was carried out using the Ribosomal Database Project (RDP) classifier [29]. Given the limited taxonomic resolution of the V3–V4 region, species-level assignments were considered exploratory and interpreted with caution. The resulting quality-filtered reads were processed in R (version 4.0.2) using scripts from the Rhea pipeline [30] for the analysis of diversity and taxonomic distributions. To evaluate microbial community diversity, α-diversity was calculated in terms of richness, Shannon index and Simpson index. β-diversity was evaluated using Bray–Curtis dissimilarity to assess structural differences between study groups. Principal Coordinates Analysis (PCoA) was performed to visualize the multidimensional distance matrix in two-dimensional space. To statistically test for significant differences in community composition among and between groups, Permutational Multivariate Analysis of Variance (PERMANOVA) was conducted using the adonis function from the vegan package, for both overall and pairwise comparisons. To identify bacterial taxa differentially represented between patients and healthy controls, Linear Discriminant Analysis Effect Size (LEfSe) was conducted using the Microbiome Analyst web-based platform [31]. The analysis was performed on a species-level taxonomic abundance table, with sample type (Hashimoto’s thyroiditis versus healthy controls) specified as the experimental factor. Prior to LEfSe analysis, low-abundance features were filtered out, and the remaining abundance data were normalized using total sum scaling. An absolute log10 LDA score threshold of 2 was applied to define a relevant effect size, and statistical significance was assessed using the Benjamini–Hochberg false discovery rate correction (FDR), with species showing FDR-adjusted p-values < 0.10 considered discriminatory.
Receiver Operating Characteristic (ROC) analysis was performed in R version 4.6.1 using the pROC package (version 1.19.1) to explore the ability of four LEfSe-selected taxa, Faecalibacterium PRLD (F. PRLD), Staphylococcus aureus, Lawsonella clevelandensis, and Acinetobacter plantarum, to distinguish HT cases from healthy controls. Each taxon was evaluated separately using untransformed relative-abundance data, with HT designated as the case group. Areas under the curve (AUCs) and 95% confidence intervals were estimated using the DeLong method; Youden-index cut-offs and corresponding sensitivity and specificity were also calculated. AUCs were compared with 0.5 using two-sided Wald z-tests based on the DeLong standard error (these p-values were not adjusted for multiple comparisons). Because feature selection and ROC evaluation were performed in the same small dataset and no independent validation cohort was available, the analyses were considered exploratory and are not intended to establish clinical diagnostic performance. Finally, correlations were calculated using Spearman’s rank method with rcorr() in the Hmisc package, and heatmaps were generated using pheatmap.
2.6. Functional Profiling and KEGG Orthology Annotation
We used Phylogenetic Investigation of Communities by Reconstruction of Unobserved States PICRUSt2 [32] to predict the functional composition of microbial communities based on taxonomic and sequence profiles. The analysis was carried out using the full PICRUSt2 pipeline on the Galaxy Europe platform [33]. The input data consisted of ZOTUs derived from 16S rRNA gene sequences. PICRUSt2 was run with default parameters for sequence placement, hidden-state prediction, and functional annotation. The weighted Nearest Sequenced Taxon Index (NSTI) scores ranged from 0.050 to 0.216, with a mean of 0.110 ± 0.042, indicating a high degree of similarity between the study’s ZOTUs and available reference genomes. Functional predictions were generated as KEGG Orthology (KO) identifiers for each sample. KO identifiers were functionally mapped to the Kyoto Encyclopedia of Genes and Genomes (KEGG) database (v114.0, accessed May 2025) using the R package KEGGREST (v1.44.1) [34]. These annotations were subsequently aggregated into higher-level KEGG pathway categories to facilitate biological interpretation.
2.7. Differential Functional Analysis and Pathway Enrichment
Differential abundance analysis was performed using the DESeq2 package in R (v4.4.0), with quality control steps including removal of missing values and low-abundance KOs via independent filtering. Raw KO counts were normalized by the median-of-ratios method to account for sequencing depth. A negative binomial model was fitted with the study group variable (Hashimoto’s vs. Control) as the primary factor, and significance was assessed using the Wald test with Benjamini–Hochberg FDR correction. Features with FDR < 0.05 and log2-fold change > 1 were considered significant. No outliers were detected using Cook’s distance. Visualizations were generated in a Python environment (v3.11.13) using matplotlib (v3.10.3) [35] and seaborn (v0.13.2) [36]. To perform functional enrichment analysis, we utilized the KEGG database and the R package clusterProfiler (v4.12.6) [37] to map biological pathways to corresponding KO identifiers. Over-Representation Analysis (ORA) was carried out with the enrichKEGG() function, with KOs at an FDR < 0.05 considered significant. For Gene Set Enrichment Analysis (GSEA) [38], a preranked analysis was executed using gseKEGG() with the fgsea algorithm. The complete KO list was ranked according to DESeq2-derived log2 fold changes, employing 10,000 permutations to estimate statistical significance. ORA visualizations were generated in R using the enrichplot package (v1.24.4) and ggplot2 (v3.5.2). GSEA plots were generated in Python using matplotlib and seaborn. Top enriched pathways were selected based on their normalized enrichment score (NES) and statistical significance (p-adj < 0.05). For each enriched pathway, we identified the leading-edge gene set, recorded the set size and NES and assessed the significance using a threshold of p-adj < 0.01. Data processing and visualizations were managed using pandas (version 2.2.2) [39], matplotlib, and seaborn.
3. Results
3.1. Study Population
The demographic and clinical characteristics of the study participants are summarized in Table 1. Both groups were well-matched with no significant differences in age, sex, or body mass index (BMI). As expected, HT patients exhibited significantly higher TPOAb and TGAb concentrations compared to controls (p < 0.05), reflecting underlying thyroid autoimmune. However, serum thyroid-stimulating hormone (TSH) levels did not differ significantly between groups, confirming that the HT cohort was in a clinically euthyroid state under levothyroxine replacement therapy at the time of sampling. In summary, baseline demographic profiles were comparable across both groups, with expected differences restricted to autoimmune markers and medical treatment status.
Table 1.
Clinical characteristics of the study participants.
3.2. Alterations in Gut Microbial Diversity and Community Structure Define HT Dysbiosis
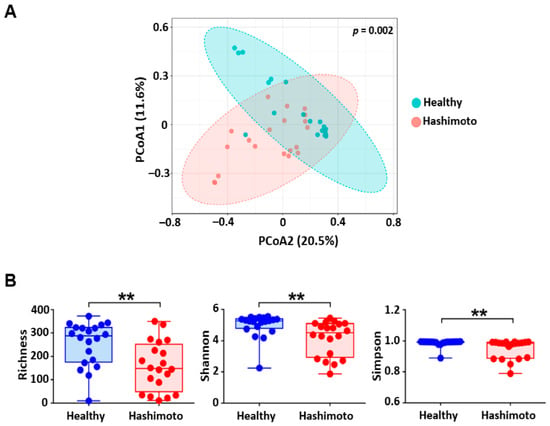
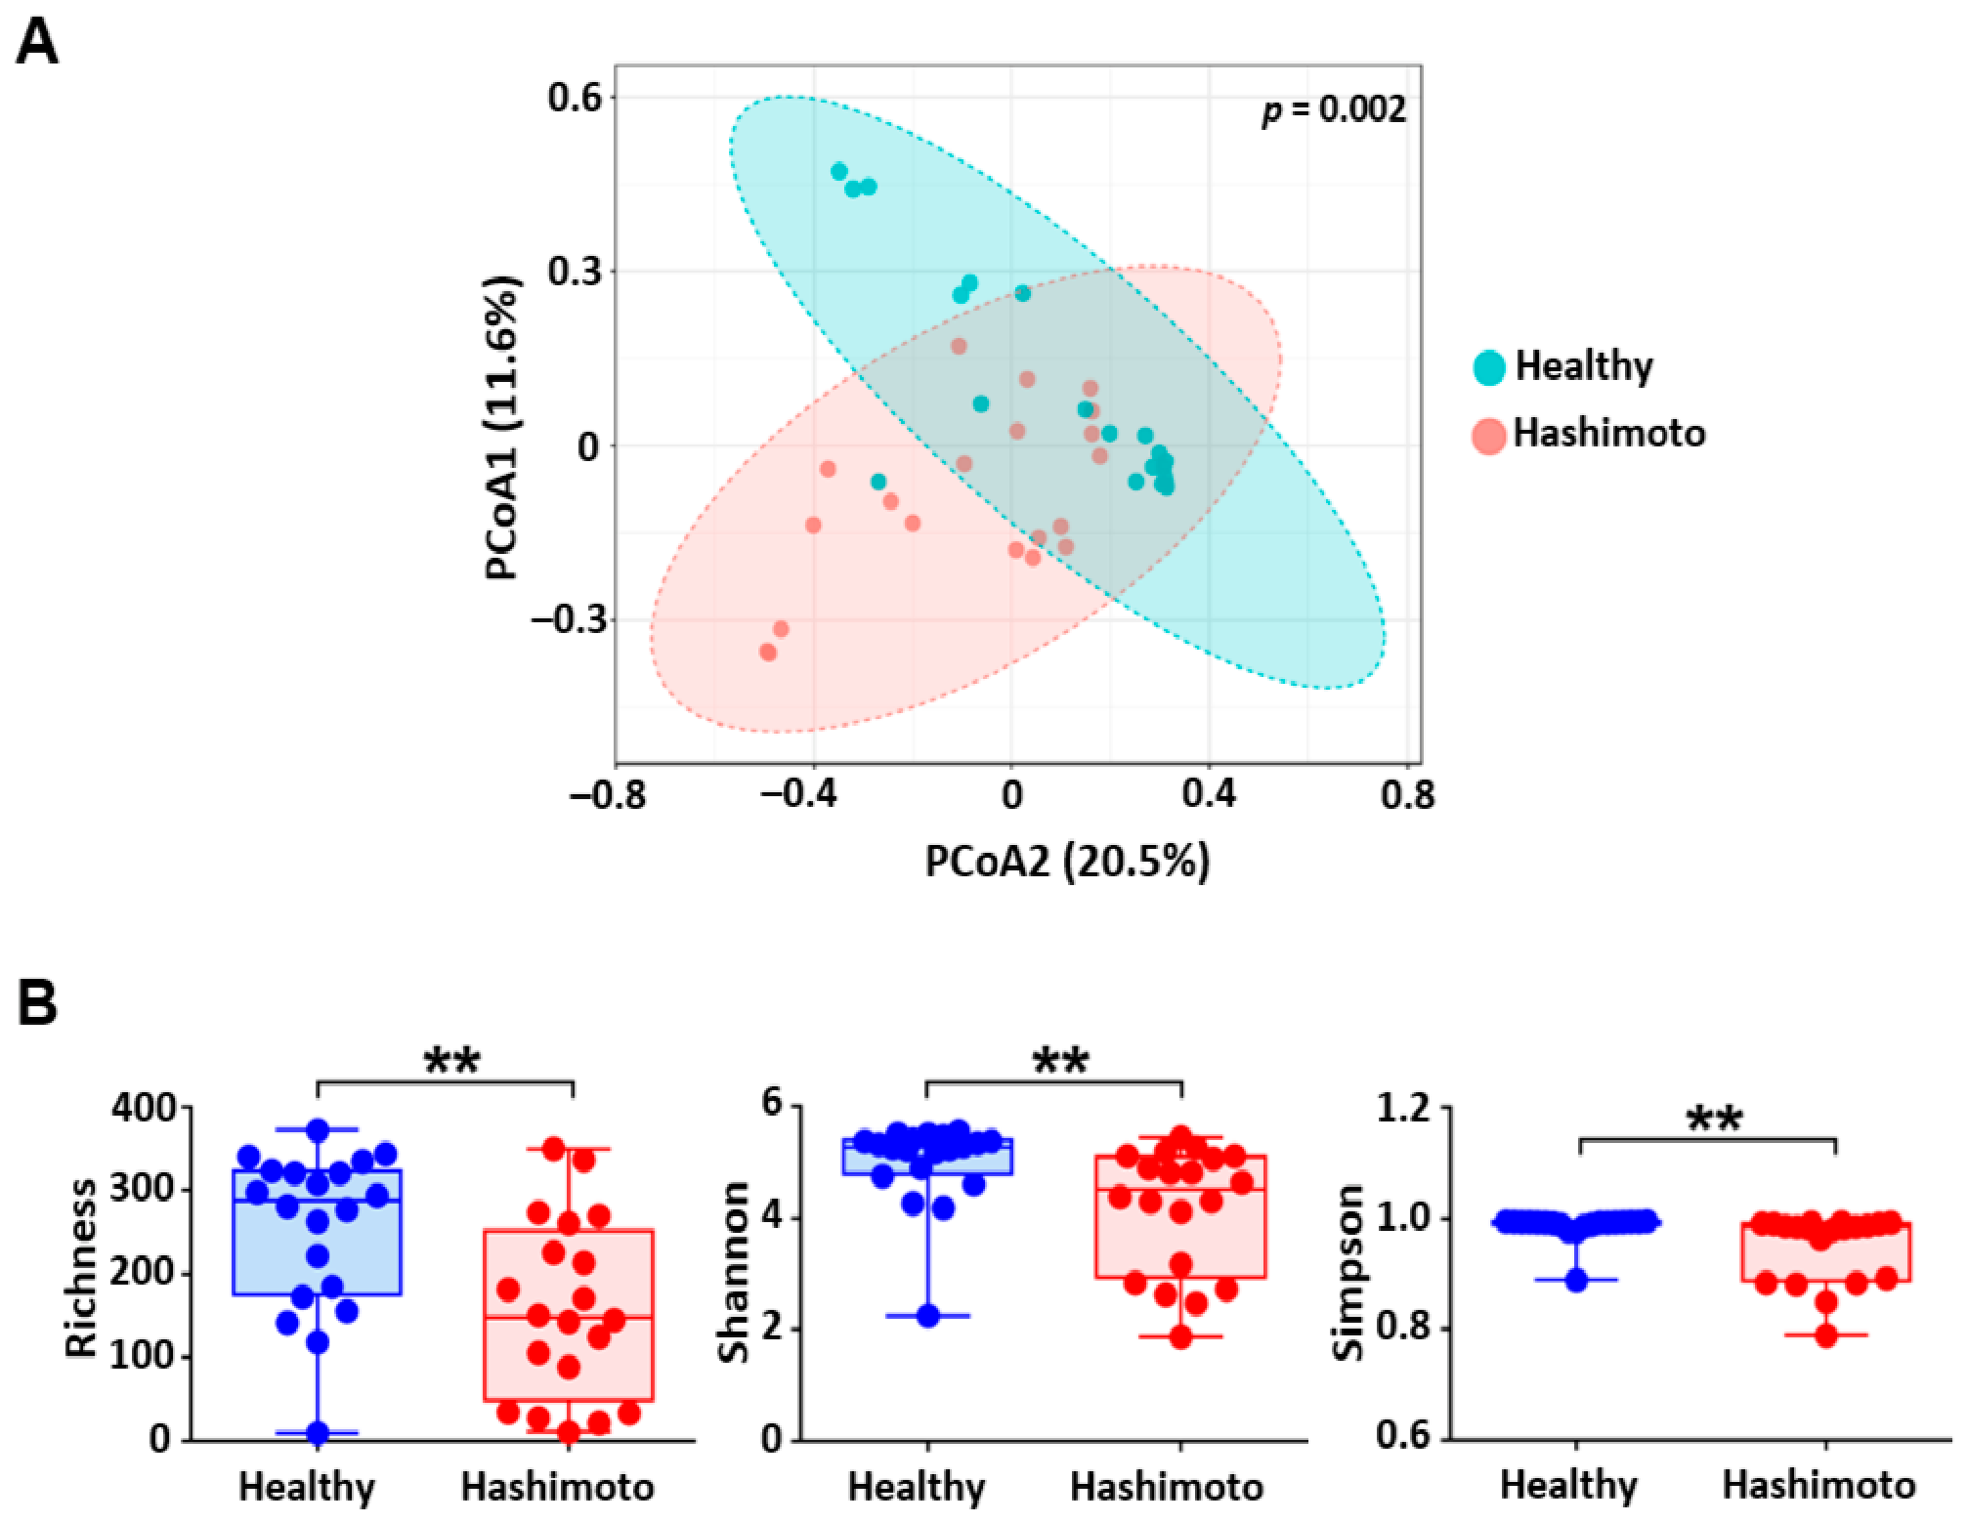
Principal coordinate analysis (PCoA) of β-diversity analysis revealed a distinct microbial community composition in HT patients compared to healthy controls (Figure 1A). The first two principal coordinates explained 20.5% and 11.6% of the total variance, with PERMANOVA confirming a statistically significant difference between groups (p = 0.002). These results demonstrate a clear disease-associated compositional shift in the gut microbiota. Consistent with overall community alterations, analysis of within-sample diversity (α-diversity) revealed a significant reduction across all key metrics in the HT group relative to controls (Figure 1B). Microbial richness was 37.6% lower in HT patients (158.7 ± 105.3) than in controls (254.3 ± 94.6; p = 0.006). Similarly, the Shannon diversity index, which accounts for both richness and evenness, was significantly reduced in the HT group (4.16 ± 1.11 vs. 5.00 ± 0.76, p = 0.002). The Simpson index also showed a significant decrease in HT patients (0.949 ± 0.061 vs. 0.986 ± 0.023; p = 0.0005), indicating a shift toward community dominance by fewer taxa. Together, these reductions in microbial richness and structural uniformity define a distinct multivariate dysbiosis profile in euthyroid HT patients. Furthermore, the HT cohort exhibited substantially higher inter-individual variability in the Simpson index (IQR 0.100 vs. 0.005), suggesting that disease-associated microbial alterations are highly heterogeneous among affected individuals.
Figure 1.
Gut Microbiota Diversity and Community Structure in Hashimoto’s Thyroiditis (HT) Patients and Healthy Controls. (A) β-diversity Analysis depicted as PCoA plots revealing distinct clustering of fecal microbiota samples from HT patients (red circles) and healthy controls (blue circles). Ellipses represent the 95% confidence interval for each group. (B) α-diversity metrics expressed as microbial richness (observed ZOTUs), Shannon index (overall diversity), and Simpson index (microbial dominance). Boxplots display the median, interquartile range (IQR), and full range of values. Each dot represents a fecal sample. Statistical significance was calculated using the Wilcoxon–Mann–Whitney test. Asterisks indicate statistically significant differences and correspond to ** p ≤ 0.01.
3.3. Taxonomic Profiling at Phylum and Genus Levels of HT-Associated Gut Microbiota
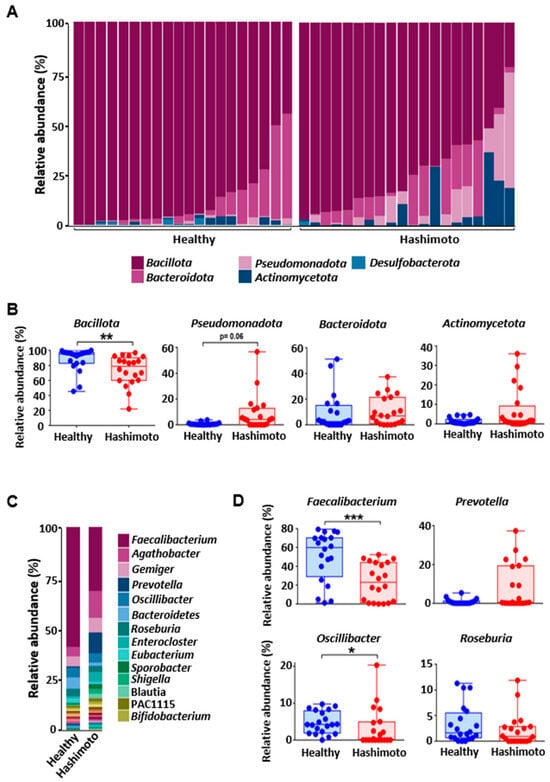
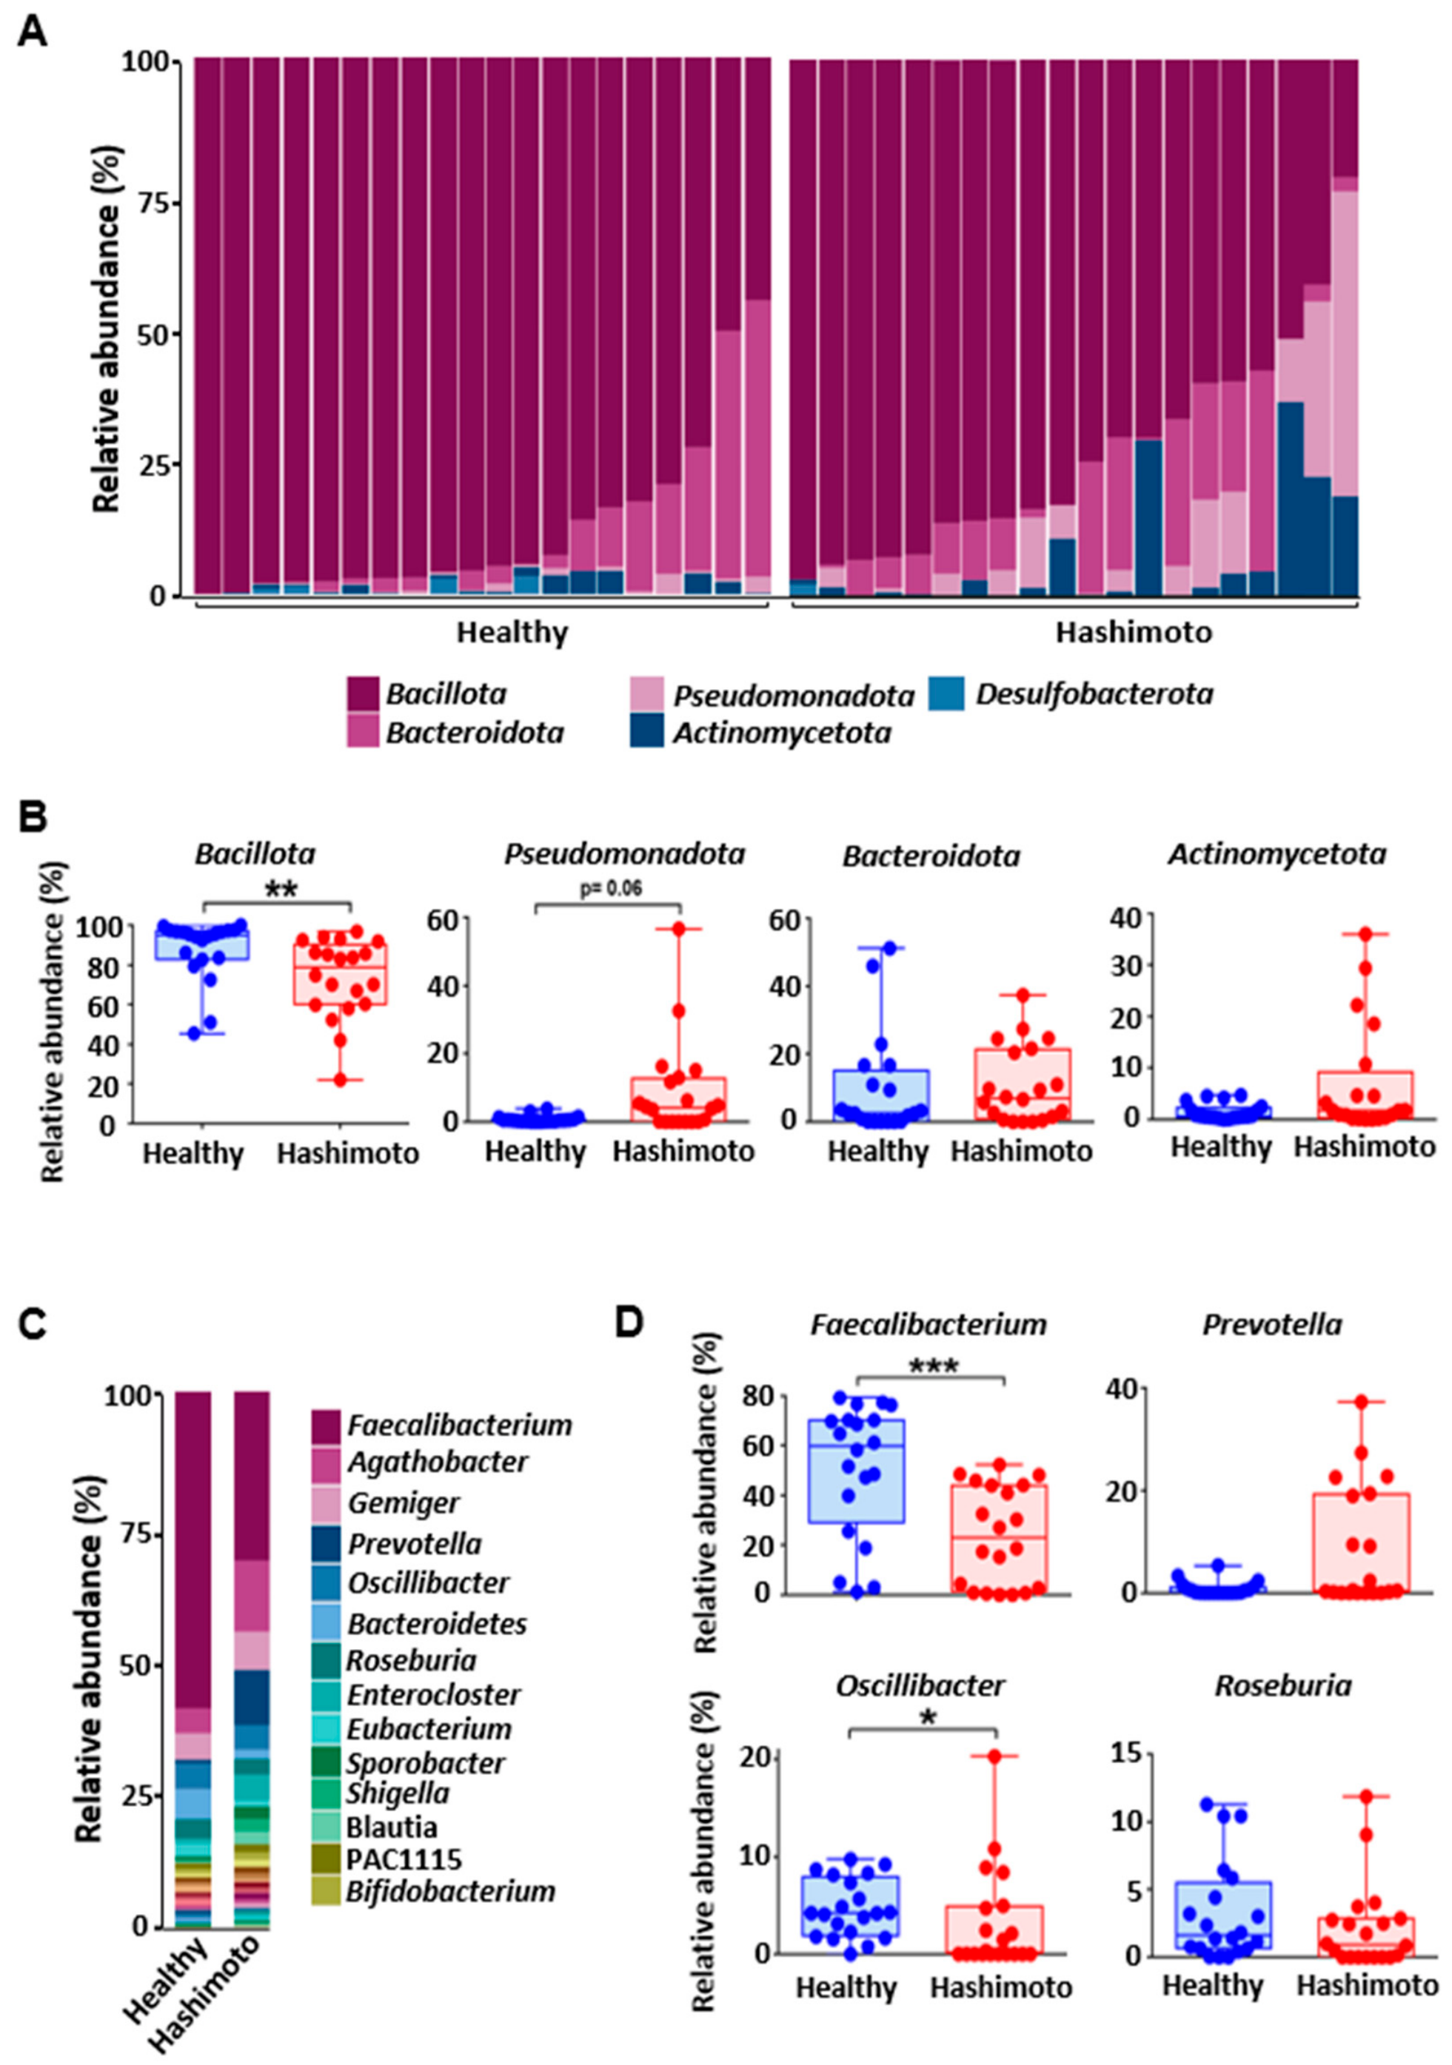
The gut microbiota composition differed significantly at the phylum level between HT patients and healthy controls (Figure 2A). Bacillota (formerly Firmicutes) dominated both groups but was significantly less abundant in HT patients compared to controls (79.97% vs. 90.65%). Conversely, HT patients exhibited increased relative abundances of Bacteroidota (12.68% vs. 6.82%), Pseudomonadota (4.88% vs. 0.61%), and Actinomycetota (2.24% vs. 1.21%). Desulfobacterota remained the least represented phylum, showing a lower relative abundance in the HT group (0.24% vs. 0.71%) (Figure 2B). Across 36 detected genera, HT patients displayed distinct compositional shifts (Figure 2C,D). Faecalibacterium, the most abundant genus overall, was significantly depleted in HT patients (31.6% vs. 58.9%), as were Bacteroides (1.7% vs. 5.6%), Eubacterium (1.1% vs. 2.4%), and Roseburia (2.9% vs. 3.6%). In contrast, the HT group showed marked increases in several genera, including Prevotella (10.2% vs. 0.7%), Agathobacter (13.2% vs. 4.7%), Enterocloster (4.9% vs. 0.9%), Gemmiger (7.2% vs. 4.9%), and Blautia (2.4% vs. 0.2%). Similar enrichments were observed in low-abundant genera such as Enterobacter (1.2% vs. 0.1%), Shigella (2.3% vs. 0.3%), and Sporobacter (2.3% vs. 0.7%). These findings demonstrate a substantial compositional shift and intestinal dysbiosis, establishing a distinct disease-associated microbial structure in euthyroid HT patients.
Figure 2.
Taxonomic Profiling of the Gut Microbiota at Phylum and Genus Levels in Hashimoto’s Thyroiditis Patients and Healthy Controls. (A) Stacked bar plots displaying the relative abundance of bacterial phyla in both study groups. (B) Boxplots illustrating group-wise comparisons of the dominant bacterial phyla. (C) Stacked bar plots showing genus-level mean relative abundances across all samples. (D) Boxplots displaying the relative abundance of four key dominant genera. Each dot represents a fecal sample. The statistical significance was calculated using Wilcoxon–Mann–Whitney test. The asterisks indicate statistically significant differences and correspond to * p ≤ 0.05, ** p ≤ 0.01, *** p ≤ 0.001.
3.4. In-Depth Taxonomic Analysis Reveals Specific Compositional Shifts in the HT Gut Microbiota
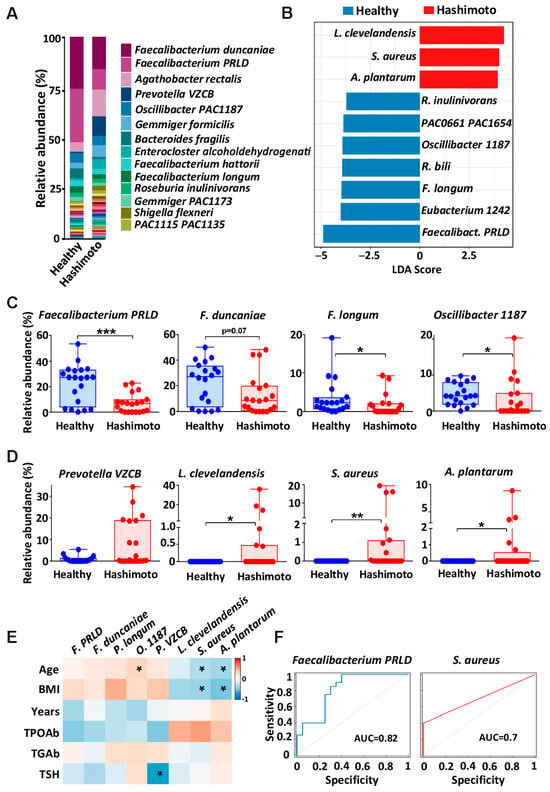
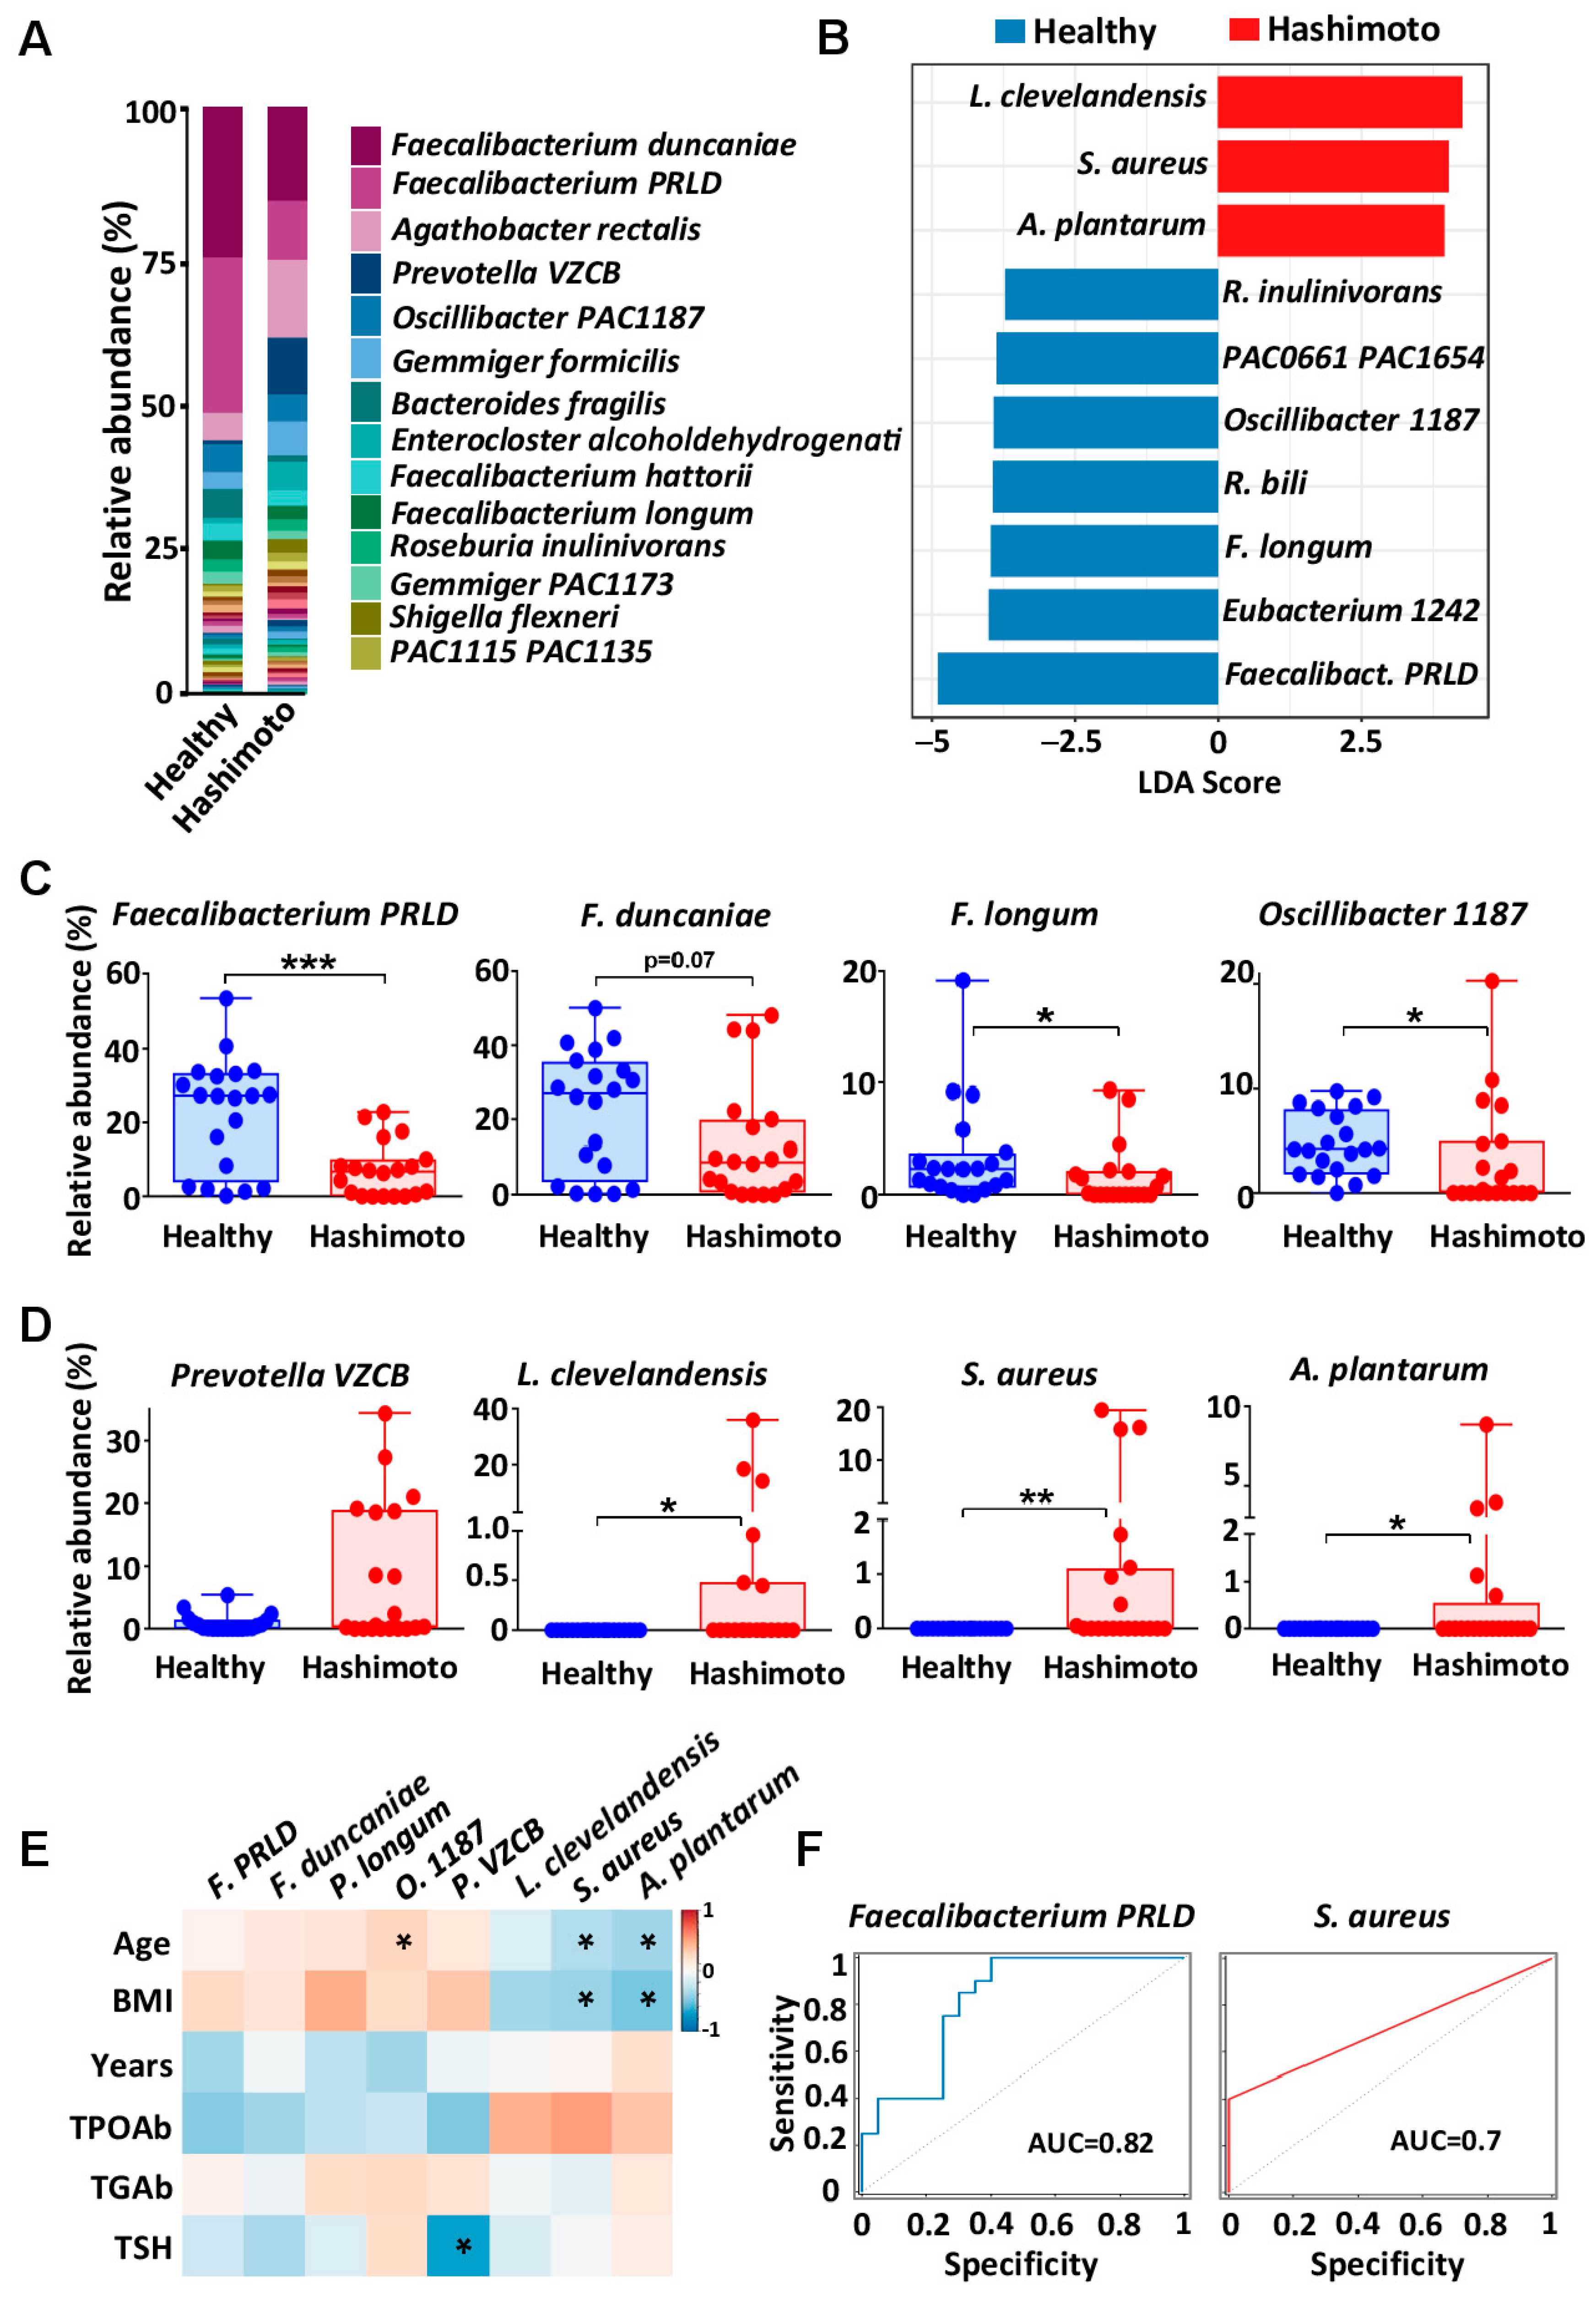
Species-level profiling showed different compositional patterns between groups (Figure 3A–D). In controls, Faecalibacterium taxa were prominent, exceeding 50% of relative abundance, particularly Faecalibacterium PRLD (26.4% vs. 10.0%) and F. duncaniae (25.6% vs. 16.0%). In contrast, HT patients showed higher relative abundances of Agathobacter rectalis (13.2% vs. 4.7%), Prevotella VZCB (9.7% vs. 0.7%), and Gemmiger formicilis (5.7% vs. 2.8%). Notably, Lawsonella clevelandensis, Staphylococcus aureus, and Acinetobacter plantarum were detected only in the HT group in this dataset. LEfSe identified Faecalibacterium PRLD (LDA = 4.88) and F. longum (LDA = 3.95) as discriminant taxa enriched in controls, whereas L. clevelandensis (LDA = −4.25), S. aureus, and A. plantarum discriminated the HT group (Figure 3B). Spearman analyses showed positive correlations between selected HT-enriched taxa (L. clevelandensis, S. aureus, and A. plantarum) and TPOAb (a key clinical indicator of disease severity), and negative correlations with age and BMI (Figure 3E). ROC analysis (Figure 3F) showed the greatest discrimination for F. PRLD (AUC = 0.82, 95% CI: 0.68–0.95), while S. aureus had modest discrimination (AUC = 0.70, 95% CI: 0.59–0.81). L. clevelandensis and A. plantarum had comparatively lower AUC values (Figure S1). These findings suggest that F. PRLD may constitute a candidate microbial marker for differentiating patients with Hashimoto’s thyroiditis from healthy controls. Nevertheless, these estimates should be considered as exploratory, taking into account the small sample size and absence of an independent validation cohort.
Figure 3.
Species-level compositional shifts in HT gut microbiota relative to healthy controls. (A) Stacked bar plot illustrating the mean relative abundance of bacterial species in HT patients and healthy controls. (B) Linear discriminant analysis effect size (LEfSe) displayed as column chart of key species discriminating between HT and controls groups. The length of the bar corresponds to the log-transformed LDA score, indicating the effect size and significance of the species abundance difference between the groups. Boxplots showing group-wise variations in the relative abundance of selected species (C) in healthy controls (D) and HT patients. Each dot represents a fecal sample. Statistical significance was calculated using Wilcoxon–Mann–Whitney test. Asterisks indicate statistically significant differences and correspond to * p ≤ 0.05, ** p ≤ 0.01, *** p ≤ 0.001. (E) Spearman rank correlation illustrating the associations between the relative abundance of selected species and clinical parameters in HT patients. Color gradients represent correlation coefficients (red for positive, blue for negative). Statistically significant correlations (p < 0.05) are denoted by asterisk. (F) ROC curves showing the sensitivity–specificity trade-off for microbial markers differentiating Hashimoto’s thyroiditis (red color) from controls (blue color). AUC values are reported in the legend.
3.5. Functional Prediction Reveals Distinct Metabolic and Virulence Signatures in HT Microbiota
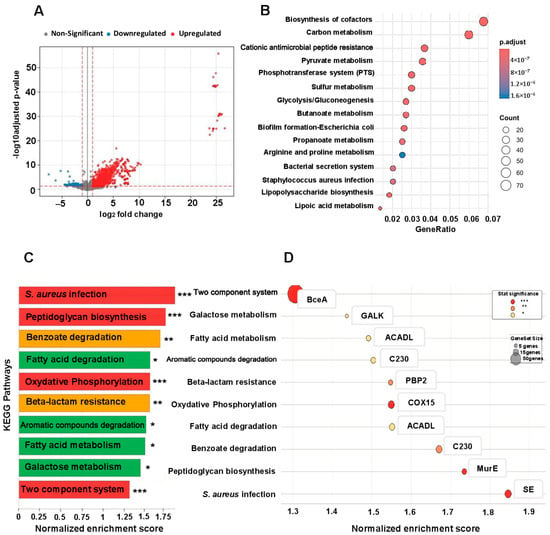
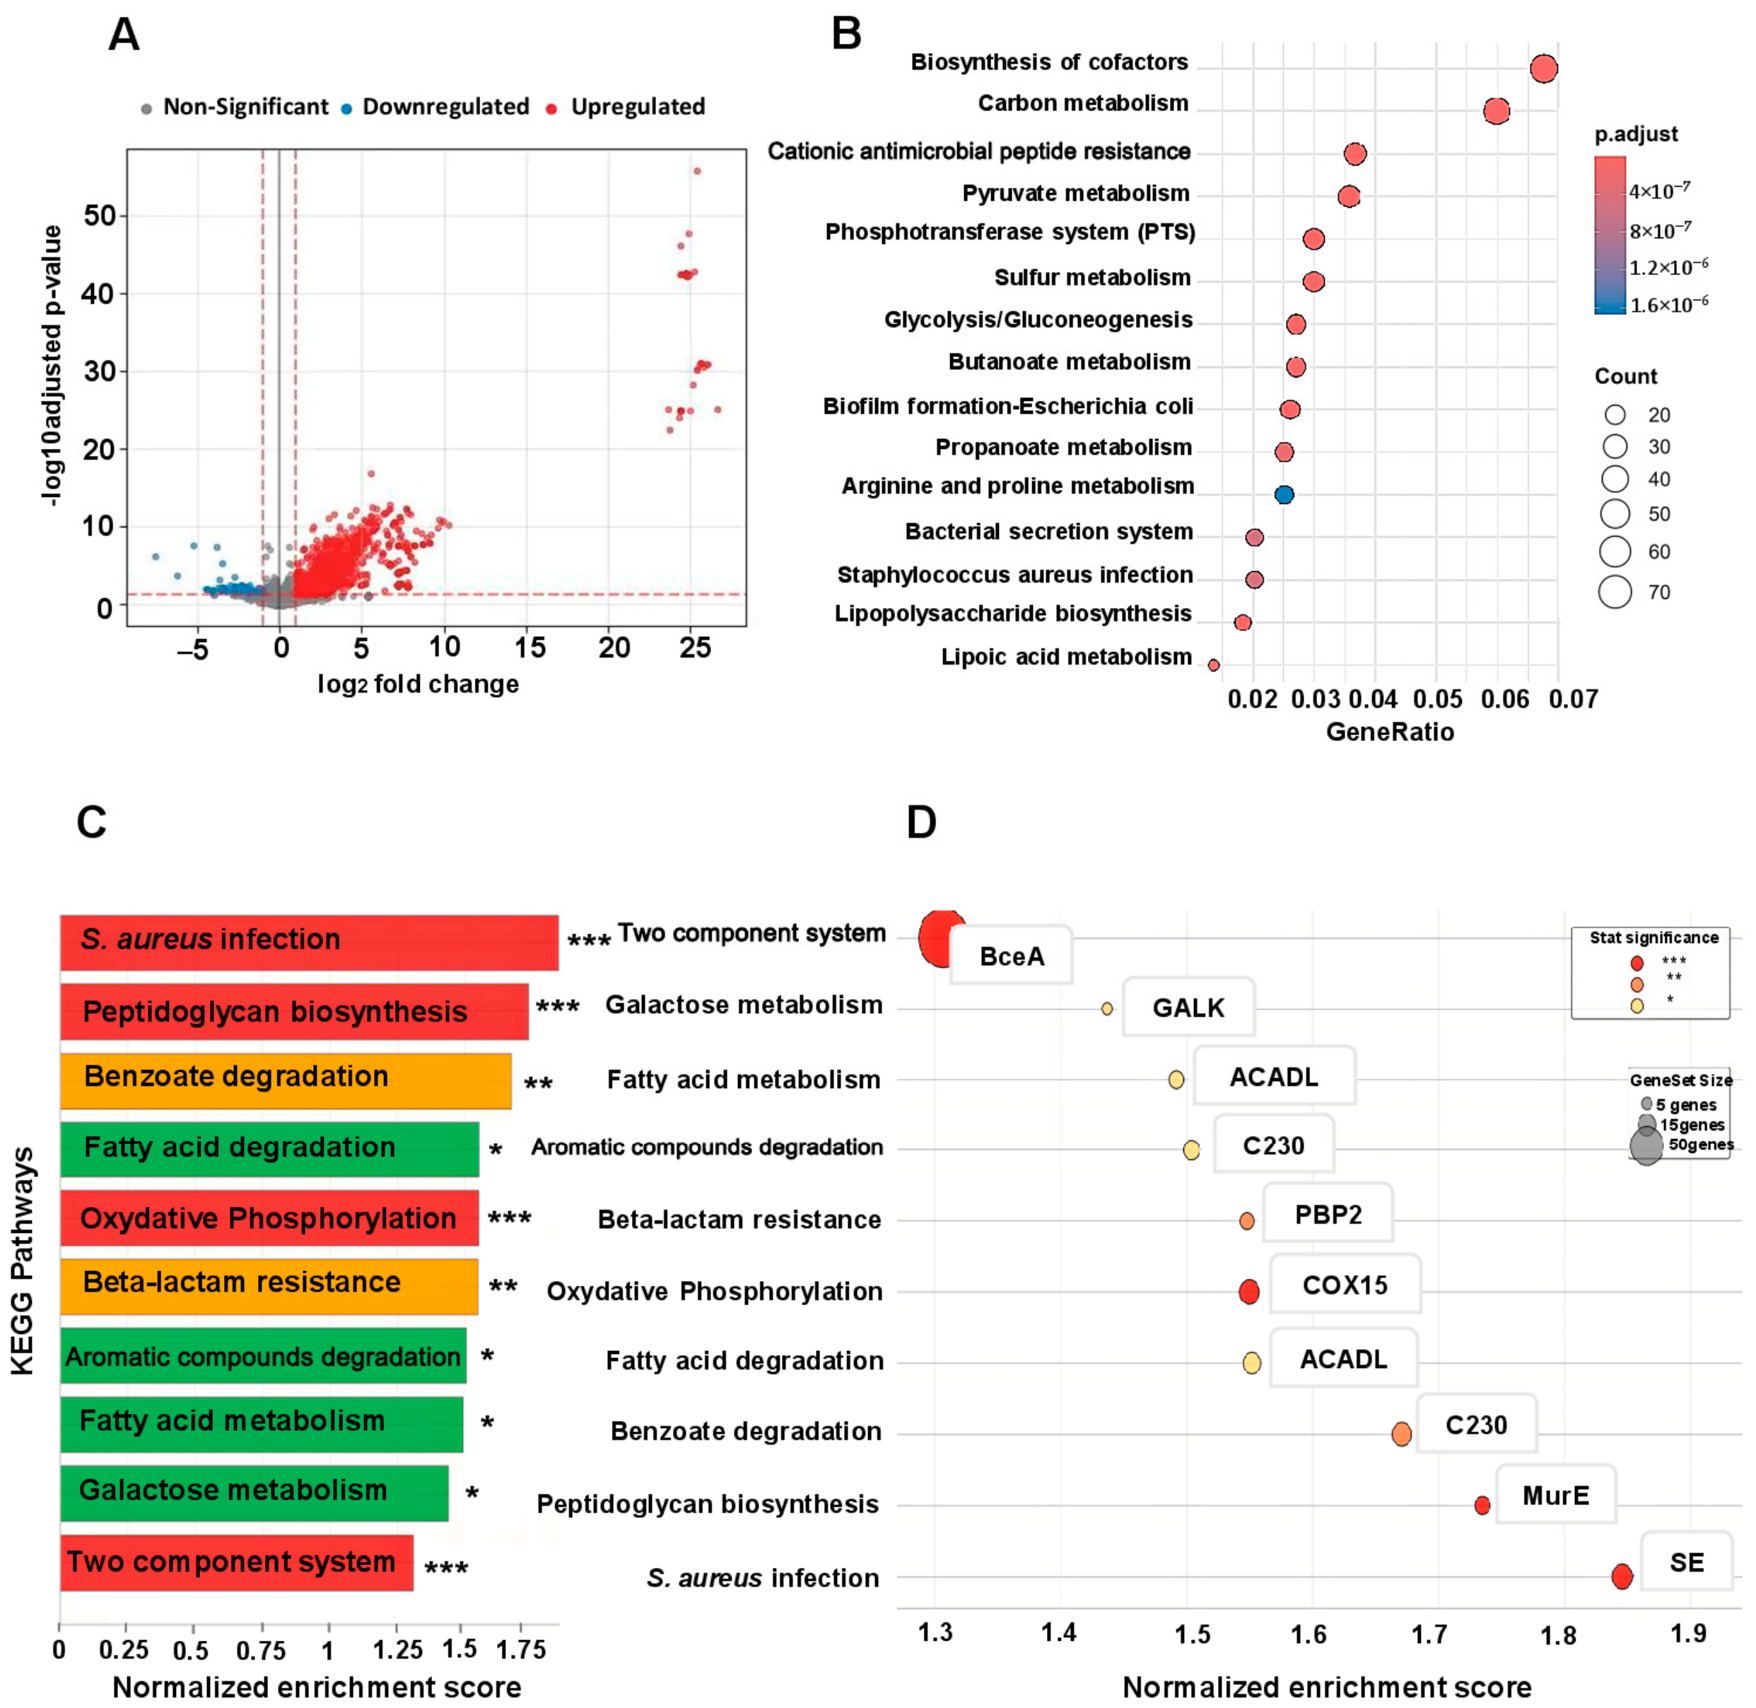
Functional profiling with PICRUSt2, followed by differential-abundance analysis using DESeq2, revealed a marked imbalance in predicted Kyoto Encyclopedia of Genes and Genomes (KO) orthologs between patients with Hashimoto’s thyroiditis and healthy controls. Of the 4857 assessed predicted orthologs, 2028 were significantly upregulated in HT (p-adj < 0.05; log2 fold change > 1), whereas only 70 were significantly downregulated (p-adj < 0.05; log2 fold change < −1), as illustrated in the volcano plot (Figure 4A).
Figure 4.
Predicted Microbial Functional Signatures Associated with Hashimoto’s Thyroiditis. (A) Volcano plot illustrating the differential abundance of predicted KOs between the study groups. (B) Bubble plot of Over-Representation Analysis (ORA) representing gene ratio and adjusted p-values of significantly enriched metabolic pathways. The bubble size is proportional to the number of detected KOs per pathway and color intensity reflects the adjusted p-value. (C) Bar chart of the top 10 KEGG pathways enriched in the HT group, ranked by Normalized Enrichment Score (NES). The asterisks mark statistical significance. (D) Bubble plot showing the contribution of the top leading-edge KOs for each enriched pathway. Bubble size reflects the gene set size. Colors indicate statistical significance: red for *** p-adj < 0.001, orange for ** p-adj < 0.01, yellow for * p-adj < 0.05.
Over-Representation Analysis (ORA) identified several enriched predicted functional categories in the HT-associated microbiota (Figure 4B). Cofactor biosynthesis (gene ratio = 0.07; 70 genes) and carbon metabolism (0.06; 68 genes) were the most highly represented categories. Other significantly enriched inferred metabolic pathways included pyruvate, sulfur, butanoate, and propanoate metabolism, together with the phosphotransferase system and glycolysis/gluconeogenesis. Notably, the HT microbiota showed a higher predicted representation of pathways related to virulence and adaptation mechanisms, including cationic antimicrobial peptide resistance (CAMP) (0.015, 18 genes), biofilm formation processes specific to Escherichia coli (0.012, 15 genes), bacterial secretion systems (0.01, 12 genes), Staphylococcus aureus infection-related pathways (0.008, 10 genes), and lipopolysaccharide biosynthesis mechanisms (0.008, 9 genes). Arginine and proline metabolism was also enriched in predicted gene representations (0.02, 24 genes) (Figure 4B).
Gene Set Enrichment Analysis (GSEA) was used to characterize the predicted functional landscape of the HT-associated microbiota. All significantly enriched pathways in the HT group showed positive Normalized Enrichment Scores (NES range: 1.307–1.846; Figure 4C,D). Predicted pathways with the highest enrichment score included S. aureus infection (NES = 1.846, p-adj < 0.001), and peptidoglycan biosynthesis (NES = 1.735, p-adj < 0.001), pointing toward a dominant proinflammatory and pathogenic profile. In addition, the predicted β-lactam resistance pathway was significantly enriched (p-adj < 0.01) (Figure 4C). Leading-edge analysis identified predicted KO contributors to these signatures, including staphylococcal enterotoxin (SE)-related functions, UDP-N-acetylmuramoyl ligase (MurE), and penicillin-binding protein 2 (PBP2)-related functions (Figure 4D). These findings indicate enrichments in predicted functional potential related to virulence-associated and antibiotic-resistance pathways in the HT group. In contrast, the two-component system regulatory pathway showed the lowest predicted relative enrichment among the significant pathways (NES = 1.307). Detailed leading-edge gene data are available in Table S1, and additional pathway enrichment analyses are provided in Tables S2–S5.
4. Discussion
While the gut–thyroid axis has garnered significant attention, the specific role of microbial dysbiosis in Hashimoto’s thyroiditis remains unclear. In this cross-sectional study we characterized gut microbial composition and predicted functional potential in HT patients and healthy matched controls using high-throughput 16S rRNA gene sequencing. By selecting euthyroid participants, we controlled for the confounding effects of thyroid hormone fluctuations on microbial composition [22,40], isolating the signature of HT autoimmunity. The HT group showed lower α-diversity (Richness, Shannon and Simpson indices) and a distinct overall community structure, broadly consistent with reports of gut microbiota alterations in HT and other autoimmune thyroid diseases. These findings suggest a less resilient microbial ecosystem characterized by the ecological dominance of fewer species, a state frequently linked to increased intestinal permeability and chronic inflammation [41,42,43,44,45].
Taxonomy analysis at the phylum level revealed significantly lower relative abundances of Bacillota in HT, in line with previous reports in this disease [43,46,47] and other conditions characterized by intestinal inflammation, including inflammatory bowel disease (IBD) [48,49]. In contrast, Bacteroidota proportions were significantly elevated, a pattern that has also been reported in autoimmune thyroid diseases (AITD) [50,51], IBD [48], type 2 diabetes, and Parkinson’s disease [52]. At the genus level, we observed a marked decrease in SCFA-producing members, including Faecalibacterium, Bacteroides, Eubacterium, and Roseburia. These taxa have been implicated in SCFA production, colonocyte metabolism, intestinal barrier maintenance and immune regulation [53,54]. Bacteroides species are important producers of propionate and acetate [55], whereas Faecalibacterium, Eubacterium, and Roseburia include important butyrate-producing members [56,57]. This observation is consistent with reports of lower butyrate concentrations and altered butyrate metabolism in HT [58]. Conversely, Prevotella, Agathobacter, Enterocloster, Gemmiger, and Blautia were more abundant in the HT group. Previous studies have reported similar patterns of enrichment in HT and other AITD, particularly for Prevotella, Blautia and Enterocloster, whereas the relevance of Agathobacter and Gemmiger to HT requires independent confirmation [19,50,59]. Butyrate is an important energy source for colonocytes and contributes to epithelial integrity through effects on mucus production and tight-junction function; it also shows immunomodulatory and anti-inflammatory properties [60,61,62,63]. Therefore, a reduction in butyrate-producing taxa may be associated with impaired intestinal barrier function and increased permeability. In turn, barrier disruption can facilitate the translocation of microbial products or antigens across the epithelial layer and contribute to local and systemic immune activation. This mechanism is of particular interest in HT, where alterations in gut microbiota and intestinal permeability have already been reported [64]. SCFAs also participate in mucosal immune regulation by promoting regulatory T-cell responses, modulating cytokine production, and restraining inflammatory signaling. In HT, reduced butyrate has been associated with an imbalance between Th17 and Treg responses, raising the possibility that alterations in SCFA-producing taxa may contribute to a less tolerogenic immune environment [58]. However, the effects of SCFAs are context-dependent, and under certain inflammatory conditions, butyrate and propionate may also promote NLRP3 inflammasome activation in human macrophages following Toll-like receptor stimulation [65]. The precise contribution of SCFA-producing taxa to thyroid-specific immune dysregulation therefore remains to be defined. These findings can be considered within the broader gut–thyroid axis, in which alterations in microbial composition, intestinal barrier function, and microbial metabolism may interact with immune activation and thyroid autoimmunity [20,58]. Importantly, because SCFA concentrations were not measured in the present study, the observed taxonomic changes should be interpreted as alterations in the representation of taxa with SCFA-producing potential rather than as direct evidence of reduced SCFA concentrations [58].
At the species level, LEfSe analysis identified L. clevelandensis, S. aureus, and A. plantarum as taxa that discriminated the HT group in this dataset. L. clevelandensis has been isolated from a range of human infections, including abscesses and vascular graft-associated infections [66,67]. Although its detection in this data set does not establish a causal relationship with HT, its differential representation may warrant further investigation as a potential marker of altered microbial community structure. S. aureus is a common human commensal [68], and can transition to pathogenic behavior under permissive conditions [69]. The detection of S. aureus and A. plantarum is noteworthy, as these species are rarely observed in the human gut microbiota. In addition, other species prevalent in the HT group included A. rectalis, Prevotella VZCB, and G. formicilis. Importantly, species-level identification does not establish virulence, as closely related strains may differ substantially in their expression of toxins and other pathogenicity determinants. Temperate bacteriophages may contribute to bacterial adaptation and, in some circumstances, facilitate the transfer of toxin-associated or other accessory genes through lysogenic conversion or horizontal gene transfer within microbial communities [70,71]. However, because this study used 16S rRNA gene sequencing and did not characterize bacterial strains, virulence genes, or the intestinal virome, the observed taxa and associated functional predictions should be considered hypothesis-generating rather than evidence of active infection or virulence. Several Faecalibacterium taxa, including F. duncaniae, F. prausnitzii, F. hattorii, F. longum, and the uncultured taxon Faecalibacterium PRLD, were less abundant in HT. This pattern is consistent with the potential loss of commensals involved in butyrate production and intestinal homeostasis [54,72], although the corresponding metabolic consequences were not directly measured.
To further characterize the functional potential associated with these dysbiotic alterations, we performed functional profiling using PICRUSt2. This analysis revealed an enrichment of predicted pathways related to bacterial virulence, cell-envelope biosynthesis, antimicrobial resistance, oxidative phosphorylation, and fatty acid metabolism. In particular, pathways annotated for S. aureus infection, peptidoglycan biosynthesis, and β-lactam resistance were enriched in the HT group. Moreover, we observed a higher predicted representation of functions annotated to the staphylococcal enterotoxin (SE) gene alongside the MurE gene, which plays a critical role in peptidoglycan synthesis, and bacterial cell wall assembly [73]. Staphylococcal enterotoxins can act as superantigens that induce broad T-cell activation and inflammatory cytokine responses [74]. Concurrently, the higher predicted representation of functions related to cell wall assembly, while not direct evidence of functional activity, might indicate structural adaptations to the HT gut environment. Furthermore, predicted functional profiling indicated a higher potential for oxidative phosphorylation and fatty acid degradation, as reflected by the predicted abundance of key enzymes such as COX15 [75] and ACADL [76], respectively. This predicted metabolic signature is consistent with a potential shift toward high-efficiency energy production, which might favor microbial survival and adaptation under nutrient-restricted, inflamed conditions. Together, this concurrent enrichment of predicted exotoxins, structural cell wall components, and high-yield energy metabolic networks emphasizes a functionally distinct pro-inflammatory microbial signature characteristic of the HT gut ecosystem. These findings should be considered hypothesis-generating and require validation using direct functional approaches to determine whether the predicted functions are actually present and biologically active.
5. Conclusions
In conclusion, our study reveals a distinct gut microbial signature in euthyroid HT patients, characterized by a significant depletion of beneficial commensals like Faecalibacterium and Roseburia, accompanied by an enrichment of pro-inflammatory taxa such as S. aureus. The concurrent loss of SCFA-producing bacteria and the predicted upregulation of virulence-associated pathways suggest a disrupted immune–microbiota equilibrium. While this cross-sectional study does not establish causality, these findings align with emerging gut–thyroid axis models where functional dysbiosis acts as a key driver of thyroid inflammation. By focusing on a euthyroid cohort, we isolated the primary microbial features of HT autoimmunity from the confounding effects of systemic thyroid hormone fluctuations. Ultimately, this work provides valuable insight into HT gut microbiota structure and functionality, shedding light on its potential role in disease pathogenesis, and highlighting candidates for future diagnostic markers or precision-targeted therapies.
6. Limitations
Several limitations of this study should be acknowledged. First, due to the cross-sectional design, temporal relationships between gut microbial alterations and HT cannot be established, and causal inferences cannot be drawn. Second, the modest sample size and single-center recruitment may limit statistical power and generalizability across diverse ethnic or geographic populations. Third, 16S rRNA gene sequencing and PICRUSt2-based inference offer limited taxonomic and functional resolution, as they predict genomic functional potential rather than directly measuring gene expression, metabolic activity, or strain-level variation. Finally, residual confounding from unmeasured dietary factors, medications, adiposity, and lifestyle habits cannot be ruled out, and systemic inflammatory markers as well as microbial metabolites were not directly measured. These findings should therefore be interpreted with caution and validated in larger, independent, longitudinal cohorts using multi-omic approaches, including shotgun metagenomics, metabolomics, and a metatranscriptomics approach.
Supplementary Materials
The following supporting information can be downloaded at: https://www.mdpi.com/article/10.3390/microorganisms14112475/s1, Figure S1: Species-level compositional shifts in HT gut microbiota relative to healthy controls; Table S1: KEGG Pathways enriched in the gut microbiota of HT patients. Table S2: KEGG Pathway analysis; Table S3: KEGG Pathway Distribution; Table S4: Biological Function Distribution; Table S5: Over-Representation Analysis.
Author Contributions
Conceptualization, N.B., N.M. and Y.A.; methodology, M.B., N.B. and Y.A.; software, M.B.; validation, M.B.; formal analysis, M.B. and Y.A.; investigation, M.B., N.M. and Y.A.; resources, M.B. and N.B.; data curation, M.B. and Y.A.; writing—original draft preparation, M.B.; writing—review and editing, M.B., N.B., N.M., N.N., L.E. and Y.A.; supervision, N.B., N.M. and Y.A.; project administration, N.B. and Y.A.; funding acquisition, N.B., N.M. and Y.A. All authors have read and agreed to the published version of the manuscript.
Funding
This work was supported by the University of Constantine 1 Frères Mentouri (to N.B.); the National Center of Biotechnology (CRBT), Constantine (to N.M.); and the deutsche forschungsgemeinschaft (DFG, project No. 580001886) (to Y.A.).
Institutional Review Board Statement
This study was approved by the Medical Ethics Review Board of the University Hospital of Constantine, Algeria (Approval No. CE/CHUC/21/03/2025; Approval Date: 18 November 2025). The procedures used in this study adhere to the tenets of the Declaration of Helsinki.
Informed Consent Statement
Written informed consent was obtained from all participants prior to any sample collection.
Data Availability Statement
All newly generated sequence data have been deposited in GenBank under accession numbers PX388263 to PX389629.
Acknowledgments
This study was conducted in the Department of Endocrinology at the University Hospital of Constantine, Algeria. The authors thank all participating physicians and patients for their valuable contributions. We are especially grateful to Assia Ikhlef from the National Center of Biotechnology (CRBT) and Lamia Eulmi from the École Nationale Supérieure de Biotechnologie (ENSB) for their technical assistance with DNA extraction. We also thank Rima Hind Boudchicha for her support with PCR procedures and the entire staff of the CRBT in Constantine for their cooperation throughout this study.
Conflicts of Interest
The authors declare no conflicts of interest.
Abbreviations
The following abbreviations are used in this manuscript:
| AUC | Area under the curve |
| BMI | Body mass index |
| CTLA-4 | Cytotoxic T-lymphocyte-associated protein 4 |
| GSEA | Gene Set Enrichment Analysis |
| HLA | Human leukocyte antigen |
| HT | Hashimoto’s thyroiditis |
| KEGG | Kyoto Encyclopedia of Genes and Genomes |
| KO | KEGG Orthology |
| LEfSe | Linear Discriminant Analysis Effect Size |
| NES | Normalized Enrichment Score |
| NSTI | Nearest Sequenced Taxon Index |
| ZOTUs | Zero-radius operational taxonomic units |
| PCoA | Principal coordinate analysis |
| ROC | Receiver Operating Characteristic |
| SCFA | Short-chain fatty acid |
| TGAb | Thyroglobulin antibodies. |
| TPOAb | Thyroid peroxidase antibodies |
| TSH | Thyroid-stimulating hormone |
References
- Caturegli, P.; De Remigis, A.; Rose, N. Hashimoto thyroiditis: Clinical and diagnostic criteria. Autoimmun. Rev. 2014, 13, 391–397. [Google Scholar] [CrossRef] [Scilit] [PubMed]
- Fröhlich, E.; Wahl, R. Thyroid Autoimmunity: Role of Anti-thyroid Antibodies in Thyroid and Extra-Thyroidal Diseases. Front. Immunol. 2017, 8, 521. [Google Scholar] [CrossRef] [Scilit] [PubMed]
- Ajjan, R.A.; Weetman, A.P. The Pathogenesis of Hashimoto’s Thyroiditis: Further Developments in our Understanding. Horm. Metab. Res. 2015, 47, 702–710. [Google Scholar] [CrossRef] [Scilit] [PubMed]
- Hiromatsu, Y.; Satoh, H.; Amino, N. Hashimoto’s Thyroiditis: History and Future Outlook. Hormones 2013, 12, 12–18. [Google Scholar] [CrossRef] [Scilit] [PubMed]
- Chaker, L.; Bianco, A.C.; Jonklaas, J.; Peeters, R.P. Hypothyroidism. Lancet 2017, 390, 1550–1562. [Google Scholar] [PubMed]
- Prinzi, N.; Sorrenti, S.; Baldini, E.; De Vito, C.; Tuccilli, C. Association of thyroid diseases with primary extra-thyroidal malignancies in women: Results of a cross-sectional study of 6,386 patients. PLoS ONE 2015, 10, e0122958. [Google Scholar] [CrossRef] [Scilit] [PubMed]
- Garmendia Madariaga, A.; Santos Palacios, S.; Guillén-Grima, F.; Galofré, J.C. The incidence and prevalence of thyroid dysfunction in Europe: A meta-analysis. J. Clin. Endocrinol. Metab. 2014, 99, 923–931. [Google Scholar] [CrossRef] [Scilit] [PubMed]
- Hu, X.; Chen, Y.; Shen, Y.; Tian, R.; Sheng, Y. Global prevalence and epidemiological trends of Hashimoto’s thyroiditis in adults: A systematic review and meta-analysis. Front. Public Health 2022, 10, 1020709. [Google Scholar] [CrossRef] [Scilit] [PubMed]
- Chiovato, L.; Magri, F.; Carlé, A. Hypothyroidism in Context: Where We’ve Been and Where We’re Going. Adv. Ther. 2019, 36, 47–58. [Google Scholar] [CrossRef] [Scilit] [PubMed]
- Ragusa, F.; Fallahi, P.; Elia, G.; Gonnella, D.; Paparo, S.R. Hashimotos’ thyroiditis: Epidemiology, pathogenesis, clinic and therapy. Best Pract. Res. Clin. Endocrinol. Metab. 2019, 33, 101367. [Google Scholar] [CrossRef] [Scilit] [PubMed]
- Brix, T.H.; Kyvik, K.O.; Hegedüs, L. A Population-Based Study of Chronic Autoimmune Hypothyroidism in Danish Twins. J. Clin. Endocrinol. Metab. 2000, 85, 536–539. [Google Scholar] [CrossRef] [Scilit]
- Dittmar, M.; Libich, C.; Brenzel, T.; Kahaly, G.J. Increased Familial Clustering of Autoimmune Thyroid Diseases. Horm. Metab. Res. 2011, 43, 200–204. [Google Scholar] [CrossRef] [Scilit] [PubMed]
- Liontiris, M.I.; Mazokopakis, E.E. A concise review of Hashimoto thyroiditis (HT) and the importance of iodine, selenium, vitamin D and gluten on the autoimmunity and dietary management of HT patients. Hell. J. Nucl. Med. 2017, 20, 51–56. [Google Scholar] [CrossRef] [Scilit] [PubMed]
- Hou, K.; Wu, Z.X.; Chen, X.Y.; Wang, J.Q.; Zhang, D. Microbiota in health and diseases. Signal Transduct. Target. Ther. 2022, 7, 135. [Google Scholar] [CrossRef] [Scilit] [PubMed]
- Su, X.; Zhao, Y.; Li, Y.; Ma, S.; Wang, Z. Gut dysbiosis is associated with primary hypothyroidism with interaction on gut-thyroid axis. Clin. Sci. 2020, 134, 1521–1535. [Google Scholar] [CrossRef] [Scilit] [PubMed]
- Yu, X.; Jiang, W.; Kosik, R.O.; Song, Y.; Luo, Q. Gut microbiota changes and its potential relations with thyroid carcinoma. J. Adv. Res. 2022, 35, 61–70. [Google Scholar] [CrossRef] [Scilit] [PubMed]
- Fröhlich, E.; Wahl, R. Microbiota and Thyroid Interaction in Health and Disease. Trends Endocrinol. Metab. 2019, 30, 479–490. [Google Scholar] [CrossRef] [Scilit] [PubMed]
- Ludgate, M.E.; Masetti, G.; Soares, P. The relationship between the gut microbiota and thyroid disorders. Nat. Rev. Endocrinol. 2024, 20, 511–525. [Google Scholar] [CrossRef] [Scilit] [PubMed]
- Li, M.; Chen, K.; Chen, Y.; Zhang, L.; Cui, Y.; Xiao, F.; Liu, Z.; Zhang, W.; Jiang, J.; Zhou, Q.; et al. Integrative analysis of gut microbiome and host transcriptome reveal novel molecular signatures in Hashimoto’s thyroiditis. J. Transl. Med. 2024, 22, 1045. [Google Scholar] [CrossRef] [Scilit] [PubMed]
- Zhu, X.; Zhang, C.; Feng, S.; He, R.; Zhang, S. Intestinal microbiota regulates the gut-thyroid axis: The new dawn of improving Hashimoto thyroiditis. Clin. Exp. Med. 2024, 24, 39. [Google Scholar] [CrossRef] [Scilit] [PubMed]
- Di Vincenzo, F.; Del Gaudio, A.; Petito, V.; Lopetuso, L.R.; Scaldaferri, F. Gut microbiota, intestinal permeability, and systemic inflammation: A narrative review. Intern. Emerg. Med. 2024, 19, 275–293. [Google Scholar] [CrossRef] [Scilit] [PubMed]
- Virili, C.; Stramazzo, I.; Bagaglini, M.F.; Carretti, A.L.; Capriello, S.; Romanelli, F.; Trimboli, P.; Centanni, M. The relationship between thyroid and human-associated microbiota: A systematic review of reviews. Rev. Endocr. Metab. Disord. 2024, 25, 215–237. [Google Scholar] [CrossRef] [Scilit] [PubMed]
- Jiang, W.; Lu, G.; Gao, D.; Lv, Z.; Li, D. The relationships between the gut microbiota and its metabolites with thyroid diseases. Front. Endocrinol. 2022, 13, 943408. [Google Scholar] [CrossRef] [Scilit] [PubMed]
- Maslowski, K.M.; Vieira, A.T.; Ng, A.; Kranich, J.; Sierro, F.; Yu, D.; Schilter, H.C.; Rolph, M.S.; Mackay, F.; Artis, D.; et al. Regulation of inflammatory responses by gut microbiota and chemoattractant receptor GPR43. Nature 2009, 461, 1282–1286. [Google Scholar] [CrossRef] [Scilit] [PubMed]
- Knezevic, J.; Starchl, C.; Tmava Berisha, A.; Amrein, K. Thyroid-Gut-Axis: How Does the Microbiota Influence Thyroid Function? Nutrients 2020, 12, 1769. [Google Scholar] [CrossRef] [Scilit] [PubMed]
- Srirungruang, S.; Mahajindawong, B.; Nimitpanya, P.; Bunkasem, U.; Ayuyoe, P. Comparative Study of DNA Extraction Methods for the PCR Detection of Intestinal Parasites in Human Stool Samples. Diagnostics 2022, 12, 2588. [Google Scholar] [CrossRef] [Scilit] [PubMed]
- Amar, Y.; Lagkouvardos, I.; Silva, R.L.; Ishola, O.A.; Foesel, B.U.; Kublik, S.; Schöler, A.; Niedermeier, S.; Bleuel, R.; Zink, A.; et al. Pre-digest of unprotected DNA by Benzonase improves the representation of living skin bacteria and efficiently depletes host DNA. Microbiome 2021, 9, 123. [Google Scholar] [CrossRef] [Scilit] [PubMed]
- Lagkouvardos, I.; Joseph, D.; Kapfhammer, M.; Giritli, S.; Horn, M. IMNGS: A comprehensive open resource of processed 16S rRNA microbial profiles for ecology and diversity studies. Sci. Rep. 2016, 6, 33721. [Google Scholar] [CrossRef] [Scilit] [PubMed]
- Wang, Q.; Garrity, G.M.; Tiedje, J.M.; Cole, J.R. Naïve Bayesian Classifier for Rapid Assignment of rRNA Sequences into the New Bacterial Taxonomy. Appl. Environ. Microbiol. 2007, 73, 5261–5267. [Google Scholar] [CrossRef] [Scilit] [PubMed]
- Lagkouvardos, I.; Fischer, S.; Kumar, N.; Clavel, T. Rhea: A transparent and modular R pipeline for microbial profiling based on 16S rRNA gene amplicons. PeerJ 2017, 5, e2836. [Google Scholar] [CrossRef] [Scilit] [PubMed]
- Lu, Y.; Zhou, G.; Ewald, J.; Pang, Z.; Shiri, T. MicrobiomeAnalyst 2.0: Comprehensive statistical, functional and integrative analysis of microbiome data. Nucleic Acids Res. 2023, 51, W310–W318. [Google Scholar] [CrossRef] [Scilit] [PubMed]
- Douglas, G.M.; Maffei, V.J.; Zaneveld, J.R.; Yurgel, S.N.; Brown, J.R. PICRUSt2 for prediction of metagenome functions. Nat. Biotechnol. 2020, 38, 685–688. [Google Scholar] [CrossRef] [Scilit] [PubMed]
- The Galaxy Community. The Galaxy platform for accessible, reproducible, and collaborative data analyses: 2024 update. Nucleic Acids Res. 2024, 52, W83–W94. [Google Scholar] [CrossRef] [Scilit] [PubMed]
- Kanehisa, M.; Furumichi, M.; Sato, Y.; Kawashima, M.; Ishiguro-Watanabe, M. KEGG for taxonomy-based analysis of pathways and genomes. Nucleic Acids Res. 2023, 51, D587–D592. [Google Scholar] [CrossRef] [Scilit] [PubMed]
- Hunter, J.D. Matplotlib: A 2D Graphics Environment. Comput. Sci. Eng. 2007, 9, 90–95. [Google Scholar] [CrossRef] [Scilit]
- Waskom, M. seaborn: Statistical data visualization. J. Open Source Softw. 2021, 6, 3021. [Google Scholar] [CrossRef] [Scilit]
- Wu, T.; Hu, E.; Xu, S.; Chen, M.; Guo, P. clusterProfiler 4.0: A universal enrichment tool for interpreting omics data. Innovation 2021, 2, 100141. [Google Scholar] [CrossRef] [Scilit] [PubMed]
- Subramanian, A.; Tamayo, P.; Mootha, V.K.; Mukherjee, S.; Ebert, B.L. Gene set enrichment analysis: A knowledge-based approach for interpreting genome-wide expression profiles. Proc. Natl. Acad. Sci. USA 2005, 102, 15545–15550. [Google Scholar] [CrossRef] [Scilit] [PubMed]
- The Pandas Development Team. pandas-dev/pandas: Pandas, version v2.2.2; Zenodo: Geneva, Switzerland, 2024. [CrossRef]
- Shi, C.; Chen, J.; He, S.; Zhang, Y.; Zhang, Y. Cross-talk between the gut microbiota and hypothyroidism: A bidirectional two-sample Mendelian randomization study. Front. Nutr. 2024, 11, 1286593. [Google Scholar] [CrossRef] [Scilit] [PubMed]
- Gong, B.; Wang, C.; Meng, F.; Wang, H.; Song, B. Association Between Gut Microbiota and Autoimmune Thyroid Disease: A Systematic Review and Meta-Analysis. Front. Endocrinol. 2021, 12, 774362. [Google Scholar] [CrossRef] [Scilit] [PubMed]
- Liu, J.; Qin, X.; Lin, B.; Cui, J.; Liao, J. Analysis of gut microbiota diversity in Hashimoto’s thyroiditis patients. BMC Microbiol. 2022, 22, 318. [Google Scholar] [CrossRef] [Scilit] [PubMed]
- Fang, L.; Ning, J. Recent advances in gut microbiota and thyroid disease: Pathogenesis and therapeutics in autoimmune, neoplastic, and nodular conditions. Front. Cell Infect. Microbiol. 2024, 14, 1465928. [Google Scholar] [CrossRef] [Scilit] [PubMed]
- Wang, T.; Sternes, P.R.; Guo, X.K.; Zhao, H.; Xu, C. Autoimmune diseases exhibit shared alterations in the gut microbiota. Rheumatology 2024, 63, 856–865. [Google Scholar] [CrossRef] [Scilit] [PubMed]
- Zhao, F.; Feng, J.; Li, J.; Zhao, L.; Liu, Y. Alterations of the Gut Microbiota in Hashimoto’s Thyroiditis Patients. Thyroid 2018, 28, 175–186. [Google Scholar] [CrossRef] [Scilit] [PubMed]
- Song, Y.; Bai, Y.; Liu, C.; Zhai, X.; Zhang, L. The impact of gut microbiota on autoimmune thyroiditis and relationship with pregnancy outcomes: A review. Front. Cell Infect. Microbiol. 2024, 14, 1361660. [Google Scholar] [CrossRef] [Scilit] [PubMed]
- Tomov, D.G.; Levterova, B.B.; Mihailova, V.N.; Troev, D.M.; Miteva, M.Z. Influence of the increase in intestinal permeability and microbiota change in the development of Hashimoto’s thyroiditis—Systematic review. Endocr. Metab. Sci. 2024, 16, 100195. [Google Scholar] [CrossRef] [Scilit]
- Stojanov, S.; Berlec, A.; Štrukelj, B. The Influence of Probiotics on the Firmicutes/Bacteroidetes Ratio in the Treatment of Obesity and Inflammatory Bowel disease. Microorganisms 2020, 8, 1715. [Google Scholar] [CrossRef] [Scilit] [PubMed]
- Chen, Y.; Zhou, J.; Wang, L. Role and Mechanism of Gut Microbiota in Human Disease. Front. Cell Infect. Microbiol. 2021, 11, 625913. [Google Scholar] [CrossRef] [Scilit] [PubMed]
- Sawicka-Gutaj, N.; Gruszczyński, D.; Zawalna, N.; Nijakowski, K.; Muller, I. Microbiota Alterations in Patients with Autoimmune Thyroid Diseases: A Systematic Review. Int. J. Mol. Sci. 2022, 23, 13450. [Google Scholar] [CrossRef] [Scilit] [PubMed]
- Liu, S.; An, Y.; Cao, B.; Sun, R.; Ke, J. The Composition of Gut Microbiota in Patients Bearing Hashimoto’s Thyroiditis with Euthyroidism and Hypothyroidism. Int. J. Endocrinol. 2020, 2020, 5036959. [Google Scholar] [CrossRef] [Scilit] [PubMed]
- Ju, D.W. The Gut Microbiota; eCampusOntario: Toronto, ON, Canada, 2020. [Google Scholar]
- Zhu, C.; Song, K.; Shen, Z.; Quan, Y.; Tan, B. Roseburia intestinalis inhibits interleukin-17 excretion and promotes regulatory T cells differentiation in colitis. Mol. Med. Rep. 2018, 17, 7567–7574. [Google Scholar] [CrossRef] [Scilit] [PubMed]
- Martín, R.; Rios-Covian, D.; Huillet, E.; Auger, S.; Khazaal, S.; Bermúdez-Humarán, L.G.; Sokol, H.; Chatel, J.M.; Langella, P. Faecalibacterium: A bacterial genus with promising human health applications. FEMS Microbiol. Rev. 2023, 47, fuad039. [Google Scholar] [CrossRef] [Scilit] [PubMed]
- Maslowski, K.M.; Mackay, C.R. Diet, gut microbiota and immune responses. Nat. Immunol. 2011, 12, 5–9. [Google Scholar] [CrossRef] [Scilit] [PubMed]
- Duncan, S.H.; Belenguer, A.; Holtrop, G.; Johnstone, A.M.; Flint, H.J. Reduced Dietary Intake of Carbohydrates by Obese Subjects Results in Decreased Concentrations of Butyrate and Butyrate-Producing Bacteria in Feces. Appl. Environ. Microbiol. 2007, 73, 1073–1078. [Google Scholar] [CrossRef] [Scilit] [PubMed]
- Lakhdari, O.; Tap, J.; Béguet-Crespel, F.; Le Roux, K.; de Wouters, T. Identification of NF-κB Modulation Capabilities within Human Intestinal Commensal Bacteria. BioMed. Res. Int. 2011, 2011, 282356. [Google Scholar] [CrossRef] [Scilit] [PubMed]
- Gong, B.; Meng, F.; Wang, X.; Han, Y.; Yang, W.; Wang, C.; Shan, Z. Effects of iodine intake on gut microbiota and gut metabolites in Hashimoto thyroiditis-diseased humans and mice. Commun. Biol. 2024, 7, 136. [Google Scholar] [CrossRef] [Scilit] [PubMed]
- Hu, L.; Li, J.; Zhang, M.; Sun, Z.; Ban, Y. Gut microbiome characteristics of women with hypothyroidism during early pregnancy detected by 16S rRNA amplicon sequencing and shotgun metagenomic. Front. Cell Infect. Microbiol. 2024, 14, 1369192. [Google Scholar] [CrossRef] [Scilit] [PubMed]
- Bui, T.N.Y.; Paul, A.; Guleria, S.; O’Sullivan, J.M.; Toldi, G. Short-chain fatty acids-a key link between the gut microbiome and T-lymphocytes in neonates? Pediatr. Res. 2026, 99, 1698–1706. [Google Scholar] [CrossRef] [Scilit] [PubMed]
- Clavel, T.; Neto, J.C.G.; Lagkouvardos, I.; Ramer-Tait, A.E. Deciphering interactions between the gut microbiota and the immune system via microbial cultivation and minimal microbiomes. Immunol. Rev. 2017, 279, 8–22. [Google Scholar] [CrossRef] [Scilit] [PubMed]
- Singh, V.; Lee, G.; Son, H.; Koh, H.; Kim, E.S. Butyrate producers, “The Sentinel of Gut”: Their intestinal significance with and beyond butyrate, and prospective use as microbial therapeutics. Front. Microbiol. 2023, 13, 1103836. [Google Scholar] [CrossRef] [Scilit] [PubMed]
- Shi, Z.; Li, M.; Zhang, C.; Li, H.; Zhang, Y. Butyrate-producing Faecalibacterium prausnitzii suppresses natural killer/T-cell lymphoma by dampening the JAK-STAT pathway. Gut 2025, 74, 557–570. [Google Scholar] [CrossRef] [Scilit] [PubMed]
- Cayres, L.C.F.; de Salis, L.V.V.; Rodrigues, G.S.P.; Lengert, A.V.H.; Biondi, A.P.C.; Sargentini, L.D.B.; Brisotti, J.L.; Gomes, E.; de Oliveira, G.L.V. Detection of Alterations in the Gut Microbiota and Intestinal Permeability in Patients With Hashimoto Thyroiditis. Front. Immunol. 2021, 12, 579140. [Google Scholar] [CrossRef] [Scilit] [PubMed]
- Wang, W.; Dernst, A.; Martin, B.; Lorenzi, L.; Cadefau-Fabregat, M.; Phulphagar, K.; Wagener, A.; Budden, C.; Stair, N.; Wagner, T.; et al. Butyrate and propionate are microbial danger signals that activate the NLRP3 inflammasome in human macrophages upon TLR stimulation. Cell Rep. 2024, 43, 114736. [Google Scholar] [CrossRef] [Scilit] [PubMed]
- Ahmed, W.; Dewar, S.; Williams, R. Lawsonella clevelandensis is a rare cause of infected chronic contained rupture of abdominal aortic aneurysm. Access Microbiol. 2021, 3, 000183. [Google Scholar] [CrossRef] [Scilit] [PubMed]
- Ramesh, R.; Assi, M.; Esquer Garrigos, Z.; Sohail, M.R. Lawsonella clevelandensis: An emerging cause of vascular graft infection. BMJ Case Rep. 2021, 14, e237350. [Google Scholar] [CrossRef] [Scilit] [PubMed]
- Gehrke, A.; Giai, C.; Gómez, M. Staphylococcus aureus Adaptation to the Skin in Health and Persistent/Recurrent Infections. Antibiotics 2023, 12, 1520. [Google Scholar] [CrossRef] [Scilit] [PubMed]
- Raineri, E.J.M.; Maaß, S.; Wang, M.; Brushett, S.; Palma Medina, L.M. Staphylococcus aureus populations from the gut and the blood are not distinguished by virulence traits: A critical role of host barrier integrity. Microbiome 2022, 10, 240. [Google Scholar] [CrossRef] [Scilit] [PubMed]
- Brüssow, H.; Canchaya, C.; Hardt, W.D. Phages and the evolution of bacterial pathogens: From genomic rearrangements to lysogenic conversion. Microbiol. Mol. Biol. Rev. 2004, 68, 560–602. [Google Scholar] [CrossRef] [Scilit] [PubMed]
- Borodovich, T.; Shkoporov, A.N.; Ross, R.P.; Hill, C. Phage-mediated horizontal gene transfer and its implications for the human gut microbiome. Gastroenterol. Rep. 2022, 10, goac012. [Google Scholar] [CrossRef] [Scilit] [PubMed]
- Auger, S.; Kropp, C.; Borras-Nogues, E.; Chanput, W.; Andre-Leroux, G. Intraspecific Diversity of Microbial Anti-Inflammatory Molecule (MAM) from Faecalibacterium prausnitzii. Int. J. Mol. Sci. 2022, 23, 1705. [Google Scholar] [CrossRef] [Scilit] [PubMed]
- Noguchi, S.; Onoue, S.; Kouzai, H.; Kawahara, K. Effects of cloned murE gene for peptidoglycan synthesis on morphology and amino acid composition of peptidoglycan of Escherichia coli. J. Gen. Appl. Microbiol. 2025, 71, jgam.2025.2010. [Google Scholar] [CrossRef] [Scilit] [PubMed]
- Spaulding, A.R.; Salgado-Pabón, W.; Kohler, P.L.; Horswill, A.R.; Leung, D.Y.M. Staphylococcal and Streptococcal Superantigen Exotoxins. Clin. Microbiol. Rev. 2013, 26, 422–447. [Google Scholar] [CrossRef] [Scilit] [PubMed]
- Herwaldt, E.J.; Rivett, E.D.; White, A.J.; Hegg, E.L. Cox15 interacts with the cytochrome bc(1) dimer within respiratory supercomplexes as well as in the absence of cytochrome c oxidase. J. Biol. Chem. 2018, 293, 16426–16439. [Google Scholar] [CrossRef] [Scilit] [PubMed]
- Narayanan, B.; Xia, C.; McAndrew, R.; Shen, A.L.; Kim, J.P. Structural basis for expanded substrate specificities of human long chain acyl-CoA dehydrogenase and related acyl-CoA dehydrogenases. Sci. Rep. 2024, 14, 12976. [Google Scholar] [CrossRef] [Scilit] [PubMed]

Disclaimer/Publisher’s Note: The statements, opinions and data contained in all publications are solely those of the individual author(s) and contributor(s) and not of MDPI and/or the editor(s). MDPI and/or the editor(s) disclaim responsibility for any injury to people or property resulting from any ideas, methods, instructions or products referred to in the content. |
© 2026 by the authors. Licensee MDPI, Basel, Switzerland. This article is an open access article distributed under the terms and conditions of the Creative Commons Attribution (CC BY) license.