


Abstract
Pneumatic soft grippers adapt to uncertain object geometry through compliant deformation, and their performance is governed by chamber geometry, material behavior, pneumatic routing, and pressure control. This study develops a modular soft-finger gripper and a common-pressure-control platform. A toothed, multi-chamber Shore A20 silicone finger was cast in split polylactic acid (PLA) molds. Uniaxial tensile data from the same material batch were fitted with a third-order Yeoh model and used in an Abaqus/Standard simulation with 25,940 10-node quadratic hybrid tetrahedral (C3D10H) elements. Across 5–40 kPa, measured chord angles agreed with finite-element predictions with a maximum relative error of 5.69%. A single finger generated a tip contact force of 0.96 N at 35 kPa. The H-shaped and X-shaped configurations were documented in qualitative object-grasping demonstrations on representative household objects, including regular, cylindrical, and small asymmetric forms. The physical platform integrates an Arduino UNO, metal–oxide–semiconductor (MOS) driver, 24 V pump, FA2021B three-way valve, M1 pressure manifold, and MATLAB App Designer host interface. Fixed-gain proportional–integral–derivative (PID) and fuzzy gain-scheduled PID controllers were compared only in nonlinear pressure-tracking simulations; no experimental closed-loop pressure-tracking results are reported. Fuzzy gain-scheduled PID reduced settling time from 13.12 to 6.62 s and integral absolute error (IAE) from 76.01 to 58.48 kPa s. The resulting framework combines modular design, material characterization, numerical validation, experimental grasping evidence, platform integration, and pressure-control simulation.
1. Introduction
Robots increasingly handle food products, laboratory samples, thin-walled parts, and mixed objects whose dimensions, stiffness, surface friction, and initial pose vary from one cycle to the next. A rigid parallel gripper works well when the contact geometry is known and repeatable, but small positioning errors can then be converted into concentrated pressure, visible indentation, or loss of contact. Soft grippers address this problem through continuous deformation: the fingers conform to the object and redistribute contact as the object moves [1,2,3,4]. Their attraction is not simply that they bend. The useful property is controlled compliance, meaning that the gripper must form enough contact to retain an object while remaining sufficiently compliant to avoid damage.
Available soft-gripper technologies include tendon-driven and underactuated hands, dielectric-elastomer devices, shape-memory actuators, vacuum or jamming mechanisms, and fluidic elastomer actuators [5,6,7,8,9]. Pneumatic actuation is particularly common in laboratory prototypes because the working body can be cast from low-cost silicone and the pressure source remains outside the contact surface. Embedded pneumatic networks convert chamber-wall expansion into bending when one side of the actuator is constrained [10,11,12,13]. The same mechanism also creates familiar engineering difficulties: the chamber response is nonlinear, silicone properties depend on processing, air is compressible, and pressure dynamics depend on the pump, valve, tubing, manifold volume, and leakage rather than on the finger geometry alone.
Early embedded-network actuators demonstrated large, programmable deformation in elastomeric bodies [10,11]. Subsequent work extended this principle to fiber-reinforced actuators with pressure-dependent bending and measurable output [12,13]. Together, these studies establish the relationship between actuator architecture, material response, and output motion.
The structural design of a pneumatic finger is coupled to the material model. Chamber height and pitch, wall thickness, rib shape, constraint-layer stiffness, root fixation, and external contact determine the resulting curvature and stress distribution [14,15]. Geometry selection therefore combines deformation capacity, stress management, manufacturability, and mounting constraints.
Silicone fingers normally operate beyond the strain range for which linear elasticity is appropriate. Hyperelastic laws instead describe the strain-energy density under finite deformation. The Ogden family provides a general spectral form for rubber-like solids, while the Yeoh form represents strain hardening through powers of the first deviatoric invariant [16,17]. The latter is convenient when uniaxial tensile data dominate the available evidence. Even then, the coefficients depend on material grade, mixing ratio, degassing, cure schedule, specimen geometry, loading rate, and fitted strain range. A cross-laboratory comparison of common soft-robotic elastomers found substantial differences that make batch-specific testing preferable to borrowing constants from a datasheet [18].
Previous studies have demonstrated that structural reinforcement and constraint layers can modify the deformation mode generated by identical pneumatic inputs [19,20]. At the complete gripper scale, modular mechanisms and compliant fingers have been used to widen the object range, identify contact conditions, and manipulate uncertain geometry [21,22,23,24,25]. Those capabilities still require task-level evidence: object properties, initial offset, pressure history, hold time, and failure criteria should be recorded rather than inferred from a selected photograph.
Pressure delivery introduces a second layer of dynamics. Supply pressure, effective flow area, line resistance, chamber volume, and exhaust routing determine rise and fall times [26,27,28,29]. In a soft actuator, these pneumatic effects interact with wall expansion and leakage, so the controller coordinates the pneumatic network and the compliant load.
Recent studies have further demonstrated the value of modularity and material-specific modeling in pneumatic soft grippers. Zhang et al. combined regular and herringbone PneuNet actuators in a modular gripper and experimentally showed the trade-off between longitudinal output force and transverse conformability [30]. Correia et al. compared molded silicone PneuNet actuators using third-order Yeoh models and showed that the agreement between finite-element predictions and experiments depends on the silicone material and fabrication details [31]. Antonelli et al. proposed a reconfigurable modular reinforcement for a silicone pneumatic actuator and characterized its bending, force, and response time over a broad pressure range [32].
Table 1 compares these representative studies with the present work. The comparison indicates that the contribution of this study is not a claim of universally superior payload capacity. Rather, it is the integration of interchangeable H-shaped and X-shaped mounting architectures, a single toothed multi-chamber Shore A20 finger, batch-specific hyperelastic characterization, finite-element-to-experiment bending validation, physical force and grasping demonstrations, and a common-pressure-control simulation within a stated operating range.
Table 1.
Comparison of representative modular and silicone-based pneumatic grippers with the present modular soft-finger gripper.
Reference [1] reported a flexible finger with a fixed structural design, Abaqus-based deformation analysis, radial-basis-function proportional–integral–derivative (RBF-PID) pressure regulation, and experimental checks of bending angle and tip force. In contrast, the present work introduces a toothed multi-chamber finger with interchangeable H-shaped and X-shaped four-finger mounting arms. The present study further combines same-batch silicone characterization, three-dimensional finite-element bending analysis, pressure–angle validation, single-finger force measurement, two-layout grasping demonstrations, and a common-pressure-acquisition platform. The toothed constraint layer is treated as a design rationale for local conformity; no controlled comparison with an otherwise identical non-toothed finger was performed. The fuzzy gain-scheduled PID contribution is methodological and simulation-based, rather than a new control law or a claim of experimentally demonstrated superiority. The specific scientific problem is how to establish a traceable link between batch-specific silicone characterization, geometry-specific bending prediction, pressure regulation, and documented qualitative grasping evidence when the same soft finger is mounted in two different four-finger layouts. This problem is relevant because configuration changes alter load paths and contact conditions, whereas many previous studies validate only one geometry or report control performance without connecting it to the measured material and structural response.
Accordingly, this study develops and evaluates a modular pneumatic soft-finger gripper with interchangeable H-shaped and X-shaped arm configurations. The soft finger is fabricated from Shore A20 silicone using split polylactic acid (PLA) molds and incorporates a toothed lower constraint layer. Uniaxial tests on specimens cast from the same material batch are used to identify a third-order Yeoh model for finite-element analysis. The numerical pressure-bending response is compared with physical chord-angle measurements, while tip-force measurements and object-grasping demonstrations provide physical evidence at the finger and gripper levels. In parallel, an Arduino-based common-pressure platform and a nonlinear pressure-control simulation are developed to compare fixed-gain PID and fuzzy gain-scheduled PID control. The results are interpreted within the stated 5–40 kPa pressure range and the specified experimental fixtures and objects.
2. Materials and Methods
2.1. Experimental Setup, Test Conditions, and Measurement Procedure
All physical tests were performed using fingers fabricated from the same Shore A20 silicone batch and under the same curing protocol. The pneumatic system consisted of the AP40-3 miniature pump, the FA2021B normally closed three-way solenoid valve, the buffer reservoir, the M1 common-pressure manifold: assembled using ATM pneumatic fittings (PU/PE/PY type, PBT plastic), supplied by Aoteman Pneumatic Components, Shenzhen, China, the mechanical pressure gauge: ACUTEK mechanical pressure gauge, manufactured by Shanghai Yichuan High-tech Instrument Co., Ltd., Shanghai, China, and the single-finger or four-finger test fixtures: model SYJ-01, Ruishi Technology; purchased through Taobao Marketplace (Alibaba Group), Hangzhou, China, described below. The electronic pressure sensor was an XGZP6847A040KPG amplified gauge-pressure sensor (CFSensor). Its measurement range was 0–40 kPa, and it provided a calibrated analog output of 0.5–4.5 V under a 5 V supply. The manufacturer-stated accuracy was ±1% of full span, corresponding to ±0.40 kPa over the 0–40 kPa range. The sensor was temperature-compensated over 0–60 °C. Its analog output was acquired by the 10-bit converter (ADC) of the Arduino UNO: Arduino UNO R3, manufactured by Arduino S.r.l., Monza, Italy. With a 5 V ADC reference, the nominal ADC quantization increment was approximately 0.049 kPa/count; this value represents digitization resolution rather than overall measurement accuracy. The pressure level was set and monitored at the downstream M1 measurement point, which was located on the same pneumatic side as the soft finger.
For pressure-induced bending validation, a single finger was clamped at its non-active root region in the fixture used for the finite-element comparison. Internal pressures of 5, 10, 15, 20, 25, 30, 35, and 40 kPa were applied sequentially. After the pressure reading at M1 became stable, the deformed finger was photographed against the same grid background and from the same viewing direction. The chord angle was defined as the angle between the initial longitudinal axis of the finger and the line joining the root-center reference point to the deformed tip reference point. The bending angle was measured directly using coordinate paper placed behind the finger. The center of the clamped root was defined as the reference point O. The undeformed fingertip position T0 and the deformed fingertip position T were read from the coordinate grid before and after pressurization, respectively. The bending angle theta was determined from the change in direction between the initial line OT0 and the deformed line OT. The same coordinate-paper method and reference-point definition were applied under all pressure conditions and in the finite-element comparison. The same finger was used throughout one ascending pressure sequence, and no repeated or unloading measurements were performed. Therefore, this experiment was used for comparison between the finite-element (FE) model and the experiment rather than for a statistical repeatability analysis.
For the tip-contact-force measurement, the finger root was fixed in the fixture and the fingertip was brought into light contact with a digital force gauge. The gauge was zeroed in the fully depressurized state, and its loading axis was aligned with the primary direction of tip motion. Measurements were performed at 20, 30, and 35 kPa after the pressure had stabilized. Three repeated measurements were conducted on the same finger at each pressure, with complete venting between repetitions. The reported force values are the mean values and standard deviations of the three measurements.
For the four-finger object-grasping demonstrations, each object was placed near the center of the contact region before pressurization. The H-shaped layout was used primarily for regular-sided or elongated objects, whereas the X-shaped layout was used for selected cylindrical, oval, or small asymmetric objects. The layout assignment was object-specific rather than determined exclusively by object shape; consequently, cylindrical objects were tested with both configurations. The gripper was pressurized until continuous finger–object contact was established and the object posture was retained. Photographs were recorded after continuous finger–object contact had been established and the object posture had been retained. These trials were documented physical demonstrations rather than a randomized statistical success-rate study; therefore, the results are used to illustrate configuration suitability and contact behavior, rather than to claim a universal grasping success probability.
2.2. Modular Gripper Architecture
The end effector consists of a rigid mounting base, interchangeable gripper arms, detachable finger clamps, and cast pneumatic soft fingers. The mounting base transfers external loads to the rigid structure and defines the installation reference. An H-shaped arm provides four finger-mounting positions for opposed contact around elongated or prismatic targets. An X-shaped arm provides four radial mounting locations for circumferential contact around approximately spherical or pose-uncertain targets. The finger clamps are bolted to the arm and engage only the non-active root region, allowing a damaged finger or a modified geometry to be replaced without rebuilding the complete end effector.
Figure 1 shows the two modular layouts: the H-shaped arm provides an opposed arrangement for elongated objects, whereas the X-shaped arm provides a circumferential arrangement for approximately spherical objects. The H-shaped and X-shaped drawings in Figure 1 are conceptual schematics used to explain the two alternative contact arrangements, rather than dimensional drawings of the fabricated rigid arms. The physical assemblies were used in the qualitative object-grasping demonstrations.
Figure 1.
Conceptual schematics of the alternative four-finger arrangements: (a) opposed H-shaped layout; (b) circumferential X-shaped layout. The schematics illustrate the relative finger arrangement and intended contact directions only; they are not engineering drawings and are not to scale.
2.3. Soft-Finger Geometry and Fabrication
Each finger contains nine interconnected rectangular pneumatic chambers, an inlet passage, an extensible chamber wall, and a continuous lower constraint layer. Rectangular teeth are formed on the external surface of the constraint layer. When the chambers are pressurized, the upper chamber region expands more than the lower layer, producing a bending moment toward the constrained side. The external teeth were incorporated as a design feature intended to increase local geometric conformity during bending and contact.
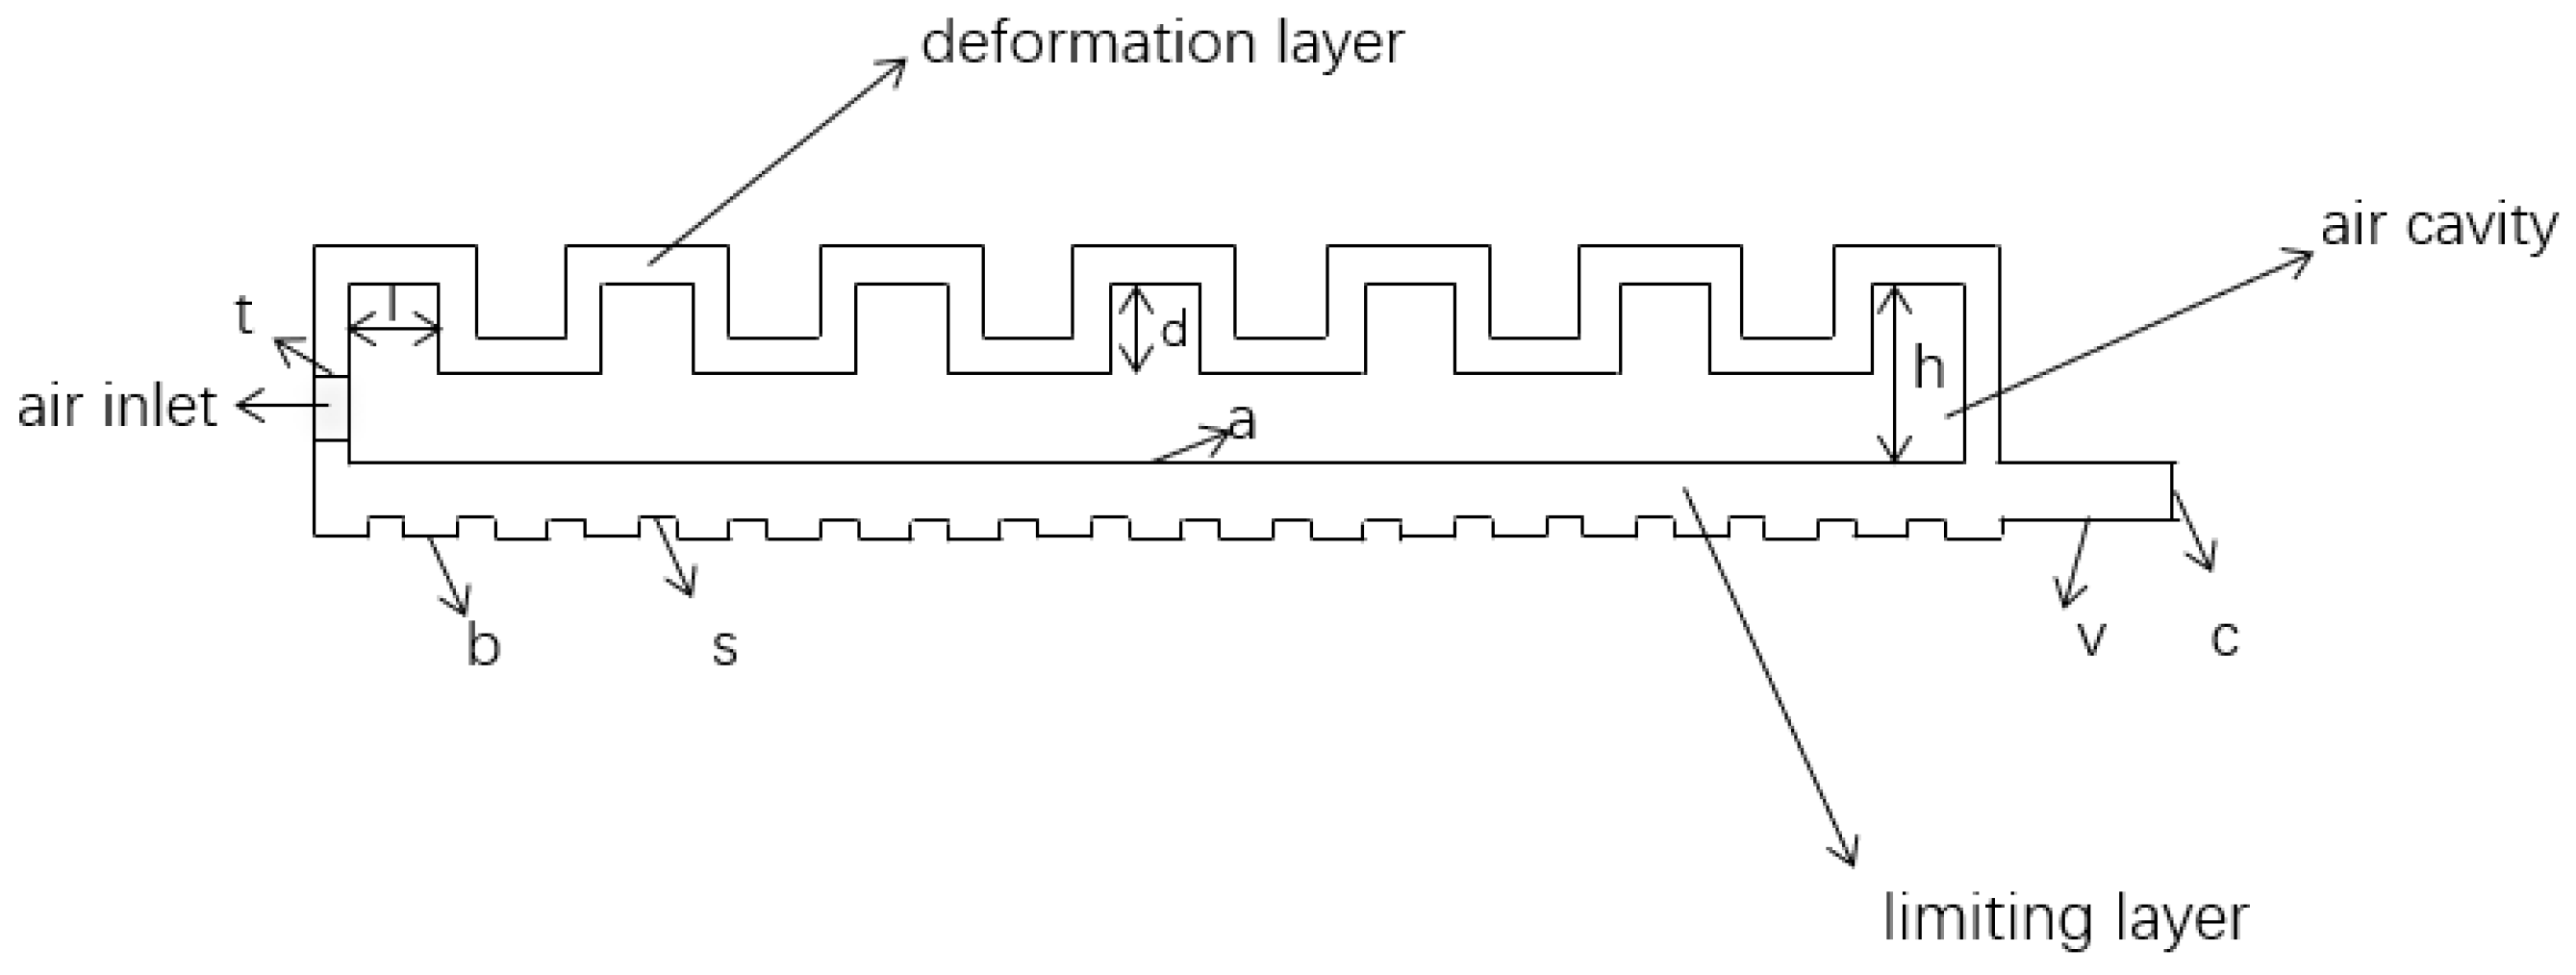
Figure 2 defines the dimensional symbols used for the soft finger. The active pneumatic-chamber array length is a = 89 mm; h = 10 mm denotes the chamber height; and t = 2 mm denotes the nominal wall thickness. The local chamber dimensions l and d are both 5 mm. The chamber width and overall finger width are 20 and 24 mm, respectively, giving nominal 2 mm side walls. On the lower constraint layer, b = 3 mm denotes tooth width, the unlabeled tooth height is 1 mm, and s = 2 mm denotes tooth spacing. The constraint-layer thickness is c = 3 mm, and the distal tip reserve is v = 10 mm.
Figure 2.
Geometry and dimensional symbols of the multi-chamber soft finger: a, active chamber-array length; h, chamber height; t, wall thickness; l and d, local chamber dimensions; b, tooth width; s, tooth spacing; c, constraint-layer thickness; v, distal tip reserve.
The finger was produced using a split mold fabricated by fused-deposition modeling from polylactic acid. The upper mold and removable core defined the chamber side; after initial curing and core removal, the lower mold closed the chamber network and formed the toothed constraint surface. The silicone used in this study was Posilicone Shore A20 semitransparent self-defoaming mold silicone. Components A and B were mixed slowly at a mass ratio of 1:1. Although the material had self-defoaming capability, the mixture was additionally vacuum-degassed for approximately 30 min to remove entrapped air; the exact vacuum level was not recorded. The silicone was poured along one side of the mold to reduce air entrapment and cured at room temperature for approximately 8–10 h. No additional thermal post-curing treatment was applied. The same material batch and curing procedure were used for the tensile specimens and the pneumatic fingers. After curing, the finger was demolded, trimmed, fitted with pneumatic tubing, and checked visually and under low pressure for air-passage continuity, wall uniformity, and leakage.
Figure 3 presents the mold sequence and printed tooling used to fabricate the soft finger.
Figure 3.
Split–mold fabrication sequence for the toothed multi-chamber soft finger.
2.4. Silicone Tensile Test and Constitutive Identification
Dumbbell specimens were cast from the same Shore A20 silicone batch and under the same curing conditions as the finger prototypes. Each specimen had a total length of 120 mm, a grip width of 25 mm, a gauge length of 40 mm, a gauge width of 12 mm, a thickness of 4 mm, and R14 transitions; the initial gauge cross-sectional area was therefore 48 mm2. Three specimens were tested at room temperature using an electronic universal testing machine (model 5010A; IDEAR, Dongguan Dongri Instrument Co., Ltd., Dongguan, China; rated capacity 50 kg; system precision setting 0.5) equipped with a DRS-50KG load cell (P/N 152883, Dongguan Dongri Instrument Co., Ltd., Dongguan, China; nominal capacity approximately 500 N; sensitivity 2.0 mV/V). The displacement channel had a nominal range of 700 mm, and force and displacement were recorded at approximately 30 Hz. The specimens were aligned with the loading axis and loaded monotonically to failure under displacement control at an actual displacement rate of approximately 30 mm/min, determined from the exported displacement-time data. No preconditioning or unloading–reloading cycles were performed. Nominal stress and strain were calculated from the initial gauge dimensions. The tensile procedure followed ASTM D412 [33] where applicable; because the specimen dimensions were selected to fit the available mold and testing fixture, they were treated as custom geometries for constitutive-parameter identification rather than standard specimens for formal material certification.
Nominal strain ε and nominal stress σ were calculated from the gauge extension ΔL and measured force F using conventional engineering definitions for uniaxial elastomer testing [33]:
where L0 = 40 mm and A0 = 48 mm2. The stretch ratio was λ = 1 + ε. Figure 4 documents the specimen geometry, a cast specimen, and the tensile-test apparatus.
Figure 4.
Silicone material test: (a) specimen dimensions; (b) cast Shore A20 dumbbell specimen; (c) uniaxial tensile-test setup.
A third-order Yeoh model was selected for the approximately incompressible silicone following the strain-energy formulation proposed for rubber-like materials [16,17]. Its strain-energy density was written as
where is the first deviatoric strain invariant, J is the volume ratio, C10, C20, and C30 define the deviatoric response, and D1 controls the volumetric penalty. Under incompressible uniaxial tension, , with . Therefore, . The nominal stress used for fitting was
Because D1 was not independently identified from the uniaxial tensile data, a Poisson ratio of ν = 0.495 was assumed for the nearly incompressible silicone. Using the initial shear modulus μ0 = 2C10, the bulk modulus was calculated as K = 2μ0(1 + ν)/[3(1 − 2ν)], and D1 was then calculated from D1 = 2/K, giving D1 = 0.226434 MPa−1. Thus, D1 was introduced as an assumed numerical compressibility parameter rather than as an independently fitted material coefficient.
The fitted parameters are listed in Table 2, and the measured force-displacement curves together with the corresponding Yeoh fit are shown in Figure 5. The third-order Yeoh model was fitted to the averaged nominal stress–strain curve obtained from the three specimens over an engineering-strain interval of 0–3.0 (0–300%). The fit yielded an root mean square error (RMSE) of 0.002990 MPa and an R2 value of 0.999549.
Table 2.
Third-order Yeoh parameters for the tested Shore A20 silicone.
Figure 5.
Material characterization: (a) measured force-displacement curves; (b) third-order Yeoh fit to the tensile data.
The fitted hyperelastic law was identified from a single monotonic uniaxial loading condition. Viscoelasticity, hysteresis, stress relaxation, and Mullins-type effects were not separately characterized; therefore, the model is used here to represent the quasi-static loading condition of the present study rather than the full rate-dependent cyclic behavior of the silicone.
Because the constitutive law represents the silicone material rather than the specimen shape, the parameters identified from the dumbbell tests were assigned to all silicone regions of the finger FE model. The different finger shape was represented explicitly by the chamber network, lower constraint layer, wall thicknesses, distal tip, and fixed-root boundary condition in the three-dimensional geometry. Thus, the specimen geometry was used for material identification, whereas the finger geometry governed the simulated bending response. No specimen-to-finger geometric scaling was applied to the fitted material parameters.
2.5. Finite-Element Model
A three-dimensional model containing the internal chamber network, distal tip, fixed root, and lower constraint layer was analyzed in Abaqus/Standard using a consistent mm-N-MPa unit system. External tubing and rigid mounting hardware were omitted. The complete root face was fixed. To represent the intended planar-bending configuration, the U3 displacement was constrained for the AllNodesPlanar set. This is an idealized kinematic constraint rather than a direct representation of a separately modeled lateral guide in the physical fixture. A 40 kPa sensitivity analysis used the same geometry, material parameters, mesh, root fixation, pressure loading, and post-processing definitions, but with the global U3 constraint released. No self-contact or contact interaction between adjacent chamber regions was defined in the baseline model because these surfaces did not contact during the simulated deformation. At 40 kPa, the chord angle changed from 35.38° in the constrained model to 34.92° in the model with U3 released, while the maximum displacement changed from 81.78 mm to 80.36 mm. These differences were 0.46° and 1.42 mm, corresponding to approximately 1.30% and 1.74%, respectively. The small changes support use of the planar-bending assumption for the reported quasi-static response, while out-of-plane deformation and twisting are outside the present model scope. Uniform pressure was applied to the internal walls of the nine pneumatic chambers, represented by 30 loaded internal chamber-wall surfaces in the FE model.
Near-incompressibility and large deformation were addressed using C3D10H quadratic hybrid tetrahedral elements. The nominal global seed size of the baseline C3D10H mesh was 2.0 mm. The resulting mesh contained 44,895 nodes and 25,940 elements. The nominal wall thickness was 2 mm, so the baseline mesh provided approximately one element across the nominal wall thickness. All analyses were performed in Abaqus/Standard using a static, general step with geometric nonlinearity enabled (NLGEOM = YES). The initial, minimum, and maximum increment sizes were 0.005, 1 × 10⁻⁸, and 0.02, respectively, with a maximum of 1000 increments. Automatic stabilization was not activated. The root face was fully fixed, and U3 was constrained for all nodes to enforce planar bending. For the 40 kPa C3D10H analysis, the maximum principal logarithmic strain was 1.124, and the maximum von Mises stress was 1.829 MPa. The final total strain energy was 1033.501, while the dissipated stabilization energy (ALLSD) was zero. The analysis completed successfully without cutbacks or termination errors. Eight static–general analyses were solved at 5, 10, 15, 20, 25, 30, 35, and 40 kPa. The root face was fixed, U3 was constrained, and uniform pressure was applied to 30 chamber-wall surfaces.The mesh-sensitivity results at 40 kPa for the selected baseline and three additional C3D10H meshes are summarized in Table 3.
Table 3.
Mesh-sensitivity results at 40 kPa for the selected baseline and three additional C3D10H meshes.
Relative to the original 2.0 mm baseline mesh, the 4.5, 3.0, and 2.25 mm remeshed models changed the chord angle by 0.62%, −2.32%, and −3.07%, respectively. The corresponding changes in maximum displacement were −4.13%, −1.56%, and −1.62%. Thus, the global bending response varied by less than 4.2% over the tested mesh range. The 2.0 mm baseline mesh was retained for the subsequent simulations because it was the original model used for the pressure-response and experimental-validation results. All three remeshed analyses were completed successfully without cutbacks or termination errors. The dissipated stabilization energy (ALLSD) was zero for the analyses, because automatic stabilization was not activated. At 40 kPa, the original baseline model produced a maximum principal logarithmic strain of 1.124, a maximum von Mises stress of 1.829 MPa, and a total strain energy of 1033.501.
Values are taken from the final frame of each Abaqus/Standard analysis. Relative changes are calculated with respect to the selected 2.0 mm baseline mesh.
The chord angle was defined between the initial longitudinal axis and the line joining the root center to a tip reference point after deformation. The maximum displacement was taken as the largest displacement magnitude over the entire model. This consistent metric permits comparison among pressure cases.
2.6. Pneumatic Control Platform
2.6.1. Pneumatic and Electrical Architecture
The pressure platform comprises an Arduino UNO, a four-channel MOS power driver, a 24 V AP40-3 miniature pump (Shikang, Dongguan, China), a 24 V FA2021B normally closed three-way air valve (manufacturer information shown on the label as http://www.dgzqkj.cn, Dongguan, China), an EDR-150-24 DC supply(Mean Well Enterprises Co., Ltd., New Taipei City, Taiwan), a mechanical gauge, a pressure-sensor branch, a buffer reservoir, and an M1 common-pressure manifold connected to the soft finger.
The pump outlet entered a T fitting. One branch supplied port P of the three-way valve; the other entered the buffer reservoir to reduce short pressure fluctuations at the pump outlet. Valve port A connected to M1, while port R exhausted to atmosphere. The remaining M1 ports connected the finger, the mechanical gauge, and the electronic pressure sensor. During the four-finger grasping demonstrations, all four fingers were connected to the common M1 manifold. Branch pressure differences and tubing-length matching among the four fingers were not independently measured. Both pressure instruments were therefore located on the same downstream domain as the finger. This detail matters during venting: a gauge installed upstream of the valve could retain pump-side pressure even when the finger had already been connected to exhaust. The overall architecture is shown in Figure 6, and the pneumatic circuit and electrical connections are shown in Figure 7. Figure 6 summarizes the complete experimental platform, including the MATLAB R2021a host, Arduino controller, power stage, pump, valve, pressure sensor, M1 manifold, and soft finger. Figure 7a shows the pneumatic path from the pump and buffer reservoir through the FA2021B valve and M1 manifold to the soft finger. Valve port P is connected to the supply, port A is connected to the downstream M1 manifold, and port R is connected to atmosphere for venting. The mechanical gauge and electronic pressure sensor are connected downstream of the valve at the M1 measurement point. Figure 7b shows the corresponding electrical connections between the MATLAB host, Arduino UNO, pressure sensor, MOS driver, pump, and solenoid valve.
Figure 6.
Overall architecture of the MATLAB host, Arduino controller, power stage, pneumatic components, sensor, and soft finger.
Figure 7.
Control-platform interfaces: (a) pneumatic circuit and M1 measurement point; (b) electrical connections.
2.6.2. Command Protocol and Fail-Safe State
Commissioning commands were deliberately separated from automatic control. The serial interface operated at 115200 baud and parsed line-terminated commands. STATUS returned the output and valve state; VALVE TEST exercised the valve without starting a pressure-control routine; ARM enabled a subsequent bounded charging pulse; PULSE t energized the required outputs for 1–250 ms; HOLD stopped active charging while preserving the selected pneumatic condition; VENT stopped the pump and restored A-to-R exhaust; and ADC n returned n raw analog samples. The two-step ARM/PULSE sequence reduced the chance that a mistyped line would start the pump. VENT was processed as the highest-priority operational command.
Four states were distinguished in the commissioning logic: VENT, ARMED, CHARGE, and HOLD. Startup always entered VENT with the pump off and the valve de-energized. ARMED authorized one bounded pulse but did not energize a load. CHARGE activated the valve and pump for the requested duration, after which, the output returned to a non-charging state. HOLD and VENT were kept separate because a closed pneumatic volume and an exhausted volume have different safety implications. Any reset or unrecognized state forced the outputs back to VENT.
2.6.3. MATLAB Interface and Commissioning Procedure
A MATLAB App Designer interface provides port selection, connection control, pressure-setpoint entry, zero and span fields, live sample display, plotting, status logging, manual commands, and CSV export. The interface exchanges STATUS, VALVE TEST, ADC, ARM, PULSE, HOLD, and VENT commands through the serial link.
Commissioning followed a fixed order. Wiring and pneumatic routing were checked with the 24 V loads disabled. The serial port was then opened and STATUS was requested. Raw acquisition was tested with repeated ADC commands, followed by bounded output pulses and monitored venting through the M1 pressure branch.
The assembled hardware is shown in Figure 8. The relation between the simulated closed-loop pressure controller and the implemented pressure-acquisition and commissioning path is summarized in Figure 9.
Figure 8.
Implemented hardware: (a) assembled single-channel pressure platform; (b) platform connected to the MATLAB host and single-finger fixture.
Figure 9.
Control-system representation and experimental-platform boundary: (a) simulated closed-loop pressure controller with feedback; (b) implemented hardware acquisition and commissioning path. The hardware platform was used for pressure acquisition and manual commissioning, whereas the fixed-gain PID and fuzzy gain-scheduled PID results were obtained from the nonlinear pressure simulation.
2.7. Pressure-Control Formulation and Simulation
Figure 9 distinguishes the experimentally implemented acquisition and commissioning path from the simulated closed-loop controller. In the simulation, the reference quantity is r = pset [kPa], the measured quantity is y = pf [kPa], and the error is e = r − y [kPa]. The normalized controller output is u [-], which is converted into fill, vent, and hold durations Tf, Tv, and Th [s] within the control window Tc = 0.020 s. In the hardware platform, the pressure-sensor output is acquired as nADC [count] and converted to pressure using the calibration relationship in Section 2.7.1. The implemented platform is presented as a pressure-acquisition and commissioning system, not as an experimental closed-loop PID validation.
2.7.1. Sensor Conversion and Control Variables
During platform commissioning, an XGZP6847A040KPG amplified gauge-pressure sensor (CFSensor, Wuhu, Anhui, China) was connected to the downstream M1 measurement point. The sensor used in the platform had a selected gauge-pressure range of 0–40 kPa and an analog output range of 0.5–4.5 V. Its output was acquired by the Arduino 10-bit ADC using a 5 V reference voltage. A YN60 mechanical pressure gauge (manufacturer and source location not recorded; measuring range 0–100 kPa) with a nominal range of 0–100 kPa was used for pressure indication and manual reference checking.
The intended ADC-to-pressure conversion was defined as p_raw(k) = a_s n_ADC(k) + b_s, where n_ADC(k) is the ADC count, a_s is the calibration slope, and b_s is the calibration intercept. However, the numerical values of a_s and b_s, the exact number of calibration points, and the calibration residuals were not preserved in the available experimental records. These quantities are therefore not reported as measured calibration results.
The value of approximately 0.049 kPa/count represents only the theoretical ADC quantization increment calculated from a 5 V reference and a 10-bit ADC; it is not the overall pressure-measurement accuracy. The pressure signal was intended to be processed using a five-sample moving-average filter before use in the physical feedback path. The controller simulations used a sampling interval of Ts = 0.020 s. Under this nominal interval, the five-sample moving-average window corresponds to 0.100 s and has an ideal group delay of approximately 0.040 s. The actual hardware acquisition frequency, sensor repeatability, zero drift, and end-to-end sensor, communication, and actuator delays were not independently measured. These limitations are considered when interpreting the pressure-control results, which are reported as simulation results rather than experimental closed-loop validation. The intended ADC-to-pressure conversion was defined as follows:
where a_s has units of kPa/count, b_s has units of kPa, p_raw(k) denotes the reconstructed pressure at sampling instant k, and n_ADC(k) represents the raw ADC reading. For the intended physical feedback path, the five-sample moving-average filter was defined as follows:
This filter follows standard discrete-time signal-processing practice [34]. The pressure-tracking error was defined as
2.7.2. Incremental PID and Time Allocation
A discrete incremental PID law was adopted following standard digital PID control formulations [35]. The output was interpreted as a change in the fill/vent duty command. Derivative action was applied to the filtered pressure p_f(k) to reduce derivative kick after a setpoint change. The accumulated command was saturated before timing allocation.
The accumulated command u(k) was limited to [−1, 1]. Positive output was assigned to filling and negative output to venting. Within each control window T_c, the requested times were
where T_f(k), T_v(k), and T_h(k) are fill, vent, and hold durations. The baseline controller used Kp = 0.085, Ki = 0.018, K_d = 0.005, and T_c = 0.020 s for the 20, 30, and 35 kPa pressure targets. The baseline PID gains were selected by manual empirical tuning for the nonlinear simulation. The gain values were adjusted iteratively across the 20, 30, and 35 kPa target-pressure simulations until the controller produced bounded outputs, stable convergence, and no sustained oscillation. The normalized command was constrained to u(k) in [−1, 1], and the control-window duration was fixed at Tc = 0.020 s. The final gain set was selected as a common fixed-gain PID baseline for comparison with the fuzzy gain-scheduled controller. These gains were selected for the present simulation study and were not claimed to be experimentally validated closed-loop gains. The FA2021B component used in the platform is a 24 V DC two-position three-way miniature solenoid valve, and the AP40-3 component is a 24 V miniature pneumatic pump. The publicly available information identified the component types and nominal supply voltage, but did not provide verified opening and closing delays, minimum effective valve pulse width, or complete flow-pressure characteristics for the exact units used in this study. Therefore, these component ratings were not used to claim that the assembled platform can realize a 20 ms control interval. The minimum effective pulse width, combined valve and pump delays, pressure-sensor latency, communication latency between the Arduino and the host computer, tubing resistance, and minimum fill, vent, and hold times were not experimentally measured or included as hardware constraints in the present simulation. The control window T_c = 0.020 s is consequently treated as a simulation time-allocation interval rather than an experimentally verified 50 Hz hardware sampling period.
2.7.3. Fuzzy Gain Scheduling
A fuzzy gain scheduler was used to modify the PID gains according to the instantaneous pressure error and its rate [36]. During the early portion of a step, the rule base emphasized proportional action; as pressure approached the target, the effective action was moderated and a smaller integral contribution corrected the remaining offset. Across the three nominal setpoints, the response retained a consistent form across operating regions.
E(k) = sat_[−1, 1]{k_e e(k)}; EC(k) = sat_[−1, 1]{k_ec[e(k) − e(k − 1)]/T_c},
Both inputs were partitioned into seven linguistic levels: negative big (NB), negative medium (NM), negative small (NS), zero (ZO), positive small (PS), positive medium (PM), and positive big (PB).
The pressure error e and its rate de were normalized by dividing them by 15 and 35, respectively, and then limiting the results to the range [−1, 1]. Seven triangular membership functions were used for each normalized input, with centers at −1, −2/3, −1/3, 0, 1/3, 2/3, and 1. For each pair of activated membership functions, the rule weight was calculated as the product of their membership degrees. The proportional-gain correction for each rule was calculated from 0.120 times the absolute value of the error-membership center, with an additional 0.020 when the error and error-rate centers had the same sign. The integral-gain correction was calculated as 0.038 times the product of one minus the absolute values of the two membership centers. The derivative-gain correction was calculated as 0.024 times the absolute value of the error-rate center, with an additional 0.008 when the error magnitude exceeded 0.33 and the error and error-rate centers had opposite signs. Weighted-average defuzzification was then used to obtain the corrections to the proportional, integral, and derivative gains. The resulting gains were limited to 0.090–0.255 for Kp, 0.006–0.065 for Ki, and 0.006–0.035 for Kd. The controller output was limited to [−1, 1]. Integral accumulation was inhibited when the proposed output was saturated. A zero-output dead band was applied when the absolute error was smaller than 0.18, while the minimum nonzero command magnitude was set to 0.07. The input scaling factors were ke = 1/15 kPa−1 and kec = 1/35 (kPa s−1)−1. The common width of the triangular membership functions was h = 1/3. The logical AND operation was implemented as the product of the membership grades, wij = μi(en)μj(den). The activated rule consequents were aggregated using weighted averaging, and no additional output scaling was applied to the defuzzified gain corrections.
The baseline gains were Kp0 = 0.105, Ki0 = 0.024, and Kd0 = 0.006. The minimum and maximum gain bounds were 0.090 ≤ Kp ≤ 0.255, 0.006 ≤ Ki ≤ 0.065, and 0.006 ≤ Kd ≤ 0.035. At initialization, the chamber pressure, previous error, previous pressure, and integral state were all set to zero.
The analytical rule relationships given above define all 7 × 7 = 49 combinations of the two input membership functions; therefore, a separate 49-cell rule table is not required for reproducing the controller.
The fixed-gain PID and fuzzy gain-scheduled PID controllers were tuned manually using the same nonlinear pressure model, the same control-window duration of Tc = 0.020 s, the same pressure targets of 20, 30, and 35 kPa, and the same output limits of [−1, 1]. The fixed-gain PID used Kp = 0.085, Ki = 0.018, and Kd = 0.005. These values were adjusted iteratively across the three target-pressure simulations until bounded outputs, stable convergence, and no sustained oscillation were obtained. The fuzzy gain-scheduled PID used baseline gains of Kp0 = 0.105, Ki0 = 0.024, and Kd0 = 0.006. Its rule coefficients and gain bounds were then adjusted manually using the same nominal simulation conditions to obtain stable tracking without retuning for individual pressure targets. No Ziegler–Nichols rule or numerical optimization was used. All controller parameters were fixed before the comparative simulations.
The comparison was conducted using one specified pressure sequence and one prescribed disturbance condition. Therefore, the present results demonstrate the relative behavior of the two controllers under the stated simulation model and do not establish universal superiority of the fuzzy gain-scheduled PID controller. Sensitivity to broader variations in supply pressure, leakage level, disturbance magnitude, and model parameters was not systematically evaluated and remains a subject for future work.
2.7.4. Nonlinear Pressure Model and Disturbance Protocol
Controller behavior was examined in a nonlinear single-channel pressure model. Ideal-gas and air-mass-balance relations provide the physical background for pneumatic pressure dynamics [37]. However, the controller simulations in this study used the following study-specific discrete empirical pressure model. Filling effectiveness decreased as chamber pressure approached the available supply; filling and venting used different effective flow rates, and leakage increased with pressure. The model was evaluated at 20, 30, and 35 kPa and in a 20-to-30-to-20 kPa sequence with a supply-capability reduction and increased leakage at t = 6.5 s.
Here, pk and pk + 1 denote the chamber gauge pressure, in kPa, at two consecutive sampling instants. The chamber pressure was initialized as p0 = 0 kPa, and the sampling period was Ts = 0.020 s. The normalized control input uk was bounded by [−1, 1], where uk ≥ 0 represents filling and uk < 0 represents venting. The supply pressure was set to 45 kPa gauge pressure. The coefficients 14.0, 16.0, 0.18, 0.032, and 0.0022 in Equation (18) were fixed study-specific empirical numerical parameters. Under nominal conditions, gin = 1.00 and gleak = 1.00.
The simulated pressure command was 0 kPa for 0 ≤ t < 1.0 s, 20 kPa for 1.0 ≤ t < 8.0 s, 30 kPa for 8.0 ≤ t < 15.0 s, and 20 kPa for 15.0 ≤ t ≤ 22.0 s. At t = 6.5 s, gin was reduced from 1.00 to 0.72, corresponding to a 28% reduction in effective filling capability, and gleak was increased from 1.00 to 1.35, corresponding to a 35% increase in leakage. The venting term was unchanged.
The model did not separately include chamber volume, pressure-dependent chamber deformation, atmospheric pressure, air temperature, pump flow-pressure characteristics, valve flow area, tubing volume or resistance, reservoir volume, sensor dynamics, or actuator delay. These quantities were outside the scope of the discrete empirical model and were not independently identified from the prototype. Accordingly, the simulation results should be interpreted as controlled algorithm-comparison simulations rather than quantitative predictions of the prototype pressure dynamics.
2.7.5. Performance Metrics and Timing Criteria
The steady-state deviation, root-mean-square error, integral absolute error, and disturbance peak error were calculated using standard control-performance indices [35]:
Here, r is the target pressure; Ω_s and Ω_d denote the steady-state and disturbance windows, respectively; N_s is the number of samples in Ω_s; and N is the total number of samples.
Rise time was defined from the first 10% to the first 90% crossing of the target. Settling time was defined as the earliest time after which the pressure remained within max (0.02r, 0.5 kPa) of the target. Recovery time was measured from the end of the disturbance until the same error band was continuously maintained for 1 s.
3. Results
3.1. Tensile Response and Yeoh Fit
The Shore A20 force-displacement response was nonlinear, with a progressively increasing slope at larger elongation (Figure 5a). This strain-hardening behavior supports the use of a hyperelastic model for the finger’s large-deformation regime. The third-order Yeoh curve closely followed the converted nominal stress–strain data over the fitted range (Figure 5b), and the fitted coefficients were used for the numerical study. Only monotonic loading data were used for the present material identification. Therefore, viscoelasticity, hysteresis, stress relaxation, and the Mullins effect were not independently characterized. The fitted Yeoh model is interpreted as a quasi-static, rate-specific representation of the silicone response and is not intended to describe cyclic or time-dependent behavior.
3.2. Pressure-Dependent Numerical Deformation
Figure 10 presents the predicted deformation and equivalent-stress fields from 5 to 40 kPa. Increasing pressure produced continuous bending toward the constraint layer. The result set is summarized in Table 4. The corresponding pressure–angle relationship is plotted in Figure 11. From 5 to 20 kPa, the chord angle increased from 5.12 to 24.09 degrees and the maximum displacement increased from 9.32 to 45.07 mm. At 30 kPa, the corresponding values were 35.25 degrees and 68.55 mm. In addition to the root-to-tip chord angle, the maximum displacement magnitude over the complete FE model is reported in Table 4 to describe the overall deformation. The chord angle is therefore interpreted as a global secant descriptor rather than a local curvature measure, particularly at large deformation.
Figure 10.
Predicted deformation and equivalent-stress contours at internal pressures from 5 to 40 kPa. The figure has been enlarged and re-exported to improve the readability of the contour legends and numerical scales. Each panel uses an individual contour scale to display the local concentration pattern; quantitative comparisons across pressure levels should be based on the numerical maxima reported in Table 4.
Table 4.
Predicted deformation, stress, and strain response under uniform internal pressure.
Figure 11.
Predicted internal-pressure versus chord-angle response.
The maximum principal stretch was calculated according to λmax = exp(LEmax). Because local strain-energy-density output was not requested in the Abaqus analysis, the maximum von Mises stress is reported as an additional local response indicator.
At 40 kPa, the maximum principal stretch was 3.077, corresponding to an engineering strain of approximately 2.077. This value lies within the engineering-strain interval of 0–3.0 used for the Yeoh fit.
3.3. Physical Validation of Pressure-Induced Bending
The finite-element pressure–angle response was validated using physical pressurization tests at 5, 10, 15, 20, 25, 30, 35, and 40 kPa. The same molded finger and root fixture were used throughout the ascending pressure sequence. At each pressure, the finger was allowed to reach a stable pressure before being photographed against coordinate paper. The root-center point O, the undeformed fingertip position T0, and the deformed fingertip position T were identified from the images. The experimental chord angle was calculated from the change in direction between OT0 and OT.
In the FE post-processing, the corresponding root-center and fingertip reference points were identified from the undeformed and deformed model coordinates. The FE chord angle was calculated using the same root-to-tip chord definition as that used for the experimental measurement. Therefore, the comparison was based on the same geometric quantity. The measured and finite-element chord angles are reported in Table 5 and Figure 12. The absolute angular error, model-normalized difference, RMSE, mean absolute error, and coefficient of determination were calculated from the unrounded values. The maximum model-normalized difference was 5.69%, the RMSE was 0.559°, the mean absolute error was 0.501°, and the coefficient of determination was R2 = 0.9976.
Table 5.
Comparison of measured and finite-element chord angles. Relative errors were calculated from unrounded raw angle values; displayed angles are rounded to two decimal places.
Figure 12.
Comparison of predicted and measured chord angles from 5 to 40 kPa.
This validation concerns the pressure-induced chord angle. The maximum displacement obtained from the FE model was not directly measured experimentally and is therefore reported only as a numerical deformation metric. Because the same finger was tested in one ascending pressure sequence, no unloading or repeated measurements were performed. The angle comparison therefore assesses FE-to-experiment agreement rather than statistical repeatability. The angle errors were calculated as
The measured and predicted responses followed the same monotonic increase through 35 kPa and showed the same reduced chord-angle gain at 40 kPa. The maximum relative error was 5.69% at 10 kPa. This agreement supports use of the model for the selected pressure range and for identifying the 20–35 kPa region as the principal posture-adjustment range. Representative physical bending states are shown in Figure 13.
Figure 13.
Coordinate-paper measurement of the single-finger bending angle and representative physical bending states at internal pressures from 5 to 40 kPa. The annotations in the 35 kPa panel illustrate the measurement definition used for all pressure conditions. O denotes the root-center reference point, T0 the undeformed fingertip, T the deformed fingertip, and theta the bending angle.
The bending validation used one finger and one ascending pressure sequence at 5, 10, 15, 20, 25, 30, 35, and 40 kPa. The same finger and the same coordinate-paper measurement procedure were used throughout the test. No repeated measurements were performed at each pressure, and no loading–unloading cycle was recorded. Therefore, the present results represent a single-sequence FE-to-experiment comparison rather than a statistical estimate of repeatability, manufacturing variability, or hysteresis. Camera-related uncertainty, marker-placement uncertainty, and angular confidence intervals were not quantified.
Based on the displayed values in Table 4, the overall RMSE was 0.559°, the mean absolute angular error was 0.501°, and the coefficient of determination relative to the measured angles was R^2 = 0.9976. Equation (23) uses the finite-element value in the denominator and is therefore a model-normalized difference rather than an experiment-referenced measurement error.
3.4. Stress Distribution and Design Implications
The higher equivalent-stress regions were concentrated around chamber ribs, the transition between the chamber body and lower constraint layer, and the fixed root. These locations combine pressure loading, abrupt changes in section geometry, and external constraint. Smooth transitions and adequate local wall thickness should therefore be prioritized in subsequent design iterations. The numerical results also suggest that 20–35 kPa is a useful candidate range for physical characterization because the chord angle increased strongly in this interval, whereas the 40 kPa case added displacement without increasing the chord angle.
3.5. Experimental Platform Integration and Data Acquisition Validation
The single-channel apparatus was assembled and connected to the finger fixture (Figure 8). The platform integrates the Arduino, MOS driver, 24 V supply, miniature pump, three-way valve, buffer reservoir, mechanical gauge, sensor branch, M1 manifold, host computer, and test finger in one setup.
The Arduino program was uploaded, and the communication link between the microcontroller and the host computer was verified through serial data exchange. The MATLAB interface successfully acquired raw pressure signals, displayed the measurements, and transferred the data for subsequent processing through the serial connection (Figure 9).
The platform workflow integrates vent-state control, serial command parsing, raw ADC acquisition, host-side plotting, and common-pressure pneumatic routing. These tests verified the basic operation of the physical platform, including pressure acquisition, serial communication, and manual pump-valve operation. They did not constitute experimental closed-loop pressure tracking using either the fixed-gain PID or the fuzzy gain-scheduled PID controller.
3.6. Fixed-Gain PID and Fuzzy Gain-Scheduled PID Pressure Simulations
Both controllers were evaluated at constant targets of 20, 30, and 35 kPa, and the corresponding simulated responses are shown in Figure 14. These responses were generated by MATLAB simulations using the nonlinear pressure model described in Section 2.7.4. They are not measured pressure traces from the physical pneumatic platform. The waveforms are provided to show the response trends at the three operating pressures, whereas the control quality was evaluated using quantitative indicators. To preserve the readability of the individual pressure trajectories, the existing two-panel layout was retained. Direct quantitative comparison of the two controllers is provided in Table 6 under identical target, model, and disturbance conditions.
Figure 14.
Simulated pressure responses at 20, 30, and 35 kPa: (a) fixed-gain PID; (b) fuzzy gain-scheduled PID. The quantitative control-quality comparison is given in Table 6.
Table 6.
Simulated multistage tracking and disturbance metrics.
The quantitative comparison under the multistage tracking and disturbance protocol is reported in Table 6. Compared with fixed-gain PID, fuzzy gain-scheduled PID reduced the rise time from 4.76 s to 3.84 s and the 2% settling time from 13.12 s to 6.62 s. The steady-state deviation decreased from 0.23 kPa to 0.20 kPa, while RMSE decreased from 4.92 kPa to 4.44 kPa. The integral absolute error (IAE) decreased from 76.01 kPa s to 58.48 kPa s, corresponding to a 23.1% reduction. Under the imposed supply-capability reduction and increased leakage, the disturbance peak error decreased from 0.66 kPa to 0.22 kPa, and the recovery time decreased from 1.48 s to 0.22 s. These results indicate that the fuzzy gain-scheduled controller improved simulated transient tracking and disturbance recovery under the specified nonlinear model and disturbance condition under the specified nonlinear simulation conditions.
3.7. Multistage Tracking and Simulated Disturbance
The multistage command changed from 20 to 30 kPa and then returned to 20 kPa. This 20-30-20 kPa sequence was evaluated numerically rather than experimentally. The pressure traces and performance indices reported in this section are therefore simulation results. At 6.5 s, supply capability was reduced and leakage was increased according to the protocol in Section 2.7.4. The responses are compared in Figure 15, and the calculated indices are listed in Table 6. Under the shared model and test conditions, fuzzy gain-scheduled PID shortened rise time by 0.92 s and settling time by 6.50 s. IAE decreased by 17.53 kPa s, corresponding to a 23.1% reduction relative to fixed-gain PID. RMSE decreased from 4.92 to 4.44 kPa.
Figure 15.
Simulated multistage pressure tracking and disturbance response for fixed-gain and fuzzy gain-scheduled PID.
The largest difference occurred after the imposed disturbance. Fixed-gain PID reached a peak pressure error of 0.66 kPa and required 1.48 s to recover, whereas fuzzy gain-scheduled PID limited the peak error to 0.22 kPa and recovered in 0.22 s. The steady deviations were 0.23 kPa for fixed-gain PID and 0.20 kPa for fuzzy gain-scheduled PID. The result shows that gain scheduling improves transitions and changes in pneumatic authority.
3.8. Experimental Grasping Performance
Physical gripper performance was evaluated from the output of one finger to object-level grasping. The reported force values and grasping demonstrations were measured or recorded experimentally. The pressure-control comparison in Section 3.6 and Section 3.7 remains a nonlinear simulation study and is not used as a substitute for these physical tests.
3.8.1. Tip Contact Force
The tip-contact-force experiment followed the procedure described in Section 2.1. The measured values are summarized in Table 7, and the experimental arrangement is shown in Figure 16. A single pneumatic finger was fixed at its root and brought into light contact with a load-cell-based force measurement system. The system consisted of a 5010A microcomputer-controlled electronic universal testing machine with a 50 kg measurement capacity and a stated system accuracy of 0.5%, together with a DRS-50KG load-cell sensor (P/N 152883; sensitivity 2.0 mV/V). The sensor was zeroed before each measurement. No intentional preload was applied; the reading was recorded after light contact between the finger tip and the sensor. The loading axis was aligned with the primary tip-motion direction. Pressure was set to 20, 30, and 35 kPa, and three repeated measurements were performed on the same finger, with complete pressure release between repetitions. The original experimental records did not document the exact contact-tip dimensions, root-to-contact distance, readout resolution, calibration uncertainty, or quantitative pressure-stabilization tolerance and duration. These quantities are therefore identified as methodological limitations and are not inferred from the photographs or instrument label.
Table 7.
Measured single-finger tip contact force based on three repeated measurements.
Figure 16.
Single-finger tip-contact-force experiment: (a) schematic of the fixture and force-gauge arrangement; (b) photograph of the physical test; (c) measured tip contact force as a function of internal pressure, based on three repeated measurements.
The mean tip contact force increased from 0.47 N at 20 kPa to 0.96 N at 35 kPa (Figure 16). The calculated standard deviations were approximately 0.01 N after rounding. Because the readout resolution and calibration uncertainty were not recorded, these values should be interpreted as the variability of the recorded readings rather than as a complete measurement-uncertainty estimate. This fixture-specific single-finger reaction force should not be interpreted as the net grasping force, payload, torque capacity, or friction margin of the four-finger gripper. It depends on the root fixture, contact point, loading direction, and force-gauge stiffness; it is therefore used only as a direction-specific single-finger output indicator. No finite-element blocked-force or contact-force simulation was performed in the present study. The measured values are therefore reported as fixture-specific single-finger reaction forces and are not used as a second independent FE validation quantity.
3.8.2. Four-Finger Object Grasping with H-Shaped and X-Shaped Layouts
The object-grasping demonstrations followed the qualitative procedure defined in Section 2.1. The tested objects, their masses, and the selected gripper configurations are summarized in Table 8, while representative H-shaped and X-shaped grasping states are shown in Figure 17 and Figure 18. Representative household objects were placed at the center of the contact region and pressurized until continuous finger–object contact was established. The pressure and holding time used in the individual documented demonstrations were not systematically recorded; therefore, these trials are not used for pressure-performance comparison. Successful retention was judged from the establishment of continuous finger–object contact and maintenance of the object posture during the documented trial. Because each object was evaluated in a single documented demonstration, the results are reported as qualitative, mass-documented demonstrations. The listed masses provide descriptive object information but do not represent a payload-capacity measurement. Lifting height, contact force, and repeated-trial success rate were also not systematically recorded in Table 8. Therefore, the demonstrations do not establish a statistically validated grasping success rate, payload limit, or quantitative comparison between the two layouts.
Table 8.
Masses, gripper configurations, and figure-panel mapping of the tested objects.
Figure 17.
Qualitative grasping demonstrations using the H-shaped layout for regular-sided objects. Subpanels (a–i) correspond to the objects listed in Table 8. The figure illustrates approximately symmetric side contact and object-posture retention. The pressure used in the individual documented demonstrations was not systematically recorded.
Figure 18.
Qualitative grasping demonstrations using the X-shaped layout for cylindrical and small asymmetric objects. Subpanels (a–f) correspond to the objects listed in Table 8. The figure illustrates crossing contact directions and qualitative resistance to object rotation. The pressure used in the individual documented demonstrations was not systematically recorded.
Figure 17 and Figure 18 provide qualitative visual evidence of continuous finger–object contact and object-posture retention in the documented trials. They illustrate the complementary roles of the two layouts: the H-shaped arrangement provides approximately symmetric side contact for regular-sided objects, whereas the X-shaped arrangement supplies crossing contact directions for curved, cylindrical, or small asymmetric objects that may otherwise rotate during lifting. The complete list of tested objects, their masses, and the corresponding gripper configurations is provided in Table 8. Because different objects were assigned to the H-shaped and X-shaped layouts, the present tests do not constitute a matched comparative evaluation. Therefore, Figure 17 and Figure 18 are interpreted as qualitative feasibility demonstrations for the documented objects and fixtures rather than as quantitative evidence that one layout is superior to the other. Matched-object trials, repeated grasping tests, failure-mode classification, and grasp-success rates were not performed in the present study.
4. Discussion
4.1. Structural and Material Evidence
The modular H and X arms provide different contact arrangements for elongated and approximately spherical objects. Separating the rigid arm from the cast finger makes the layouts interchangeable while retaining the same chamber design, material, and finger geometry.
The chosen geometry produced a continuous bending mode in the finite-element analyses, and the toothed lower surface was intended to increase local geometric conformity. The split-mold route supports controlled adjustment of the lower-surface features in subsequent design iterations.
Using tensile specimens from the same Shore A20 batch as the fingers supported traceable numerical modeling. The implied initial Poisson ratio of approximately 0.495 is consistent with a nearly incompressible numerical representation.
4.2. Interpretation of the Finite-Element Results
The finite-element study provides a pressure-dependent map of the present design. From 5 to 35 kPa, both chord angle and maximum displacement increased, and the largest predicted chord angle was 37.16° at 35 kPa. At 40 kPa, the maximum displacement magnitude increased further to 81.78 mm, whereas the root-to-tip chord angle decreased to 35.38°. This reduction in chord angle was interpreted as a large-deformation geometric effect rather than reverse bending: the maximum displacement over the model increased from 76.05 to 81.78 mm while the root-to-tip chord direction rotated slightly toward the initial axis.
Stress concentrations occurred at chamber ribs, layer transitions, and the fixed root. These locations combine pressure loading, section transitions, and boundary constraint, and they guide geometry refinement and inspection of the molded finger.
The stress and strain fields are used to identify potential concentration regions at the chamber ribs, layer transitions, and fixed root. They are not used to establish structural safety or a maximum allowable operating pressure. The present material characterization was based on monotonic uniaxial tensile tests, and no independent multiaxial failure criterion was identified for the actuator geometry.
Uniform pressure was applied simultaneously to all chamber surfaces to evaluate static pressure-dependent deformation. The analysis establishes the equilibrium response of the chambered structure over the selected pressure range.
4.3. Physical Validation and Grasping Evidence
Physical pressure–angle measurements agree closely with the finite-element response over 5–40 kPa, with a maximum relative error of 5.69%. This result connects the material characterization and static numerical model to the molded finger rather than relying on numerical deformation alone.
The measured contact-force trend confirms that pressure selection changes the available single-finger output. The object demonstrations add configuration-level evidence: Within the documented trials, the H-shaped layout was used mainly for regular-sided or elongated objects, while the X-shaped layout was used for selected cylindrical and small asymmetric objects. Since cylindrical objects appeared in both configurations and no matched trials were performed, these observations should not be interpreted as evidence of layout superiority. These results are specific to the stated fixtures, pressures, and objects, and do not establish a universal payload rating.
4.4. What the Control Platform Already Demonstrates
The control platform integrates assembled hardware, defined pneumatic and electrical routes, a MATLAB interface, a vented startup state, and raw analog acquisition from A0 to the host. Locating the mechanical gauge and electronic sensor at M1 establishes a common measurement domain for the soft finger.
The default A-to-R route provides a controlled vent state for the elastomeric load. A software fault, disconnected serial link, or controller reset leaves the pump off and opens the finger-side volume to exhaust. The ARM/PULSE sequence organizes manual commissioning, while the pressure branch provides direct observation of the common pneumatic state.
The ADC acquisition path was intended to support pressure conversion through the calibration relationship in Equation (6); however, the numerical zero and span coefficients were not preserved in the available experimental records. The host interface records the sampled values, displays their evolution, and provides a direct data route for pressure-control experiments.
4.5. Meaning of the PID Comparison
Under the specified nonlinear model, fuzzy gain-scheduled PID improved the transient indices more than the steady-state index. Settling time fell by nearly one half, and recovery from the imposed supply/leakage disturbance was faster. The rule base used stronger action while the error was large and moderated the gains as the trajectory approached the setpoint.
The controller comparison uses identical targets, initial conditions, pressure-dependent flow, leakage, saturation, and disturbance definitions for the two algorithms. The resulting metrics provide a direct algorithmic comparison under the nonlinear pressure model. The comparison was conducted using one specified pressure sequence and one prescribed disturbance condition. Therefore, the present results demonstrate the relative behavior of the two controllers under the stated simulation model and do not establish universal superiority of the fuzzy gain-scheduled PID controller. No experimental closed-loop pressure-tracking test was performed for the 20, 30, and 35 kPa pressure steps or for the 20-30-20 kPa multistage sequence. Consequently, the reported rise time, settling time, overshoot, RMSE, IAE, disturbance error, and recovery time are simulation metrics only. The physical platform was used for pressure acquisition, serial communication, valve operation, and manual commissioning; hardware closed-loop validation under matched operating conditions remains necessary future work.
PID regulation and fuzzy gain adaptation have been widely used in soft-robotic manipulators and pneumatic soft-gripper systems [26,27,31]. Previous studies have reviewed control strategies for soft-robotic manipulators, analyzed the control of pneumatic soft-robotic systems through simulation, and reported the design and control of multifunctional soft-robotic grippers [26,27,31]. These studies indicate that PID-type and fuzzy/adaptive regulation are established approaches rather than new control algorithms. In the present work, fixed-gain PID and fuzzy gain-scheduled PID are used as benchmark controllers for the proposed modular pneumatic gripper. The contribution is therefore the traceable comparison under the specified nonlinear simulation conditions, rather than the introduction of a new control law or a claim of experimentally validated closed-loop superiority.
For future experimental validation, the controller-comparison protocol should retain identical target profiles, initial pressure, supply voltage, tubing, finger, sample period, filter, and output limits. The pressure traces and summary metrics are organized by the 20, 30, and 35 kPa operating points.
4.6. Limitations and Future Work
This study is limited to a static finite-element model, uniaxial material identification, a fixture-specific single-finger force test, qualitative object-grasping demonstrations, and simulation-based controller comparison. Dynamic hysteresis, fatigue, leakage aging, friction variation, manufacturing variability, quantitative grasp-success statistics, and hardware closed-loop control remain to be evaluated. Future work will combine dynamic identification, hardware controller experiments, repeated grasp trials, and durability testing.
Although the nominal supply voltage and component types are known, the timing behavior of the assembled the integrated valve, pump, sensor, communication, and pneumatic subsystems system has not been experimentally characterized. Future work should measure the minimum effective valve pulse width, valve and pump delays, sensor and communication latency, and pneumatic-line response before implementing a hardware controller with a 20 ms control period.
5. Conclusions
This study developed a modular pneumatic soft-finger gripper from its mechanical layout through controller simulation. Interchangeable H-shaped and X-shaped arms support two alternative four-finger arrangements for opposed and circumferential contact, while detachable roots allow the same finger design to be reused. Qualitative object-grasping demonstrations were documented for both four-finger layouts. The actuator is a cast, multi-chamber Shore A20 silicone finger with a toothed constraint layer. Split PLA tooling, a cast finger, and tensile specimens were produced as part of the work.
Uniaxial measurements from the same material batch supported a third-order Yeoh model with C10 = 4.4163 × 10⁻² MPa, C20 = 5.3071 × 10⁻⁴ MPa, C30 = 1.6251 × 10⁻⁵ MPa, and D1 = 0.226434 MPa−1. In the corresponding Abaqus model, the chord angle increased from 5.12° at 5 kPa to 37.16° at 35 kPa, then decreased to 35.38° at 40 kPa, whereas maximum displacement continued to increase and reached 81.78 mm. Chamber ribs, layer transitions, and the fixed root were the main predicted stress-concentration regions.
An Arduino-based pressure platform was assembled with a MOS driver, 24 V pump, normally closed three-way valve, common downstream measurement point, and MATLAB App Designer interface. The Arduino-based platform enabled pressure acquisition, valve operation, and MATLAB-based data communication for the pneumatic system.
Physical validation linked the finite-element and grasping results to the molded actuator. The predicted and measured chord angles agreed within 5.69% across 5–40 kPa. The measured single-finger tip contact force increased to 0.96 N at 35 kPa. Documented single-trial demonstrations showed retention of representative regular-sided, cylindrical, and small asymmetric household objects using the two layouts. These observations are qualitative and do not establish a universal payload capacity or comparative superiority between the layouts.
In the nonlinear pressure simulation, fuzzy gain-scheduled PID reduced settling time from 13.12 to 6.62 s, IAE from 76.01 to 58.48 kPa s, disturbance peak error from 0.66 to 0.22 kPa, and recovery time from 1.48 to 0.22 s relative to fixed-gain PID. Under the selected nonlinear model and prescribed disturbance condition, the fuzzy gain-scheduled PID controller produced improved simulated tracking performance relative to the fixed-gain PID controller.
Supplementary Materials
The following supporting information can be downloaded at: https://www.mdpi.com/article/10.3390/act15090488/s1.
Author Contributions
Y.Z.: Writing—review and editing, Validation, Supervision; L.W.: Writing—original draft, Investigation, Formal analysis, Conceptualization; M.C.: Validation, Supervision, Formal analysis, Project administration; X.T.: Validation, Supervision, Conceptualization; F.W.: Writing—review and editing, Data curation. All authors have read and agreed to the published version of the manuscript.
Funding
This work was partially supported by the Outstanding Young Scientists in Beijing (Grant No. BJJWZYJH01201910006021), Open Foundation of the State Key Laboratory of Fluid Power and Mechatronic Systems (Grant No. GZKF-202016), the Key Scientific and Technological Project of Henan Province (Grant No. 202102210081, 212102210050), Sub project of strengthening key basic research projects in the basic plan of the Science and Technology Commission of the Military Commission (2019-JCJQ-ZD-120-13), Principles of Sensors and Detection Technology, the second batch of “14th Five-Year Plan” textbooks for general higher education in Henan Province (Project No. 2024XBJC09), Henan Provincial Natural Science Foundation (Project No. 262300421351).
Data Availability Statement
The raw tensile-test data, fitted Yeoh material parameters, selected finite-element input files and derived response data, and available single-finger force-test records are provided in the Supplementary Material. Additional materials supporting the findings of this study are available from the corresponding author upon reasonable request.
Conflicts of Interest
The authors declare no conflicts of interest.
References
- Zhang, Y.; Wang, K.; Cai, M.; Shi, Y.; Gong, S.; Zhang, H.; Zhang, P. Structural design and control performance study of flexible finger mechanisms for robot end effectors. Actuators 2024, 13, 271. [Google Scholar] [CrossRef] [Scilit]
- Shintake, J.; Cacucciolo, V.; Floreano, D.; Shea, H. Soft robotic grippers. Adv. Mater. 2018, 30, 1707035. [Google Scholar] [CrossRef] [Scilit] [PubMed]
- Rus, D.; Tolley, M.T. Design, fabrication and control of soft robots. Nature 2015, 521, 467–475. [Google Scholar] [CrossRef] [Scilit] [PubMed]
- Sinatra, N.R.; Teeple, C.B.; Vogt, D.M.; Parker, K.K.; Gruber, D.F.; Wood, R.J. Ultragentle manipulation of delicate structures using a soft robotic gripper. Sci. Robot. 2019, 4, eaax5425. [Google Scholar] [CrossRef] [Scilit] [PubMed]
- Lau, G.K.; Heng, K.R.; Ahmed, A.S.; Shrestha, M. Dielectric elastomer fingers for versatile grasping and nimble pinching. Appl. Phys. Lett. 2017, 110, 182906. [Google Scholar] [CrossRef] [Scilit]
- Li, L.; Xie, F.; Wang, T.; Wang, G.; Tian, Y.; Jin, T.; Zhang, Q. Stiffness-tunable soft gripper with soft-rigid hybrid actuation for versatile manipulations. Soft Robot. 2022, 9, 1108–1119. [Google Scholar] [CrossRef] [Scilit] [PubMed]
- Tawk, C.; Gillett, A.; in het Panhuis, M.; Spinks, G.M.; Alici, G. A 3D-printed omni-purpose soft gripper. IEEE Trans. Robot. 2019, 35, 1268–1275. [Google Scholar] [CrossRef] [Scilit]
- Xavier, M.S.; Tawk, C.D.; Zolfagharian, A.; Pinskier, J.; Howard, D.; Young, T.; Li, J.; Harrison, S.M.; Yong, Y.K.; Bodaghi, M.; et al. Soft pneumatic actuators: A review of design, fabrication, modeling, sensing, control and applications. IEEE Access 2022, 10, 59442–59485. [Google Scholar] [CrossRef] [Scilit]
- Pagoli, A.; Chapelle, F.; Corrales-Ramon, J.A.; Mezouar, Y.; Lapusta, Y. Review of soft fluidic actuators: Classification and materials modeling analysis. Smart Mater. Struct. 2022, 31, 013001. [Google Scholar] [CrossRef] [Scilit]
- Marchese, A.D.; Katzschmann, R.K.; Rus, D. A recipe for soft fluidic elastomer robots. Soft Robot. 2015, 2, 7–25. [Google Scholar] [CrossRef] [Scilit] [PubMed]
- Ilievski, F.; Mazzeo, A.D.; Shepherd, R.F.; Chen, X.; Whitesides, G.M. Soft robotics for chemists. Angew. Chem. Int. Ed. 2011, 50, 1890–1895. [Google Scholar] [CrossRef] [Scilit] [PubMed]
- Mosadegh, B.; Polygerinos, P.; Keplinger, C.; Wennstedt, S.; Shepherd, R.F.; Gupta, U.; Shim, J.; Bertoldi, K.; Walsh, C.J.; Whitesides, G.M. Pneumatic networks for soft robotics that actuate rapidly. Adv. Funct. Mater. 2014, 24, 2163–2170. [Google Scholar] [CrossRef] [Scilit]
- Polygerinos, P.; Wang, Z.; Overvelde, J.T.B.; Galloway, K.C.; Wood, R.J.; Bertoldi, K.; Walsh, C.J. Modeling of soft fiber-reinforced bending actuators. IEEE Trans. Robot. 2015, 31, 778–789. [Google Scholar] [CrossRef] [Scilit]
- Hu, W.; Mutlu, R.; Li, W.; Alici, G. A structural optimisation method for a soft pneumatic actuator. Robotics 2018, 7, 24. [Google Scholar] [CrossRef] [Scilit]
- Elsayed, Y.; Vincensi, A.; Lekakou, C.; Geng, T.; Saaj, C.M.; Ranzani, T.; Cianchetti, M.; Menciassi, A. Finite element analysis and design optimization of a pneumatically actuating silicone module for robotic surgery applications. Soft Robot. 2014, 1, 255–262. [Google Scholar] [CrossRef] [Scilit]
- Yeoh, O.H. Characterization of elastic properties of carbon-black-filled rubber vulcanizates. Rubber Chem. Technol. 1990, 63, 792–805. [Google Scholar] [CrossRef] [Scilit]
- Ogden, R.W. Large deformation isotropic elasticity: On the correlation of theory and experiment for incompressible rubberlike solids. Proc. R. Soc. Lond. A 1972, 326, 565–584. [Google Scholar] [CrossRef] [Scilit]
- Marechal, L.; Balland, P.; Lindenroth, L.; Petrou, F.; Kontovounisios, C.; Bello, F. Toward a common framework and database of materials for soft robotics. Soft Robot. 2021, 8, 284–297. [Google Scholar] [CrossRef] [Scilit] [PubMed]
- Connolly, F.; Polygerinos, P.; Walsh, C.J.; Bertoldi, K. Mechanical programming of soft actuators by varying fiber angle. Soft Robot. 2015, 2, 26–32. [Google Scholar] [CrossRef] [Scilit]
- Connolly, F.; Walsh, C.J.; Bertoldi, K. Automatic design of fiber-reinforced soft actuators for trajectory matching. Proc. Natl. Acad. Sci. USA 2017, 114, 51–56. [Google Scholar] [CrossRef] [Scilit] [PubMed]
- Barbieri, L.; Bruno, F.; Gallo, A.; Muzzupappa, M.; Russo, M.L. Design, prototyping and testing of a modular small-sized underwater robotic arm controlled through a master-slave approach. Ocean Eng. 2018, 158, 253–262. [Google Scholar] [CrossRef] [Scilit]
- Hao, Y.; Gong, Z.; Xie, Z.; Guan, S.; Yang, X.; Ren, Z.; Wang, T.; Wen, L. Universal soft pneumatic robotic gripper with variable effective length. In Proceedings of the 35th Chinese Control Conference, Chengdu, China, 27–29 July 2016; pp. 6109–6114. [Google Scholar] [CrossRef] [Scilit]
- Homberg, B.S.; Katzschmann, R.K.; Dogar, M.R.; Rus, D. Haptic identification of objects using a modular soft robotic gripper. In Proceedings of the 2015 IEEE/RSJ International Conference on Intelligent Robots and Systems (IROS), Hamburg, Germany, 28 September–2 October 2015; pp. 1698–1705. [Google Scholar] [CrossRef] [Scilit]
- Manti, M.; Hassan, T.; Passetti, G.; D’Elia, N.; Laschi, C.; Cianchetti, M. A bioinspired soft robotic gripper for adaptable and effective grasping. Soft Robot. 2015, 2, 107–116. [Google Scholar] [CrossRef] [Scilit]
- Fang, B.; Sun, F.; Wu, L.; Liu, F.; Wang, X.; Huang, H.; Huang, W.; Liu, H.; Wen, L. Multimode grasping soft gripper achieved by layer jamming structure and tendon-driven mechanism. Soft Robot. 2022, 9, 233–249. [Google Scholar] [CrossRef] [Scilit] [PubMed]
- Thuruthel, T.G.; Ansari, Y.; Falotico, E.; Laschi, C. Control strategies for soft robotic manipulators: A survey. Soft Robot. 2018, 5, 149–163. [Google Scholar] [CrossRef] [Scilit] [PubMed]
- Xavier, M.S.; Fleming, A.J.; Yong, Y.K. Design and control of pneumatic systems for soft robotics: A simulation approach. IEEE Robot. Autom. Lett. 2021, 6, 5800–5807. [Google Scholar] [CrossRef] [Scilit]
- Joshi, S.; Paik, J. Pneumatic supply system parameter optimization for soft actuators. Soft Robot. 2021, 8, 152–163. [Google Scholar] [CrossRef] [Scilit] [PubMed]
- Joshi, S.; Sonar, H.; Paik, J. Flow path optimization for soft pneumatic actuators: Towards optimal performance and portability. IEEE Robot. Autom. Lett. 2021, 6, 7949–7956. [Google Scholar] [CrossRef] [Scilit]
- Zhang, X.; Yu, S.; Dai, J.; Oseyemi, A.E.; Liu, L.; Du, N.; Lv, F. A Modular Soft Gripper with Combined Pneu-Net Actuators. Actuators 2023, 12, 172. [Google Scholar] [CrossRef] [Scilit]
- Correia, A.; Charters, T.; Leite, A.; Campos, F.; Monge, N.; Rocha, A.; Mendes, M.J.G.C. Design, Control, and Testing of a Multifunctional Soft Robotic Gripper. Actuators 2024, 13, 476. [Google Scholar] [CrossRef] [Scilit]
- Antonelli, M.G.; Beomonte Zobel, P.; Mattei, E.; Stampone, N. Mechanical Design, Manufacturing, and Testing of a Soft Pneumatic Actuator with a Reconfigurable Modular Reinforcement. Robotics 2024, 13, 165. [Google Scholar] [CrossRef] [Scilit]
- ASTM D412-16(2021); Standard Test Methods for Vulcanized Rubber and Thermoplastic Elastomers—Tension. ASTM International: West Conshohocken, PA, USA, 2021. [CrossRef] [Scilit]
- Oppenheim, A.V.; Schafer, R.W. Discrete-Time Signal Processing, 3rd ed.; Prentice Hall: Upper Saddle River, NJ, USA, 2009. [Google Scholar]
- Åström, K.J.; Hägglund, T. PID Controllers: Theory, Design, and Tuning, 2nd ed.; Instrument Society of America: Research Triangle Park, NC, USA, 1995. [Google Scholar]
- Mamdani, E.H.; Assilian, S. An Experiment in Linguistic Synthesis with a Fuzzy Logic Controller. Int. J. Man-Mach. Stud. 1975, 7, 1–13. [Google Scholar] [CrossRef] [Scilit]
- Çengel, Y.A.; Boles, M.A. Thermodynamics: An Engineering Approach, 8th ed.; McGraw-Hill Education: New York, NY, USA, 2015. [Google Scholar]
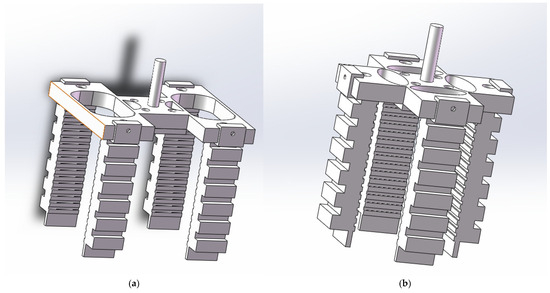
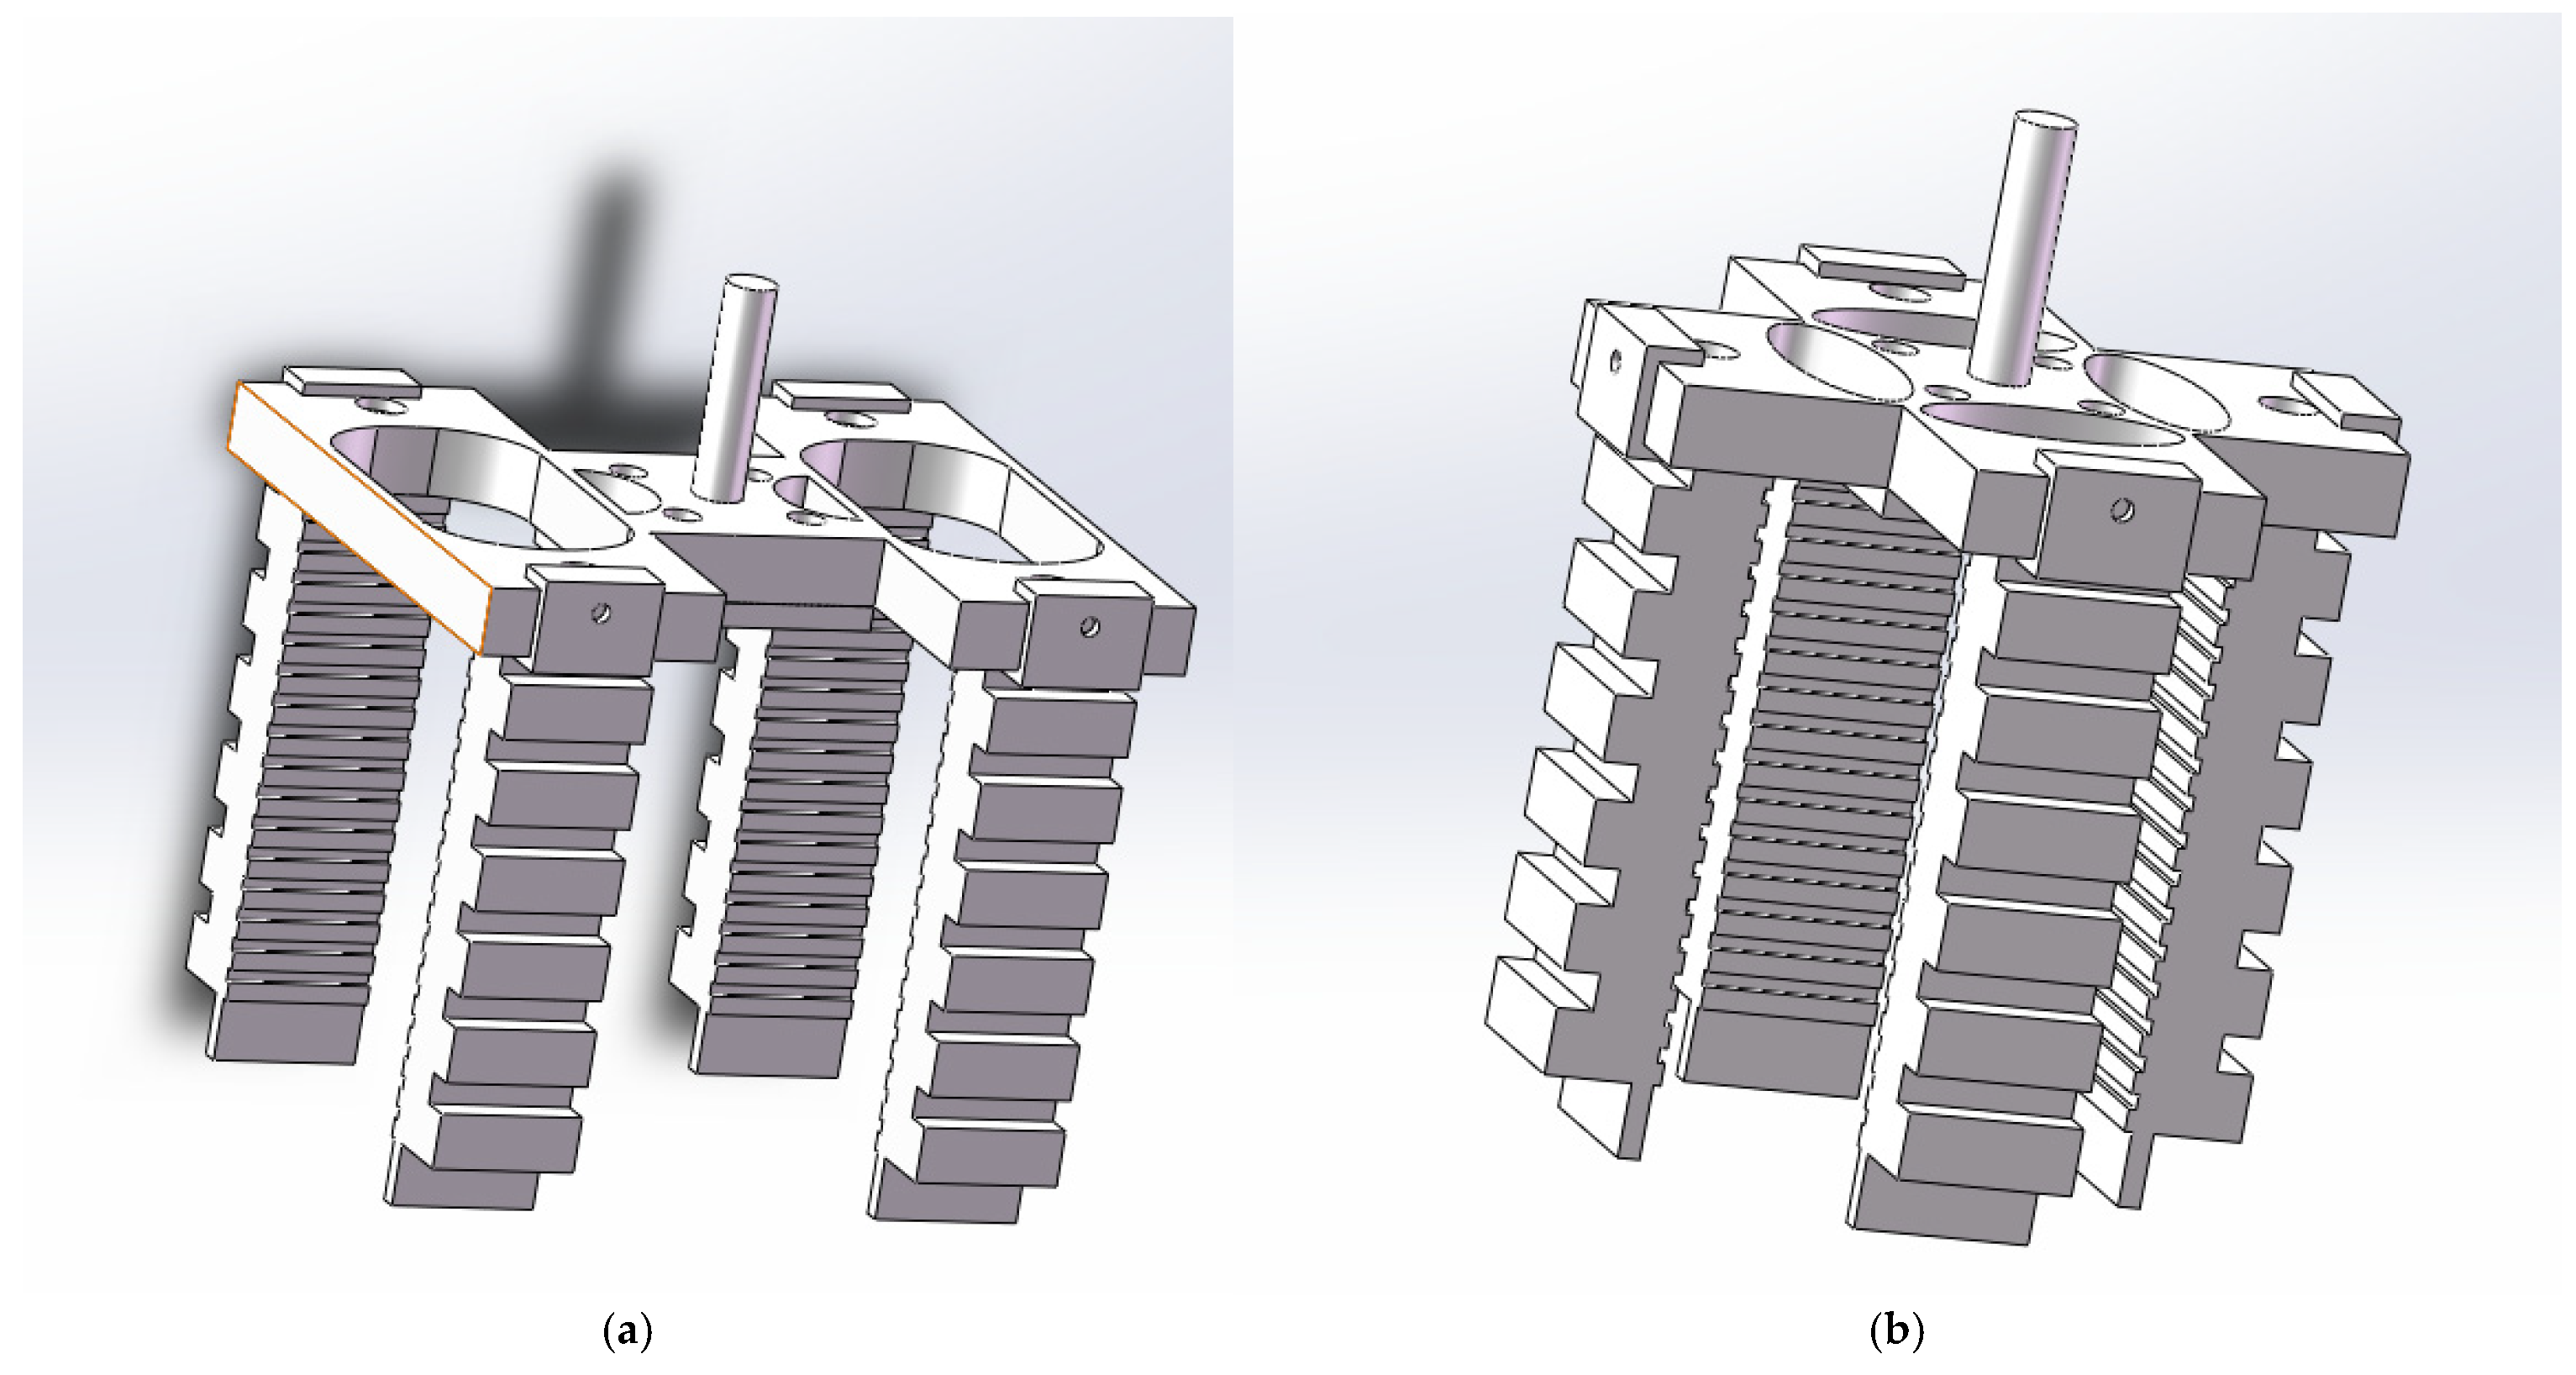
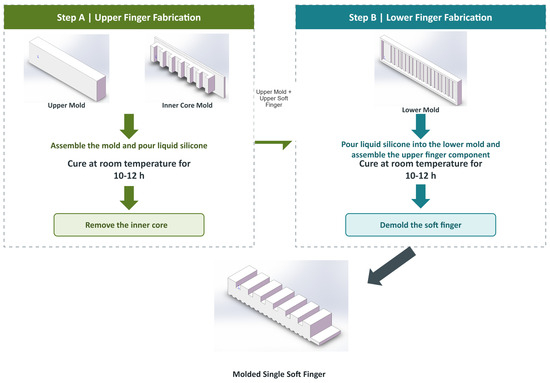
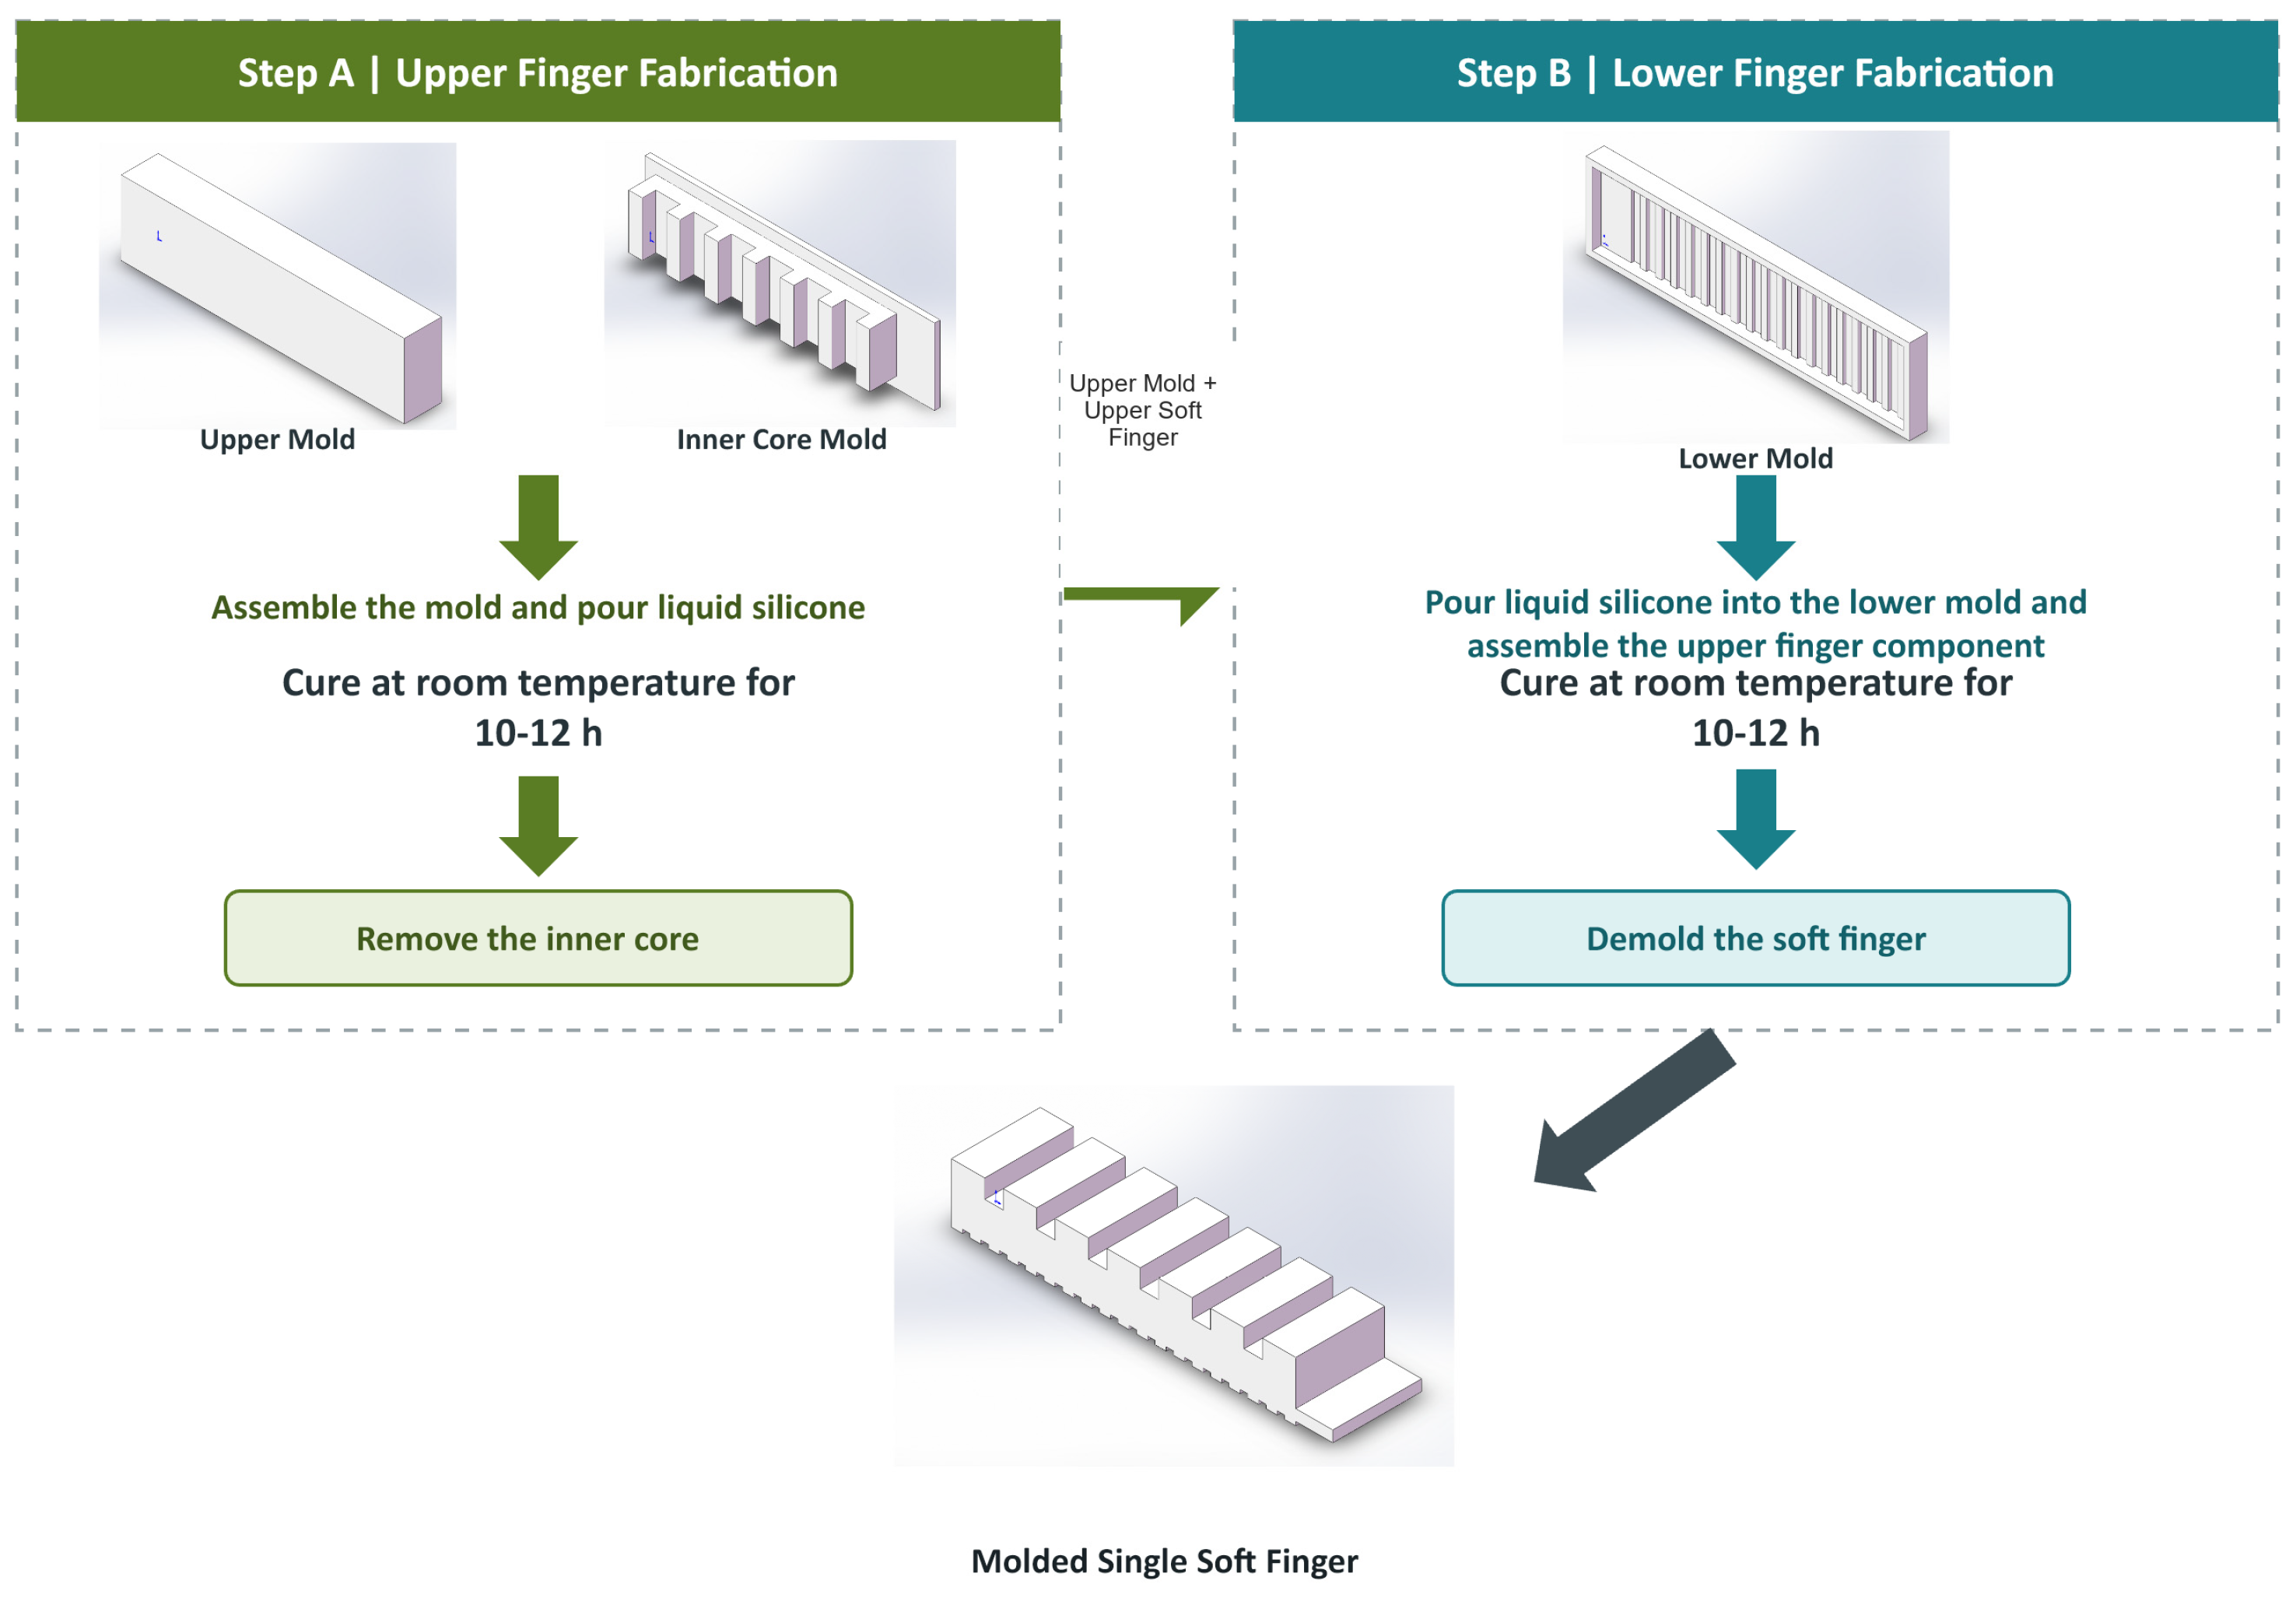
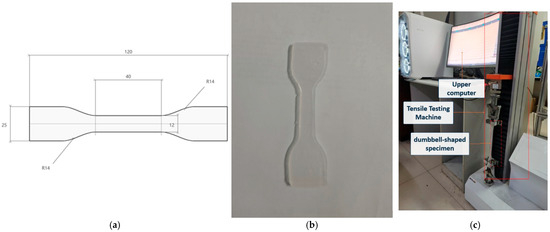
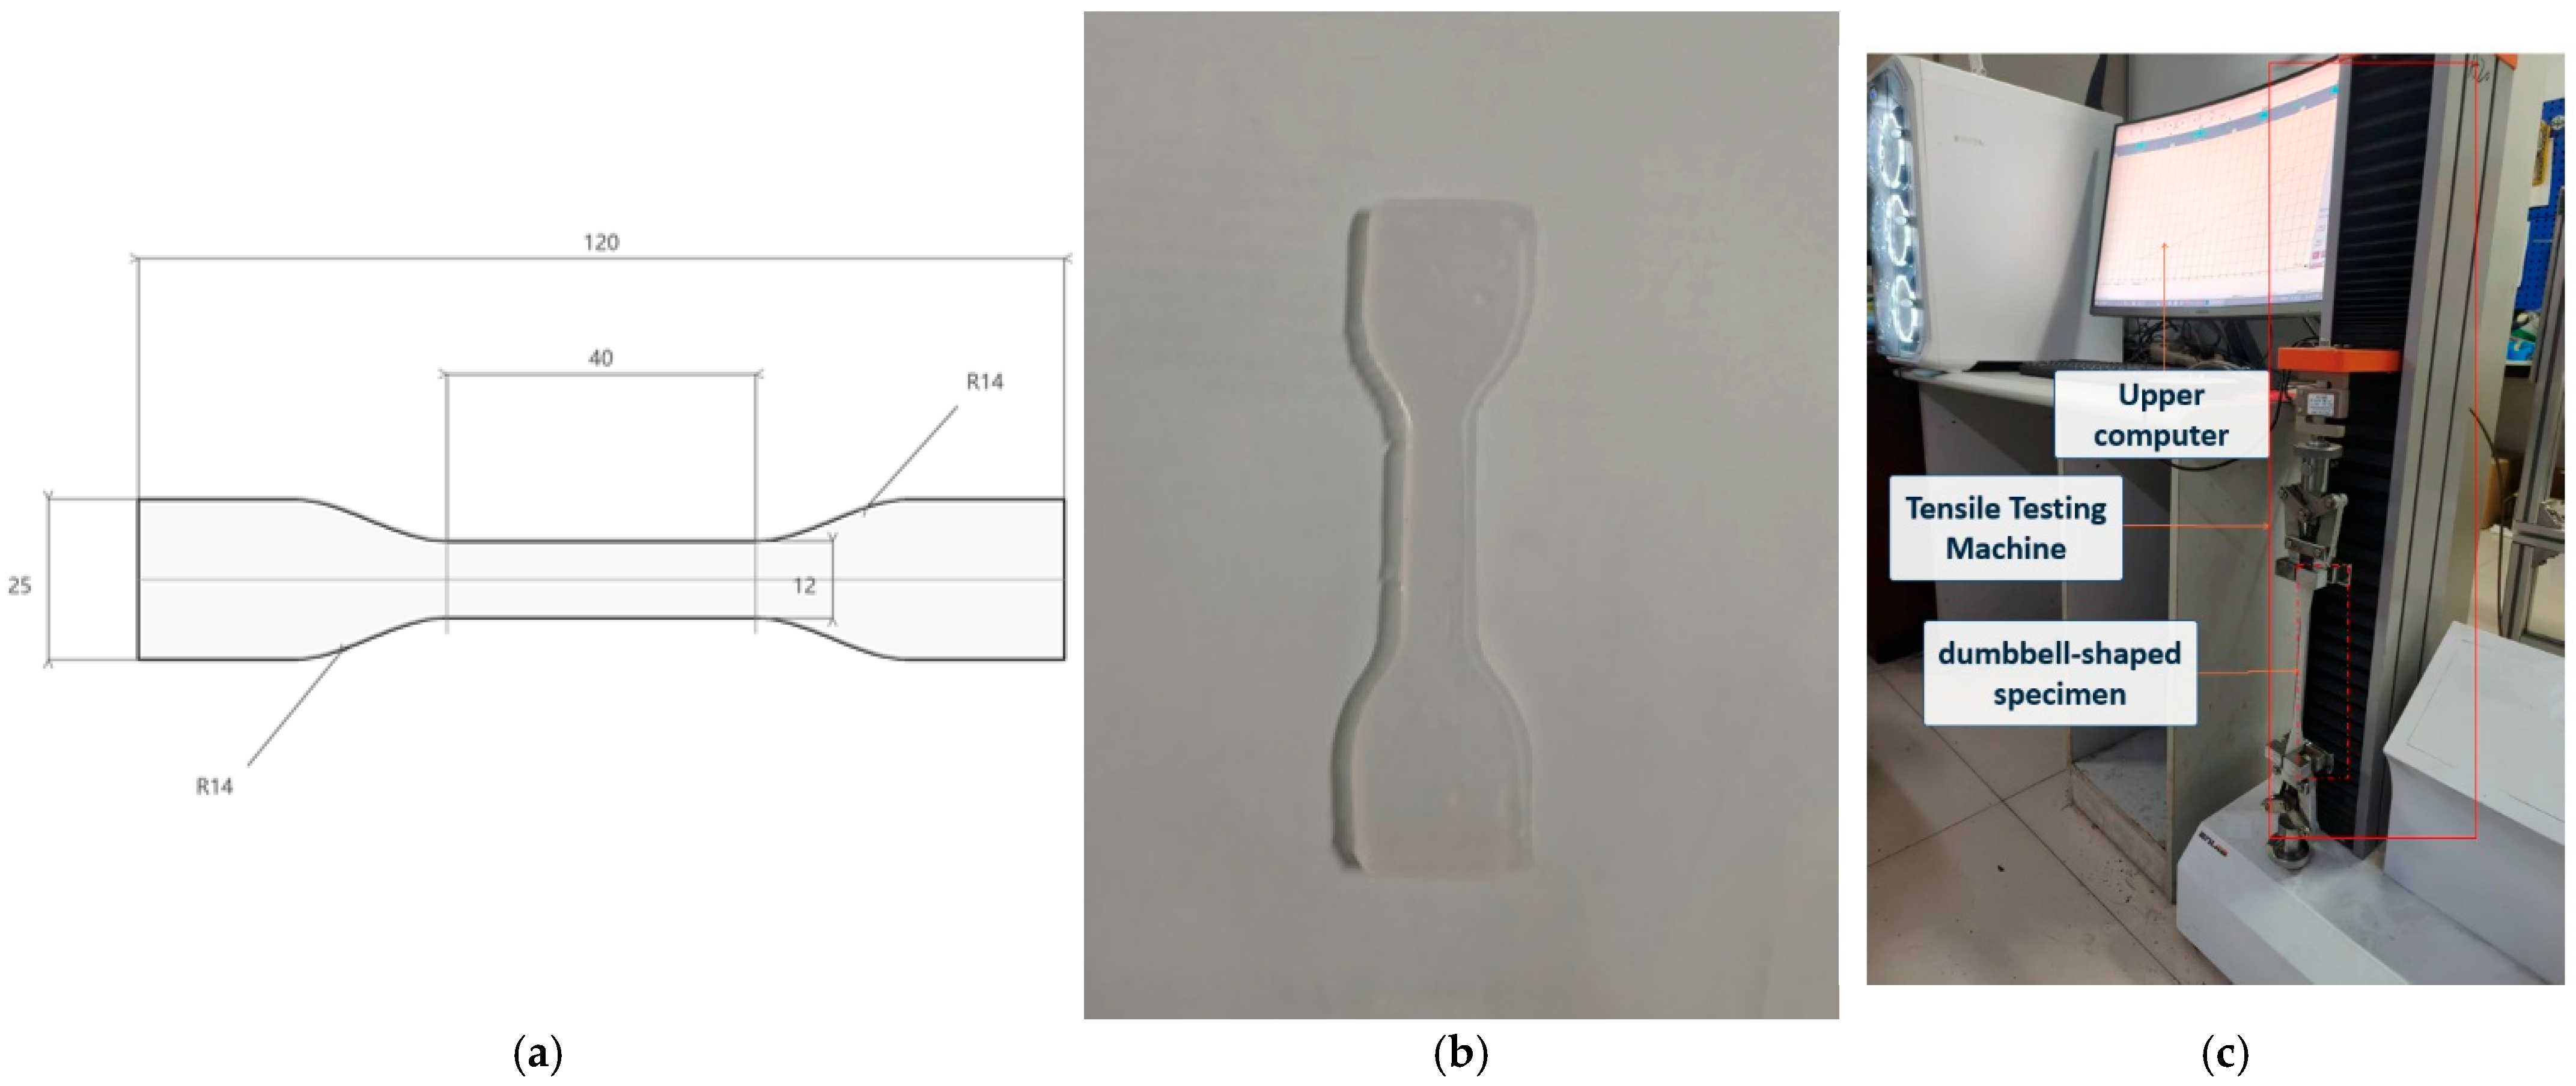
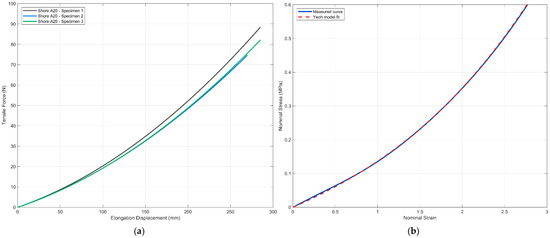
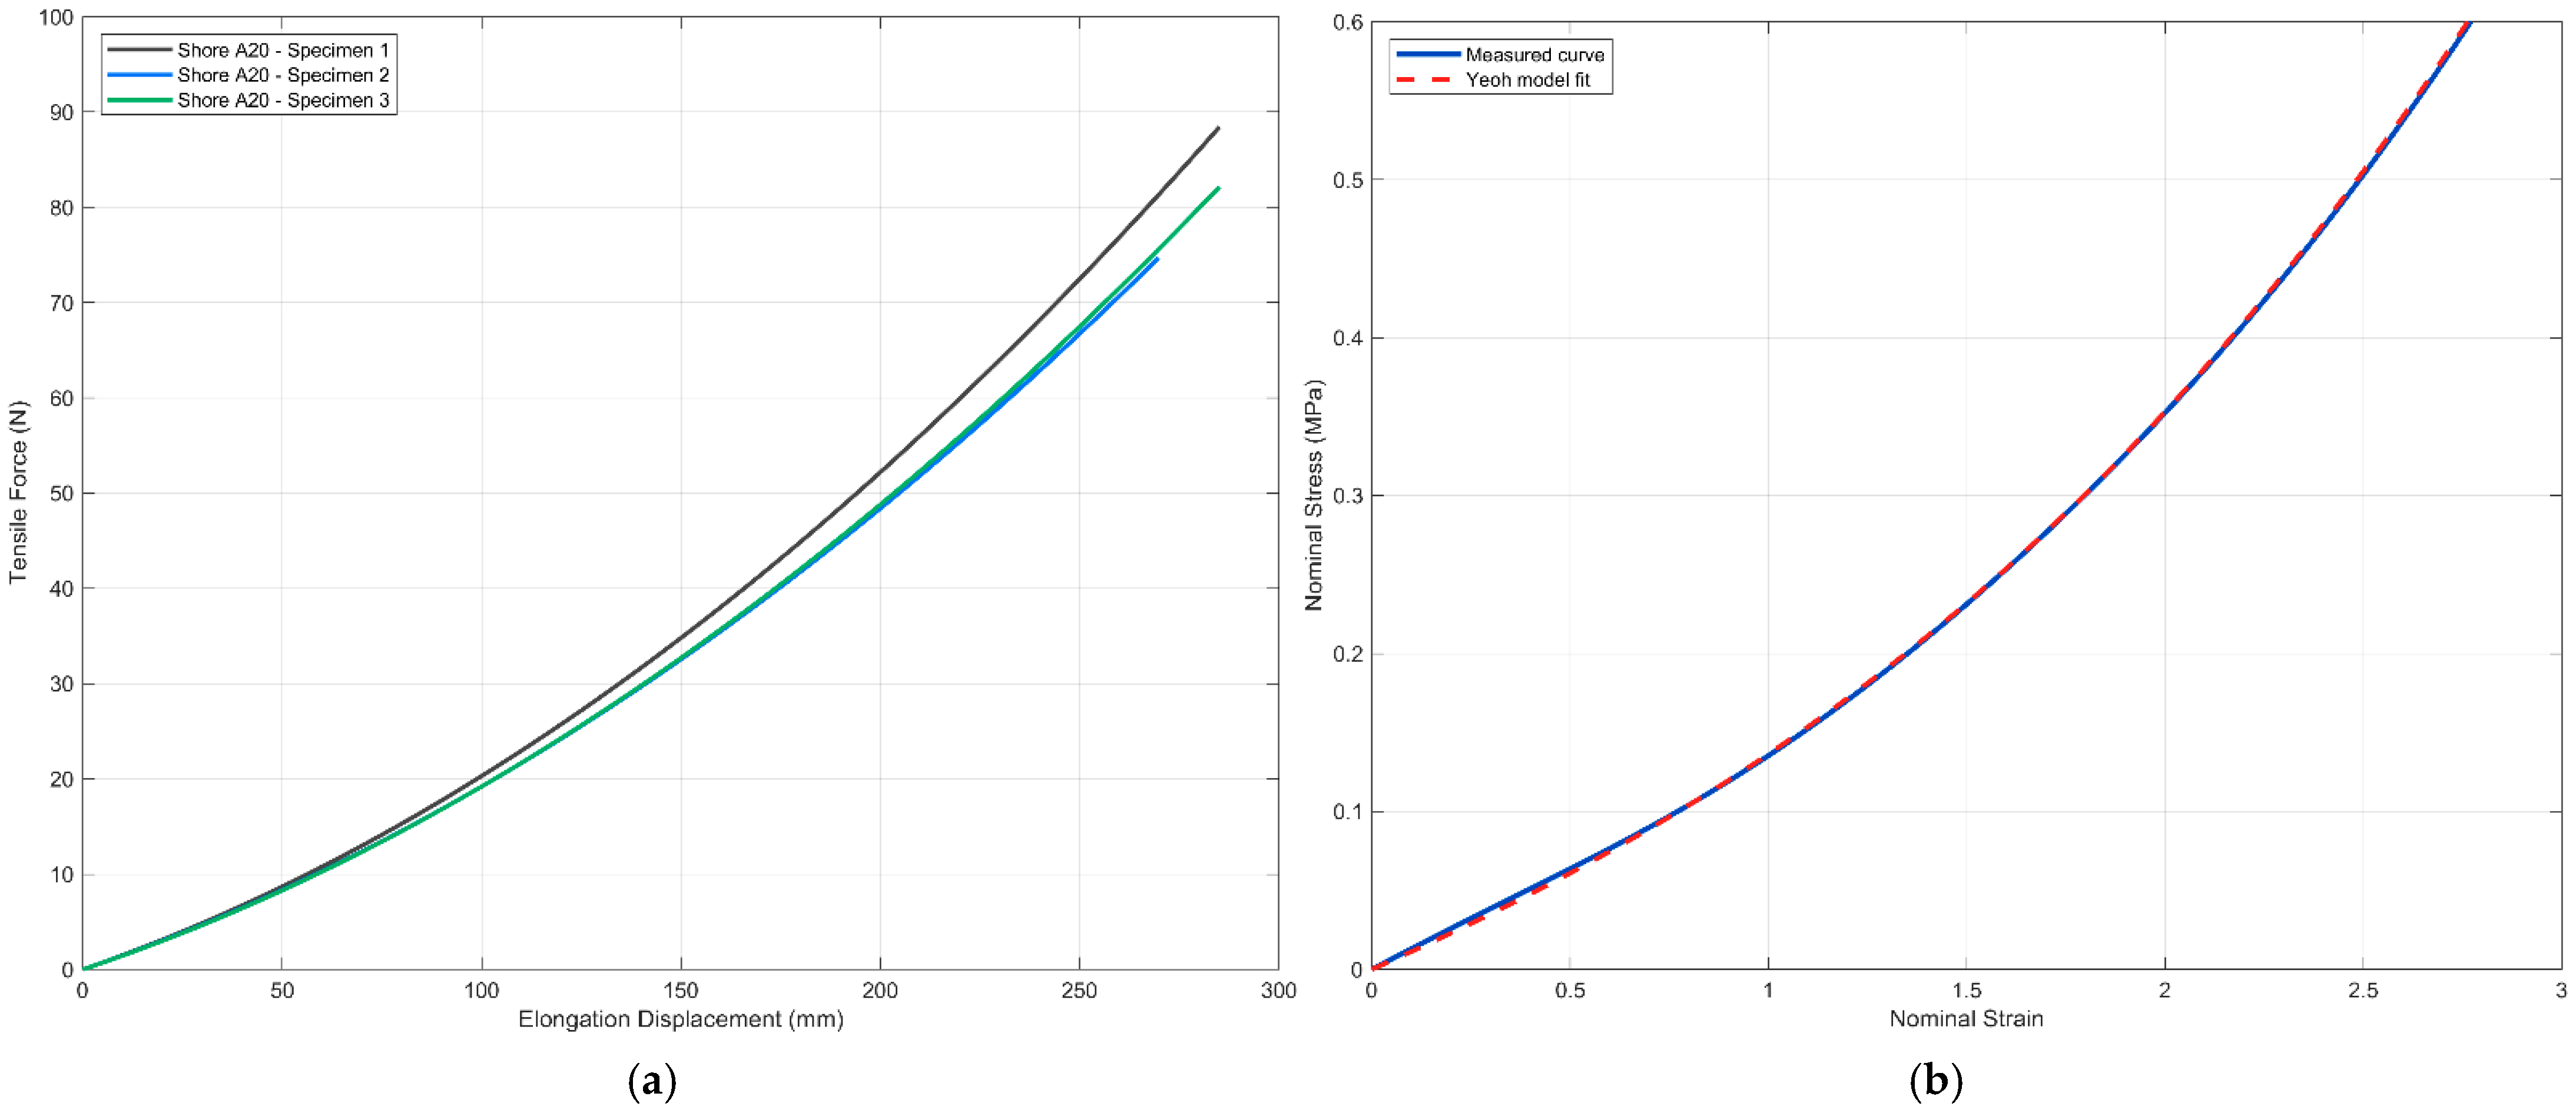
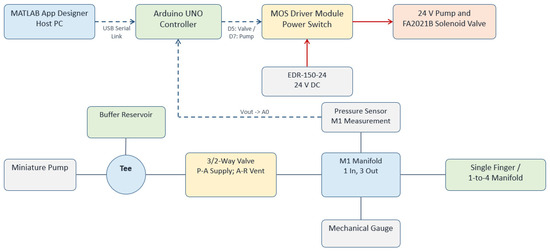
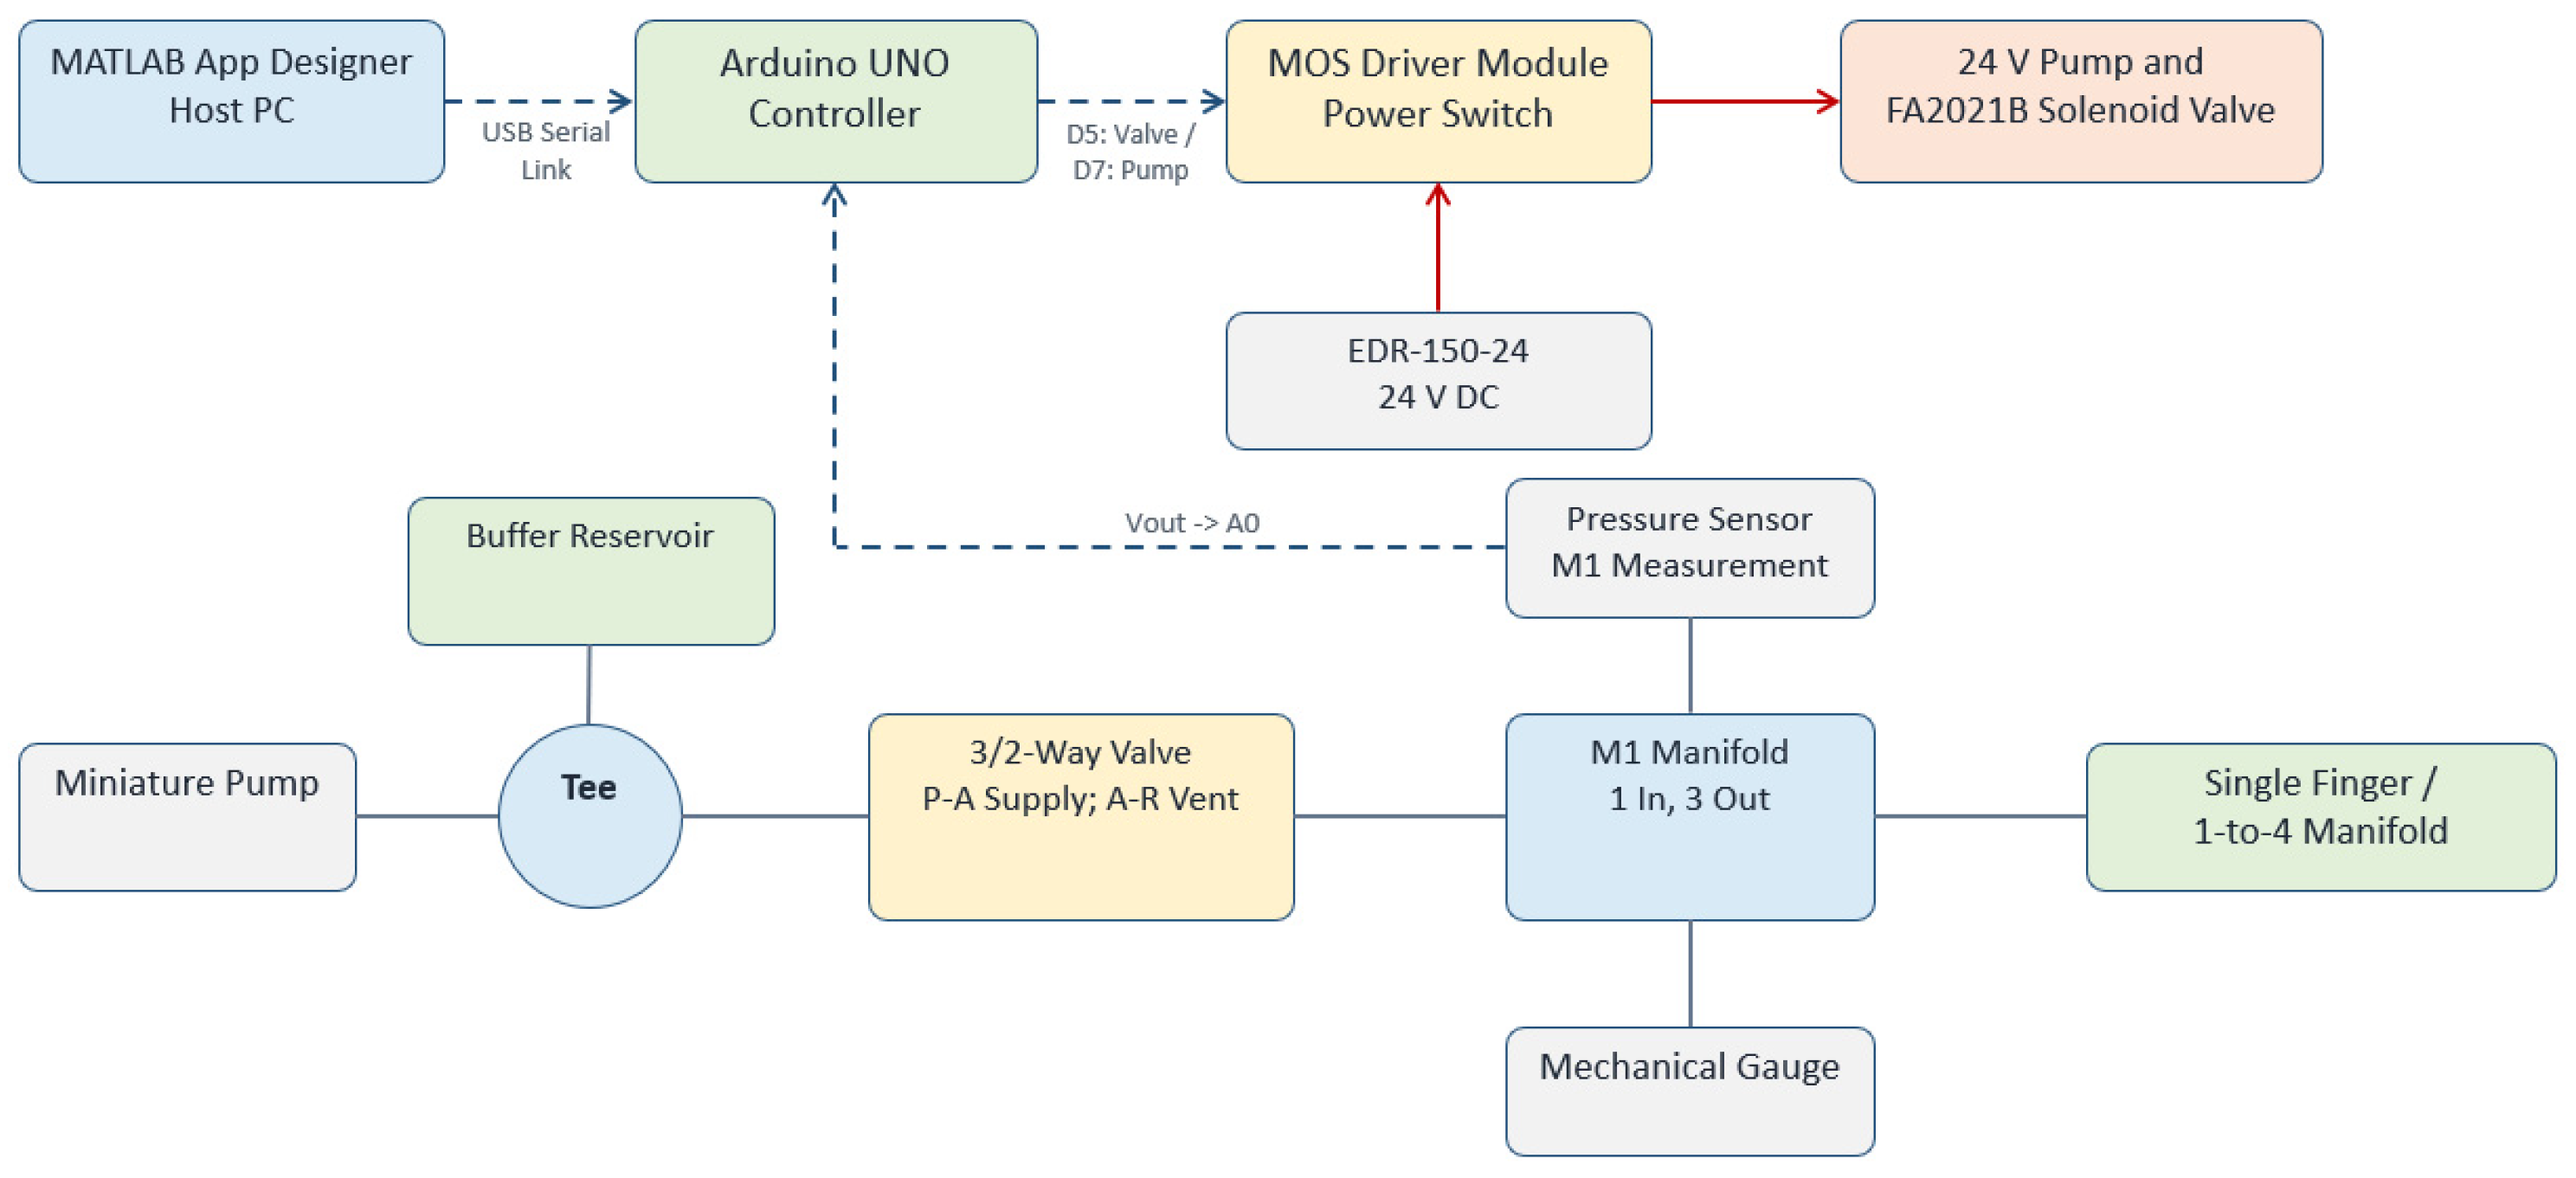
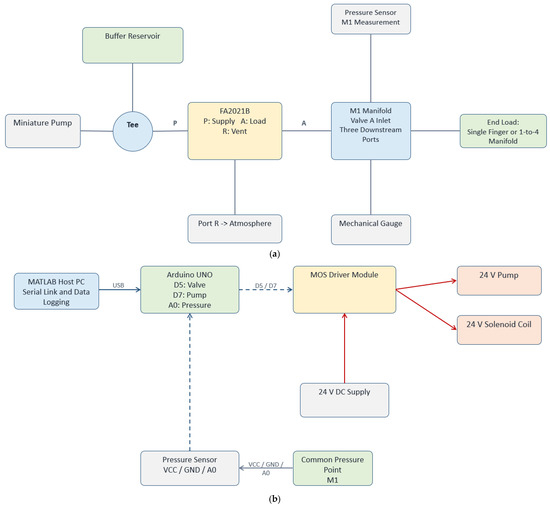
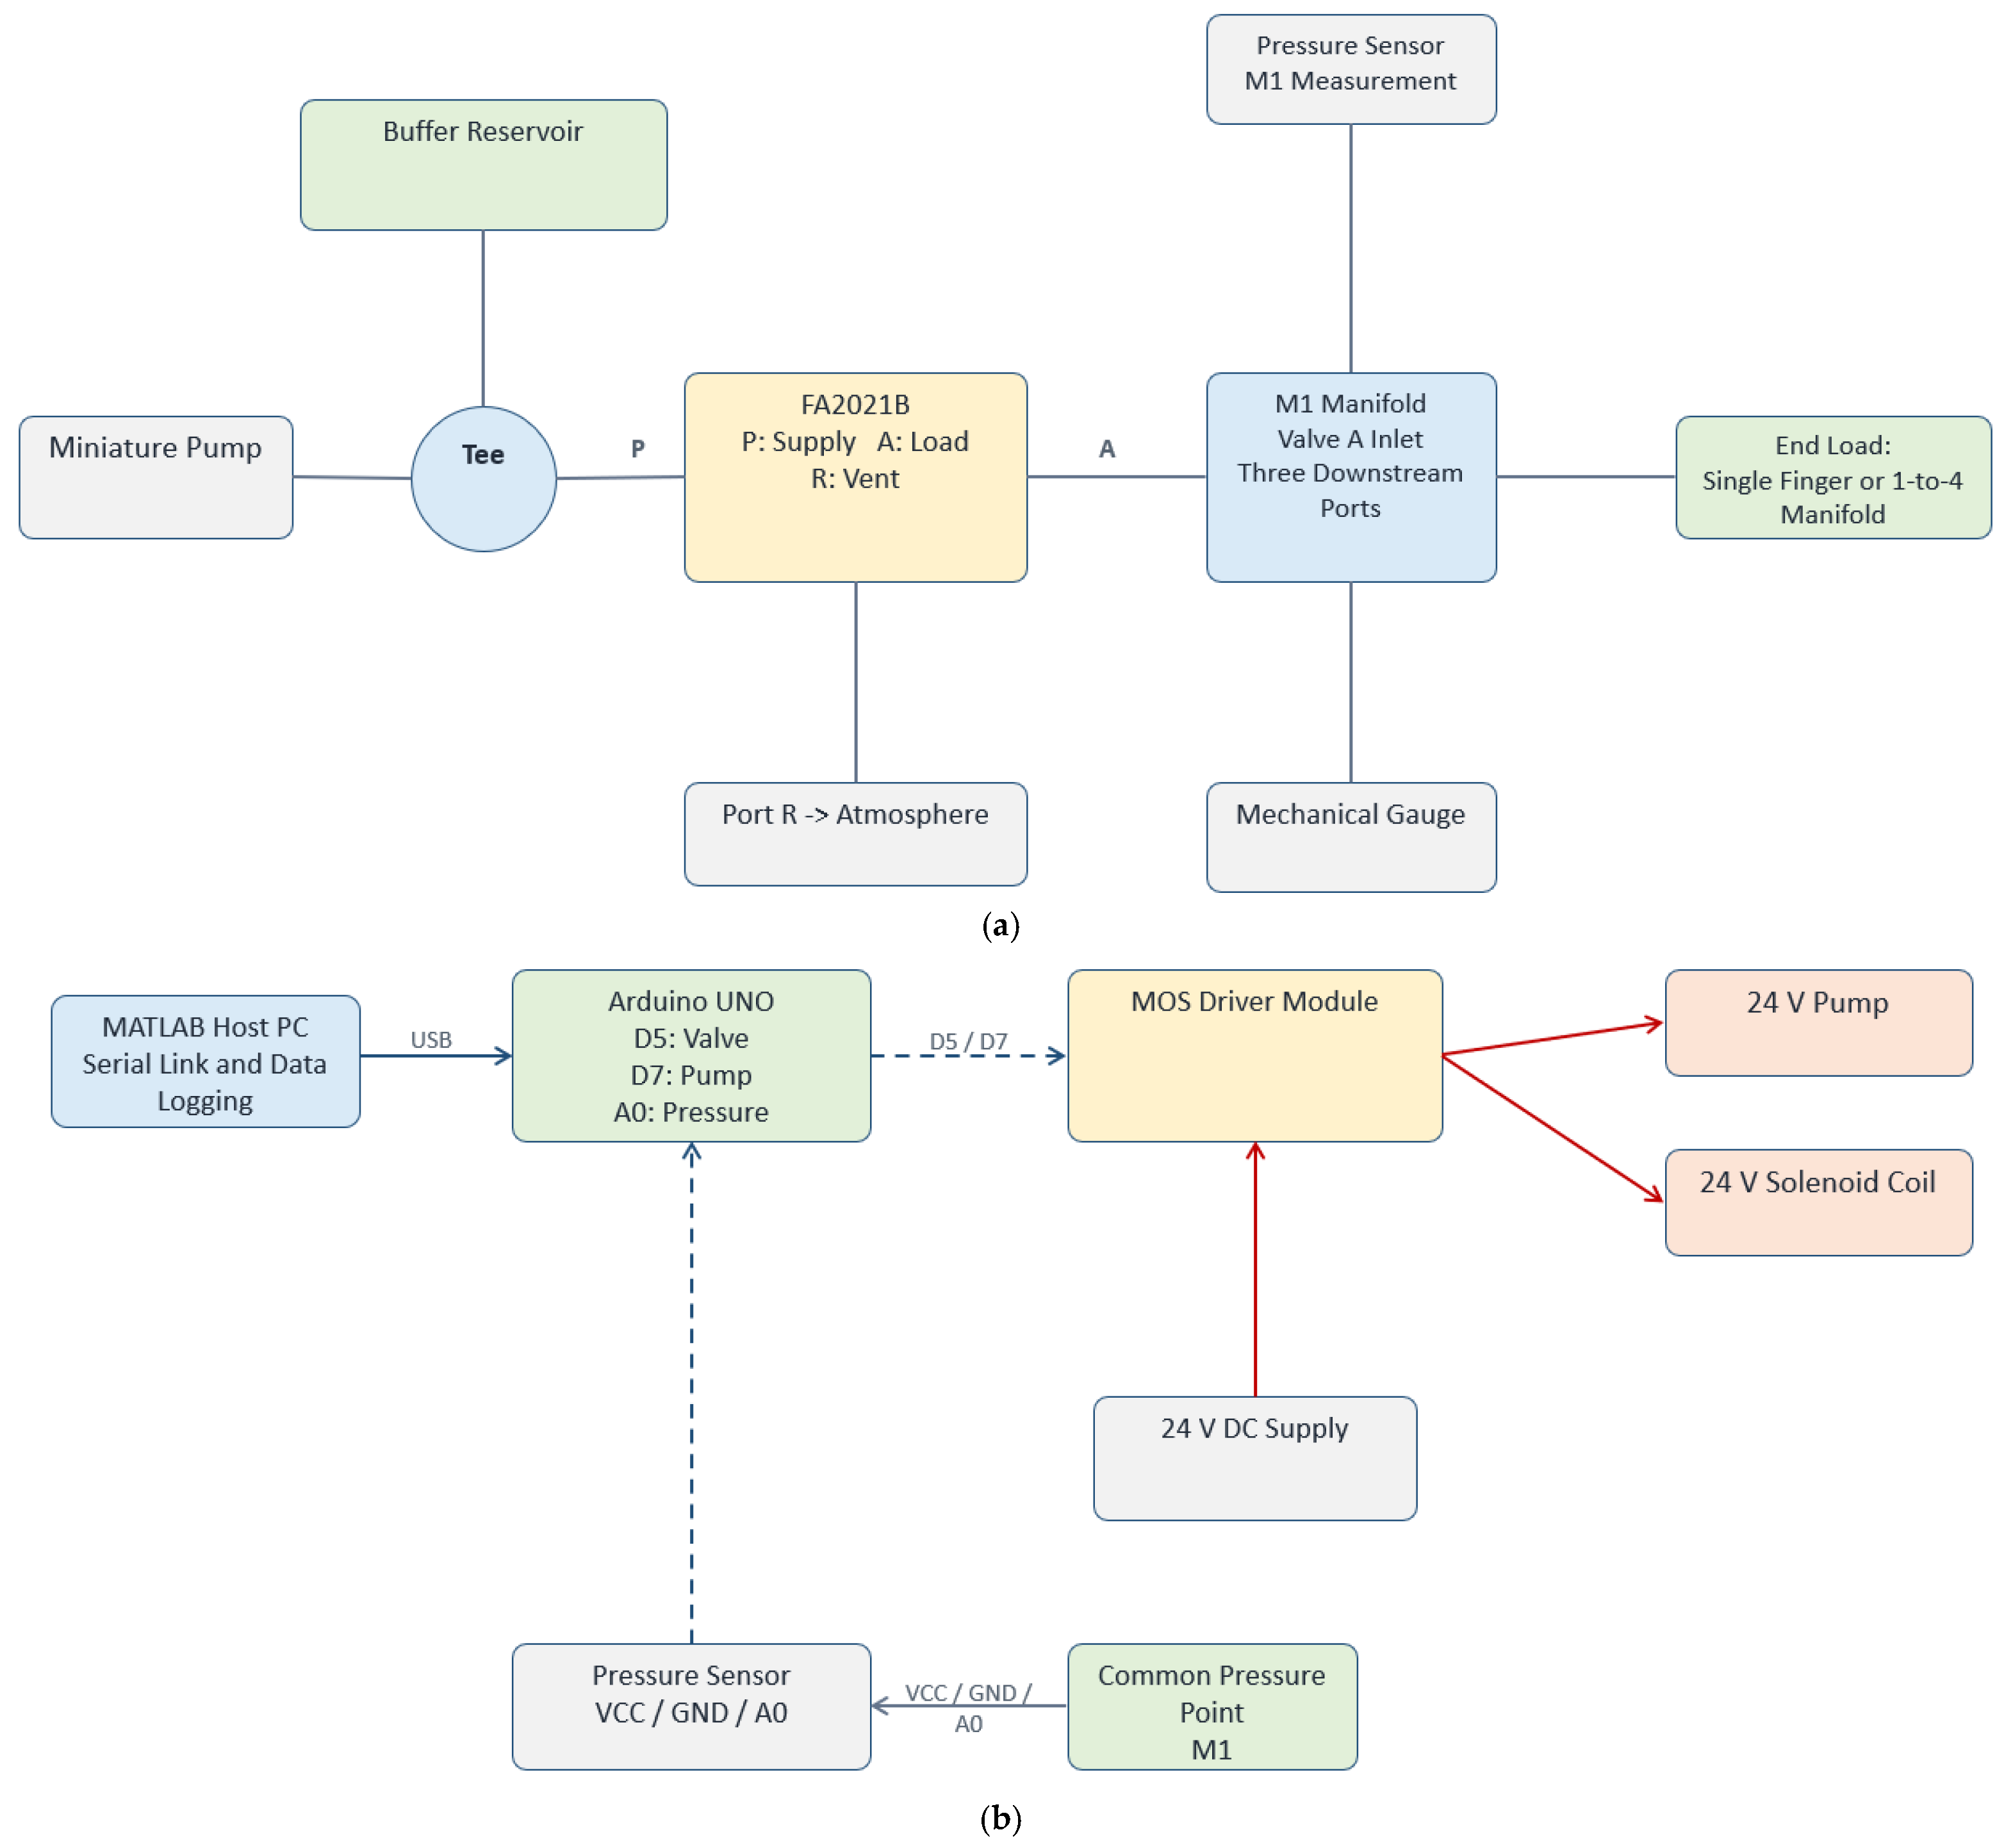
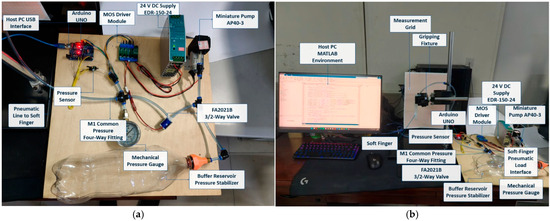
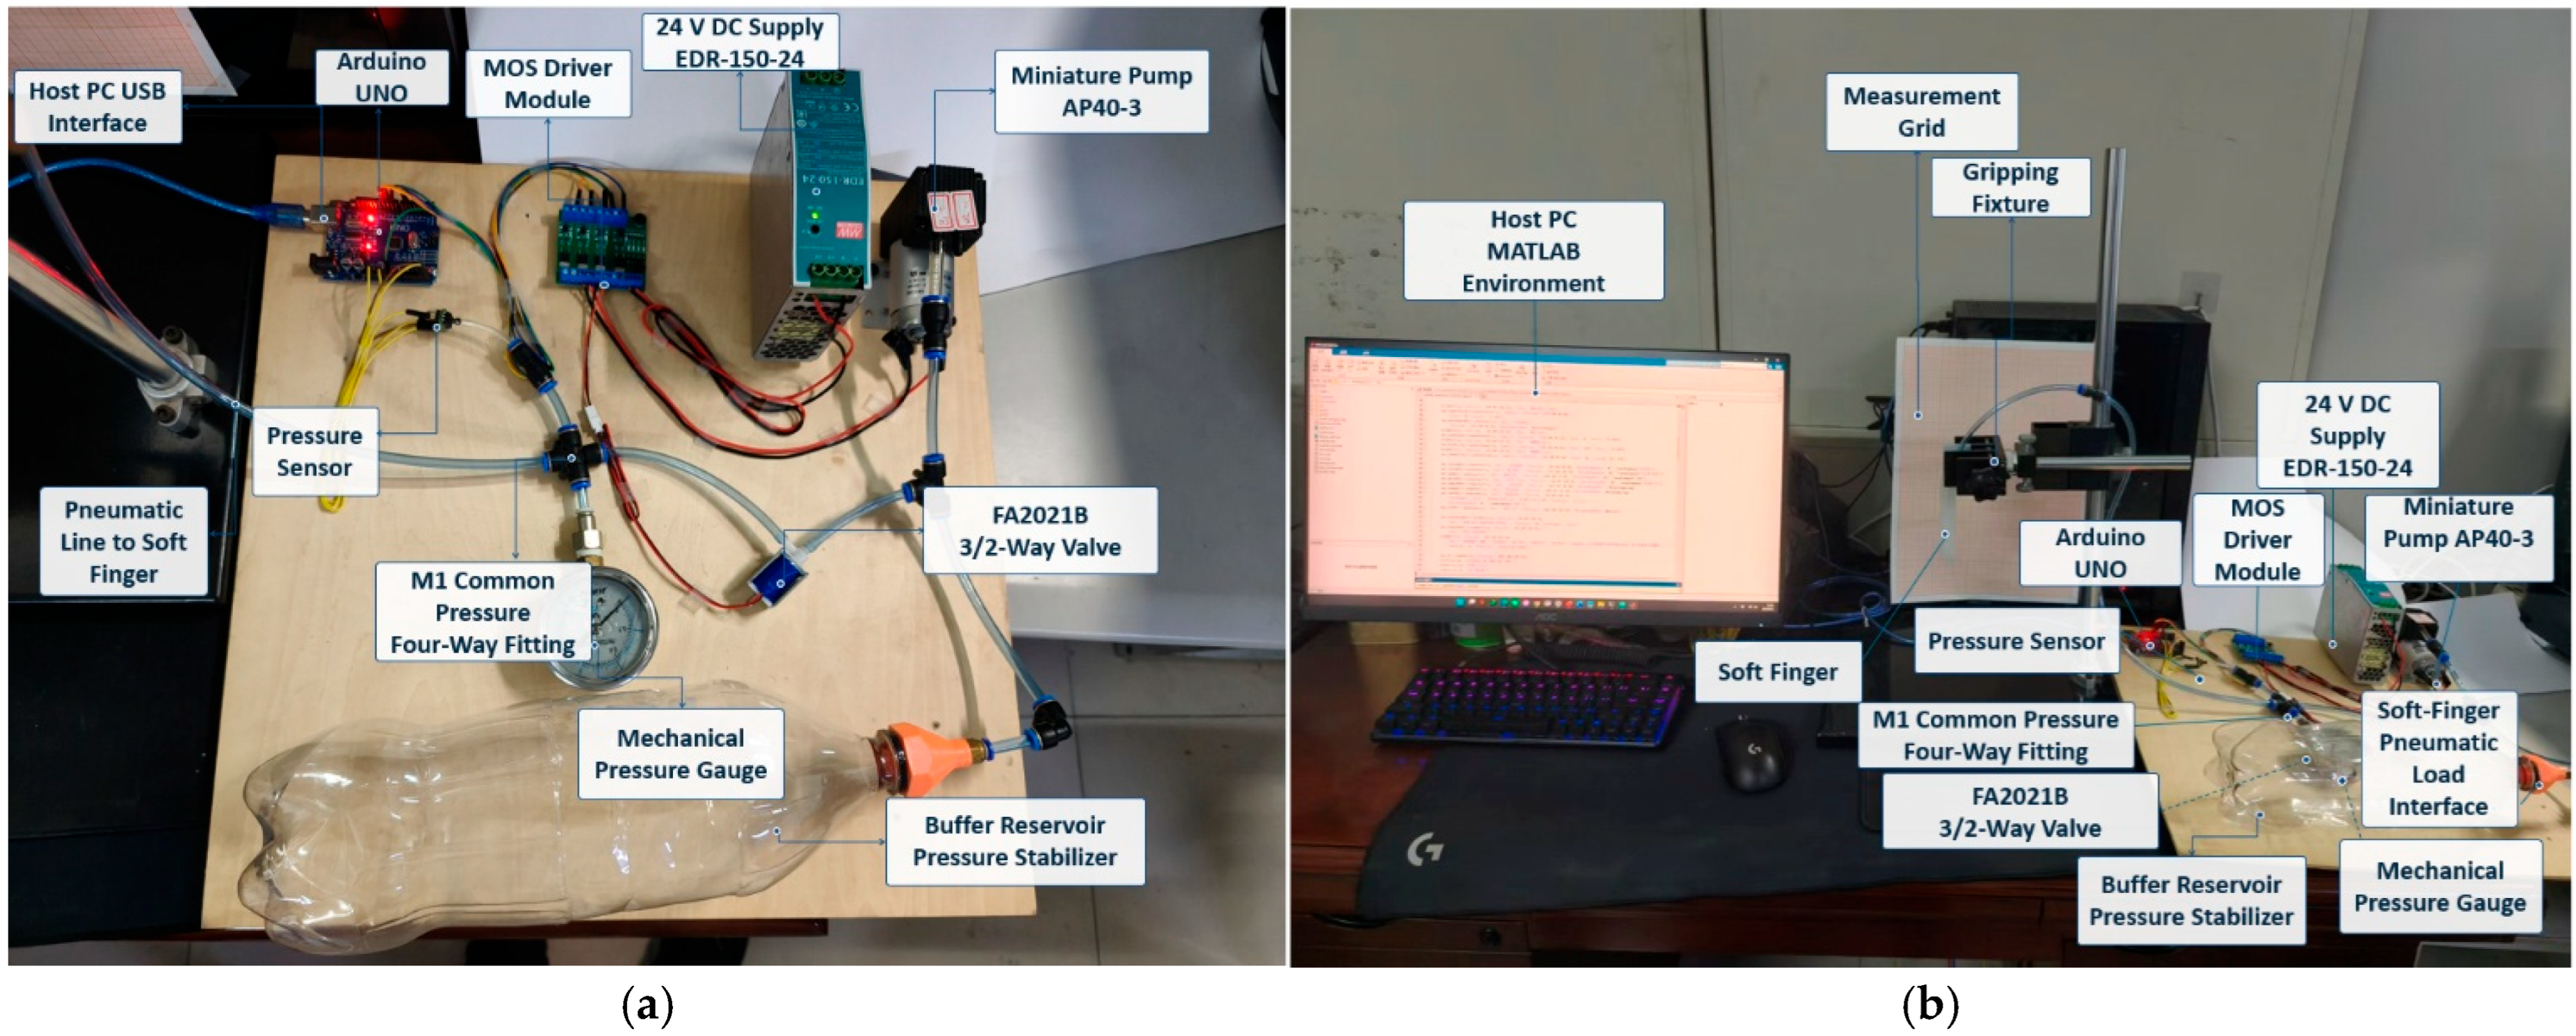
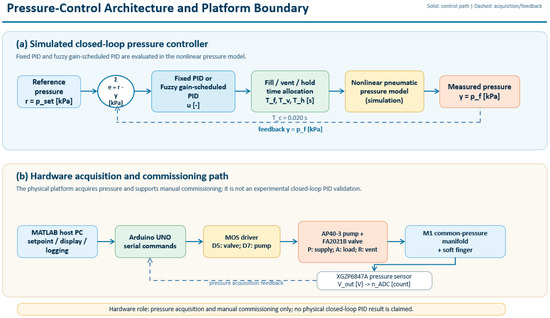
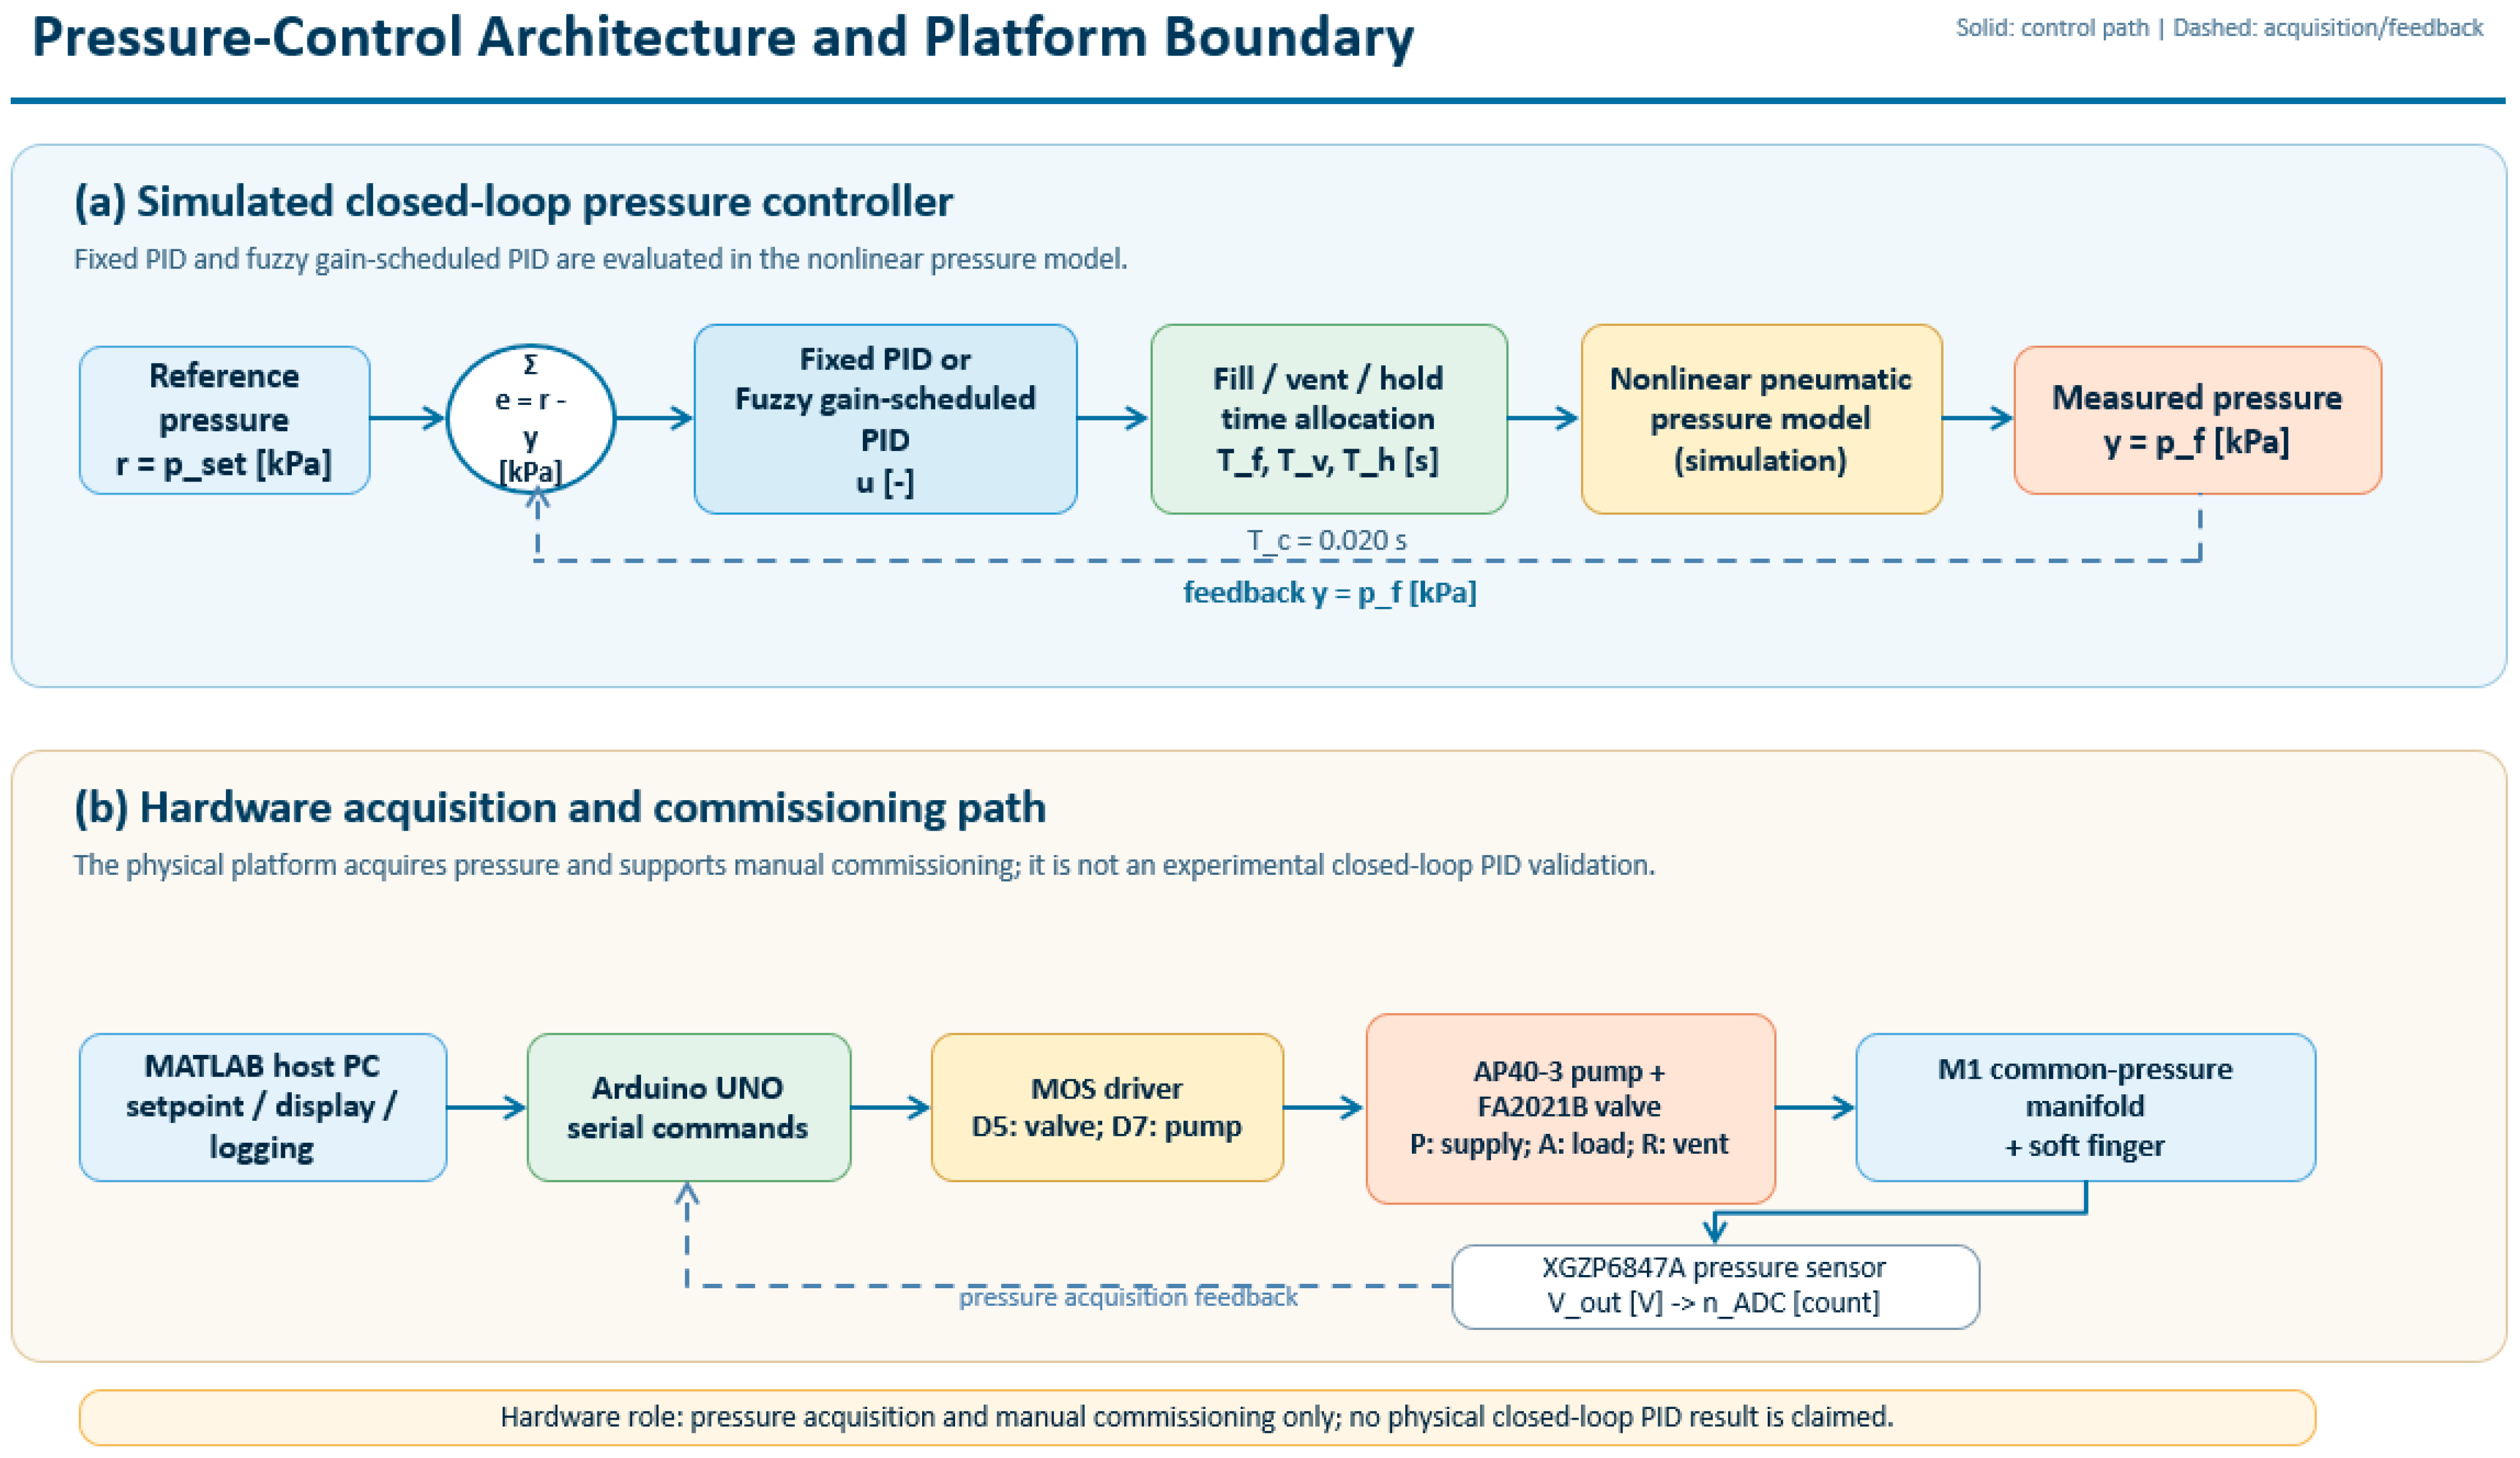
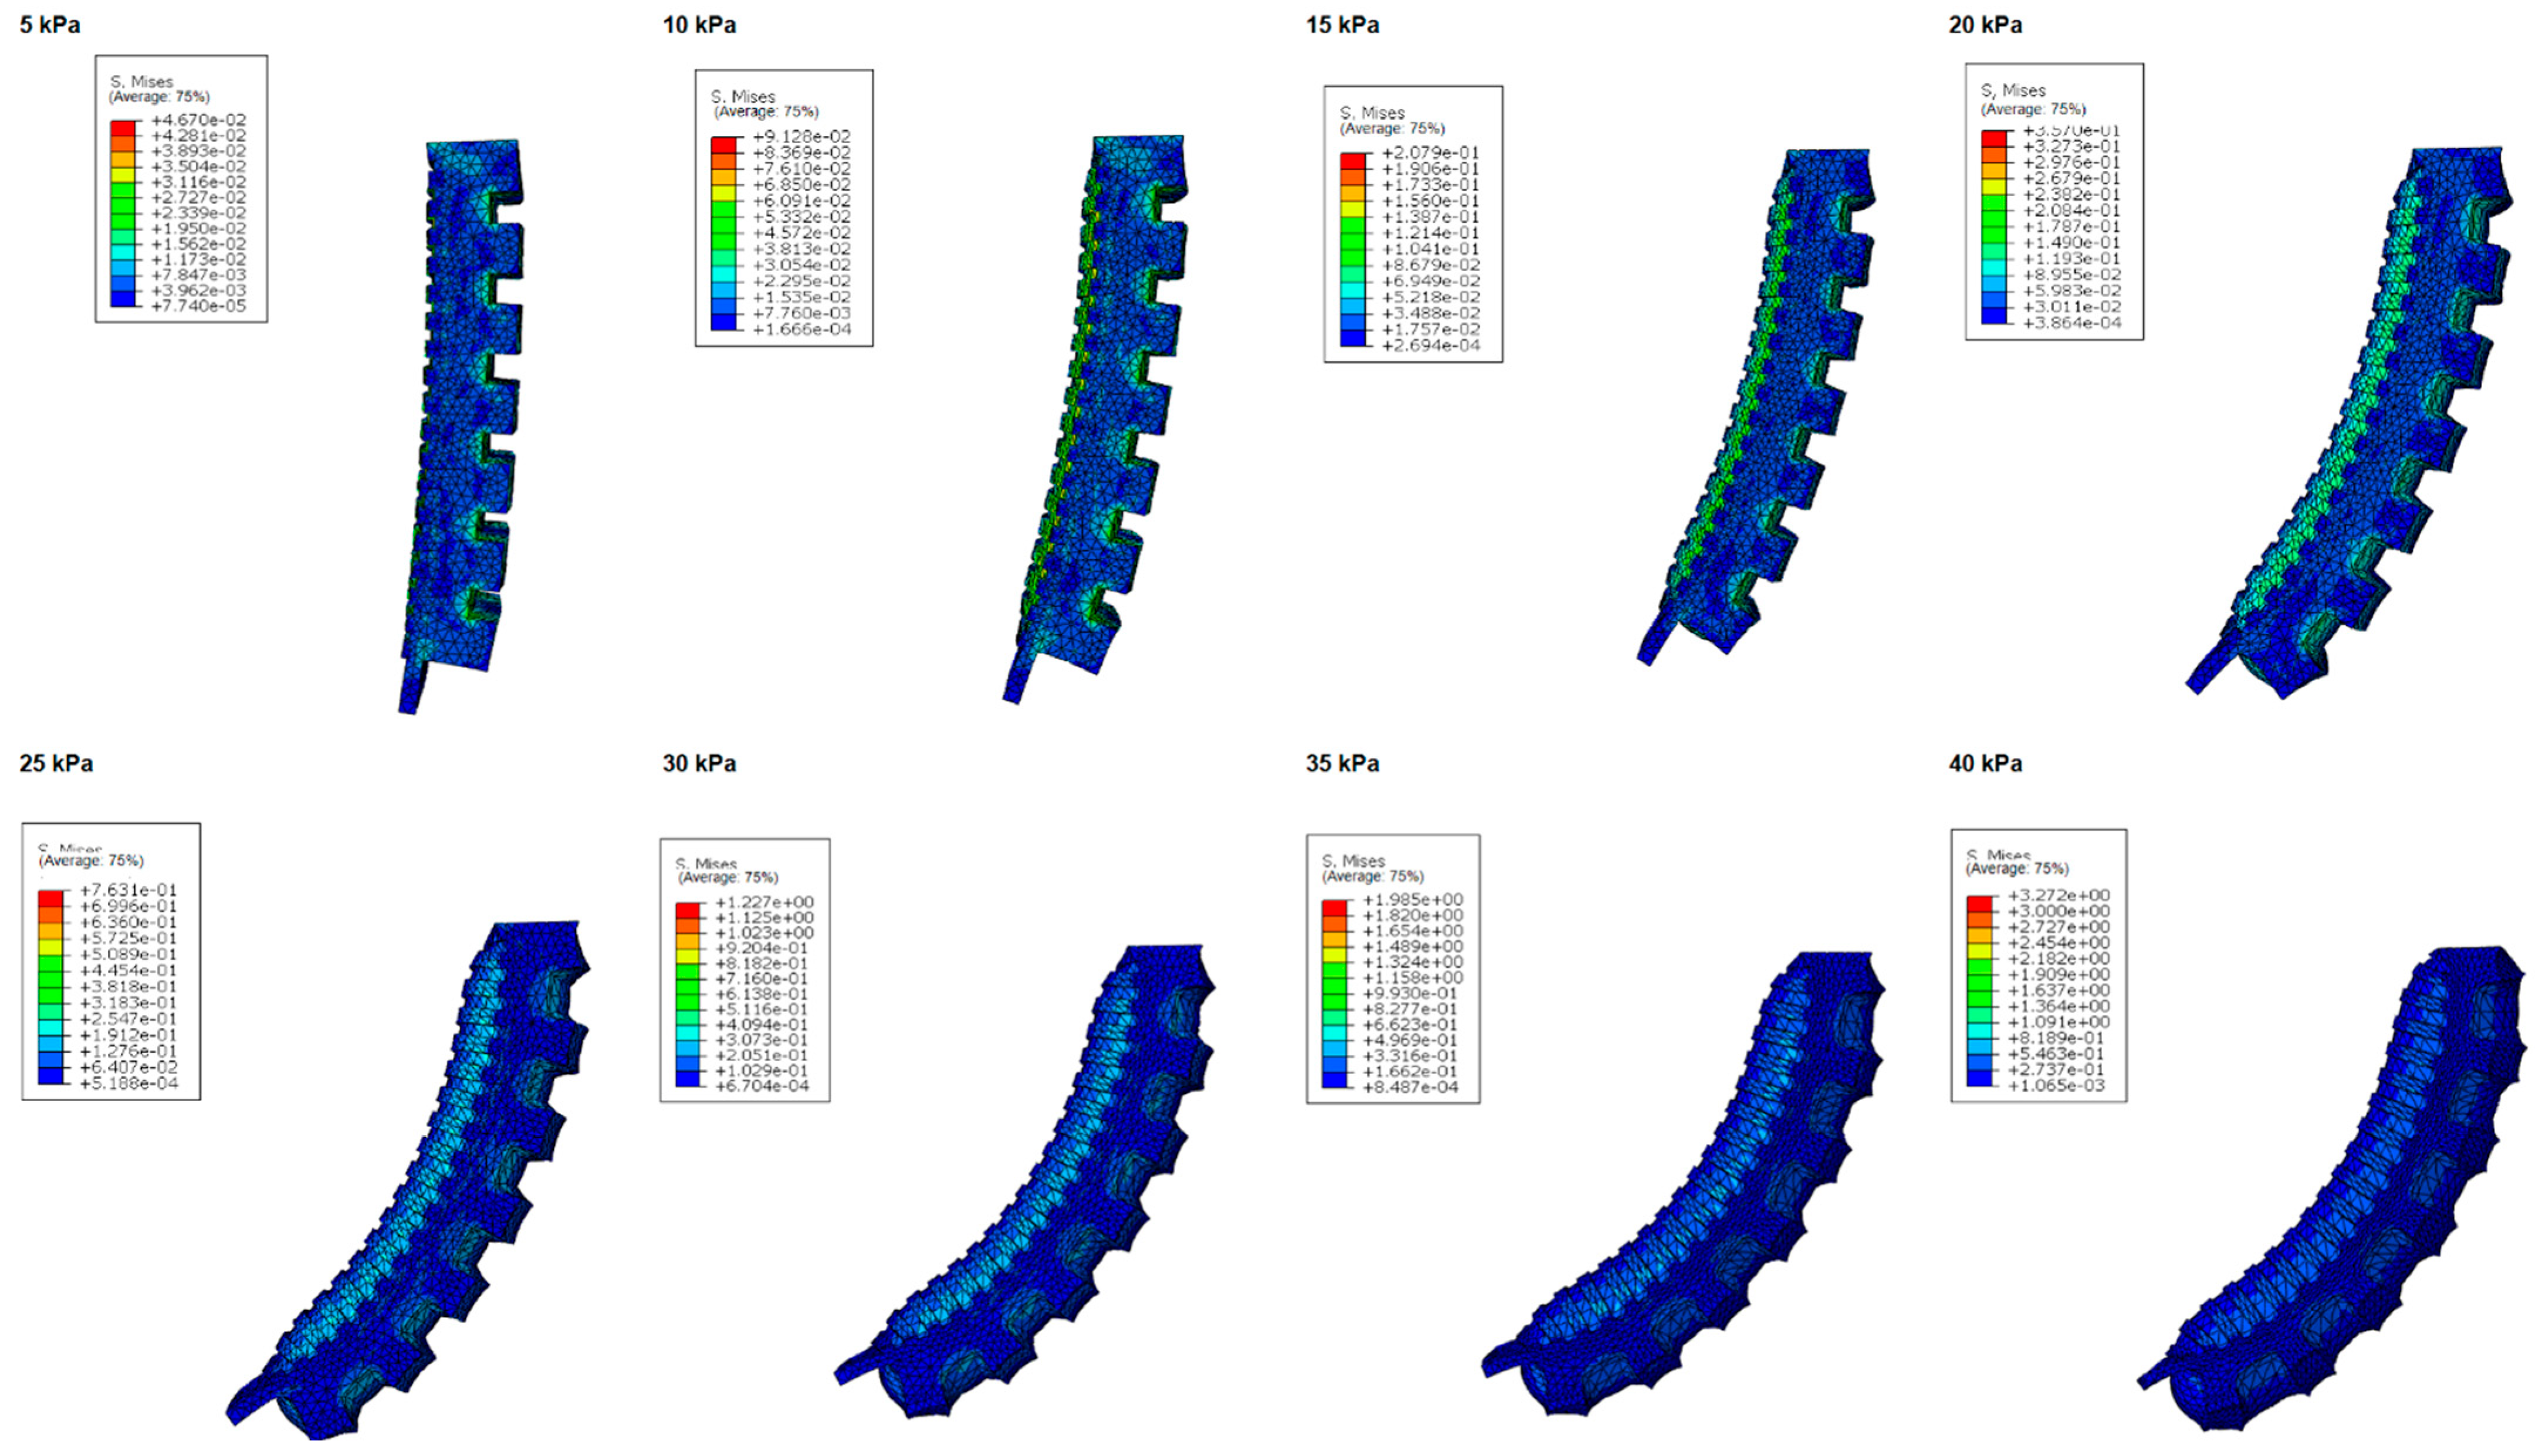
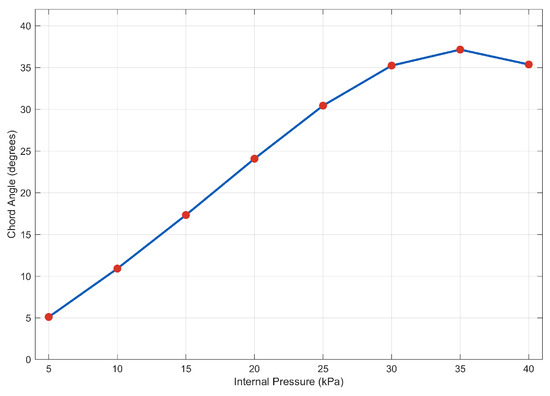
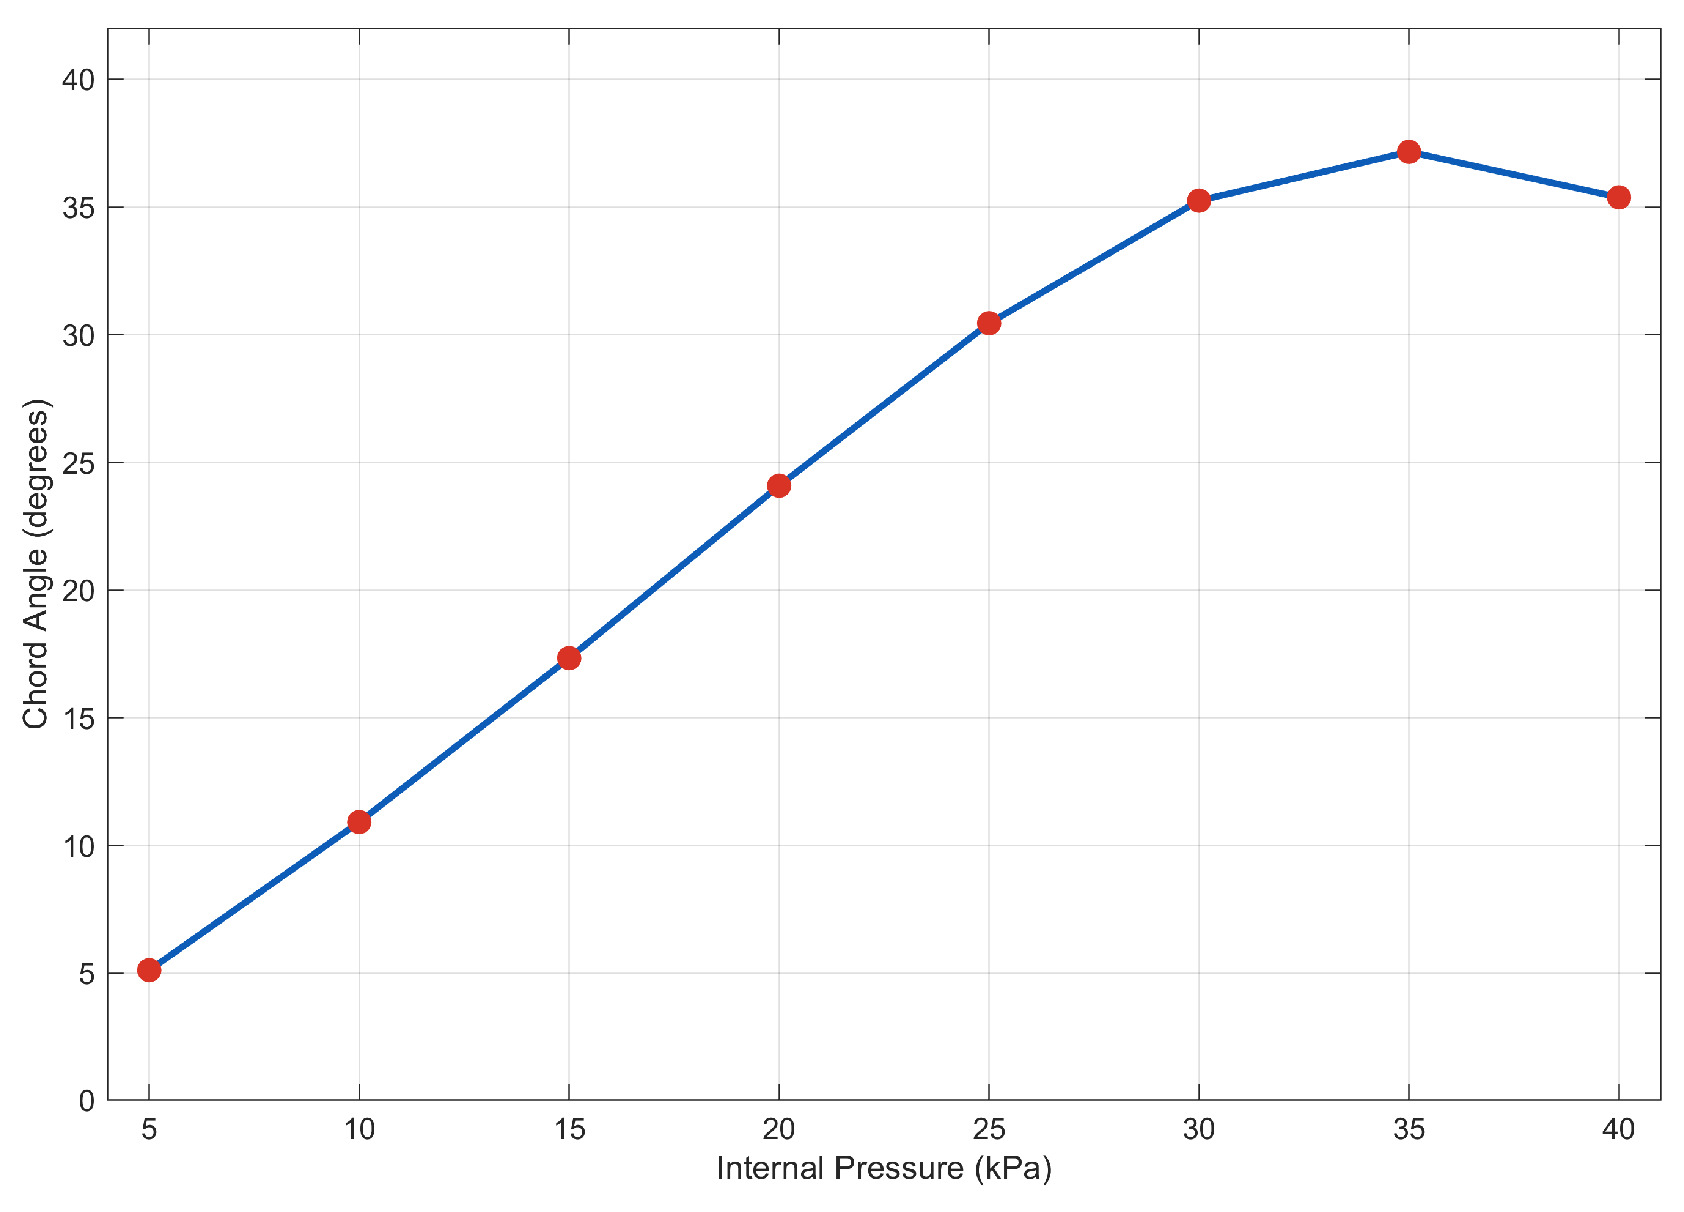
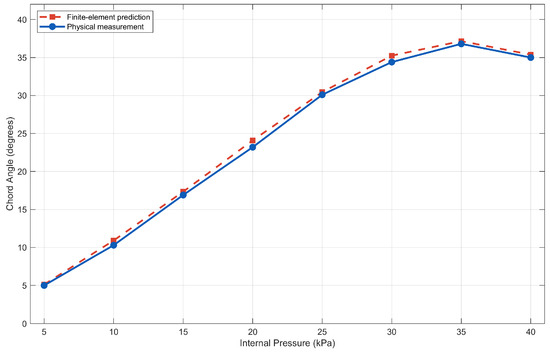
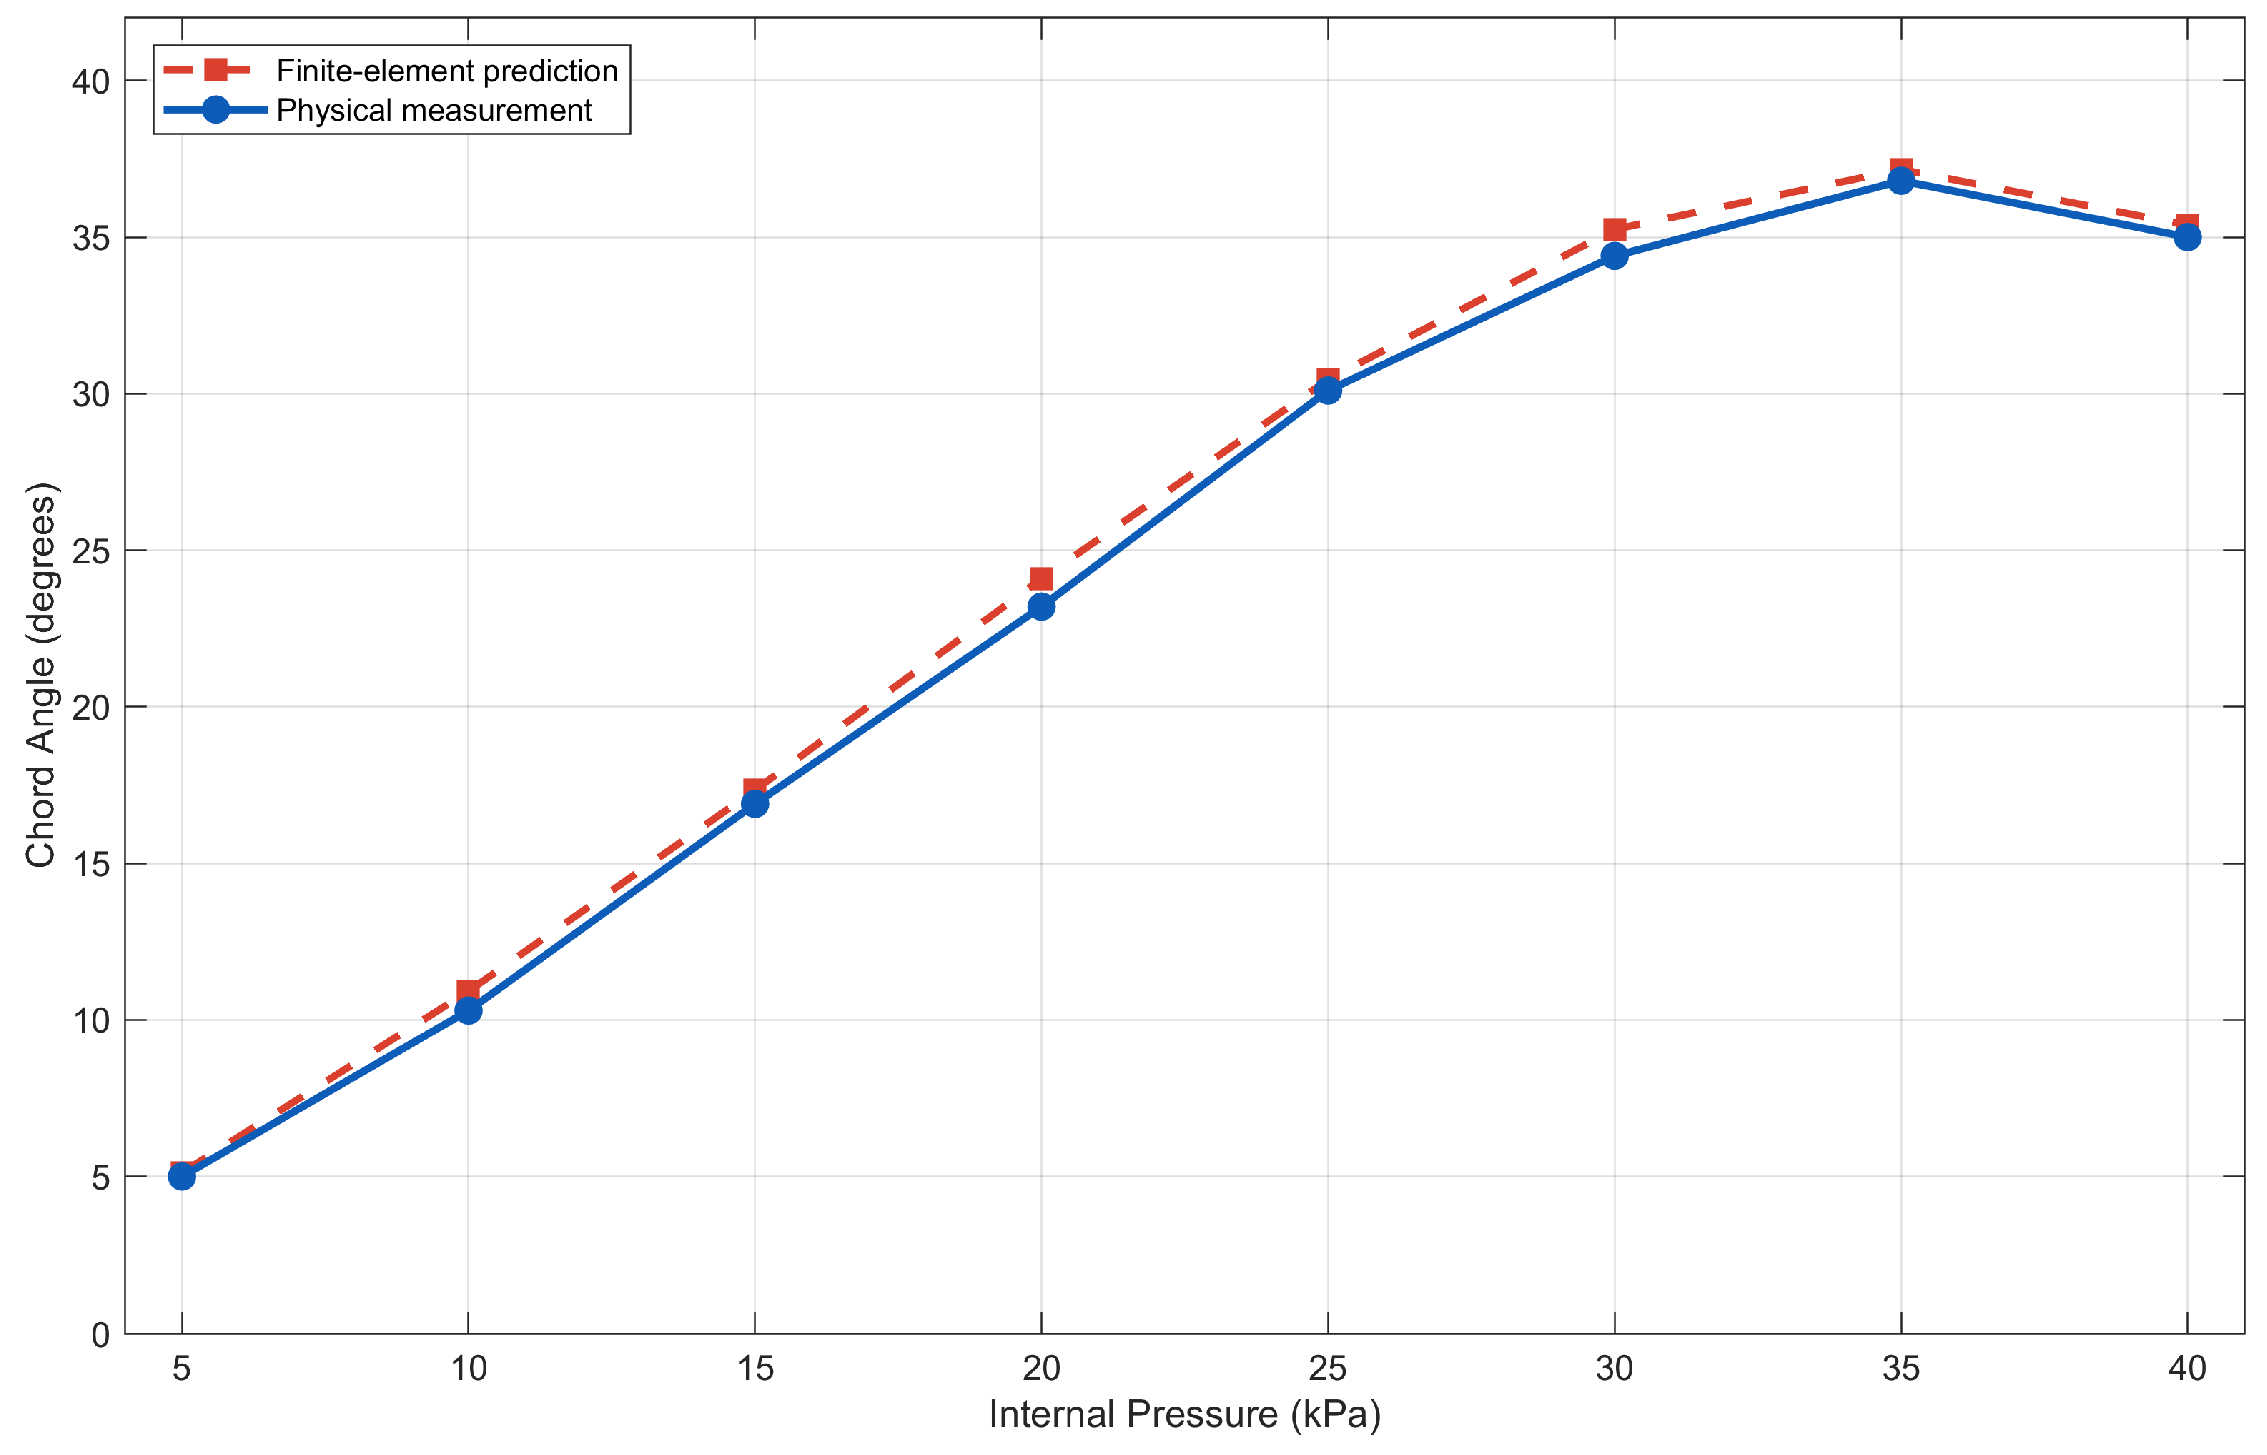
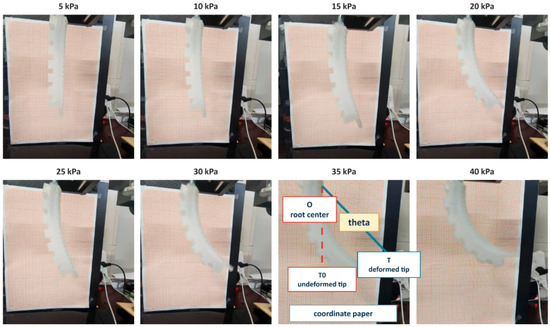
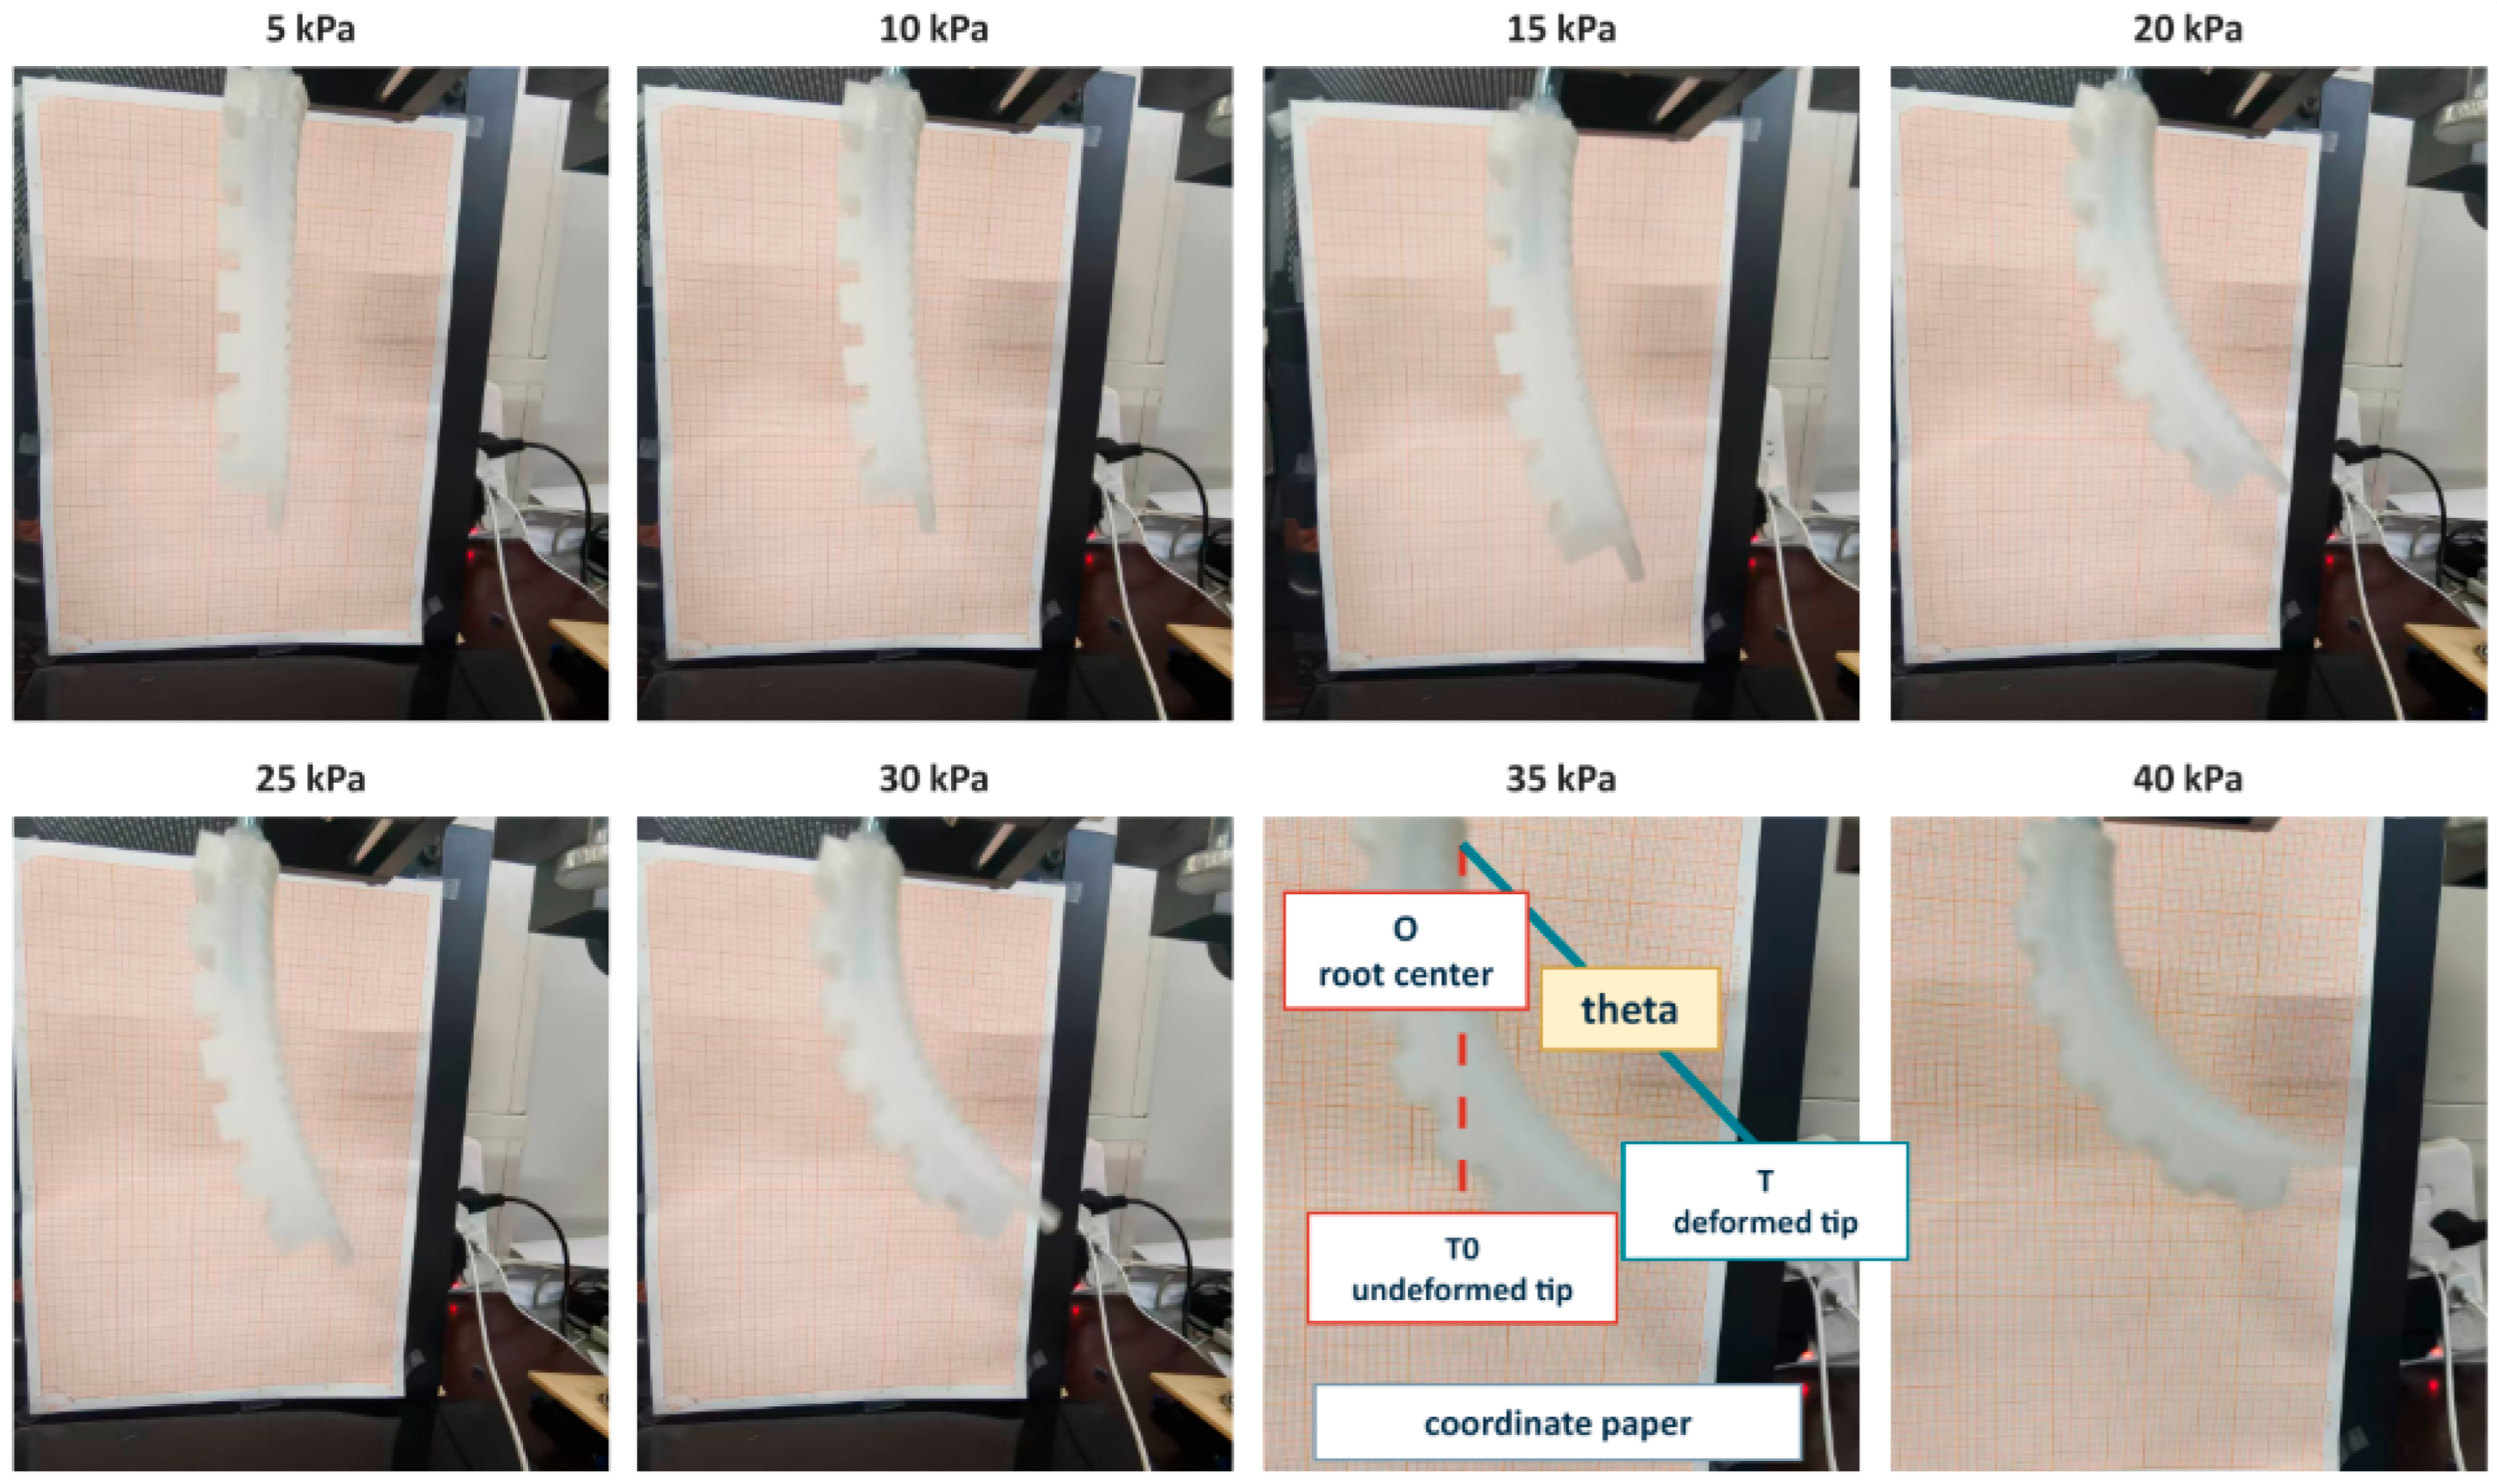
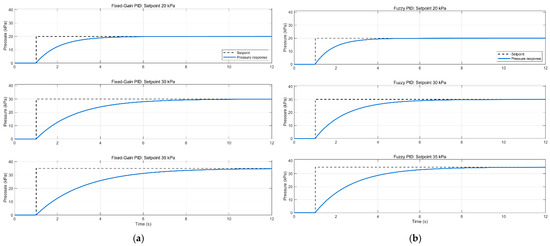
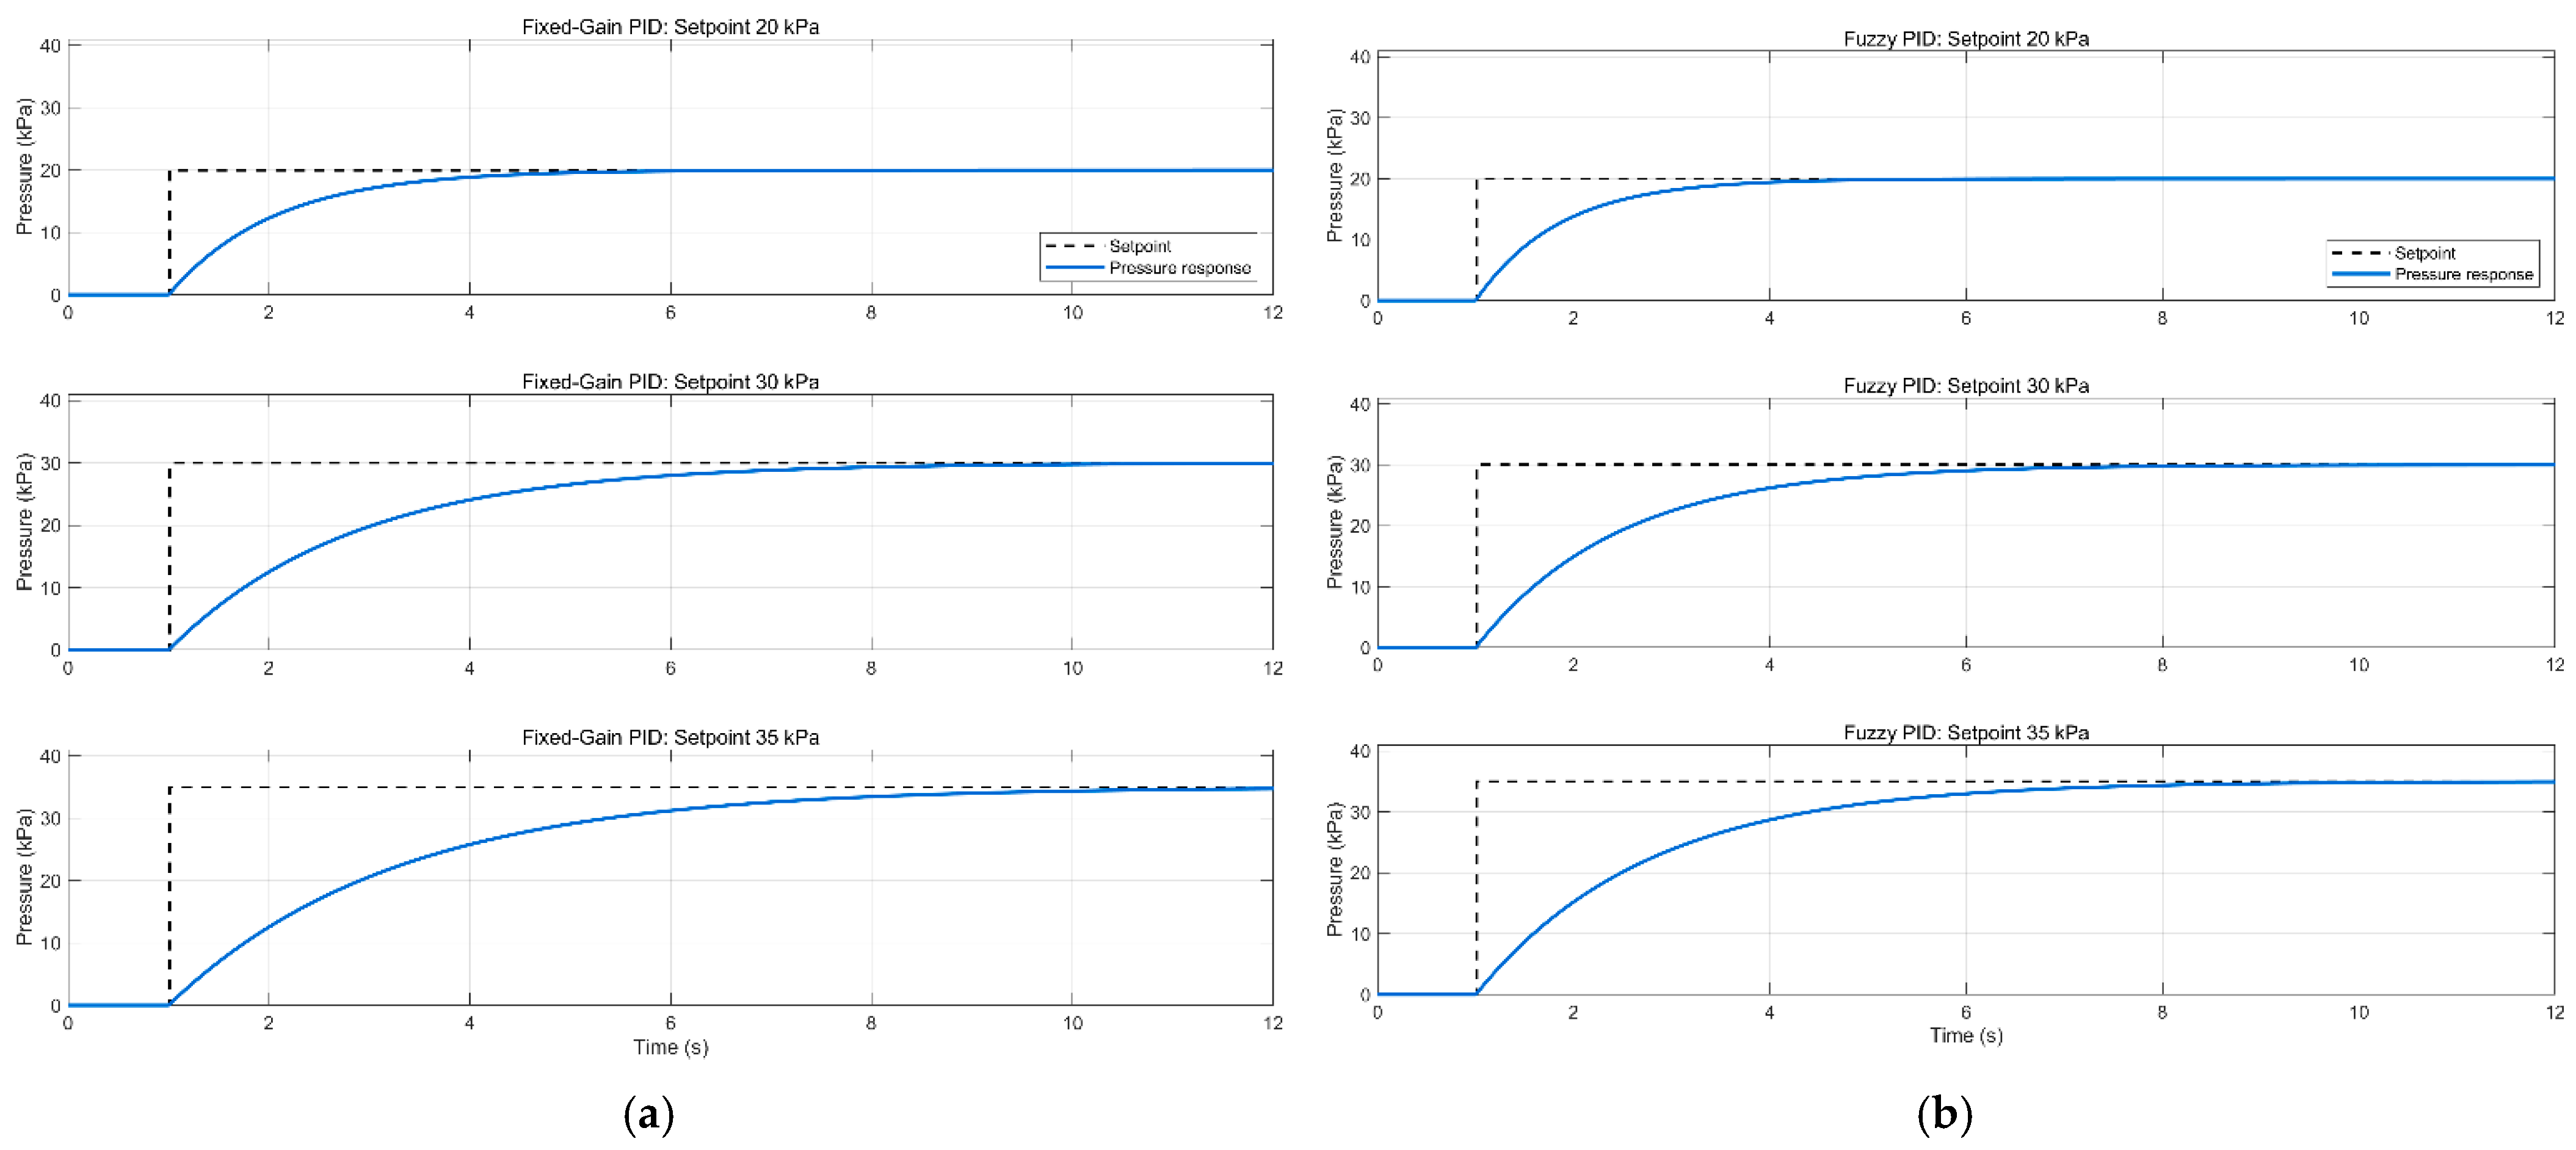
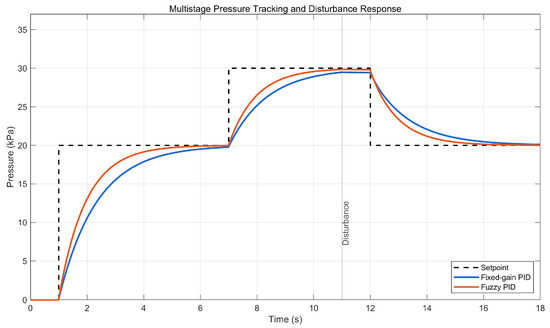
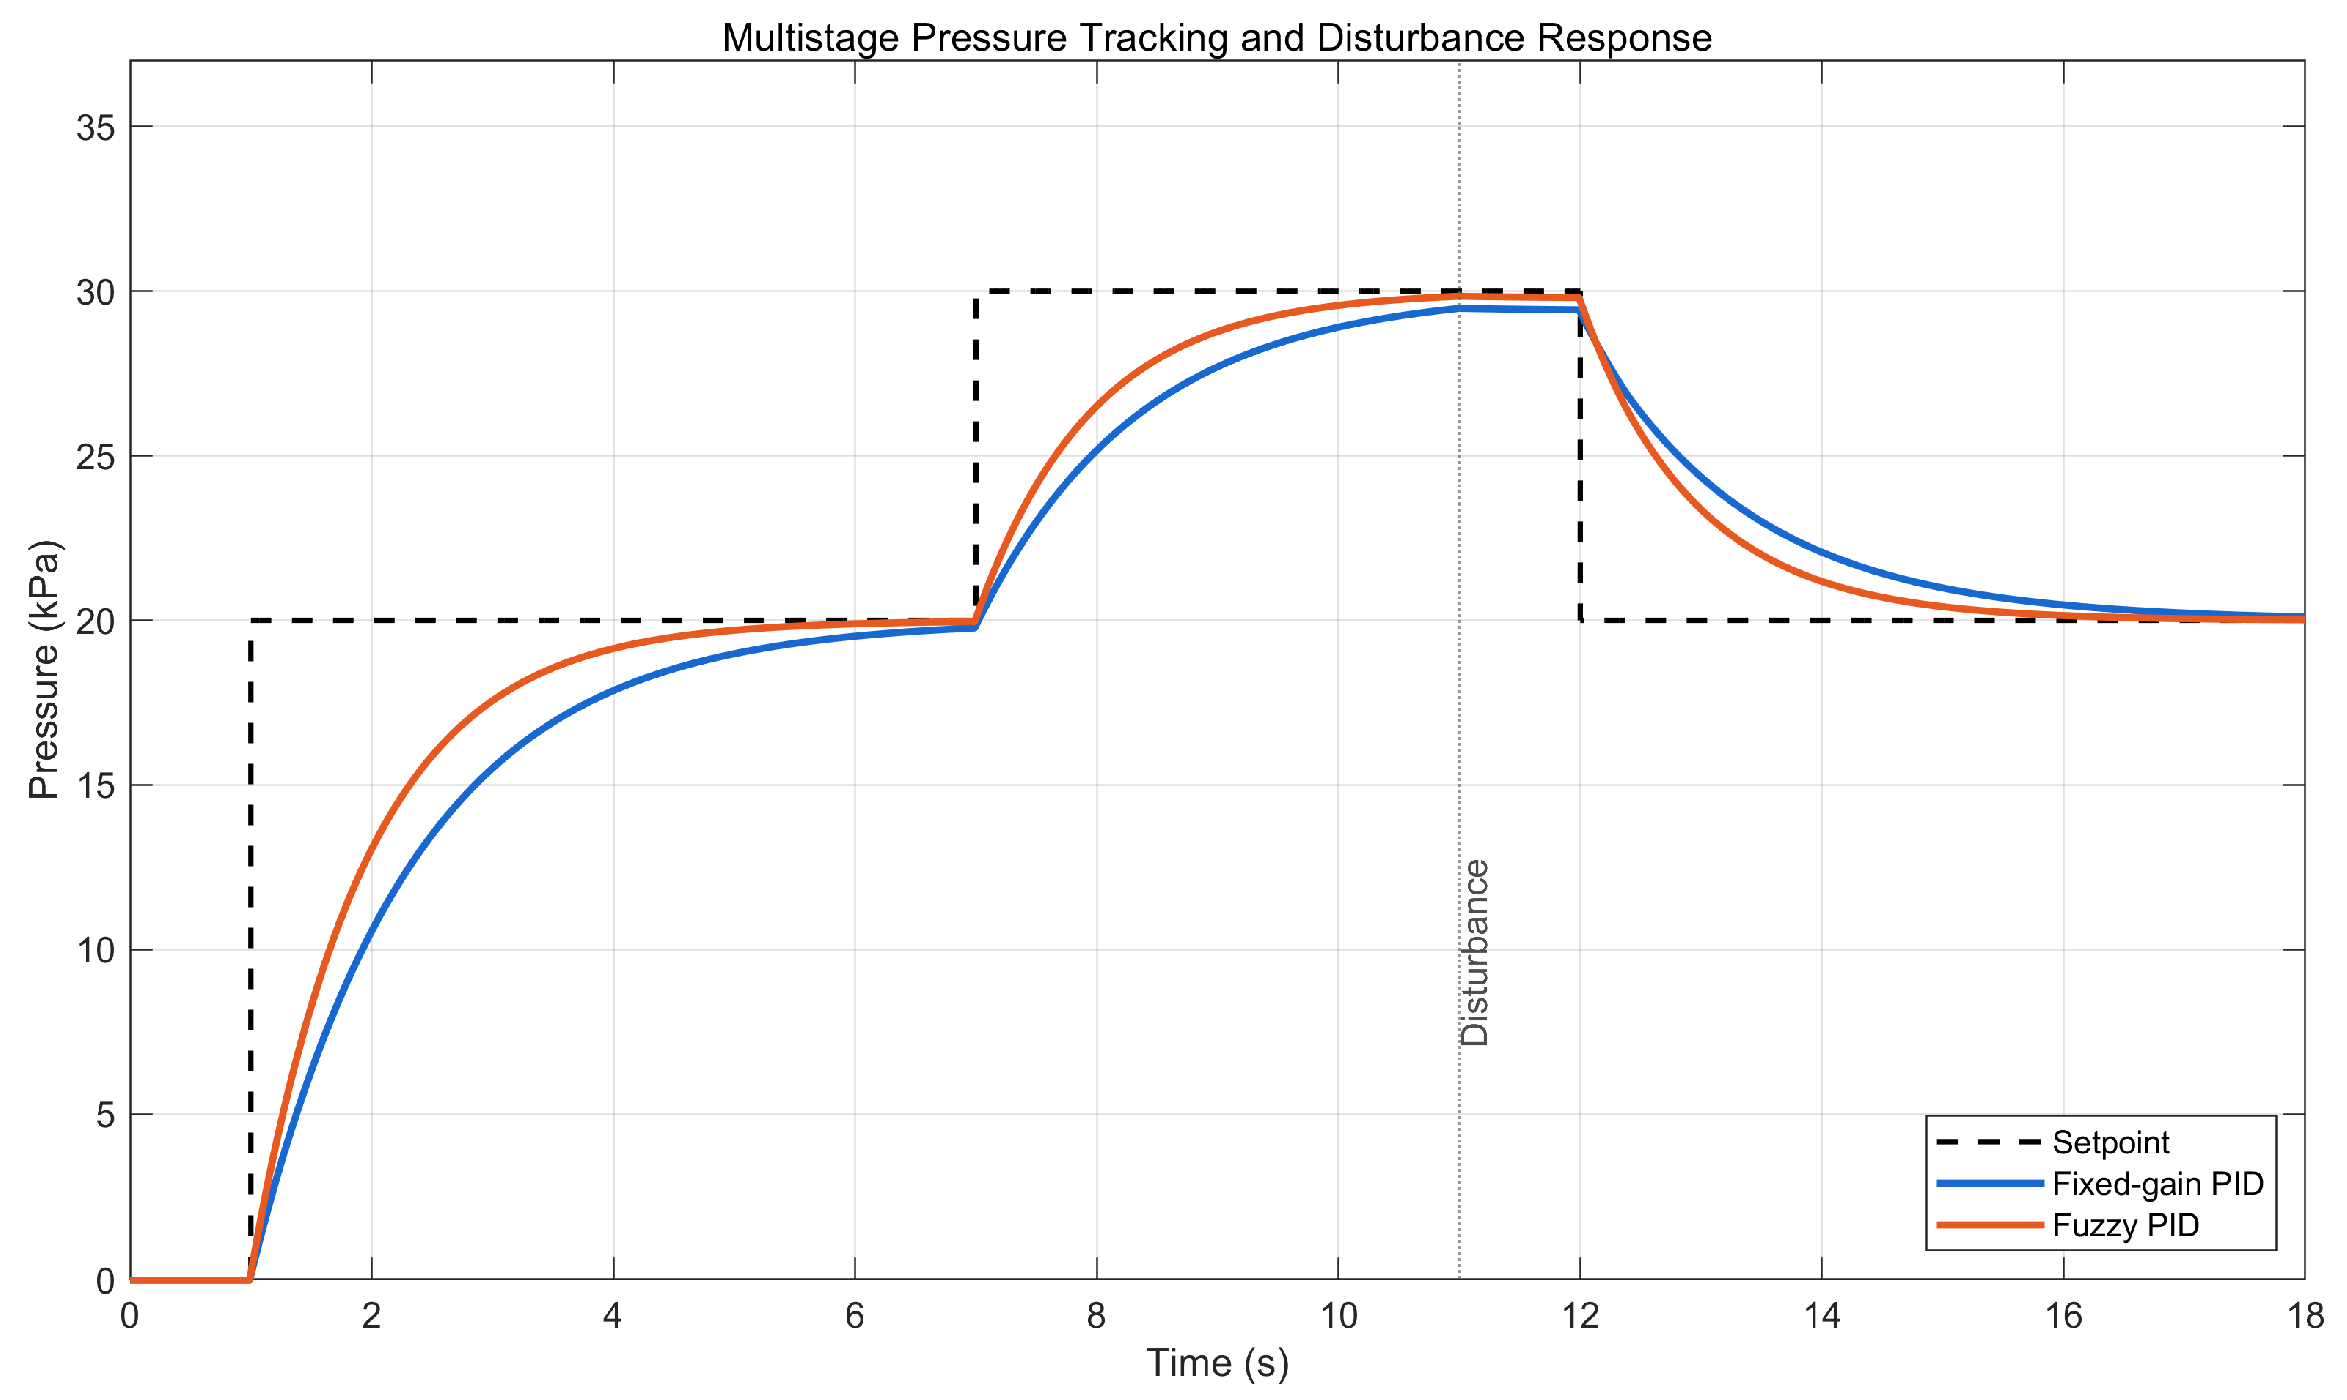
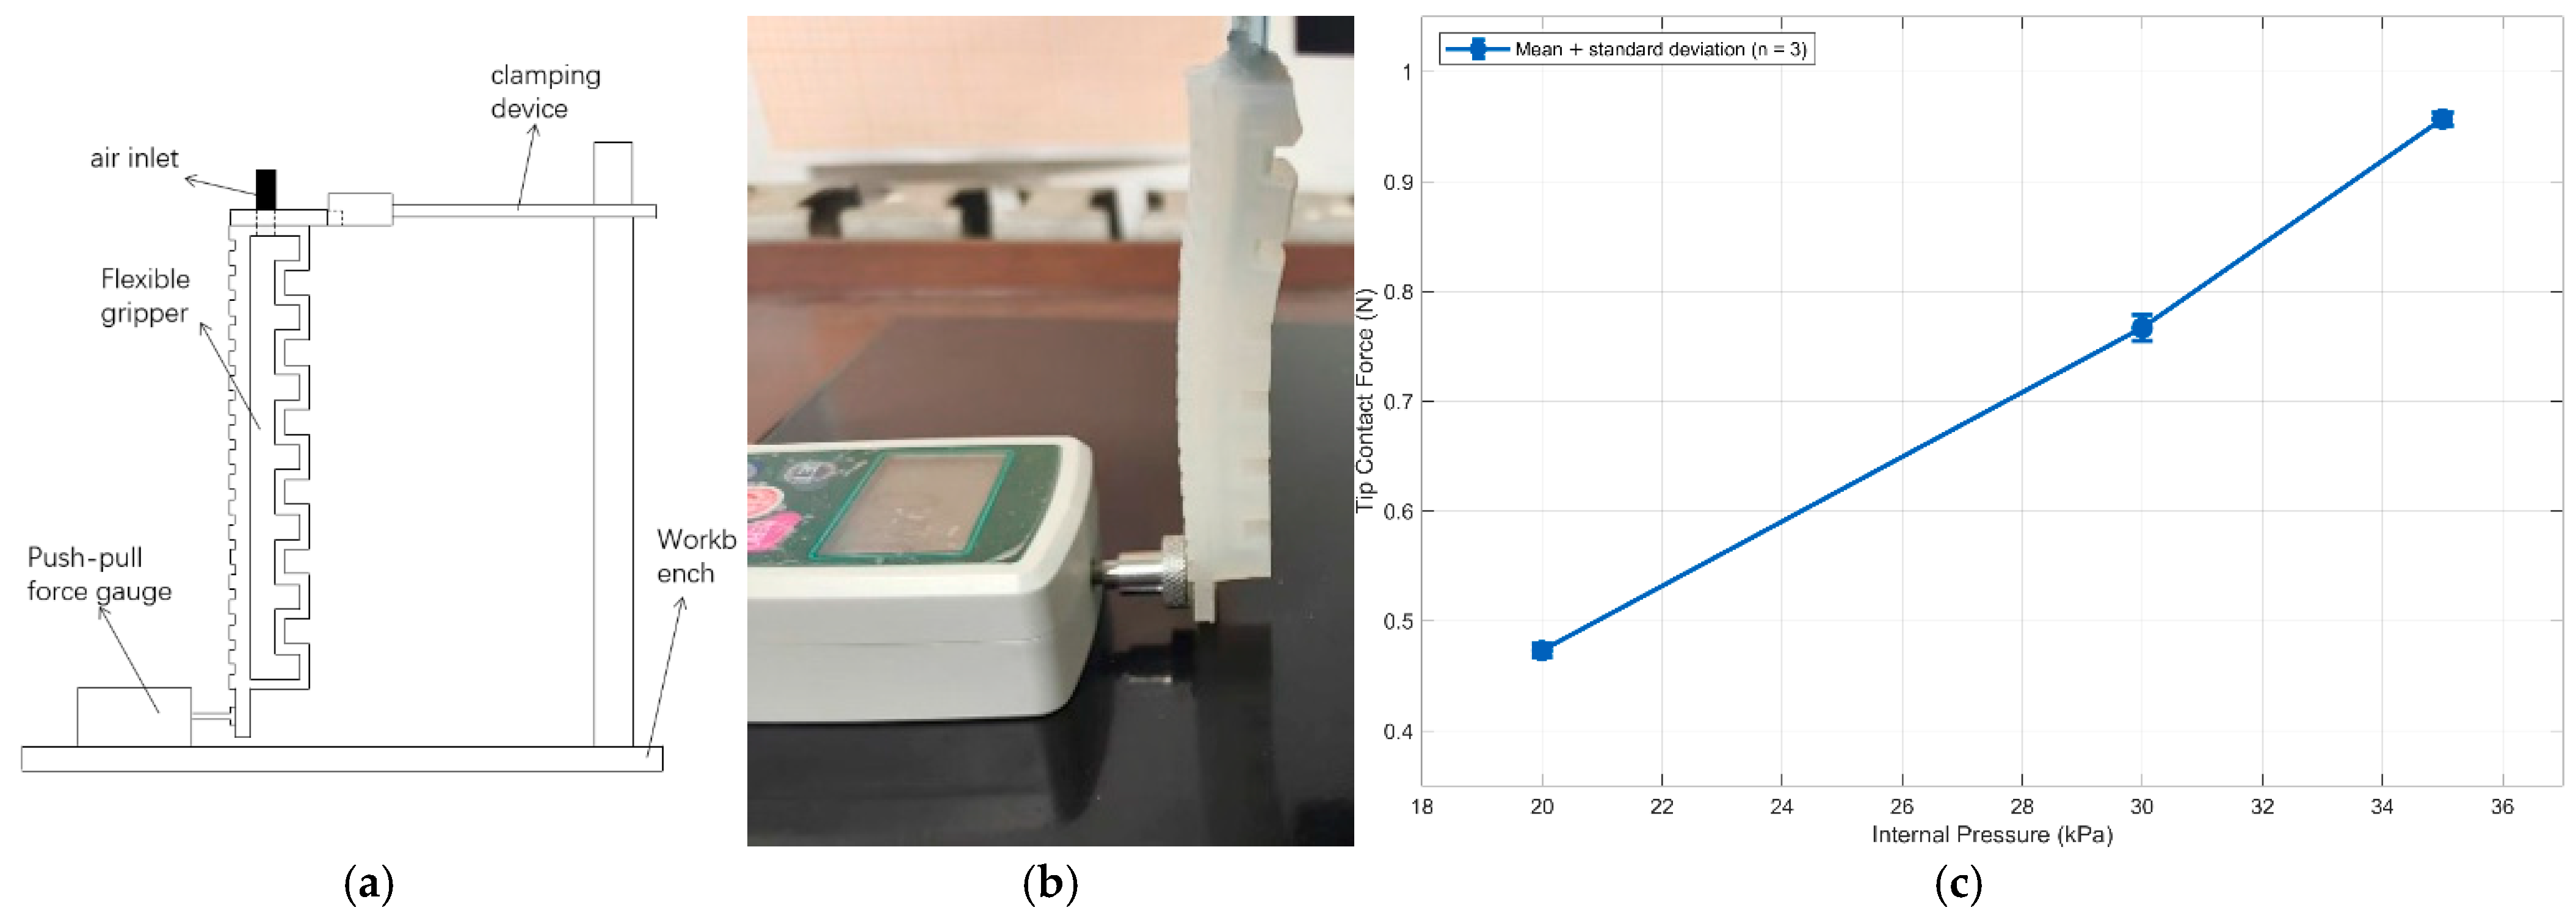
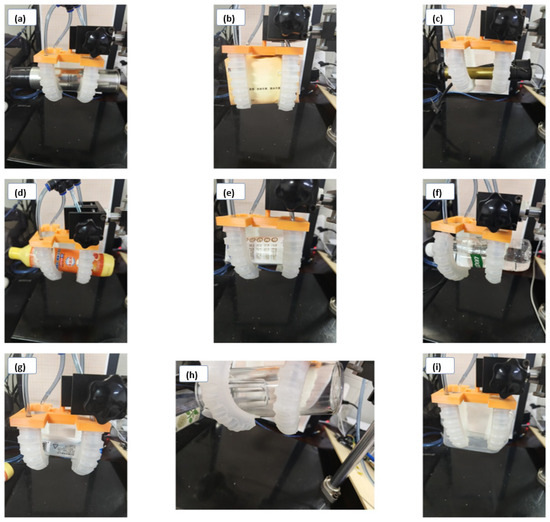
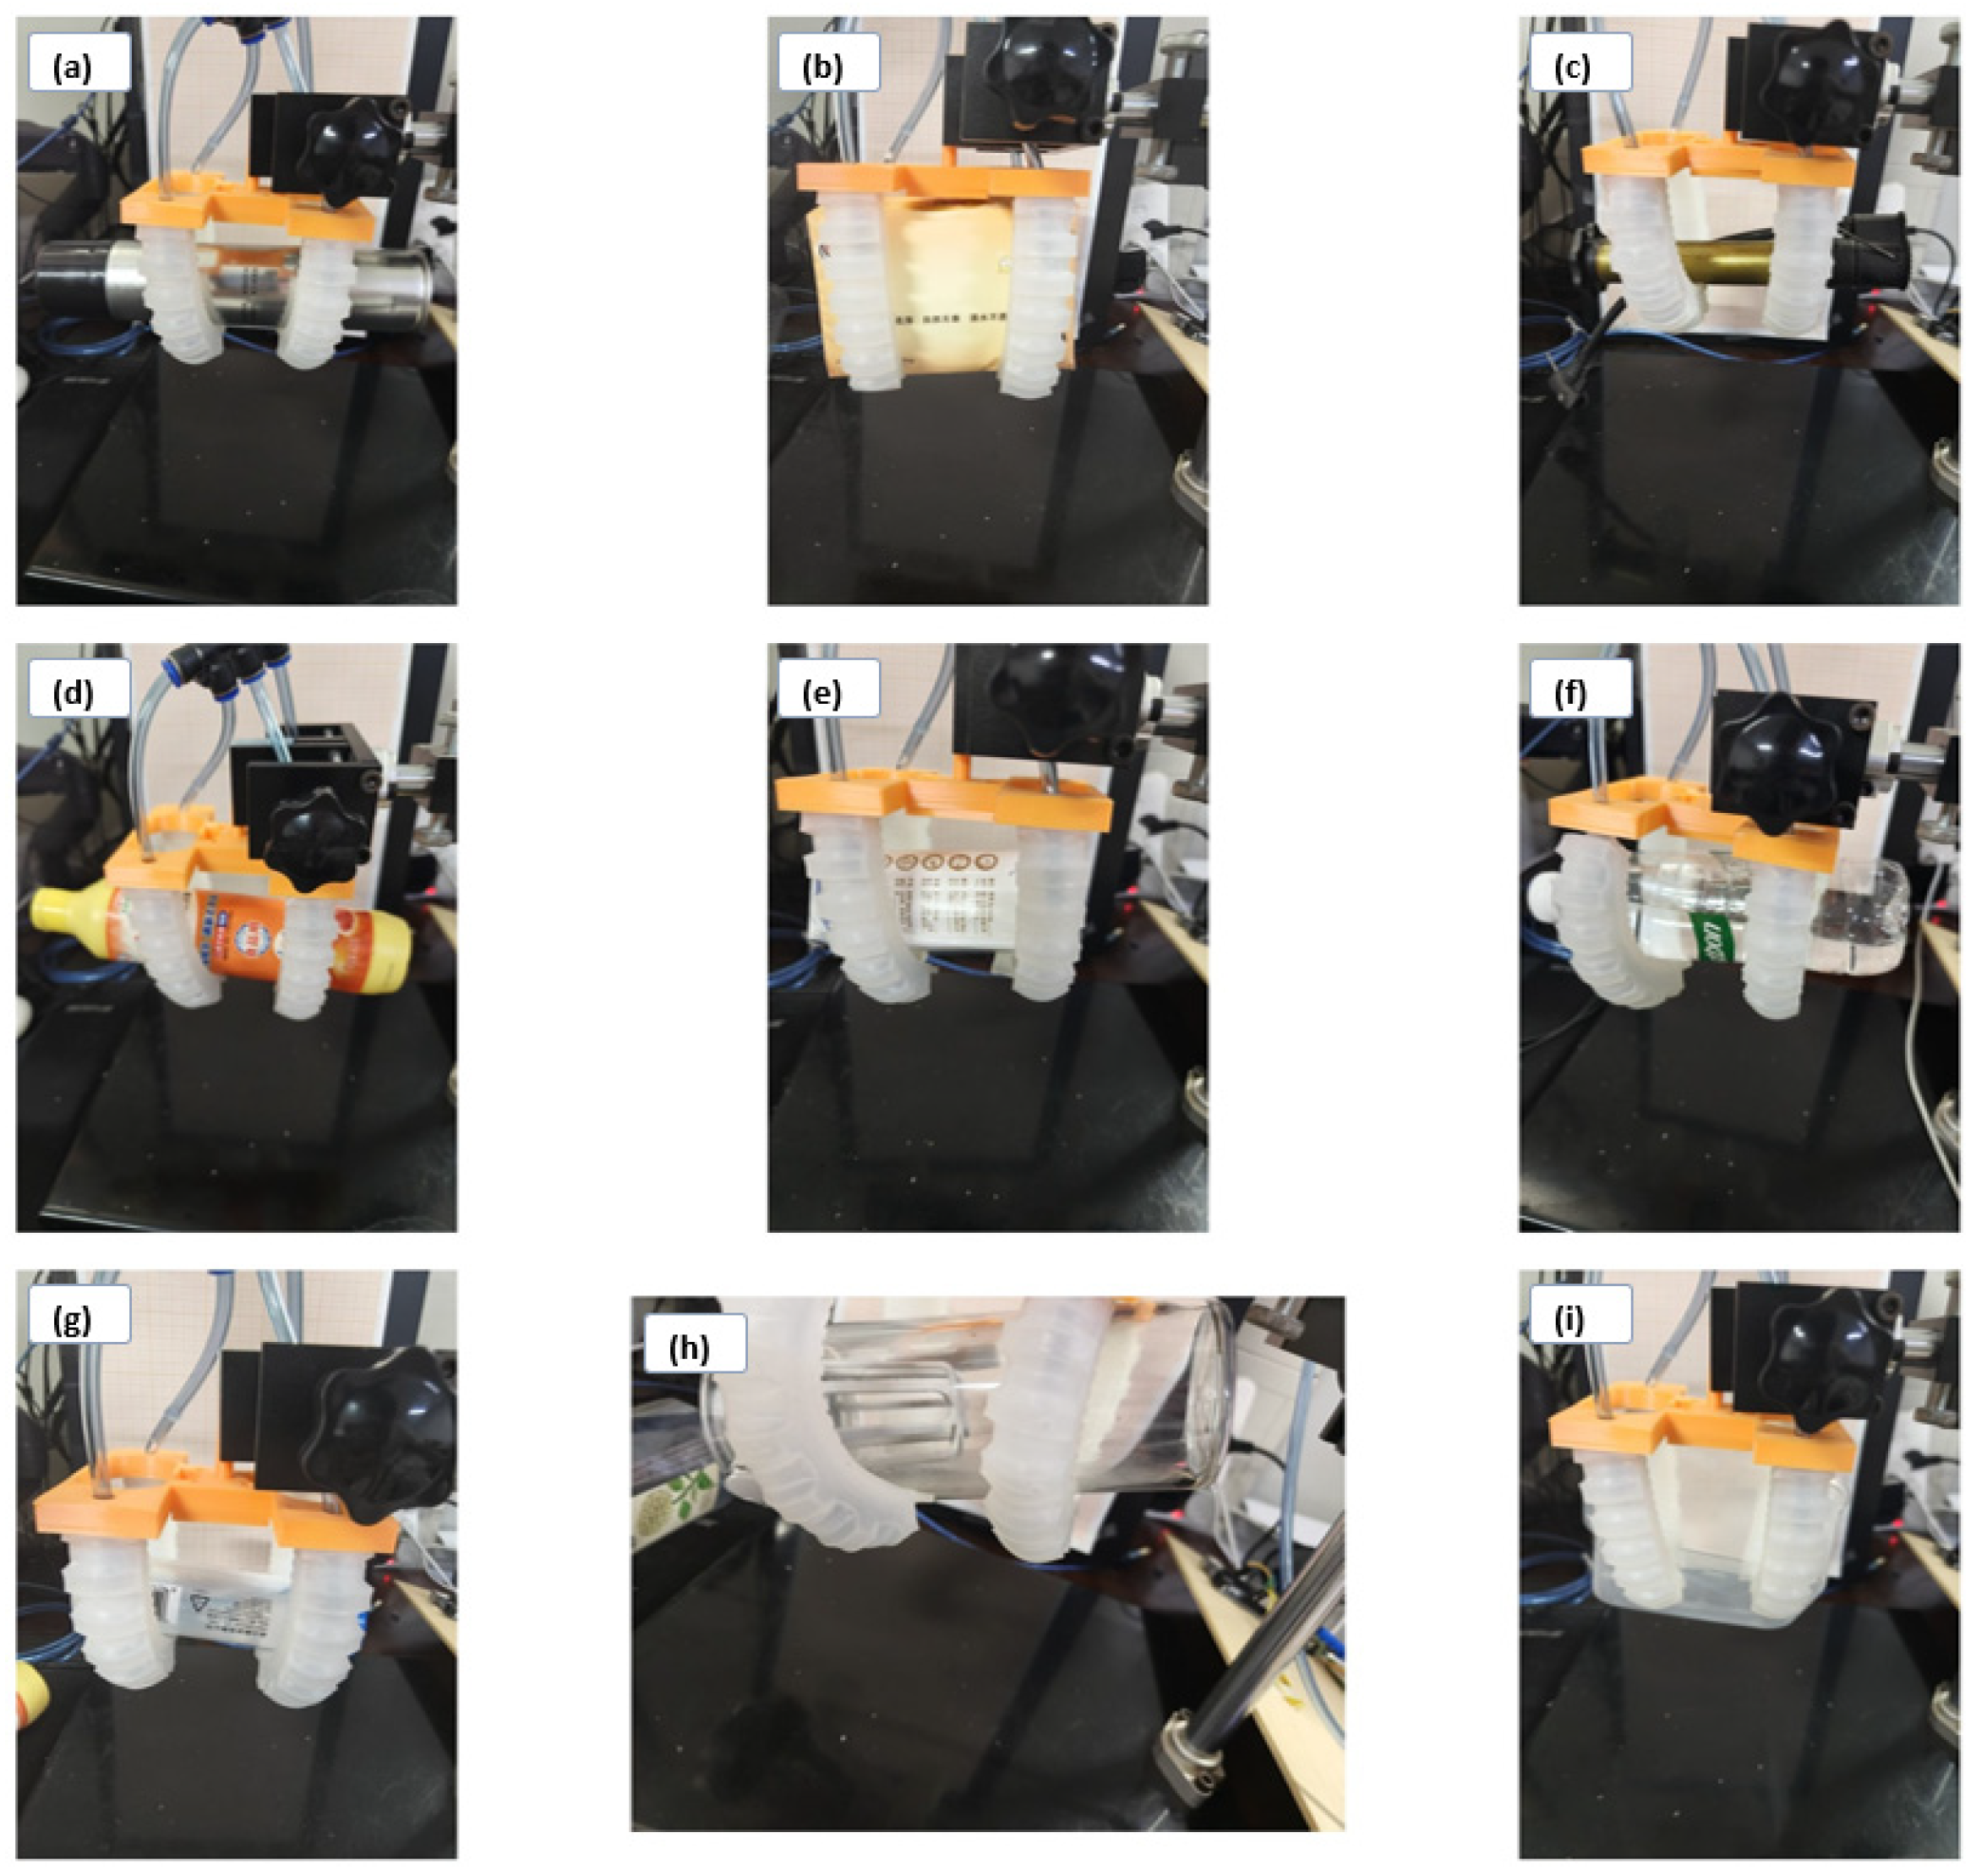
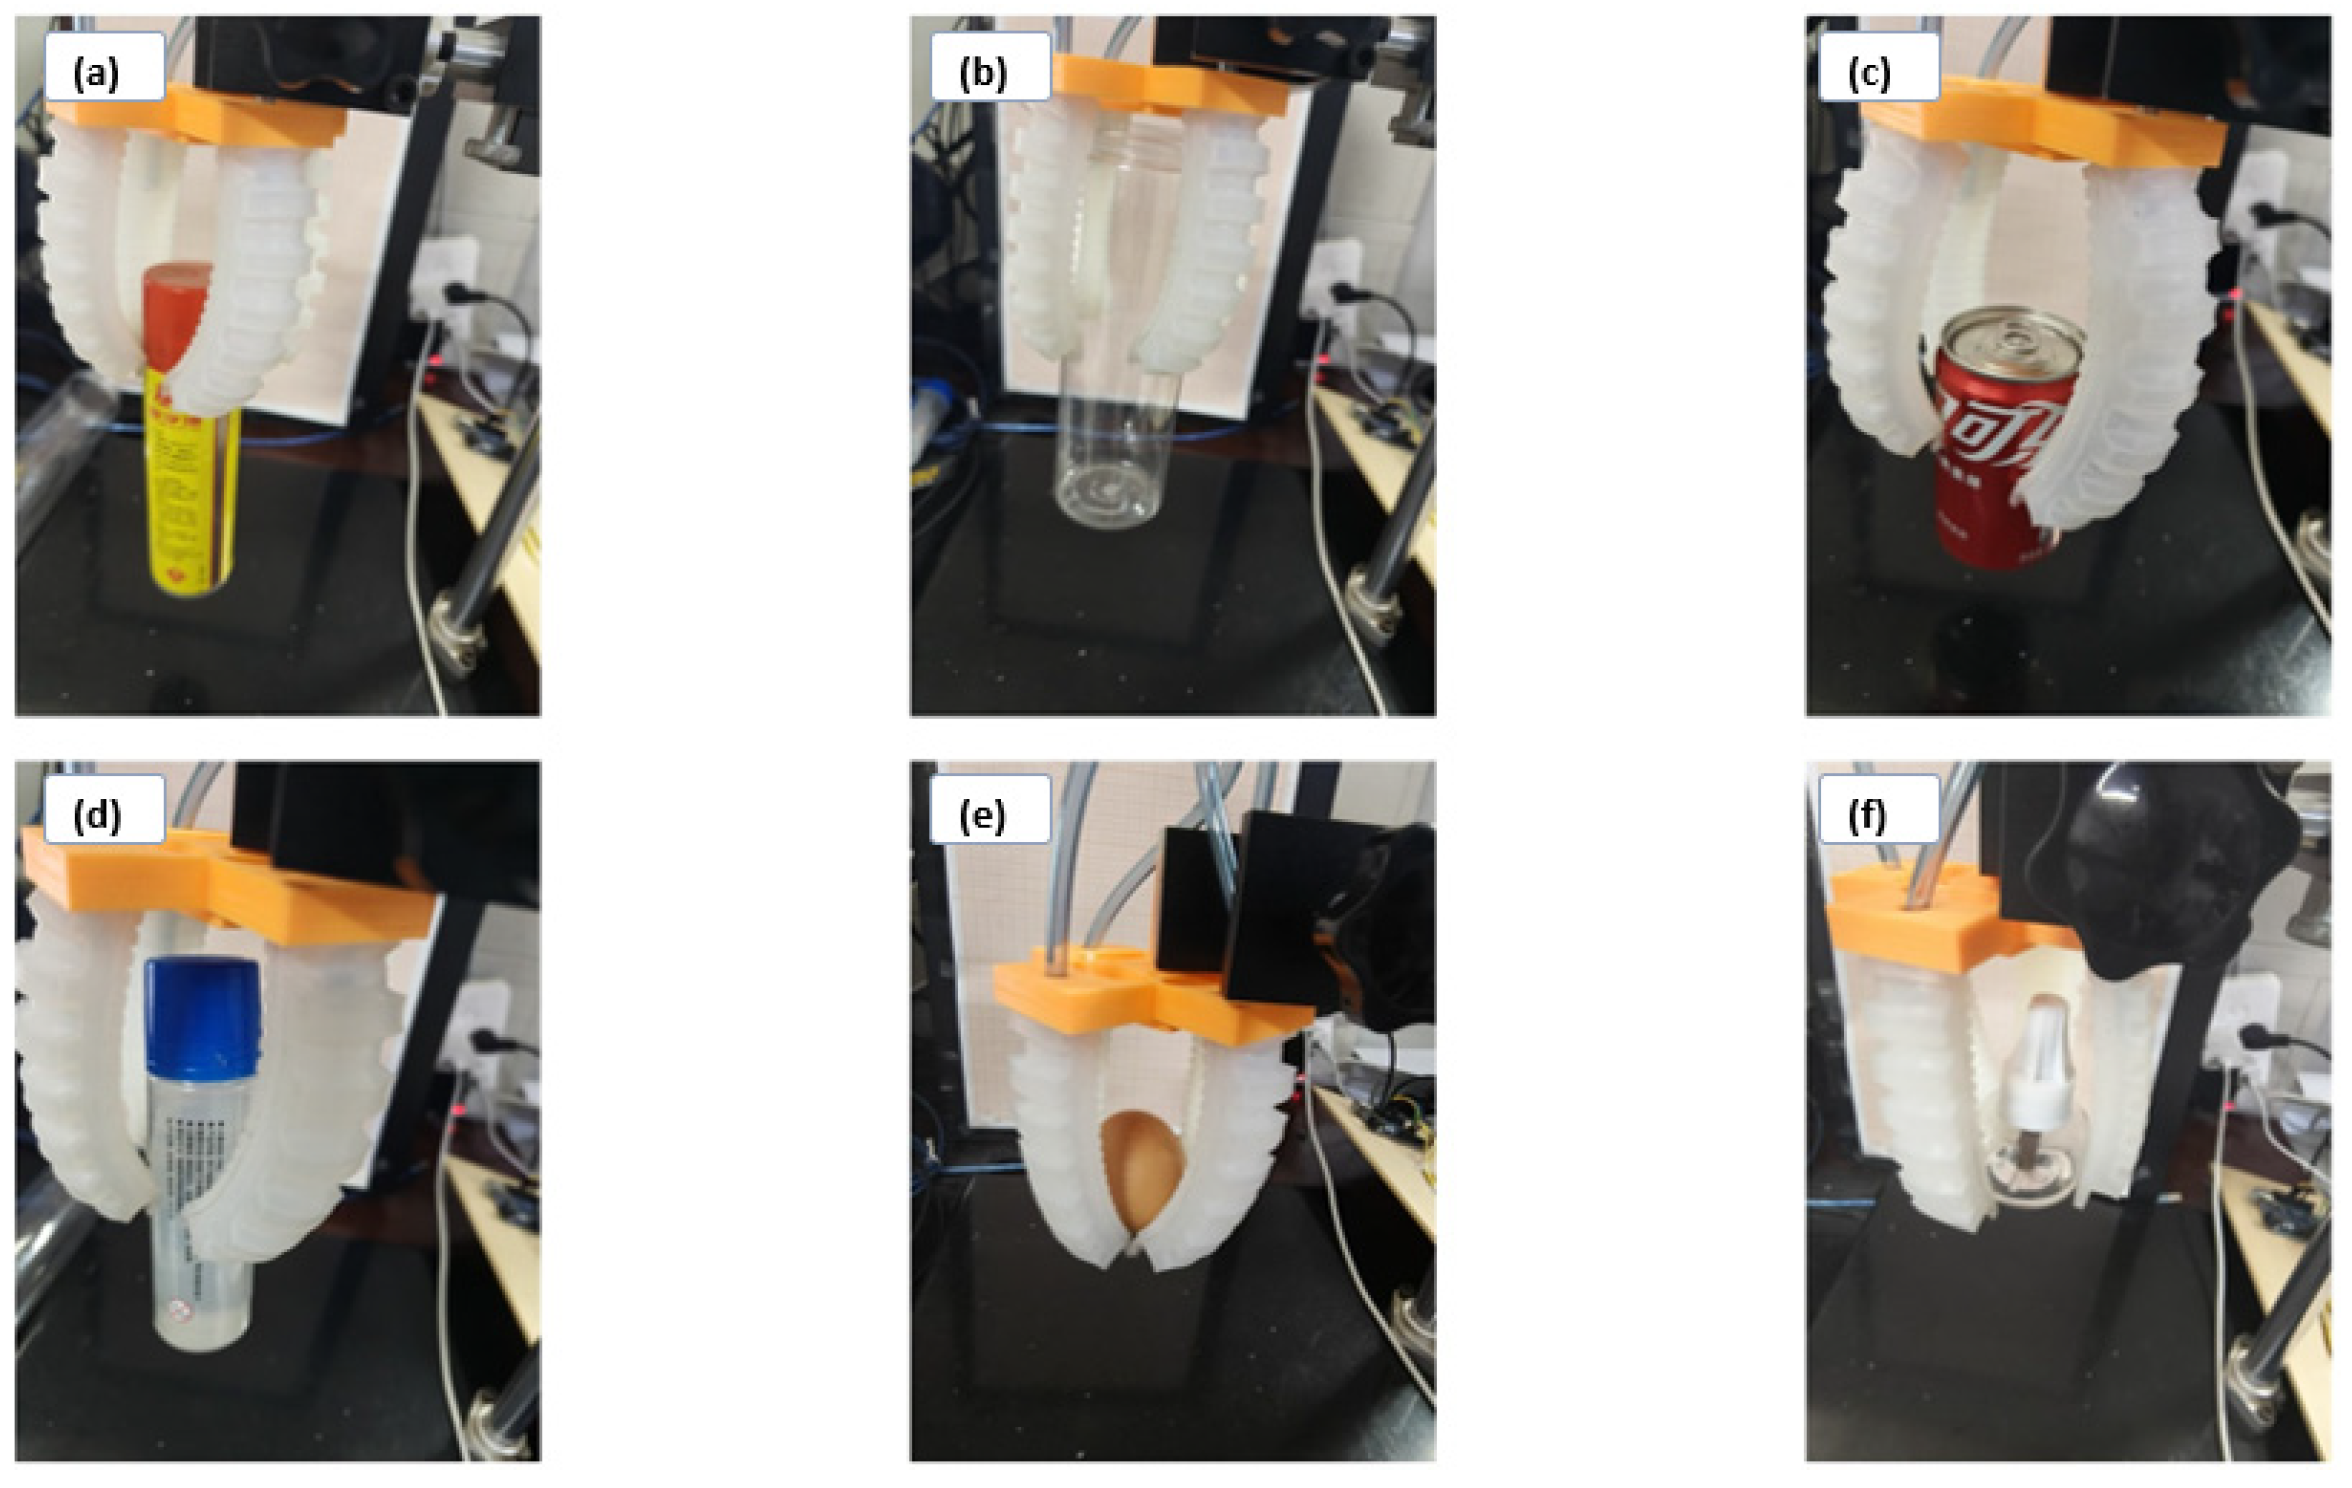

Disclaimer/Publisher’s Note: The statements, opinions and data contained in all publications are solely those of the individual author(s) and contributor(s) and not of MDPI and/or the editor(s). MDPI and/or the editor(s) disclaim responsibility for any injury to people or property resulting from any ideas, methods, instructions or products referred to in the content. |
© 2026 by the authors. Licensee MDPI, Basel, Switzerland. This article is an open access article distributed under the terms and conditions of the Creative Commons Attribution (CC BY) license.