


Abstract
Last-mile delivery robots frequently navigate pedestrian-rich local corridors, where sensing, tracking, communication, and computation delays can make pedestrian observations stale and degrade collision-risk estimation. This paper develops a delay-aware risk-adaptive model predictive control (MPC) pipeline that coordinates observation-age compensation and continuous multi-parameter adaptation in a common candidate-based planner. A normalized interaction-risk score jointly schedules the reference speed, pedestrian-avoidance weight, and motion-smoothness weight, enabling efficient motion in low-risk situations and progressively more conservative behavior as predicted risk increases. The method is evaluated through 800 performance simulations, including a 480-run main study over three pedestrian densities, four observation delays, and ten random seeds, a 240-run ablation study, and an 80-run 40 m extended-route evaluation. In the main study, the proposed method achieves a 100% goal-reaching rate, compared with 81.7% for the efficiency-oriented baseline, while reducing average collision count and collision duration by 61.5% and 74.8%, respectively, and increasing minimum robot–human distance by 55.9%. The corresponding collision-free run rate reaches 69.2%. Among successful runs, its mean completion time is 15.32 s, only 6.9% longer than the efficiency-oriented baseline. At a 1.0 s observation delay, the proposed method reduces collision count by 70.2% relative to the efficiency-oriented controller and by 49.9% relative to rule-based switching, while reducing absolute clearance-estimation error to 0.056 m under the tested prescribed pedestrian-motion model. Ablation results confirm that both delay compensation and adaptive weighting contribute to the improvement. On the 40 m extended route, the proposed controller retains a 100% goal-reaching rate and a 70% collision-free run rate. Its mean decision time and average run-wise 95th-percentile decision time are 58.28 ms and 74.21 ms, respectively, both below the 100 ms control period, indicating real-time potential without a measurable average computational penalty.
1. Introduction
The continued growth of e-commerce, on-demand logistics, and contactless services has accelerated the development of autonomous delivery robots as a potential solution for last-mile transportation. Compared with conventional delivery vehicles, small ground robots can operate on sidewalks and pedestrian-oriented facilities and may reduce the dependence on human couriers for short-distance deliveries [1,2]. Recent pilot deployments have further demonstrated that autonomous delivery services are technically feasible in campuses and urban pedestrian areas, while also revealing practical challenges associated with perception, communication, infrastructure, and interaction with surrounding road users [3,4]. Field observations show that delivery robots frequently share limited sidewalk space with pedestrians and cyclists, where crossing, overtaking, bottlenecks, and face-to-face encounters may create safety-critical interactions [5,6,7]. Moreover, recent route-planning studies emphasize that pedestrian congestion and uncertain sidewalk conditions can substantially affect delivery-robot efficiency [8]. These observations indicate that reliable local navigation in pedestrian-rich environments is a key enabling capability for practical last-mile robotic delivery. In an integrated logistics system, autonomous robots can support transportation between warehouses, distribution centers, local delivery hubs, and final delivery points. Pedestrian-aware local navigation is an essential component of reliable last-mile delivery operations.
Navigation around pedestrians is more challenging than conventional static-obstacle avoidance because human motion is interactive, uncertain, and governed by implicit social conventions. Human-aware navigation has, therefore, evolved from purely geometric collision avoidance toward approaches that explicitly consider comfort, social behavior, interaction, and uncertainty [9,10]. Recent reviews similarly identify motion prediction, socially compliant decision making, and standardized evaluation as central challenges that remain before social navigation can be deployed reliably in everyday environments [11]. Classical local navigation methods nevertheless remain important because of their computational efficiency and interpretability. Artificial potential fields generate obstacle-repulsive and goal-attractive actions [12], but can suffer from local minima and oscillatory behavior in constrained passages [13]. The dynamic window approach searches dynamically feasible velocity commands in real time [14], while reciprocal velocity-obstacle formulations coordinate collision avoidance in velocity space [15]. However, reactive or weakly predictive approaches can become inadequate in dense crowds, where robot freezing, unnecessary detours, or unsafe late reactions may emerge if human cooperation and future motion are not sufficiently anticipated [16].
Learning-based methods have consequently been investigated to represent complex human–robot interaction patterns that are difficult to encode using fixed geometric rules. Deep reinforcement learning has been applied to socially aware motion planning and collision avoidance in pedestrian-rich environments [17,18], while attention-based crowd representations allow the robot to reason selectively about nearby pedestrians [19]. Group-aware representations have also been introduced to capture correlated pedestrian motion in crowded environments [20]. In parallel, inverse reinforcement learning has been used to infer socially compliant navigation behavior from demonstrations rather than manually defining all social costs [21]. A recent review of deep-reinforcement-learning navigation methods confirms the increasing capability of learning-based navigation in dynamic and crowded scenes, but also highlights continuing concerns regarding generalization, training efficiency, safety assurance, and evaluation consistency [22]. For safety-critical delivery applications, these limitations motivate retaining an interpretable optimization structure in which robot constraints and safety–efficiency objectives remain explicit.
A related line of research focuses on pedestrian-motion prediction. Early analytical models such as the social-force model represent pedestrian motion through goal attraction and interaction forces [23]. Data-driven prediction later progressed from recurrent interaction models such as Social-LSTM [24] to multimodal generative prediction using Social-GAN [25]. Graph-based approaches such as Social-STGCNN model pedestrian interactions directly in a spatiotemporal graph [26], whereas Trajectron++ incorporates heterogeneous agents, dynamics, and contextual information into multimodal forecasting [27]. Transformer-based architectures such as AgentFormer further model temporal and social dependencies jointly across interacting agents [28]. Recent reviews continue to identify interaction modeling, multimodality, and long-horizon uncertainty as fundamental difficulties in pedestrian-behavior prediction [29], and interpretable interaction models have been proposed to make the predicted social modes more understandable [30]. These advances establish pedestrian prediction as an important component of human-aware planning, but prediction accuracy alone does not determine safe navigation; the controller must also decide how prediction uncertainty and changing interaction severity should modify robot behavior.
Model predictive control (MPC) provides a suitable framework for this purpose because it explicitly optimizes future robot motion while accounting for dynamic constraints and predicted obstacle evolution [31]. Interactive MPC has been used to jointly consider pedestrian intentions and crowd interactions when planning robot trajectories [32]. Safety-oriented variants combine MPC with dynamic control barrier functions to enforce collision-avoidance behavior around moving obstacles [33], while probabilistic formulations account for uncertainty propagation without relying exclusively on hard collision constraints [34]. Stochastic MPC has also been investigated for navigation around uncertain human motion, including feedback policies that reduce the effect of growing prediction uncertainty [35]. More recently, SICNav embeds an interactive pedestrian model directly into a bilevel MPC formulation [36], and uncertainty-aware constrained optimization has been systematically studied for social navigation in both simulation and real-world experiments [37]. Learning-based pedestrian predictors have likewise been integrated with MPC for physical crowd-navigation experiments [38]. Collectively, these works demonstrate that prediction-based MPC can provide an effective balance between explicit safety reasoning and anticipatory interaction handling. Compared with safety-constrained MPC using dynamic barrier functions, stochastic MPC that propagates forecast uncertainty, or socially interactive MPC that incorporates human responses, the present work focuses on a narrower operational problem: the age of the pedestrian state supplied to a lightweight local planner and how the corrected state should change its control preferences. The approach, therefore, addresses observation staleness and risk-dependent control preferences within a single interpretable local decision process.
Despite these advances, a practical issue that receives comparatively less attention is the age of the pedestrian information used by the controller. Real navigation pipelines include image acquisition, object detection, tracking, filtering, communication, and computation. Consequently, a pedestrian state delivered to the planner may represent an earlier physical state rather than the pedestrian’s position at the current control instant. Delayed measurements are known to degrade state estimation and navigation performance, and explicit delay compensation has been studied in mobile-robot estimation problems [39]. Recent event-based perception research similarly emphasizes that visual latency can directly affect human-centered robot navigation [40], while low-latency pedestrian detection remains an active topic in safety-critical robotic and autonomous systems [41]. For a crossing pedestrian, even a moderate delay can, therefore, make the controller overestimate the available clearance and initiate avoidance too late. This problem is distinct from conventional trajectory-prediction uncertainty: even a reasonable motion model may produce a systematically biased current-state estimate if its prediction starts from a stale observation.
A second limitation is that many local navigation controllers use fixed safety and efficiency parameters. An aggressive parameter set can be appropriate when pedestrian clearance is large and the observation is recent, but the same setting may remain excessively fast when stale information and short predicted clearance increase interaction risk. Conversely, a permanently conservative parameterization can unnecessarily increase travel time in benign situations. Discrete switching between efficient and conservative modes partially addresses this issue, but binary transitions cannot naturally represent continuously varying interaction severity and may introduce abrupt behavior changes. These observations motivate a controller that explicitly compensates pedestrian-observation delay and continuously adjusts multiple MPC parameters using a common measure of predicted interaction risk.
Accordingly, this paper proposes a delay-aware risk-adaptive model predictive control method for last-mile delivery-robot navigation in pedestrian corridors. Delayed pedestrian observations are first propagated to the current control instant using short-term motion prediction. The resulting predicted robot–human interaction is then mapped to a normalized risk variable, which jointly schedules the reference speed, pedestrian-avoidance weight, and motion-smoothness weight. The controller, therefore, remains close to an efficiency-oriented configuration when the predicted interaction is benign and progressively transitions toward a slower and more conservative configuration as risk increases.
The main contributions of this work are summarized as follows:
- A delay-aware pedestrian-interaction formulation is introduced for local delivery-robot navigation. By propagating stale pedestrian observations toward the current control instant before MPC evaluation, the method directly addresses the clearance-estimation bias caused by observation delay.
- A continuous multi-parameter risk-adaptation mechanism is developed. A single normalized interaction-risk variable jointly reduces the reference forward speed and increases the pedestrian-avoidance and motion-smoothness weights, producing a gradual safety–efficiency transition rather than relying on a fixed parameter set or discrete mode switching.
- The physical mechanism behind the improvement is explicitly evaluated using the error between controller-estimated and true minimum robot–human clearance. This analysis distinguishes the benefit of delay compensation from a simple increase in obstacle-avoidance conservatism.
- The controller is evaluated through 800 performance simulations, including 480 main corridor runs covering three pedestrian densities, four observation delays, and ten random seeds, 240 component-ablation runs, and 80 runs on a 40 m extended delivery-route scenario. The evaluation separately considers goal reaching, collision safety, successful-run efficiency, delay robustness, ablation behavior, route-level generalization, and computational cost.
The key methodological contribution is the coordinated observation-compensation and risk-scheduling pipeline: estimated pedestrian states are corrected for their age before a common interaction measure continuously adjusts progress, avoidance and command-variation preferences in a constrained candidate search.
The remainder of this paper is organized as follows. Section 2 formulates the pedestrian-corridor navigation problem and delayed pedestrian observations. Section 3 presents the delay-aware risk-adaptive MPC formulation. Section 4 describes the simulation design, baselines, ablation variants, and extended-route evaluation. Section 5 reports the quantitative results, Section 6 discusses the implications and limitations, and Section 7 concludes the paper.
2. Problem Formulation
2.1. Local Pedestrian-Corridor Navigation
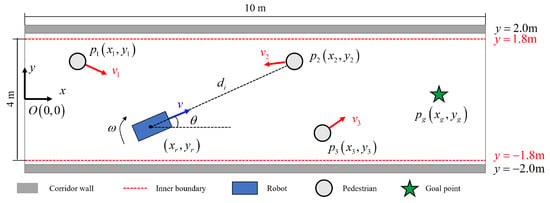
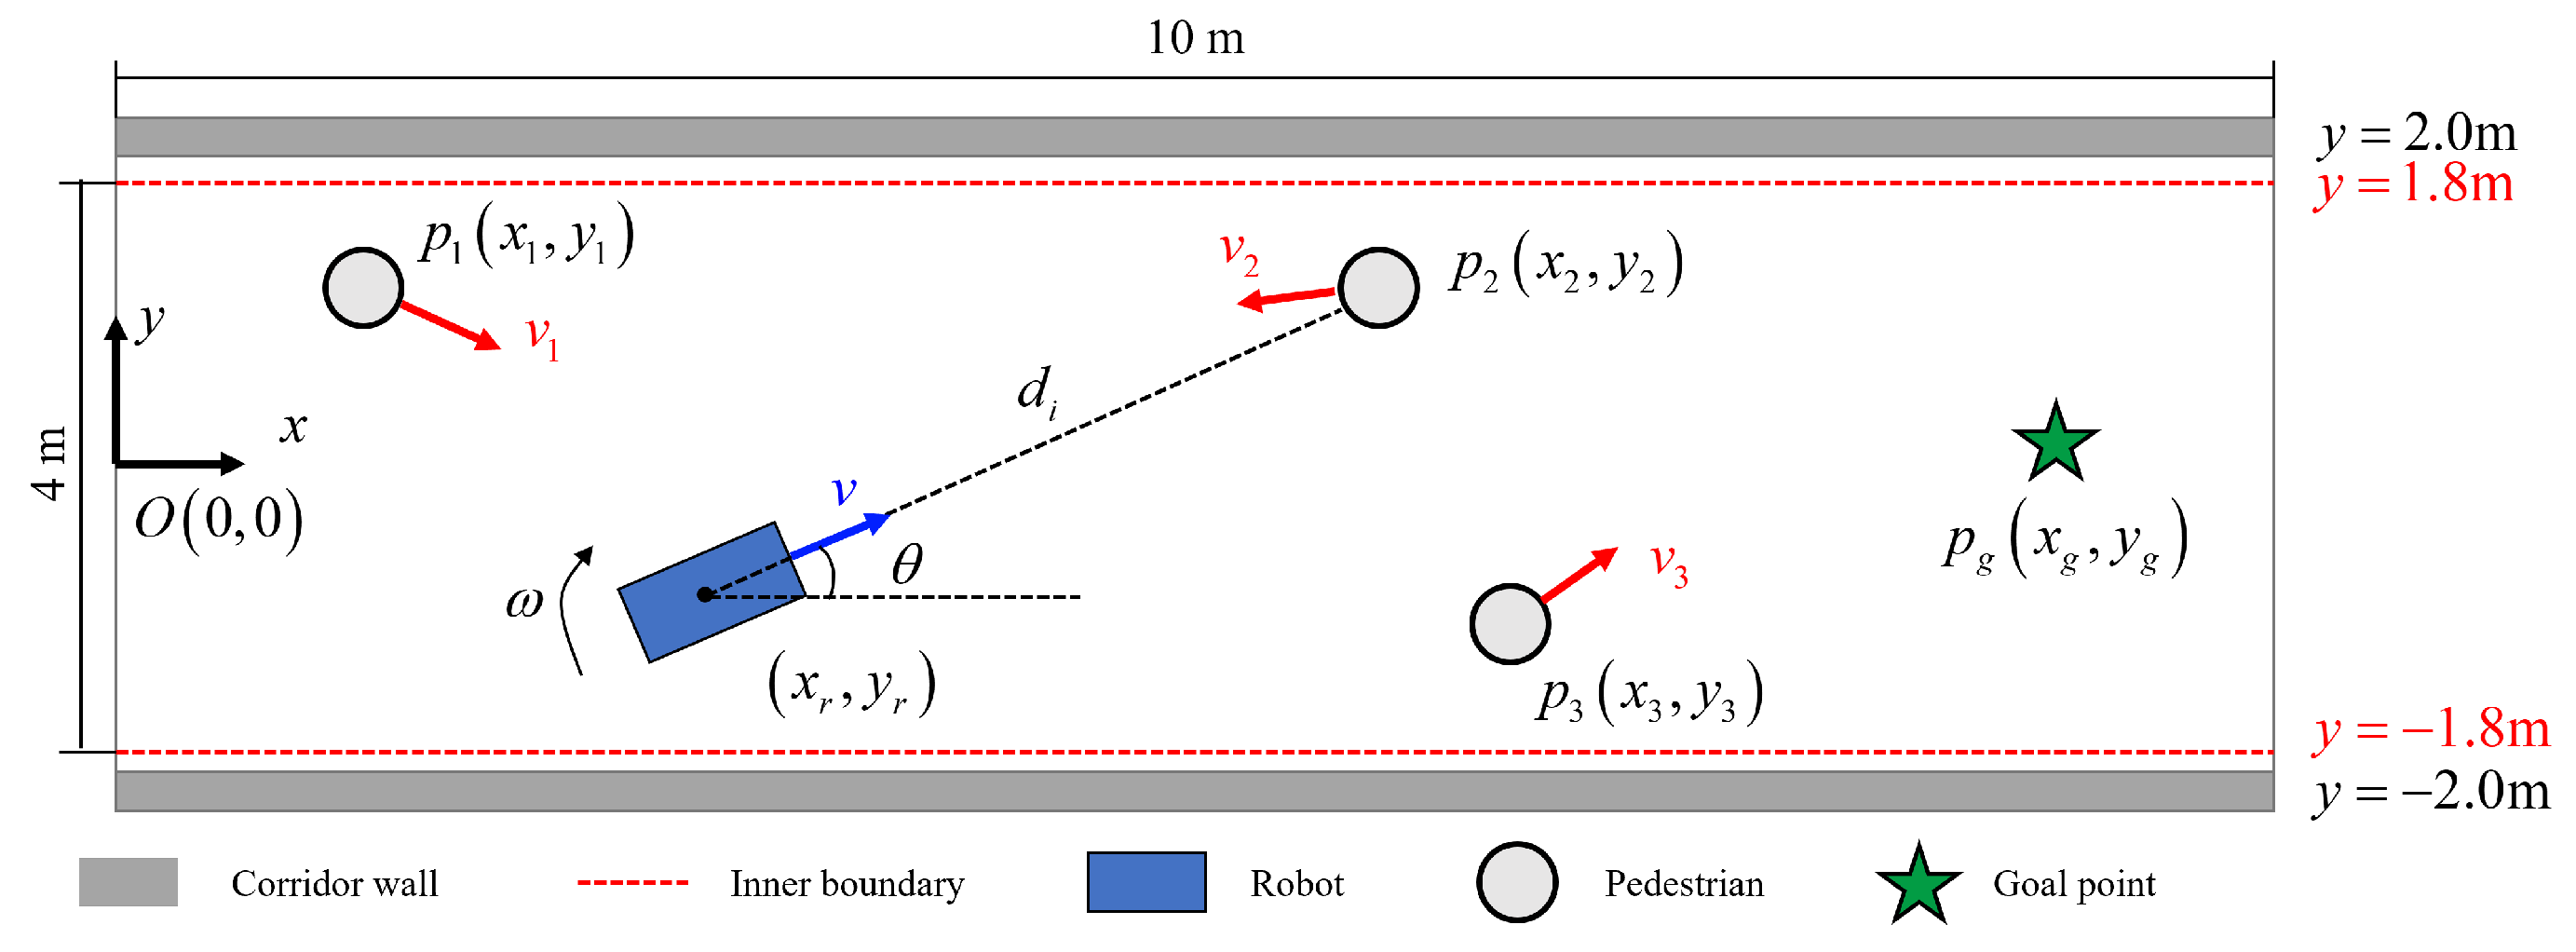
The main evaluation considers a local corridor segment representative of the pedestrian-interaction portions of a last-mile delivery task. A global Cartesian coordinate frame is defined with the x-axis aligned with the corridor direction and the y-axis pointing laterally. The corridor is 10 m long and 4 m wide, with the nominal lateral envelope
The envelope is implemented through soft boundary penalties rather than a strict hard-feasibility constraint; an inner edge margin is activated at m, while excursions beyond m receive a substantially larger quadratic penalty. The robot starts near and navigates toward a goal near . A run is considered goal-reaching when the Euclidean distance from the robot to the nominal goal becomes smaller than 0.3 m. Three pedestrian densities are used: low, medium, and high, corresponding to 3, 5, and 8 pedestrians, respectively. The local corridor is intentionally short so that the density–delay combinations can be repeated with identical statistical structure. A separate 40 m route is introduced later to test whether the conclusions remain valid over multiple consecutive interaction zones.
Figure 1 shows the corridor-fixed Cartesian coordinate frame, the robot pose, the nominal lateral boundaries, pedestrian motion, and the goal. The heading is measured counterclockwise from the positive x-axis; are commands expressed in the robot body frame. The distance represents the Euclidean center-to-center distance between the robot and pedestrian i, which is used in the pedestrian-interaction evaluation.
Figure 1.
Geometry and coordinate definitions for local pedestrian-corridor navigation (schematic, not an experimental trajectory).
The robot state is defined as
where and denote the longitudinal and lateral positions, respectively, and denotes the robot heading angle. The robot position is denoted by
The control command is
where and denote the commanded linear and angular velocities, respectively. A low-speed unicycle model is used for candidate prediction,
with a control interval of s. This sampling interval provides a 10-Hz replanning frequency and allows the four evaluated observation delays to be represented by integer numbers of control steps. Together with the 15-step prediction horizon, it gives a 1.5 s look-ahead window. The command maps to global-position increments through the heading-dependent kinematic equations above. A low-speed velocity-tracking base is assumed, while wheel dynamics and command-following errors are not included. The input constraints are m/s and rad/s.
2.2. Delayed Pedestrian Observation
For pedestrians, let and denote the true position and velocity of pedestrian at time step k. The observation delay is written as
where denotes the delay measured in discrete control intervals. The controller, therefore, receives the stale position
The main experiments use s, corresponding to 0, 3, 6, and 10 control intervals. Directly treating as the current pedestrian position can produce a large discrepancy between the clearance perceived by the controller and the true robot–human clearance.
The navigation problem is, therefore, to choose a receding-horizon robot command that (i) reaches the goal, (ii) maintains adequate separation from moving pedestrians despite delayed observations, (iii) accounts for the corridor geometry and penalizes boundary excursions, and (iv) avoids unnecessary loss of efficiency and excessive control variation.
3. Delay-Aware Risk-Adaptive MPC
3.1. Delay Compensation and Short-Term Pedestrian Prediction
A velocity estimate is obtained from recent pedestrian observations. The delayed position is first projected from its observation time toward the current control instant,
A short-horizon constant-velocity prediction is then formed as
where N denotes the prediction-horizon length in discrete control steps. This intentionally lightweight predictor isolates the effect of observation delay without introducing a separately trained pedestrian-motion model. The simulated pedestrians follow constant-speed motion segments with endpoint reversals, providing a consistent setting for evaluating delay compensation and short-term pedestrian prediction.
For a candidate robot trajectory , the predicted robot–pedestrian clearance is
and the most critical predicted clearance is
3.2. Interaction Risk
The risk score is computed once per control cycle from the compensated current pedestrian states. Let denote the nearest pedestrian and the corresponding center-to-center distance. The nonnegative relative closing speed is calculated as
where is the current robot velocity in the global coordinate frame and . The implemented risk combines proximity, closing motion, and the number of pedestrians:
Here ; becomes unity at a 0.5 m separation and zero at or beyond 3.0 m. The closing-speed contribution saturates at 0.8 m/s, and the crowd-size contribution saturates at eight pedestrians. When there are no tracked pedestrians, is set to zero. The known observation delay affects through the timestamp-compensated pedestrian states in Equation (8), rather than through a separate explicit delay-risk term.
The normalized interaction risk is used to continuously schedule the reference speed, pedestrian-avoidance weight, and motion-smoothness weight as
For the numerical settings used here, m/s, , and , giving ranges m/s, , and , respectively.
3.3. Candidate-Based MPC Objective
At each control cycle, the planner considers seven linear-velocity values and 13 angular-velocity values, yielding 91 candidate commands. For a candidate , the same command is propagated for steps ( s) with Equation (5); only the first 0.1 s command interval is executed before replanning. The angular grid spans rad/s in 0.2-rad/s increments. The adaptive linear grid is , with m/s; the fixed-parameter baselines use .
The implemented candidate objective comprises goal progress, speed preference, pedestrian avoidance, control regularization, and corridor compliance:
The running and terminal goal costs and the proposed controller’s risk-conditioned speed preference are
The fixed-parameter controllers instead use the base speed term . The pedestrian penalty is explicitly
The exponential penalty decays with predicted center distance in meters; the additional coefficient 1000 penalizes short clearance independently of . Neither term is a hard collision-avoidance constraint.
Since each candidate command is held constant over its predicted horizon, the regularization is evaluated against the previously executed command , rather than between identical within-horizon candidate controls:
The final longitudinal control-change term is used by the adaptive implementation; it is not included in the fixed-parameter baseline objective. This formulation captures control updates between adjacent executed time steps; a within-rollout difference penalty would be zero for a constant candidate command.
For the corridor term, let
where m and m, and define the inner-edge excess as
The implemented soft corridor penalty is
where
and denotes the indicator function.
The inner edge m creates a 0.2 m warning buffer inside the nominal m corridor bounds; it is not an additional physical wall. The coefficient 10 penalizes entry into this buffer, while coefficients 20 and 200 penalize actual boundary exceedance, with the larger penalty activated after 0.05 m of overshoot. The boundary costs remain soft to keep the finite candidate search defined during constrained interactions. These are simulation design settings, not parameters calibrated against an observed physical sidewalk.
The candidate yielding the minimum prediction cost is selected, and its first control input is applied to the robot. The optimization is repeated at the next sampling instant in a receding-horizon manner.
The receding-horizon implementation of the proposed controller is summarized in Algorithm 1.
| Algorithm 1 Delay-Aware Risk-Adaptive Candidate-Based MPC |
Require: Robot state , delayed pedestrian observations , observation delay Ensure: Applied control command 1: Estimate pedestrian velocities 2: Compensate delayed pedestrian positions using Equation (8) 3: Predict pedestrian motion over the horizon using Equation (9) 4: Compute from the compensated current pedestrian states using Equation (12) 5: Update , , and using Equation (13) 6: Generate the 91 feasible velocity-command candidates 7: for each candidate control do 8: Propagate the candidate robot trajectory using Equation (5) 9: Evaluate the candidate objective using Equation (14) 10: end for 11: Select the candidate with the minimum prediction cost 12: Apply its first control command as 13: Advance to the next control step |
4. Simulation Experiments
4.1. Experimental Design
Three complementary experiments are performed. The first is a systematic local-corridor evaluation with four main controllers. The second removes individual components of the proposed method to determine whether delay compensation and risk-adaptive weighting both contribute to the observed performance. The third extends the route length to 40 m and introduces three consecutive interaction zones to test whether the local controller remains effective over a longer delivery-like passage. Table 1 summarizes the experimental design. The same 0.3 m goal-reaching tolerance is used in both the 10 m corridor and the 40 m extended route.
Table 1.
Simulation design and evaluation scope.
4.2. Compared Controllers and Ablation Variants
In the main corridor, pedestrian speeds are uniformly sampled from 0.5 to 1.2 m/s. Each agent follows two endpoints: with probability 0.7, it crosses between and m at m; otherwise, it travels longitudinally from to m at m. Initial travel direction is equiprobable, and the target switches when the pedestrian is within 0.3 m of its current endpoint. These prescribed agents do not reactively yield to the robot. The same seed values (0–9) and density–delay combinations are used by all four controllers. This controlled generator facilitates matched comparisons but cannot establish robustness to unconstrained human motion.
The four main methods share the same robot model, pedestrian scenarios, and candidate-evaluation structure; their difference is how aggressively safety and efficiency are weighted.
- Efficient: an efficiency-oriented fixed parameterization corresponding to weak pedestrian avoidance and a high forward-speed preference .
- Safe: a conservative fixed parameterization with strong pedestrian avoidance and reduced speed preference .
- Switching: a rule-based controller that switches discretely between efficiency-oriented and conservative parameterizations according to the local risk state. It uses the efficient tuple for , the intermediate tuple for , and the safe tuple for .
- Proposed: the delay-aware controller that continuously schedules the three parameters in Equation (13).
Two ablation variants are additionally evaluated. No Delay Awareness retains the adaptive controller structure but uses delayed pedestrian observations without delay compensation. Fixed Weight retains the risk-dependent reference speed and the same candidate-search structure but holds the pedestrian-avoidance and motion-smoothness weights at and , the respective midpoints of their adaptive ranges. Both ablations use identical density, delay, and seed combinations to the Proposed runs. These comparisons assess delay compensation and the combined effect of weight adaptation; they do not isolate each scheduled parameter separately.
All compared controllers operate under identical robot models, pedestrian scenarios, and observation-delay conditions. This experimental design enables a direct evaluation of fixed-parameter control, discrete risk-based switching, and continuous multi-parameter adaptation, thereby highlighting the effects of the proposed delay-aware risk-adaptive formulation.
4.3. Extended Delivery Route
The extended route is 40 m long and uses the same nominal m lateral envelope and 0.3 m goal-reaching tolerance as the local corridor. Three consecutive pedestrian-interaction regions are introduced: a lower-density interaction zone at approximately –12 m, a cross-flow region at –26 m, and a high-interaction bottleneck at –38 m. The four main controllers are evaluated at 0.3 s and 1.0 s observation delays using ten seeds, resulting in 80 runs.
4.4. Evaluation Metrics
The analysis distinguishes task completion from collision safety. The goal-reaching rate is
where counts runs that enter the 0.3 m terminal region before the timeout. The collision-free run rate is
where denotes the number of runs with zero collision events, irrespective of whether the goal is reached. Because a run may reach the goal after a short collision, and quantify different aspects of performance and are reported separately.
A collision event is operationally defined as a time interval in which the simulated robot–pedestrian center distance falls below 0.4 m. It is a geometric proximity-threshold event, not a measured physical impact or a guarantee about the shapes of real robots and pedestrians. Consequently, a run may both reach the goal and contain one or more such events. The average event count and accumulated event duration quantify frequency and persistence. The true minimum human clearance is
To avoid mixing task failure with navigation speed, completion-time comparisons use the mean time of successful runs only,
where denotes the set of successful runs. This prevents timeout values from artificially making an unsuccessful controller appear slow.
The run-wise minimum clearance is . To evaluate current-state estimation rather than a horizon minimum against a run minimum, define the estimated and true nearest-pedestrian distances at the same control instant:
The signed and absolute clearance-estimation errors are
A positive signed value indicates overestimated clearance. Main-study controllers use matched density–delay–seed cases, so paired performance contrasts can be evaluated without changing the test scenarios. Unless otherwise stated, error bars on the original plots denote SEM; Table 2 reports sample standard deviations. For matched-method uncertainty intervals we use a 10,000-resample seed-block bootstrap, keeping each seed’s 12 density–delay combinations together.
Table 2.
Overall results over 480 main-corridor runs. Continuous metrics are mean ± sample standard deviation; task time includes successful runs only.
5. Results
5.1. Overall Performance in the Local Corridor
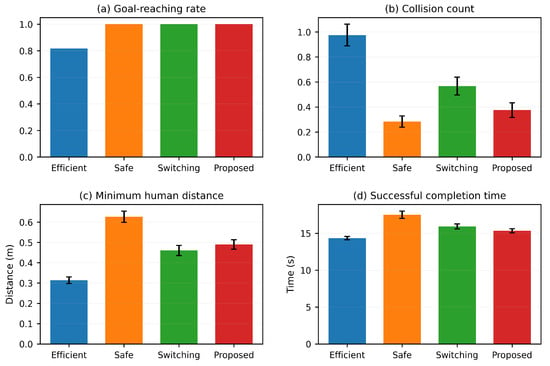
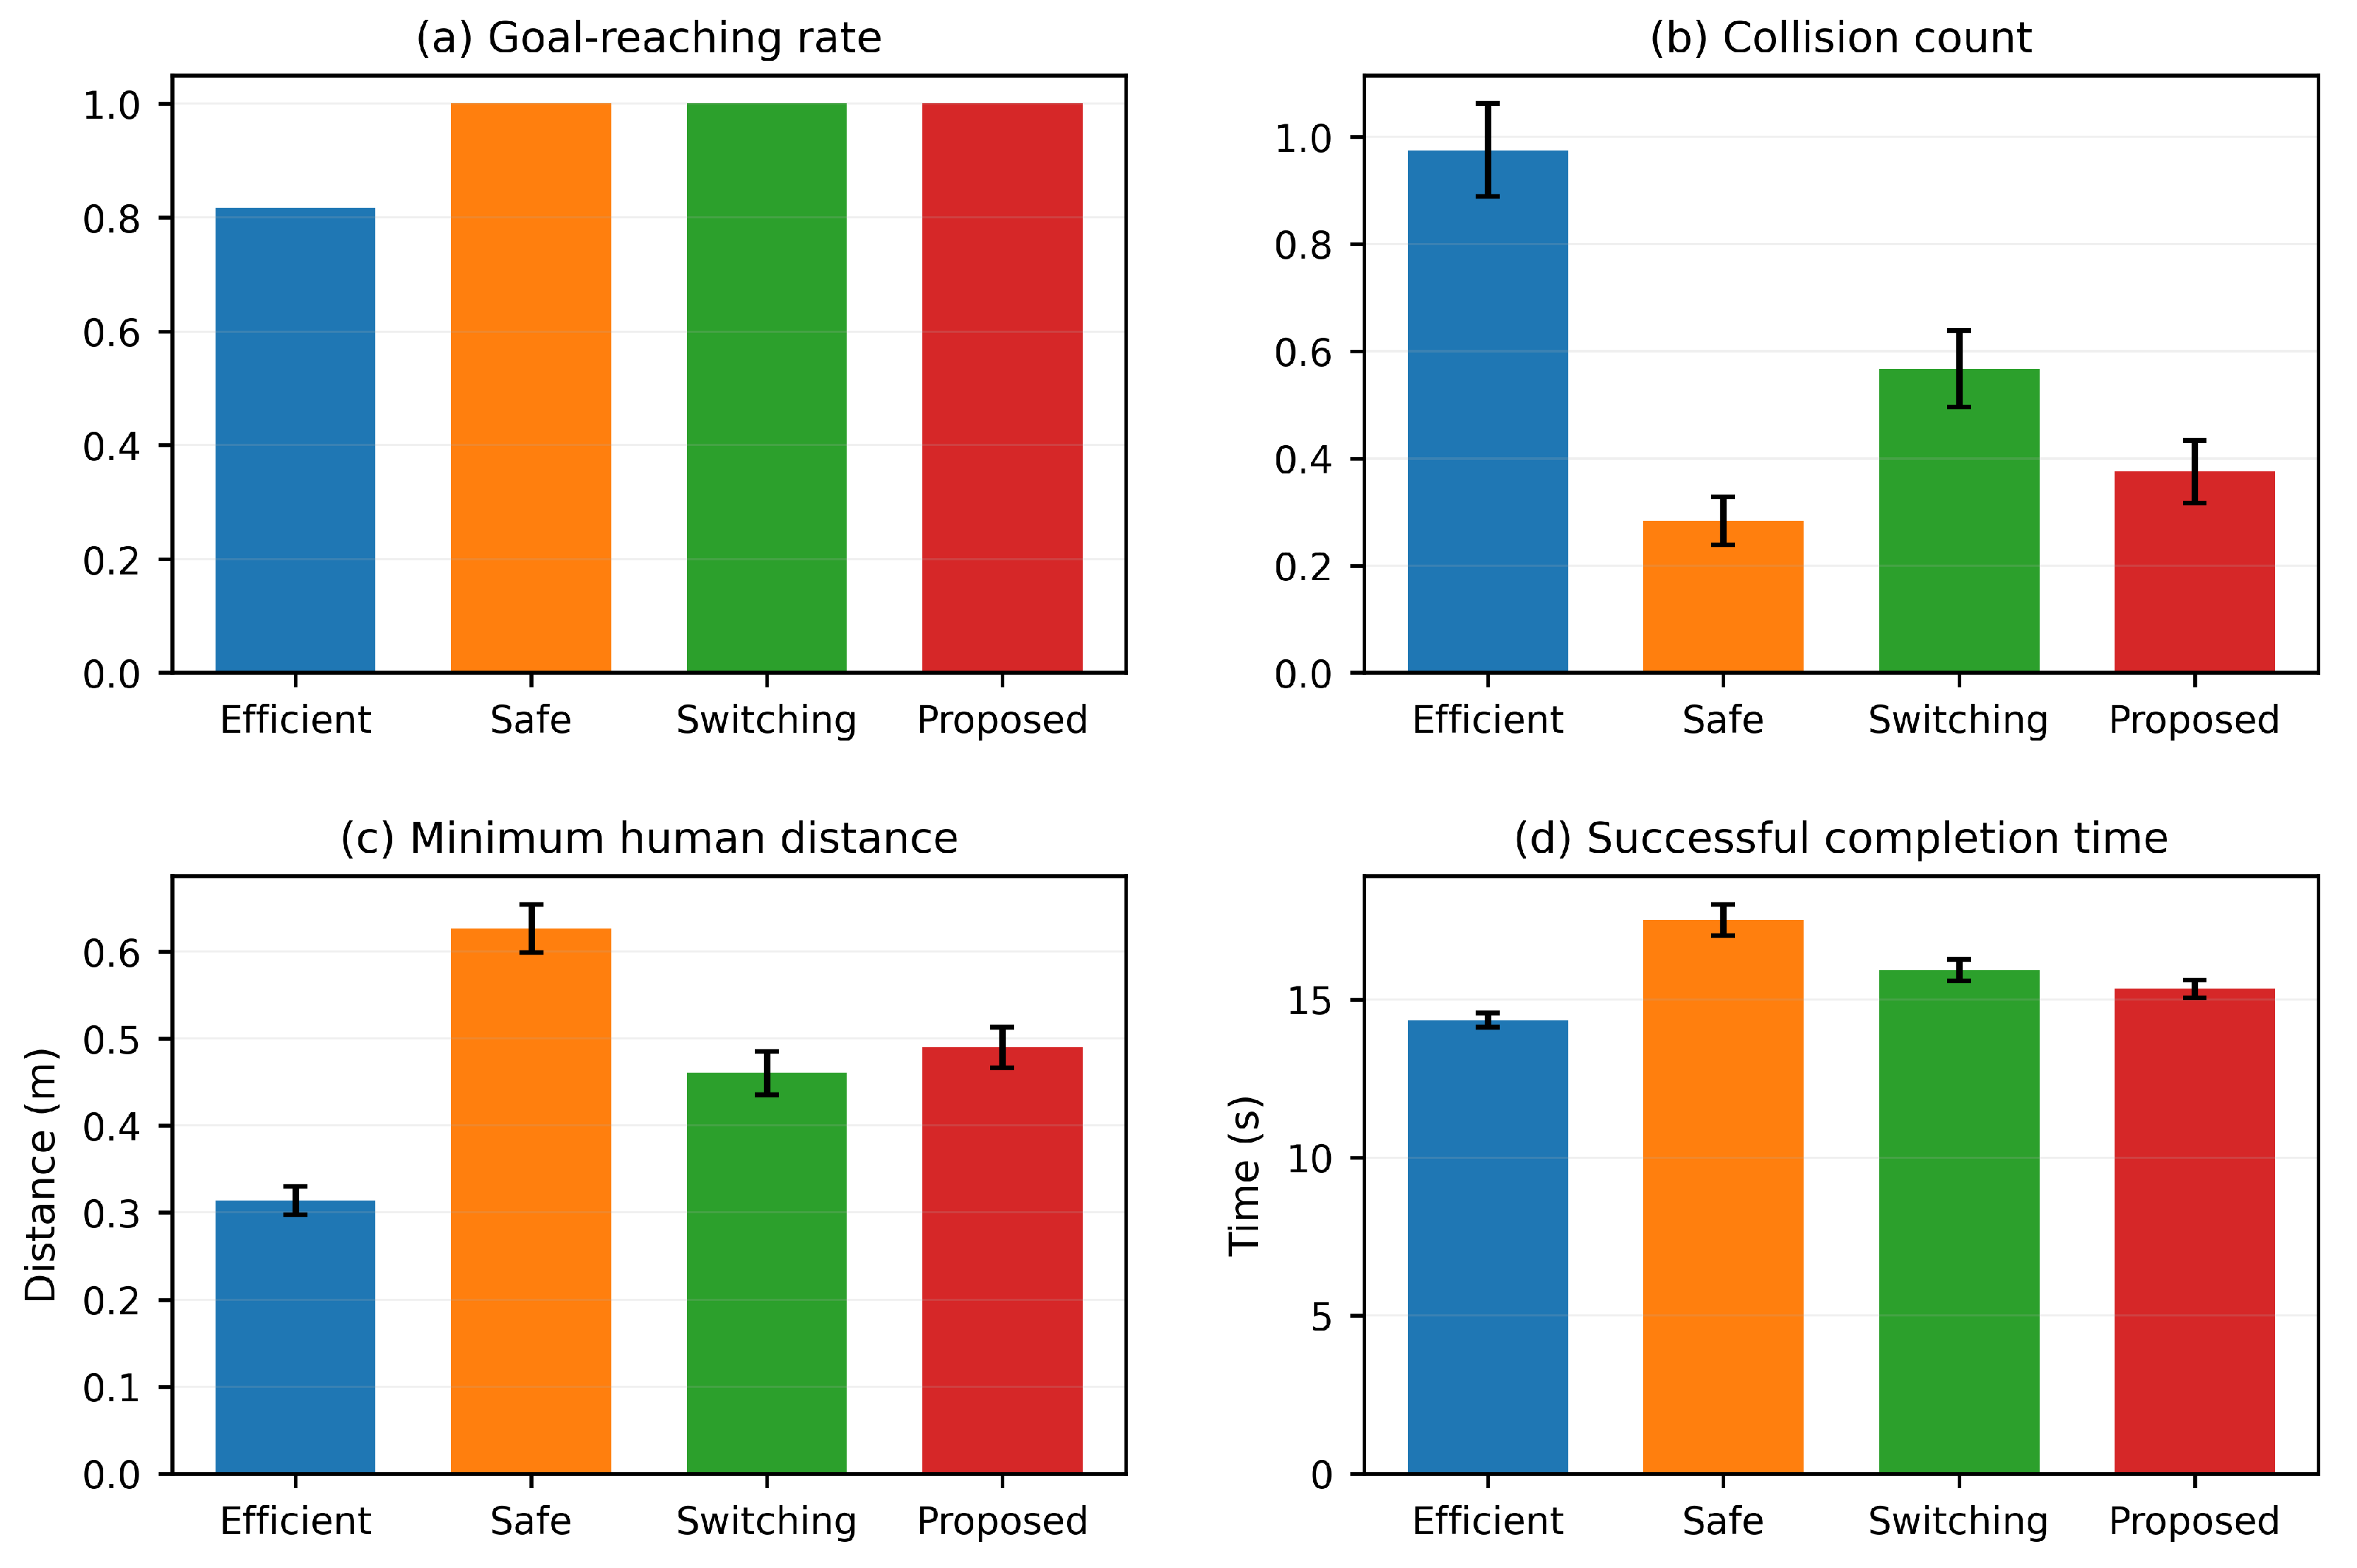
Table 2 summarizes the 480 main corridor runs. Efficient reaches the goal in only 81.7% of the runs and has the highest average collision count and collision duration. Safe is the most conservative controller: it has the lowest collision count, shortest collision duration, largest minimum clearance, and highest collision-free run rate, but also the longest successful-run completion time. Switching reaches every goal and remains efficient, but its collision count, collision duration, and control-smoothness metric are all worse than those of Proposed. Proposed, therefore, occupies the intended intermediate operating region: it preserves a 100% goal-reaching rate while approaching the safety of the conservative controller and retaining a short traversal time.
Compared with Efficient, Proposed reduces the average collision count from 0.975 to 0.375 (61.5%) and collision duration from 0.752 to 0.189 s (74.8%), while increasing the mean minimum clearance from 0.314 to 0.490 m (55.9%). The collision-free run rate increases from 36.7% to 69.2%. Among successful runs, Efficient completes the task in 14.338 s on average and Proposed in 15.324 s, corresponding to a 6.9% increase. Thus, the substantial safety and reliability gains are obtained with a modest successful-run time penalty rather than by simply making the robot excessively slow.
Relative to Switching, Proposed has lower observed average collision count (by 33.8%) and accumulated event duration (by 38.6%), along with a 33.1% lower recorded smoothness metric, a 6.4% larger mean clearance, and 3.8% shorter successful-run travel time. A 10,000-resample paired seed-block bootstrap gives Proposed-minus-Efficient 95% confidence intervals of events, s event duration, and m minimum clearance. Against Switching, the corresponding intervals are , s, and m. The latter intervals include zero; hence, the Switching contrast is an observed trend, not a statistically established improvement at the 95% level. The overall comparison is summarized in Figure 2.
Figure 2.
Overall comparison of the four main controllers. Successful completion time excludes timeout failures. Error bars denote SEM.
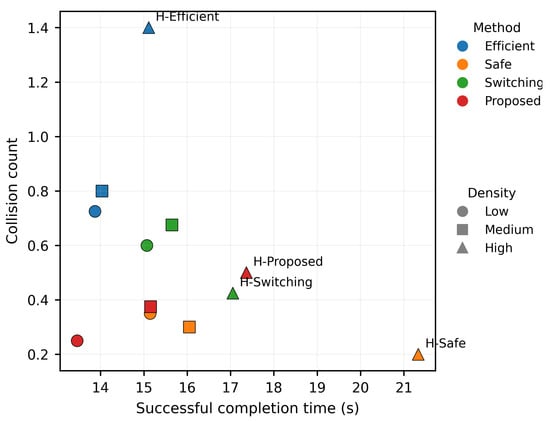
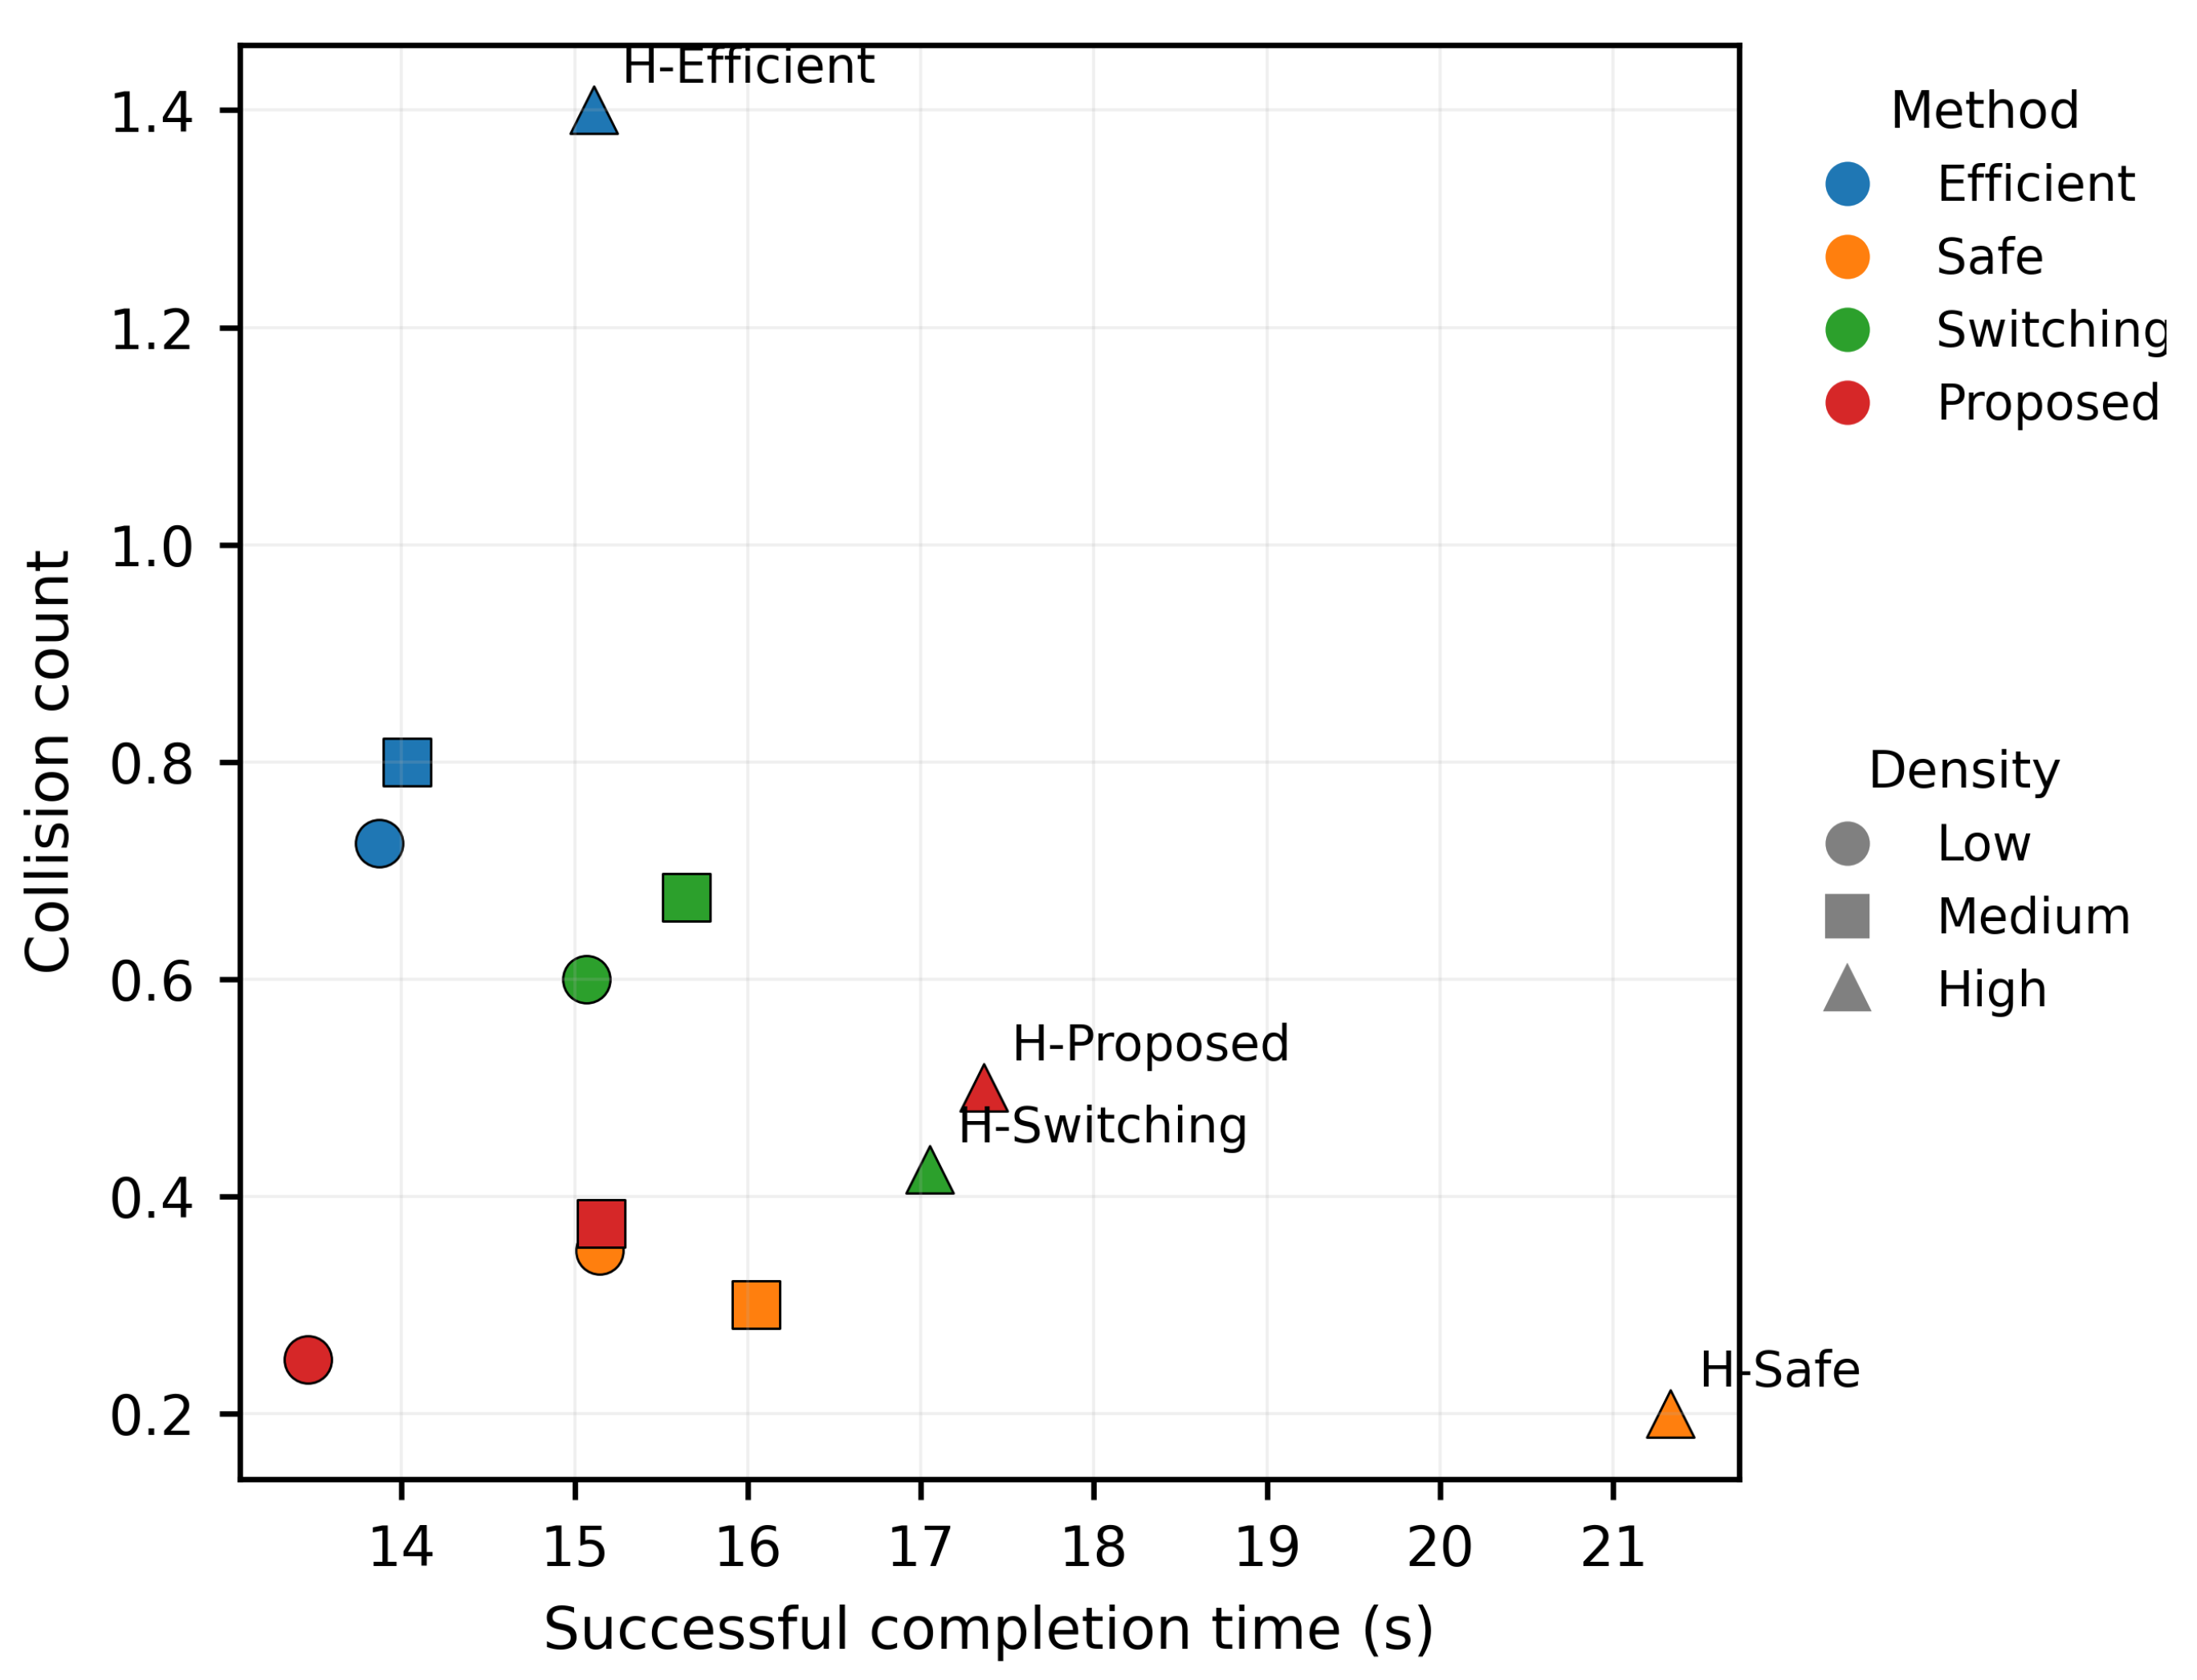
Figure 3 provides a complementary safety–efficiency view across pedestrian densities. Color denotes the controller and marker shape denotes pedestrian density. Safe occupies the low-collision but slower region, whereas Efficient shifts toward shorter travel time only under favorable conditions and deteriorates markedly at high density. Proposed remains in a comparatively favorable region over low and medium densities and avoids the severe high-density degradation exhibited by Efficient.
Figure 3.
Safety–efficiency trade-off across pedestrian-density levels. Marker type denotes density and color denotes control method.
5.2. Robustness to Observation Delay
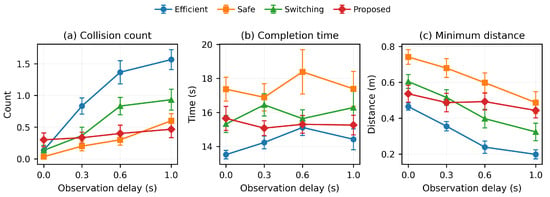
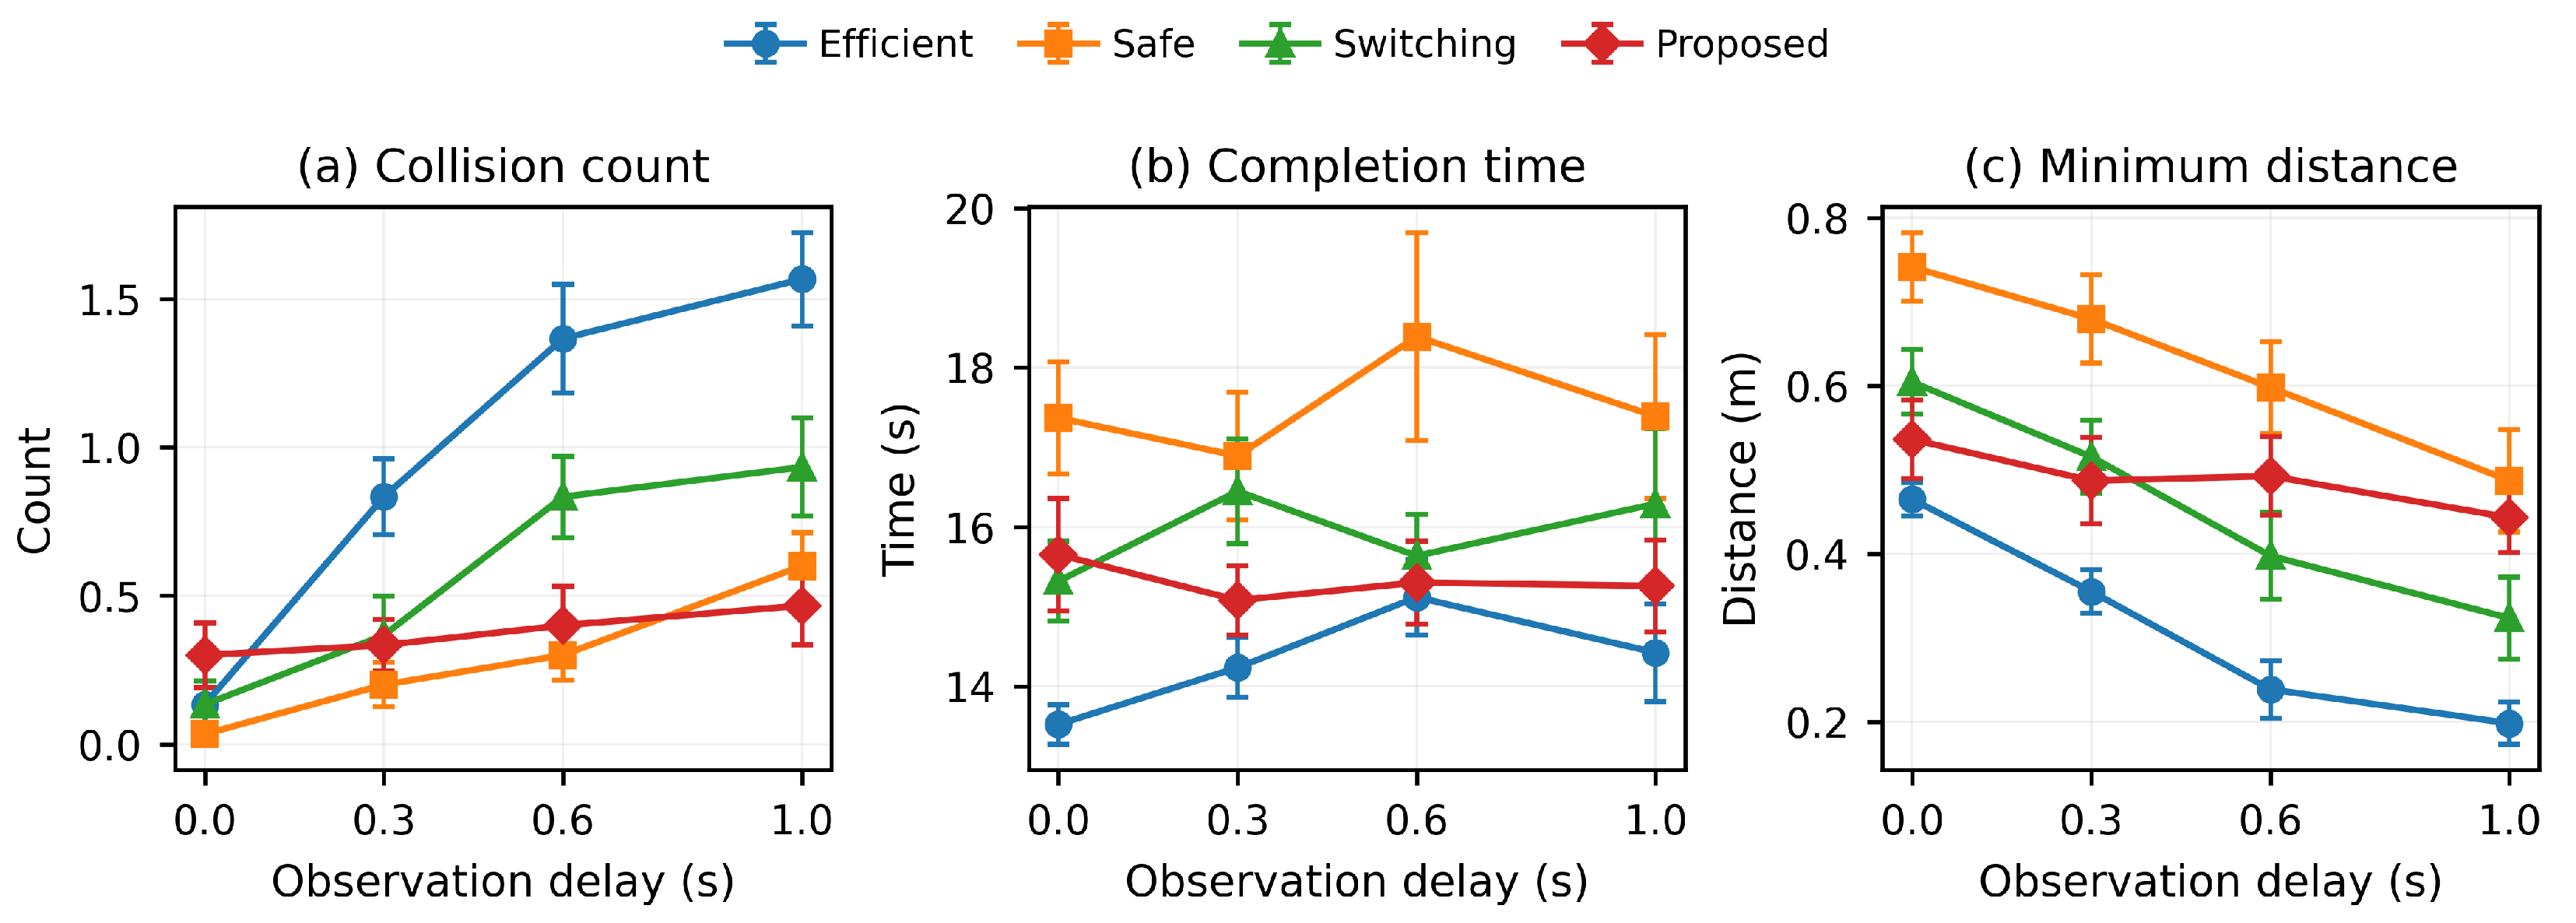
Figure 4 shows how safety and successful-run efficiency change with observation delay. The safety performance of Efficient and Switching deteriorates strongly as pedestrian information becomes older, whereas Proposed remains comparatively stable. At a 1.0 s delay, Efficient reaches the goal in only 70% of the runs; its collision-free run rate decreases to 6.7%, its average collision count rises to 1.567, and its mean minimum clearance falls to 0.198 m. Switching maintains a 100% goal-reaching rate but reaches a collision-free run rate of only 30.0% and an average collision count of 0.933.
Figure 4.
Sensitivity to pedestrian-observation delay in collision count, successful completion time, and minimum human distance. Error bars denote SEM.
Under the same 1.0 s delay, Proposed maintains a 100% goal-reaching rate and a 63.3% collision-free run rate. Its collision count is 0.467, which is 70.2% lower than Efficient and 49.9% lower than Switching. The mean minimum clearance is 0.443 m, corresponding to increases of 123.7% and 37.2% relative to Efficient and Switching, respectively. The proposed method also completes successful runs in 15.260 s, compared with 16.290 s for Switching and 17.387 s for Safe. Thus, under severe delay, continuous adaptation provides a clear advantage over the efficiency-oriented and switching strategies while retaining a shorter successful-run completion time than the rule-based and conservative alternatives.
At zero delay, the relative ranking is different: Safe provides the largest clearance and lowest collision count, while Efficient and Switching remain competitive because no stale observation has to be compensated. The benefit of the proposed controller becomes increasingly pronounced as observation delay grows, demonstrating its effectiveness in mitigating stale pedestrian-state information.
5.3. Delay-Induced Human-Distance Estimation Error
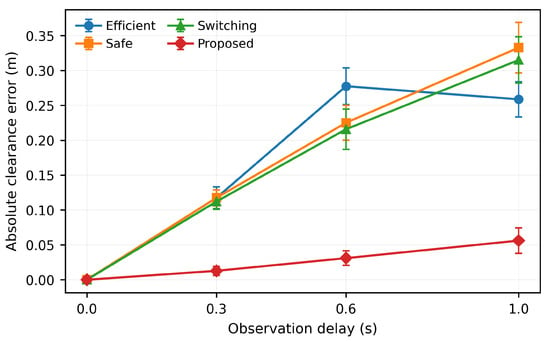
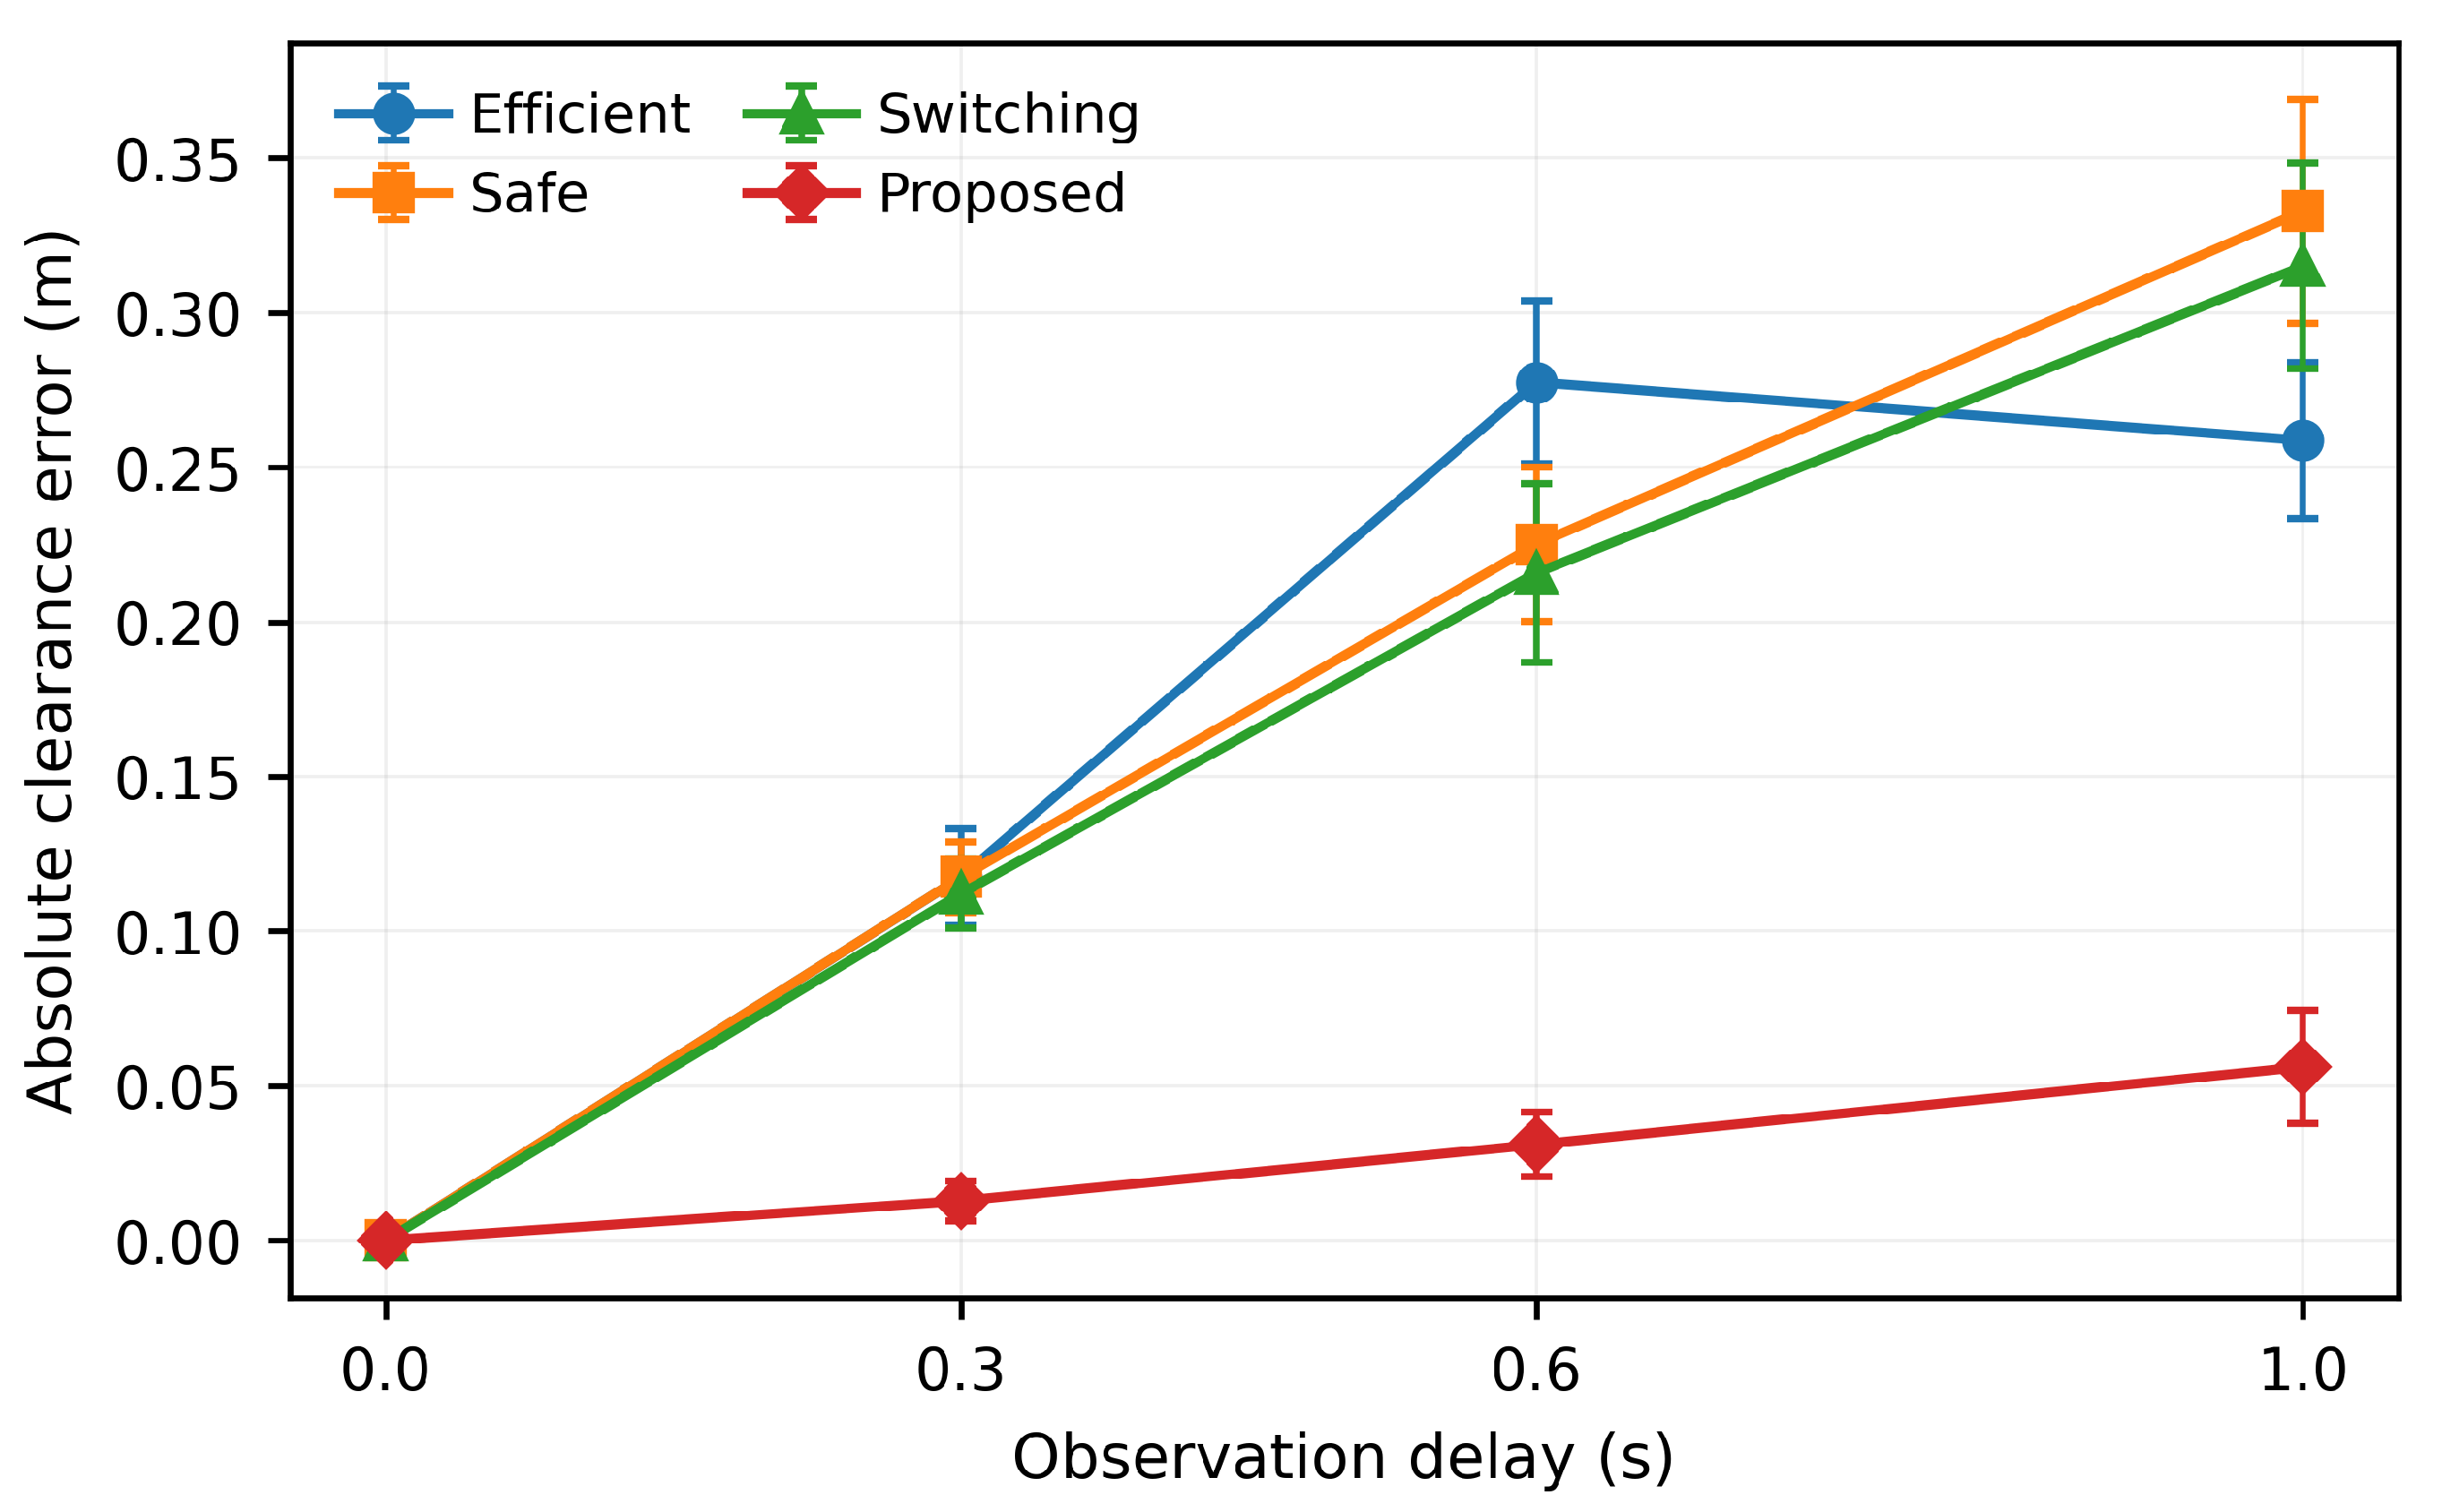
The simulation records contain both the nearest distance estimated by the controller and the minimum distance computed from the true pedestrian states. Equation (27), therefore, allows the effect of stale observations to be examined directly. Figure 5 shows a clear separation between Proposed and the three main baselines once delay is introduced.
Figure 5.
Absolute clearance-estimation error versus observation delay. Delay compensation keeps the estimation error of Proposed substantially below those of the three baselines as delay increases. Error bars denote SEM.
At 0.3 s, the mean absolute clearance-estimation error is only 0.013 m for Proposed, compared with 0.117 m for Efficient and Safe and 0.112 m for Switching. At 0.6 s, the error of Proposed is 0.031 m, whereas those of Efficient, Safe, and Switching rise to 0.278, 0.225, and 0.216 m. At a 1.0 s delay, Proposed remains at 0.056 m; the corresponding errors are 0.259, 0.333, and 0.315 m for Efficient, Safe, and Switching. Relative to Switching, Proposed, therefore, reduces the 1.0 s absolute distance-estimation error by 82.2%.
The signed error provides additional insight. At a 1.0 s delay, Efficient, Safe, and Switching overestimate clearance by 0.197, 0.262, and 0.276 m on average, respectively, whereas the mean signed error of Proposed is only 0.018 m. The safety improvement is, therefore, consistent with a concrete mechanism: delayed uncompensated observations make the robot believe that the human clearance is larger than it actually is, while delay-compensated prediction substantially suppresses this optimistic bias.
5.4. Influence of Pedestrian Density
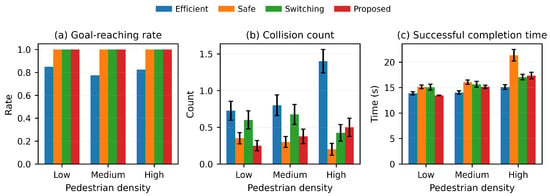
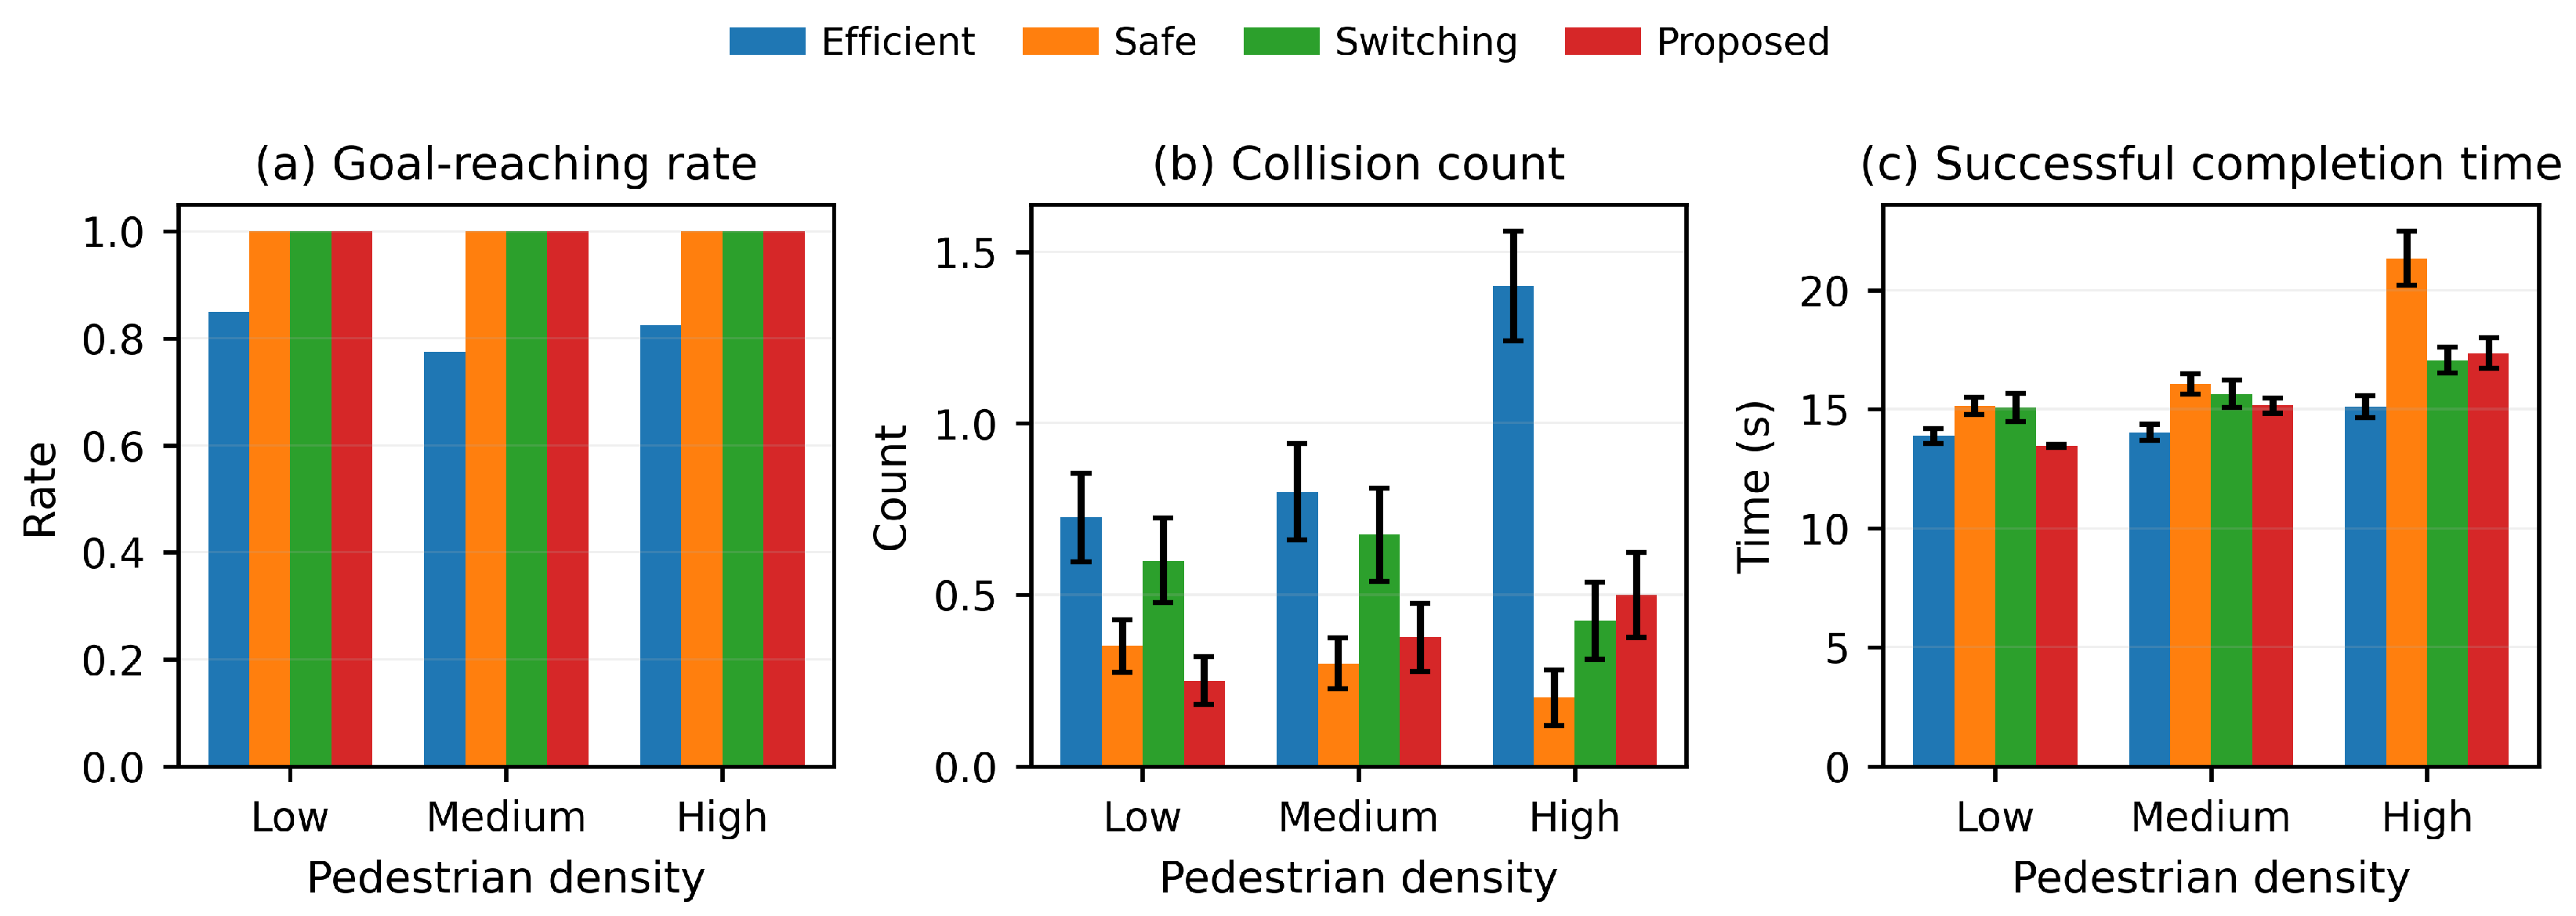
The density-dependent results in Figure 6 provide a complementary view. Proposed reaches the goal in all runs for low, medium, and high densities. Under low density, it achieves the lowest collision count (0.250) and the shortest successful completion time (13.457 s), while retaining a 0.596 m mean minimum clearance close to the 0.633 m of Safe. Under medium density, Proposed records 0.375 collisions per run and a 15.152 s successful completion time, compared with 0.300 collisions and 16.047 s for Safe. Thus, Safe gains a small safety advantage at the cost of longer travel time.
Figure 6.
Performance under low, medium, and high pedestrian densities. Proposed maintains a 100% goal-reaching rate across densities, while Safe remains the most conservative under sustained high density. Error bars denote SEM.
At high density, Safe remains the most conservative, with 0.200 collisions per run and a 0.665 m minimum clearance. More simultaneous pedestrian interactions restrict feasible free space and can make an efficiency–clearance trade-off more pronounced; the larger separation achieved by Safe is, therefore, consistent with its lower speed preference and stronger avoidance weighting. Switching obtains 0.425 collisions, a 0.528 m clearance, and a 17.052 s completion time, while Proposed obtains 0.500 collisions, a 0.438 m clearance, and a 17.362 s completion time. At high density, Safe retains the strongest safety margin, whereas Proposed operates at a less conservative safety–efficiency balance while preserving full goal reaching.
5.5. Representative Interaction Cases
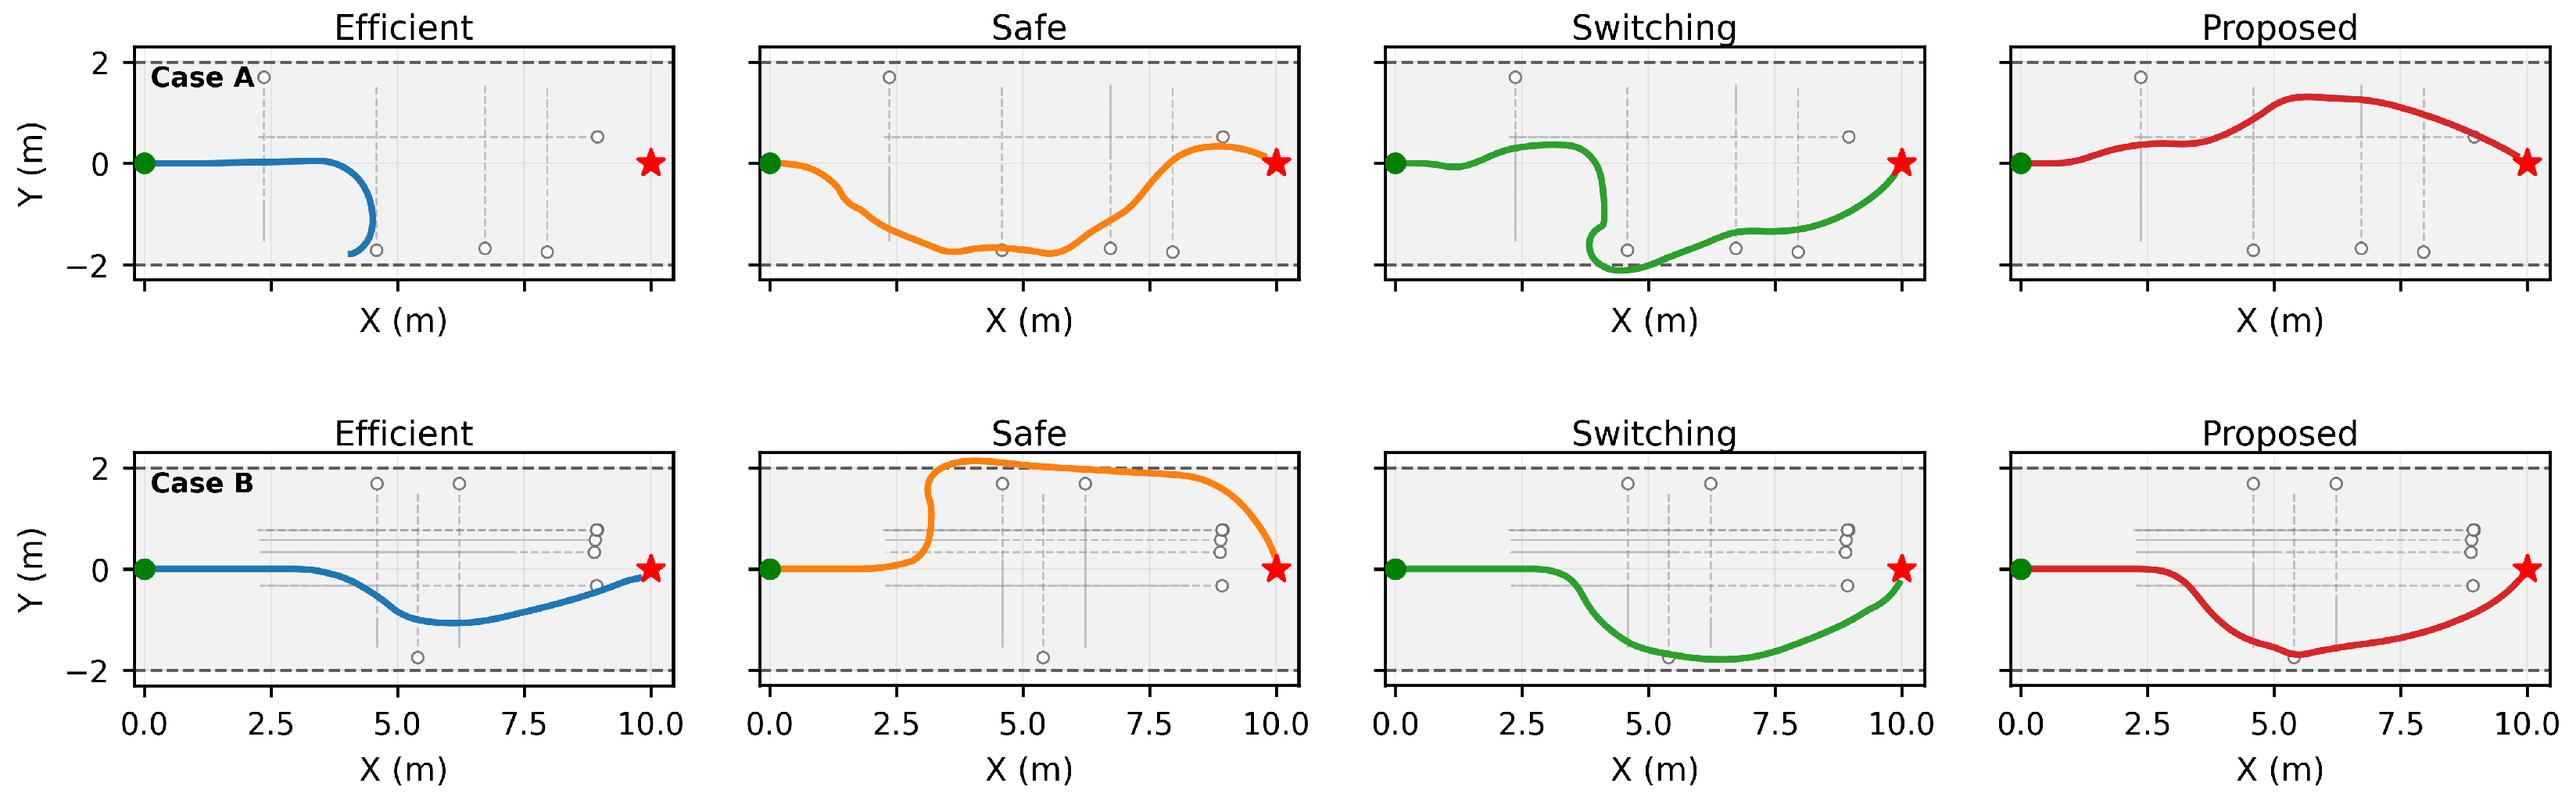
Figure 7 visualizes two representative cases from the complete multi-seed experiment set. Case A uses medium density with a 0.3 s delay (seed 6), and Case B uses high density with a 1.0 s delay (seed 9). The trajectories show that the four controllers produce qualitatively different lateral avoidance strategies under the same pedestrian realization. In particular, Proposed begins its lateral maneuver before the most constrained part of the interaction and reaches the terminal region in both examples. These trajectories are generated by the linear and angular velocity commands selected at successive control instants. According to Equation (5), the forward velocity governs translational progress, while the angular velocity determines heading evolution and the resulting lateral displacement. The observed trajectory differences, therefore, reflect the effects of different speed preferences and pedestrian-avoidance decisions.
Figure 7.
Representative local-corridor trajectories. Case A: medium density, 0.3 s delay, seed 6. Case B: high density, 1.0 s delay, seed 9. The dashed horizontal lines denote the nominal corridor envelope.
5.6. Ablation Study
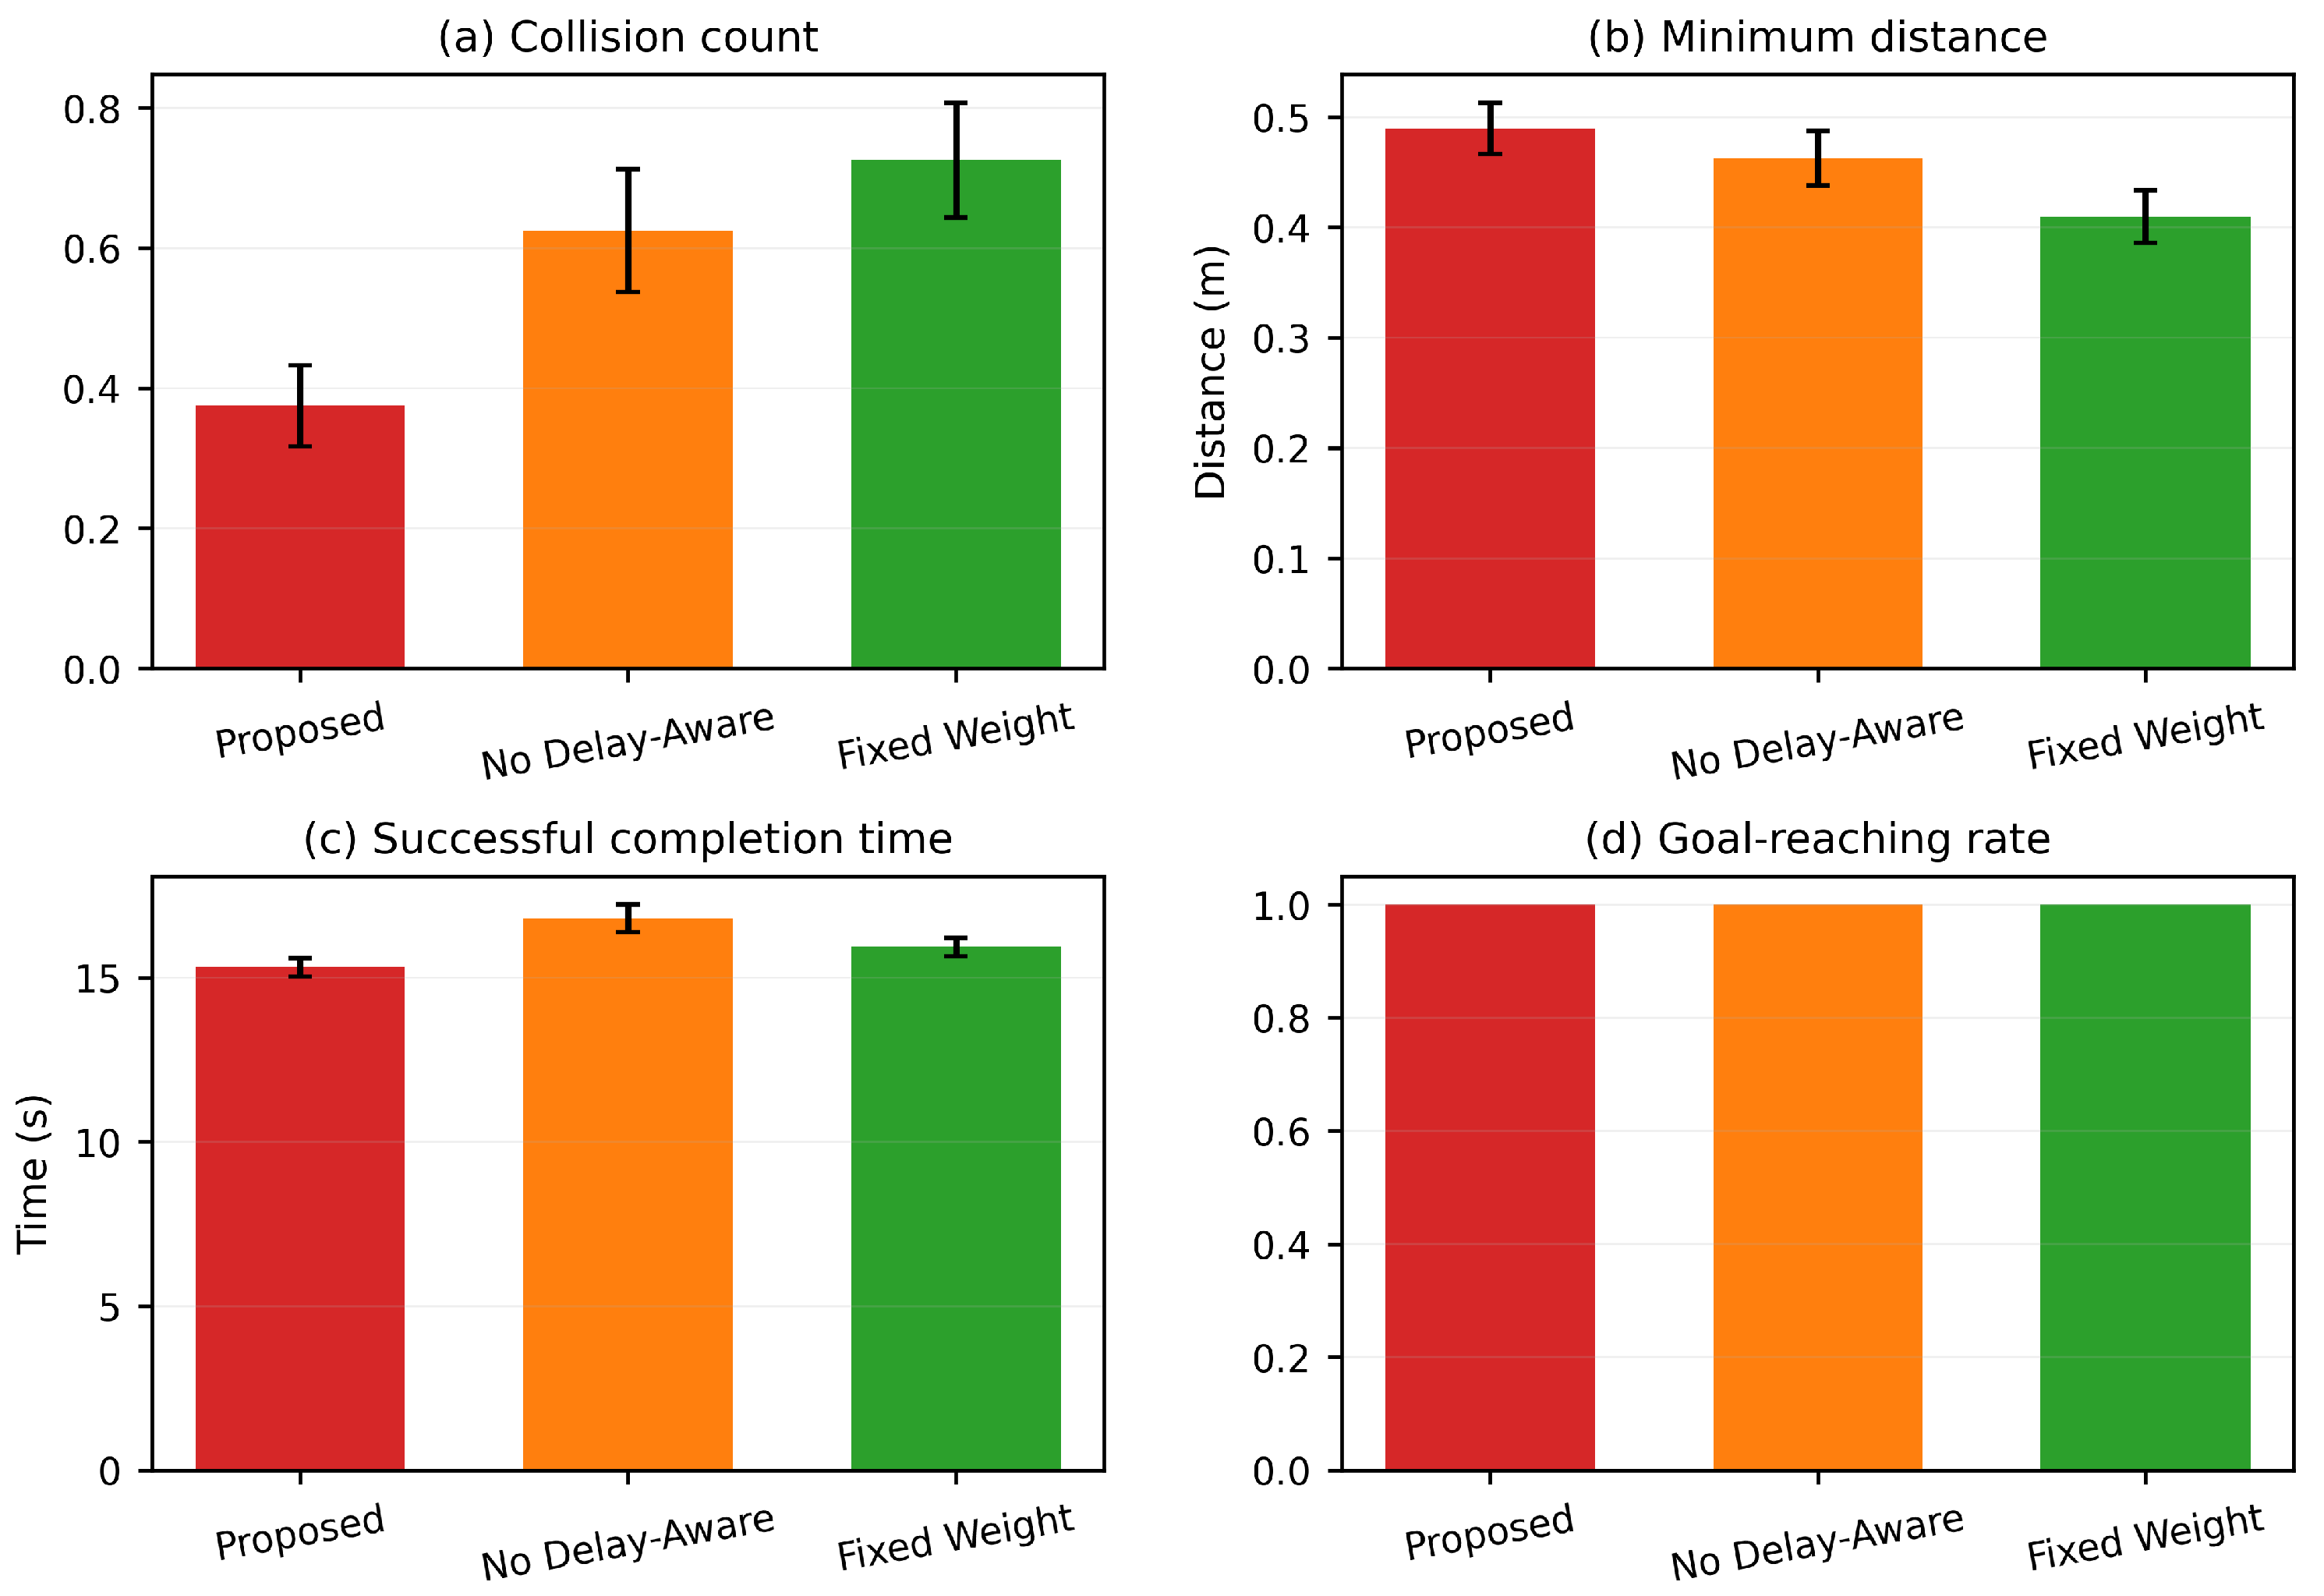
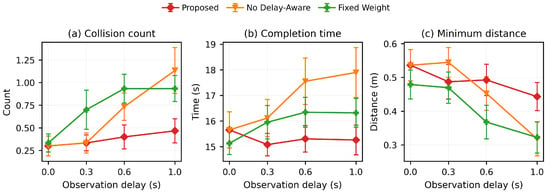
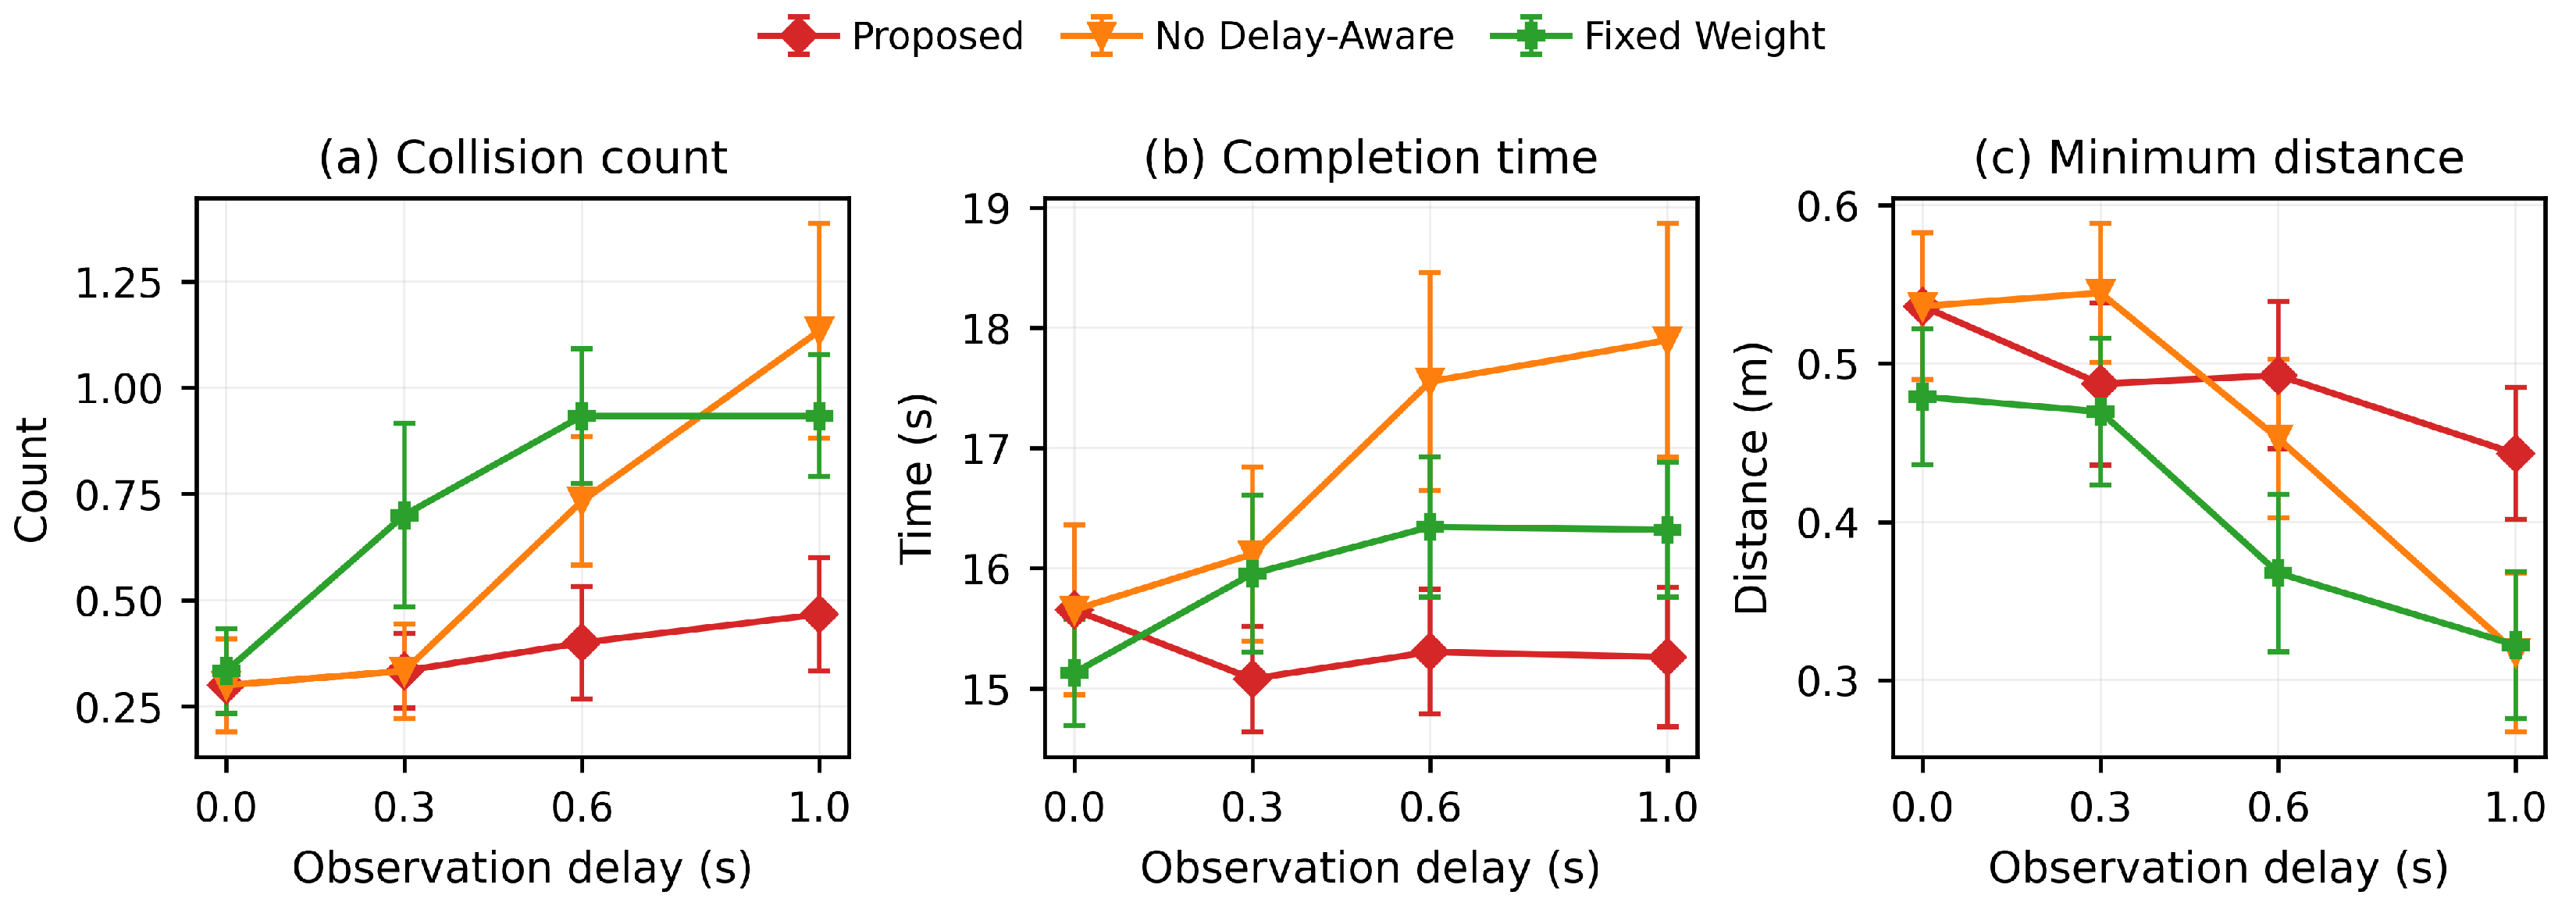
Table 3 compares the complete controller with the two ablation variants over the same 120 density–delay–seed conditions for each method. Removing delay awareness increases collision count from 0.375 to 0.625 and collision duration from 0.189 to 0.356 s. Restoring delay compensation, therefore, reduces collision count by 40.0% and collision duration by 46.9% relative to No Delay Awareness. Fixed Weight performs worse in safety, with 0.725 collisions per run, a 0.445 s collision duration, and a 0.410 m minimum clearance.
Table 3.
Ablation results over all density and delay conditions.
The overall ablation is summarized in Figure 8, while the delay-dependent comparison in Figure 9 reveals how the two components behave as sensing latency grows. At zero delay, Proposed and No Delay Awareness are identical in collision count (0.300), minimum clearance (0.536 m), and completion time (15.653 s), as expected because there is no stale observation to compensate. At a 1.0 s delay, Proposed records 0.467 collisions per run, compared with 1.133 for No Delay Awareness and 0.933 for Fixed Weight. The complete method, therefore, reduces collision count by 58.8% and 49.9%, respectively. Its minimum clearance of 0.443 m is 39.3% larger than No Delay Awareness and 37.6% larger than Fixed Weight. These results demonstrate the benefits of observation-age compensation and joint risk-adaptive weighting in improving collision avoidance and maintaining navigation efficiency under delayed pedestrian observations.
Figure 8.
Overall ablation comparison. All three variants reach the goal in all runs, while removing delay awareness or adaptive weighting degrades collision-related metrics and successful-run efficiency. Error bars denote SEM.
Figure 9.
Delay-dependent ablation comparison. The reduced variants degrade more strongly as observation delay increases, supporting the complementary roles of delay awareness and adaptive weighting. Error bars denote SEM.
5.7. Extended 40 m Delivery-Route Evaluation
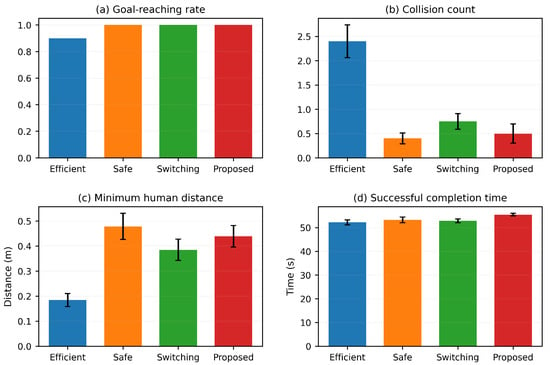
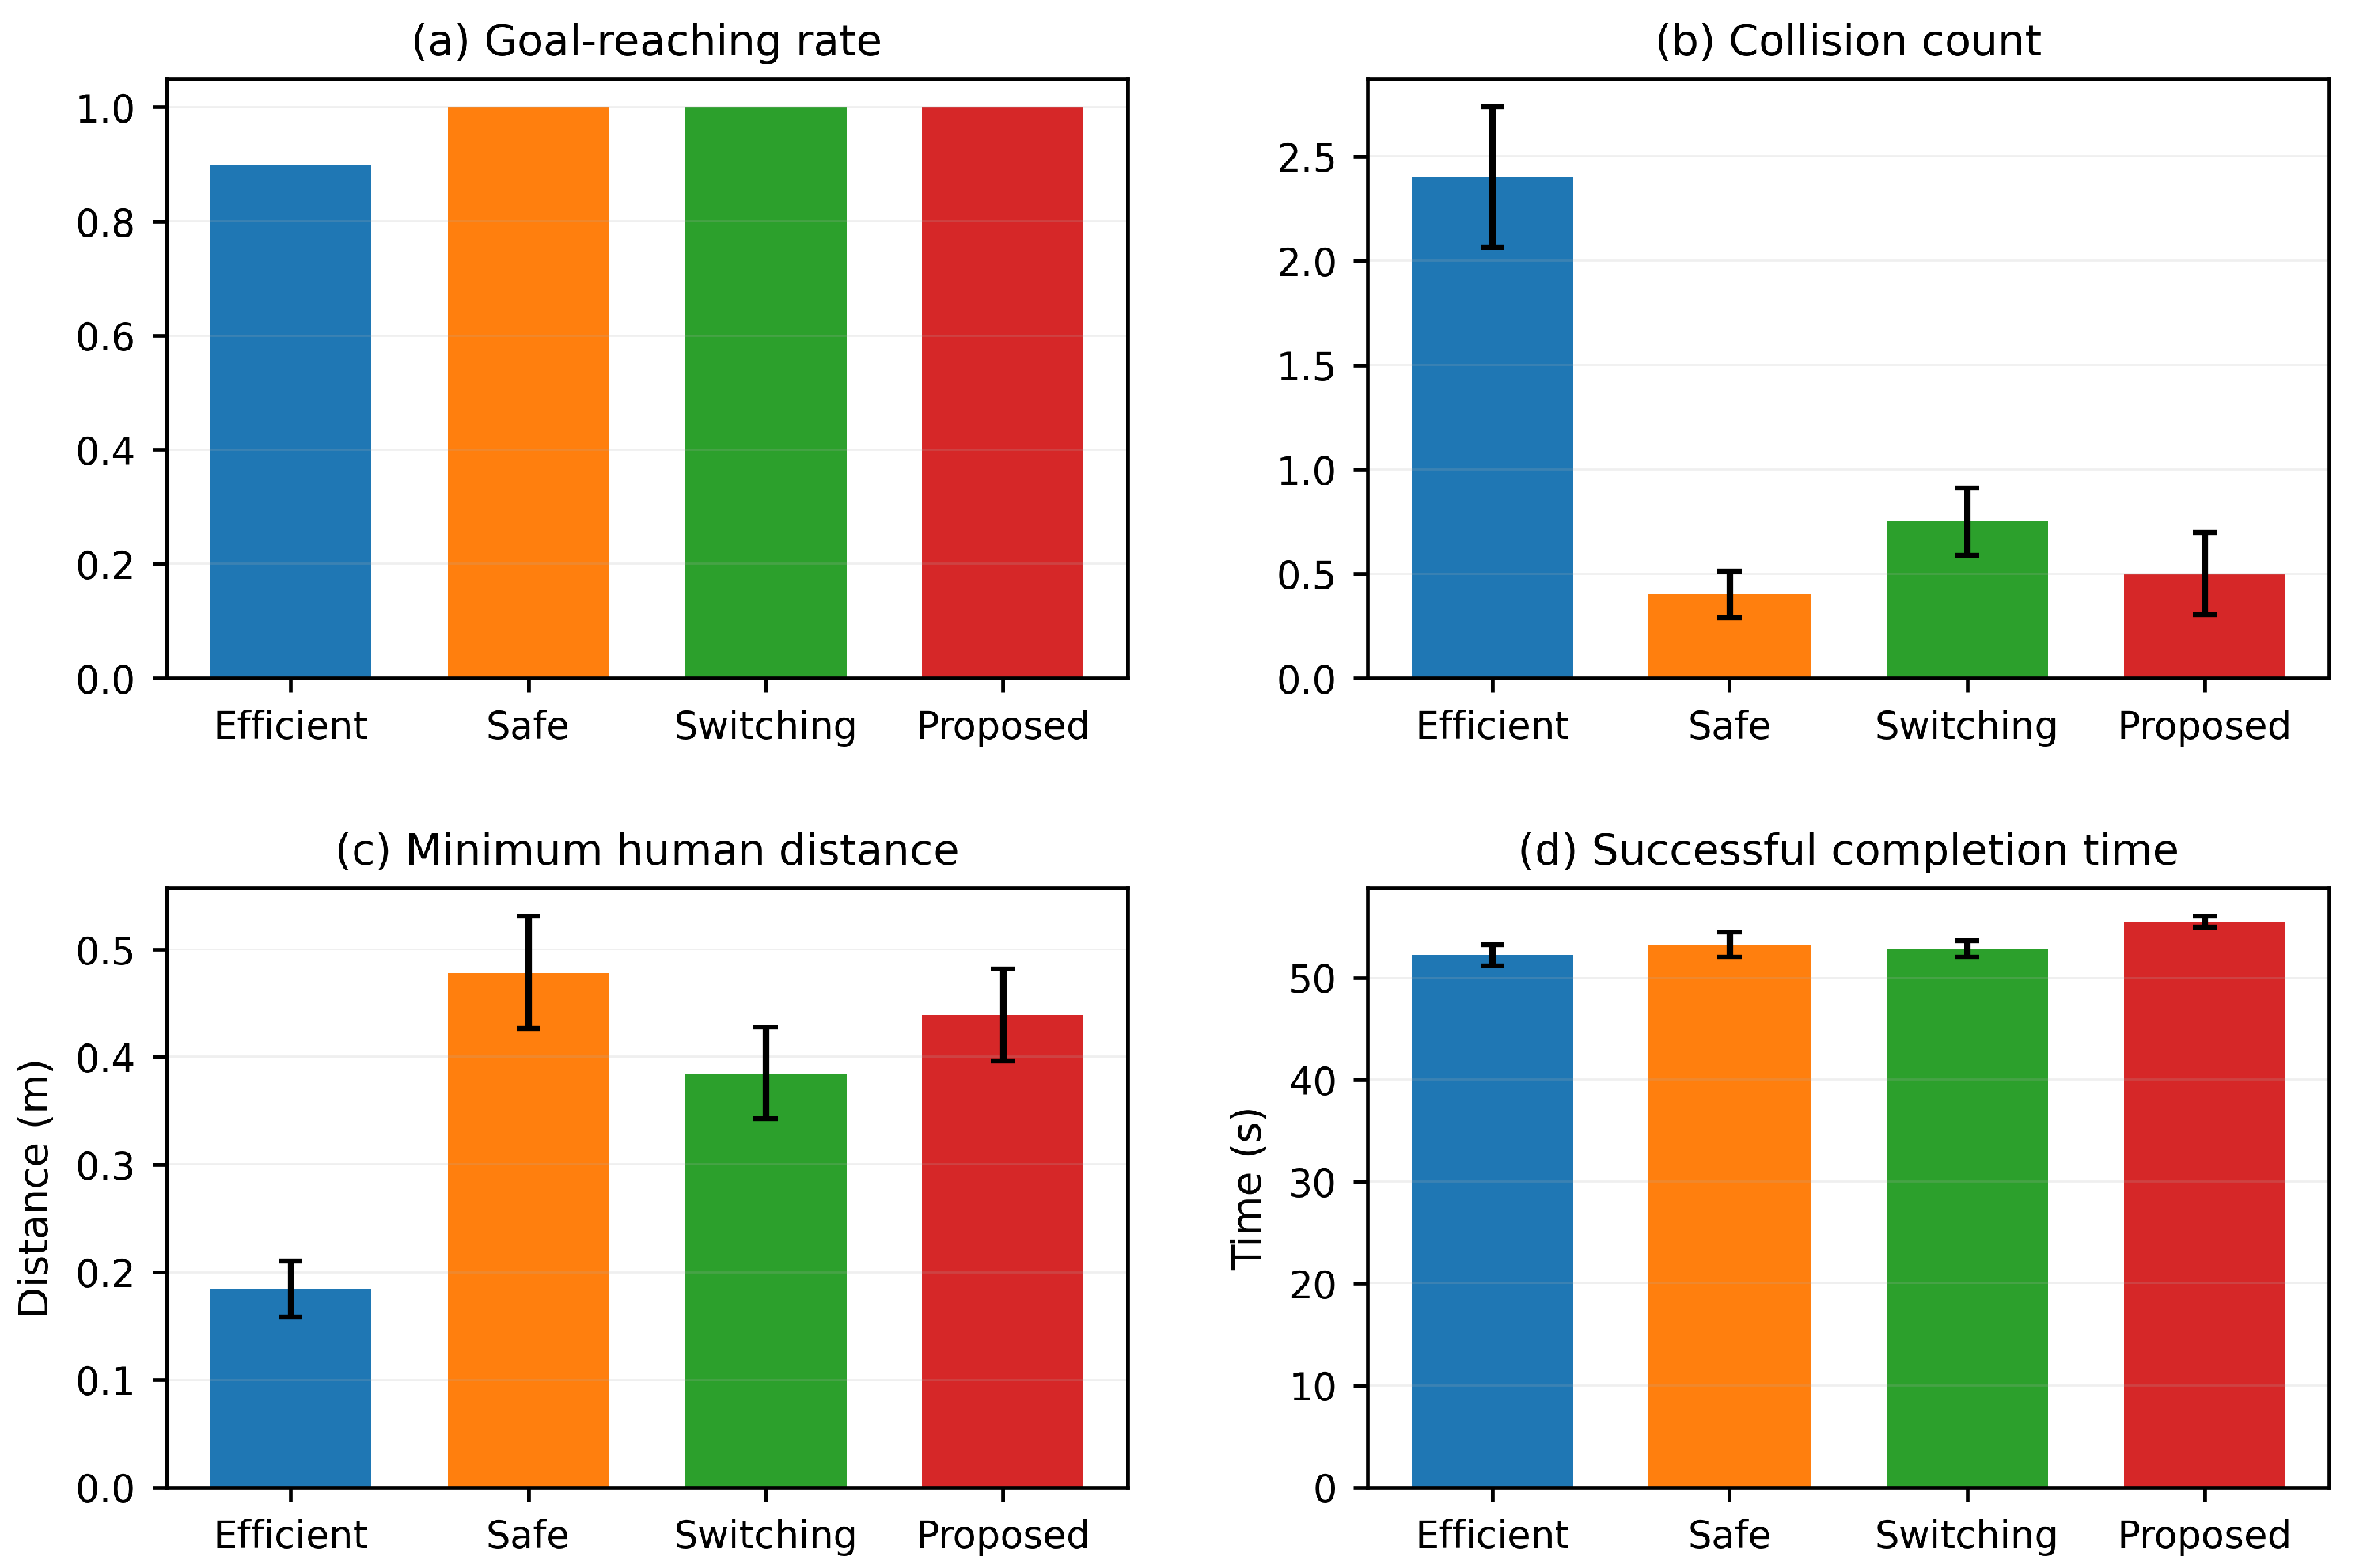
The 40 m route provides a more demanding sequence of interactions than the 10 m local corridor. The same 0.3 m goal-reaching tolerance used in the local corridor is retained. Table 4 shows that Efficient reaches the goal in 90% of the 20 runs but experiences at least one collision in every run, giving a collision-free run rate of 0. Proposed, Safe, and Switching all maintain 100% goal reaching. Proposed achieves the highest collision-free run rate, 70%, compared with 60% for Safe and 40% for Switching. Its average collision count is 0.50, slightly higher than the 0.40 of Safe but lower than the 0.75 of Switching and far below the 2.40 of Efficient.
Table 4.
Overall results on the 40 m extended delivery-route scenario with the 0.3 m goal-reaching tolerance.
Compared with Efficient, Proposed reduces collision count by 79.2% and collision duration by 84.0%, while increasing the mean minimum clearance from 0.185 to 0.439 m (137.3%). Relative to Switching, it reduces collision count by 33.3% and increases minimum clearance by 14.0%, although its successful completion time is approximately 4.7% longer. The extended-route results further demonstrate the effectiveness of the proposed controller across multiple consecutive pedestrian-interaction zones, with improved safety performance and a moderate completion-time trade-off. The overall extended-route performance is summarized in Figure 10.
Figure 10.
Overall performance on the 40 m extended route with the 0.3 m goal-reaching tolerance. Proposed retains full goal reaching and the highest collision-free run rate, while Safe maintains the largest average clearance. Error bars denote SEM.
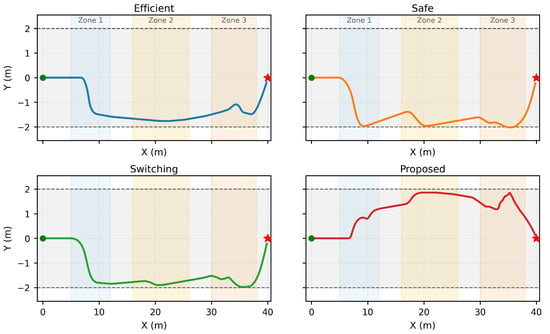
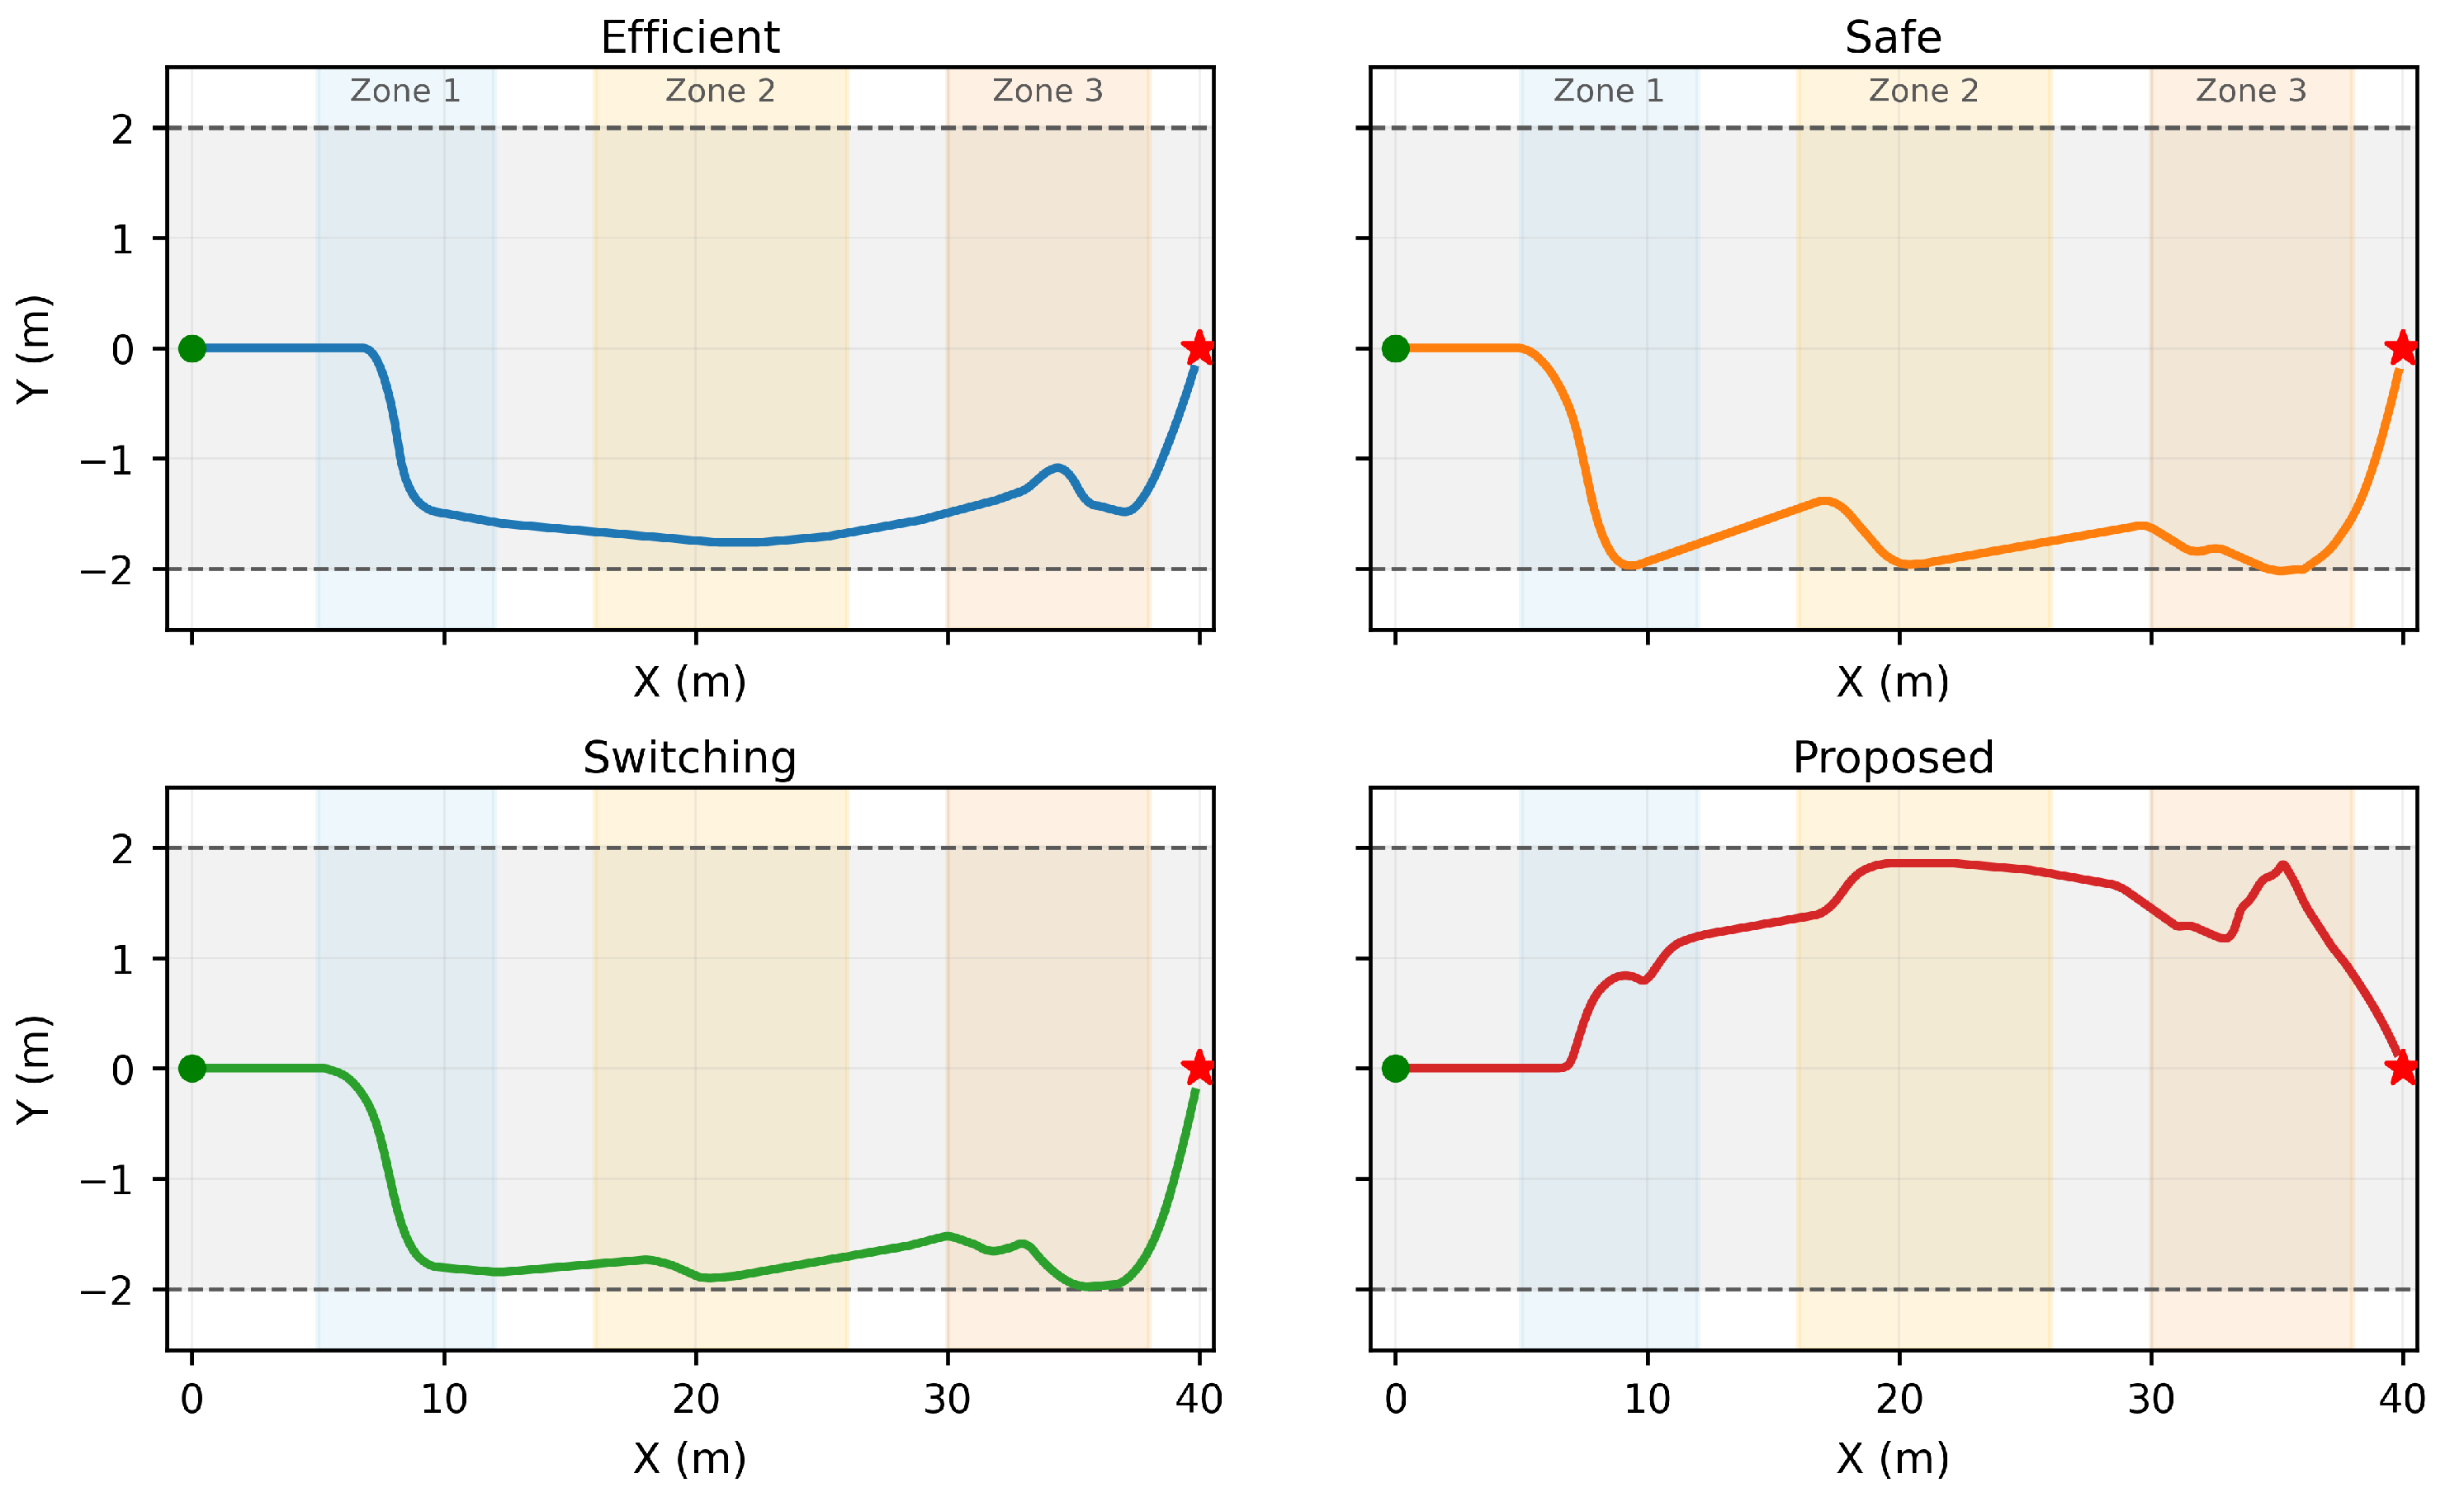
The two tested delay levels also reveal an important limitation. At 0.3 s, Proposed records 0.10 collisions per run, a 0.535 m minimum clearance, and a 55.20 s successful completion time. At 1.0 s, its collision count rises to 0.90 and its mean clearance decreases to 0.344 m, while successful completion time increases to 56.71 s. Safe performs better in the sustained 1.0 s high-delay condition, with 0.40 collisions per run and a 0.462 m clearance. Thus, the extended route acts as a useful stress test: Proposed retains full goal-reaching reliability, but a purely conservative fixed controller can remain safer in some persistent high-delay conditions. A representative trajectory comparison under a 1.0 s observation delay is shown in Figure 11.
Figure 11.
Representative trajectories on the 40 m extended route at a 1.0 s observation delay (seed 3). The shaded regions denote the three sequential pedestrian-interaction zones, and the dashed horizontal lines denote the nominal lateral envelope.
Figure 11 further illustrates a representative trajectory comparison at a 1.0 s observation delay. The robot trajectories are evaluated using the same terminal condition as the local-corridor experiments, m. As summarized in Table 4, Proposed reaches this terminal region in all 20 extended-route runs, demonstrating consistent task completion across the evaluated delay conditions.
5.8. Computational Efficiency
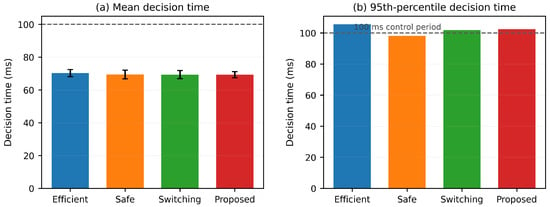
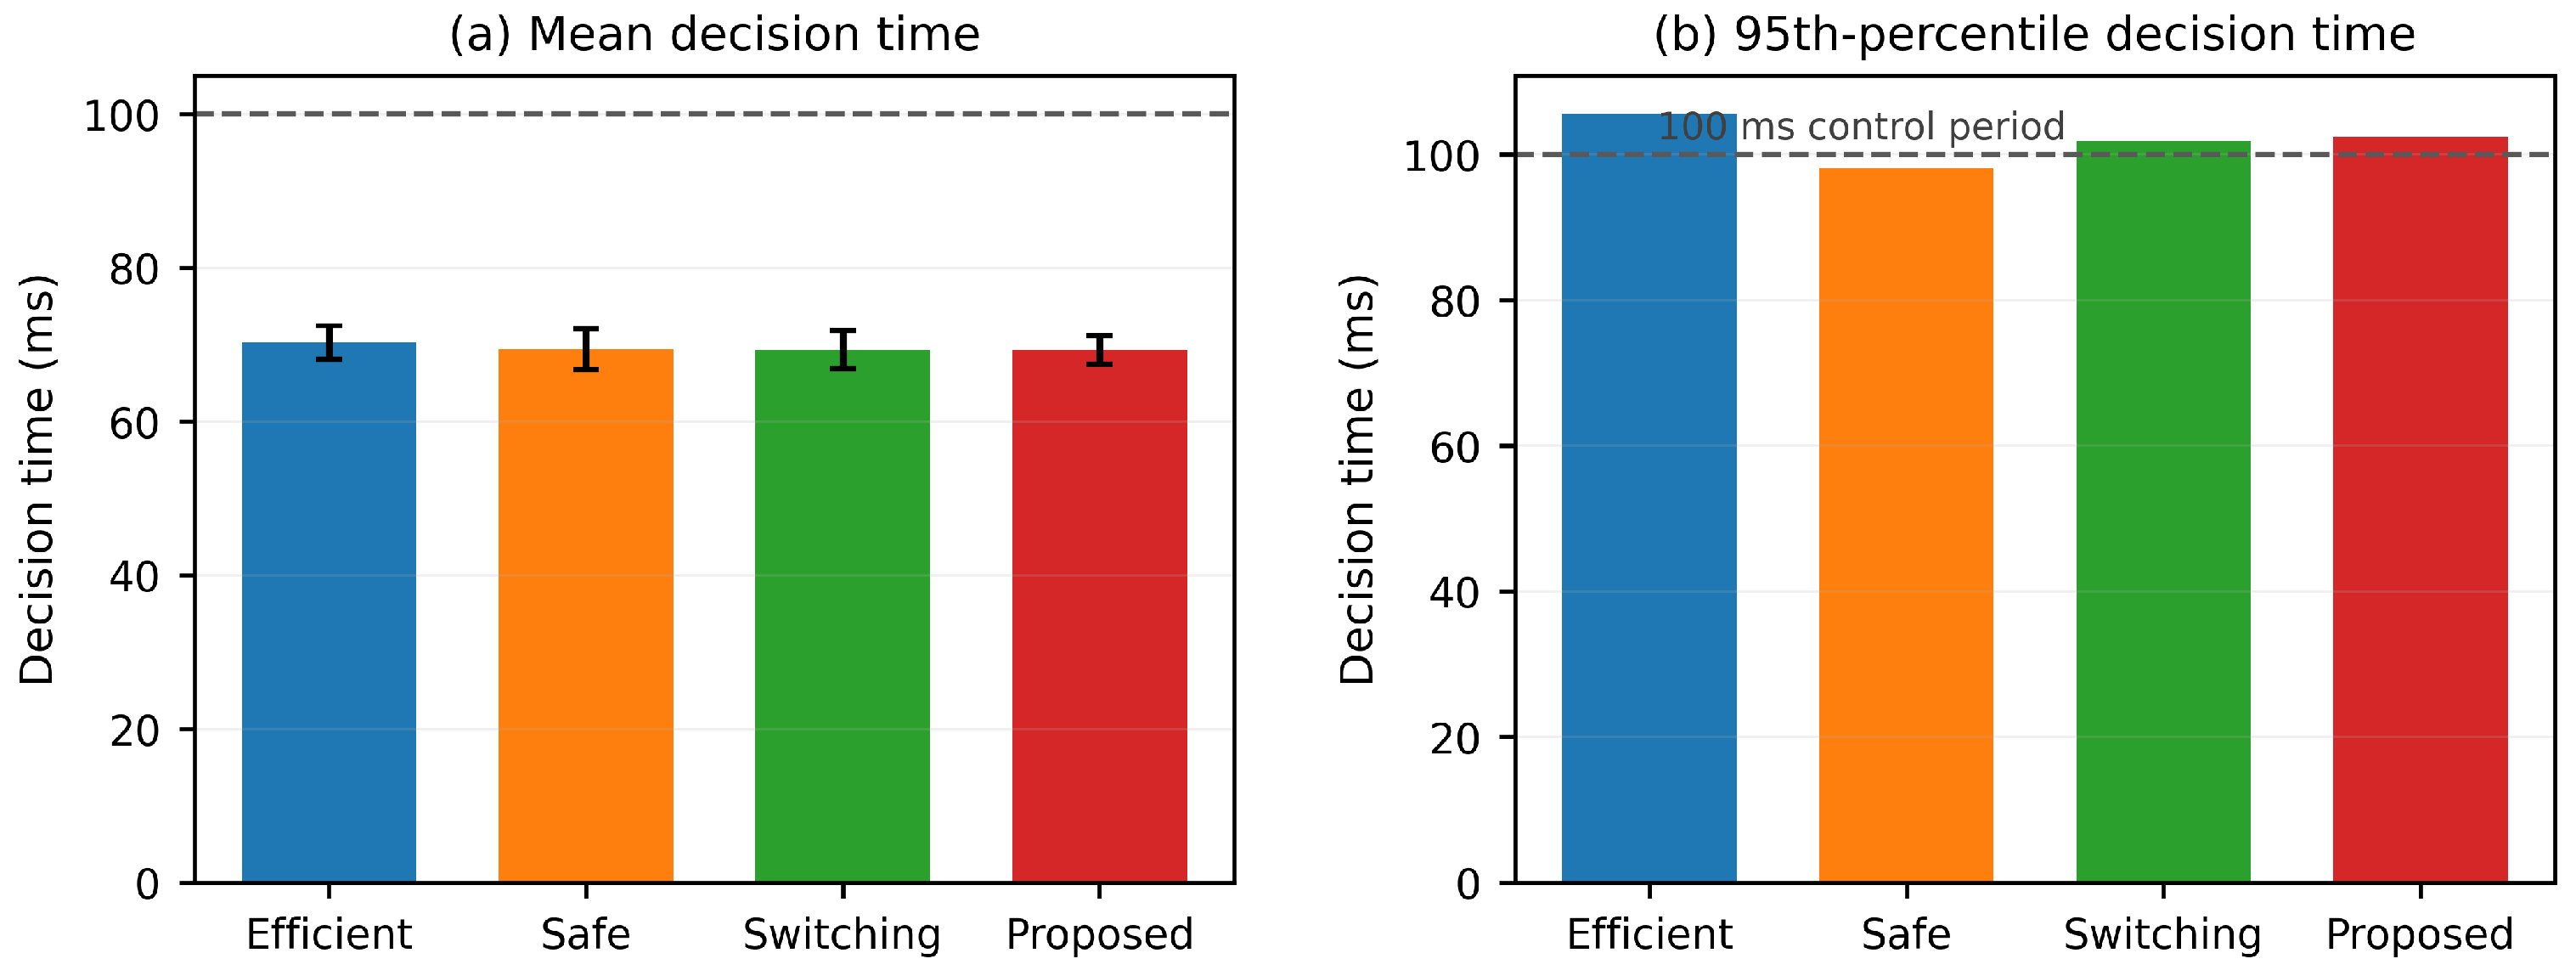
Computation time is compared using the same 40 m route workload for the four main controllers. As summarized in Table 5 and Figure 12, the mean decision times are tightly clustered around 58 ms. Proposed has a mean decision time of 58.282 ms, while Efficient, Safe, and Switching require 57.990, 57.969, and 58.272 ms, respectively. The corresponding mean 95th-percentile decision times are 74.214, 73.159, 73.287, and 74.075 ms. Hence, the continuous three-parameter adaptation introduces no practically meaningful average computational overhead relative to the other candidate-based controllers.
Table 5.
Decision-time statistics on the common 40 m extended-route workload.
Figure 12.
Decision-time statistics for the four main controllers under the same extended-route workload. The dashed line denotes the 100 ms nominal control period.
The tabulated P95 value is the mean of the 95th-percentile decision times first computed within individual extended-route runs, rather than the 95th percentile of all pooled decisions. All four methods have mean and mean P95 decision times below the 100 ms nominal period. However, the mean of run-wise maxima exceeds the period for several methods (Efficient: 112.790 ms; Safe: 119.819 ms; Proposed: 111.060 ms); the single largest recorded Proposed step is 132.424 ms. These are different timing statistics and demonstrate occasional deadline overruns. The results, therefore, indicate computational feasibility potential for the Python implementation, not deterministic real-time execution on an embedded robot.
6. Discussion
The experiments indicate that the value of the proposed controller does not arise from a larger obstacle penalty alone. Three observations support this interpretation. First, the delay-induced distance-estimation error is dramatically smaller for Proposed than for the fixed and switching baselines. Under a 1.0 s delay, the three baselines overestimate the true clearance by approximately 0.20–0.28 m on average, whereas the signed error of Proposed is only 0.018 m. The controller, therefore, makes its safety–efficiency decision using a substantially less optimistic representation of pedestrian clearance.
Second, the adaptive parameterization changes several mutually coupled aspects of behavior. Raising only the pedestrian weight while retaining an aggressive speed target can produce a trajectory that still approaches an interaction too quickly and then reacts sharply. Equation (13) instead lowers the desired speed while simultaneously increasing the pedestrian-avoidance and smoothness weights. The resulting transition is continuous. This helps explain why Proposed is substantially smoother than Switching in the main experiment while also reducing collision frequency and duration.
Third, the ablation trend is strongly delay-dependent. Proposed and No Delay Awareness coincide when , which is consistent with the formulation because no delay compensation is required when . The delay-compensation mechanism should have no effect when there is no delay to compensate. As increases, the complete method separates progressively from both ablations. This behavior links the observed improvement directly to the sensing-latency problem that motivates the controller.
The results reveal a clear safety–efficiency trade-off among the four controllers. Safe deliberately sacrifices speed to maximize clearance and remains superior in several high-density or sustained long-route high-delay conditions. Efficient can be fastest among the runs that it successfully completes, but its goal-reaching rate and collision metrics deteriorate markedly. Proposed instead targets a middle operating point: substantially improved safety relative to Efficient, improved safety and smoothness relative to Switching in the main corridor, and full goal-reaching reliability across all tested Proposed runs. The separate reporting of , , and is, therefore, essential; using an all-run mean completion time would mix timeout failures with true navigation efficiency and could lead to an incorrect interpretation.
Among the 120 main-corridor runs, Proposed successfully reaches the target region in all cases, with 83 runs satisfying the collision-free criterion. The goal-reaching condition m provides the terminal convergence criterion used in the simulations, while collision-related indicators independently characterize pedestrian-interaction safety. The controller employs a finite-horizon predictive optimization framework without an explicit Lyapunov terminal constraint; the reported convergence performance is, therefore, evaluated through the simulated task-completion results.
For practical implementation, camera- or LiDAR-based pedestrian tracking can provide timestamped position and velocity estimates, while wheel odometry and inertial measurements provide the robot state. The delay-compensation and candidate-based MPC modules can be executed on an onboard computing platform, with the resulting linear and angular velocity commands transmitted to the low-level motion controller. This architecture supports integration with a conventional autonomous delivery-robot navigation system.
Several limitations remain. The quantitative comparisons focus on three baseline strategies implemented within the same robot model and candidate-search framework. This controlled design evaluates the contribution of risk-adaptive scheduling, while comparison with independently developed contemporary navigation algorithms remains outside the present experimental scope. The current simulations employ prescribed pedestrian trajectories with constant-speed motion segments and known observation delays. Future evaluations will consider pedestrian acceleration, unpredictable direction changes, time-varying sensing latency, and perception uncertainty. The extended 40 m scenario provides additional sequential interactions, while broader environmental configurations and physical robot experiments will further examine practical applicability. The measured computational performance also motivates implementation-level optimization for onboard real-time execution.
7. Conclusions
This paper presented a delay-aware risk-adaptive MPC for local delivery-robot navigation in pedestrian corridors. Delayed pedestrian observations are compensated through short-term motion prediction, and a normalized interaction risk continuously coordinates the reference speed, pedestrian-avoidance weight, and motion-smoothness weight. The approach, therefore, transitions gradually between efficiency-oriented and conservative behavior instead of relying on a fixed parameter set or discrete safe/efficient switching.
Across 480 main corridor runs, Proposed achieved a 100% goal-reaching rate and a 69.2% collision-free run rate. Relative to Efficient, it reduced collision count by 61.5%, collision duration by 74.8%, and increased minimum robot–human distance by 55.9%, while increasing successful-run completion time by only 6.9%. At a 1.0 s observation delay, collision count was 70.2% lower than Efficient and 49.9% lower than Switching. The delay-aware formulation reduced the 1.0 s absolute clearance-estimation error to 0.056 m, compared with 0.259–0.333 m for the main baselines under the tested constant-speed-segment pedestrian model. Ablation experiments confirmed that both delay awareness and adaptive weighting contribute to the improvement.
The 40 m extended route was evaluated using the same 0.3 m goal-reaching criterion as the local corridor. Proposed retained a 100% goal-reaching rate and achieved the highest collision-free run rate (70%) among the four main strategies, while reducing collision count by 79.2% relative to Efficient and by 33.3% relative to Switching. Its mean decision time was 58.282 ms and its mean 95th-percentile decision time was 74.214 ms, both below the 100 ms nominal control period, although run-level timing maxima still preclude a hard real-time guarantee.
These results demonstrate the effectiveness of combining observation-delay compensation with continuous risk-adaptive MPC parameter scheduling for pedestrian-corridor navigation. The proposed method improves the safety–efficiency balance across the evaluated density and delay conditions. Further work will extend the method to richer pedestrian uncertainty models, stricter constraint handling, implementation-level acceleration, and real-robot experiments.
Author Contributions
Conceptualization, N.Z. and Z.Y.; methodology, N.Z.; software, N.Z. and J.L.; validation, J.L., Y.P., Y.G. and H.C.; formal analysis, N.Z. and J.L.; investigation, N.Z., Y.P. and Y.G.; data curation, J.L. and H.C.; writing—original draft preparation, N.Z.; writing—review and editing, N.Z. and Z.Y.; visualization, N.Z. and J.L.; supervision, Z.Y.; project administration, Z.Y.; funding acquisition, Z.Y. All authors have read and agreed to the published version of the manuscript.
Funding
This research was funded by the Open Fund of Key Laboratory of Automotive Power Train and Electronic Control (Grant No. ZDK12025B10), the Yancheng Municipal Young Scientists Fund for Applied Basic Research (Grant No. YCBK2026062), and the Scientific Research Startup Fund for High-Level Talents of Yancheng Institute of Technology (Grant No. xjr2025025).
Institutional Review Board Statement
Not applicable.
Informed Consent Statement
Not applicable.
Data Availability Statement
A public research repository is available at https://gitee.com/zhunx17885/delay-aware-risk-adaptive-mpc-for-delivery-robot-navigation (accessed on 22 October 2026). The repository provides a README describing the controller formulation and experimental settings, three representative result figures, and a license file. The simulation data and analysis scripts supporting the findings of this study are available from the corresponding author upon reasonable request.
Acknowledgments
The authors would like to thank the colleagues who provided technical support for the simulation study.
Conflicts of Interest
The authors declare no conflicts of interest.
Abbreviations
The following abbreviations are used in this manuscript:
| MPC | Model predictive control |
| SEM | Standard error of the mean |
| P95 | 95th percentile |
References
- Alverhed, E.; Hellgren, S.; Isaksson, H.; Olsson, L.; Palmqvist, H.; Flodén, J. Autonomous Last-Mile Delivery Robots: A Literature Review. Eur. Transp. Res. Rev. 2024, 16, 4. [Google Scholar] [CrossRef] [Scilit]
- Jennings, D.; Figliozzi, M. Study of Sidewalk Autonomous Delivery Robots and Their Potential Impacts on Freight Efficiency and Travel. Transp. Res. Rec. 2019, 2673, 317–326. [Google Scholar] [CrossRef] [Scilit]
- Malisetty, V.A.B.; Patatouka, E.; Raptis, O.; Antonakopoulou, A.; Amditis, A.; Silani, E.; Cepolina, E.M. Field-Driven Lessons Learned for Delivery Robots Logistics Operation in Urban Environment. In Shared Mobility Revolution; Springer: Cham, Switzerland, 2025; pp. 97–117. [Google Scholar] [CrossRef] [Scilit]
- Pani, A.; Mishra, S.; Golias, M.; Figliozzi, M. Evaluating Public Acceptance of Autonomous Delivery Robots during COVID-19 Pandemic. Transp. Res. Part D Transp. Environ. 2020, 89, 102600. [Google Scholar] [CrossRef] [Scilit]
- Weinberg, D.; Dwyer, H.; Fox, S.E.; Martelaro, N. Sharing the Sidewalk: Observing Delivery Robot Interactions with Pedestrians during a Pilot in Pittsburgh, PA. Multimodal Technol. Interact. 2023, 7, 53. [Google Scholar] [CrossRef] [Scilit]
- Gehrke, S.R.; Phair, C.D.; Russo, B.J.; Smaglik, E.J. Observed Sidewalk Autonomous Delivery Robot Interactions with Pedestrians and Bicyclists. Transp. Res. Interdiscip. Perspect. 2023, 18, 100789. [Google Scholar] [CrossRef] [Scilit]
- Yu, X.; Hoggenmüller, M.; Tran, T.T.M.; Wang, Y.; Tomitsch, M. Understanding the Interaction between Delivery Robots and Other Road and Sidewalk Users: A Study of User-Generated Online Videos. ACM Trans. Hum.-Robot Interact. 2024, 13, 1–32. Article 59. [Google Scholar] [CrossRef] [Scilit]
- Tong, X.; Simoni, M.D. Robust Route Planning for Sidewalk Delivery Robots. Transp. Res. Part C Emerg. Technol. 2026, 188, 105670. [Google Scholar] [CrossRef] [Scilit]
- Kruse, T.; Pandey, A.K.; Alami, R.; Kirsch, A. Human-Aware Robot Navigation: A Survey. Robot. Auton. Syst. 2013, 61, 1726–1743. [Google Scholar] [CrossRef] [Scilit]
- Mavrogiannis, C.; Baldini, F.; Wang, A.; Zhao, D.; Trautman, P.; Steinfeld, A.; Oh, J. Core Challenges of Social Robot Navigation: A Survey. ACM Trans. Hum.-Robot Interact. 2023, 12, 1–39. [Google Scholar] [CrossRef] [Scilit]
- Alyassi, R.; Cadena, C.; Riener, R.; Páez-Granados, D. Social Robot Navigation: A Review and Benchmarking of Learning-Based Methods. Front. Robot. AI 2025, 12, 1658643. [Google Scholar] [CrossRef] [Scilit] [PubMed]
- Khatib, O. Real-Time Obstacle Avoidance for Manipulators and Mobile Robots. Int. J. Robot. Res. 1986, 5, 90–98. [Google Scholar] [CrossRef] [Scilit]
- Koren, Y.; Borenstein, J. Potential Field Methods and Their Inherent Limitations for Mobile Robot Navigation. In Proceedings of the 1991 IEEE International Conference on Robotics and Automation, Sacramento, CA, USA, 9–11 April 1991; pp. 1398–1404. [Google Scholar] [CrossRef] [Scilit]
- Fox, D.; Burgard, W.; Thrun, S. The Dynamic Window Approach to Collision Avoidance. IEEE Robot. Autom. Mag. 1997, 4, 23–33. [Google Scholar] [CrossRef] [Scilit]
- van den Berg, J.; Lin, M.C.; Manocha, D. Reciprocal Velocity Obstacles for Real-Time Multi-Agent Navigation. In Proceedings of the 2008 IEEE International Conference on Robotics and Automation, Pasadena, CA, USA, 19–23 May 2008; pp. 1928–1935. [Google Scholar] [CrossRef] [Scilit]
- Trautman, P.; Ma, J.; Murray, R.M.; Krause, A. Robot Navigation in Dense Human Crowds: Statistical Models and Experimental Studies of Human–Robot Cooperation. Int. J. Robot. Res. 2015, 34, 335–356. [Google Scholar] [CrossRef] [Scilit]
- Chen, Y.F.; Everett, M.; Liu, M.; How, J.P. Socially Aware Motion Planning with Deep Reinforcement Learning. In Proceedings of the 2017 IEEE/RSJ International Conference on Intelligent Robots and Systems, Vancouver, BC, Canada, 24–28 September 2017; pp. 1343–1350. [Google Scholar] [CrossRef] [Scilit]
- Everett, M.; Chen, Y.F.; How, J.P. Collision Avoidance in Pedestrian-Rich Environments with Deep Reinforcement Learning. IEEE Access 2021, 9, 10357–10377. [Google Scholar] [CrossRef] [Scilit]
- Chen, C.; Liu, Y.; Kreiss, S.; Alahi, A. Crowd-Robot Interaction: Crowd-Aware Robot Navigation with Attention-Based Deep Reinforcement Learning. In Proceedings of the 2019 International Conference on Robotics and Automation, Montreal, QC, Canada, 20–24 May 2019; pp. 6015–6022. [Google Scholar] [CrossRef] [Scilit]
- Wang, A.; Mavrogiannis, C.; Steinfeld, A. Group-Based Motion Prediction for Navigation in Crowded Environments. In Proceedings of the 5th Conference on Robot Learning, PMLR, London, UK, 8–11 November 2021; Volume 164, pp. 871–882. [Google Scholar]
- Kretzschmar, H.; Spies, M.; Sprunk, C.; Burgard, W. Socially Compliant Mobile Robot Navigation via Inverse Reinforcement Learning. Int. J. Robot. Res. 2016, 35, 1289–1307. [Google Scholar] [CrossRef] [Scilit]
- Le, H.; Saeedvand, S.; Hsu, C.C. A Comprehensive Review of Mobile Robot Navigation Using Deep Reinforcement Learning Algorithms in Crowded Environments. J. Intell. Robot. Syst. 2024, 110, 158. [Google Scholar] [CrossRef] [Scilit]
- Helbing, D.; Molnár, P. Social Force Model for Pedestrian Dynamics. Phys. Rev. E 1995, 51, 4282–4286. [Google Scholar] [CrossRef] [Scilit] [PubMed]
- Alahi, A.; Goel, K.; Ramanathan, V.; Robicquet, A.; Fei-Fei, L.; Savarese, S. Social LSTM: Human Trajectory Prediction in Crowded Spaces. In Proceedings of the IEEE Conference on Computer Vision and Pattern Recognition, Las Vegas, NV, USA, 27–30 June 2016; pp. 961–971. [Google Scholar] [CrossRef] [Scilit]
- Gupta, A.; Johnson, J.; Fei-Fei, L.; Savarese, S.; Alahi, A. Social GAN: Socially Acceptable Trajectories with Generative Adversarial Networks. In Proceedings of the IEEE Conference on Computer Vision and Pattern Recognition, Salt Lake City, UT, USA, 18–22 June 2018; pp. 2255–2264. [Google Scholar] [CrossRef] [Scilit]
- Mohamed, A.; Qian, K.; Elhoseiny, M.; Claudel, C. Social-STGCNN: A Social Spatio-Temporal Graph Convolutional Neural Network for Human Trajectory Prediction. In Proceedings of the IEEE/CVF Conference on Computer Vision and Pattern Recognition, Online, 14–19 June 2020; pp. 14412–14420. [Google Scholar] [CrossRef] [Scilit]
- Salzmann, T.; Ivanovic, B.; Chakravarty, P.; Pavone, M. Trajectron++: Dynamically-Feasible Trajectory Forecasting with Heterogeneous Data. In Proceedings of the Computer Vision—ECCV 2020; Lecture Notes in Computer Science; Springer: Cham, Switzerland, 2020; Volume 12363, pp. 683–700. [Google Scholar] [CrossRef] [Scilit]
- Yuan, Y.; Weng, X.; Ou, Y.; Kitani, K.M. AgentFormer: Agent-Aware Transformers for Socio-Temporal Multi-Agent Forecasting. In Proceedings of the IEEE/CVF International Conference on Computer Vision, Online, 11–17 October 2021; pp. 9813–9823. [Google Scholar] [CrossRef] [Scilit]
- Galvão, L.G.; Huda, M.N. Pedestrian and Vehicle Behaviour Prediction in Autonomous Vehicle System—A Review. Expert Syst. Appl. 2024, 238, 121983. [Google Scholar] [CrossRef] [Scilit]
- Liu, Q.; Shi, X.; Jiang, R.; Zhang, H.; Lu, L.; Shibasaki, R. Modeling Interpretable Social Interactions for Pedestrian Trajectory. Transp. Res. Part C Emerg. Technol. 2024, 162, 104617. [Google Scholar] [CrossRef] [Scilit]
- Rawlings, J.B.; Mayne, D.Q.; Diehl, M.M. Model Predictive Control: Theory, Computation, and Design, 2nd ed.; Nob Hill Publishing: Madison, WI, USA, 2017. [Google Scholar]
- Chen, Y.; Zhao, F.; Lou, Y. Interactive Model Predictive Control for Robot Navigation in Dense Crowds. IEEE Trans. Syst. Man. Cybern. Syst. 2022, 52, 2289–2301. [Google Scholar] [CrossRef] [Scilit]
- Jian, Z.; Yan, Z.; Lei, X.; Lu, Z.; Lan, B.; Wang, X.; Liang, B. Dynamic Control Barrier Function-Based Model Predictive Control to Safety-Critical Obstacle-Avoidance of Mobile Robot. In Proceedings of the 2023 IEEE International Conference on Robotics and Automation, London, UK, 29 May–2 June 2023; pp. 3679–3685. [Google Scholar] [CrossRef] [Scilit]
- Arul, S.H.; Park, J.J.; Prem, V.; Zhang, Y.; Manocha, D. Unconstrained Model Predictive Control for Robot Navigation under Uncertainty. In Proceedings of the 2024 IEEE International Conference on Robotics and Automation, Yokohama, Japan, 13–17 May 2024; pp. 9321–9327. [Google Scholar] [CrossRef] [Scilit]
- Gao, Y.; Messerer, F.; van Duijkeren, N.; Diehl, M. Stochastic Model Predictive Control with Optimal Linear Feedback for Mobile Robots in Dynamic Environments. IFAC-PapersOnLine 2024, 58, 153–158. [Google Scholar] [CrossRef] [Scilit]
- Samavi, S.; Han, J.R.; Shkurti, F.; Schoellig, A.P. SICNav: Safe and Interactive Crowd Navigation Using Model Predictive Control and Bilevel Optimization. IEEE Trans. Robot. 2025, 41, 801–818. [Google Scholar] [CrossRef] [Scilit]
- Akhtyamov, T.; Kashirin, A.; Postnikov, A.; Sosin, I.; Ferrer, G. Social Robot Navigation through Constrained Optimization: A Comprehensive Study of Uncertainty-Based Objectives and Constraints in the Simulated and Real World. Robot. Auton. Syst. 2025, 183, 104830. [Google Scholar] [CrossRef] [Scilit]
- Aslam, M.P.; Derajic, B.; Bouzidi, M.K.; Bernhard, S.; Ringert, J.O. Model Predictive Control for Crowd Navigation via Learning-Based Trajectory Prediction. In Proceedings of the 22nd International Conference on Informatics in Control, Automation and Robotics; INSTICC, SciTePress: Marbella, Spain, 20–22 October 2025; Volume 2, pp. 251–258. [Google Scholar] [CrossRef] [Scilit]
- Das, B.; Dobie, G. Delay Compensated State Estimation for Telepresence Robot Navigation. Robot. Auton. Syst. 2021, 146, 103890. [Google Scholar] [CrossRef] [Scilit]
- Bugueño-Córdova, I.; Ruiz-del Solar, J.; Verschae, R. Human-Robot Navigation Using Event-Based Cameras and Reinforcement Learning. In Proceedings of the IEEE/CVF Conference on Computer Vision and Pattern Recognition Workshops, Nashville, TN, USA, 11–12 June 2025; pp. 5043–5051. [Google Scholar]
- Huang, B.; Allebosch, G.; Willems, T.; Veelaert, P.; Philips, W.; Aelterman, J. Low Latency Crossing Pedestrian Detection by Dynamic Vision Sensor and RGB Camera. J. Intell. Robot. Syst. 2026, 112, 22. [Google Scholar] [CrossRef] [Scilit]

Disclaimer/Publisher’s Note: The statements, opinions and data contained in all publications are solely those of the individual author(s) and contributor(s) and not of MDPI and/or the editor(s). MDPI and/or the editor(s) disclaim responsibility for any injury to people or property resulting from any ideas, methods, instructions or products referred to in the content. |
© 2026 by the authors. Licensee MDPI, Basel, Switzerland. This article is an open access article distributed under the terms and conditions of the Creative Commons Attribution (CC BY) license.