


Abstract
The proviral load (PVL) of bovine leukemia virus (BLV) is associated with viral transmission and disease progression to BLV-induced enzootic bovine leukosis and is influenced by genetic polymorphisms of the bovine leukocyte antigen (BoLA)-DRB3 gene. However, its host genetic determinants remain partially defined because additional host events are necessary for BLV infection outcomes. We performed a genome-wide association study of 113 BLV-positive Holstein cattle to identify novel single-nucleotide polymorphisms (SNPs). We first compared 33 high-PVL and 37 low-PVL cattle using 582,324 quality-controlled SNPs. Two SNPs, rs110742604 and rs137368875, exceeding the Bonferroni-corrected significance threshold, were identified in the BoLA class I region of chromosome 23. Kompetitive allele-specific PCR (KASP) assays were developed for both SNPs, and three genotype calls (TT, TC, and CC) were concordant with Sanger sequencing in all samples. Further, genotyping was performed for rs110742604 and rs137368875 in 364 and 362 cattle, respectively. At both loci, the C allele was associated with a lower PVL, with the lowest PVL observed in CC animals. In a combined genotype of three resistance markers, BoLA-DRB3 resistance-associated alleles, rs110742604-CC and rs137368875-CC, stepwise enrichment in cattle with low PVL was dependent on the increasing number of candidate resistance markers; further, 11 of 12 cattle carrying all three markers showed a tendency toward low PVL, and none had high PVL. These findings identify candidate host biomarkers for BLV PVL and establish rapid assays for large-scale validation. Replication across breeds and functional characterization are required before incorporation into genomic selection or integrated control programs for BLV.
1. Introduction
Bovine leukemia virus (BLV), belonging to the Deltaretrovirus genus of the Retroviridae family, establishes lifelong infection and causes enzootic bovine leukosis (EBL). Most infected cattle remain clinically asymptomatic; approximately one-third develop persistent lymphocytosis, and only a small proportion progress to B-cell lymphoma after a prolonged latency period [1,2,3]. Despite the relatively low incidence of overt malignancy, BLV remains important because infected animals constitute a long-term reservoir, and infection is widespread in major cattle-producing regions [4]. A nationwide survey conducted between 2009 and 2011 in Japan found BLV seropositivity in 40.9% of dairy cattle and 28.7% of beef breeding cattle [5]. In countries or herds with a high prevalence, test-and-cull programs can be economically difficult to sustain, indicating the need for control strategies that prioritize animals based on their contribution to transmission and disease risk. The impact of BLV is not limited to clinical lymphoma: infection has been associated with reduced carcass value, shortened productive life, and lower milk production [6,7,8,9,10,11]. Chronic BLV infection can also impair immune function, potentially increase susceptibility to secondary diseases, and amplify veterinary and management costs [12,13,14].
As a retrovirus, BLV integrates its genome into host DNA as a provirus, resulting in lifelong infection. The BLV proviral load (PVL), defined as the number of integrated proviral copies, is a central quantitative marker of infection status. The BLV-CoCoMo-qPCR system enables sensitive quantification across diverse BLV variants [15], and subsequent studies have demonstrated that PVL is associated with the number of infected cells, viral biokinetics, the BLV biodistribution in the organs during the early stages of experimentally infected cattle, viral infectivity, transmission potential and disease progression [15,16,17,18,19,20,21,22]. Further, previous studies have shown that the BLV provirus can be detected in the milk, nasal mucus, and saliva of dairy cattle with PVLs of >10,000, 14,000, and 18,000 copies/105 cells in their blood samples, respectively [23,24]. Overall, these results suggest that a PVL of approximately 10,000 copies/105 cells in blood may indicate efficient BLV spreading throughout the body, which is a relatively high number. Therefore, a BLV PVL of 10,000 copies/105 cells was set as the threshold for distinguishing between high- and low-PVL cows [25,26]. Therefore, cattle maintaining a low PVL are reported to pose little detectable transmission risk to BLV-free herd mates, whereas a high or increasing PVL is associated with a greater risk of transmission [17,18,19,20,27,28,29]. Therefore, PVL provides a biologically and operationally meaningful phenotype for identifying the host factors influencing BLV control.
Host genetic variation is a major determinant of interindividual differences in PVL. The best characterized effect involves a highly polymorphic bovine leukocyte antigen (BoLA) region. BoLA-DRB3 encodes the β-chain of a major histocompatibility complex (MHC) class II molecule that presents extracellularly derived peptides to CD4+ T cells; therefore, allelic variation at this locus is biologically relevant to antiviral immune recognition and presents a highly polymorphic gene located on bovine chromosome 23 (BTA23) [30]. In total, 387 alleles were registered in the immunopolymorphism database-major histocompatibility complex (IPD-MHC) database (https://www.ebi.ac.uk/ipd/mhc/group/BoLA/) (accessed on 27 July 2026). Among the alleles, in Japanese cattle populations, BoLA-DRB3*002:01, *009:02, and *014:01:01 have been used as resistance-associated alleles because their carriers tend to maintain lower BLV PVL or infectivity, whereas BoLA-DRB3*012:01 and *015:01 have been classified as susceptibility-associated alleles linked to higher PVL [19,25,26,28]. However, the effects of the BoLA-DRB3 allele can vary with breed, population, heterozygosity, and epidemiological context [25,26,31,32,33,34,35,36,37,38,39,40,41]. Further, EBL is a multifactorial disease caused by a complex interplay between host genetic, environmental, and viral factors [1]. Therefore, because BLV disease susceptibility cannot be reliably determined based solely on polymorphism of the BoLA-DRB3 gene, novel genomic markers related to BLV PVL in addition to BoLA-DRB3 need to be identified.
Genome-wide association studies (GWAS) provide an unbiased approach for identifying additional host determinants. Previous GWAS have also identified several single-nucleotide polymorphisms (SNPs) related to BLV PVL in the BoLA region and elsewhere in the genome of Japanese Black and dairy cattle: one SNP within the spermatogenesis associated 16 (SPATA16)-coding region on BTA 1, which was evaluated across breeds [42], SNPs were located on BTA 23, 3, and 8 in close vicinity of patatin-like phospholipase domain containing 1 (PNPLA1), adaptor-related protein complex 4, beta 1 subunit (AP4B1), tripartite motif-containing 45 (TRIM45), and cell division cycle associated 2 (CDCA2) genes, respectively [43]; 1 SNP in the contactin 3 (CNTN3) gene on chromosome 22, and 2 in the BoLA region on BTA 23 [44], and 24 SNPs in close vicinity of genes related to immune response, cell cytoskeletal reorganization, the extracellular matrix genes and host transcription factors within the BoLA region [45]. However, several limitations have restricted the translation of these findings, including the use of medium-density arrays [43,44,45] and insufficient independent population-level validation [42,43,44,45]. Only a few association signals have been converted into rapid assays suitable for routine screening. Moreover, many GWAS variants are non-coding; therefore, association alone cannot identify the regulated gene or establish a causal mechanism.
The available control measures include hygiene management, segregation, selective replacement, and test-and-cull programs; however, their feasibility strongly depends on herd prevalence and economic circumstances [46]. Genetic markers that can reproducibly identify cattle that are predisposed to low PVL levels may complement PVL testing and herd management. Indeed, an integrated BLV eradication program using cattle with the resistant BoLA-DRB3 allele as biological barriers and preferentially eliminating cattle with a susceptible BoLA-DRB3 allele has shown practical potential [47]. A low-cost genotyping method would make it feasible to test candidate markers in larger herds and, following appropriate validation, incorporate them into marker-assisted or genomic selection. Such selection should complement rather than replace biosecurity and longitudinal infection monitoring. Kompetitive Allele-Specific PCR (KASP) is particularly attractive for this translational step because competitive allele-specific PCR enables the rapid and flexible genotyping of a small number of target variants across many samples and has been used for high-throughput MHC screening and marker-assisted selection [48,49,50].
In this study, we used a high-density Illumina Bovine HD BeadChip and a mixed-model GWAS implemented in GEMMA [51] to identify BLV PVL-associated SNPs in Holstein cattle. Furthermore, we developed KASP assays for the significant SNPs, and verified their genotype calls using Sanger sequencing. We also evaluated their association with PVL in an independent Holstein population. Finally, we evaluated the relationship between combined BoLA-DRB3 and SNP marker status and low PVL; overall, the study was designed to bridge SNP discovery, independent validation, and assay development, with the long-term objective of developing scalable genetic tools for BLV control.
2. Materials and Methods
2.1. Study Populations and Sample Selection
Blood samples were collected for GWAS from 113 BLV-infected clinically asymptomatic Holstein cattle from BLV-positive farms and slaughter-inspection facilities in Japan. For independent validation using the KASP assay, blood samples from 364 Holstein cattle that were not included in the GWAS discovery population were used for targeted SNP genotyping and PVL association analysis. All animals were handled by veterinarians in accordance with the guidelines of the University of Tokyo. This study was approved by the Animal Experiments Committee of the University of Tokyo (Approval Number p22–2–030; Approval date, 22 May 2022).
2.2. Genomic DNA Extraction and BLV Proviral Load Quantification
Genomic DNA was extracted from 300 µL of ethylenediaminetetraacetic acid (EDTA)-treated whole blood using the Wizard Genomic DNA Purification Kit (Promega Corporation, Madison, WI, USA) according to the manufacturer’s protocol. DNA concentration and quality were evaluated using a NanoDrop Spectrophotometer ND-1000 (Thermo Fisher Scientific, Waltham, MA, USA). DNA was diluted to 30 ng/µL with Nuclease-Free Water (Thermo Fisher Scientific). The BLV-positive status was determined using quantitative PCR (qPCR).
PVL was quantified from genomic DNA by BLV-CoCoMo-qPCR using the THUNDERBIRD Probe qPCR Mix (Toyobo, Tokyo, Japan) and BLV-CoCoMo-qPCR reagents (Nippon Gene, Toyama, Japan), as described previously [13]. Amplification was performed using a LightCycler 480 System II (Roche Diagnostics, Mannheim, Germany). Finally, the PVL was calculated using the following formula: (number of BLV long terminal repeat (LTR) copies/number of BoLA-DRA copies) × 105 cells. The BLV PVL was expressed as the number of copies per 105 cells.
2.3. High-Density SNP Genotyping and Quality Control
In total, 113 samples were genotyped using an Illumina Bovine HD Genotyping BeadChip (Illumina, Inc., San Diego, CA, USA) targeting 770,962 SNPs. Quality control was performed using PLINK v1.9 [52,53]. SNPs were retained when the minor allele frequency was >0.01, the SNP call rate was >0.95, and the Hardy–Weinberg equilibrium test yielded p > 0.001. Samples with a call rate ≤ 0.95 were excluded. After filtering, 582,324 SNPs were retained.
2.4. Genome-Wide Association and Linkage Disequilibrium Analyses
Cattle were categorized as low PVL (0–999 copies/105 cells; n = 37), intermediate PVL (1000–9999 copies/105 cells; n = 43), or high PVL (10,000–120,482 copies/105 cells; n = 33). For the primary extreme-phenotype analysis, high- and low-PVL groups were coded as a binary phenotype, and the intermediate group was excluded, yielding 70 animals for the primary association analysis. Genome-wide association testing was performed with GEMMA using a linear mixed model and genomic relatedness matrix [51]. Allelic odds ratios were calculated from allele counts in the high- and low-PVL groups to provide descriptive effect-size estimates.
The genome-wide significance threshold was set at p = 8.59 × 10⁻⁸ using Bonferroni correction (0.05/582,324) [54]. The genomic inflation factor (λGC) was calculated as the ratio of the median observed association test statistic to its expected median under the null hypothesis [55]. Association results were visualized as Manhattan plots using the qqman package in R [56]. Local linkage disequilibrium (LD) surrounding the two significant loci was evaluated with Haploview v4.2 by calculating r2 and D′ [57]. Variant positions and neighboring genes were annotated against the ARS-UCD1.2 bovine genome assembly.
2.5. KASP Genotyping
KASP assays targeting rs110742604 (SNPK10) and rs137368875 (SNPK11) were designed and synthesized by LGC Biosearch Technologies (Hoddesdon, UK). A total of 364 samples from BLV-infected cattle that were not included in the GWAS were used for the assay. Each 10 µL reaction contained 5 µL of 2× KASP-TF master mix, 0.14 µL of KASP assay mix, 4 µL of Nuclease-Free Water, and 1 µL of genomic DNA (30 ng/µL). Reactions were performed using the LightCycler 480 System II (Roche Diagnostics). The cycling program was 94 °C for 15 min; 10 touchdown cycles of 94 °C for 20 s and 61–55 °C for 60 s (decreasing by 0.6 °C per cycle); 26 cycles of 94 °C for 20 s and 55 °C for 60 s; and 30 °C for 60 s. Genotypes were assigned from allele-specific fluorescence clusters. The general suitability of KASP for targeted MHC screening and marker-assisted selection has been previously demonstrated [48,49,50].
2.6. Confirmation of KASP Genotypes Using Sanger Sequencing
To evaluate the KASP call accuracy, the genomic regions containing SNPk10 and SNPk11 were amplified from 61 and 22 samples, respectively, selected from the 364 cattle used in the validation study using PrimeSTAR GXL DNA Polymerase (TaKaRa Bio, Kusatsu, Japan). SNPK10 was amplified using forward primer 5′-AGATCCAGCAGAATCAAGAGAAG-3′ and reverse primer 5′-CACTCAAGAAGCCCAAGAGAA-3′ (475 bp). SNPK11 was amplified using forward primer 5′-CTCACTGAGGCTTGAAGAAGAA-3′ and reverse primer 5′-GGAGGACACCCAGCAATAAC-3′ (422 bp). The thermal cycle program comprised 98 °C for 10 s, followed by 30 cycles of 98 °C for 10 s, 60 °C for 15 s, and 68 °C for 1 min, with a final hold at 4 °C. Amplicons were purified using the FastGene Gel/PCR Extraction Kit (Nippon Genetics, Tokyo, Japan) and sequenced using Fasmac (Atsugi, Japan). Chromatograms were analyzed using SnapGene v8.0.1, and Sanger-derived genotypes were directly compared with KASP calls.
2.7. BoLA-DRB3 Genotyping
BoLA-DRB3 alleles were determined using the PCR-sequence-based typing (SBT) method described by Takeshima et al. (2011) [58]. Briefly, BoLA-DRB3 exon 2 was amplified through single-step PCR using the DRB3 forward (5′-CGCTCCTGTGAYCAGATCTATCC-3′) and reverse (5′-CACCCCCGCGCTCACC-3′) primer sets. The PCR products were purified using a FastGene Gel/PCR Extraction Kit (NIPPON Genetics Co., Ltd., Tokyo, Japan) and sequenced using FASMAC (Atsugi, Japan). Sequence data were analyzed using the Assign 400ATF ver. 1.0.2.45 software (Gonexio Genomics, Fremantle, Australia) to determine the BoLA-DRB3 genotype. When one or two alleles were detected, the samples were considered homozygous or heterozygous.
2.8. Classification and Exploratory Analysis for Combined-Resistance Markers
The BoLA-DRB3 genotypes available for the independent validation population were classified using previously applied resistance categories in Japanese Holstein cattle [25,28]: Cattle were divided into resistant, susceptible, and neutral groups based on the presence of BoLA-DRB3 alleles, as follows: susceptible cattle carried at least one BoLA-DRB3*012:01 or *015:01 allele in their genomes; resistant cattle carried at least one BoLA-DRB3*002:01, *009:02, or *014:01:01 allele in their genomes; and neutral cattle carried other alleles in their genomes. Importantly, resistance is a dominant trait and susceptibility is a recessive trait [31]. Therefore, cattle carrying both susceptible and resistant alleles were defined as resistant. In this study, cattle carrying at least one BoLA-DRB3*002:01, *009:02, or *014:01:01 allele were classified as BoLA resistant (BoLA-R). Animals carrying both resistance- and susceptibility-associated alleles remained in the BoLA-R group. The three evaluated candidate resistance markers were the BoLA-R status, rs110742604 CC genotype (SNPK10-CC), and rs137368875 CC genotype (SNPK11-CC).
The exact overlap among the three markers was enumerated. Cattle were then grouped according to the number of candidate resistance markers carried (zero to three), and the PVL distributions and proportions of low-PVL (<1000 copies/105 cells), intermediate-PVL (1000–9999 copies/105 cells), and high-PVL (≥10,000 copies/105 cells) animals were summarized. Two cattle lacking SNPK11 genotype calls were excluded, leaving 362 complete cases. PVL distributions across the marker-count groups were compared using the Kruskal–Wallis test. This analysis was pre-specified as exploratory and descriptive; it was not adjusted for farm or population covariates and was not used to infer independent, additive, or synergistic marker effects.
2.9. Statistical Analysis
PVL distributions among the TT, TC, and CC genotypes were compared using the Kruskal–Wallis test followed by Dunn’s multiple-comparison test with Bonferroni-adjust.
3. Results
3.1. Identification of Two PVL-Associated SNPs Using Genome-Wide Association Analysis
PVL is an important diagnostic index for determining disease progression and transmission risk in BLV infections. PVL in peripheral blood strongly correlates with infection status, transmission potential, and disease development [15,17,18,19,20,21]. Therefore, we used it to identify SNPs associated with BLV PVL in Holstein cattle using the high-density Illumina BovineHD BeadChip and a mixed-model GWAS implemented in GEMMA. First, PVL was measured in 113 dairy cattle using the BLV-CoCoMo-qPCR assay (Table 1). PVL values ranged from 0 to 120,482 copies per 105 cells. Referring to previous studies [34,35,59], we classified cattle into three groups based on distribution: the top 30% as high PVL, the bottom 30% as low PVL, and the remaining animals as moderate PVL. In total, 113 BLV-positive Holstein cattle were classified according to PVL as low-PVL (0–999 copies per 105 cells; n = 37), intermediate-PVL (1000–9999 copies per 105 cells; n = 43), or high-PVL (10,000–120,482 copies per 105 cells; n = 33). Next, we performed a GWAS using these traits as binary variables, as was done in 33 cases (high-PVL group) and 37 controls (low-PVL group). The 43 cattle with intermediate PVL were excluded from the extreme phenotypic comparison. The 70 animals were genotyped using the Illumina Bovine HD BeadChip targeting 770,962 SNPs. After quality control, 582,324 SNPs met the quality control criteria (call rate > 95%, minor allele frequency > 0.01, SNP call rate > 0.95, Hardy–Weinberg equilibrium, p > 0.001). Analyses were then performed using GEMMA, which uses a genetic relatedness matrix within a linear mixed-model framework to reduce confounding from the population structure [51].
Table 1.
Classification of BLV-positive Holstein cattle according to proviral load. 1 BLV proviral load is expressed as copies per 105 cells. The HPVL and LPVL groups (see Data S1) were used for the binary-phenotype GWAS.
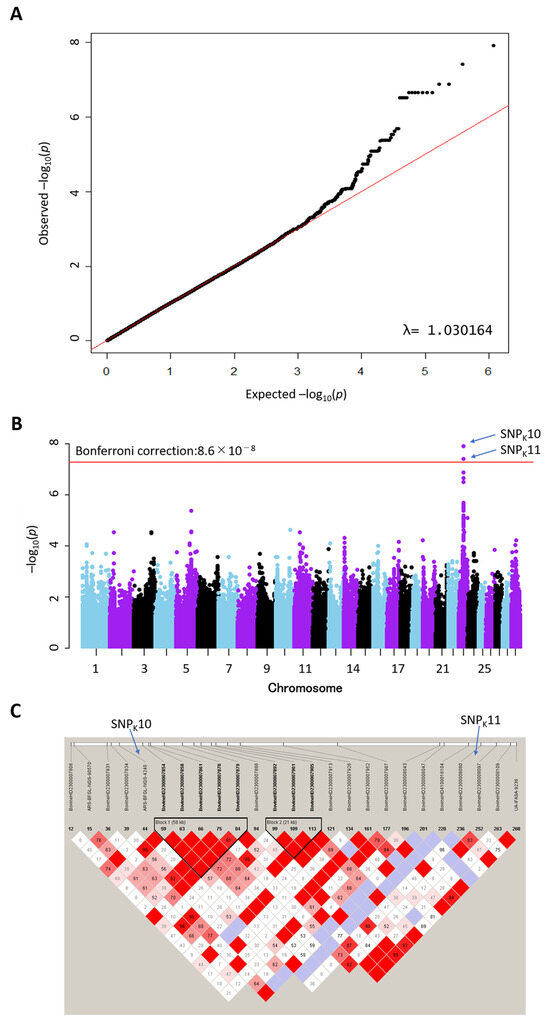
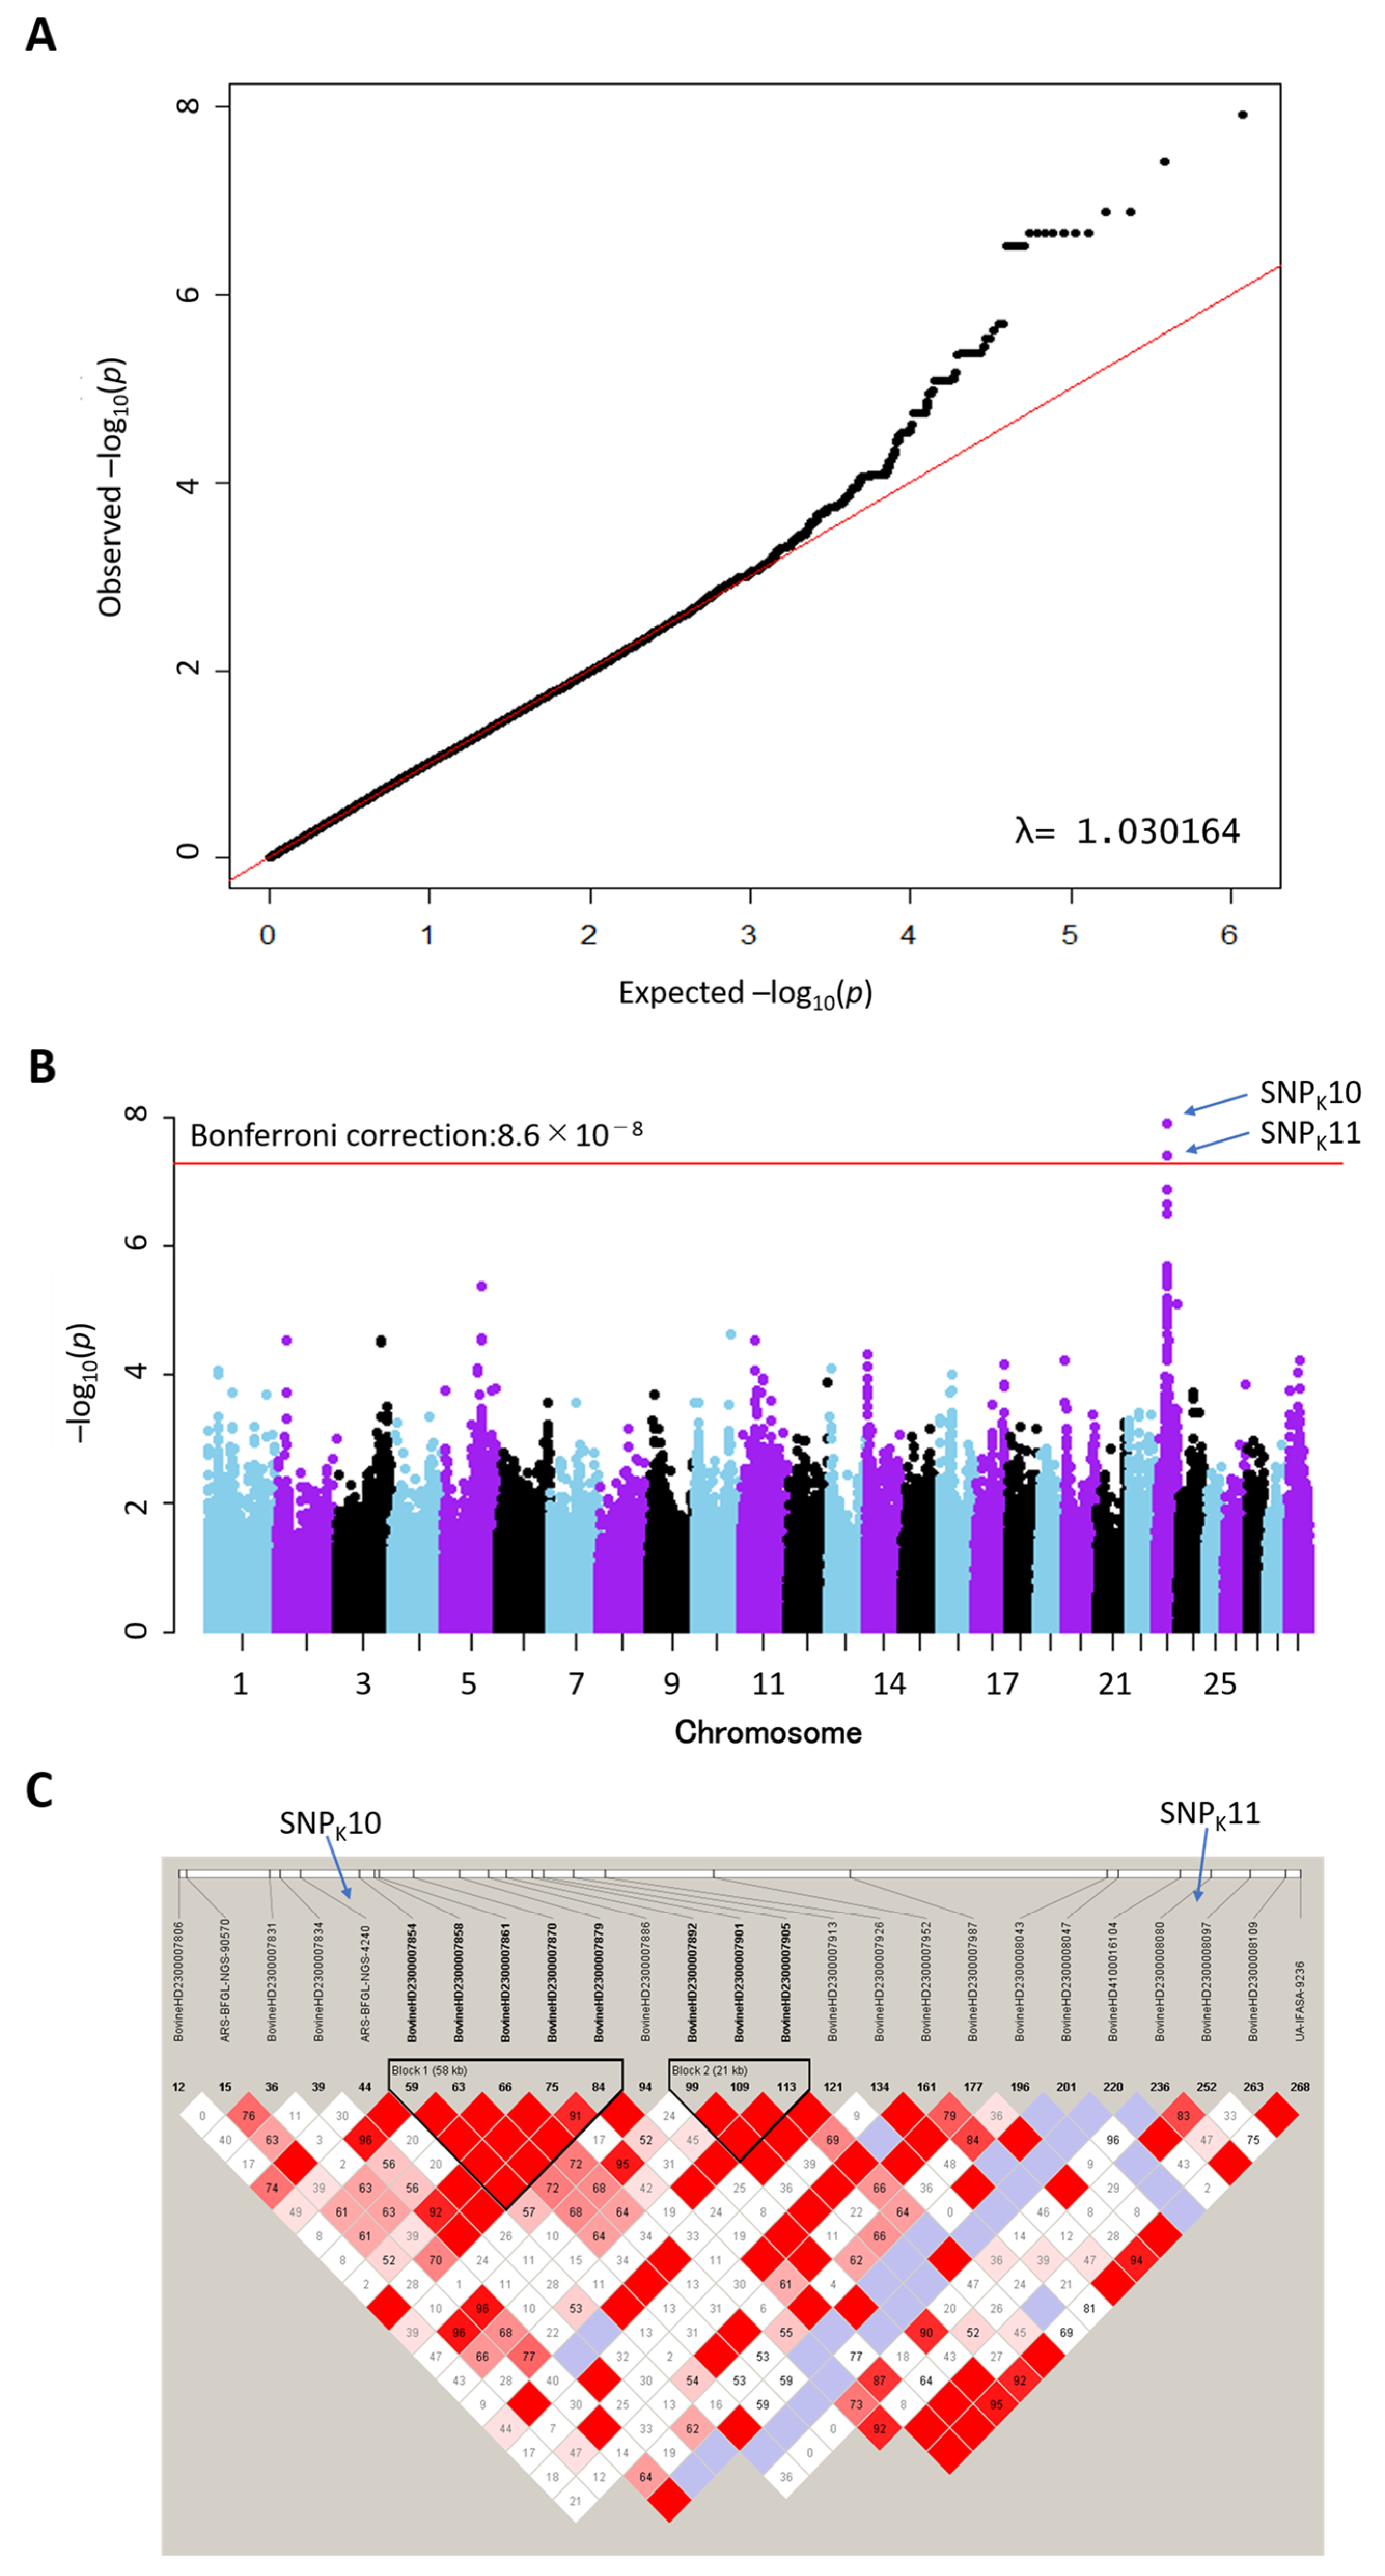
The genomic inflation factor (λGC) for this analysis was 1.030164, indicating that the sample was appropriate for inclusion in the association study (Figure 1A). The quantile–quantile (Q–Q) plot showed that the two SNPs deviated significantly from the null hypothesis (Figure 1A). Genome-wide mixed-model analysis identified two SNPs that exceeded the Bonferroni-corrected significance threshold (p = 8.6 × 10⁻⁸; Figure 1B). SNPK10 (ARS-BFGL-NGS-4240; rs110742604) was located at 28,284,087 bp on BTA 23 and was associated with PVL at p = 1.18 × 10⁻⁸ (minor allele C; minor allele frequency = 0.199; odds ratio = 8.714; Table 2). SNPK11 (BovineHD2300008097; rs137368875) was located at 28,847,653 bp on BTA 23 and showed an association at p = 3.81 × 10⁻⁸ (minor allele C; minor allele frequency = 0.243; odds ratio = 8.429; Table 2).
Figure 1.
Genome-wide association and linkage-disequilibrium analyses of BLV proviral load. (A) Quantile–quantile (Q–Q) plot of the binary-phenotype genome-wide association analysis comparing 33 high-PVL and 37 low-PVL Holstein cattle using 582,324 quality-controlled SNPs. The genomic inflation factor (λ) is shown. (B) Manhattan plot of the same GWAS. The red horizontal line indicates the Bonferroni-corrected threshold (p = 8.6 × 10⁻⁸), and SNPK10 and SNPK11 on chromosome 23 exceeded this threshold. (C) Linkage-disequilibrium plot surrounding SNPK10 and SNPK11 in the BoLA class I region. The two loci were not contained within a common strong LD block.
Table 2.
Basic information for the two SNPs significantly associated with BLV proviral load. 1 Coordinates are based on the ARS-UCD1.2 bovine genome assembly. Both variants are located in intergenic regions. MAF, minor allele frequency.
3.2. Linkage Disequilibrium Analysis of SNPK10 and SNPK11
The two SNPs were mapped to the BoLA class I region on BTA23 and were separated by a 563,566 bp window located at 28,284,087–28,847,653 bp according to their reported ARS-UCD1.2 coordinates (Table 2). SNPK10 was situated 825 bp upstream of IER3 and 97,226 bp downstream of DDR1 genes, whereas SNPK11 was flanked by Tripartite Motif Containing 40 (TRIM40) and Tripartite Motif Containing 31 (TRIM31). Approximately 35 annotated genes were located between these two loci. LD analysis did not place the two SNPs within a shared haplotype block in the analyzed population (Figure 1C). However, the SNP pair showed a strong allelic correlation (r2 = 0.78).
3.3. Development and Validation of KASP Genotyping Assays for SNPK10 and SNPK11
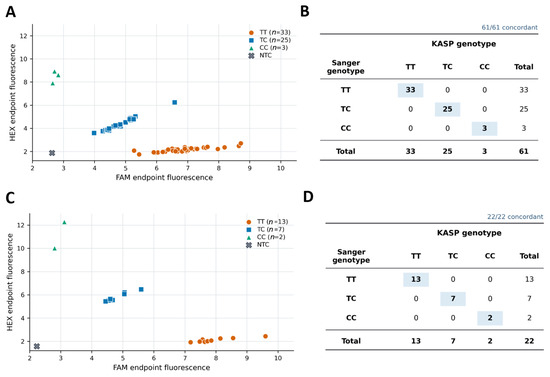
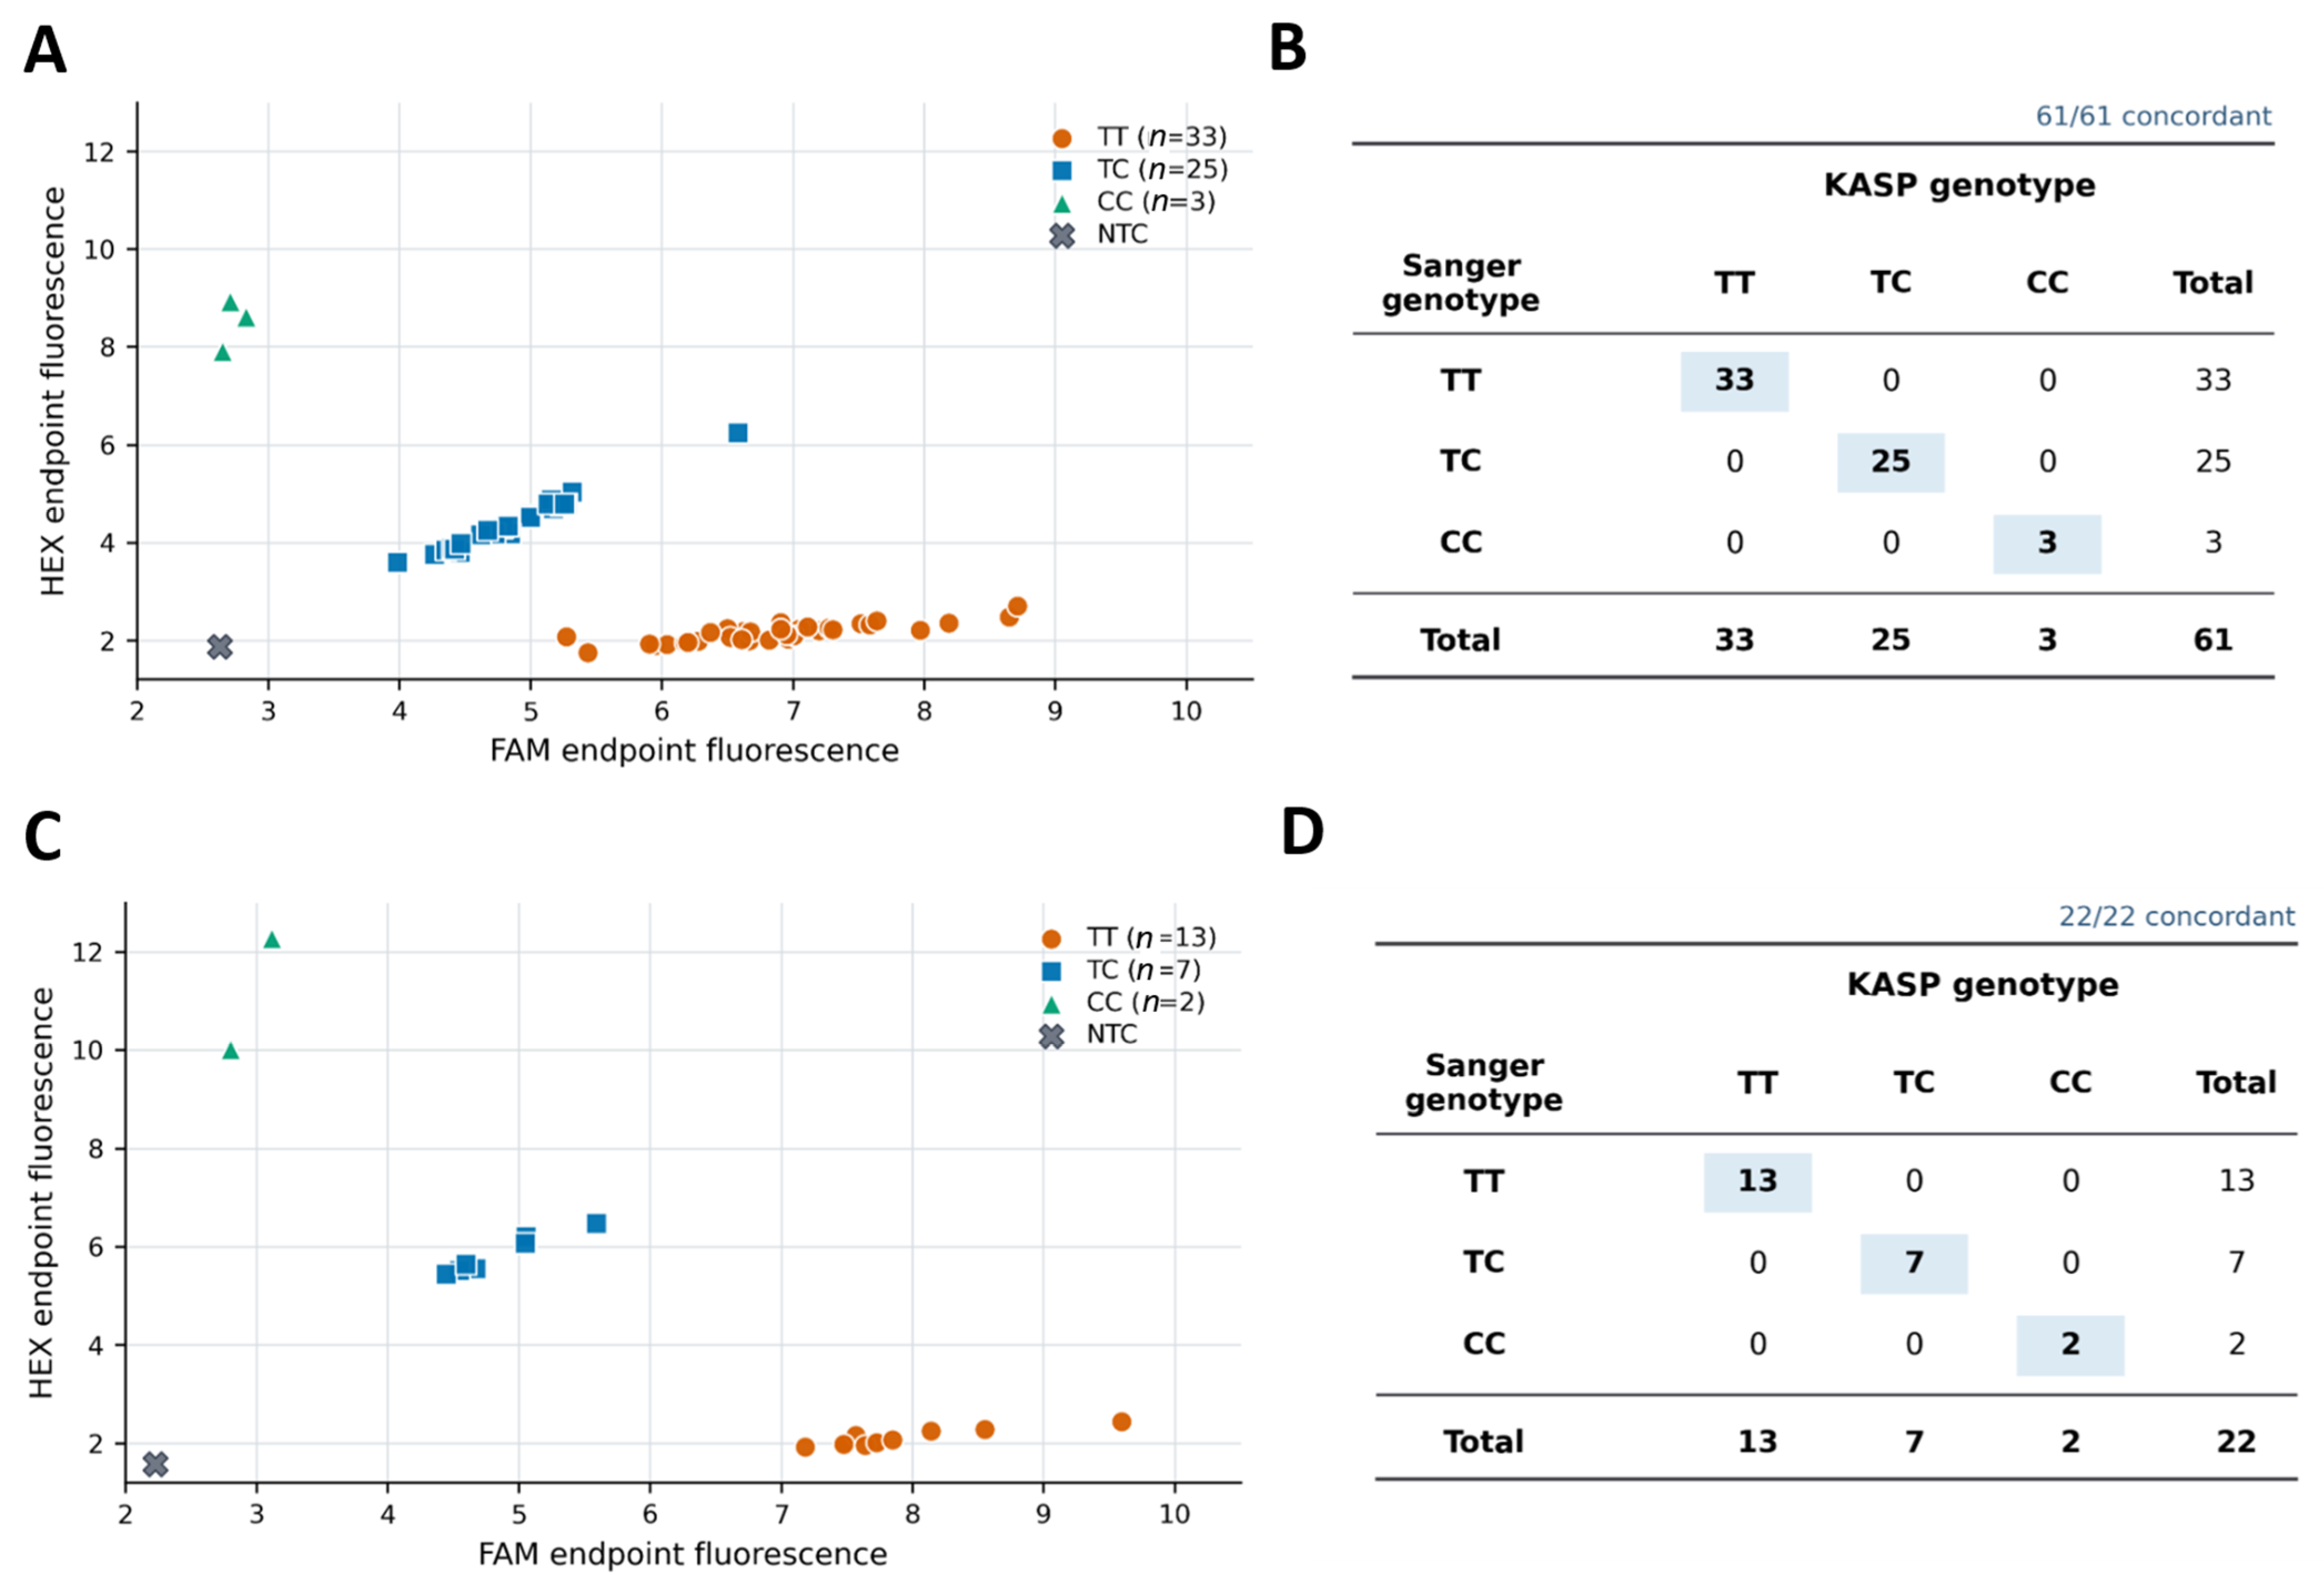
To follow up on the results of the GWAS, allele-specific KASP assays were developed for SNPK10 and SNPK11. Genotypes assigned using the optimized KASP assay were compared with those determined independently using conventional Sanger sequencing (Figure 2). Clear clustering of the CC, TC, and TT genotypes was observed for both assays. For SNPk10, KASP calls were concordant with Sanger sequencing in all 61 samples examined (61/61, 100%; Figure 2A,B). For SNPk11, the 22-sample nested subset likewise showed complete concordance (22/22, 100%; Figure 2C,D).
Figure 2.
Development and analytical validation of KASP genotyping assays for the two PVL-associated SNPs. (A) Endpoint fluorescence cluster plot for rs110742604 (SNPK10). (B) Concordance table comparing KASP and Sanger sequencing genotypes for SNPK10. (C) Endpoint fluorescence cluster plot for rs137368875 (SNPK11). (D) Concordance table comparing KASP and Sanger sequencing genotypes for SNPK11. FAM and HEX endpoint fluorescence values were obtained from the KASP assays, and no-template controls (NTC) are shown in gray. The analytical validation included 61 samples for SNPk10 (33 TT, 25 TC, and 3 CC) and a nested subset of 22 of the 61 samples for SNPk11 (13 TT, 7 TC, and 2 CC); all were selected from the 362-cattle follow-up KASP cohort.
3.4. Validation of the Association Between SNP Genotypes and BLV PVL in an Independent Cattle Population for SNPK10 and SNPK11
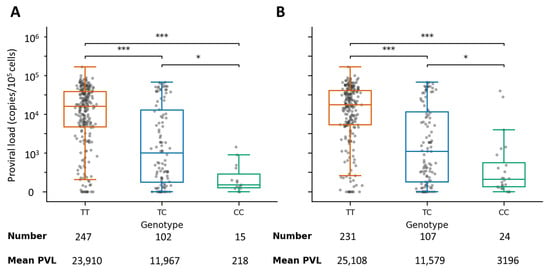
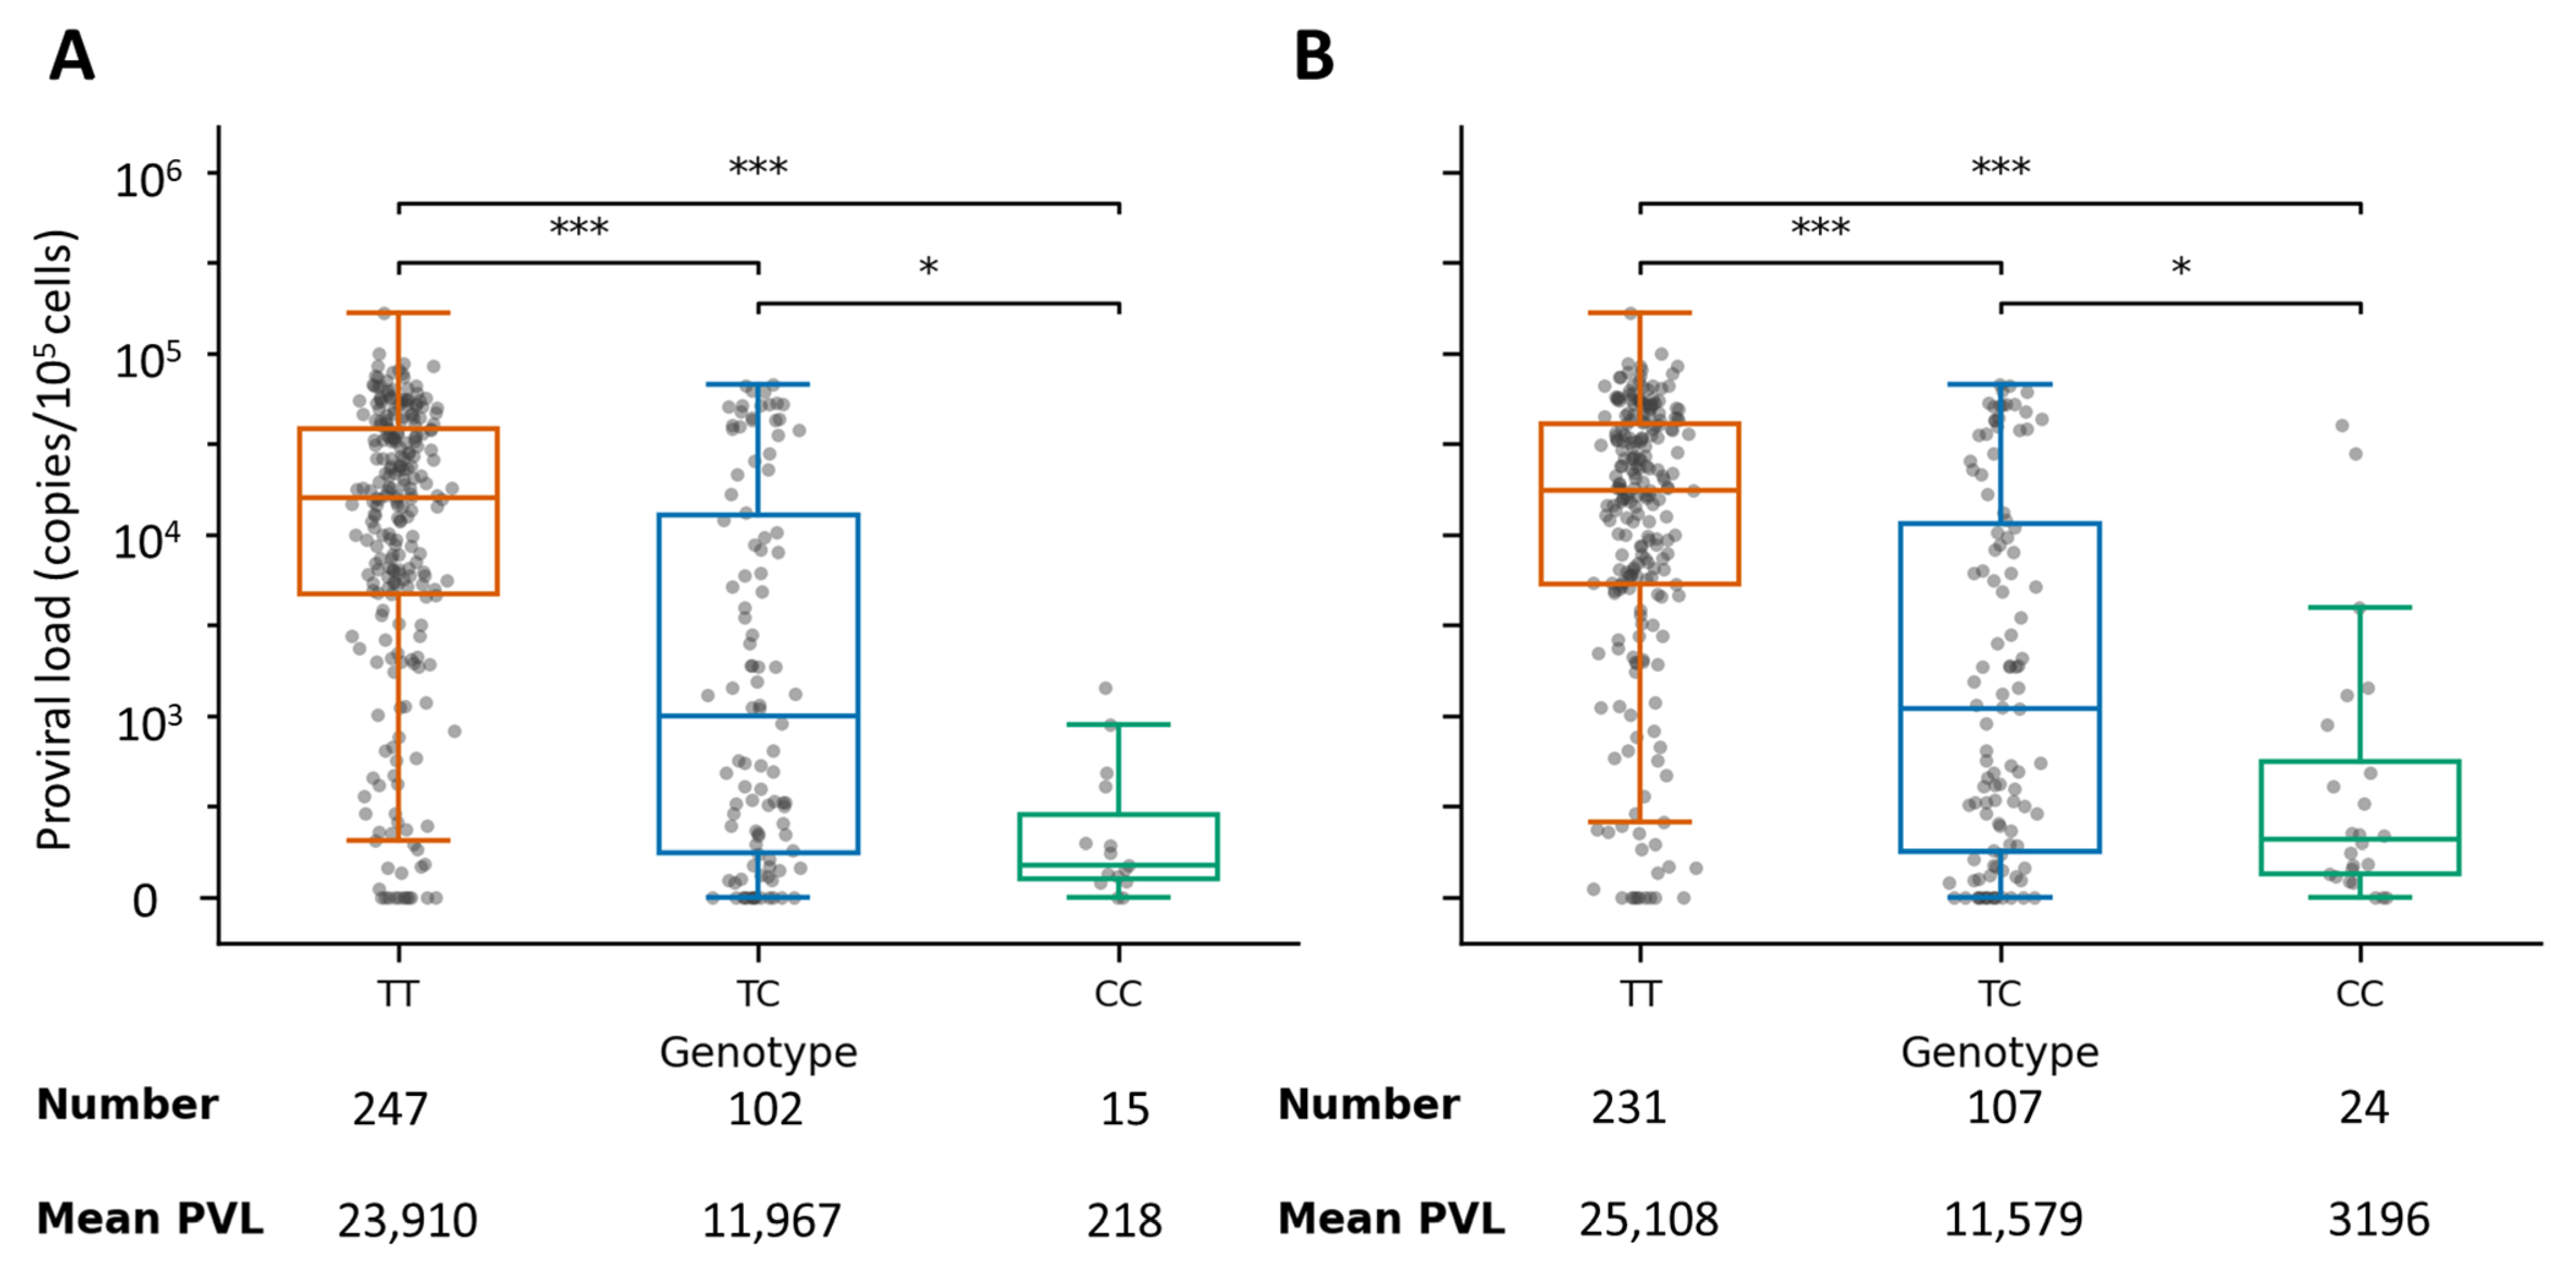
To further confirm the GWAS results, the association between SNP genotypes for SNPK10 and SNPK11 and BLV PVL was investigated in 364 additional field samples collected in a nationwide survey across Japan using KASP genotyping assays. In addition, the 70 animals included in the GWAS were investigated using KASP genotyping assays for SNPK10 and SNPK11 (Data S2). SNPK10 was successfully typed in all animals, whereas SNPK11 was evaluated in 362 cattle except two animals. For the genotypes of SNPK10 with 364 samples, the sample sizes and mean PVL values were as follows: TT (n = 247, mean = 23,910 copies per 105 cells), CC (n = 15, mean = 218 copies per 105 cells), and TC (n = 102, mean = 11,967 copies per 105 cells) (Figure 3A). PVL differed significantly among the TT, TC, and CC genotypes (Kruskal–Wallis test, p < 0.001). At SNPK10, animals with the TT genotype had a higher PVL than that of animals with either the TC or CC genotype (Dunn’s post hoc test, both p < 0.001), and the PVL also differed between the TC and CC animals (p < 0.01). A similar effect was observed for SNPK11. For the SNPK11 genotypes in 362 blood samples, the sample sizes and mean PVL values were as follows: TT (n = 231, mean = 25,108 copies per 105 cells), CC (n = 24, mean = 3196 copies per 105 cells), and TC (n = 107, mean = 11,579 copies per 105 cells) (Figure 3B). The TT animals had a higher PVL than that of the TC or CC animals (both p < 0.001), whereas the TC and CC animals differed at p < 0.05. Thus, carriage of the C allele at either locus was consistently associated with reduced PVL in the validation population.
Figure 3.
Association between SNP genotype and BLV proviral load in the independent validation population. (A) SNPK10 (n = 364) and (B) SNPK11 (n = 362). Points represent individual cattle, and boxes show the median and interquartile range. The boxplots and individual points display proviral load (copies/105 cells), whereas the sample number and arithmetic mean PVL shown below each genotype are reported on the original scale (copies per 105 cells). Group differences were assessed by the Kruskal–Wallis test followed by Dunn’s multiple-comparison test with Bonferroni-adjusted p values. * p < 0.05, *** p < 0.001. These PVL and KASP genotyping results are presented in Data S2.
3.5. Combined-Marker Stratification by BoLA-DRB3 and SNP Genotypes
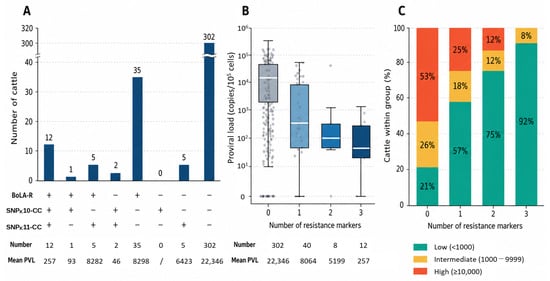
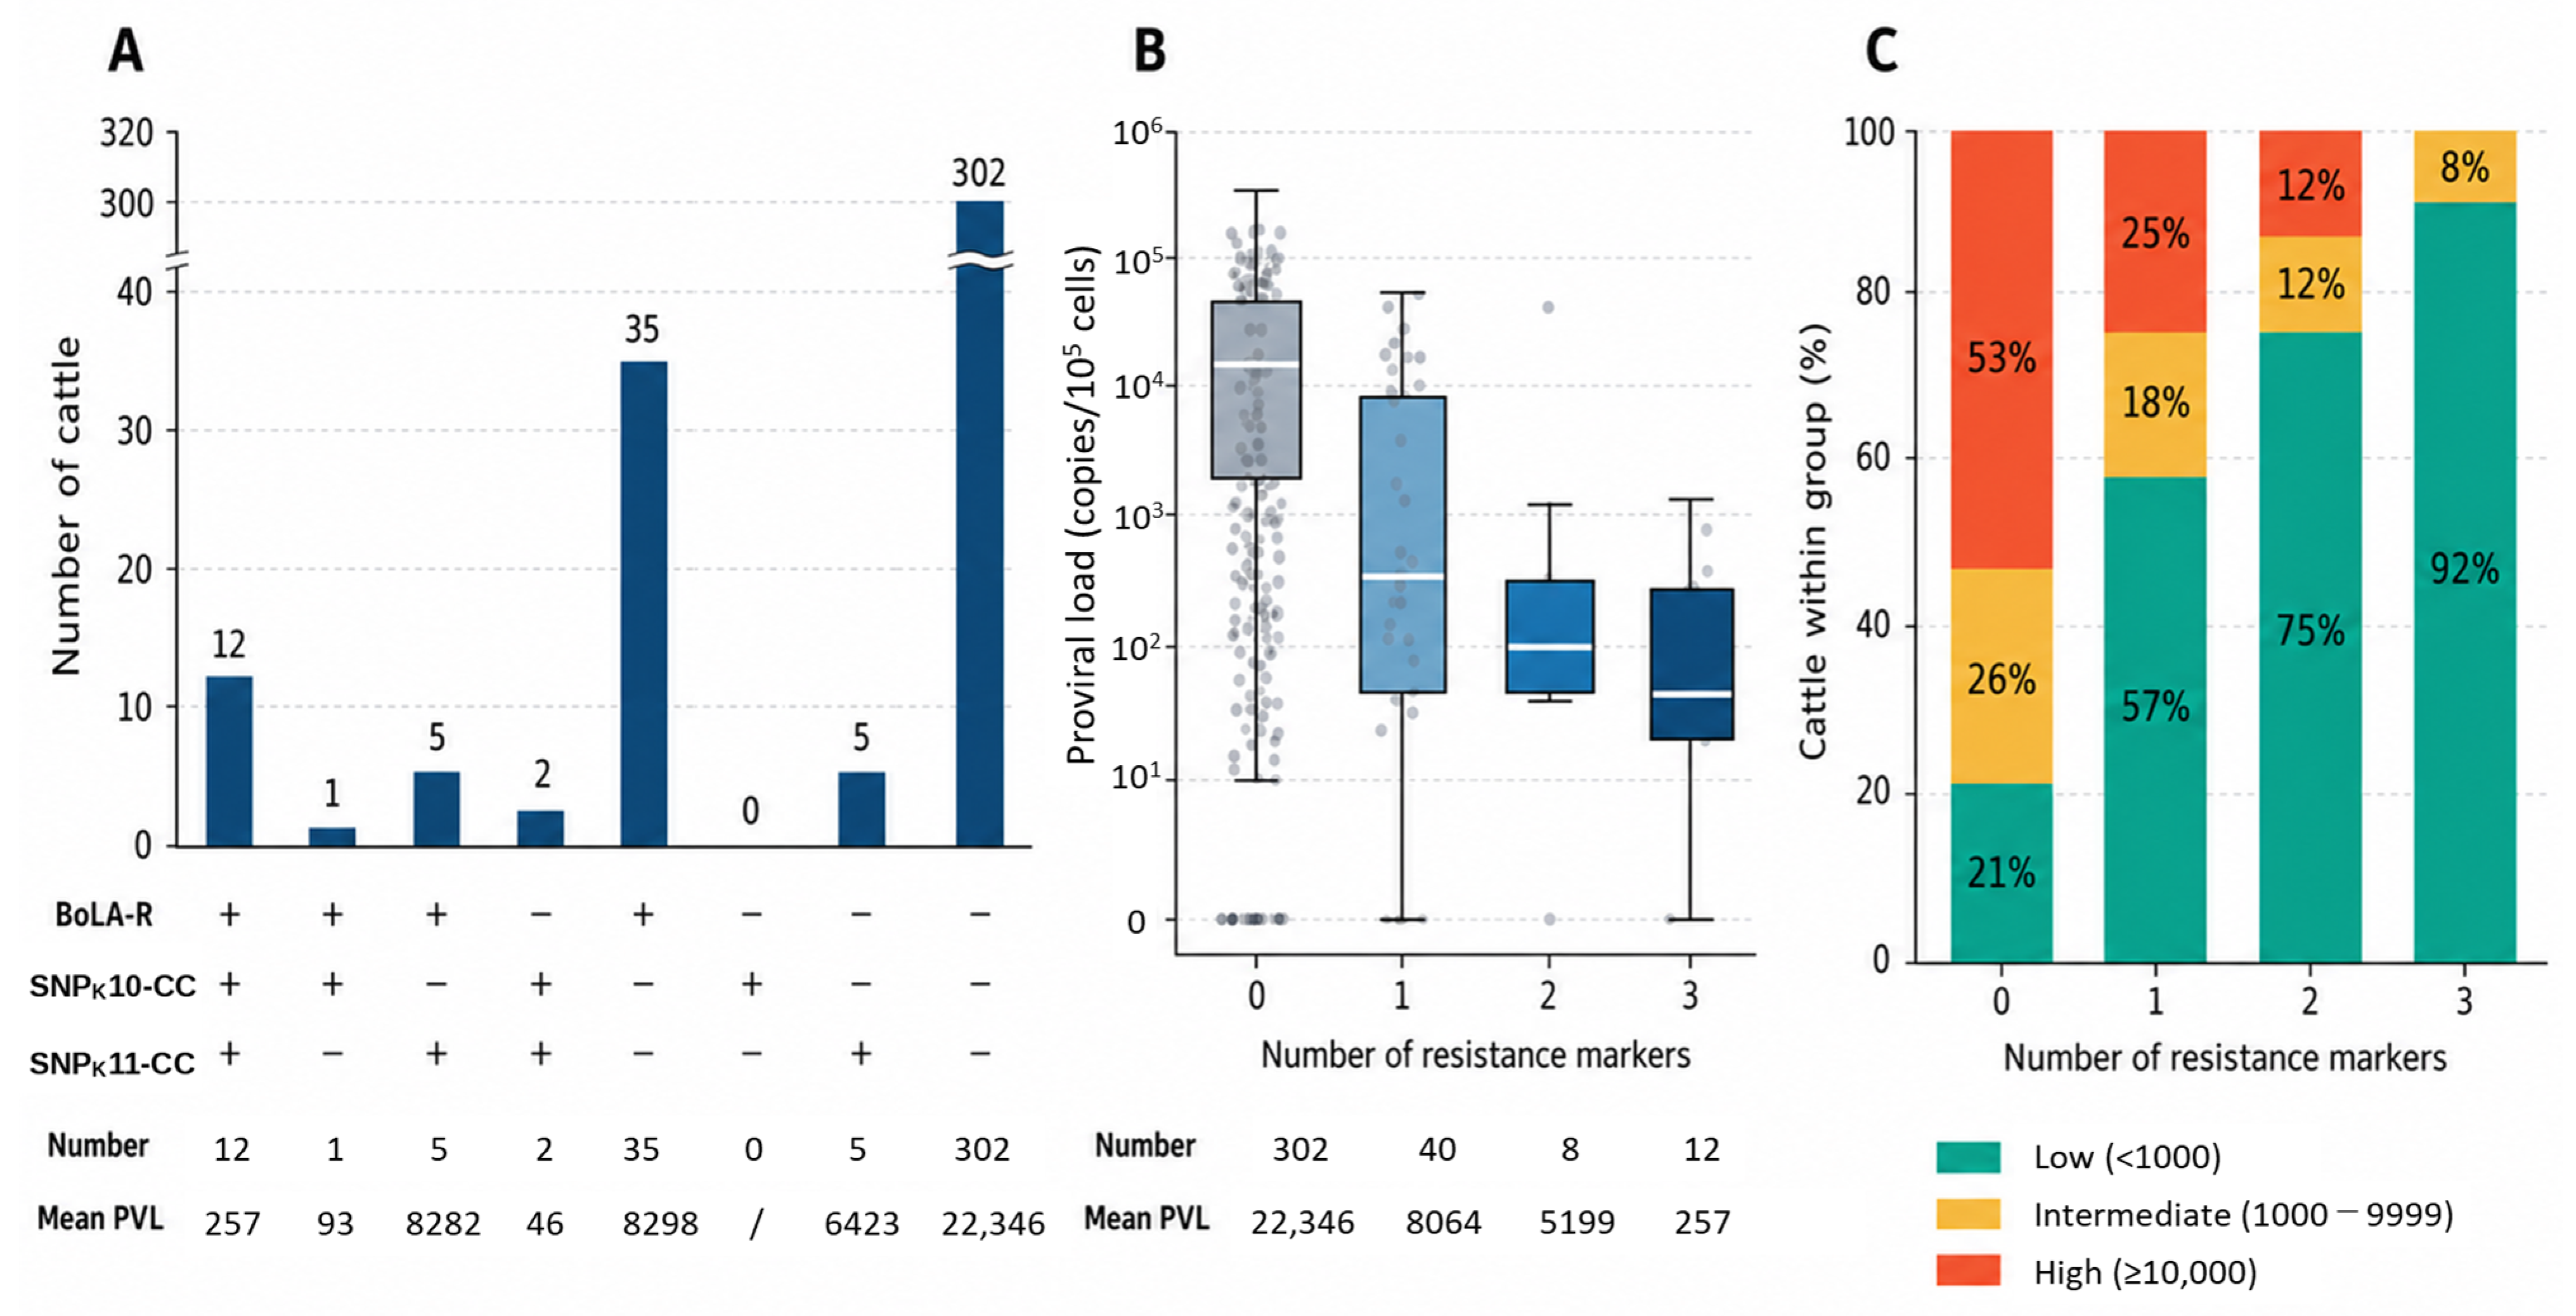
We then clarified an association between the combined markers BoLA-DRB3, SNPK10 and SNPK11, genotypes, and BLV PVL. The distribution of BoLA-DRB3 alleles in 362 Holstein samples was first determined using PCR-SBT targeting exon 2 of the BoLA-DRB3 gene and classified using the following resistance categories: cattle carrying at least one BoLA-DRB3*002:01, *009:02, or *014:01:01 allele (BoLA-R) were classified as resistant, in conjunction with the rs110742604 CC genotype (SNPK10-CC) and the rs137368875 CC genotype (SNPK11-CC). As shown in Figure 4A, among the 362 cattle with three complete markers, BoLA-R, SNPK10-CC, and SNPK11-CC, 53 carried BoLA-R, 15 had the SNPK10-CC genotype, and 24 had the SNPK11-CC genotype. The markers overlapped substantially: 12 cattle carried all three markers, 14 of the 15 SNPK10-CC cattle also harbored SNPK11-CC, and 12 of the 15 SNPK10-CC cattle were resistant. The exact intersections and their mean PVL values were as follows: 35 cattle with BoLA-R alone (8298 copies/105 cells), no cattle with SNPk10-CC alone, five with SNPk11-CC alone (6423 copies/105 cells), one with BoLA-R plus SNPk10-CC (93 copies/105 cells), five with BoLA-R plus SNPk11-CC (8282 copies/105 cells), two with SNPk10-CC plus SNPk11-CC (46 copies/105 cells), 12 with all three markers (257 copies/105 cells), and 302 without any of the three markers (22,346 copies/105 cells). Among the seven cattle carrying SNPk10-CC and/or SNPk11-CC without BoLA-R, two had low PVL (46 copies/105 cells) and five had intermediate PVL (6423 copies/105 cells); none had high PVL. Across all 15 SNPk10-CC cattle, irrespective of BoLA-R status, the mean PVL was 218 copies/105 cells; 14 had low PVL and none had high PVL.
Figure 4.
Exploratory combined stratification using BoLA-DRB3 and the two PVL-associated SNPs. (A) Exact intersections among BoLA-DRB3 resistance-associated status (BoLA-R), rs110742604-CC (SNPK10-CC), and rs137368875-CC (SNPK11-CC), including cattle carrying none of the three candidate resistance markers. Sample number and mean PVL for each exact intersection are shown below the plot; the bar for the no-marker group is truncated with a break because of its larger sample size. (B) Distribution of PVL according to the number of candidate resistance markers carried. Boxes indicate the median and interquartile range, points represent individual cattle, and the sample number and mean PVL for each marker-count group are shown below the x-axis. (C) Proportions of low-PVL (<1000 copies/105 cells), intermediate-PVL (1000–9999 copies/105 cells), and high-PVL (≥10,000 copies/105 cells) cattle in each marker-count group. The analysis included 362 cattle with complete data for all three markers. These PVL and KASP genotyping results as well as BoLA-DRB3 allele information are presented in Data S2.
Next, the cattle were divided into four groups based on the number of resistance markers (0 = cattle without marker, 1 = cattle carrying one marker, 2 = cattle carrying two markers, and 3 = cattle carrying three markers), and the distributions and proportions of PVL in each group were analyzed (Figure 4B,C). PVL decreased with an increase in the number of candidate resistance markers (Kruskal–Wallis, p < 0.001; Figure 4B). Median PVLs were 13,228 copies/105 cells in cattle carrying no marker (n = 302), 350 copies/105 cells in cattle carrying one marker (n = 40), 105 copies/105 cells in cattle carrying two markers (n = 8), and 54 copies/105 cells in cattle carrying all three markers (n = 12). The corresponding proportions of cattle with low PVL were 20.9%, 57.5%, 75.0%, and 91.7%, whereas the proportions of cattle with high PVL were 53.3%, 25.0%, 12.5%, and 0% in groups 0, 1, 2, and 3, respectively (Figure 4C). Eleven of the twelve cattle carrying all three markers were classified as having low PVL, and none were classified as having high PVL, indicating a consistent trend toward lower PVL as the number of candidate resistance markers increased. Although the marker-defined subgroups were small and overlapping, these findings support further evaluation of SNPk10 and SNPk11 as complementary markers to BoLA-DRB3.
4. Discussion
In this study, we explored BLV PVL-associated SNPs in Japanese Holstein cattle using the high-density Illumina BovineHD BeadChip and a mixed-model GWAS implemented in GEMMA. First, we successfully identified two PVL-associated variants, rs110742604 and rs137368875, in the BoLA class I region of BTA23 and reproduced their genotype–phenotype relationships in an additional Holstein population. SNPK10 (rs110742604) was previously reported by Carignano et al., 2018 [45], whereas SNPK11 (rs137368875) was discovered for the first time in this study. Second, the two SNPs exceeding the genome-wide significance threshold were separated by more than 0.5 Mb and were not contained within a common strong LD block but showed a strong allelic correlation (r2 = 0.78). Generally, clustering of genes with related functions in the LD pattern of the BoLA region makes it difficult to detect the effects of individual loci [60]. The strong allelic correlation and complexity of the BoLA region indicate that the relationships among the two SNPs and BoLA-DRB3 should be further evaluated in larger datasets. Third, we demonstrated the effectiveness of the KASP system for the two SNPs. In the validation population, the C allele at either locus was associated with a lower PVL, and the lowest values were observed in the CC animals. In particular, exploratory integration with established BoLA-DRB3 resistance-associated alleles further showed stepwise enrichment in low-PVL cattle as the number of candidate resistance markers increased; further, 11 of the 12 cattle carrying all three markers had low PVL, and none had high PVL. These genetic results were complemented by a rapid KASP workflow, which showed complete concordance with the Sanger sequencing results. These results support the two SNPs as candidate PVL-associated markers and the KASP assays as a practical platform for larger-scale validation and future evaluation in breeding and BLV control strategies.
Previous GWAS have identified several SNPs related to BLV PVL in the BoLA region and additional loci distributed across the bovine genome in Japanese Black and dairy cattle [25,26,31,32,42,43,44,45]. Our findings extend this genetic architecture by identifying two validated signals in the BoLA class I region. They reside within the broader BoLA region; however, they are distinct from the extensively studied BoLA-DRB3 and DQA1 class II markers and appear to represent separate association signals from one another, keeping a distance of more than 0.5 Mb, but they are related to only partially competing traits. Therefore, their strongest immediate value is as candidate biomarkers for risk stratification, not as proven causal variants.
However, the mechanisms controlling BLV PVL have not been fully elucidated. SNPK10 is located upstream of IER3 and downstream of DDR1. IER3 is an immediate-early response gene that integrates stress, inflammation, survival, and apoptotic signals [61,62]. IER3 has also been implicated in the aggressive progression and autophagy occurring in acute myeloid leukemia through AKT/mTOR-related signaling [63]. These functions may be relevant to BLV, a deltaretrovirus that persists in long-lived lymphocytes and, in a minority of infected cattle, drives clonal expansion and lymphoma. However, direct evidence linking IER3 to BLV replication and transformation remains lacking. In contrast, DDR1 encodes a receptor tyrosine kinase activated by fibrillar collagen and transduces signals from the extracellular matrix into cells [64]. Pathogenic or disease-associated findings of DDR1 have been reported in adenocarcinoma, melanoma, glioma susceptibility 1, and soft tissue sarcoma. However, an association between IER3 and BLV or other retroviral replication has not been reported. Therefore, further research on the interaction between IER3 or DDR1 and BLV proviral integration and its impact on the regulation of BLV PVL remains indispensable. Another finding of our study is that SNPK11 lies between TRIM40 and TRIM31. TRIM proteins commonly function as ubiquitin or ubiquitin-like modification regulators, and many TRIM family members participate in innate immune and antiviral pathways. TRIM40 has also been shown to promote neddylation of IKKγ and to suppress NF-κB activity [65], providing a mechanistic link to inflammatory signaling that is potentially relevant to persistent retroviral infection. Nevertheless, TRIM40 should not be labeled as an established BLV restriction factor because no direct evidence currently shows that it controls BLV entry, proviral transcription, clonal expansion, or virion production. TRIM31 also regulates innate inflammation by promoting the proteasomal degradation of NOD-Like Receptor family Pyrin domain-containing 3 (NLRP3) [66], but this function has not been demonstrated in BLV infection. Therefore, further studies are needed to clarify the effects of BLV proviral regulation on TRIM40 and TRIM31 near SNPK11 reported in this study.
SNPK10 is located in the intergenic region between IER3 and DDR1, whereas SNPK11 is located in the intergenic region between TRIM40 and TRIM31. A large proportion of trait-associated variants identified using GWAS map to noncoding regulatory DNA, particularly cell type-specific open chromatin and enhancer elements [67]. Intergenic variants can alter transcription factor binding, enhancer activity, chromatin accessibility, or long-range enhancer–promoter contacts, and their target genes need not be the nearest annotated gene [68]. Consequently, IER3, DDR1, TRIM40, and TRIM31 are reasonable candidates, and it is important not to conclusively identify them as effector genes but rather to simultaneously search for the true associated genes across a broader range.
Genetic association is useful for disease control only if it can be measured accurately and economically. Sanger sequencing is suitable for confirmation but requires post-PCR processing, sequence interpretation, and a greater per-sample time. In contrast, KASP uses endpoint allele-specific fluorescence and is well-suited for testing a small number of variants across many animals. KASP-derived markers have been used for high-throughput haplotype screening and marker-assisted selection in breeding programs [48,49,50]. In this study, both assays produced genotypes concordant with those of Sanger sequencing and generated results in approximately 90 min, supporting their use as practical candidate tests. Notably, clinical and breeding implementations require more than locus-specific analytical concordance (61 samples for SNPk10 and a nested subset of 22 samples for SNPk11) in this study. Therefore, assay performance, including call rate, repeatability, Mendelian consistency, sensitivity to DNA quality, and robustness to polymorphisms within primer-binding sites, should be quantified across laboratories and breeds. The two failed SNPK11 calls among the 364 attempted samples illustrate this need in the highly polymorphic BoLA region. Most importantly, prospective studies must establish predictive performance—effect size, discrimination, calibration, and incremental value beyond PVL measurement and established BoLA markers—before assays can be described as diagnostic tests.
BoLA-DRB3 is one of the most reproducible genetic determinants of BLV PVL and infectivity. Its highly polymorphic peptide-binding region can alter the repertoire of viral peptides presented to CD4+ T cells, thereby contributing to differences in immune control [25,30]. In this study, the identification of two additional class I-region SNPs was compatible with PVL as a complex polygenic trait influenced by antigen presentation, innate immune regulation, viral factors, age, infection history, and management. Further, EBL is a multifactorial disease caused by a complex interplay between host genetic, environmental, and viral factors [1]. The combined-marker analysis showed a clear reduction in PVL among cattle carrying the SNPk10-CC genotype. The 35 cattle carrying BoLA-R alone had a mean PVL of 8298 copies/105 cells, lower than the mean of 22,346 copies/105 cells in cattle without any of the three markers but higher than the mean of 218 copies/105 cells across all 15 SNPk10-CC cattle, irrespective of BoLA-R status. Fourteen of the 15 SNPk10-CC cattle had low PVL and none had high PVL. Thus, despite the small number of SNPk10-CC cattle, its association with reduced PVL was descriptively more pronounced than that of BoLA-R alone in this cohort. Because most SNPk10-CC cattle also carried BoLA-R and SNPk11-CC, larger studies are needed to clarify the contribution of each marker.
This study has several limitations. The discovery cohort contained only 113 animals, limiting the power to detect smaller effects. The estimated effect sizes of the identified SNPs may have been overestimated. Further analyses with a larger number of samples are thus necessary. Discovery and validation were restricted to Holstein cattle. Therefore, transferability to Japanese Black, Jersey, Brown Swiss, crossbred, and geographically distinct populations needs to be examined. Thus, larger studies across independent populations are needed to refine effect estimates and assess generalizability. The combined-marker groups were unbalanced (n = 302, 40, 8, and 12 for zero to three markers) and partly overlapping. The independence of SNPk10 and SNPk11 remains to be established by conditional analysis. Larger datasets will be useful for evaluating marker independence, LD with individual BoLA-DRB3 resistance-associated alleles, and the potential incremental value of combined genotyping. Because these loci lie in a structurally complex and highly polymorphic BoLA region, dense local sequencing is required to exclude untyped causal variants and assembly- or mapping-related artifacts. PVL was evaluated at a single or limited number of time points, and potential confounders, such as age, farm, infection duration, and viral genotype, require more complete modeling. In addition, further studies evaluating PVL in specific lymphocyte subsets may provide additional insight into their roles in BLV transmission and disease progression. We were unable to identify a suitable publicly accessible individual-level Holstein BovineHD dataset containing both loci; therefore, breed-level marker frequencies should be estimated in larger independent Holstein populations.
The next priority is to elucidate PVL-regulatory mechanisms through functional analysis of genes near SNPs, replication in multiple breeds and independent herds, longitudinal PVL measurement, targeted sequencing and statistical fine-mapping, genotype-aware bulk and single-cell RNA sequencing and assay for transposase-accessible chromatin (ATAC) profiling, expression quantitative trait locus (eQTL) and allele-specific expression analyses, reporter assays and electrophoretic mobility shift assay (EMSA) experiments, clustered regularly interspaced short palindromic repeats (CRISPR)-based perturbation of candidate bases and regulatory elements, and three-dimensional (3D) chromatin mapping. If these studies confirm robust, independent predictive effects, rs110742604 and rs137368875 could be incorporated into multi-marker selection tools aimed at lowering herd-level PVL and transmission risks. Their contribution to BLV control would then lie not in replacing the existing measures but in adding a scalable genetic layer to an integrated eradication strategy.
In conclusion, this study identified rs110742604 and rs137368875 as two PVL-associated loci in the BoLA class I region and reproduced their genotype–phenotype associations in an additional Holstein population. Overall, the variants represent separate locally associated SNPs from one another, and the carriage of the C allele at either locus was consistently associated with a lower PVL. Rapid KASP assays accurately reproduced the Sanger-derived genotypes in the analytical validation set, providing a practical platform for larger population studies. The combined-marker analysis identified a three-marker subgroup in which 11 of 12 cattle had low PVL and none had high PVL. SNPk10-CC also showed a more pronounced descriptive reduction in PVL than that for BoLA-R alone in this cohort. These findings suggest that SNPk10 and SNPk11 may provide complementary information to BoLA-DRB3; however, validation in larger independent populations is warranted before application to risk stratification, breeding, or BLV control programs. Practical application would also require consideration of economic feasibility, ethical aspects, and implementation in breeding programs.
Supplementary Materials
The following supporting information can be downloaded at https://www.mdpi.com/article/10.3390/pathogens15101017/s1: Data S1: GWAS discovery cohort. Data S2: validation cohort.
Author Contributions
Conceptualization, Y.A.; methodology, Y.Y., S.W., F.N., Y.M. (Yoshiyuki Miyazaki) and Y.A.; validation, Y.Y., S.W. and Y.A.; formal analysis, Y.Y. and Y.A.; investigation, Y.Y., S.W., Y.M. (Yoshiyuki Miyazaki) and Y.A.; resources, Y.A.; data curation, Y.A. and Y.Y.; writing—original draft preparation, Y.Y. and Y.A.; writing—review and editing, Y.A. and Y.Y.; supervision, Y.A. and Y.M. (Yasunobu Matsumoto); project administration, Y.A.; funding acquisition, Y.A. All authors have read and agreed to the published version of the manuscript.
Funding
This study was supported by a grant from the Livestock Promotional Subsidies from the Japan Racing Association (JRA).
Institutional Review Board Statement
All the animals were handled following the regulations of the Animal Ethics Committee of The University of Tokyo. This study was reviewed and approved by the Animal Experiments Committee of the University of Tokyo (Approval Number: p22–2–030; Approval date: 22 May 2022).
Informed Consent Statement
The informed consent has been obtained from the animal owners.
Data Availability Statement
The nucleotide sequences generated in this study have been deposited in the DDBJ/ENA/GenBank databases under accession numbers LC946423–LC946426. All other data generated or analyzed during this study are included in this article and its supplementary information files.
Acknowledgments
The authors thank all the farmers, veterinarians, and veterinary officers of the prefectural Livestock Hygiene Service Centers for their help with the blood sampling and the epidemiological data collection. We thank all the members of the Laboratory of Global Infectious Diseases Control Science, Graduate School of Agricultural and Life Sciences, the University of Tokyo, for technical assistance and suggestions. We thank Kaltech Co., Ltd. (https://kaltec.co.jp/en/, accessed on 20 December 2023) for helping with the organization of our laboratory.
Conflicts of Interest
The authors declare no conflicts of interest.
References
- Aida, Y.; Murakami, H.; Takahashi, M.; Takeshima, S.N. Mechanisms of pathogenesis induced by bovine leukemia virus as a model for human T-cell leukemia virus. Front. Microbiol. 2013, 4, 328. [Google Scholar] [CrossRef] [Scilit] [PubMed]
- Schwartz, I.; Levy, D. Pathobiology of bovine leukemia virus. Vet. Res. 1994, 25, 521–536. [Google Scholar] [PubMed]
- Lairmore, M.D. Animal models of bovine leukemia virus and human T-lymphotrophic virus type-1: Insights in transmission and pathogenesis. Annu. Rev. Anim. Biosci. 2014, 2, 189–208. [Google Scholar] [CrossRef] [Scilit] [PubMed]
- Polat, M.; Takeshima, S.N.; Aida, Y. Epidemiology and genetic diversity of bovine leukemia virus. Virol. J. 2017, 14, 209. [Google Scholar] [CrossRef] [Scilit] [PubMed]
- Murakami, K.; Kobayashi, S.; Konishi, M.; Kameyama, K.; Tsutsui, T. Nationwide survey of bovine leukemia virus infection among dairy and beef breeding cattle in Japan from 2009–2011. J. Vet. Med. Sci. 2013, 75, 1123–1126. [Google Scholar] [CrossRef] [Scilit] [PubMed]
- Nakada, S.; Fujimoto, Y.; Kohara, J.; Adachi, Y.; Makita, K. Estimation of economic loss by carcass weight reduction of Japanese dairy cows due to infection with bovine leukemia virus. Prev. Vet. Med. 2022, 198, 105528. [Google Scholar] [CrossRef] [Scilit] [PubMed]
- Nekouei, O.; VanLeeuwen, J.; Stryhn, H.; Kelton, D.; Keefe, G. Lifetime effects of infection with bovine leukemia virus on longevity and milk production of dairy cows. Prev. Vet. Med. 2016, 133, 1–9. [Google Scholar] [CrossRef] [Scilit] [PubMed]
- Norby, B.; Bartlett, P.; Byrem, T.; Erskine, R. Effect of infection with bovine leukemia virus on milk production in Michigan dairy cows. J. Dairy Sci. 2016, 99, 2043–2052. [Google Scholar] [CrossRef] [Scilit] [PubMed]
- Bartlett, P.C.; Norby, B.; Byrem, T.M.; Parmelee, A.; Ledergerber, J.T.; Erskine, R.J. Bovine leukemia virus and cow longevity in Michigan dairy herds. J. Dairy Sci. 2013, 96, 1591–1597. [Google Scholar] [CrossRef] [Scilit] [PubMed]
- Ott, S.L.; Johnson, R.; Wells, S.J. Association between bovine-leukosis virus seroprevalence and herd-level productivity on US dairy farms. Prev. Vet. Med. 2003, 61, 249–262. [Google Scholar] [CrossRef] [Scilit] [PubMed]
- Yang, Y.; Fan, W.; Mao, Y.; Yang, Z.; Lu, G.; Zhang, R.; Zhang, H.; Szeto, C.; Wang, C. Bovine leukemia virus infection in cattle of China: Association with reduced milk production and increased somatic cell score. J. Dairy Sci. 2016, 99, 3688–3697. [Google Scholar] [CrossRef] [Scilit] [PubMed]
- Frie, M.C.; Coussens, P.M. Bovine leukemia virus: A major silent threat to proper immune responses in cattle. Vet. Immunol. Immunopathol. 2015, 163, 103–114. [Google Scholar] [CrossRef] [Scilit] [PubMed]
- Nakada, S.; Fujimoto, Y.; Kohara, J.; Makita, K. Economic losses associated with mastitis due to bovine leukemia virus infection. J. Dairy Sci. 2023, 106, 495–507. [Google Scholar] [CrossRef] [Scilit] [PubMed]
- Benitez, O.J.; LaDronka, R.M.; Norby, B.; Grooms, D.L.; Bartlett, P.C. The effect of bovine leukemia virus on dairy cow longevity. JDS Commun. 2022, 3, 185–188. [Google Scholar] [CrossRef] [Scilit] [PubMed]
- Jimba, M.; Takeshima, S.N.; Matoba, K.; Endoh, D.; Aida, Y. BLV-CoCoMo-qPCR: Quantitation of bovine leukemia virus proviral load using the CoCoMo algorithm. Retrovirology 2010, 7, 91. [Google Scholar] [CrossRef] [Scilit] [PubMed]
- Panei, C.J.; Takeshima, S.N.; Omori, T.; Nunoya, T.; Davis, W.C.; Ishizaki, H.; Matoba, K.; Aida, Y. Estimation of bovine leukemia virus (BLV) proviral load harbored by lymphocyte subpopulations in BLV-infected cattle at the subclinical stage of enzootic bovine leucosis using BLV-CoCoMo-qPCR. BMC Vet. Res. 2013, 9, 95. [Google Scholar] [CrossRef] [Scilit] [PubMed]
- Kobayashi, T.; Inagaki, Y.; Ohnuki, N.; Sato, R.; Murakami, S.; Imakawa, K. Increasing bovine leukemia virus proviral load is a risk factor for progression of enzootic bovine leukosis: A prospective study in Japan. Prev. Vet. Med. 2020, 178, 104680. [Google Scholar] [CrossRef] [Scilit] [PubMed]
- Bai, L.; Borjigin, L.; Sato, H.; Takeshima, S.-N.; Asaji, S.; Ishizaki, H.; Kawashima, K.; Obuchi, Y.; Sunaga, S.; Ando, A.; et al. Kinetic study of BLV infectivity in BLV susceptible and resistant cattle in Japan from 2017 to 2019. Pathogens 2021, 10, 1281. [Google Scholar] [CrossRef] [Scilit] [PubMed]
- Borjigin, L.; Lo, C.-W.; Bai, L.; Hamada, R.; Sato, H.; Yoneyama, S.; Yasui, A.; Yasuda, S.; Yamanaka, R.; Mimura, M.; et al. Risk assessment of bovine major histocompatibility complex class II DRB3 alleles for perinatal transmission of bovine leukemia virus. Pathogens 2021, 10, 502. [Google Scholar] [CrossRef] [Scilit] [PubMed]
- Ohno, A.; Takeshima, S.N.; Matsumoto, Y.; Aida, Y. Risk factors associated with increased bovine leukemia virus proviral load in infected cattle in Japan from 2012 to 2014. Virus Res. 2015, 210, 283–290. [Google Scholar] [CrossRef] [Scilit] [PubMed]
- Somura, Y.; Sugiyama, E.; Fujikawa, H.; Murakami, K. Comparison of the copy numbers of bovine leukemia virus in the lymph nodes of cattle with enzootic bovine leukosis and cattle with latent infection. Arch. Virol. 2014, 159, 2693–2697. [Google Scholar] [CrossRef] [Scilit] [PubMed]
- Kohara, J.; Bai, L.; Takeshima, S.N.; Matsumoto, Y.; Hirai, T.; Aida, Y. Correlation between the biodistribution of bovine leukemia virus in the organs and the proviral load in the peripheral blood during early stages of experimentally infected cattle. Pathogens 2023, 12, 130. [Google Scholar] [CrossRef] [Scilit] [PubMed]
- Watanuki, S.; Takeshima, S.N.; Borjigin, L.; Sato, H.; Bai, L.; Murakami, H.; Sato, R.; Ishizaki, H.; Matsumoto, Y.; Aida, Y. Visualizing bovine leukemia virus (BLV)-infected cells and measuring BLV proviral loads in the milk of BLV-seropositive dams. Vet. Res. 2019, 50, 102. [Google Scholar] [CrossRef] [Scilit] [PubMed]
- Yuan, Y.; Kitamura-Muramatsu, Y.; Saito, S.; Ishizaki, H.; Nakano, M.; Haga, S.; Matoba, K.; Ohno, A.; Murakami, H.; Takeshima, S.N.; et al. Detection of the BLV provirus from nasal secretion and saliva samples using BLV-CoCoMo-qPCR-2: Comparison with blood samples from the same cattle. Virus Res. 2015, 210, 248–254. [Google Scholar] [CrossRef] [Scilit] [PubMed]
- Takeshima, S.N.; Ohno, A.; Aida, Y. Bovine leukemia virus proviral load is more strongly associated with bovine major histocompatibility complex class II DRB3 polymorphism than with DQA1 polymorphism in Holstein cows in Japan. Retrovirology 2019, 16, 14. [Google Scholar] [CrossRef] [Scilit] [PubMed]
- Lo, C.-W.; Borjigin, L.; Saito, S.; Fukunaga, K.; Saitou, E.; Okazaki, K.; Mizutani, T.; Wada, S.; Takeshima, S.N.; Aida, Y. BoLA-DRB3 polymorphism is associated with differential susceptibility to bovine leukemia virus-induced lymphoma and proviral load. Viruses 2020, 12, 352. [Google Scholar] [CrossRef] [Scilit] [PubMed]
- Juliarena, M.A.; Barrios, C.N.; Ceriani, M.C.; Esteban, E.N. Hot topic: Bovine leukemia virus (BLV)-infected cows with low proviral load are not a source of infection for BLV-free cattle. J. Dairy Sci. 2016, 99, 4586–4589. [Google Scholar] [CrossRef] [Scilit] [PubMed]
- Nakatsuchi, A.; Watanuki, S.; Borjigin, L.; Sato, H.; Bai, L.; Matsuura, R.; Kuroda, M.; Murakami, H.; Sato, R.; Asaji, S.; et al. BoLA-DRB3 polymorphism controls proviral load and infectivity of bovine leukemia virus (BLV) in milk. Pathogens 2022, 11, 210. [Google Scholar] [CrossRef] [Scilit] [PubMed]
- Gutiérrez, G.; Alvarez, I.; Politzki, R.; Lomónaco, M.; Rondelli, F.; Fondevila, N.; Trono, K. Natural progression of bovine leukemia virus infection in Argentinean dairy cattle. Vet. Microbiol. 2011, 151, 255–263. [Google Scholar] [CrossRef] [Scilit] [PubMed]
- Takeshima, S.N.; Aida, Y. Structure, function and disease susceptibility of the bovine major histocompatibility complex. Anim. Sci. J. 2006, 77, 138–150. [Google Scholar] [CrossRef] [Scilit]
- Miyasaka, T.; Takeshima, S.N.; Jimba, M.; Matsumoto, Y.; Kobayashi, N.; Matsuhashi, T.; Sentsui, H.; Aida, Y. Identification of bovine leukocyte antigen class II haplotypes associated with variations in bovine leukemia virus proviral load in Japanese Black cattle. Tissue Antigens 2013, 81, 72–82. [Google Scholar] [CrossRef] [Scilit] [PubMed]
- Lo, C.-W.; Takeshima, S.N.; Okada, K.; Saitou, E.; Fujita, T.; Matsumoto, Y.; Wada, S.; Inoko, H.; Aida, Y. Association of bovine leukemia virus-induced lymphoma with BoLA-DRB3 polymorphisms at DNA, amino acid, and binding pocket property levels. Pathogens 2021, 10, 437. [Google Scholar] [CrossRef] [Scilit] [PubMed]
- Lo, C.-W.; Takeshima, S.N.; Wada, S.; Matsumoto, Y.; Aida, Y. Bovine major histocompatibility complex (BoLA) heterozygote advantage against the outcome of bovine leukemia virus infection. HLA 2021, 98, 132–139. [Google Scholar] [CrossRef] [Scilit] [PubMed]
- Hamada, R.; Metwally, S.; Matsuura, R.; Borjigin, L.; Lo, C.-W.; Ali, A.O.; Mohamed, A.E.A.; Wada, S.; Aida, Y. BoLA-DRB3 polymorphism associated with bovine leukemia virus infection and proviral load in Holstein cattle in Egypt. Pathogens 2023, 12, 1451. [Google Scholar] [CrossRef] [Scilit] [PubMed]
- Wang, J.; Matsuura, R.; Watanuki, S.; Bao, A.; Fukushi, N.; Matsumoto, Y.; Dong, L.; Guo, G.; Yao, C.; Wang, C.; et al. First identification of BoLA-DRB3 alleles associated with differential susceptibility to bovine leukemia virus infection and proviral load in Chinese Holstein cattle. Pathogens 2026, 15, 34. [Google Scholar] [CrossRef] [Scilit] [PubMed]
- Juliarena, M.A.; Poli, M.; Sala, L.; Ceriani, M.C.; Gutierrez, G.; Forletti, A.; Alvarez, I.; Troggio, M.; Esteban, E.N. Association of BLV infection profiles with alleles of the BoLA-DRB3.2 gene. Anim. Genet. 2008, 39, 432–438. [Google Scholar] [CrossRef] [Scilit] [PubMed]
- Nagai, R.; Ou, Y.; Onda, T.; Noguchi, T.; Kobayashi, T. High-throughput detection of bovine leukocyte antigen (BoLA)-DRB3 alleles associated with resistance to bovine leukemia virus using a rapid allele-specific PCR assay. J. Vet. Med. Sci. 2026, 88, 400–406. [Google Scholar] [CrossRef] [Scilit] [PubMed]
- Lohr, C.E.; Sporer, K.R.B.; Brigham, K.A.; Pavliscak, L.A.; Mason, M.M.; Borgman, A.; Ruggiero, V.J.; Taxis, M.M.; Bartlett, P.C.; Droscha, C.J. Phenotypic selection of dairy cattle infected with bovine leukemia virus demonstrates immunogenetic resilience through NGS-based genotyping of BoLA MHC class II genes. Pathogens 2022, 11, 104. [Google Scholar] [CrossRef] [Scilit] [PubMed]
- Mkize, L.S.; Zishiri, O.T. Genetic variation and population differentiation in the bovine lymphocyte antigen DRB3.2 locus of South African Nguni crossbred cattle. Animals 2021, 11, 1651. [Google Scholar] [CrossRef] [Scilit] [PubMed]
- Mandefro, A.; Uzzaman, M.R.; Tessema, T.S.; Dadi, H.; Kim, K.S. Genetic assessment of BoLA-DRB3 polymorphisms by comparing Bangladesh, Ethiopian, and Korean cattle. J. Anim. Sci. Technol. 2021, 63, 248–261. [Google Scholar] [CrossRef] [Scilit] [PubMed]
- Miltiadou, D.; Russell, G.C.; Holiday, S.I.; Glass, E.J. Establishment of a sequence-based typing system for BoLA-DRB3 exon 2. Tissue Antigens 2003, 62, 55–65. [Google Scholar] [CrossRef] [Scilit] [PubMed]
- Mekata, H.; Yamamoto, M. Single-nucleotide polymorphism on spermatogenesis-associated 16 gene-coding region affecting bovine leukemia virus proviral load. Vet. Sci. 2022, 9, 275. [Google Scholar] [CrossRef] [Scilit] [PubMed]
- Brym, P.; Bojarojć-Nosowicz, B.; Oleński, K.; Hering, D.M.; Ruść, A.; Kaczmarczyk, E.; Kamiński, S. Genome-wide association study for host response to bovine leukemia virus in Holstein cows. Vet. Immunol. Immunopathol. 2016, 175, 24–35. [Google Scholar] [CrossRef] [Scilit] [PubMed]
- Takeshima, S.N.; Sasaki, S.; Meripet, P.; Sugimoto, Y.; Aida, Y. Single nucleotide polymorphisms in the bovine MHC region of Japanese Black cattle are associated with bovine leukemia virus proviral load. Retrovirology 2017, 14, 24. [Google Scholar] [CrossRef] [Scilit] [PubMed]
- Carignano, H.A.; Beribe, M.J.; Caffaro, M.E.; Amadio, A.; Nani, J.P.; Gutiérrez, G.; Alvarez, I.; Trono, K.; Miretti, M.M.; Poli, M.A. Genome-wide scan for common SNPs affecting bovine leukemia virus infection level in dairy cattle. BMC Genom. 2018, 19, 142. [Google Scholar] [CrossRef] [Scilit] [PubMed]
- Bartlett, P.C.; Sordillo, L.M.; Byrem, T.M.; Norby, B.; Grooms, D.L.; Swenson, C.L.; Zalucha, J.; Erskine, R.J. Options for the control of bovine leukemia virus in dairy cattle. J. Am. Vet. Med. Assoc. 2014, 244, 914–922. [Google Scholar] [CrossRef] [Scilit] [PubMed]
- Borjigin, L.; Watanuki, S.; Hamada, R.; Bai, L.; Hirose, T.; Sato, H.; Yoneyama, S.; Yasui, A.; Yasuda, S.; Yamanaka, R.; et al. Effectiveness of integrated bovine leukemia virus eradication strategies utilizing cattle carrying resistant and susceptible major histocompatibility complex class II DRB3 alleles. J. Dairy Sci. 2023, 106, 9393–9409. [Google Scholar] [CrossRef] [Scilit] [PubMed]
- Dicks, K.L.; Pemberton, J.M.; Ballingall, K.T.; Johnston, S.E. MHC class IIa haplotypes derived by high-throughput SNP screening in an isolated sheep population. G3 Genes Genomes Genet. 2021, 11, jkab200. [Google Scholar] [CrossRef] [Scilit] [PubMed]
- Chen, Z.; Tang, D.; Ni, J.; Li, P.; Wang, L.; Zhou, J.; Li, C.; Lan, H.; Li, L.; Liu, J. Development of genic KASP SNP markers from RNA-seq data for map-based cloning and marker-assisted selection in maize. BMC Plant Biol. 2021, 21, 157. [Google Scholar] [CrossRef] [Scilit] [PubMed]
- Ilie, D.E.; Gavojdian, D.; Kusza, S.; Neamț, R.I.; Mizeranschi, A.E.; Mihali, C.V.; Cziszter, L.T. Kompetitive Allele Specific PCR genotyping of 89 SNPs in Romanian Spotted and Romanian Brown cattle breeds and their association with clinical mastitis. Animals 2023, 13, 1484. [Google Scholar] [CrossRef] [Scilit] [PubMed]
- Zhou, X.; Stephens, M. Genome-wide efficient mixed-model analysis for association studies. Nat. Genet. 2012, 44, 821–824. [Google Scholar] [CrossRef] [Scilit] [PubMed]
- Purcell, S.; Neale, B.; Todd-Brown, K.; Thomas, L.; Ferreira, M.A.R.; Bender, D.; Maller, J.; Sklar, P.; de Bakker, P.I.W.; Daly, M.J.; et al. PLINK: A tool set for whole-genome association and population-based linkage analyses. Am. J. Hum. Genet. 2007, 81, 559–575. [Google Scholar] [CrossRef] [Scilit] [PubMed]
- Chang, C.C.; Chow, C.C.; Tellier, L.C.A.M.; Vattikuti, S.; Purcell, S.M.; Lee, J.J. Second-generation PLINK: Rising to the challenge of larger and richer datasets. GigaScience 2015, 4, 7. [Google Scholar] [CrossRef] [Scilit] [PubMed]
- Armstrong, R.A. When to use the Bonferroni correction. Ophthalmic Physiol. Opt. 2014, 34, 502–508. [Google Scholar] [CrossRef] [Scilit] [PubMed]
- Devlin, B.; Roeder, K. Genomic control for association studies. Biometrics 1999, 55, 997–1004. [Google Scholar] [CrossRef] [Scilit] [PubMed]
- Turner, S.D. qqman: An R package for visualizing GWAS results using Q-Q and Manhattan plots. J. Open Source Softw. 2018, 3, 731. [Google Scholar] [CrossRef] [Scilit]
- Barrett, J.C.; Fry, B.; Maller, J.; Daly, M.J. Haploview: Analysis and visualization of LD and haplotype maps. Bioinformatics 2005, 21, 263–265. [Google Scholar] [CrossRef] [Scilit] [PubMed]
- Takeshima, S.N.; Matsumoto, Y.; Miyasaka, T.; Arainga-Ramirez, M.; Saito, H.; Onuma, M.; Aida, Y. A new method for typing bovine major histocompatibility complex class II DRB3 alleles by combining two established PCR sequence-based techniques. Tissue Antigens 2011, 78, 208–213. [Google Scholar] [CrossRef] [Scilit] [PubMed]
- Dung, T.L.; Son, N.V.; Lo, C.W.; Dao, D.T.; Bui, N.V.; Ogawa, H.; Imai, K.; Sugiura, K.; Aida, Y. Association between BoLA-DRB3 polymorphism and bovine leukemia virus proviral load in Vietnamese Holstein Friesian cattle. HLA 2022, 99, 105–112. [Google Scholar] [CrossRef] [Scilit] [PubMed]
- Slatkin, M. Linkage disequilibrium—Understanding the evolutionary past and mapping the medical future. Nat. Rev. Genet. 2008, 9, 477–485. [Google Scholar] [CrossRef] [Scilit] [PubMed]
- Arlt, A.; Schäfer, H. Role of the immediate early response 3 (IER3) gene in cellular stress response, inflammation and tumorigenesis. Eur. J. Cell Biol. 2011, 90, 545–552. [Google Scholar] [CrossRef] [Scilit] [PubMed]
- Villalba, M.; Fredericksen, F.; Otth, C.; Olavarría, V.H. Molecular characterization of the bovine IER3 gene: Down-regulation of IL-8 by blocking NF-κB activity mediated by IER3 overexpression in MDBK cells infected with bovine viral diarrhea virus-1. Mol. Immunol. 2017, 92, 169–179. [Google Scholar] [CrossRef] [Scilit] [PubMed]
- Chen, Y.; Huang, Z.; Chen, S.; Tan, L.; He, L.; Yuan, D.; Zheng, L.; Zhong, J.; Li, A.; Zhang, H.; et al. Immediate early response 3 gene promotes aggressive progression and autophagy of AML by negatively regulating AKT/mTOR. Transl. Oncol. 2023, 35, 101711. [Google Scholar] [CrossRef] [Scilit] [PubMed]
- Sun, X.; Wu, B.; Chiang, H.C.; Deng, H.; Zhang, X.; Xiong, W.; Liu, J.; Rozeboom, A.M.; Harris, B.T.; Blommaert, E.; et al. Tumour DDR1 promotes collagen fibre alignment to instigate immune exclusion. Nature 2021, 599, 673–678. [Google Scholar] [CrossRef] [Scilit] [PubMed]
- Noguchi, K.; Okumura, F.; Takahashi, N.; Kataoka, A.; Kamiyama, T.; Todo, S.; Hatakeyama, S. TRIM40 promotes neddylation of IKKγ and is downregulated in gastrointestinal cancers. Carcinogenesis 2011, 32, 995–1004. [Google Scholar] [CrossRef] [Scilit] [PubMed]
- Song, H.; Liu, B.; Huai, W.; Yu, Z.; Wang, W.; Zhao, J.; Han, L.; Jiang, G.; Zhang, L.; Gao, C.; et al. The E3 ubiquitin ligase TRIM31 attenuates NLRP3 inflammasome activation by promoting proteasomal degradation of NLRP3. Nat. Commun. 2016, 7, 13727. [Google Scholar] [CrossRef] [Scilit] [PubMed]
- Maurano, M.T.; Humbert, R.; Rynes, E.; Thurman, R.E.; Haugen, E.; Wang, H.; Reynolds, A.P.; Sandstrom, R.; Qu, H.; Brody, J.; et al. Systematic localization of common disease-associated variation in regulatory DNA. Science 2012, 337, 1190–1195. [Google Scholar] [CrossRef] [Scilit] [PubMed]
- Schierding, W.; Antony, J.; Cutfield, W.S.; Horsfield, J.A.; O’Sullivan, J.M. Intergenic GWAS SNPs are key components of the spatial and regulatory network for human growth. Hum. Mol. Genet. 2016, 25, 3372–3382. [Google Scholar] [CrossRef] [Scilit] [PubMed]

Disclaimer/Publisher’s Note: The statements, opinions and data contained in all publications are solely those of the individual author(s) and contributor(s) and not of MDPI and/or the editor(s). MDPI and/or the editor(s) disclaim responsibility for any injury to people or property resulting from any ideas, methods, instructions or products referred to in the content. |
© 2026 by the authors. Licensee MDPI, Basel, Switzerland. This article is an open access article distributed under the terms and conditions of the Creative Commons Attribution (CC BY) license.