


Abstract
Digital wellness policies in universities often rely on uniform daily screen time caps, yet platform-specific risks may shape student outcomes as strongly as total time online. This paper presents a methodological proof of concept: it demonstrates an analytical pipeline that converts multi-platform outcome data into a graduated, affordance-informed policy typology, rather than offering validated platform-risk classifications or ready-to-implement policy. Using a publicly available student dataset covering twelve social networks, we aggregate four harm-aligned outcomes—addictive use, poorer mental health, shorter sleep duration, and interpersonal conflict—to the platform level and apply hierarchical clustering to derive a four-tier risk typology. We stress that the clustering and the subsequent principal component analysis operate on only twelve platform-level observations, not on the 705 individual students. We then project the tiers onto a two-dimensional risk map and simulate three illustrative policy regimes: a uniform daily cap, a tier-calibrated cap, and an affordance-targeted short-video cap. In this illustrative dataset, the tier-calibrated cap reproduces roughly seventy percent of the harm reduction in a blanket cap while directly affecting about three-quarters of students, and the three regimes deliver near-equivalent harm reduction per percent of students affected. Because the source data show characteristics consistent with synthetic or semi-synthetic simulation and lack established provenance, all quantitative results are presented as demonstrations of the pipeline. We describe the sensitivity of the typology to clustering choices, the ethical risks of tiered classification, and the replication required before any tier could inform practice.
1. Introduction
Across universities, the dominant instrument of digital wellness policy remains a blunt one: a uniform daily or weekly cap on total social media screen time. Campus counselling services issue hour-count guidelines, parents rely on device-level limits, and national regulators increasingly contemplate blanket minor user curfews. The appeal of such caps is that they are simple to communicate, easy to audit, and neutral across platforms. Their weakness is that they rest on an empirical assumption that is increasingly questioned: that an hour of social media exposure is fungible across platforms (Bradley et al. 2024; Taiwade et al. 2022).
A growing body of comparative work suggests otherwise. Short-video and image-centric networks appear to recruit different behavioural pathways than messenger or professional networks, and they are associated with different well-being and academic risk profiles even among students who report identical total daily exposure (Novánská Škripcová and Viteková 2025; Bayer et al. 2020). If this is correct, then uniform caps are not merely inefficient; they may be mis-specified, over-restricting low-risk ecosystems, under-restricting high-risk ones, and offering no conceptual guidance to the parents, educators, and designers who must decide what to discourage and what to redesign.
This paper takes the platform-differentiation argument seriously and asks a translational question: what would a proportionate, ecosystem-aware digital wellness regime look like in principle, and how much of the harm reduction promised by blanket caps could such a regime preserve while narrowing the intervention footprint? We answer this question not with new epidemiological evidence but by demonstrating an analytical pipeline. In three steps, we (i) build a platform-risk typology by applying hierarchical clustering to a four-outcome harm vector aggregated to the platform level; (ii) use principal component analysis to render the typology as a two-dimensional risk map; and (iii) simulate three candidate policy regimes against the same data to compare their projected harm-reduction yields and intervention footprints.
We are explicit about the scope of the contribution. This is a methodological proof of concept and an illustrative framework demonstration, not a validated platform-risk classification and not a set of ready-to-implement policy recommendations. Two features of the analysis make this framing essential. First, although the underlying survey comprises 705 students, the typology and the risk map are computed from only twelve platform-level observations (the platform means of four outcomes); the effective sample for the core analyses is therefore n = 12, not n = 705. Second, as we document in Section 3.2, the source dataset shows several characteristics consistent with synthetic or semi-synthetic simulation and lacks established provenance. Accordingly, every tier, coordinate, and simulation result reported below should be read as a demonstration of what the pipeline produces, not as substantive evidence about specific platforms. The value of the paper lies in the transparent, reproducible method and the design questions it surfaces, both of which can be re-run on stronger primary data as they become available.
The paper is organised as follows. Section 2 reviews screen time thresholds, platform heterogeneity, affordance theory, the four harm outcomes, and current policy instruments. Section 3 describes the dataset, its provenance and data-quality limitations, variable construction, the analytical pipeline, and a cluster-robustness analysis. Section 4 reports illustrative typology, risk map, and policy simulation. Section 5 discusses the findings, their practical and ethical implications, and the limitations that bound them.
2. Literature Review
2.1. From Screen Time Thresholds to Platform-Aware Regulation
The first generation of digital wellness evidence was dominated by aggregate screen time dose–response work. Meta-analytic syntheses across prospective adolescent cohorts linked more than three hours of daily screen exposure to elevated risk of depressive symptoms, and parallel reviews extended the association to anxiety, stress, and sleep disturbance (Eric 2025; Matakanye 2025; Mohd Saat et al. 2024). These syntheses were influential precisely because they delivered a single actionable number that could be embedded in guideline documents. They were also, however, built on pooled screen time measures that collapsed heterogeneous platforms into one exposure variable, effectively assuming that the relevant dose was time-at-screen rather than activity-at-screen (Wu et al. 2026; Vizcaino et al. 2019). This strategy did not distinguish passive consumption from active, intentional use such as creative production or social coordination. Consequently, more recent work has moved toward approaches in which the nature and context of digital activity are treated as more important than time alone.
2.2. Evidence of Platform Heterogeneity
Platform-specific empirical research has expanded rapidly. A recent three-part replication found that, among young adults and university students in North America and the United Kingdom, image- and video-centric platforms such as TikTok, Instagram, and Snapchat accounted for most time online; yet instructing participants to reduce time on these apps produced little measurable improvement in depression or anxiety symptoms (Bradley et al. 2024). Participants generally believed that their most-used apps had the largest influence on their mental health, but reductions in use did not translate into detectable changes in well-being. Findings of this kind motivate a shift in analytic attention from how much students use social media to which affordances they engage and with what consequences.
2.3. Affordance Theory and Social Media Affordances
The differences in how people use platforms can be understood through the concept of affordances: the action possibilities that a technology offers to a user, arising from the relation between the artefact’s features and the user’s goals and capacities. In the social media context, Bayer et al. (2020) provide an influential synthesis, distinguishing structural elements (such as the persistence, visibility, and editability of content) from the ecologies in which they are embedded and the effects they produce. Trepte (2021), in the Social Media Privacy Model, similarly foregrounds affordances such as anonymity, association, and persistence as the mechanisms linking platform design to user behaviour and outcomes. These accounts share a central claim relevant here: risk is not intrinsic to a named platform but to the configuration of affordances that platform foregrounds.
Applying this lens, several affordance families can be distinguished. Short-video feeds (for example, TikTok) foreground algorithmically curated, rapidly refreshing, autoplaying content that supports passive, low-friction consumption and variable-ratio reward schedules (Chin et al. 2025; Pan 2023). Image-sharing feeds (for example, Pinterest and Instagram) foreground idealised visual self-presentation and social comparison. Messenger applications (for example, WhatsApp and Facebook Messenger) foreground dyadic and small-group synchronous communication. Professional networks (for example, LinkedIn and Xing) foreground curated identity work oriented toward employment. To make the mapping explicit: the reward family bundles algorithmic curation, autoplay persistence, and quantified social feedback (variable-ratio “likes” and view counts); the comparison family bundles visibility, content persistence, and editability, which jointly enable idealised self-presentation and upward comparison (Bayer et al. 2020; Trepte 2021); and the interruption family bundles constant availability and asynchronous notification, which fragment attention across contexts. Because these families differ in the reward, comparison, and interruption affordances they emphasise, affordance theory predicts that they should differ systematically in their harm profiles—and, importantly, that platforms sharing an affordance family should cluster together. This prediction is the theoretical rationale for the number of tiers we adopt in Section 3, and we are careful in Section 5 not to treat the resulting affordance-consistency of the clusters as independent confirmation of the theory (see Section 5.1).
2.4. Defining the Four Harm Outcomes
Because the literature on social media harm spans many constructs, we define at the outset the four outcomes that the empirical analysis actually uses, and we distinguish related terms that are sometimes conflated.
2.4.1. Addictive Use
Problematic or addictive social media use refers to a pattern of engagement marked by preoccupation, tolerance, withdrawal, and use that persists despite adverse consequences (Andreassen 2015). It is the most direct behavioural marker of platform-related risk and is the primary outcome in the present simulation.
2.4.2. Mental Health and Well-Being
We use mental health to denote the presence or absence of psychological symptoms (for example, depressive or anxious symptomatology), and well-being to denote a broader evaluative and affective appraisal of one’s life. These are related but distinct constructs, and reviews caution that social media use relates differently to each depending on whether use is active or passive (Verduyn et al. 2017; Dienlin and Johannes 2020). Because the dataset provides a single self-rated mental health score, we use the term mental health throughout and reserve well-being for the broader conceptual discussion.
2.4.3. Sleep
Shorter and poorer-quality sleep is among the most consistently reported correlates of heavy social media use, plausibly through displacement of sleep time and pre-sleep arousal (Alonzo et al. 2021). The dataset operationalises this as self-reported average sleep hours per night; we treat shorter duration as the harm-aligned direction.
2.4.4. Interpersonal Conflict
Social media-related interpersonal conflict refers to arguments or tensions with family, partners, or peers attributed to one’s use. It is a socially salient harm but a difficult one to measure, because respondents may not share a common threshold for what counts as a “conflict”; we return to this measurement concern in Section 3.3.
2.4.5. Cross-Cutting Behavioural Distinction: Active Versus Passive Use
Cutting across these outcomes is the distinction between active use (directed communication, creation, and contribution) and passive use (non-directed browsing and consumption). The distinction matters because passive use, especially social comparison during passive scrolling, is more consistently linked to declines in well-being than active, communicative use (Verduyn et al. 2017; Dienlin and Johannes 2020). Affordance families differ precisely in how strongly they invite passive versus active engagement, which is why an affordance-based typology is a natural organising device for platform risk.
2.5. Current Policy Instruments and the Platform-Wellness Debate
The so-called platform-wellness debate is the ongoing policy and scholarly dispute over whether digital wellness regulation should target total screen time uniformly or should differentiate among platforms according to their distinct risk profiles (Thomas et al. 2022; Uslu 2025). Regulatory responses have so far tracked the first-generation screen time evidence. The most common instruments are total screen time caps for minors, mandatory device-level limit tools, and negotiated parental control settings (Taiwade et al. 2022; Thomas et al. 2022). Several jurisdictions have moved toward platform-specific curfews for short-video services, and a smaller number have imposed design-level requirements such as default autoplay disablement (Uslu 2025). These interventions reflect a growing recognition that uniform caps are insufficient, but the menu of alternatives remains conceptually thin: most proposals single out one or two high-profile platforms for special treatment, and few offer a structured method for deciding which platforms should be grouped together and what interventions should apply at each risk level.
2.6. Gap Addressed by the Present Study
Despite accumulating evidence that platform identity (or, more precisely, platform affordance profile) matters, the literature has not produced a transparent, reproducible procedure for translating multi-platform outcome data into a risk typology that can guide graduated policy. Existing studies typically test platforms one at a time against one outcome at a time, or report between-platform differences without organising them into actionable tiers. The present study addresses this methodological gap by demonstrating a pipeline that (a) derives a platform-risk typology from a multi-outcome harm vector, (b) projects the typology onto a two-dimensional risk map, and (c) uses the tiers to simulate candidate policy regimes. The contribution is deliberately methodological: we offer a template that can be re-run on stronger primary datasets, not a final risk classification.
3. Methodology
3.1. Research Design
This study is a secondary quantitative analysis conducted as a methodological proof of concept. Its aim is translational and demonstrative: to show how multi-platform outcome data can be converted into a tiered safeguard framework and to evaluate the properties of that pipeline. The design prioritises interpretability, reproducibility, and transparency over causal identification or epidemiological estimation. We make no causal claims, and, for the reasons given in Section 3.2, treat every platform-level statistic as an illustration of the method rather than a validated estimate of platform risk.
3.2. Data Source, Provenance, and Data-Quality Assessment
The dataset is the “Students’ Social Media Addiction” resource released by an uploader (Adil Shamim) on Kaggle under a Creative Commons Attribution 4.0 licence. It contains 705 records, each representing a university student, with four psychosocial outcomes together with dominant-platform, daily usage, and demographic variables. We selected it because it covers twelve platforms simultaneously—rare in openly available student samples—includes a usable dose variable (self-reported average daily hours), and carries an open licence that permits fully transparent replication.
3.2.1. Provenance
We wish to be candid that an open licence governs reuse rights, not data validity. The dataset’s provenance cannot be established from the materials accompanying it: the original data collector, the sampling population, the time period of collection, the instrument, and any ethical approval status are not documented. The uploader is the only identifiable party, and re-use of the resource does not imply that these particulars are known. We therefore cannot vouch for the epidemiological validity of any value in the dataset, and we do not.
3.2.2. Signals Consistent with Synthetic or Semi-Synthetic Data
Direct inspection revealed several patterns that are difficult to reconcile with authentic survey data. (i) Nine of the forty-eight platform × outcome cells exhibit exactly zero within-platform variance: every respondent whose dominant platform is LINE, KakaoTalk, or VKontakte reports an identical addiction score, mental health score, and conflict count, which does not occur in genuine self-report data. (ii) The four outcomes are near-collinear, with inter-correlations far higher than is typical for distinct psychosocial self-reports (for example, addictive use correlates with mental health at r = −0.95 and with conflict at r = 0.93). (iii) Addictive use is almost deterministic in reported daily usage: platform-agnostic mean addiction rises monotonically and with small dispersion across each hour of usage. (iv) The 705 students are distributed across 110 countries (roughly six per country), which is implausible for a single coherent survey. Taken together, these signatures indicate a synthetic or heavily processed source. Consequently, all numerical results below are illustrative of the analytical pipeline and are not primary epidemiological estimates; any institutional use of the framework must first replicate it on a real, documented student cohort.
3.2.3. The Unit of Analysis
Most importantly for interpretation, although the survey comprises 705 students, the clustering and principal component analysis operate on the twelve platform-level means of the four outcomes. The effective sample for the typology and the risk map is therefore twelve observations, not 705. We make this explicit here and again in Section 4 and Section 5, because it fundamentally bounds the confidence that any tier assignment can carry. Table 1 summarises the data-selection and preprocessing pipeline.
Table 1.
Six-step data-selection and preprocessing pipeline. The clustering unit is the platform (n = 12).
3.3. Variable Operationalization and Measurement
The four typology inputs are continuous platform-aggregated outcomes: a self-reported addictive-use score (1–10), a self-rated mental health score (1–10, higher = better, reversed for the harm vector), self-reported average sleep hours per night (reversed), and a self-reported interpersonal-conflict count. A fifth variable, a binary self-report of whether social media affects academic performance (“yes”/”no”), is used descriptively in Section 4 to characterise tiers; it is not one of the four clustering outcomes. Age, gender, academic level, and country were available but not entered into clustering, which targets platform-level rather than student-level structure.
Item wording and its limits. Because provenance is undocumented, the exact original item wording is not available, which is itself a measurement limitation. Table 2 gives the variables as supplied together with plausible operational reconstructions, offered only to orient the reader. The conflict measure warrants particular caution: respondents are unlikely to share a common definition of what constitutes a “conflict,” so counts may not be comparable across individuals, threatening validity and comparability. All four outcomes are single-item measures.
Table 2.
Variables as supplied and illustrative operationalization (exact original wording is undocumented).
Reliability. Standard internal-consistency reliability (Cronbach’s α) cannot be computed for the individual outcomes because each is a single-item measure; this is a limitation of the source data. As a descriptive check on the composite harm index that the pipeline actually uses, we computed α across the four standardised harm-aligned items and obtained α = 0.95. This value should be read with caution rather than as reassurance: such a high coefficient across four ostensibly distinct constructs is itself consistent with the near-collinearity documented in Section 3.2 and with a synthetic data-generating process, not necessarily with genuine measurement quality.
3.4. Analytical Pipeline
Analyses were conducted in Python 3.11 (pandas, scipy, scikit-learn); the workflow is shown in Figure 1. Stage 1 aggregates the four harm-aligned outcomes to platform means, yielding the 12 × 4 matrix. Stage 2 applies hierarchical clustering with Ward linkage to the standardised matrix. Ward linkage minimises within-cluster variance and yields compact groups suitable for mapping to discrete tiers. The linkage was cut at four clusters as an a priori, theory-driven choice, motivated by the affordance families set out in Section 2.3 (professional/messenger, general-purpose lower, general-purpose higher, and short-video/image); it was not selected by an internal validity index. Stage 3 projects the platforms onto two principal components of the same matrix. Stage 4 runs the policy simulation on the five-platform dose–response sub-sample (n = 610), described in Section 3.6.
Figure 1.
Analytical workflow from raw dataset through typology construction to the tiered safeguard framework.
3.5. Cluster Robustness and Sensitivity
Because the four-cluster choice is theory-driven rather than validated, its sensitivity must be examined. We compared the three-, four-, and five-cluster Ward solutions. The three-cluster solution preserves the low-risk group (LINE, LinkedIn) and the short-video/messenger high-risk group (TikTok, Snapchat, WhatsApp) but merges all seven general-purpose networks into a single undifferentiated middle cluster, erasing the moderate/low-moderate distinction that is central to a graduated policy. The five-cluster solution splits YouTube off as an unstable singleton (n = 10), a small-sample artefact rather than a meaningful tier. The four-cluster solution is thus the coarsest partition that separates the theoretically distinct affordance families without producing singletons, which is why we adopt it—on stated conceptual grounds, and while acknowledging that no internal index compels the choice. Two further caveats follow from the small number of platforms: with only twelve observations, alternative linkages or a larger platform set could reorder the middle tiers, and the near-total variance captured by the first two principal components (Section 4.3) reflects the low dimensionality of a twelve-point cloud rather than robustness. We therefore treat both the tier count and the risk-map geometry as illustrative.
3.6. Policy-Simulation Design
The simulation compares three regimes on the dose–response sub-sample by substituting users’ platform-level addiction scores with those of a target usage tertile. Policy A (uniform cap) moves all users to the low-use tertile. Policy B (tier-calibrated cap) moves users on Tier 3–4 platforms to the low tertile and users on Tier 2 platforms to the mid tertile. Policy C (affordance-targeted cap) moves only users of platforms primarily organised around short-form video to the low tertile. Within this twelve-platform set, that criterion selects TikTok alone: Instagram, although it offers Reels, is a multi-format, image-and-feed platform and is classified as general-purpose (Tier 3), so it is not included in Policy C. We make this scope explicit because it materially affects the result—if Policy C were widened to include Instagram, its footprint would rise from about one-quarter to roughly two-thirds of the sub-sample and its harm reduction would more than triple—and because the dataset cannot isolate a user’s short-video minutes within a multi-format platform. The simulation is deterministic: it models neither behavioural substitution, displacement to other platforms, nor heterogeneous response, all of which we treat as limitations (Section 5.6).
4. Results
4.1. Sample and Platform Distribution
The dataset comprises 705 students across twelve platforms. Instagram accounts for the largest share (n = 249, 35.3%), followed by TikTok (n = 154, 21.8%) and Facebook (n = 123, 17.4%); WhatsApp (n = 54), Twitter (n = 30), and LinkedIn (n = 21) add a further 15%. The remaining six platforms (Snapchat, WeChat, LINE, KakaoTalk, VKontakte, and YouTube) each contribute between ten and fifteen cases. Several tiers therefore rest on very small cells, and, as noted, three of the small platforms exhibit zero within-platform variance—facts that bear directly on the stability of any tier assignment.
Given these limitations, the rationale for retaining this dataset deserves a direct statement. The contribution of the paper is the pipeline, not the estimates: a public dataset—even one of uncertain provenance—is sufficient to demonstrate an analytical method whose value lies precisely in being re-runnable on stronger primary data. Its public availability also makes the demonstration fully reproducible by any reader, which no proprietary dataset would permit. And documenting the synthetic signatures before analysis is itself part of the method: the data-forensics step in Section 3.2 is a worked example of the screening we would advocate before any wellness dataset informs policy.
4.2. Illustrative Four-Tier Risk Typology
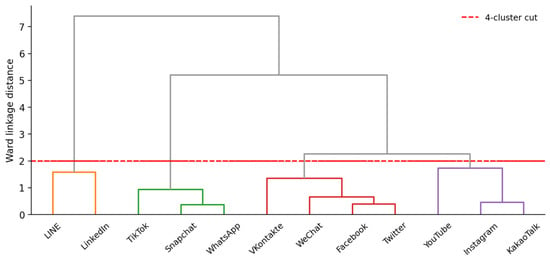
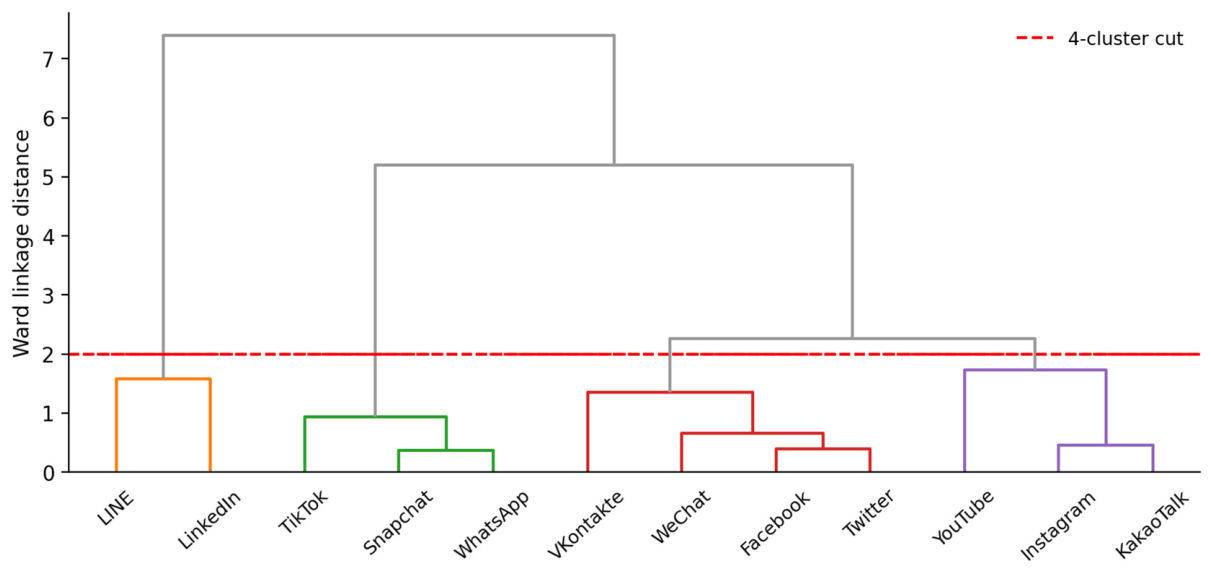
Ward-linkage clustering on the standardised four-outcome harm vector produced the four-cluster solution in Figure 2. It partitions the twelve platforms into a low-risk tier, a low-to-moderate tier, a moderate-to-high tier, and a high-risk tier. We reiterate that this partition is a partition of twelve platform-level points.
Figure 2.
Ward-linkage dendrogram of the twelve platforms on the standardised harm vector; the red dashed line marks the a priori four-cluster cut.
Tier 1 (low risk) contains LINE and LinkedIn, with a mean harm composite of −1.66 standardised units, a platform-level mean addiction score of 3.40, and zero academic-performance impact in the sample. Tier 2 (low–moderate) contains VKontakte, Facebook, Twitter, and WeChat (composite −0.30; addiction 5.56; 30% reporting academic impact). Tier 3 (moderate–high) contains YouTube, KakaoTalk, and Instagram (composite +0.30; addiction 6.22; 66%). Tier 4 (high) contains TikTok, Snapchat, and WhatsApp (composite +1.21; addiction 7.45; 95%). Table 3 illustrates the four-tier platform-risk typology. The “academic impact” figures are the tier-mean percentages of students answering “yes” to the academic-performance item defined in Section 3.3; they are descriptive, not clustering inputs. The assignment of WhatsApp—a messaging application—to the high-risk tier is theoretically surprising and, as Section 5.6 explains, is driven partly by a small-sample, zero-variance artefact in the source data; it should not be read as evidence that messaging is equivalent in risk to short-video platforms.
Table 3.
Illustrative four-tier platform-risk typology (clustering unit: 12 platform means).
4.3. Two-Dimensional Risk Map
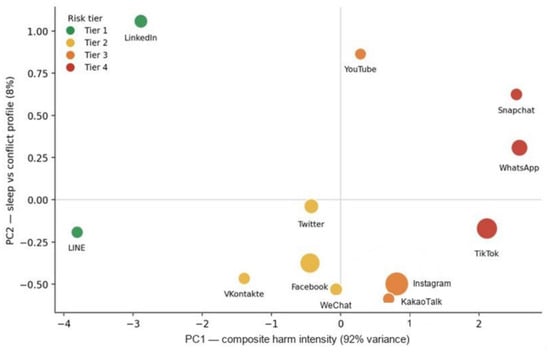
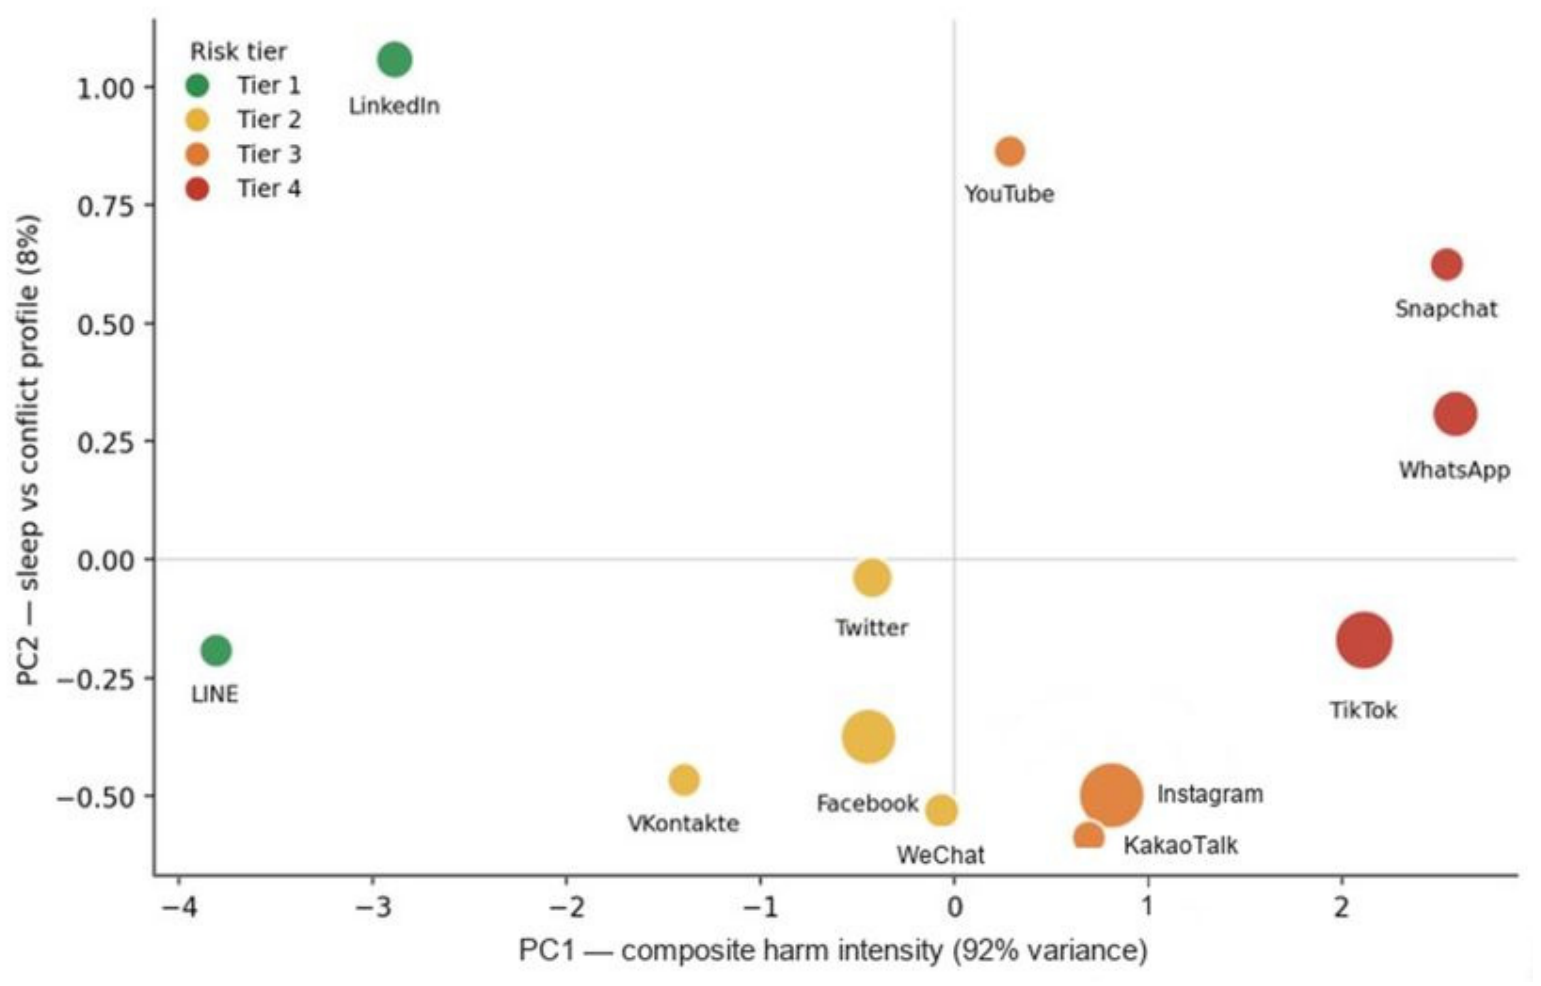
Principal component analysis on the same standardised matrix yields a two-dimensional projection accounting for about ninety-nine percent of between-platform variance, with the first component alone capturing roughly ninety-two percent. The first component loads positively and approximately equally on all four harm dimensions and is interpretable as a composite harm-intensity axis; the second contrasts sleep-dominant with conflict-dominant profiles. Figure 3 projects the twelve platforms onto this plane, coloured by tier and sized by n. We caution that the very high variance explained is a mathematical consequence of projecting only twelve points into two dimensions, not evidence of robustness; with a larger and more diverse platform set the map’s geometry could change substantially.
Figure 3.
Two-dimensional risk map. PC1 indexes composite harm intensity; PC2 contrasts sleep- and conflict-dominant profiles. Colour denotes tier; marker size is proportional to platform n.
4.4. Policy Simulation
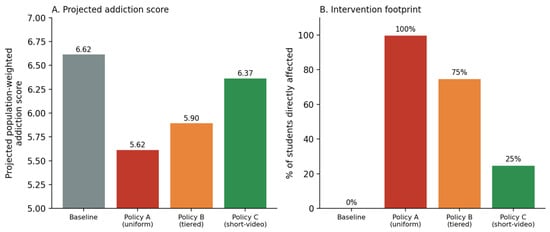
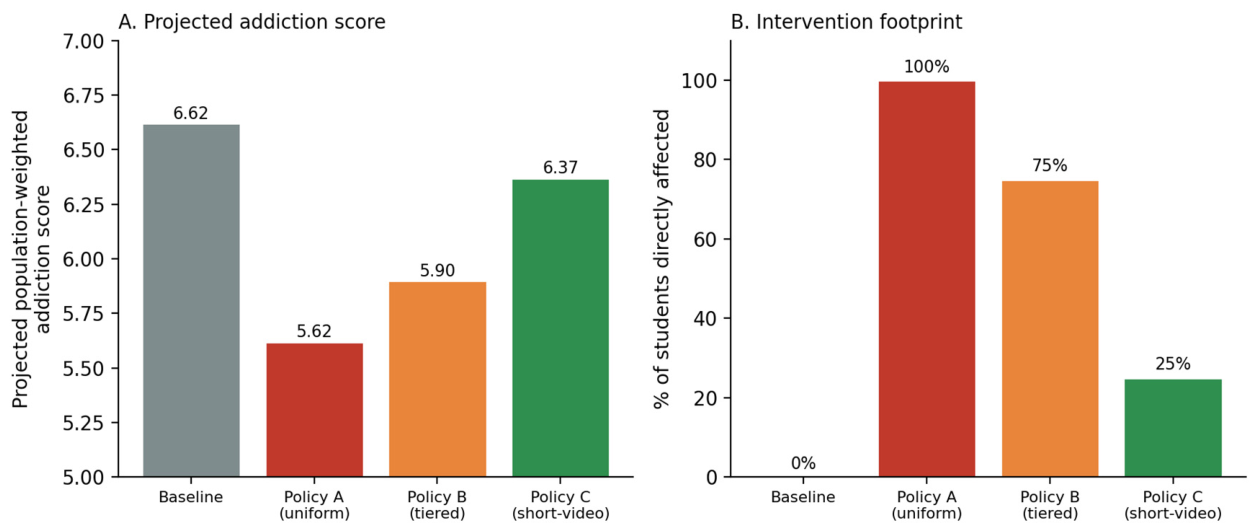
Table 4 and Figure 4 summarise the simulation on the dose–response sub-sample (n = 610). The population-weighted baseline addiction score under current usage is 6.62. Policy A (uniform cap) lowers the projected score to 5.62 (−1.00) but alters the behaviour of one hundred percent of students. Policy B (tier-calibrated) lowers it to 5.90 (−0.72) while materially altering about seventy-five percent (those on Tier 3–4 platforms; Tier 2 users move only to the mid tertile, a negligible change). Policy C (short-video/TikTok-only) lowers it to 6.37 (−0.25) while altering only about twenty-five percent.
Table 4.
Projected addiction scores and intervention footprints under three illustrative policy regimes (n = 610).
Figure 4.
Policy-simulation outcomes. (A) projected addiction score under each regime. (B) proportion of students directly affected.
Expressed as harm reduction per percentage point of population affected, the three regimes are close: Policy A yields −0.0100 percent, Policy B −0.0096, and Policy C −0.0100. In this illustrative dataset, narrower regimes approach the per-user efficiency of a blanket cap while exposing far fewer students to intervention. We caution against over-reading this metric, however: per-percent efficiency captures neither the psychological and symbolic costs borne by those who are affected, nor differences in compliance burden and enforcement cost across regimes, nor equity considerations about who is targeted. These non-quantified costs are taken up in Section 5.5.
4.5. Illustrative Tiered Safeguard Framework
As a demonstration of how such a typology could inform graduated policy, we sketch a four-tier framework in which interventions scale with tier rather than with total daily hours. Tier 1 would attract ordinary digital-literacy messaging and no additional restriction; Tier 2, general awareness prompts and opt-in usage summaries; Tier 3, soft design-level nudges (for example, autoplay off by default), counselling-intake screening, and affordance reviews; and Tier 4, the strongest proportionate measures, such as time-boxed access for students in academic difficulty and mandatory reviews of recommender and reward affordances. We present this framework as a translational template only; the tiers on which it rests are, in this paper, illustrative outputs of a twelve-point clustering on data of uncertain provenance.
5. Discussion
5.1. Principal Findings, and a Note on Circularity
Three observations carry the demonstration. First, clustering a four-outcome harm vector yields a four-tier typology whose grouping is broadly consistent with affordance families. Because the four-cluster cut was chosen a priori to reflect those very families (Section 3.4), the resulting consistency is not independent confirmation of affordance theory but a designed-in property of the analysis. We therefore report it as coherence between a theory-motivated choice and its output, not as a finding that validates the theory. Second, the typology can be rendered as a two-dimensional risk map dominated by a single composite–harm axis, which aids communication; however, as noted, the high variance explained is an artefact of dimensionality. Third, in this illustrative dataset, tier-calibrated and short-video-targeted caps deliver roughly equivalent per-user harm reduction to a blanket cap while affecting far fewer students.
5.2. Why Uniform Caps May Fall Short
The simulation makes the logic of uniform caps concrete. A blanket ceiling achieves the greatest total harm reduction only because it is applied to everyone, including the roughly one-third of students whose dominant platform sits in the low tiers, for whom the marginal well-being gain is small. Untargeted instruments of this kind over-treat a low-risk majority to reach a high-risk minority. Tiered caps trade a modest amount of total harm reduction for proportionality, and targeted caps trade more total reduction for a much smaller, mechanism-aligned footprint. We frame this as an argument about the logic of graduated policy that the pipeline can help formalise, not as a validated empirical result about real platforms.
5.3. Designing Tiered Safeguards in Practice
Translating a tier framework into institutional policy would require at least three design commitments. Tier boundaries would need periodic refreshing, because affordances evolve: a mid-tier network can migrate upward when its product team adds a short-video feed, as Instagram’s trajectory illustrates. The intervention menu at each tier should be proportionate and reversible, emphasising information and nudges at lower tiers and schedule-level limits—integrated into existing academic-support workflows—at higher tiers. And the framework should include an opt-out for students whose use of a high-tier platform is clearly purposive and low-harm, so that the goal remains proportionality rather than blanket restriction under a new label.
5.4. Practical Implications: Digital Literacy, Awareness Prompts, and Nudging
Several families of approaches exist for mitigating the potential negative outcomes of social media use, ranging from educational interventions that build users’ understanding, through informational interventions that surface behaviour back to the user, to choice-architectural interventions that alter the decision environment itself. The tier framework sketched above draws on three of these: digital literacy, awareness prompts, and nudging. We define each in turn and note where it sits in the framework.
Digital literacy, in this context, denotes a concrete set of competencies: understanding how recommender systems curate and rank content; recognising persuasive and variable-reward design patterns; distinguishing active, communicative use from passive, comparison-driven scrolling; interpreting one’s own usage data; and knowing how to configure privacy and time-management settings. A digitally literate student is one who can name the affordances acting on them and adjust their behaviour accordingly. Awareness prompts are in-context messages surfaced at decision points—for example, a brief interstitial after thirty minutes of continuous short-video viewing (“You’ve been scrolling for 30 min; take a break?”), or a weekly summary comparing a student’s use against their own stated goals. Nudging refers to changes in choice architecture that steer behaviour while preserving free choice (Thaler and Sunstein 2008): defaulting autoplay to off, greying out infinite-scroll after a threshold, or ordering a settings menu so that time-limit tools are prominent.
Nudging versus manipulation. Design interventions intended to influence behaviour raise an ethical line between legitimate nudging and manipulation. Following the standard distinction, a nudge is transparent and preserves the user’s capacity for reflective choice, whereas manipulation exploits non-rational tendencies covertly or against the user’s interest (Susser et al. 2019). An institution proposing autoplay-off defaults should therefore ensure the change is disclosed, easily reversible, and demonstrably in the student’s interest—otherwise a “wellness” nudge risks reproducing the very manipulative dynamics it aims to counter.
5.5. Ethical Implications of a Tiered Classification
A platform-risk typology is not ethically neutral, and several risks deserve explicit attention. First, and most importantly, platforms placed outside the high-risk tier may be misread as inherently safe. This is a category error: risk here is a relative, affordance- and context-dependent property of an illustrative dataset, not a safety certification, and a low-tier platform can still cause harm for particular users and uses. Any published typology should carry this caveat prominently. Second, tiering can stigmatise: labelling a platform (or, by extension, its users) “high-risk” may invite disproportionate scrutiny or paternalistic restriction, especially of the students most reliant on a given platform. Third, a published tier map creates incentives for gaming: platforms may optimise for a lower tier without reducing real harm. Fourth, the very metric we used to compare regimes—harm reduction per percent affected—embeds an ethical stance by treating breadth of intervention as a cost; it is silent on the distribution of that cost, on autonomy, and on compliance burden. For all these reasons, we regard the framework as a structured way to reason about proportionate policy, not as a licence to classify and restrict.
5.6. Limitations
The limitations are substantial and shape every conclusion. (i) The typology and risk map rest on twelve platform-level observations, so all tier assignments carry very low statistical confidence. (ii) The source data show characteristics consistent with synthetic or semi-synthetic simulation, and their provenance—collector, population, period, instrument, and ethics status—cannot be established; results are illustrative only. (iii) Platform-level aggregation discards within-platform heterogeneity: a student who uses TikTok for language learning and one who uses it for passive short-video consumption receive the same tier label, which weakens the relevance of tier assignments for individual-level intervention. (iv) All outcomes are single-item, self-reported measures, precluding per-construct reliability estimation and exposing the analysis to common-method bias, whereby shared method inflates inter-outcome correlations (Podsakoff et al. 2003); self-reported daily usage is a particular concern, since logged and self-reported digital-media use diverge substantially (Parry et al. 2021). (v) The conflict measure lacks a shared definitional threshold, threatening comparability. (vi) The WhatsApp tier assignment is partly a zero-variance artefact and should not be interpreted substantively. (vii) The simulation is deterministic and ignores behavioural substitution, displacement, and heterogeneous response. (viii) Objective behavioural or academic-record data, absent here, would be needed to test whether the typology predicts anything beyond self-report.
5.7. Future Work
Three lines of work follow. The pipeline should be re-derived on a real, documented, multi-platform longitudinal cohort with prospective well-being and academic outcomes, enabling out-of-sample testing of tier assignments and, ideally, more platforms so that clustering rests on more than a dozen points. The deterministic simulation should be replaced by a stochastic, agent-based model permitting substitution, displacement, and heterogeneous response. And the framework should be piloted in a single institution—embedded, for example, in first-year orientation—with pre-registered process and outcome measures, before any tier is used to justify restrictive action.
6. Conclusions
Uniform screen time caps are the most widely used digital wellness instrument and arguably the most poorly specified (Uslu 2025; Thomas et al. 2022). If platforms differ systematically in their affordance-linked harm profiles, then treating all platforms alike will simultaneously over-restrict a low-risk majority and under-restrict a high-risk minority. This paper has demonstrated, as a proof of concept, a transparent and reproducible pipeline for moving beyond blanket caps: aggregate platforms on a multi-outcome harm vector, cluster them into tiers, render the result as a two-dimensional risk map, and simulate policy regimes against the tiers. Applied to a publicly available twelve-platform dataset, the pipeline yields an illustrative four-tier typology, a communicative risk map, and a simulation in which tier-calibrated and targeted caps approach the per-user efficiency of blanket caps while affecting fewer students. We emphasise that these outputs rest on twelve platform-level observations drawn from data of uncertain provenance and are demonstrations of method, not validated findings. The contribution is the method and the design questions it makes precise; the substantive claims await replication on real, longitudinal, multi-platform data.
Author Contributions
Conceptualisation, N.A.R. and M.I.Z.A.; methodology and formal analysis, N.A.R. and A.A.R.; writing—original draft, N.A.R.; writing—review and editing, M.I.Z.A. and A.A.R. All authors have read and agreed to the published version of the manuscript.
Funding
This research was supported by the Higher Colleges of Technology (HCT) under the Ap- plied Research Grant (Project ID: ARC_04_D006), titled “Preserving UAE Cultural Heritage through Generative AI and Immersive Technologies.” The authors would like to thank for the institutional support and resources provided during the development of this study.
Institutional Review Board Statement
Not applicable.
Informed Consent Statement
Not applicable.
Data Availability Statement
The analysis uses the publicly available “Students’ Social Media Addiction” dataset on Kaggle (CC BY 4.0). Analysis code is available from the corresponding author on reasonable request.
Acknowledgments
The authors thank the Kaggle uploader of the “Students’ Social Media Addiction” dataset, which served as the illustrative substrate for demonstrating the analytical pipeline; as noted in Section 3.2, the original data collector and provenance are undocumented. During preparation of this manuscript, the authors used ChatGPT (OpenAI, GPT 5.6 sol model) solely for language editing and Python 3.11 (pandas SciPy, and scikit-learn) for data analysis. All AI-assisted output was reviewed and verified by the authors, who take full responsibility for the publication’s content.
Conflicts of Interest
The authors declare no conflicts of interest. The funders had no role in the design of the study; in the collection, analyses, or interpretation of data; in the writing of the manuscript; or in the decision to publish the results.
References
- Alonzo, Rea, Junayd Hussain, Saverio Stranges, and Kelly K. Anderson. 2021. Interplay between social media use, sleep quality, and mental health in youth: A systematic review. Sleep Medicine Reviews 56: 101414. [Google Scholar] [CrossRef] [Scilit] [PubMed]
- Andreassen, Cecilie Schou. 2015. Online social network site addiction: A comprehensive review. Current Addiction Reports 2: 175–84. [Google Scholar] [CrossRef] [Scilit]
- Bayer, Joseph B., Penny Trieệu, and Nicole B. Ellison. 2020. Social media elements, ecologies, and effects. Annual Review of Psychology 71: 471–97. [Google Scholar] [CrossRef] [Scilit] [PubMed]
- Bradley, Abigail, Yulia Gmiro, Alysha Stoakes, Zoe Meloff, Syed J. Hasan, Amy Heaslip, and Andrea Howard. 2024. Is Limiting Social Media Use Feasible for Young Adults? A 4-Study Replication Failure of a Screen Time Reduction Intervention. PsyArXiv. [Google Scholar] [CrossRef]
- Chin, Alvin, Justin Chan, Joshua Garcia, Aria Barve, Kevin Leicht, and Philip Yu. 2025. Improving social connections through mobile social networks. In IEEE 49th Annual Computers, Software, and Applications Conference (COMPSAC). Piscataway: IEEE, pp. 1770–75. [Google Scholar] [CrossRef] [Scilit]
- Dienlin, Tobias, and Niklas Johannes. 2020. The impact of digital technology use on adolescent well-being. Dialogues in Clinical Neuroscience 22: 135–42. [Google Scholar] [CrossRef] [Scilit] [PubMed]
- Eric, Andreas. 2025. Defining the threshold: A dose-response meta-analysis of daily screen time and adverse behavioral outcomes in children and adolescents. Open Access Indonesian Journal of Medical Reviews 5: 1514–28. [Google Scholar] [CrossRef] [Scilit]
- Matakanye, Hulisani. 2025. Evaluating the effects of screen time on the wellbeing of young people: A scoping review. JMIR Preprints. [Google Scholar] [CrossRef] [Scilit]
- Mohd Saat, Nur Zakiah, Siti Aishah Hanawi, Hazlenah Hanafiah, Mahadir Ahmad, Nor M. F. Farah, and Nur Ain Atikah Abdul Rahman. 2024. Relationship of screen time with anxiety, depression, and sleep quality among adolescents: A cross-sectional study. Frontiers in Public Health 12: 1459952. [Google Scholar] [CrossRef] [Scilit] [PubMed]
- Novánská Škripcová, Lucia, and Lucia Viteková. 2025. Problematic short-form video use, instant gratification, impulsivity, and psychological distress among Slovak university students. Studies in Media and Communication 13: 326. [Google Scholar] [CrossRef] [Scilit]
- Pan, Yuyan. 2023. Study on the influence of the personalized algorithm of social media TikTok upon college students. Lecture Notes in Education Psychology and Public Media 4: 1185–96. [Google Scholar] [CrossRef] [Scilit]
- Parry, Douglas A., Brittany I. Davidson, Craig J. R. Sewall, Jacob T. Fisher, Hannah Mieczkowski, and Daniel S. Quintana. 2021. A systematic review and meta-analysis of discrepancies between logged and self-reported digital media use. Nature Human Behaviour 5: 1535–47. [Google Scholar] [CrossRef] [Scilit] [PubMed]
- Podsakoff, Philip M., Scott B. MacKenzie, Jeong-Yeon Lee, and Nathan P. Podsakoff. 2003. Common method biases in behavioral research: A critical review of the literature and recommended remedies. Journal of Applied Psychology 88: 879–903. [Google Scholar] [CrossRef] [Scilit] [PubMed]
- Susser, Daniel, Beate Roessler, and Helen Nissenbaum. 2019. Online manipulation: Hidden influences in a digital world. Georgetown Law Technology Review 4: 1–45. [Google Scholar]
- Taiwade, Himanshu, Aman Yerwarkar, Gaurav Sewatkar, Mayur Mandape, Milind Patle, and Sagar Koli. 2022. Decreasing the screen time on social media using time limitations. International Journal of Advanced Research in Science, Communication and Technology, 229–33. [Google Scholar] [CrossRef] [Scilit]
- Thaler, Richard H., and Cass R. Sunstein. 2008. Nudge: Improving Decisions About Health, Wealth, and Happiness. New Haven: Yale University Press. [Google Scholar]
- Thomas, Nisha M., Sonali G. Choudhari, Abhay M. Gaidhane, and Zahiruddin Quazi Syed. 2022. Digital wellbeing: The need of the hour in today’s digitalized and technology-driven world. Cureus 14: e27743. [Google Scholar] [CrossRef] [Scilit] [PubMed]
- Trepte, Sabine. 2021. The social media privacy model: Privacy and communication in the light of social media affordances. Communication Theory 31: 549–70. [Google Scholar] [CrossRef] [Scilit]
- Uslu, Osman. 2025. Understanding digital wellbeing: Impacts, strategies, and the path to healthier technology practices. Discover Social Science and Health 5: 145. [Google Scholar] [CrossRef] [Scilit]
- Verduyn, Philippe, Oscar Ybarra, Maxime Résibois, John Jonides, and Ethan Kross. 2017. Do social network sites enhance or undermine subjective well-being? A critical review. Social Issues and Policy Review 11: 274–302. [Google Scholar] [CrossRef] [Scilit]
- Vizcaino, Maricarmen, Matthew Buman, C. Tyler DesRoches, and Christopher Wharton. 2019. Reliability of a new measure to assess modern screen time in adults. BMC Public Health 19: 1386. [Google Scholar] [CrossRef] [Scilit] [PubMed]
- Wu, Gongbinxuan, Claire Eades, and Louise Hoyle. 2026. Association of screen time with physical and mental health in university students: A systematic review and meta-analysis. JMIR Preprints. [Google Scholar] [CrossRef] [Scilit]



Disclaimer/Publisher’s Note: The statements, opinions and data contained in all publications are solely those of the individual author(s) and contributor(s) and not of MDPI and/or the editor(s). MDPI and/or the editor(s) disclaim responsibility for any injury to people or property resulting from any ideas, methods, instructions or products referred to in the content. |
© 2026 by the authors. Licensee MDPI, Basel, Switzerland. This article is an open access article distributed under the terms and conditions of the Creative Commons Attribution (CC BY) license.