


Abstract
Noise pollution has become an increasingly discussed environmental problem in recent years. Developing a traffic infrastructure and recent sustainability goals require new solutions to mitigate noise pollution. This paper investigates the efficiency of the noise barrier made entirely of recycled materials. This solution would help achieve the United Nations sustainable development goals (SDGs). The proposed barrier target SDGs are: Good Health and Well-being (SDG 3); Industry, Innovation, and Infrastructure (SDG 9); Sustainable Cities and Communities (SDG 11); Climate Action (SDG 13). The changed barrier parameters were the parameters of the perforated panel and the air gap behind the porous material. To solve the optimisation problem, the Technique for Order Preference by Similarity to Ideal Solution (TOPSIS) method was used. The results showed that the proposed barrier configuration was the following: perforation shape—round, perforation diameter—5 mm, increment angle perforation—30°, thickness of the perforated panel—10 mm, porous absorbing material (composite rubber granule and hemp shive panel (RGHS))—50 mm thick, 20% of hemp shive content, air gap between absorbing material and the rigid backing—100 mm. The total thickness of the noise barrier was 180 mm. The acoustic parameters of the noise barrier structure were: αavg. = 0.24, peaking at 0.51 (1250 Hz) and RW = 39.7 ± 1.0 dB. These results indicate that the proposed barrier made of recycled materials could be a sustainable alternative for noise pollution mitigation and improving people’s quality of life.
1. Introduction
Noise pollution represents one of the most increasing environmental challenges in modern urban and transportation networks, emerging as a critical concern for environmental health and urban sustainability. Since the 2000s, the number of registered vehicles has increased from 960 million to 1.6 billion worldwide [1], making noise mitigation an essential component of environmental protection and public health policy [2]. Noise barriers have emerged as the primary engineering solution for reducing traffic-induced noise pollution, acting as a passive noise control structure that protects communities from excessive sound levels. The purpose of noise barriers goes beyond simple sound reduction: they represent a point where acoustical engineering meets urban planning, traffic safety measures, environmental protection, and public health [3]. The widespread construction of these structures reflects the recognition that traffic noise poses significant risks to human well-being. The aim of noise barriers for road and railway traffic is to attenuate the transmission of sound energy from the source to the receiver (which are considered as households, hospitals, hotels, etc.), with evident health and environmental benefits. As populations continue to increase and transportation intensifies, the strategic planning and optimisation of noise barriers have become important to ensure compliance with environmental noise regulations and to protect the living environment of communities [4].
Noise barriers, by purpose, are divided into five categories, each exploiting different acoustic principles and materials to achieve noise mitigation objectives [5]. Barriers are classified by primary acoustic mechanism: reflective, absorptive, reactive, diffusive, and vegetative barriers [6]. Reflective noise barriers are typically constructed from dense materials, such as concrete, metal, or transparent plastic (organic glass) panels, and reduce noise by blocking the direct sound path between the source and receiver. Their main advantages include structural simplicity, durability, and relatively low construction costs [5,7]. However, they reflect sound energy back to the source or the surrounding environment, which can increase noise levels elsewhere, particularly when barriers are installed on both sides of a roadway. Typically, the insertion loss of these structures is 2–18 dB [5]; however, there is a risk of sound amplification by up to 5 dB [8]. This would create discomfort for passing vehicles’ passengers and drivers. However, absorptive noise barriers incorporate porous or fibrous materials that dissipate acoustic energy by converting it into heat, thus reducing reflected sound waves [9]. These barriers are particularly effective in locations where reflected noise may accumulate, such as urban corridors. Nevertheless, absorptive systems usually require multilayer structures with perforated protective panels, increasing the complexity and cost of the design. In addition, the performance of absorbing materials may decrease over time due to deterioration, moisture, or contamination (clogged perforation and sound-absorbing material) [10]. These barriers reach 8–20 dB in insertion loss [11], which, compared to reflective barriers, are more effective and pose no risk of sound amplification. Reactive or resonant noise barriers attenuate sound through resonance mechanisms using cavities or structures tuned to specific frequency ranges. They can be particularly effective in mitigating low-frequency noise, where conventional absorbers are less efficient [12]. However, their performance is typically limited to narrow-frequency bands, and their design requires careful acoustic optimisation; however, these barriers are capable of reducing sound by 10–25 dB [6]. On the other hand, diffusive noise barriers use irregular or structured surfaces to scatter sound waves in multiple directions, reducing strong reflections near the barrier. Although this approach can improve the local acoustic environment, scattering alone does not significantly reduce total sound energy and is often combined with absorptive elements [13,14]. Diffusive barriers typically reach up to 5–22 dB in insertion loss [13]. Lastly, vegetative barriers combine vegetation with structural barrier elements to improve visual integration and environmental sustainability. They may also contribute to air quality and biodiversity benefits [15]. However, vegetation alone provides limited acoustic attenuation (the insertion loss of vegetation barriers reaches up to 3–12 dB), and effective noise reduction still depends primarily on the structural barrier while requiring additional maintenance [15,16].
Conventional noise barriers represent the established engineering approach to traffic noise mitigation, using materials and design principles that have been extensively tested over the years. Unlike emerging technologies that incorporate recycled materials, conventional barriers rely on traditional construction materials, including concrete panels, timber construction, and metal frames that have demonstrated reliable performance [10]. Concrete represents the most widely used conventional barrier material globally. Traditional concrete barrier panels are constructed from Portland cement-based mixtures with mineral aggregates, producing rigid panels with a high mass per unit area. These barriers showed that sound absorption in the range of 500–2000 Hz was between 0.58 and 0.97. The acoustic behaviour of concrete barriers depends critically on the density and internal porosity characteristics: dense concrete mixtures function primarily as rigid reflectors with limited absorption, while specially formulated concrete with controlled perforation (8 and 24%) can achieve enhanced sound absorption across specific frequency ranges [7].
Timber is a conventional barrier material valued for aesthetic integration with landscapes and natural visual appearance. Wooden noise barriers typically incorporate vertically arranged wood slats or boards with structural wood framing, creating systems that combine visual appeal with a single-number index DLα reaching up to 8 dB [17]. The acoustic properties of timber depend on wood species, moisture content, thickness, and spacing between the individual components (overlap). Softwood, commonly used in barrier construction, offers moderate sound absorption in the mid- and high-frequency ranges due to the structure of the cellular wood and the inherent damping properties [10]. Timber barriers typically achieve insertion loss values of 5–12 dB in the traffic noise spectrum, with particular effectiveness in frequency ranges above 1000 Hz [18].
However, metal barriers offer modular alternatives to concrete and wood construction, providing structural efficiency and design flexibility. Metal barriers typically consist of perforated or flat panels supported by steel frames, creating lightweight systems suitable for temporary or permanent installations. The acoustic properties of bare metal panels are low (SAC up to 0.2), with minimal sound absorption and mainly reflective characteristics. Effective acoustic performance with metal barriers requires the integration of absorptive materials or a specialised panel design that incorporates sound-absorbing components. Barriers with an integrated sound-absorbing material can reach SAC levels of up to 0.85 in the range of 500–1000 Hz [19]. Many commercial metal barrier systems include composite construction that combines rigid outer metal panels with internal porous materials or foam cores that improve acoustic performance [10].
Previous studies have extensively investigated the acoustic performance of conventional noise barriers. However, most of the research focuses primarily on traditional construction materials, such as concrete, metal, and wood, while the acoustic potential of recycled or waste-derived materials remains insufficiently explored [17]. This results in a lack of comparative analysis of newly available alternative materials. Therefore, a notable research gap remains in the literature on the potential use of recycled materials for the development of noise barriers. To address this gap, the present study investigates the influence of the thickness of the front panel, the shape of the perforation, the size of the perforation, and the angle of inclination, as well as the use of alternative porous absorbing materials and an air gap for resonance frequency adjustment. The TOPSIS multi-criteria decision-making method was applied to identify the most suitable combination of perforated front panel design, porous absorbing material, and air gap configuration for application in noise barrier development.
Incorporating recycled materials supports the principles of a circular economy. The development of new structures that are based on recycled or waste-derived materials enhances resource efficiency by reducing the demand for new raw materials. Furthermore, it reduces the environmental impact associated with raw material extraction, processing, and disposal. A similar approach guided by the principles of a circular economy allows materials to be used for as long as possible, closing the loop between production and waste streams [20,21]. The integration of recycled or waste-derived materials into noise barriers aligns with multiple United Nations Sustainable Development Goals (SDGs), particularly SDG 3 (Good Health and Well-Being) by reducing environmental noise exposure and improving public health, SDG 9 (Industry, Innovation and Infrastructure) by promoting innovative and sustainable barrier designs, SDG 11 (Sustainable Cities and Communities) by improving urban life quality through noise mitigation, SDG 12 (Responsible Consumption and Production) through efficient use of resources and valorisation of waste materials, and SDG 13 (Climate Action) by enabling the use of recycled or low-impact materials that reduce resource consumption and greenhouse gas emissions. A study by Tarrazó-Serrano et al. [22] suggests that noise barriers made from medium-density recycled fibreboard contribute to several SDG targets (3, 9, 11, 12, 15). Furthermore, research using the BERTopic model indicated that nearly 4000 publications have focused on SDG, with most studies aiming to improve the environmental quality related to SDGs 7, 11, and 13 [23]. However, more than 90% of newly developed noise barrier structures have been linked primarily to only one SDG [24].
The aim of this study is to incorporate various waste materials with unknown or insufficiently studied properties into a scalable solution for noise control applications. In this study, we propose a noise barrier made of recycled materials for road and railway applications. The optimisation process involves the characterisation of the acoustic behaviour of individual components, ensuring that the sound absorption property is optimal within the nature of the component materials in the acoustic system.
2. Materials and Methods
In this section, the materials and methods used in this study are presented. For this study, three acoustic characterisation methods and one multi-criteria analysis method were used.
2.1. Method of Sample Preparation
Perforated panel samples (PeP) for the determination of the sound absorption coefficient were manufactured using Bambu Lab P1S 3D printers, which is a fused deposition modelling (FDM) printer built on a CoreXY motion system.
PeP are presented in Figure 1. PeP were printed using acrylonitrile styrene acrylate (ASA) plastic, which is characterised by high UV resistance, good impact strength and rigidity, and heat and chemical resistance, which are necessary for a noise barrier that is exposed to environmental conditions. ASA thermoplastic is considered a recyclable material by other researchers [25,26]. All perforated front panels had 100% printing infill to ensure the stability and robustness of the panel. A total of 282 PeP panels were printed and tested for acoustic parameters. The percentage of PeP hole porosity in the panels was set to 8.73% to ensure the robustness of the panel. The other parameters of PeP were controlled and changed for optimal acoustic performance. The controlled parameters were as follows:
Figure 1.
Perforated panels used for acoustic characterisation: (a) printed PeP panels; (b) design of the PeP panel.
- -
- Perforation shape: round, square, teardrop curve, and diamond shape;
- -
- Thickness of the perforated panel: 10, 20, and 30 mm;
- -
- Diameter of the perforation: 3, 5, and 10 mm;
- -
- Angle of perforation: 15°, 30°, 45°, and 60°.
The PeP were printed in two different diameters—30 and 100 mm—to obtain wide-range sound absorption in impedance tubes (50–6600 Hz). The 30 mm samples with teardrop curve perforations oriented at 45° and 60° were excluded from the analysis because the perforation deviated laterally during processing, preventing proper alignment within the sample matrix. After sound absorption analysis, the TOPSIS method was applied to choose the best alternatives for the development of the noise barrier structure (three of the best alternatives were chosen from each shape type).
The RGHS panels used in the study as a sound-absorbing material in the barrier structure were produced during previous research [27]. In the study, a total of 18 sample compositions were produced that varied in rubber grain size: 0.5–2.0, 2.0–4.0, and 4.0–6.0 mm, and the hemp content ranged from 10 to 50%. The RGHS thickness varied from 10 to 50 mm. Based on the results of the study conducted by [27], the TOPSIS method was applied to find the best-performing RGHS panels. In total, 9 samples were chosen and are presented in the table below (Table 1).
Table 1.
RGHS panels selected by the TOPSIS method as the best alternatives [27].
In the next phase of the study, PeP and RGHS were combined to create a structure to be tested in the impedance tube (Figure 2) (diameter 30 and 100 mm). In total, 432 combinations were tested, which included an air gap between the sound-absorbing material (RGHS) and the rigid backing (which corresponds to the back wall of the noise barrier structure). The air gaps tested in size ranged from 0 to 150 mm, increasing in steps of 50 mm. This increase in air gap was used to show a noticeable shift in the absorbing-frequency range.
Figure 2.
Visualisation of the tested structure: (a) top view; (b) front view.
After the sound absorption analysis was conducted, the TOPSIS method was applied to determine the most effective (closest to ideal solution) air gap size, as well as the noise barrier structure (perforation shape, diameter, angle of inclination, thickness of the PeP panels). The air gap behind a sound-absorbing material enhances low-frequency absorption by increasing the effective acoustic thickness and promoting greater particle velocity near the surface. This configuration improves impedance matching and energy dissipation, particularly when the depth of the air cavity approaches 1/4 of the wavelength of the incident sound.
2.2. Transfer Function Method for Impedance Tubes
The method of determining the normal incidence sound absorption coefficient in impedance tubes is based on the standard method described in the ISO 10534-2 standard [28]. The method implies the three-microphone technique. The impedance tubes used in this study were produced by Gesellschaft für Akustikforschung Dresden GmbH, the AcoustiTube product. The impedance tubes used for the investigation of the sound absorption coefficient were 30 and 100 mm in inner diameter. This combination of tubes provides a wider range of determination of the sound absorption coefficient; i.e., the total measured frequency range was 50–6600 Hz.
The sound absorption results in this paper are presented in 1/3 octave frequency bands. This representation of the results allows engineers to analyse, compare, and design acoustic solutions with better precision and relevance to real-world applications. For each PeP, 100 averages were made for each measurement. In total, 384 samples were tested to obtain the data on the sound absorption coefficient.
2.3. TOPSIS Method for Determination of Ideal Solution
To compare and choose the optimal noise barrier design, a multicriteria decision analysis (MCDA) was conducted using the TOPSIS method. The TOPSIS method was chosen because it is a widely recognised and robust multi-criteria decision-making tool that allows for the systematic ranking of multiple design alternatives. In this study, the TOPSIS enabled an objective comparison of perforated panel designs, porous sound-absorbing materials, and air gap configurations based on their acoustic performance, facilitating the identification of the most promising combination for recycled-material noise barriers. The decision matrix was developed for each PeP (perforated panel), RGHS (rubber granule panel), and noise barrier structure, based on their sound absorption performance. The TOPSIS analysis criteria for the design of the noise barrier structure are presented in Table 2.
Table 2.
Decision-making matrix for optimisation of noise barrier structure.
TOPSIS analysis was performed in these steps. First, the evaluation criteria were established. The criterion selected for this study was the sound absorption coefficient. The whole spectrum was divided into narrow ranges, which were determined as low-, mid-, high-, and very-high-frequency ranges. In the next step, the importance of the criteria was determined, and, in this study, the criteria were optimised as beneficial. Including sound absorption as a beneficial criterion in the analysis ensures that noise barriers are ranked by their ability to minimise reflections and overall environmental noise impact, resulting in a more accurate selection. Lastly, weights were given to each criterion.
Based on the literature, the dominant frequency range of noise emitted by road vehicles and railways varies between 50 and 5000 Hz, depending on vehicle type, speed, and track or pavement characteristics. Therefore, the criteria in the TOPSIS analysis were defined according to four frequency ranges relevant to transportation noise and their contribution to environmental noise exposure. The mid-frequency range was assigned the highest weight of 0.4; therefore, most acoustic energy from the tyre–road interaction and wheel–rail rolling noise is concentrated in this band, making it the most important for environmental noise mitigation and overall A-weighted sound levels [29,30]. The high-frequency range received a weight of 0.3, as rolling-noise harmonics and aerodynamic noise components become more significant at higher vehicle and train speeds [29,31]. The low-frequency range was assigned a weight of 0.2, since it is mainly associated with engine and propulsion noise from heavy vehicles and locomotives, which generally contributes less to the total acoustic energy of traffic noise [32]. Finally, the very-high-frequency range received the lowest weight of 0.1; therefore, these frequencies contain relatively little acoustic energy and attenuate more rapidly with distance due to atmospheric absorption [33,34]. The calculations of the performance score Pi were performed according to the study by Zlaugotne et al. [35]. The alternatives were ranked from highest to lowest, which indicates the best and worst alternatives in the decision matrix.
2.4. Determination of Airborne Sound Absorption and Sound Insulation Characteristics Under Diffuse Sound Field Conditions
The test method for determining airborne sound absorption under diffuse sound field conditions was based on the ISO 354 standard [36], and the sound insulation was based on the methods of the ISO 10140-2 and ISO 16283-1 standard [37,38]. For the determination of the parameters mentioned, small-scale reverberant and semi-anechoic chambers were used. The volume of the reverberant chamber was 10 m3, the anechoic chamber’s was 8 m3, and the sample size was 1 m2 (Figure 3). The measurements of random incidence sound absorption and insulation parameters were carried out using a Bruel&Kjaer Type 2255 sound level metre, with an omnidirectional sound speaker Bruel&Kjaer Type 4292-L with a Bruel&Kjaer Type 2755 sound amplifier, produced by the company Bruel&Kjaer, Nærum, Denmark. The sound absorption and insulation coefficients are determined for each 1/3 octave band in the range of 100 to 5000 Hz.
Figure 3.
Determination of sound absorption and sound insulation in small-scale reverberant and anechoic chambers: (a) sample view; (b) measurements of sound insulation.
To finalise the sound absorption results, an average value was calculated using Equation (1):
where α315Hz … α5000Hz—sound absorption at the defined frequencies.
The expanded uncertainty is calculated as the standard deviation multiplied by 2. (the confidence interval is 95%, Student’s criterion).
2.5. Determination of αavg. for Specified Frequency Ranges
In the previous multi-criteria TOPSIS analysis subchapter, sound absorption ranges were established. Therefore, the calculation equations are presented below for each established frequency range.
The low-frequency average sound absorption is determined by Equation (2):
where α50Hz … α200Hz—sound absorption at the defined frequencies.
The mid-frequency average sound absorption is determined according to Equation (3):
where α250Hz … α1250Hz—sound absorption at the defined frequencies.
Using Equation (4), the high-frequency average sound absorption is determined:
where α1600Hz … α2000Hz—sound absorption at the defined frequencies.
And finally, the very-high-frequency average sound absorption coefficient is determined by Equation (5):
where α2500Hz … α5000Hz—sound absorption at the defined frequencies.
Based on these average sound absorption frequency ranges, the heat maps were prepared and analysed, as well as TOPSIS analysis was conducted.
3. Results
In this section, the main results and findings will be analysed, namely the acoustic parameters of the proposed new type of noise barrier design.
3.1. Characterisation of Sound Absorption Coefficient of Perforated Panels Using Transfer Function Method and Selection of the Best Alternative Using TOPSIS Method
Figure 4 presents heat maps of the average sound absorption of perforated plastic panels with round perforations. Measurements were performed according to the ISO 10534-2 impedance tube method in the 50–5000 Hz frequency range under normal incidence conditions. Following the procedure described previously, the average sound absorption was calculated for four frequency ranges: 50–200 Hz, 250–1250 Hz, 1600–2000 Hz, and 2500–5000 Hz. The colour scale ranges from red to green, indicating the lowest to highest absorption values. The graphs were generated using Origin 2019b Academic (v. 2019b (9.65)) [39].
Figure 4.
Heatmaps of αavg. results of round-shaped perforated plastic panels: (a) 0 cm air gap; (b) 5 cm air gap; (c) 10 cm air gap; (d) 15 cm air gap; (e) 20 cm air gap.
In the 50–200 Hz range, absorption remained generally low (0.01–0.09) regardless of air gap, although several peaks were observed between 0.32 and 0.51. Increasing the frequency to 250–1250 Hz resulted in higher absorption, with most configurations ranging between 0.15 and 0.35. Peak values (0.15–0.51) were obtained mainly for PeP panels with thicknesses of D10 mm, perforations of S5 mm, and perforation angles of 45–60°. In the 1600–2000 Hz range, values were typically 0.20–0.30, with peaks of 0.31–0.60. At 2500–5000 Hz, absorption further increased to approximately 0.30–0.40, while peak values of 0.50–0.60 were obtained for the configuration with D30 mm thickness, S10 mm perforations, and a 30° angle for all air-gap cases. Increasing the air gap from 0 to 20 cm shifted absorption toward lower frequencies due to resonance effects.
Figure 4a shows the results without an air gap. In all configurations, absorption in the 50–200 Hz range remained negligible (αavg. 0.01–0.05), while slightly higher values occurred in the 250–1250 Hz range (0.05–0.15), indicating limited particle velocity and cavity compliance near the rigid backing. Absorption increased at 1600–2000 Hz and reached the highest values at 2500–5000 Hz (αavg. 0.30–0.59), where viscous and thermal losses within the perforation channels dominate. Larger perforation diameters (S10 mm) produced consistently higher absorption than smaller holes (S5 mm and S3 mm), particularly at high frequencies. Thicker panels (D30 mm) also showed improved performance due to the increased effective channel length and friction losses. Intermediate perforation angles (30–45°) provided the most favourable results, as inclined channels increase the airflow path and boundary layer interaction, whereas very small (15°) or steep (60°) angles reduced dissipation efficiency. Without an air gap, PeP panels primarily acted as high-frequency absorbers.
Figure 4b presents results for a 5 cm air gap. In the 50–200 Hz range, αavg. values remained low (0.02–0.09), although peaks of 0.21–0.32 were observed for thicker panels with highly inclined perforations and varying hole diameters (S3–S10 mm). The improvement became more pronounced in the 250–1250 Hz range, where the values reached 0.11–0.51. This behaviour reflects the quarter-wavelength principle, where maximum absorption occurs when the cavity depth corresponds to the sound wavelength. In the 1600–2000 Hz range, αavg. varied between 0.06 and 0.31, with dominant values of 0.19–0.28. At higher frequencies, values increased to 0.10–0.51, with the highest results (0.39–0.51) obtained for thicker panels (D20–D30 mm) and perforation angles of 30–60°. The presence of the air gap shifted the absorption toward lower frequencies.
Figure 4c shows the results for a 10 cm air gap. In the 50–200 Hz range, αavg. values remained relatively low (0.04–0.11), although peaks of 0.30–0.44 were found for thicker panels (D20–D30 mm) with 60° perforation angles and hole sizes between 3 and 10 mm. In the 250–1250 Hz range, thinner panels provided higher absorption (0.32–0.43) with smaller holes (3–5 mm) and inclination angles of 15–45°. In the 1600–2000 Hz range, αavg. decreased to 0.07–0.18. At the highest frequencies (2500–5000 Hz), values ranged between 0.25 and 0.35, mainly for thicker panels with larger holes and perforation angles of 30–45°. These results indicate that in the 250–1250 Hz range, thinner panels with smaller perforations can achieve higher absorption, allowing for potential material savings.
Figure 4d presents the results for a 15 cm air gap. The average sound absorption increased noticeably, particularly in the low- and mid-frequency ranges. The air gap acts as an additional acoustic capacitance, enhancing the resonant mechanism and improving the absorption of longer wavelengths. Compared to the configuration without an air gap, the greatest improvement occurred in the 250–1250 Hz range, which is most relevant for environmental noise control. Increased absorption was also observed in the 50–200 Hz range, with peak values between 0.43 and 0.48 for thicker panels and higher perforation angles. At higher frequencies (1600–5000 Hz), the changes were smaller because surface absorption dominates. Although the angle of the perforation and the diameter of the hole still influenced the absorption distribution, the air gap became one of the main factors in improving performance.
Figure 4e shows the results for a 20 cm air gap. In the 50–200 Hz range, αavg. increased significantly compared to smaller air gaps, reaching 0.14–0.34 with peak values of 0.40–0.51 for thicker panels and higher angles. In the 250–1250 Hz range, αavg. averaged about 0.18, with better performance observed for thinner panels (D10 mm), where peak values reached 0.30–0.34. In the 1600–2000 Hz range, the results varied depending on panel thickness: thicker panels produced average values around 0.12, while the thinnest panels reached approximately 0.30. In the highest frequency range, αavg. remained close to 0.30 on average.
Figure 5 presents heat maps of αavg. for perforated plastic panels with square-shaped perforations. In the 50–200 Hz frequency range, αavg. increased with increasing air gap from 0.02 to peak values of 0.50, mainly for thicker panels (D20 and D30 mm), while the angle of inclination tended to decrease as the air gap increased. In the 250–1250 Hz range, the sound absorption ranged between 0.05 and 0.41, with the highest values generally observed for panels with the smallest perforation size (S3 mm). In the 1600–2000 Hz range, peak αavg. values increased to 0.53 and were obtained mainly for panels with small to medium perforations (S3 and S5 mm). In the 2500–5000 Hz range, αavg. values varied between 0.10 and 0.64, with peak values observed for panels of D30 mm with intermediate perforation angles (30–45°) and holes of S3 mm. Similarly to round perforations, increasing the air gap shifted sound absorption toward lower frequencies due to resonance effects. However, square perforations generally produced higher αavg. values, with peak absorption ranging between 0.31 and 0.64.
Figure 5.
Heatmaps of αavg. results of square shape perforated plastic panels: (a) 0 cm air gap; (b) 5 cm air gap; (c) 10 cm air gap; (d) 15 cm air gap; (e) 20 cm air gap.
Figure 5a presents αavg. results for PeP panels without an air gap. In the low-frequency range (50–200 Hz), absorption remained low across all configurations (0.02–0.03), except for one configuration (D10 mm_60°_S5 mm) with αavg. of 0.15. This indicates that panels alone do not provide sufficient interaction with low-frequency sound waves as a result of the absence of resonant mechanisms, leading to strong sound reflection. In the 250–1250 Hz range, αavg. increased slightly, ranging from 0.06 to 0.14. A more significant increase was observed in the 1600–2000 Hz range as the wavelength decreased. The lowest values occurred for the thinnest panels (D10 mm) with highly inclined or shallow perforations (15° and 60°). The best performance was observed for the thickest panels (D30 mm) with intermediate to high perforation angles and smaller holes (S3 and S5 mm), where αavg. ranged between 0.38 and 0.53. The highest absorption occurred in the 2500–5000 Hz range, reaching a peak of 0.64 for panels with the highest thickness, low to intermediate perforation angles (15–30°) and medium hole size (S5 mm). Smaller perforations improved viscous and thermal dissipation within the pores, whereas larger perforations broadened the effective frequency range but reduced peak absorption.
Figure 5b shows the αavg. results for PeP panels with a 5 cm air gap. In the 50–200 Hz range, αavg. values remained low (0.03–0.05), although the thickest panels (D30 mm) with the highest perforation angle (60°) achieved higher values of 0.19–0.23. This can be explained by an increase in pore tortuosity at higher inclination angles, which improves low-frequency dissipation. In the 250–1250 Hz range, absorption increased to 0.14–0.41, with the highest values observed for the smallest perforations (S3 mm), regardless of the angle of perforation. In the 1600–2000 Hz range, αavg. averaged about 0.25. At higher frequencies (2500–5000 Hz), the best performance was again observed for thicker panels (D20 and D30 mm) with the smallest perforations (S3 mm).
Figure 5c presents the results for a 10 cm air gap. In the 50–200 Hz range, αavg. values remained relatively low (0.04–0.07), although peaks of 0.33–0.40 were observed for D30 mm panels with highly inclined perforations. In the 250–1250 Hz range, the average αavg. was approximately 0.27, with the highest values (0.27–0.37) obtained for panels with S3 mm perforations. In the 1600–2000 Hz range, the highest values were again observed for the smallest perforations. Increasing the frequency to 2500–5000 Hz produced a similar trend, with an overall average performance of approximately 0.30 in all configurations.
Figure 5d shows the results for a 15 cm air gap. In the 50–200 Hz range, most configurations produced αavg. values of 0.04–0.10, although peak values of 0.36–0.47 were observed for panels of D30 mm with perforation angles of 45–60°. In the 250–1250 Hz range, the values were similar to those obtained for the 10 cm air gap, averaging around 0.25–0.27. However, a decrease in αavg. was observed in the 1600–2000 Hz range, where values ranged from 0.07 to 0.46 with an average of 0.25. In the 2500–5000 Hz range, peak values were obtained for panels of D30 mm with intermediate perforation angles and holes of S3 mm.
Figure 5e presents the results for a 20 cm air gap. In the 50–200 Hz range, αavg. increased in all configurations, ranging between 0.06 and 0.50. Peak values were obtained for panels with thicknesses of D20 and D30 mm and lower perforation angles (15°), while hole size had less influence. In the 250–1250 Hz range, αavg. values remained relatively stable compared to smaller air gaps, averaging approximately 0.24. In the 1600–2000 Hz range, the average value reached 0.28, with peaks between 0.37 and 0.46 for configurations similar to those in the low-frequency range. At 2500–5000 Hz, the highest αavg. values shifted toward larger perforation angles and reached peaks of 0.55–0.56, while overall average performance remained around 0.28. Compared to round perforations, square perforations shifted absorption to lower frequencies as air gap increased, indicating stronger resonance effect and greater energy dissipation.
Figure 6 presents αavg. results for perforated plastic panels with teardrop-shaped perforations. For this type of perforation, measurements with highly inclined and large perforations in small samples (30 mm diameter) were not possible because the thickness of the panel prevented the perforations from fully penetrate the sample. In the 50–200 Hz frequency range, αavg. values were generally low (0.02–0.04), although peak values of 0.26–0.44 were observed for panels of D30 mm with a 15° perforation angle and a hole size of S3 mm. In the 250–1250 Hz range, the sound absorption increased and varied between 0.04 and 0.44. The highest values were obtained for panels D10 and D20 mm with mid-to-high perforation angles (45–60°) and perforations of S5 mm. In the 1600–2000 Hz range, the highest value was observed among all perforation shapes (0.76) for a D20 mm panel with a perforation angle of 45° and hole size of S5 mm without an air gap. In the 2500–5000 Hz range, peak values between 0.57 and 0.77 were obtained for D20 mm panels with a 45° angle and the smallest perforation size. In general, the teardrop curve perforations showed greater sound absorption compared to the round and square perforations. This improved performance in the 1600–5000 Hz range is attributed to streamlined geometry, which enhances visco-thermal dissipation, reduces flow separation at perforation edges, and improves acoustic impedance matching at high frequencies.
Figure 6.
Heatmaps of αavg. results of teardrop curve shape perforated plastic panels: (a) 0 cm air gap; (b) 5 cm air gap; (c) 10 cm air gap; (d) 15 cm air gap; (e) 20 cm air gap.
Figure 6a shows αavg. results for PeP panels without an air gap. In the low-frequency range (50–200 Hz), αavg. values remained very low for all configurations, not exceeding 0.03. Unlike other perforation shapes, no notable peak values were observed. In the 250–1250 Hz range, the absorption increased slightly, mainly varying between 0.04 and 0.09, while thicker panels (D20 and D30 mm) reached values of up to 0.21. In the 1600 to 2000 Hz range, most configurations reached average αavg. values of about 0.35, with peaks between 0.55 and 0.76. These results were obtained mainly for D20 mm panels with mid-to-high perforation angles and S3–S5 mm holes. In the 2500–5000 Hz range, the αavg. was approximately 0.45, the highest value obtained for the panel D10 mm with a perforation angle of 45° and a hole size of S5 mm.
Figure 6b presents αavg. results for PeP panels with a 5 cm air gap. In the 50–200 Hz range, the air gap did not significantly improve αavg. values. However, absorption increased in the 250–1250 Hz range, where the values ranged from 0.12 to 0.44. The highest values were obtained for panels D10 and D20 mm with highly inclined perforations and S3–S5 mm hole sizes. In the 1600–2000 Hz range, αavg. values decreased compared to the case without an air gap, with the highest value of 0.47 observed for the thickest panel with the lowest angle of inclination. In the 2500–5000 Hz range, a slight decrease in αavg. values was also observed, with the maximum reaching 0.58 for the same configuration as in the case of the air gap of 0 cm.
Figure 6c presents results for a 10 cm air gap. In the 50–200 Hz range, αavg. values increased slightly, with some values exceeding 0.10. The highest value (0.26) was obtained for the D30 mm panel with a 15° perforation angle and a hole size of S3 mm. In the 250–1250 Hz range, absorption remained relatively low, indicating that cavity depth had a limited influence in this range. In the 1600–2000 Hz range, the minimum values increased, while the peak values remained similar, occurring for the same configuration as in previous cases. In the 2500–5000 Hz range, αavg. values remained relatively stable with only minor fluctuations.
Figure 6d shows the results for a 15 cm air gap. In the 50–200 Hz range, αavg. values increased slightly, with a maximum value of 0.39 for the configuration previously observed in the case of a 10 cm air gap. In the 250–1250 Hz range, αavg. values varied between 0.12 and 0.33, showing a slight decrease compared to the previous air gap. In the 1600–2000 Hz range, αavg. values ranged between 0.07 and 0.47, with a slight reduction in the lower values. In the 2500–5000 Hz range, sound absorption remained relatively stable with minimal changes compared to the previous air gap configuration.
Figure 6e presents results for a 20 cm air gap. The general trend remained similar to previous cases. In the 50–200 Hz range, αavg. values increased slightly, with a maximum of 0.44. In the 250–1250 Hz range, absorption decreased slightly, and a similar decrease was observed in the 1600–2000 Hz range. In the 2500–5000 Hz range, αavg. values remained relatively stable with only minor variations. The results indicate that increasing the air gap shifts the absorber away from the particle-velocity maximum and alters the surface impedance relative to the incident sound field. As a result, energy dissipation decreases, and the measured sound absorption performance is reduced, particularly in the mid- and high-frequency ranges.
Figure 7 presents αavg. results for diamond-shaped perforated plastic panels. Overall, the sound absorption values were lower compared with the teardrop-curve-shaped perforations. In the 50–200 Hz range, αavg. values varied between 0.01 and 0.08, although peak values of 0.20–0.60 were observed in different air gap configurations. These peaks occurred for the thickest panels (D30 mm) with a 15° perforation angle and a hole size of S3 mm. In the 250–1250 Hz range, αavg. values ranged from 0.05 to 0.49, with the highest values obtained for D10 mm panels with a 15° perforation angle and S3 mm perforations. In the 1600–2000 Hz range, the average value increased to approximately 0.25, with peak values reaching 0.48. The highest sound absorption was observed in the 2500–5000 Hz range, mainly for configurations without an air gap and with S3 mm perforations. Smaller perforations (S3 mm) improve sound absorption by increasing acoustic resistance, which promotes more efficient conversion of sound energy into heat and improves interaction with the air cavity compared to larger perforations (S5 and S10 mm).
Figure 7.
Heatmaps of αavg. results of diamond shape perforated plastic panels: (a) 0 cm air gap; (b) 5 cm air gap; (c) 10 cm air gap; (d) 15 cm air gap; (e) 20 cm air gap.
Figure 7a presents αavg. results for panels without an air gap. In the low-frequency range (50–200 Hz), most configurations showed very low absorption, typically not exceeding 0.02. An exception was the D20 mm_60°_S10 mm sample, where αavg. reached 0.22. In the 250–1250 Hz range, absorption increased slightly, mainly varying between 0.07 and 0.08 as the wavelength decreased. A further increase occurred in the 1600–2000 Hz range, where αavg. averaged about 0.30, with peak values between 0.41 and 0.48 for panels of D20 and D30 mm with various perforation angles and hole sizes. The highest absorption occurred in the 2500–5000 Hz range, with an average value of approximately 0.45 and peaks reaching 0.65. The highest values were observed mainly for panels with S3 and S5 mm perforations.
Figure 7b shows αavg. results for panels with a 5 cm air gap. In the 50–200 Hz range, no significant improvement was observed, as most configurations did not exceed αavg. values of 0.10. In the 250–1250 Hz range, absorption increased noticeably, with most configurations exceeding 0.20 and peak values reaching 0.40–0.49 for panels with S3 and S5 mm perforations. In the 1600–2000 Hz range, absorption decreased slightly, with an average value of about 0.20. In the 2500–5000 Hz range, overall αavg. values were lower compared to the configuration without an air gap, although the same samples still exhibited the highest absorption values.
Figure 7c presents the results for a 10 cm air gap. Increasing the air gap produced only a slight improvement in the 50–200 Hz range, where most configurations remained below 0.10, although a peak value of 0.43 was observed for the thickest panel with a moderate perforation angle and a hole size of S3 mm. In the 250–1250 Hz range, absorption decreased slightly, with a maximum value of 0.42 obtained for the thinnest panel with an intermediate perforation angle and S3 mm holes. In the 1600–2000 Hz range, αavg. values increased, particularly for D10 mm panels with a 15° perforation angle and S5–S10 mm holes. In the 2500–5000 Hz range, the highest value remained around 0.54, although the general trend indicated a slight decrease in αavg..
Figure 7d presents αavg. results for a 15 cm air gap. In the 50–200 Hz range, a slight increase in absorption was observed, although the highest values remained similar to those obtained for the 10 cm air gap configuration. In the 250–1250 Hz range, the results remained within the error margin, with the highest values again occurring in the same configurations as for the 10 cm air gap. In the 1600–2000 Hz range, αavg. values decreased, with a maximum value of approximately 0.30. In the 2500–5000 Hz range, absorption remained relatively stable, with values ranging from 0.12 to 0.54. These results indicate that increasing the air gap provides only limited improvement at low frequencies, while absorption at higher frequencies may decrease.
Finally, Figure 7e presents the results for a 20 cm air gap. In the 50–200 Hz range, αavg. values increased slightly, although most configurations remained below 0.20, with a peak value of 0.60. In the 250–1250 Hz range, most of the values ranged between 0.20 and 0.30, with a maximum of 0.30. The 1600–2000 Hz range showed little change compared to previous air gap configurations. In the 2500–5000 Hz range, absorption remained relatively stable, with peak values around 0.53 obtained for D30 mm panels with S3 mm perforations. Similarly to other perforation shapes, increasing the air gap shifted αavg. toward lower frequencies; however, the effect was less pronounced compared to round or teardrop-shaped perforations.
The next step of the study involved TOPSIS multi-criteria decision analysis. The objective of this optimisation was to identify panel configurations with the most favourable acoustic performance according to the selected criteria. For each perforation shape, the three best alternatives were selected for further investigation. Optimisation focused on identifying a noise barrier structure that is suitable for traffic noise conditions from both road and rail sources. The main criterion in the TOPSIS analysis was the average sound absorption within the frequency ranges described in Section 2. High sound absorption is essential for noise barriers because it reduces sound reflections that would otherwise propagate over the barrier and decrease its overall noise reduction efficiency. Absorptive surfaces also limit reverberation, providing a more stable acoustic environment in open or semi-enclosed transport corridors. In addition, increased absorption improves barrier insertion loss by reducing secondary noise generated by multiple reflections between opposing surfaces.
The criteria and their weighting used for selecting the optimal alternatives are described in the Section 2, while the ranking of the best configurations is presented in Table 3.
Table 3.
TOPSIS results on the best alternative for PeP panels.
The results of the TOPSIS analysis showed that, for noise barrier structures with round perforations, panels with a thickness of D10 mm represented the optimal design alternatives. No single perforation inclination angle dominated; instead, angles of 15°, 30°, and 60° showed comparable performance. Consequently, perforation diameters of S3 mm and S5 mm were selected for further investigation. The highest-ranked alternative achieved a relative closeness to the ideal solution of 0.59, corresponding to the configuration D10mm_60°_S5mm, which demonstrated the best overall performance among the round-perforated panels.
For square-shaped perforations, the analysis identified panels with thicknesses of D20 and D30 mm as the most favourable alternatives. In this case, an angle of inclination of 60° was consistently associated with optimal performance, while the diameters of the perforations of S3 and S5 mm showed similar effectiveness. The highest-ranked configuration reached a relative closeness value of 0.69, indicating that the D20mm_60°_S3mm panel exhibited the best overall performance and outperformed the round perforated configurations.
For teardrop-curve-shaped perforations, the TOPSIS results indicated that panels with thicknesses of D10 mm and D30 mm were the most favourable alternatives. As with square perforations, an inclination angle of 60° was consistently associated with optimal performance, while perforation diameters of S3 mm and S5 mm showed comparable effectiveness. The highest relative closeness value was 0.59, similar to the round perforation case, suggesting comparable acoustic performance.
For diamond-shaped perforations, the analysis identified panels with thicknesses of D10 mm, D20 mm, and D30 mm as favourable alternatives. An angle of inclination of 60° again corresponded to optimal performance, while a diameter of perforation of S3 mm was preferred. The configuration D20mm_60°_S3mm achieved a relative closeness value of 0.69, matching the best-performing square perforation configuration and exceeding the performance of the round and teardrop perforations.
Based on TOPSIS results, the next stage of the study involves combining the selected PeP panels with the RGHS panels investigated in previous work, together with an air gap. The best alternative will then be used to design a noise barrier model for testing in small-scale reverberation and semi-anechoic chambers to evaluate diffuse field acoustic parameters.
3.2. Characterisation of Sound Absorption Coefficient of Noise Barrier Structure Using Transfer Function Method and Selection of the Best Alternative Using TOPSIS Method
In this stage of the study, PeP panels, a sound-absorbing material known as RGHS, and an air gap were tested to identify configurations that provide the highest sound absorption for potential noise barrier applications. The normal incidence sound absorption method was applied. Figure 8 presents the results for selected PeP panels combined with RGHS (0.5–2.0 mm, hemp shive content 10 wt%), while the air gap behind the RGHS varied from 0 to 15 cm. The 20 cm air gap configuration was excluded because the impedance tube limited the movement of the rigid backing, preventing this distance from being achieved.
Figure 8.
Heatmaps of αavg. results of selected PeP panels when RGHS 0.5–2.0 mm 10 wt% hemp shive.
In the 50–200 Hz frequency band, αavg. values ranged from 0.06 to 0.61, with the highest absorption obtained for configurations using perforated panels of thickness D10–D30 mm with round or teardrop-shaped perforations and a 15 cm air gap. In the 250–1250 Hz range, absorption increased further, with αavg. values between 0.10 and 0.64. Peak values were observed for several perforation shapes when the thickness of the panel was D10 mm, indicating effective coupling between the perforated panel, the RGHS layer, and the backing air cavity. In the 1600–2000 Hz band, αavg. values were moderate, reaching 0.07–0.52, and showed greater sensitivity to the perforation angle and the diameter of the hole, reflecting a transition from resonance-dominated absorption to viscous and thermal dissipation mechanisms. In the 2500–5000 Hz range, absorption decreased for most configurations, with αavg. values generally between 0.16 and 0.45, suggesting a reduced interaction between short-wavelength sound and the composite structure. Across all frequency ranges, increasing the air gap generally improved sound absorption, particularly at low and mid frequencies, by increasing the effective acoustic thickness of the system. The differences between the shapes of the perforations were most evident in these ranges, where round and teardrop perforations often produced higher αavg. values than square and diamond geometries.
Figure 9 shows αavg. heat maps for PeP panels combined with RGHS (0.5–2.0 mm, hemp shive 20 wt%) and an air gap. In the 50–200 Hz range, αavg. values varied from 0.05 to 0.60, with the highest absorption observed for all panel thicknesses except diamond-shaped perforations, particularly with a 15 cm air gap, indicating effective low-frequency resonance. In the 250–1250 Hz range, αavg. increased substantially, ranging from 0.12 to 0.67, with peak values exceeding those of the 10 wt% hemp variant, reflecting enhanced dissipation from higher porous content. In the 1600–2000 Hz range, αavg. values were moderate to high (0.15–0.57), with round and teardrop curve perforations maintaining superior absorption. At 2500–5000 Hz, absorption decreased overall (0.15–0.51), though some configurations retained relatively high performance. Increasing the air gap continued to improve low- and mid-frequency absorption by increasing the effective absorber depth. Compared to 10 wt% hemp shive panels, the 20 wt% variant showed higher mid-frequency αavg., indicating improved broadband absorption.
Figure 9.
Heatmaps of αavg. results of selected PeP panels when RGHS 0.5–2.0 mm 20 wt% hemp shive.
Figure 10 shows αavg. heat maps for PeP panels with RGHS containing 40 wt% hemp shive. In the 50–200 Hz range, αavg. varied from 0.05 to 0.60, with the highest value observed for the thinnest panel (D10 mm) with round perforations, reaching 0.60. Similar trends were seen for other configurations, achieving higher absorption than previously discussed. In the 250–1250 Hz range, αavg. ranged from 0.11 to 0.64, showing strong but slightly less uniform performance than the 20 wt% variant, suggesting decreased airflow resistivity at higher hemp content. In the 1600–2000 Hz band, αavg. values were moderate (0.07–0.51), with fewer configurations achieving high absorption. At 2500–5000 Hz, αavg. decreased further (0.13–0.46), indicating reduced effectiveness for short-wavelength sound. Increasing the air gap enhanced low-frequency absorption, while its effect at higher frequencies remained limited. Compared with 10 wt% and 20 wt% hemp RGHS, the 40 wt% system shifts absorption toward lower frequencies at the expense of mid- and high-frequency performance.
Figure 10.
Heatmaps of αavg. results of selected PeP panels when RGHS 0.5–2.0 mm 40 wt% hemp shive.
Figure 11 presents αavg. results for PeP panels combined with RGHS (2.0–4.0 mm granules, 10 wt% hemp shive) and an air gap. Compared with finer granule systems, the composite exhibits a shift in sound absorption. In the 50–200 Hz range, αavg. varied from 0.01 to 0.56, with the highest values for the thinnest panels and large air gaps (15 cm), indicating low-frequency absorption is dominated by cavity resonance and absorber depth. In the 250–1250 Hz range, αavg. ranged from 0.10 to 0.58, showing reduced peak performance relative to finer granule RGHS due to lower airflow resistivity. In the 1600–2000 Hz band, αavg. was moderate (0.01–0.46), with fewer configurations achieving high absorption. At 2500–5000 Hz, values remained limited (0.13–0.43), reflecting reduced interaction with short wavelength sound in the more open pore structure. The air gap primarily enhances low-frequency absorption, with minimal effect at higher frequencies. Compared to 0.5–2.0 mm granule RGHS at the same hemp content, the 2.0–4.0 mm variant shows lower mid- and high-frequency absorption, indicating increased granule size produces a more permeable absorber with reduced intrinsic damping, limiting broadband performance while preserving low-frequency effectiveness.
Figure 11.
Heatmaps of αavg. results of selected PeP panels when RGHS 2.0–4.0 mm 10 wt% hemp shive.
Figure 12 shows the αavg. results for PeP panels with RGHS containing 40 wt% hemp shive. In the 50–200 Hz range, αavg. ranged from 0.00 to 0.54, with the highest value of 0.58 for the thickest panel (D30 mm) and 15 cm air gap, indicating that low-frequency absorption is governed by cavity resonance and absorber depth. In the 250–1250 Hz range, αavg. varied from 0.10 to 0.51. In the 1600–2000 Hz band, αavg. was moderate (0.08–0.50), with round and teardrop perforations maintaining stable absorption. At 2500–5000 Hz, αavg. decreased to 0.13–0.43, showing limited high-frequency effectiveness. Compared to the 2.0–4.0 mm granule RGHS with 10 wt% hemp, the 40 wt% variant improved mid-frequency absorption but offered no significant high-frequency gain. The air gap depth primarily enhanced low-frequency performance, while higher frequencies were less affected. Overall, increasing the hemp content in coarse granule RGHS improves mid-frequency absorption but limits broadband performance.
Figure 12.
Heatmaps of αavg. results of selected PeP panels when RGHS 2.0–4.0 mm 40 wt% hemp shive.
Figure 13 shows αavg. results for PeP panels with RGHS (2.0–4.0 mm granules, 50 wt% hemp shive). In the 50–200 Hz range, αavg. ranged from 0.00 to 0.55, with higher values for thinner panels and larger air gaps; the maximum 0.55 was observed for a D20 mm panel with square perforation and 15 cm air gap. In the 250–1250 Hz band, αavg. varied from 0.01 to 0.50, showing increased variability and consistently reduced high absorption compared to 40 wt% hemp. In 1600–2000 Hz, αavg. reached 0.52, but high absorption was limited to fewer configurations, with the peak in a D10 mm round perforated panel and a 5 cm air gap. At 2500–5000 Hz, the αavg. decreased to 0.02–0.43, indicating limited high-frequency effectiveness. Air gap mainly enhances low-frequency absorption, with less impact at higher frequencies as hemp content rises. Compared with 10 wt% and 40 wt% RGHS, the 50 wt% variant shows less stable broadband absorption and higher sensitivity to configuration parameters.
Figure 13.
Heatmaps of αavg. results of selected PeP panels when RGHS 2.0–4.0 mm 50 wt% hemp shive.
Figure 14 shows αavg. for PeP panels with RGHS (4.0–6.0 mm granules, 10 wt% hemp shive). In the 50–200 Hz range, αavg. ranged from 0.06 to 0.59, highest for D20 mm and D30 mm panels with 15 cm air gap, confirming low frequency absorption is governed by cavity resonance and absorber depth. In 250–1250 Hz, αavg. varied 0.11–0.56, with peak values similar to smaller granules, showing moderate mid-frequency effectiveness despite increased RGHS permeability. In 1600–2000 Hz, αavg. reached 0.51, but high absorption was limited to a few configurations, suggesting reduced viscous losses with larger granules. At 2500–5000 Hz, αavg. decreased to 0.13–0.46, with the highest values in teardrop and diamond perforations. The air gap impact remained strongest at low frequencies. Compared with 0.5–2.0 mm and 2.0–4.0 mm granule RGHS, the 4.0–6.0 mm variant shows reduced broadband absorption, especially at mid and high frequencies.
Figure 14.
Heatmaps of αavg. results of selected PeP panels when RGHS 4.0–6.0 mm 10 wt% hemp shive.
Figure 15 shows αavg. for PeP with RGHS (4.0–6.0 mm granules, 20 wt% hemp shive). In 50–200 Hz, αavg. ranged 0.05–0.59, highest for D30 mm panels with diamond perforations and 15 cm air gap. Thinner, round panels lost their previous advantage. Overall, αavg. decreased with larger granule size. In 250–1250 Hz, absorption improved, especially for D10 mm panels, with αavg. 0.12–0.55, showing enhanced viscous and frictional losses due to increased hemp content. In 1600–2000 Hz, αavg. remained moderate, up to 0.51, with stable absorption for round and teardrop perforations. At 2500–5000 Hz, αavg. ranged 0.13–0.49. Compared to 10 wt% RGHS at the same granule size, the 20 wt% system showed improved mid-frequency absorption and more consistent broadband performance, though overall, high-frequency absorption remained slightly lower than finer granule systems. Increasing the hemp content to 20 wt% partially offsets the negative effects of coarse granules, yielding a more balanced low- and mid-frequency response.
Figure 15.
Heatmaps of αavg. results of selected PeP panels when RGHS 4.0–6.0 mm 20 wt% hemp shive.
Figure 16 presents αavg. for PeP with RGHS (4.0–6.0 mm granules, 50 wt% hemp shive). In 50–200 Hz, αavg. ranged 0.06–0.61, highest for D30 mm panels with diamond perforations and 15 cm air gap. In 250–1250 Hz, absorption improved for round and teardrop curve perforations, with αavg. 0.31–0.54. In 1600–2000 Hz, round and teardrop perforations reached 0.58–0.60, showing the highest mid-frequency absorption among 4.0–6.0 mm systems. At 2500–5000 Hz, the αavg. was moderate (0.20–0.50), more stable than lower hemp content variants. The air gap depth strongly influenced low frequencies but had less effect at higher frequencies. Compared with 10 wt% and 20 wt% hemp systems at the same granule size, the 50 wt% configuration exhibited enhanced mid-frequency absorption and more consistent broadband performance.
Figure 16.
Heatmaps of αavg. results of selected PeP panels when RGHS 4.0–6.0 mm 50 wt% hemp shive.
The final step in this research stage is to determine the best alternative for the development of the noise barrier model structure. The aim here, as previously, was to find the tested PeP + RGHS + air gap structure for implementation for model measurements in diffuse field conditions. Table 4 presents the TOPSIS results for the aforementioned structure.
Table 4.
TOPSIS results on best alternative for PeP, RGHS, and an air gap.
Based on TOPSIS analysis, the optimal RGHS for the noise barrier was 0.5–2.0 mm granules with 20 wt% hemp, with a relative closeness of 0.814, reflecting higher measured absorption for finer granules. For the air gap, 15 cm was optimal (closeness 0.832), but 10 cm showed only a negligible difference (0.001) and was chosen for practical thickness constraints. The PeP panel configuration selected was 10 mm thick, round perforations, 5 mm diameter, 30° inclination (closeness 0.608). The second-best alternative was a 30 mm panel with teardrop perforations at 60° (closeness 0.587). This final design was used for further testing in reverberation and semi-anechoic chambers to evaluate diffuse field absorption and isolation coefficients.
3.3. Determination of Sound Absorption Coefficient and Apparent Sound Insulation Coefficient in Reverberation and Semi-Anechoic Chambers Under Random Incidence Sound Waves
Based on the test conducted throughout the previous steps, the final noise barrier structure was proposed and printed using 3D printing technology and was tested in small-scale reverberation and semi-anechoic chambers. The final structure considered for testing was of this configuration (Figure 17):
Figure 17.
Scheme of the proposed structure with segments: (a) front view; (b) side view; (c) isometric projection view (dimensions in mm).
- -
- Front perforated panel as segment B: thickness—10 mm, perforation shape—round, perforation size—5 mm, and inclination angle—30°;
- -
- Sound-absorbing material—hemp shive rubber granule panel as segment A: thickness—50 mm, rubber granule size—0.5 to 2.0 mm, hemp shive content by mass—20 wt%;
- -
- Air gap behind the sound-absorbing material as segment C: thickness—100 mm;
- -
- The backing wall as segment D: thickness—20 mm.
The total thickness of the structures was 180 mm. The blocks in size were: 250 × 200 × 180 mm. For testing in both chambers, a total of 1 m2 of the noise barrier structure was used.
Figure 18 presents the random incidence sound absorption of the noise barrier structure. At low frequencies, absorption is minimal (<0.1), indicating limited effectiveness due to the weak interaction between long wavelength sound waves and the perforated panel. A marked increase occurs from 500 Hz, with gradual growth up to 1250 Hz, reflecting improved energy dissipation through viscous and thermal losses within the perforations under diffuse sound incidence. The maximum absorption reaches approximately 0.51 at 1600 Hz. At higher frequencies, absorption decreases moderately but remains relatively stable up to 5000 Hz. This behaviour highlights the combined effects of perforation geometry, backing conditions, and random incidence, which favour efficient absorption in the mid- to high frequency range.
Figure 18.
Results of sound absorption under the random-incidence sound waves of selected noise barrier structures.
In contrast, Figure 19 shows impedance tube results with substantially higher absorption coefficients and higher peaks across the spectrum, especially at low and mid- frequencies. Strong resonance phenomena produce narrow-band absorption maxima exceeding those in diffuse field measurements. The difference arises from the measurement conditions: the impedance tube evaluates normal incidence sound, enhancing resonances and reducing energy losses from angular scattering, leading to higher peaks and pronounced frequency fluctuations. Conversely, the diffuse field method simulates a realistic environment with multidirectional sound waves, averaging resonant effects and yielding smoother, generally lower absorption. Edge diffraction, non-uniform pressure, and chamber losses also contribute to these discrepancies.
Figure 19.
Results of sound absorption under the normal-incidence sound waves of selected noise barrier structures.
Figure 20 shows the apparent sound reduction index measured in a small-scale semi-anechoic chamber. At 500 Hz, the total index was 39.7 ± 1.0 dB (according to ISO 717-1) [40]. Low frequencies (50–100 Hz) showed relatively low values, indicating limited insulation. This is due to long wavelengths comparable to or exceeding panel dimensions, where sound transmission is influenced by structural vibrations, reducing the acoustic impedance mismatch and allowing more low-frequency energy to pass through.
Figure 20.
Results of apparent sound reduction index of selected noise barrier structures.
As the frequency increases, structural vibrations become less influential and mass-related effects dominate, gradually improving sound insulation. In the mid-frequency range (250–500 Hz), the sound reduction index reaches 30–35 dB, reflecting the mass-law behaviour, where the transmission loss increases with frequency and surface density. Above 630 Hz, the values exceed 40 dB, showing improved airborne sound attenuation as the panel acoustically stiffens. Up to 5000 Hz, the index increases to about 47 dB, with damping, internal losses, and reduced panel–sound coupling governing transmission. Overall, low-frequency limitations arise from long wavelengths and structural compliance, while mid- and high-frequency performance aligns with mass-law and increased energy dissipation in lightweight, perforated panels.
4. Discussion
In this study, we proposed a noise barrier, which is made fully of recycled parts. This study consisted of three main tests for the optimal sound absorption in determining the design of the noise barrier. Using the TOPSIS approach, the front-facing perforated panel, infill rubber granule panel with hemp shives, and air gap were optimised.
The perforated panels facing the front were optimised by the perforation shape, hole size, hole inclination angle, and thickness of the panel. The round, square, diamond, and teardrop curve perforation shapes were tested to obtain optimal performance for traffic and railway noise. To test the perforation geometry, the perforated panels were tested without an airgap. The different shapes of the perforation holes contribute to differences in acoustic impedances, as well as sound absorption itself [41]. The results of this study confirm the previous knowledge, where the change in the shape of the hole in the perforation resulted in slightly different sound absorption values. The highest αavg. value of round perforations was 0.59, while the highest αavg. value for square-shaped perforations was 0.64, diamond-shaped was 0.65, and teardrop-curve-shaped was 0.77. The perforated panels’ sound absorption involves the resonance of acoustic systems analogous to the classical Helmholtz resonator. The classic Helmholtz resonator is described by the diameter and length of the neck. The length of the neck could be considered as the thickness of the perforated panel [42]. Since the target frequency range was to absorb traffic noise, the optimal thickness of perforated panels was 10 mm. The other crucial Helmholtz resonator parameter is the neck diameter. In our study, we performed a test to optimise each hole geometry diameter. The other authors have investigated the impact of the size of the perforation, its shape, and angle of inclination on the properties of sound absorption. Hamdan et al. [43] and Peng et al. [44] have investigated the size of the perforation and its influence on the properties of sound absorption. They found that smaller perforations tend to provide higher sound absorption in higher frequencies, which was found in this research study as well. The results in this study showed, for example, a round-shaped perforation with a diameter of S3 mm perforation hole size αavg. 0.43–0.51, while the S10 mm perforation is 0.34–0.49 on average. Hamdan et al. [43] showed that the sound absorption of larger perforations tends to shift to lower frequencies and broaden the effective absorption bandwidth; however, the maximum value was found to be reduced by around 30%. Beyond the resonance mechanism, a substantial portion of acoustic energy dissipation in perforated panels results from viscous friction losses occurring as acoustic fluid motion develops within the perforations [45]. Furthermore, in addition to viscous dissipation, acoustic energy dissipation in perforated panels occurs through thermal mechanisms during the compression and rarefaction phases of the acoustic cycle [46]. The hole geometry change influences the change in viscous and thermal losses; therefore, it could optimise the sound absorption of the perforated panel. The authors Bocanegra et al. [47] and Berardi [48] in their study investigated non-circular perforations—elliptical and rectangular shapes. It has been shown that these shapes significantly improve broadband sound absorption and sound insulation. In particular, elliptical perforations with a higher eccentricity provide increased absorption efficiency. In the case of this study, according to TOPSIS, square and diamond shapes had the highest relative closeness coefficient to the ideal solution (Pi = 0.69), which means they had greater sound absorption compared to the round and teardrop-curve-shaped (Pi = 0.59) perforations alone (without sound absorbing material behind). Mazdeh et al. [49] in their study tested triangular, square and circular shapes, and the conclusion was that irregular shapes increase the SAC by up to 12% compared to circular perforations. The results correspond to the results we found in our study. Similarly to this study, the other research has shown that increasing the angle of the perforation hole can enhance sound absorption. For example, a study on perforated plastic or wood panels with tilted holes (15° to 45°) showed that the sound absorption coefficient and transmission loss increased with the angle of the perforation pore [50]. Furthermore, studies show that the tilt angle allows us to shift the resonant frequency of the sound absorption [51]. This suggests that tilting the perforations can improve the acoustic performance of the perforated panel by increasing tortuosity. Suyatno et al. [52] tested several angles of inclination in their study and found that an increase in angle shifts the resonant frequency to lower frequencies. Similar trends were found in our study: with an increase in the perforation angle from 15° to 60°, effective sound absorption increased in the mid-frequency range, which has the highest weight in noise barriers based on TOPSIS. At a 250–1250 Hz αavg., the diameter of the round hole panel increased from 0.06 to 0.14, square hole from 0.11 to 0.12, teardrop curve from 0.08 to 0.21, and diamond from 0.11 to 0.15.
To analyse the parameters of the infill material was not in the scope of this paper. The infill material was deeply explored in a previous study [27], where results showed that RGHS composite panels could be used for sound absorption applications in the future. The peak sound absorption coefficient ranged from 0.60 to 0.97, depending on the thickness and composition. The highest SAA value (0.49) was reached with a sample of 0.5–2.0 mm rubber grain size, rubber granule and hemp shive ratio of 1.5:1, and thickness of 50 mm. The RGHS panel could be considered as a granular material; therefore, smaller particles lead to higher sound absorption values in lower-frequency ranges [53]. This phenomenon occurs due to increased tortuosity and viscous interactions [54].
The perforated panels supported with porous material form a composite acoustic absorber that works by combining two complementary sound-absorbing mechanisms. The multilayer system consists of a perforated panel followed by a layer of porous material and often an air gap behind it [55]. When sound waves interact with the acoustic system, the perforations force air to move through them with increased velocity, creating viscous friction losses within the perforations. This energy dissipation is the primary function of the perforated panel [56]. The backing of the porous material then provides an additional absorption pathway. The porous layer helps extend the sound absorption bandwidth, particularly at lower frequencies, while the perforated panel excels at mid to high frequencies [57]. In the case of this study, the optimised dual-layer panel with an air gap reached an αavg. of up to 0.61. The previous studies of perforated panels backed with rubber granule panels showed that the average sound absorption within the frequency range of 250–1000 Hz using a 12 mm rubber granule panel reached 0.27; 22 mm rubber granule panel—0.44; 27 mm rubber granule panel—0.46 [50]. In the study by Li et al. [58], MPP was used between two layers of rubber to improve the sound absorption of RGP. These structures reach sound absorption of up to 0.9 around 5 kHz.
The air gap behind a perforated panel acts as a Helmholtz resonator—an acoustic device that resonates at specific frequencies. The air trapped inside the acoustic system vibrates at a particular frequency [19]. The depth of the air gap is crucial, as it directly controls which frequencies are absorbed most effectively. Research shows that increasing the depth difference between air layers in multi-cavity arrangements leads to greater increases in bandwidth than when cavities are closer together [57]. This means it is possible to achieve multiple resonant peaks by using different cavity depths, allowing the system to absorb sound across a wider frequency range rather than just one narrow peak. In this study, the results showed that the optimal air gap for the proposed acoustic system was 10 cm. The fully optimised system of all parameters was (R_D10mm_30°_S5mm_0.5–2.0_20wt%%), with relative closeness to the ideal solution (Pi = 0.608, αavg.(50–200Hz) = 0.43; αavg.(250–1250Hz) = 0.61; αavg.(1600–2000Hz) = 0.48; αavg.(1600–2000Hz) = 0.48; αavg.(2500–5000Hz) = 0.24). The other studies suggest that geometrical parameters of the acoustic system are crucial for the tunability of the system [59]. The larger airgaps and backings increase sound absorption coefficient values in the lower-frequency range, as shown in the Section 3.
The aim of this study was to determine the optimal structure of the noise barrier. The noise barrier consists of components that interact complexly with each other. Singh et al. [60] in their research tested the nested structure noise barrier, which showed in ~400–900 Hz a maximum insertion loss value of 16 dB. The barrier itself was made of tubes with a cut-out to function as a Helmholtz resonator. Due to structural improvements in this study, where 3D printed blocks were interconnected with each other and filled with sound-absorbing material, we were able to achieve an apparent sound reduction index of 39.7 dB. The results show that both designs can effectively reduce the noise induced by traffic. Another author, Thakre et al. [61], proposed the barrier design made of a composite mixture that included clay, fly ash, rubber granules, and cements. The design involves acoustic panels made from the aforementioned materials. This structure provides ~11–13 dB in attenuation, which is lower than Singh et al. [60] showed in their research; however, their aim was to design a barrier that could be made of recycled or reused materials. Similarly, in this study, the proposed design also targets SDGs that are linked with environmental pollution reduction and climate change.
The limitations of this study include the accuracy of the measurement in a small reverberation room. Due to its relatively small size, in the low-frequency range of macro-parameters, the analysis of the noise barrier’s sound absorption is impossible due to the formation of standing waves. The small dimensions of the noise barrier prototype led to an inability to determine the insertion loss of the noise barrier under field conditions. These results would provide additional information about the efficiency of the noise barrier. Lastly, due to the relatively small size of the prototype sample, a straight performance comparison with commercially built noise barriers was not available.
Future prospects would include determining the parameters of the noise barrier in free field conditions, as well as performing a life cycle assessment (LCA) of the proposed barrier to fully understand its impact on the environment. Comparative LCA studies consistently demonstrate substantial environmental advantages for recycled plastic-based barriers over virgin plastic equivalents. The evaluation of low-height noise barriers indicated that when compared over fixed 40-year service life, recycled composite barriers demonstrated 73% reduction in global warming potential compared to baseline Portland cement concrete scenarios [62]. When accounting for carbonation and CO2 uptake, recycled barrier systems achieved further reductions of up to 8% additional GWP impact avoidance.
5. Conclusions
In this study, we proposed a new noise barrier design made entirely of recycled materials. Several analysis steps were performed to achieve an optimal structure for sound absorption and insulation of the proposed noise barrier. Each part of the acoustic system was characterised separately and then put together. To optimise the design of the barrier, the Technique for Order Preference by Similarity to Ideal Solution approach was chosen to eliminate ineffective variants of the samples.
The final optimised acoustic system consisted of PeP, RGHS, and an air gap. The results showed that the best performance according to the set criteria was the acoustic system, which consisted of a perforated panel with 5 mm diameter and 30° inclined round-shaped holes, a rubber granule panel with 20 wt% of hemp shives and 10 cm air gap. The acoustic system in noise barrier showed relative closeness to ideal solution (Pi = 0.608), and higher sound absorption coefficients in lower and mid frequencies αavg.(50–200Hz) = 0.43; αavg.(250–1250Hz) = 0.61; αavg.(1600–2000Hz) = 0.48; αavg.(1600–2000Hz) = 0.48; αavg.(2500–5000Hz) = 0.24.
The noise barrier prototype was tested in small-scale reverberation and semi-anechoic chambers. The test results showed that in the diffuse field the random incidence of the sound absorption average was αavg. = 0.24. Compared to the results in the impedance tube, where αavg. was 0.47, we see the decline in absorption due to fundamentally different sound incidence conditions, as impedance tube testing uses normal incidence that strongly excites resonance effects and often yields higher absorption values, while diffuse field measurements average sound arriving from multiple directions, resulting in smoother and generally lower absorption coefficients. The apparent sound insulation index results were 39.7 ± 1.0 dB.
The results demonstrated in this study show that the noise barrier provides a reduction in sound levels, indicating its potential to mitigate noise exposure and thus improve overall environmental quality. Furthermore, the results of sound absorption and sound reduction suggest that the proposed prototype could be scalable in the future. In particular, it is expected that the large-scale noise barrier remains effective when adapted to different urban configurations, supporting its applicability in broader infrastructural contexts. The design supports the sustainability aspects. The barrier is designed in a way that allows it to be disassembled into different streams of material. The materials would be recycled or reused; therefore, this design supports the closed-loop circular economy concept.
Author Contributions
Conceptualisation, T.J.; methodology, R.R., A.N. and T.A.; software, R.R., T.A. and M.P.; validation, R.R. and T.A.; formal analysis, R.R. and T.A.; investigation, R.R. and T.A.; resources, T.J.; data curation, R.R. and T.A.; writing—original draft preparation, R.R. and J.B.; writing—review and editing, T.A., A.N. and T.J.; visualisation, R.R.; supervision, T.J.; project administration, T.J.; funding acquisition, T.J. All authors have read and agreed to the published version of the manuscript.
Funding
Research was conducted as part of the execution of Project “Mission-driven Implementation of Science and Innovation Programmes” (No. 02-002-P-0001), funded by the Economic Revitalization and Resilience Enhancement Plan “New Generation Lithuania”.
Data Availability Statement
Research details can be provided upon request to the corresponding author.
Acknowledgments
During the preparation of this manuscript, the author(s) used M365 Copilot, v. bizchat.20260210.47.1, for the purposes of data interpretation. The authors have reviewed and edited the output and take full responsibility for the content of this publication.
Conflicts of Interest
The authors declare no conflicts of interest.
References
- Mebarki, B.; Draoui, B.; Allaoua, B.; Draoui, A. Road Transportation Industry Facing the Energy and Climate Challenges. In Renewable Energy—Resources, Challenges and Applications; Qubeissi, M.A., El-kharouf, A., Soyhan, H.S., Eds.; IntechOpen: London, UK, 2020. [Google Scholar] [CrossRef] [Scilit]
- Hemmat, W.; Hesam, A.M.; Atifnigar, H. Exploring Noise Pollution, Causes, Effects, and Mitigation Strategies: A Review Paper. Eur. J. Theor. Appl. Sci. 2023, 1, 995–1005. [Google Scholar] [CrossRef] [Scilit]
- Basner, M.; Brink, M.; Bristow, A.; De Kluizenaar, Y.; Finegold, L.; Hong, J.; Janssen, S.A.; Klaeboe, R.; Leroux, T.; Liebl, A.; et al. ICBEN review of research on the biological effects of noise 2011–2014. Noise Health 2015, 17, 57–82. [Google Scholar] [CrossRef] [Scilit]
- Khan, D.; Burdzik, R.; Burdzik, R.; Khan, D. A review on different regulation for the measurement of transport noise and vibration. J. Meas. Eng. 2023, 11, 196–213. [Google Scholar] [CrossRef] [Scilit]
- Liu, Z.; Lu, L. Structural Design and Optimization of Highway Noise Barrier Panels. Ind. Sci. Eng. 2025, 2, 6–12. [Google Scholar] [CrossRef] [Scilit]
- Qin, X.; Zhao, P.; Yang, W.; Wangechi, W.V.; Cheng, N. Noise reduction performance of non-uniform resonant cavity periodic array noise barriers. Phys. Scr. 2026, 101, 055501. [Google Scholar] [CrossRef] [Scilit]
- Fediuk, R.; Amran, M.; Vatin, N.; Vasilev, Y.; Lesovik, V.; Ozbakkaloglu, T. Acoustic Properties of Innovative Concretes: A Review. Materials 2021, 14, 398. [Google Scholar] [CrossRef] [Scilit] [PubMed]
- Zainudin, D.I.; Zainulabidin, M.H.; Kamarudin, K.A.; Hassan, S.; Ramlan, R.; Ikhsan, M.S.; Maulana, Y. Validation of Noise Barrier Insertion Loss Simulation in Reducing Road Traffic Noise by Site Measurement Data. J. Adv. Res. Appl. Mech. 2024, 125, 174–184. [Google Scholar] [CrossRef] [Scilit]
- Nakhaeipour, M.; Forouharmajd, F.; Habibi, E.; Soltani, P.; Tehrani, A. Acoustic performance optimization of natural-fiber micro-perforated panels backed by an optimized polyurethane–fibrogranule composite. Sci. Rep. 2026, 16, 5464. [Google Scholar] [CrossRef] [Scilit] [PubMed]
- Shahidan, S.; Ramzi Hannan, N.I.R.; Md Maarof, M.Z.; Leman, A.S.; Senin, M.S. A Comprehensive Review on the Effectiveness of Existing Noise Barriers commonly used in the Railway Industry. MATEC Web Conf. 2017, 87, 01007. [Google Scholar] [CrossRef] [Scilit]
- Wu, H.; He, L.; Tao, Z.; Zhang, D.; Luo, Y. An Integrated SEA–Deep Learning Approach for the Optimal Geometry Performance of Noise Barrier. Machines 2025, 13, 670. [Google Scholar] [CrossRef] [Scilit]
- Han, I.; Lee, I.; Yoon, G. Studies on Dual Helmholtz Resonators and Asymmetric Waveguides for Ventilated Soundproofing. Sensors 2024, 24, 1432. [Google Scholar] [CrossRef] [Scilit]
- Mohapatra, K.; Jena, D.P.; Dwivedy, S.K. Design and analysis of multi-resonant hybrid sonic crystal noise barrier for broadband noise attenuation. Build. Acoust. 2026, 1351010X251414514. [Google Scholar] [CrossRef] [Scilit]
- Dimitrijević, S.M.; García-Chocano, V.M.; Cervera, F.; Roth, E.; Sánchez-Dehesa, J. Sound Insulation and Reflection Properties of Sonic Crystal Barrier Based on Micro-Perforated Cylinders. Materials 2019, 12, 2806. [Google Scholar] [CrossRef] [Scilit]
- Smyrnova, Y.; Kang, J.; Hornikx, M.; Forssén, J. Effect of vegetation on noise propagation in streets and squares. In Proceedings of the Institute of Acoustics. Environmental Noise Propagation 2012: Definitions, Measuring and Control Aspects, London, UK, 21 March 2012; IOA: London, UK, 2023; Volume 34, pp. 57–67. [Google Scholar]
- Redzuan, I.H.; Darus, N.; Haron, Z.; Abidin, N.I.; Galip, N.S.; Kassim, A.S.F.A. Tradescantia Zebrina as New Creeping Plant for Good Sound Absorption Performance. J. Phys. Conf. Ser. 2024, 2721, 012008. [Google Scholar] [CrossRef] [Scilit]
- Ahac, M.; Ahac, S.; Lakušić, S. Long-Term Sustainability Approach in Road Traffic Noise Wall Design. Sustainability 2021, 13, 536. [Google Scholar] [CrossRef] [Scilit]
- Astrauskas, T.; Baltrėnas, P.; Januševičius, T.; Grubliauskas, R. Louvred Noise Barrier for Traffic Noise Reduction. Balt. J. Road Bridge Eng. 2021, 16, 140–154. [Google Scholar] [CrossRef] [Scilit]
- Agarwalla, D.K.; Mohanty, A.R. Improving the Sound Absorption Characteristics of Micro-Perforated Panel Absorber through Multi-Cavities Arrangement. Appl. Mech. Mater. 2025, 926, 3–12. [Google Scholar] [CrossRef] [Scilit]
- Papadaki, D.; Nikolaou, D.A.; Assimakopoulos, M.N. Circular Environmental Impact of Recycled Building Materials and Residential Renewable Energy. Sustainability 2022, 14, 4039. [Google Scholar] [CrossRef] [Scilit]
- Almusaed, A.; Yitmen, I.; Myhren, J.A.; Almssad, A. Assessing the Impact of Recycled Building Materials on Environmental Sustainability and Energy Efficiency: A Comprehensive Framework for Reducing Greenhouse Gas Emissions. Buildings 2024, 14, 1566. [Google Scholar] [CrossRef] [Scilit]
- Tarrazó-Serrano, D.; Castiñeira-Ibáñez, S.; Bautista, A.S.; Rubio, C.; Uris, A. Optimization of acoustic subwavelength slit barrier to control low-frequency noise in industrial buildings. J. Build. Eng. 2025, 103, 111926. [Google Scholar] [CrossRef] [Scilit]
- Murali, D.; Suresh, M.; Martin, H.; Raman, R. Aligning net zero carbon-built environments with sustainable development goals: Topic modelling approach to integrating technologies and policies. Build. Environ. 2025, 281, 113156. [Google Scholar] [CrossRef] [Scilit]
- Costa, A.; Crupi, A.; Cesaroni, F.; Abbate, T. Exploring the role of artificial intelligence in addressing sustainable development. A semantic analysis of AI patents. Technovation 2025, 148, 103335. [Google Scholar] [CrossRef] [Scilit]
- Gong, K.; Sun, C.; Zhao, Z.; Lu, Y.; Liu, H.; Xu, H.; Shu, X.; Portela, A.; Taghinezhad, S.F.; Lawlor, D.; et al. Thermomechanical Recyclability of Acrylonitrile Styrene Acrylate in Successive Extrusion Processes. J. Appl. Polym. Sci. 2025, 142, e57891. [Google Scholar] [CrossRef] [Scilit]
- Vidakis, N.; Petousis, M.; Michailidis, N.; Sagris, D.; David, C.; Papadakis, V.; Spyridaki, M.; Argyros, A.; Valsamos, I.; Dimitriou, E.; et al. Thermomechanical recyclability of acrylonitrile styrene acrylate (ASA) for cyclic economy-driven MEX additive manufacturing. Clean. Eng. Technol. 2025, 25, 100925. [Google Scholar] [CrossRef] [Scilit]
- Astrauskas, T.; Balčiūnas, G.; Bradulienė, J.; Ružickij, R.; Naimušin, A.; Januševičius, T. Acoustic and thermal insulation properties of rubberhemp shive composite bonded with regenerated polyurethane resin. Sci. Rep. 2026, 16, 4851. [Google Scholar] [CrossRef] [Scilit]
- ISO 10534-2:2023; Acoustics—Determination of Acoustic Properties in Impedance Tubes—Part 2: Two-Microphone Technique for Normal Sound Absorption Coefficient and Normal Surface Impedance. ISO: Geneva, Switzerland, 2023.
- Zhang, Y.; Liu, H.; Xu, Z.; Hou, X. Influence of Material Properties on Tire/Road Noise for Non-destructive Pavement Condition Assessment. J. Phys. Conf. Ser. 2021, 1965, 012105. [Google Scholar]
- Zhang, Y.; Li, L.; Zhou, J.; Wang, Q.; Yang, S. Contributions separation prediction for multi-dimensional vibration transmission in the bogie system to metro interior noise. JVC/J. Vib. Control 2025, 10775463251412209. [Google Scholar] [CrossRef] [Scilit]
- Qin, D.; Li, T.; Zhou, N.; Zhang, J. Numerical study on the quadrupole sound source in aerodynamic noise of high-speed pantographs. Int. J. Rail Transp. 2025, 13, 313–331. [Google Scholar] [CrossRef] [Scilit]
- Montano, W.; Gonzalez, A.E.; Gushiken, E.I. Analysis of the impact of low-frequency traffic noise in two South American cities. J. Acoust. Soc. Am. 2023, 154, A63. [Google Scholar] [CrossRef] [Scilit]
- De Carvalho, D.; Billot, G.; Marinus, B.G.; Harri, K.; Moiny, F. Uncertainty and environmental effects in outdoor firearm noise propagation. Acta Acust. 2025, 9, 59. [Google Scholar] [CrossRef] [Scilit]
- Sun, X.; Xiao, H. Numerical Modeling and Investigation on Aerodynamic Noise Characteristics of Pantographs in High-Speed Trains. Complexity 2018, 2018, 6932596. [Google Scholar] [CrossRef] [Scilit]
- Zlaugotne, B.; Zihare, L.; Balode, L.; Kalnbalkite, A.; Khabdullin, A.; Blumberga, D. Multi-Criteria Decision Analysis Methods Comparison. Environ. Clim. Technol. 2020, 24, 454–471. [Google Scholar] [CrossRef] [Scilit]
- ISO 354:2003; Acoustics—Measurement of Sound Absorption in Reverberation Room. ISO: Geneva, Switzerland, 2003.
- ISO 10140-2:2021; Acoustics—Laboratory Measurement of Sound Insulation of Building Elements—Part 2: Measurement of Airborne Sound Insulation. ISO: Geneva, Switzerland, 2021.
- ISO 16283-1:2014; Acoustics—Field Measurement of Sound Insulation in Buildings and of Buildings Elements—Part 1: Airborne Sound Insulation. ISO: Geneva, Switzerland, 2014.
- OriginLab Corporation. Origin 2019b Academic software, version 2019b (9.65). Preprint at (2025). Available online: https://www.originlab.com/ (accessed on 14 November 2025).
- ISO 717-1:2021; Acoustics—Rating of Sound Insulation in Buildings and of Building Elements. Part 1: Airborne Sound Insulation. ISO: Geneva, Switzerland, 2021. Available online: https://view.elaba.lt/standartai/view?search_from=primove&id=1385063 (accessed on 22 January 2026).
- Ning, J.F.; Ren, S.W.; Zhao, G.P. Acoustic properties of micro-perforated panel absorber having arbitrary cross-sectional perforations. Appl. Acoust. 2016, 111, 135–142. [Google Scholar] [CrossRef] [Scilit]
- Mahesh, K.; Ranjith, S.K.; Mini, R.S. Recent Advancements in Helmholtz Resonator Based Low-Frequency Acoustic Absorbers: A Critical Review. Arch. Comput. Methods Eng. 2024, 31, 2079–2107. [Google Scholar] [CrossRef] [Scilit]
- Hamdan, N.I.; Zainulabidin, M.H.; Kasron, M.Z.; Ismail, A.E.; Kassim, A.S. Effect of perforation size on sound absorption characteristics of membrane absorber. Int. J. Integr. Eng. 2018, 10, 27–34. [Google Scholar] [CrossRef] [Scilit]
- Peng, L.; Liu, M.; Wang, D.; Song, B. Sound absorption properties of wooden perforated plates. Wood Res. 2018, 63, 559–572. [Google Scholar]
- Tang, Y.C.; Cheng, H.D. Analysis and verification of optimization of micro-perforated panels’ sound absorption using the Taguchi method. J. Acoust. Soc. Am. 2025, 157, 3099–3111. [Google Scholar] [CrossRef] [Scilit] [PubMed]
- Li, X.; Pan, S.; Wu, W.; Xu, L.; Fan, H.; Xu, T.; Yang, J.; Cai, X. High temperature sound absorption characteristics of micro-perforated plate sandwich structure based on triply periodic minimal surfaces. J. Appl. Phys. 2025, 138, 145101. [Google Scholar] [CrossRef] [Scilit]
- Bocanegra, J.A.; Borelli, D.; Pallavidino, E.; Peshku, J.; Schenone, C. Effects of Geometric Parameters on Sound Absorption in Perforated Plates with Elliptical Holes. In Proceedings of the International Congress on Sound and Vibration; INCE-USA: Wakefield, MA, USA, 2024. [Google Scholar]
- Berardi, U. The increase of the sound absorption through rectangular slot perforations. In Proceedings of Meetings on Acoustics; Acoustical Society of America: Melville, NY, USA, 2013; Volume 19. [Google Scholar]
- Mazdeh, A.; Kashani, A.R. Numerical modeling of the acoustic damping of perforated liners with bias flow. In ASME International Mechanical Engineering Congress and Exposition Proceedings Imece; American Society of Mechanical Engineers: New York, NY, USA, 2013; Volume 14. [Google Scholar]
- Astrauskas, T.; Grubliauskas, R.; Januševičius, T. Optimization of sound-absorbing and insulating structures with 3D printed recycled plastic and tyre rubber using the TOPSIS approach. JVC/J. Vib. Control 2024, 30, 1772–1782. [Google Scholar] [CrossRef] [Scilit]
- Dong, M.R.; Jia, S.F.; Liu, J.Y.; Lin, X.X.; Xue, Q.W.; Sun, W.S. Properties of 3D Printed Bionic Wood Sound Absorption Structure with Different Hole Angles. Linye Kexue Sci. Silvae Sin. 2020, 56, 113–117. [Google Scholar]
- Suyatno; Mahdani, M.M.A.; Prajitno, G. Analysis of the influence of perforation angle to improve the performance of acoustic perforated panels. In Journal of Physics Conference Series; IOP Publishing: Philadelphia, PA, USA, 2025; Volume 2945. [Google Scholar]
- Sakamoto, S.; Hoshiyama, K.; Kojima, Y.; Saito, K. Theoretical and Experimental Analyses of Effect of Grain Packing Structure and Grain Size on Sound Absorption Coefficient. Appl. Sci. 2025, 15, 11614. [Google Scholar] [CrossRef] [Scilit]
- Železnik, A.; Čurović, L.; Murovec, J.; Cerkovnik, N.; Prezelj, J. Estimating viscous losses in recycled granular microparticles: A time-domain wave decomposition impedance tube with boundary condition approximation. Appl. Acoust. 2025, 228, 110372. [Google Scholar] [CrossRef] [Scilit]
- Liu, Z.; Chen, Q.; Liu, Q.; Gu, D.; Pan, B.; Geng, T.; Yang, Z.; Fard, M.; Davy, J.L. Acoustic performance of multilayer sound absorber with polygonal cross-section perforations. Build. Acoust. 2026, 1351010X251415089. [Google Scholar] [CrossRef] [Scilit]
- Fang, K.; Guo, Y.; Fan, J.; Wu, C.; Liu, T. Application of acoustic perforated panels and porous materials in the design of acoustic shielded enclosures. J. Phys. Conf. Ser. 2026, 3170, 012017. [Google Scholar] [CrossRef] [Scilit]
- Sheikhmozafari, M.J.; Hashemi, Z.; Mohsenian, A. Numerical Optimization of Microperforated panel Absorbers: The Impact of Series-Parallel Configuration, Air Gap, and Porous Materials on the Sound Absorption Bandwidth. J. Health Saf. Work 2024, 14, 772–795. [Google Scholar] [CrossRef] [Scilit]
- Li, L.; Zhang, Z.; Huang, Q.; Li, S. A sandwich anechoic coating embedded with a micro-perforated panel in high-viscosity condition for underwater sound absorption. Compos. Struct. 2020, 235, 111761. [Google Scholar] [CrossRef] [Scilit]
- Mohammadi, M.; Ishak, M.R.; Sultan, M.T.H.; Zainudin, E.S. A Comprehensive Review of Factors Influencing the Sound Absorption Properties of Micro-Perforated Panel Structures. J. Vib. Eng. Technol. 2025, 13, 319. [Google Scholar] [CrossRef] [Scilit]
- Singh, A.; Gupta, A. Research on the design and noise reduction performance of periodic noise barriers based on nested structure. J. Clean. Prod. 2024, 476, 143708. [Google Scholar] [CrossRef] [Scilit]
- Thakre, C.; Bisarya, A.; Laxmi, V.; Kalawapudi, K.; Vijay, R. An innovative design and development of noise barrier with newly composite mix of acoustic panel. J. Environ. Manag. 2024, 361, 121276. [Google Scholar] [CrossRef] [Scilit] [PubMed]
- Abdulkareem, M.; Havukainen, J.; Horttanainen, M. Life cycle assessment of a low-height noise barrier for railway traffic noise. J. Clean. Prod. 2021, 323, 129169. [Google Scholar] [CrossRef] [Scilit]
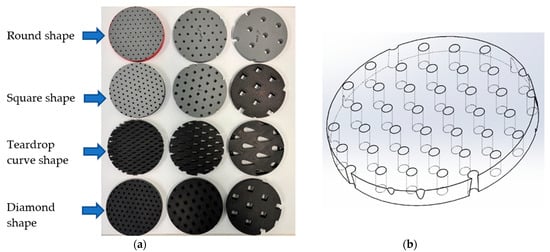
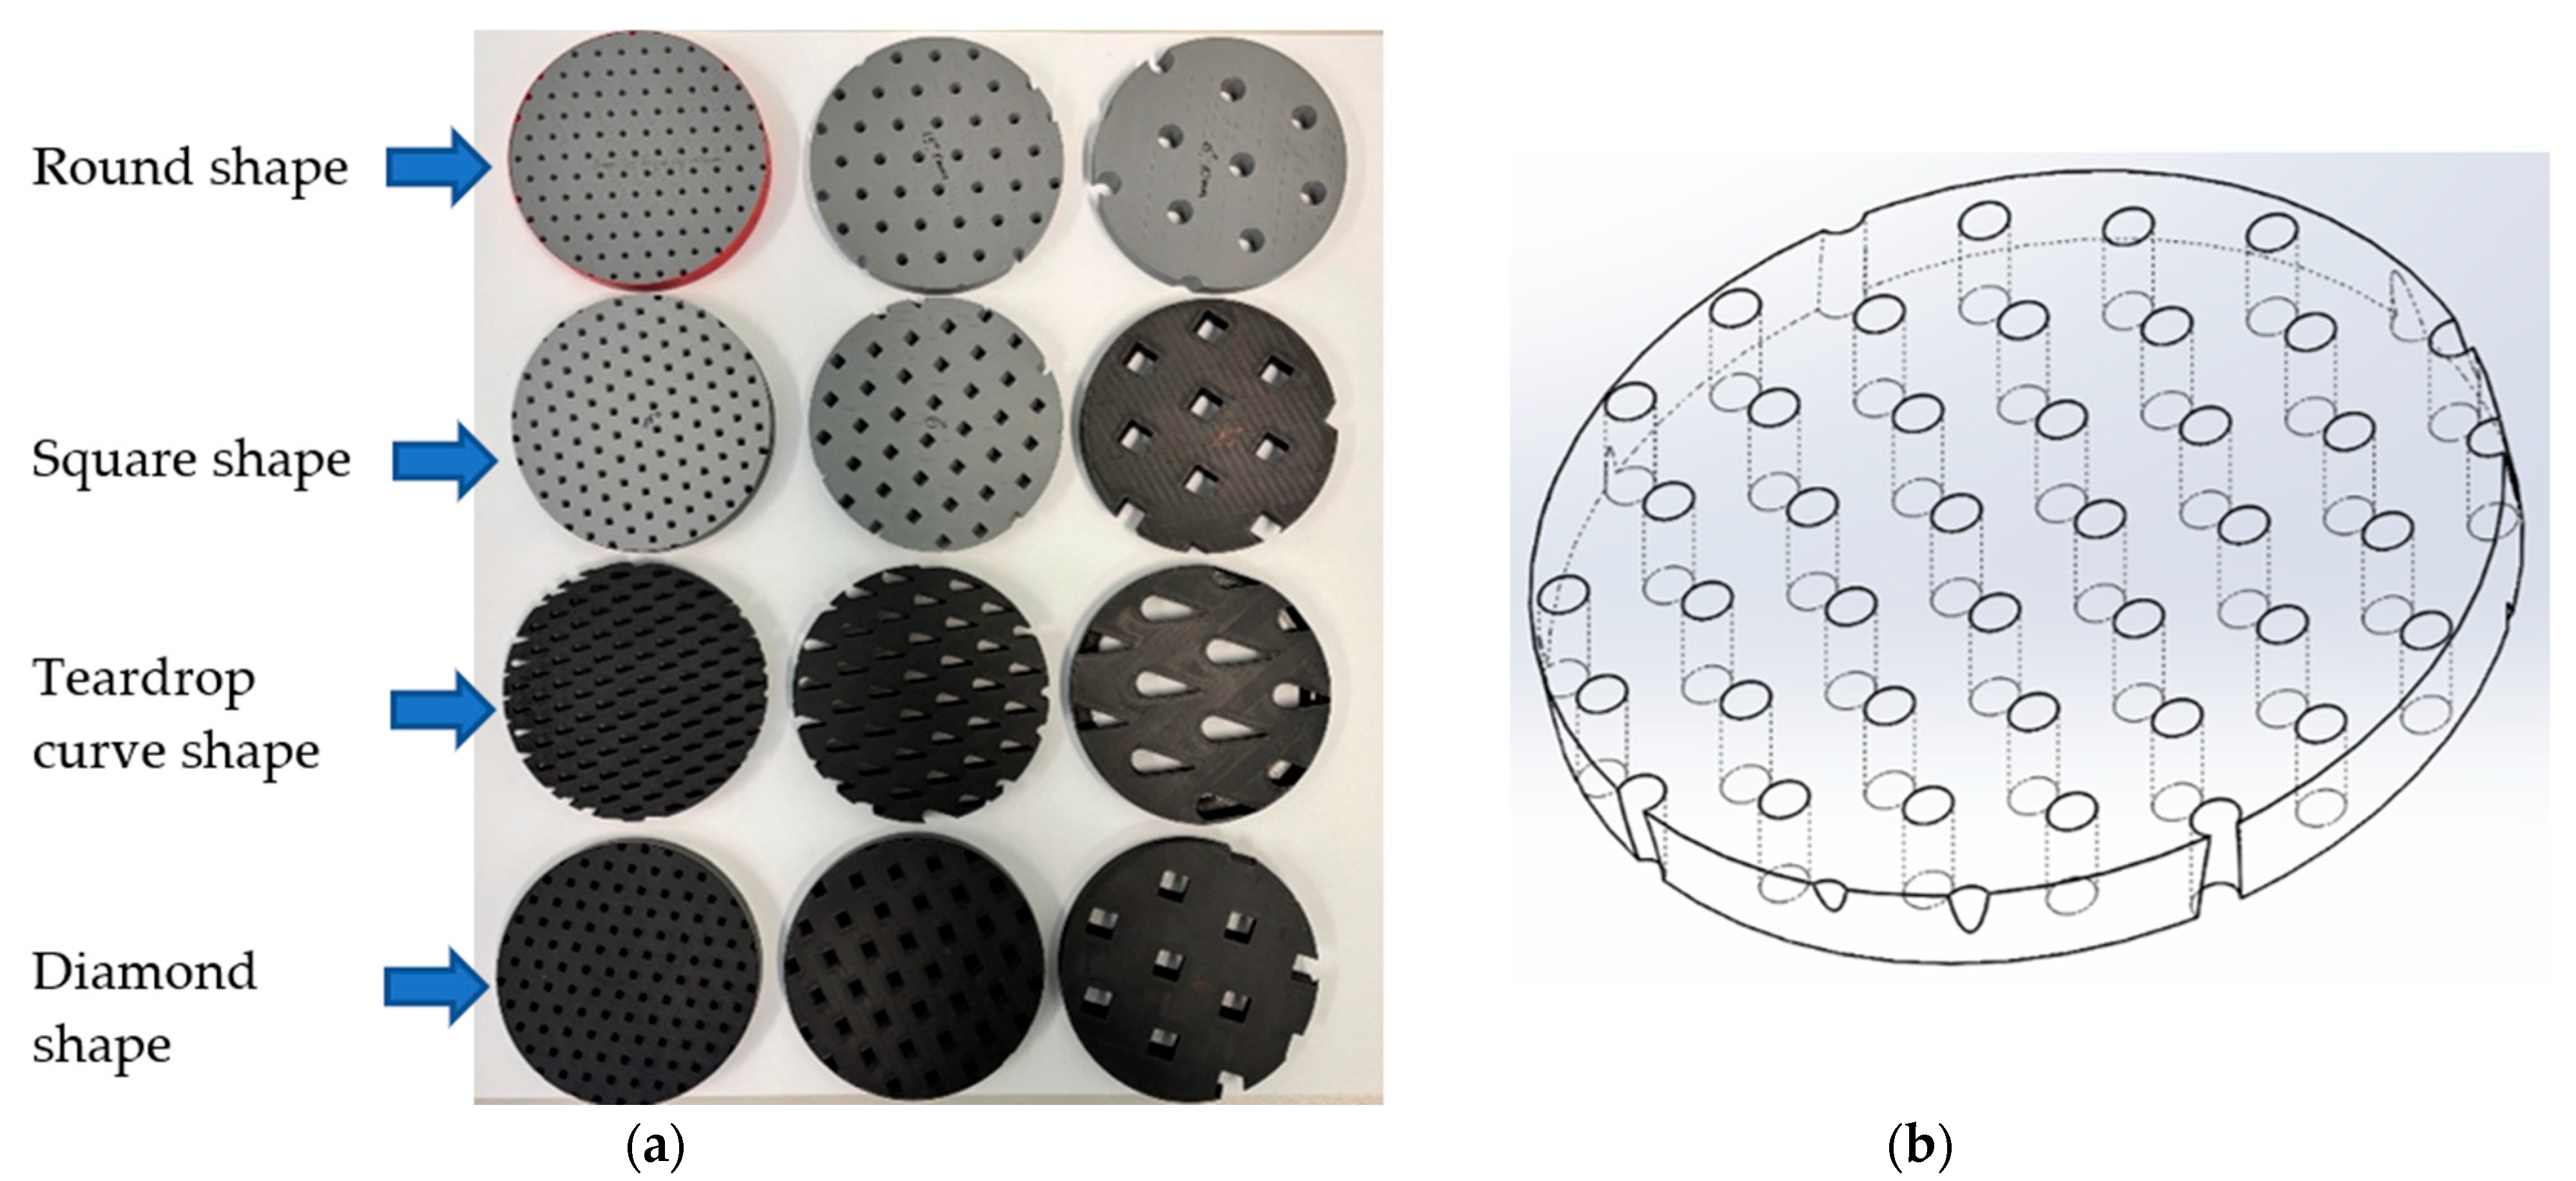
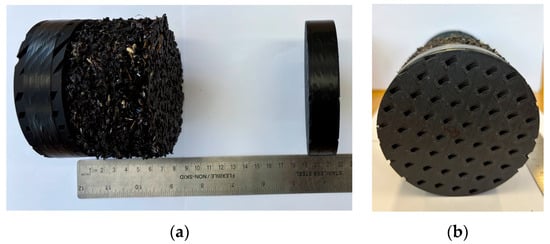
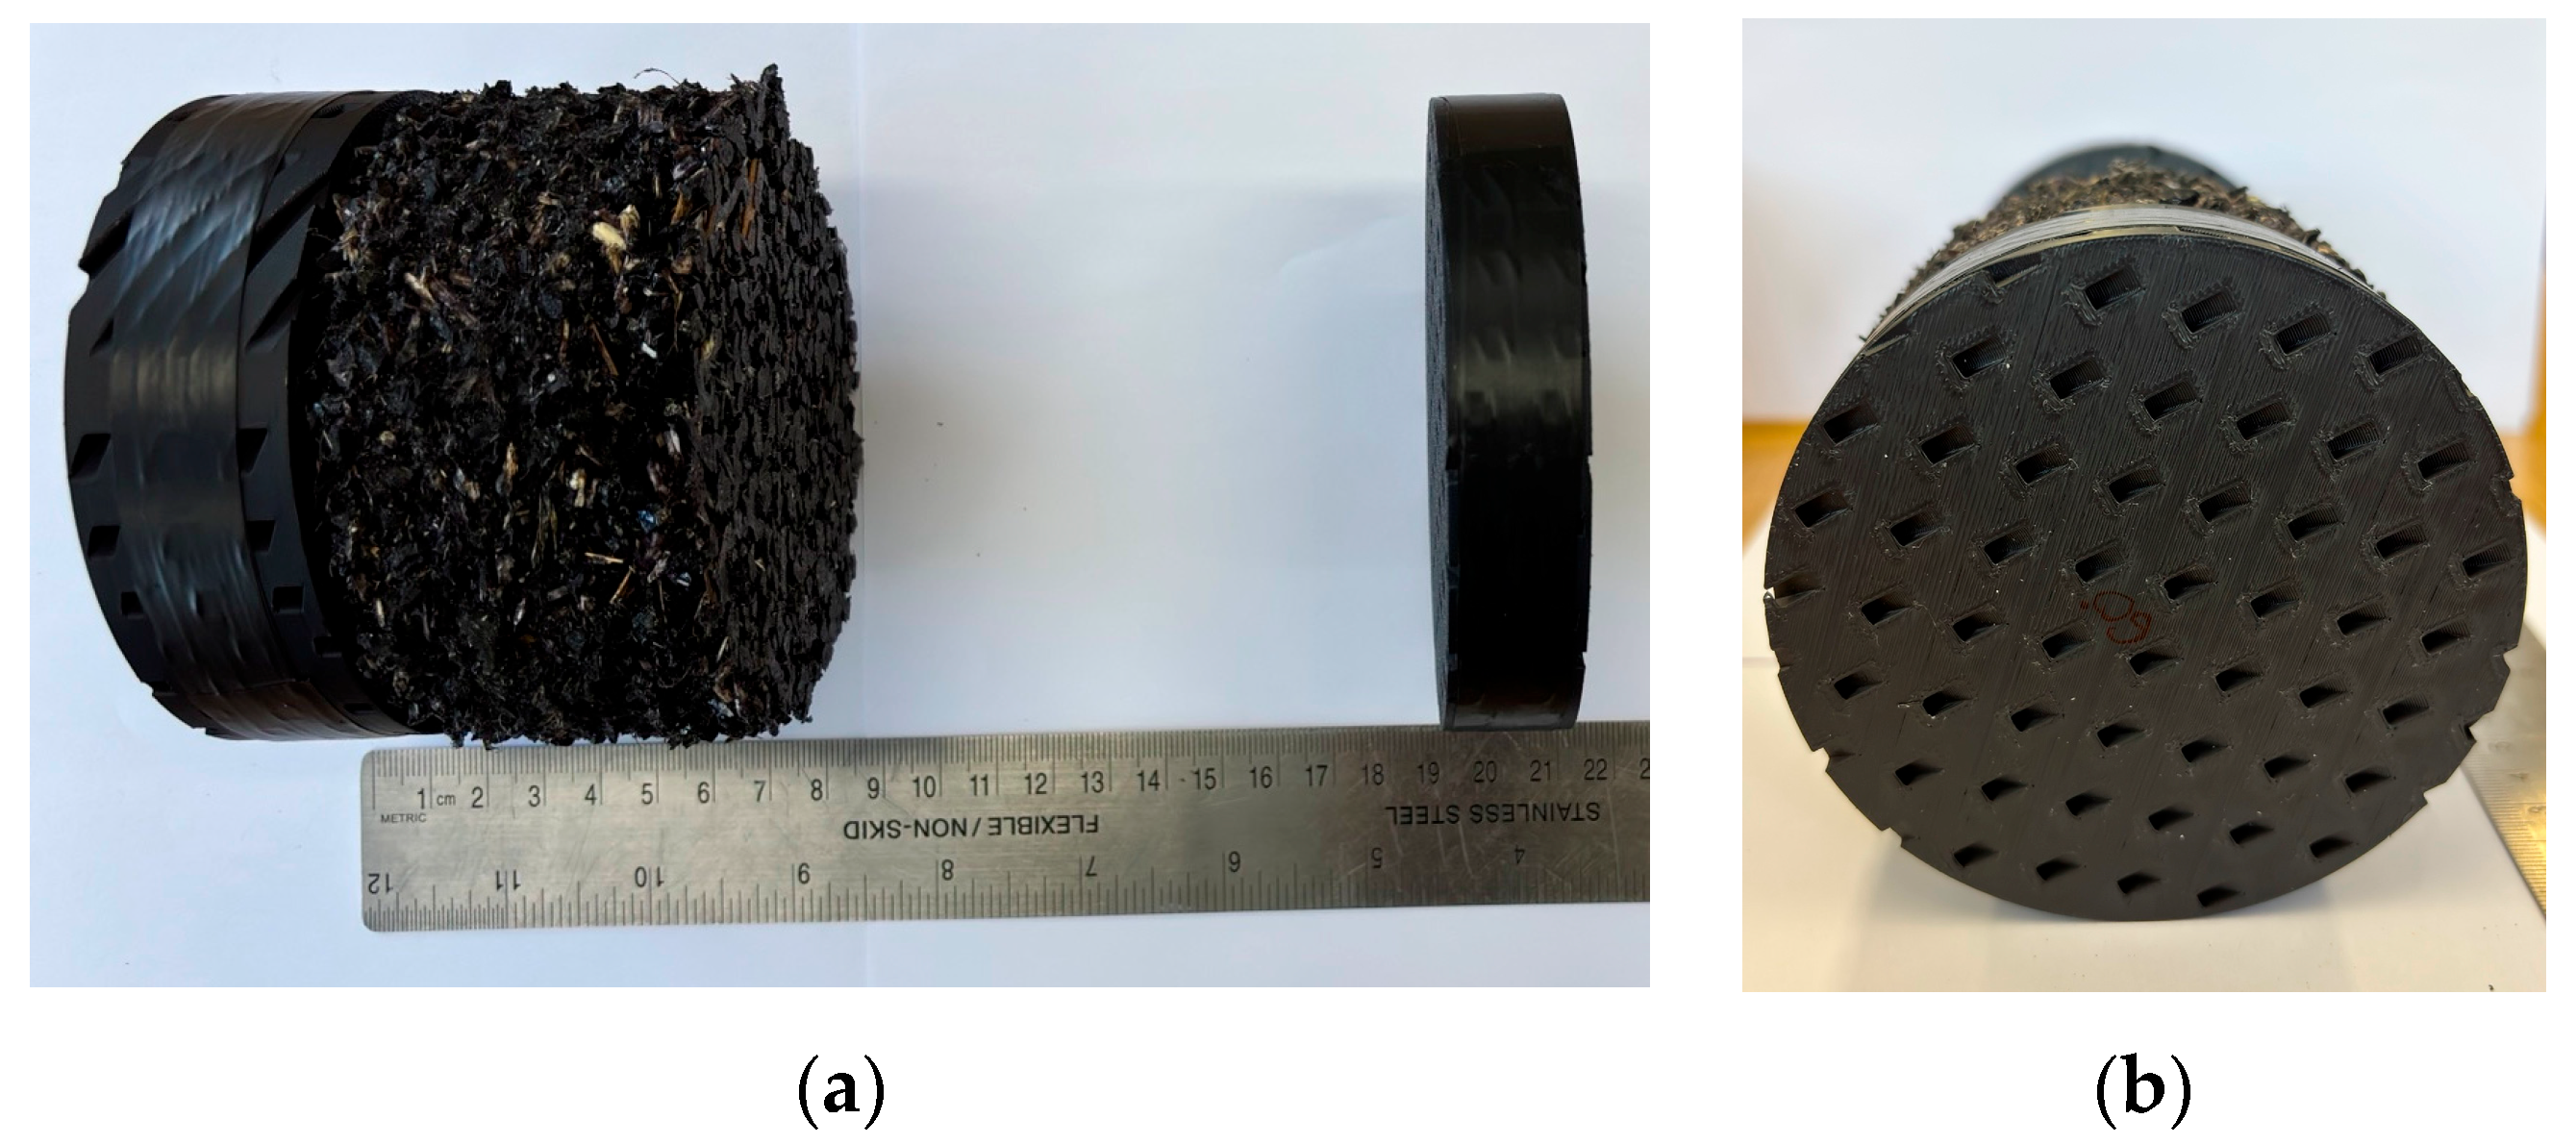
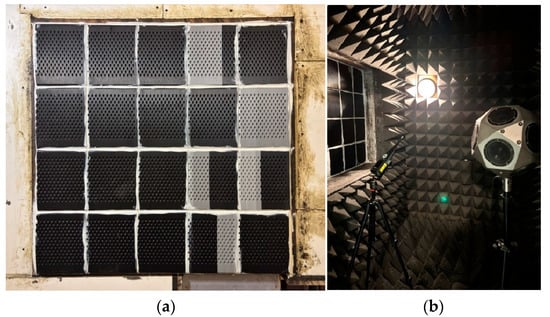
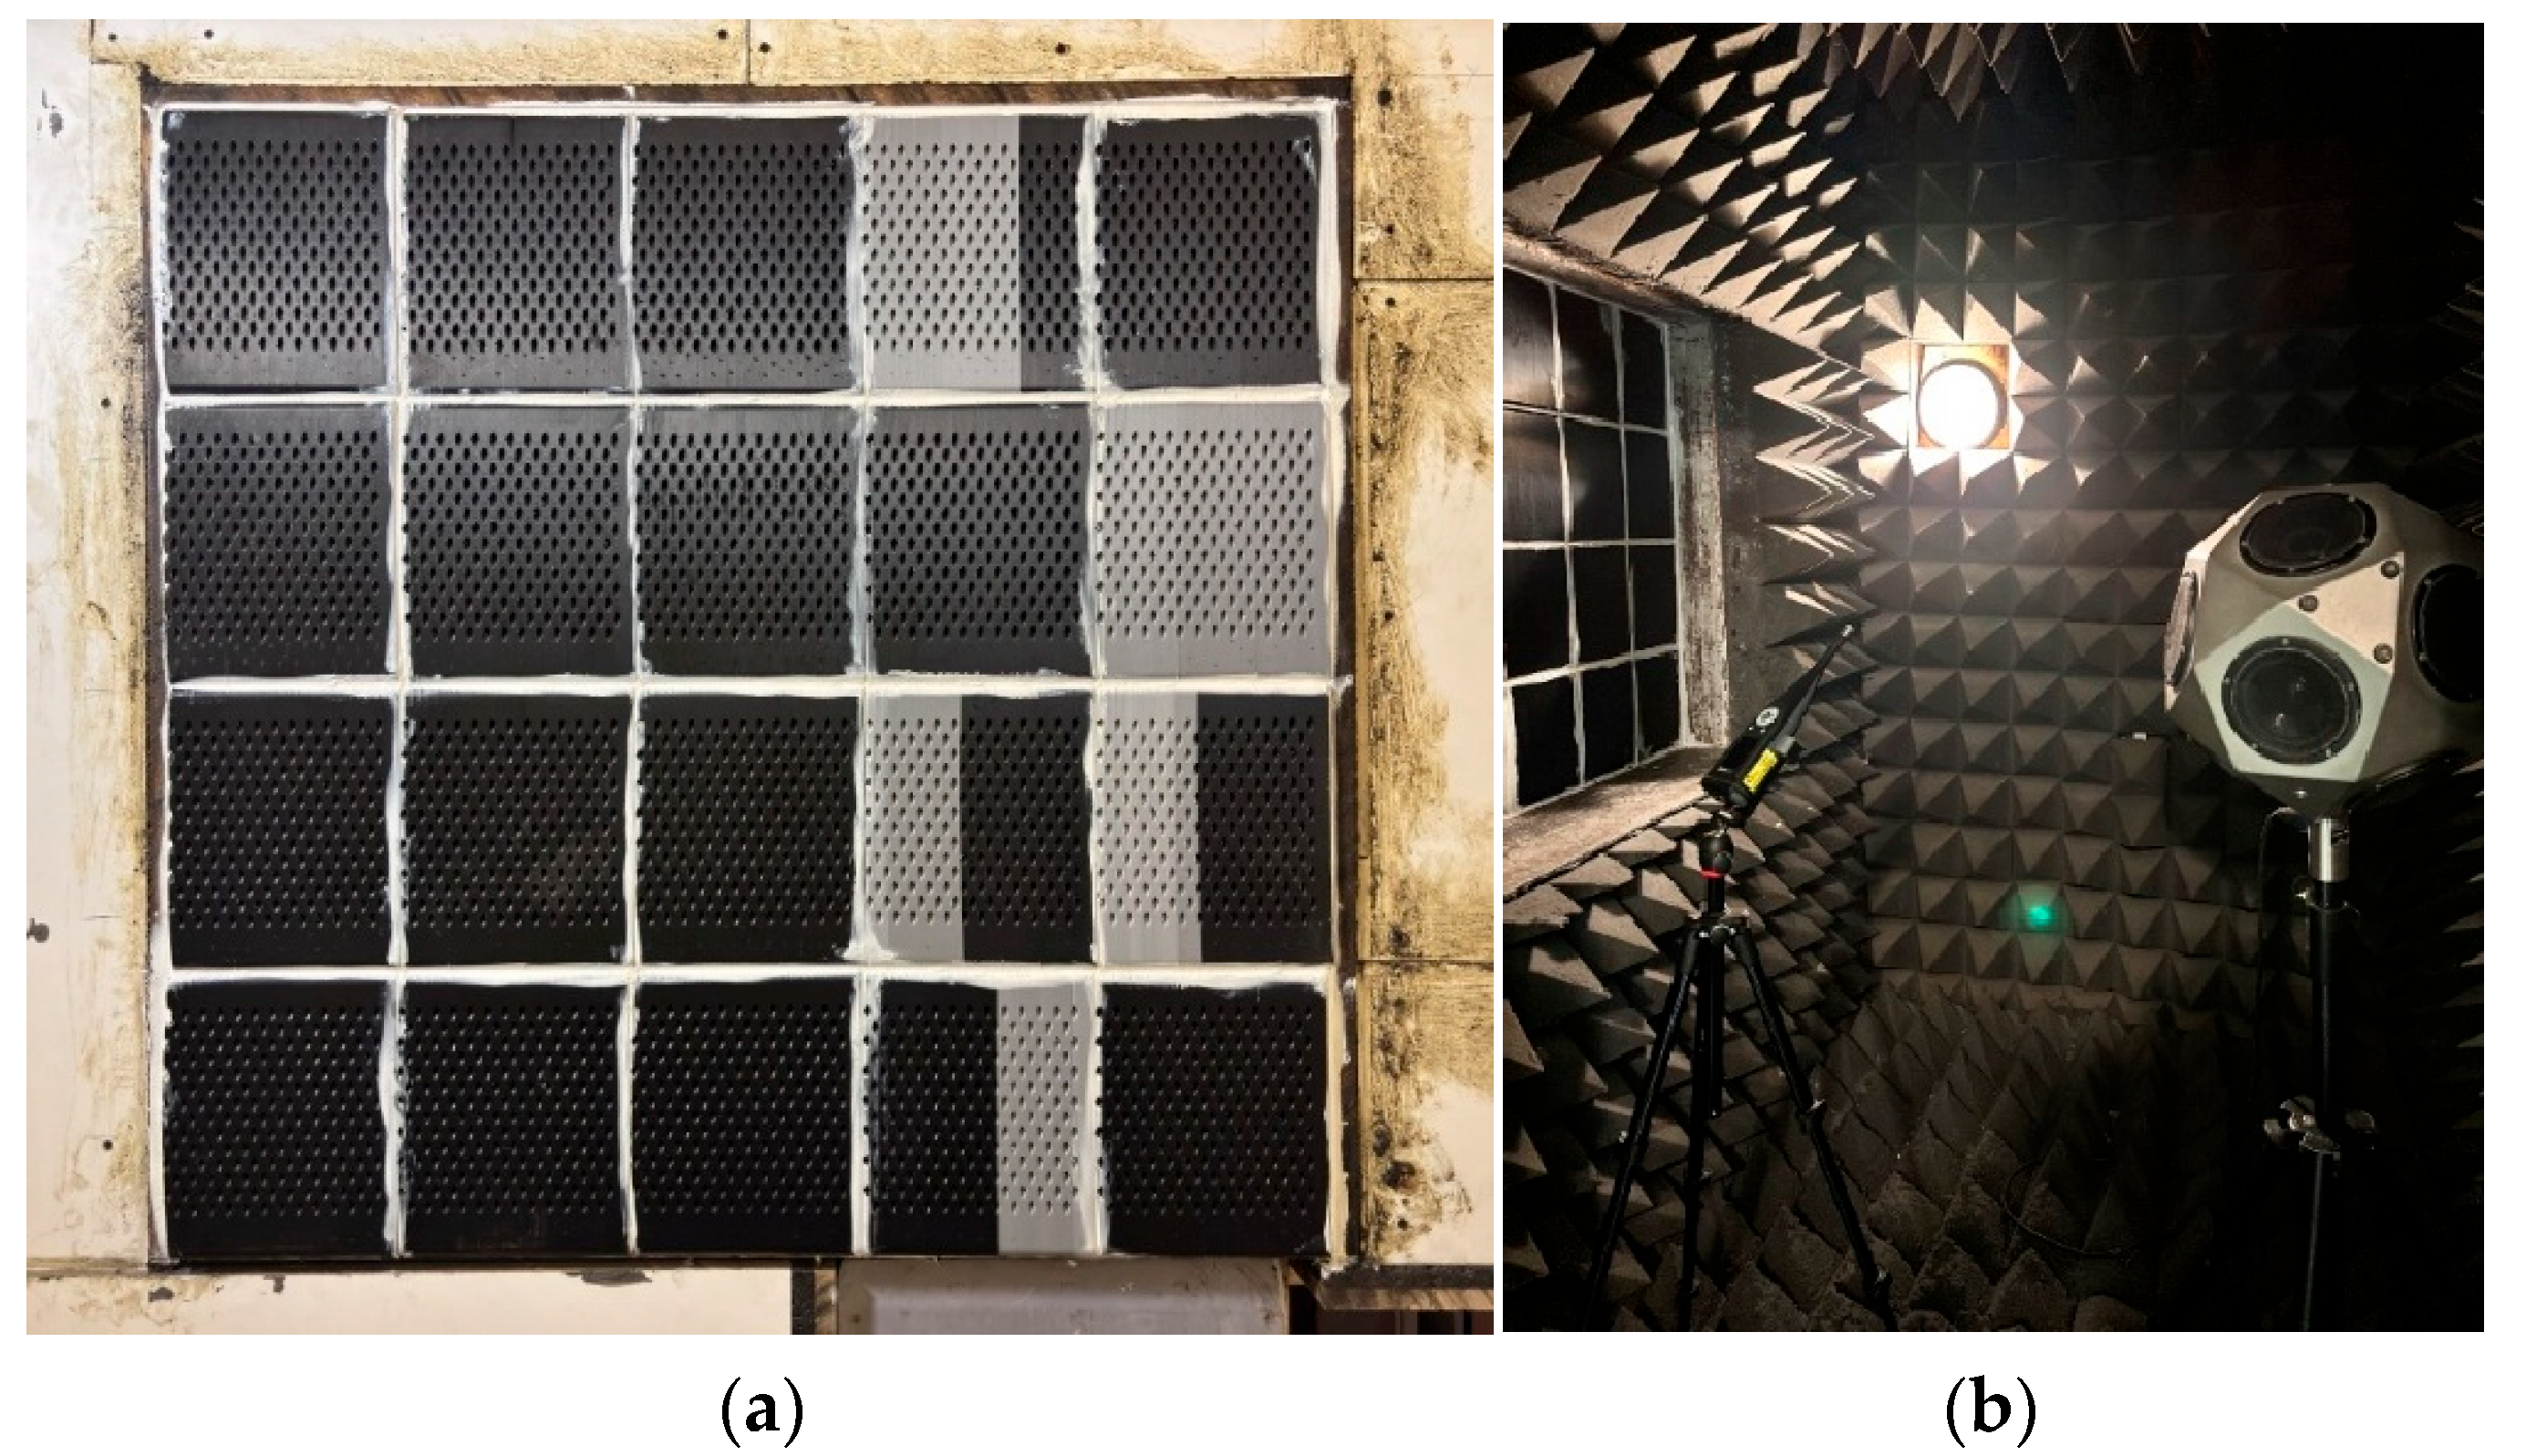
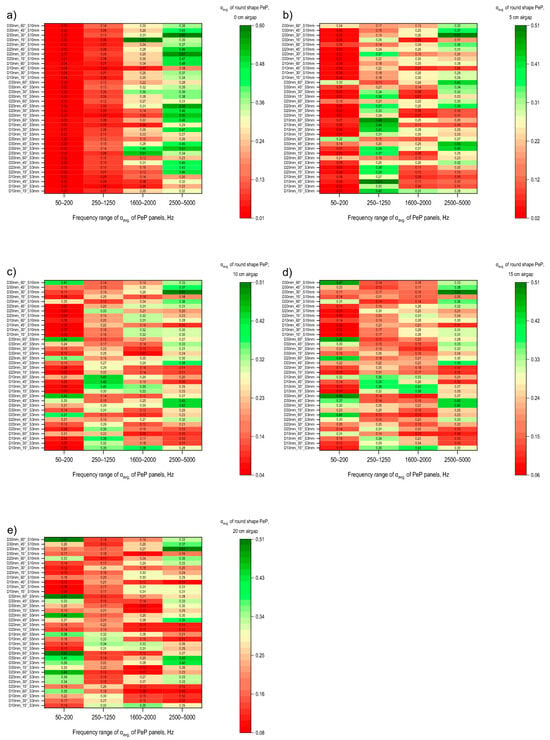
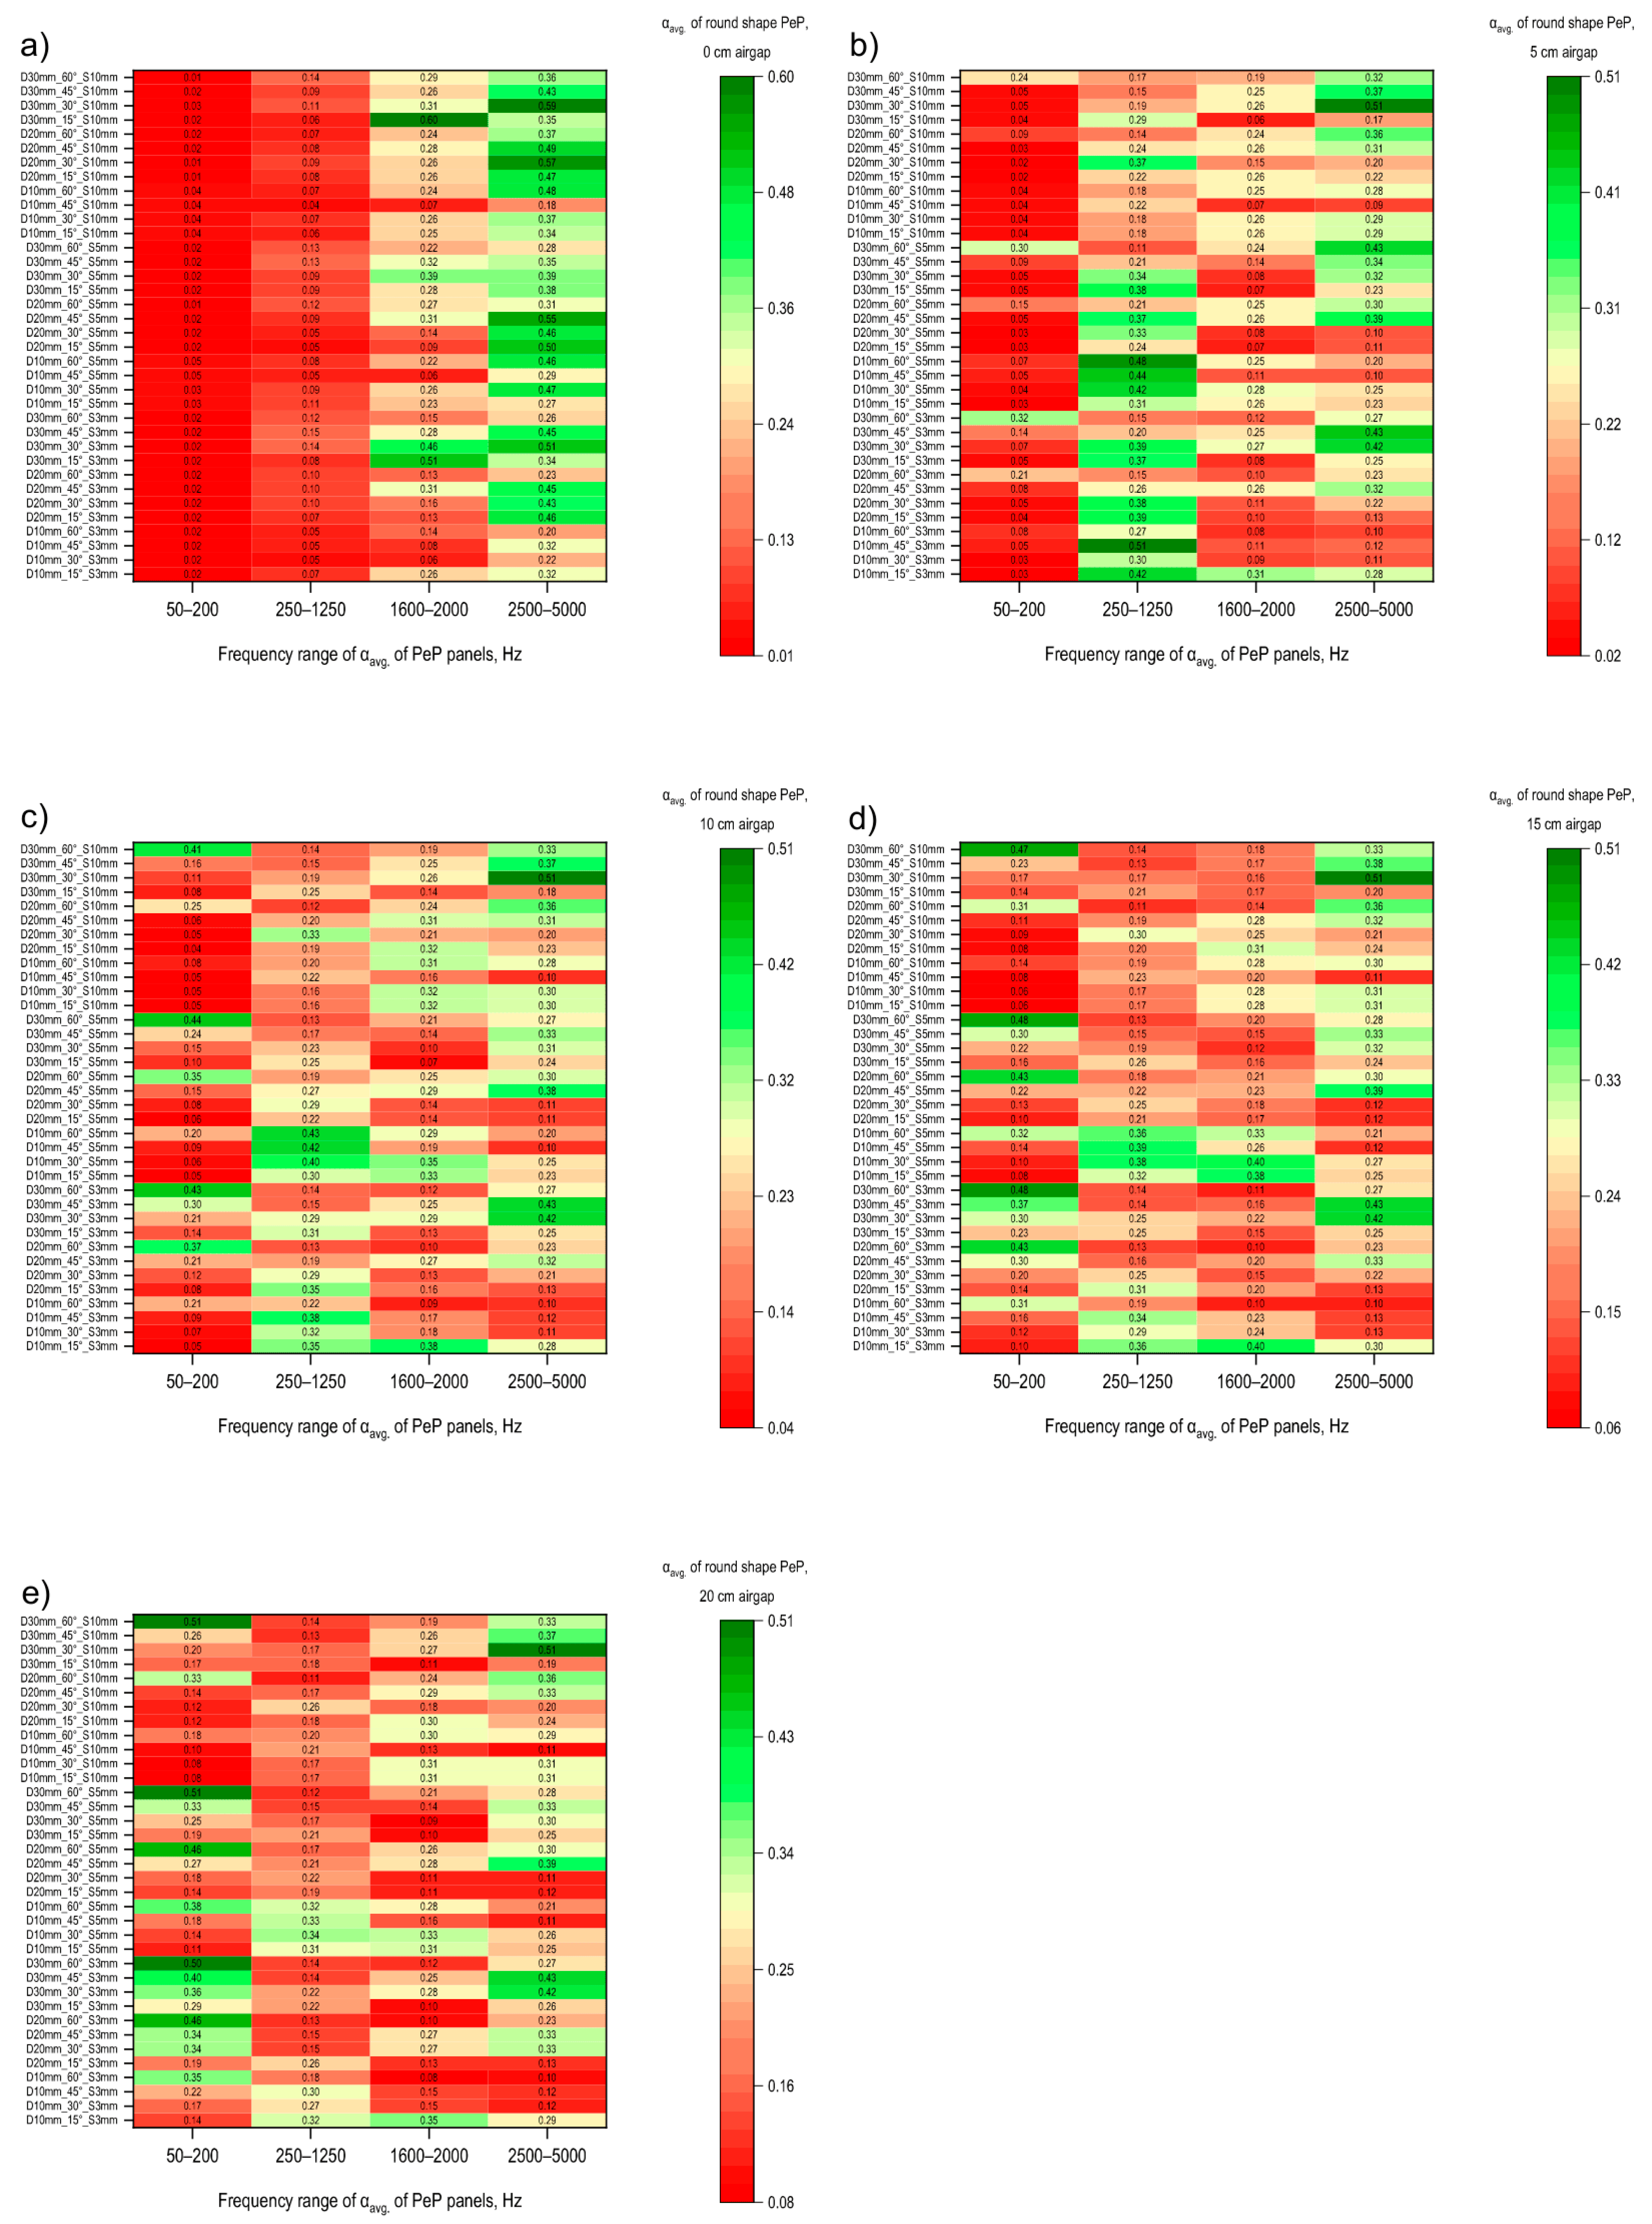
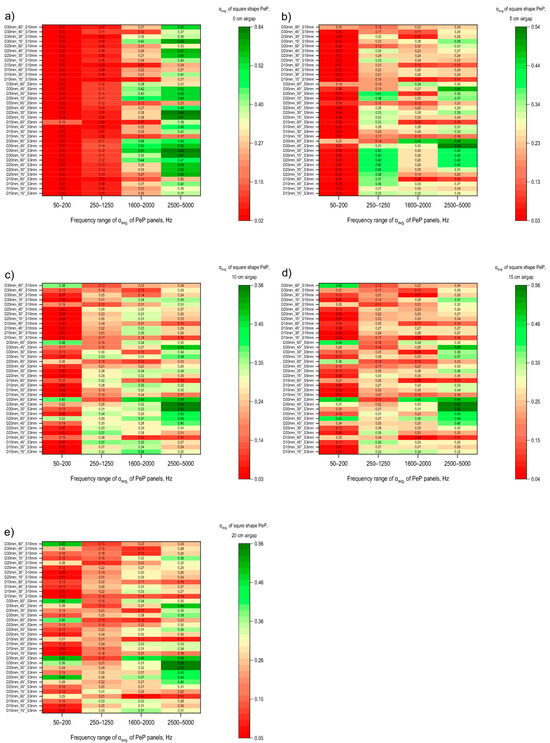
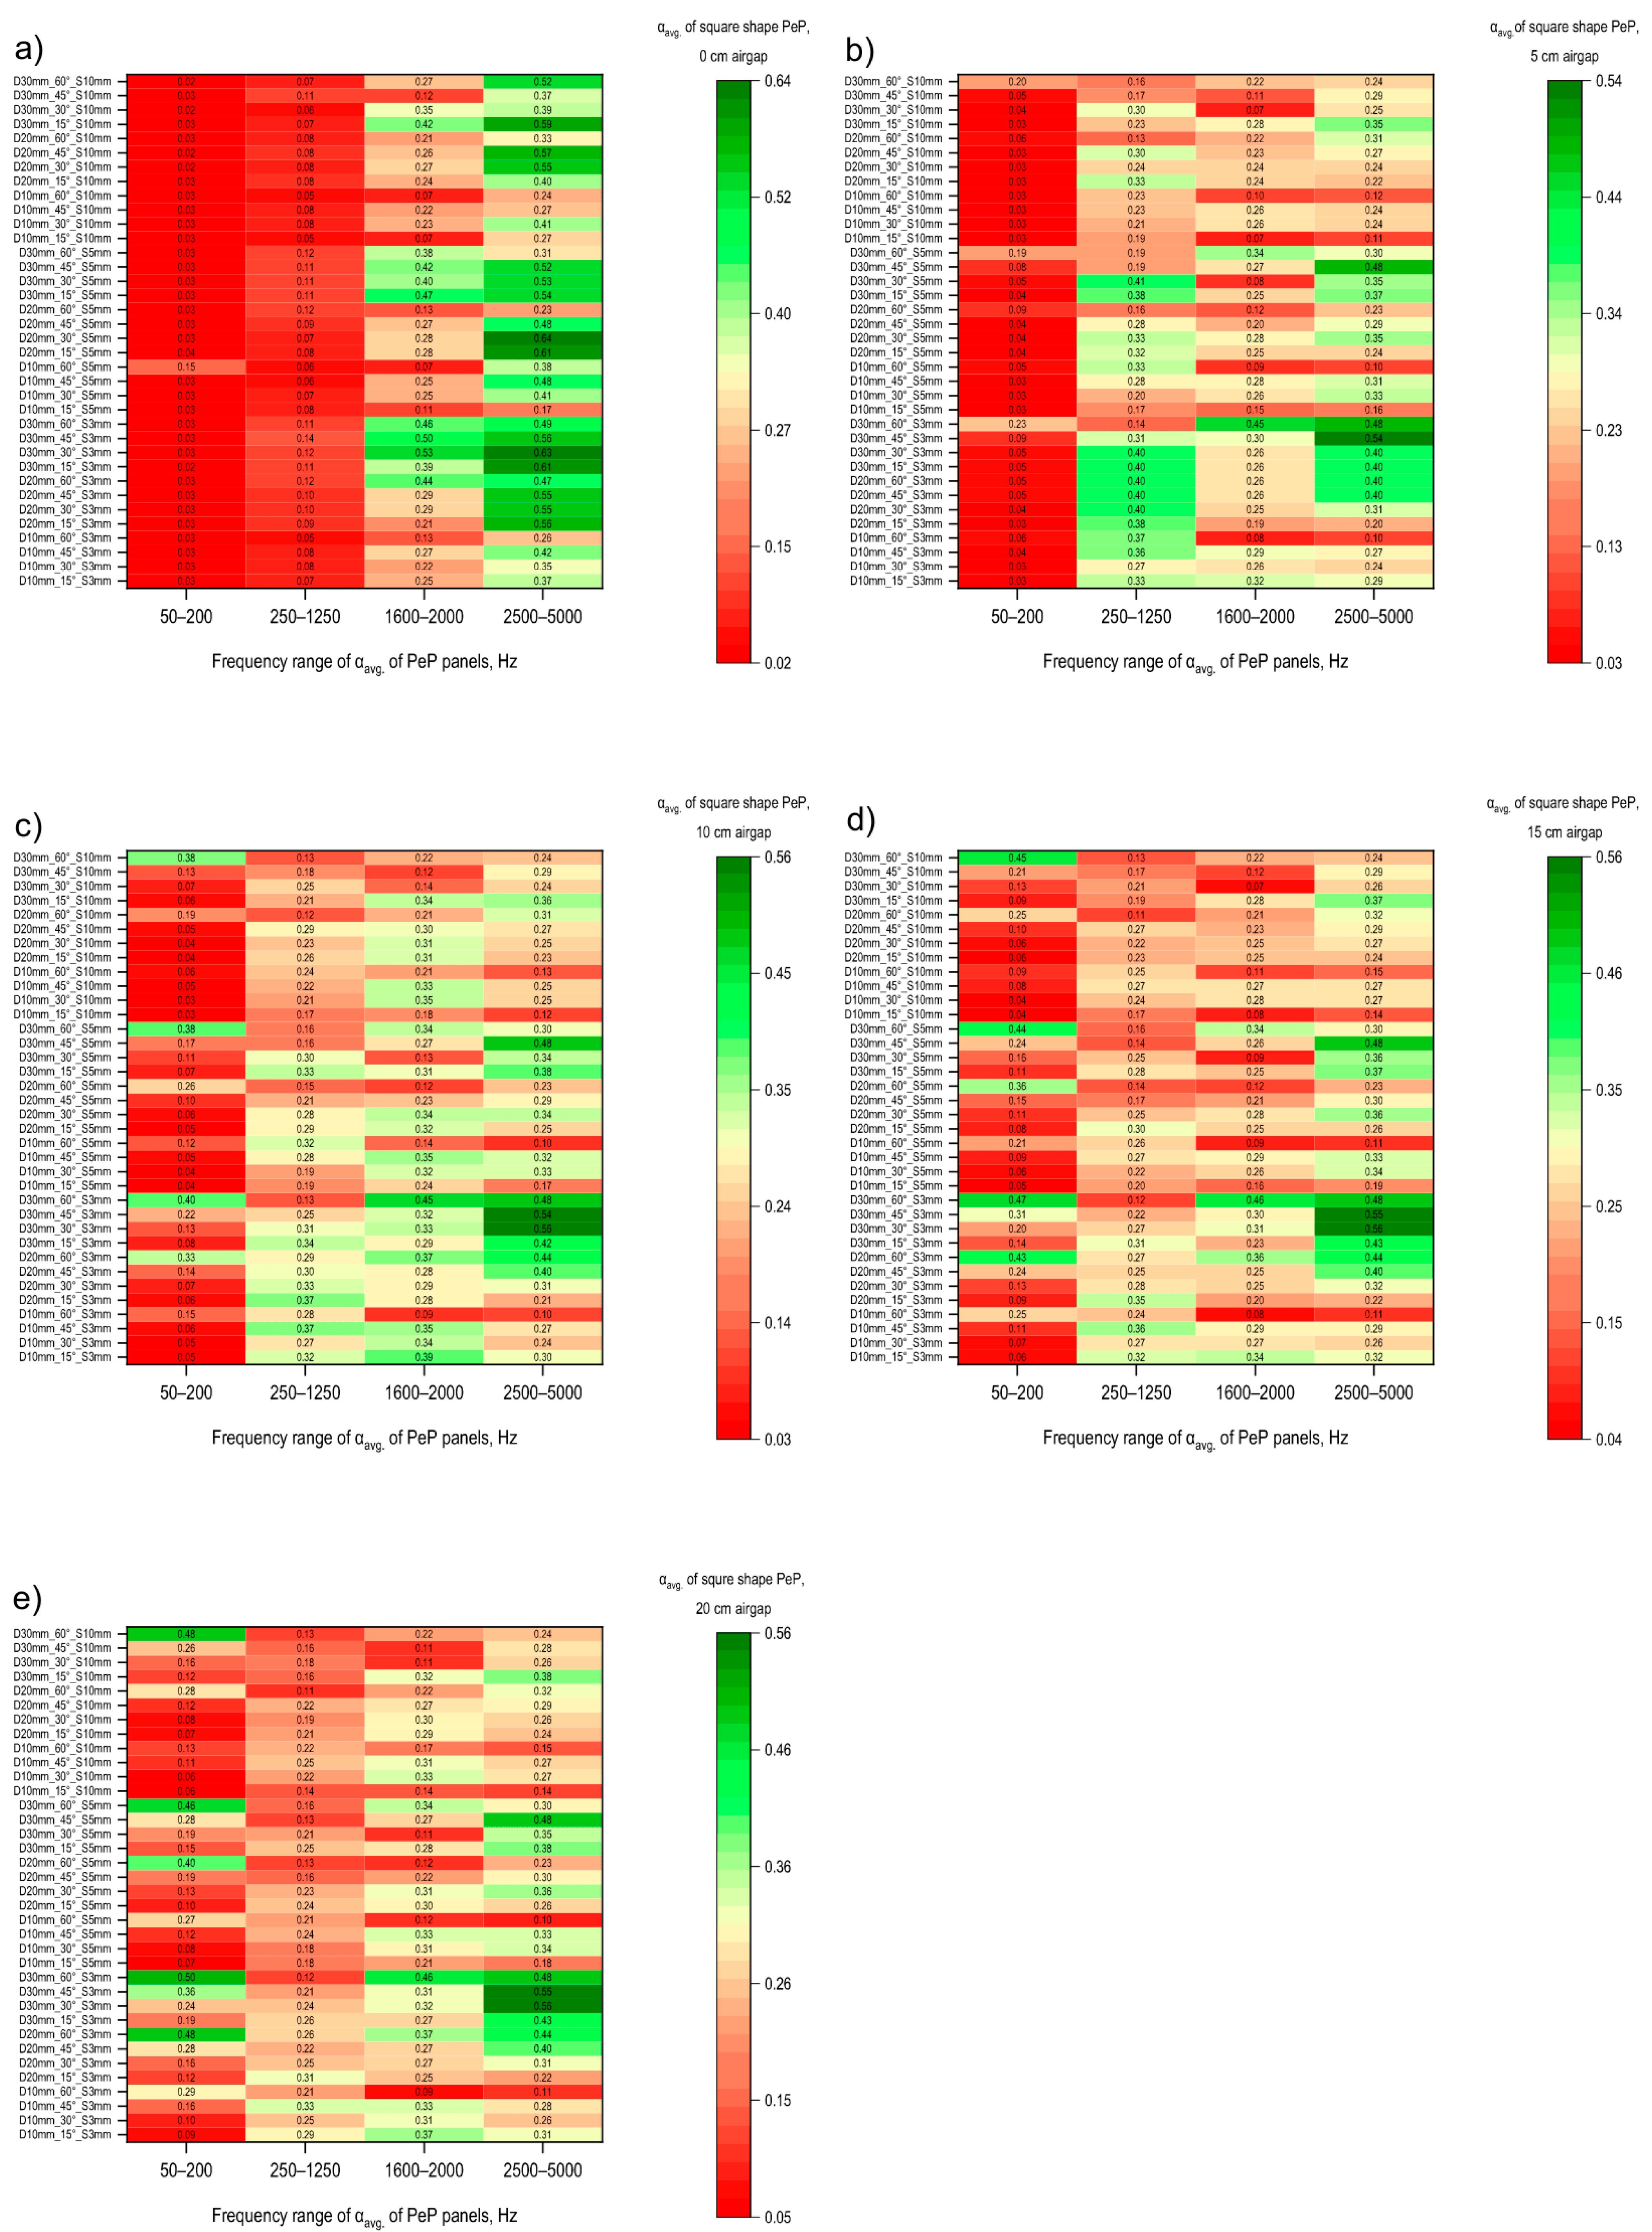
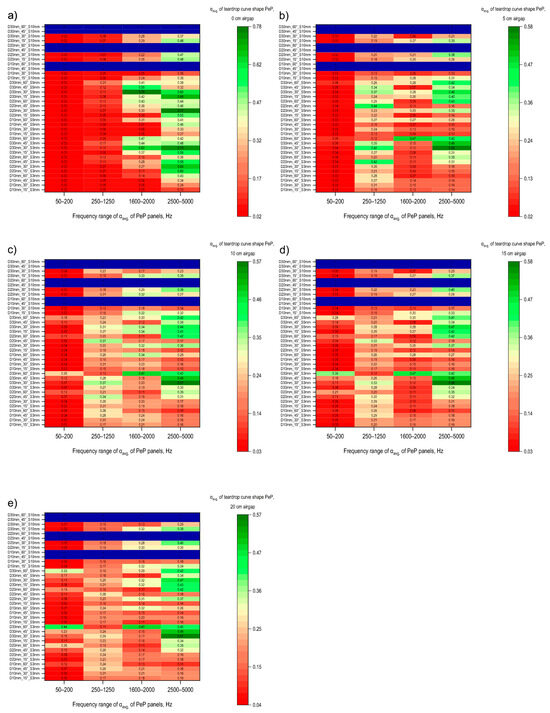
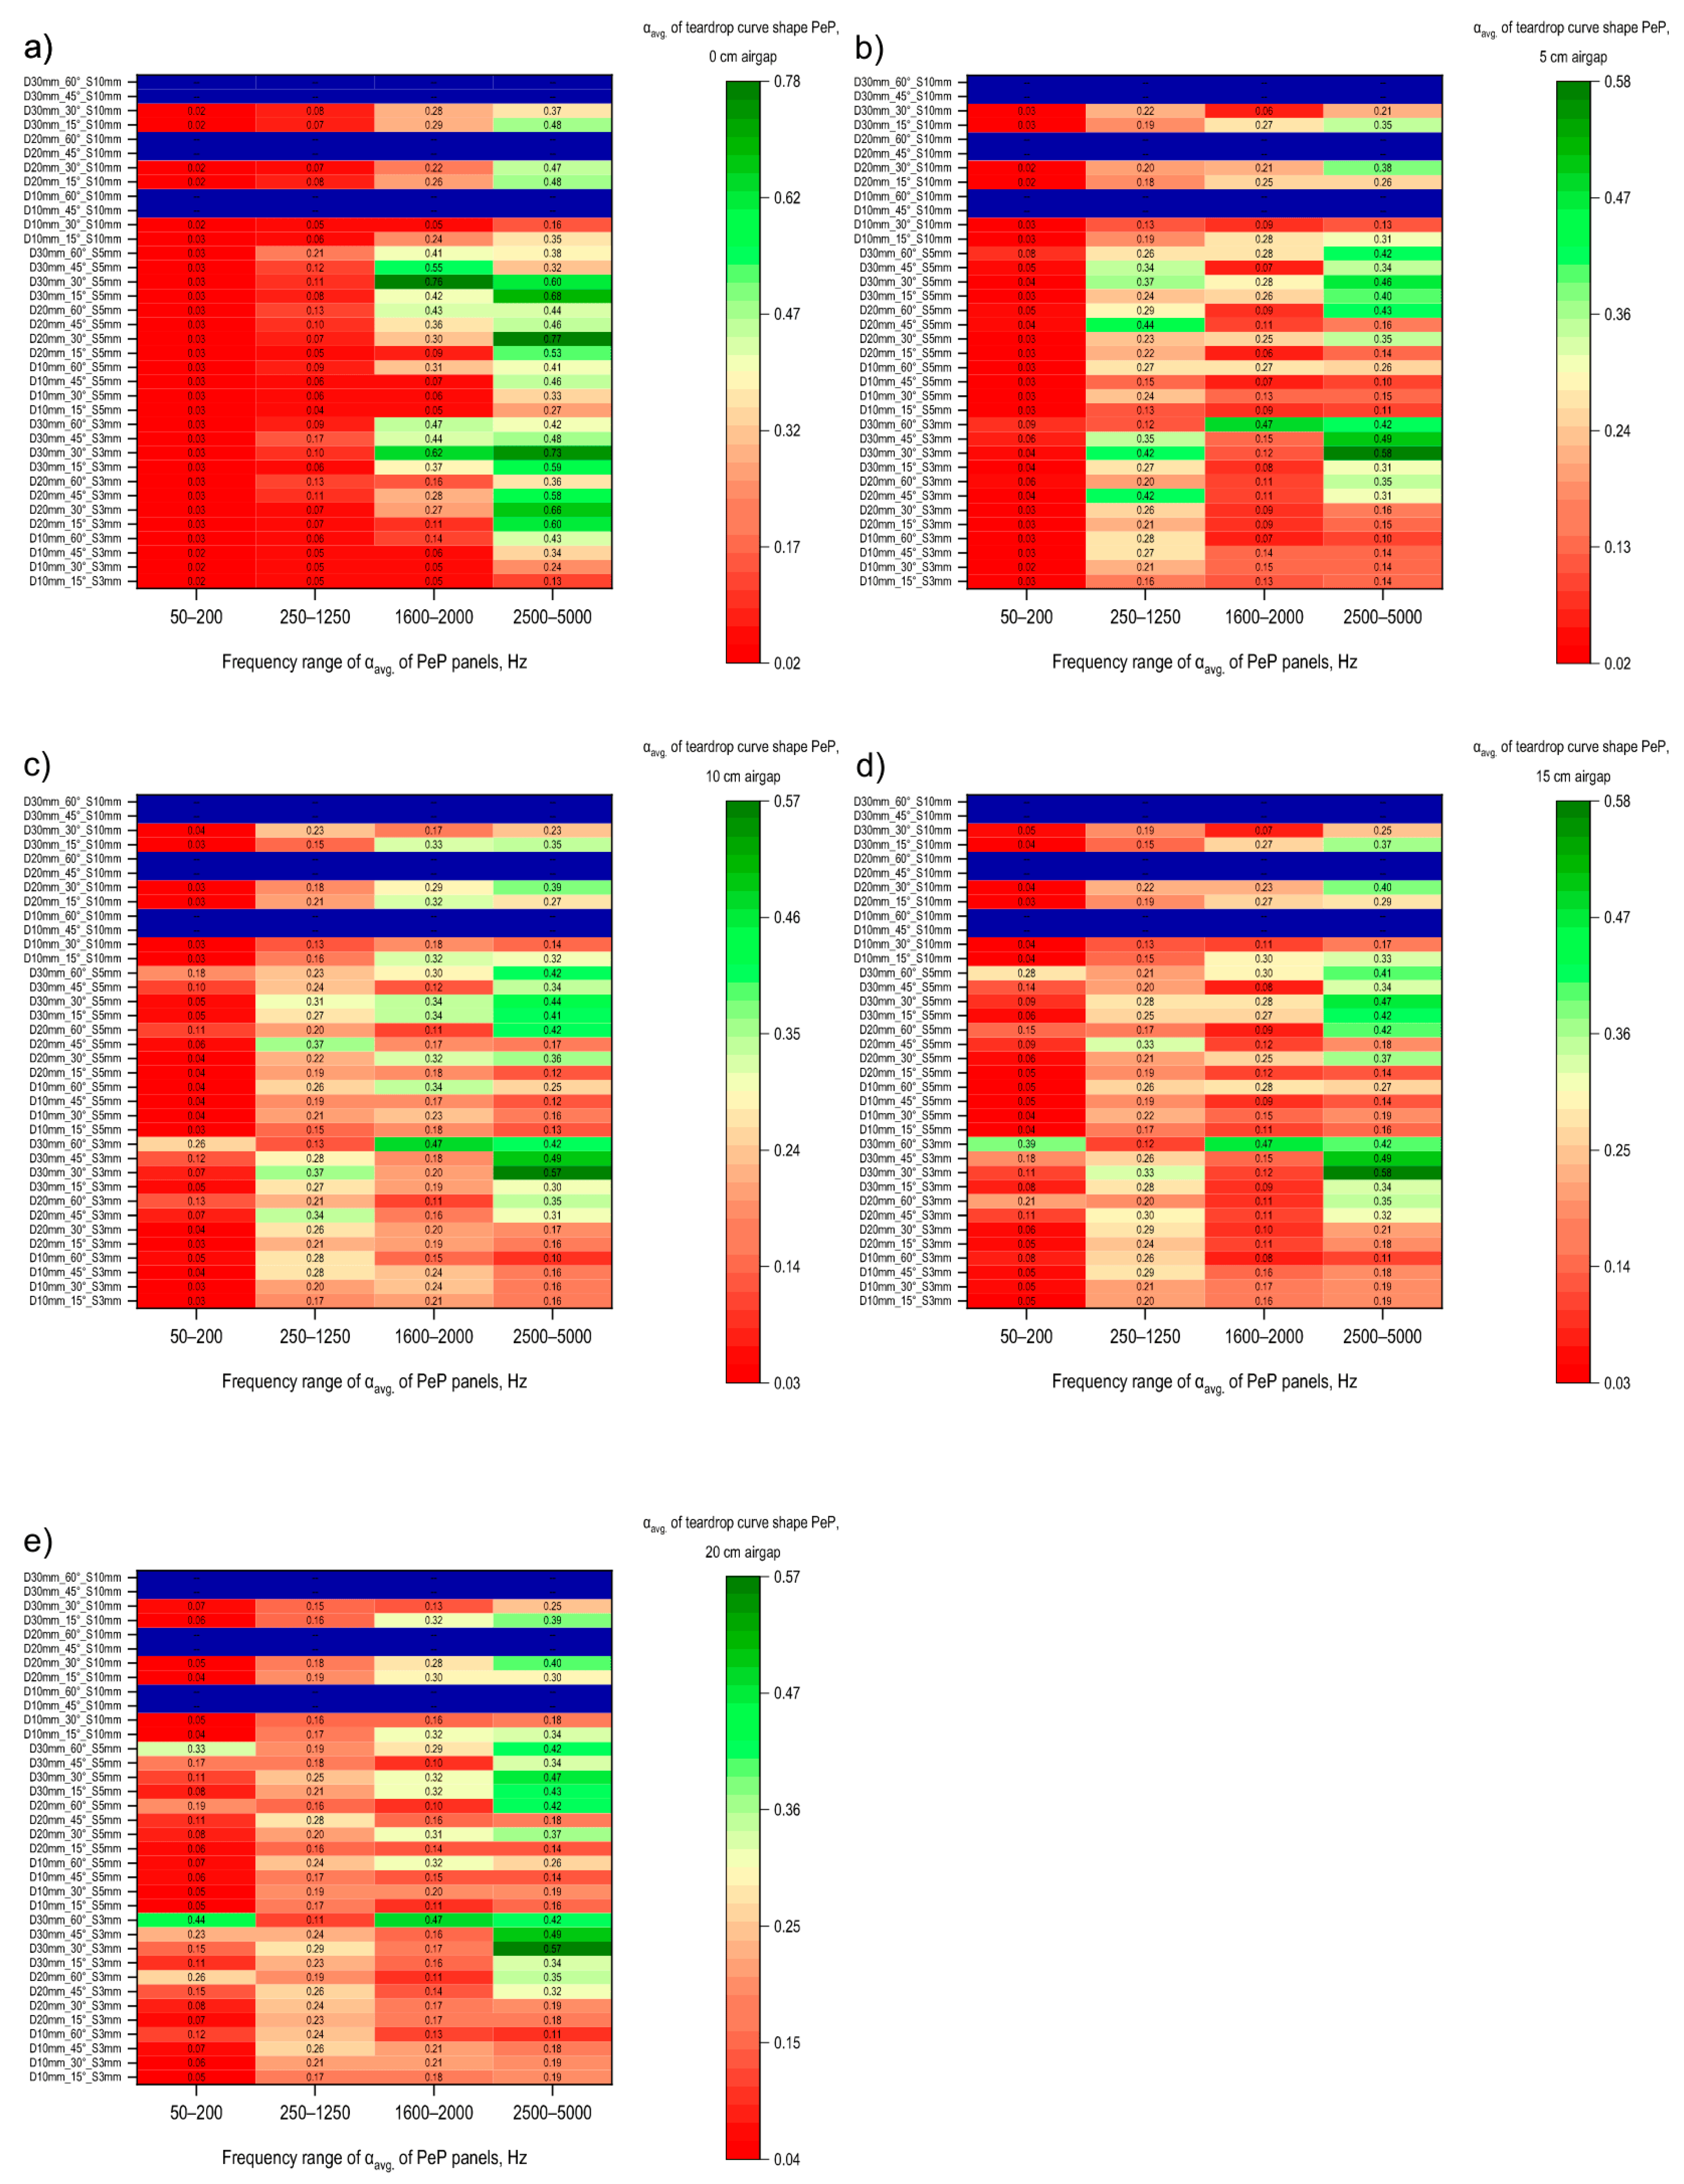
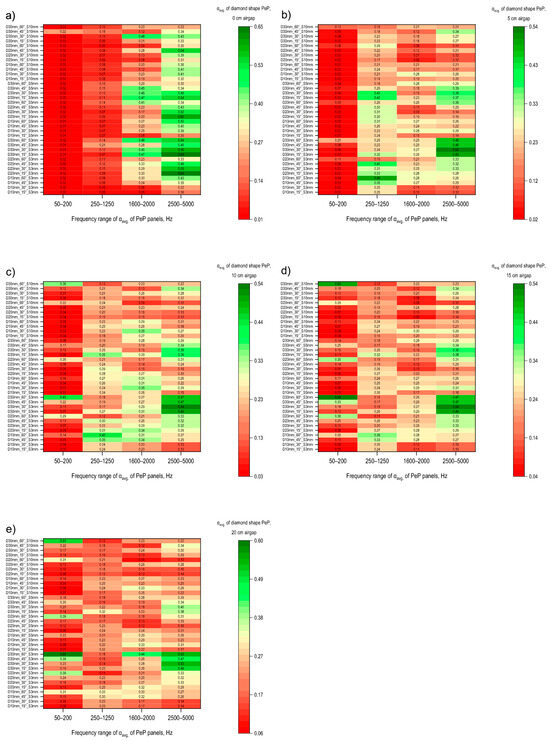
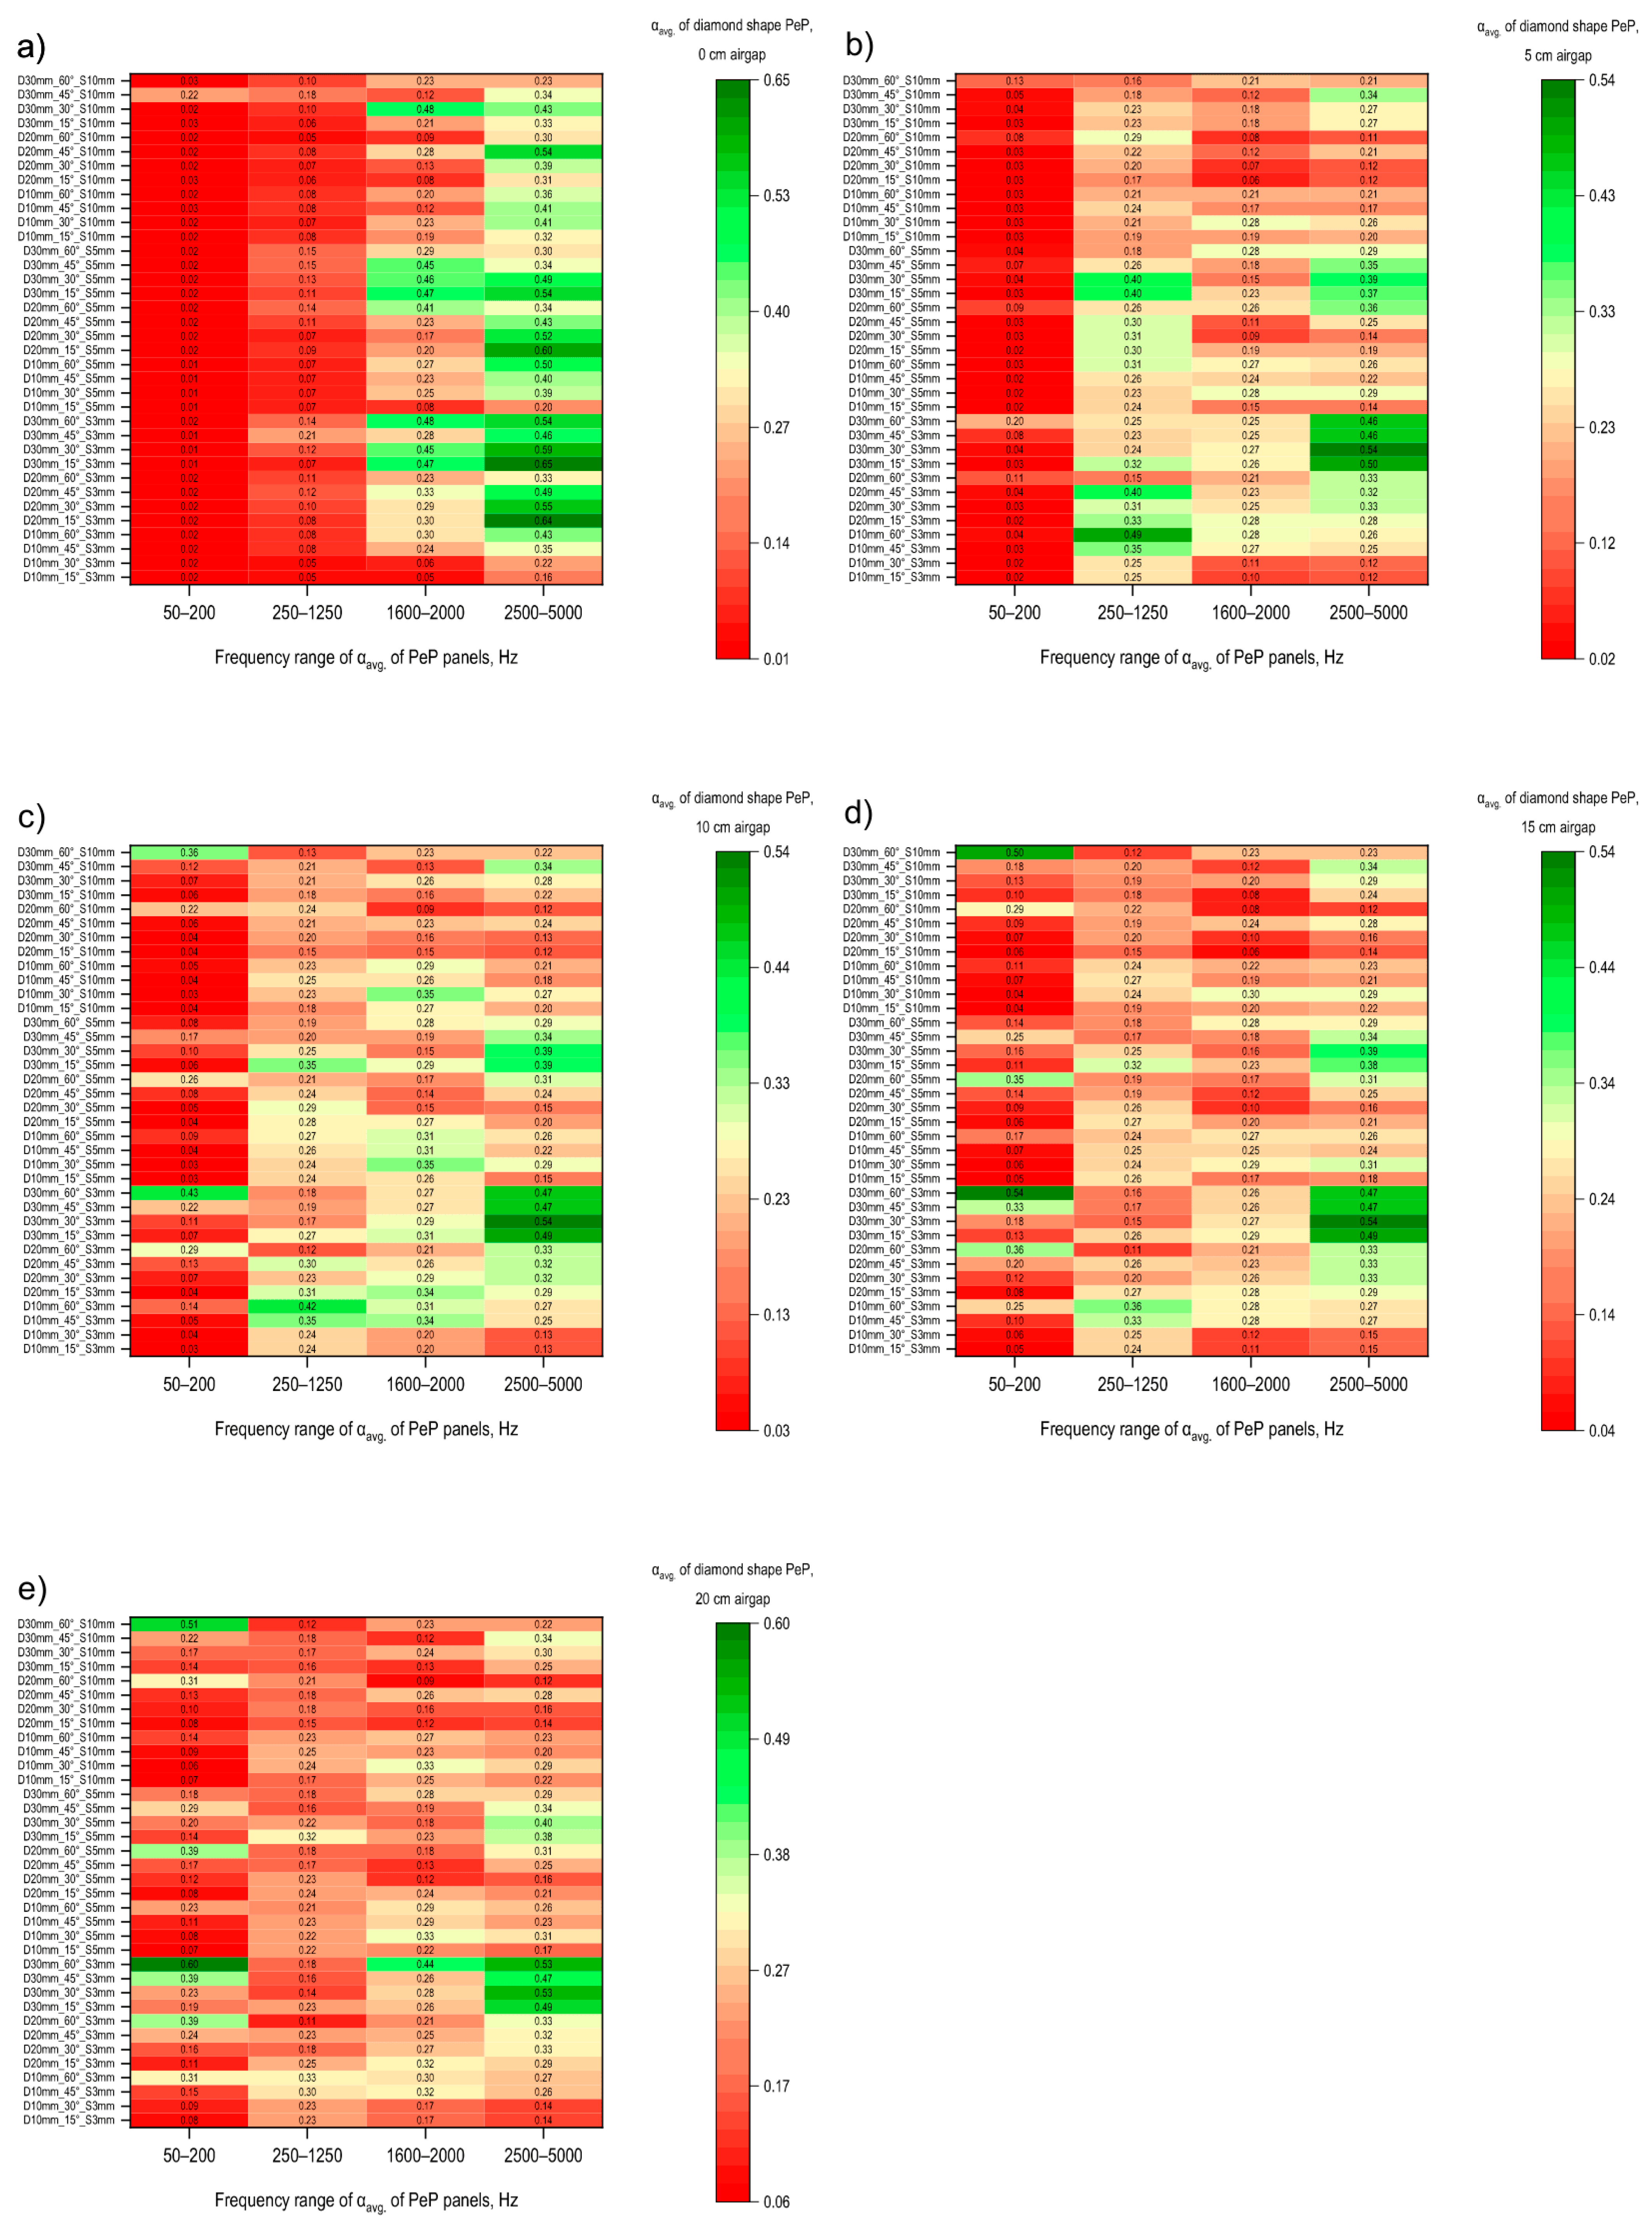
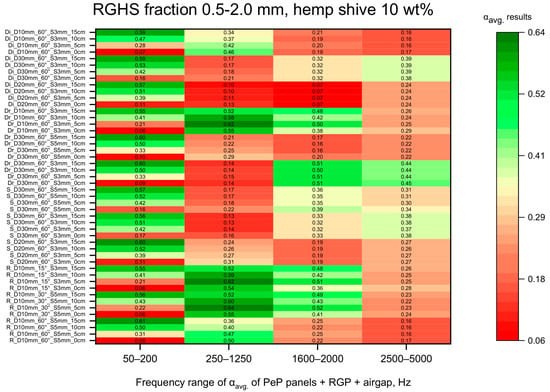
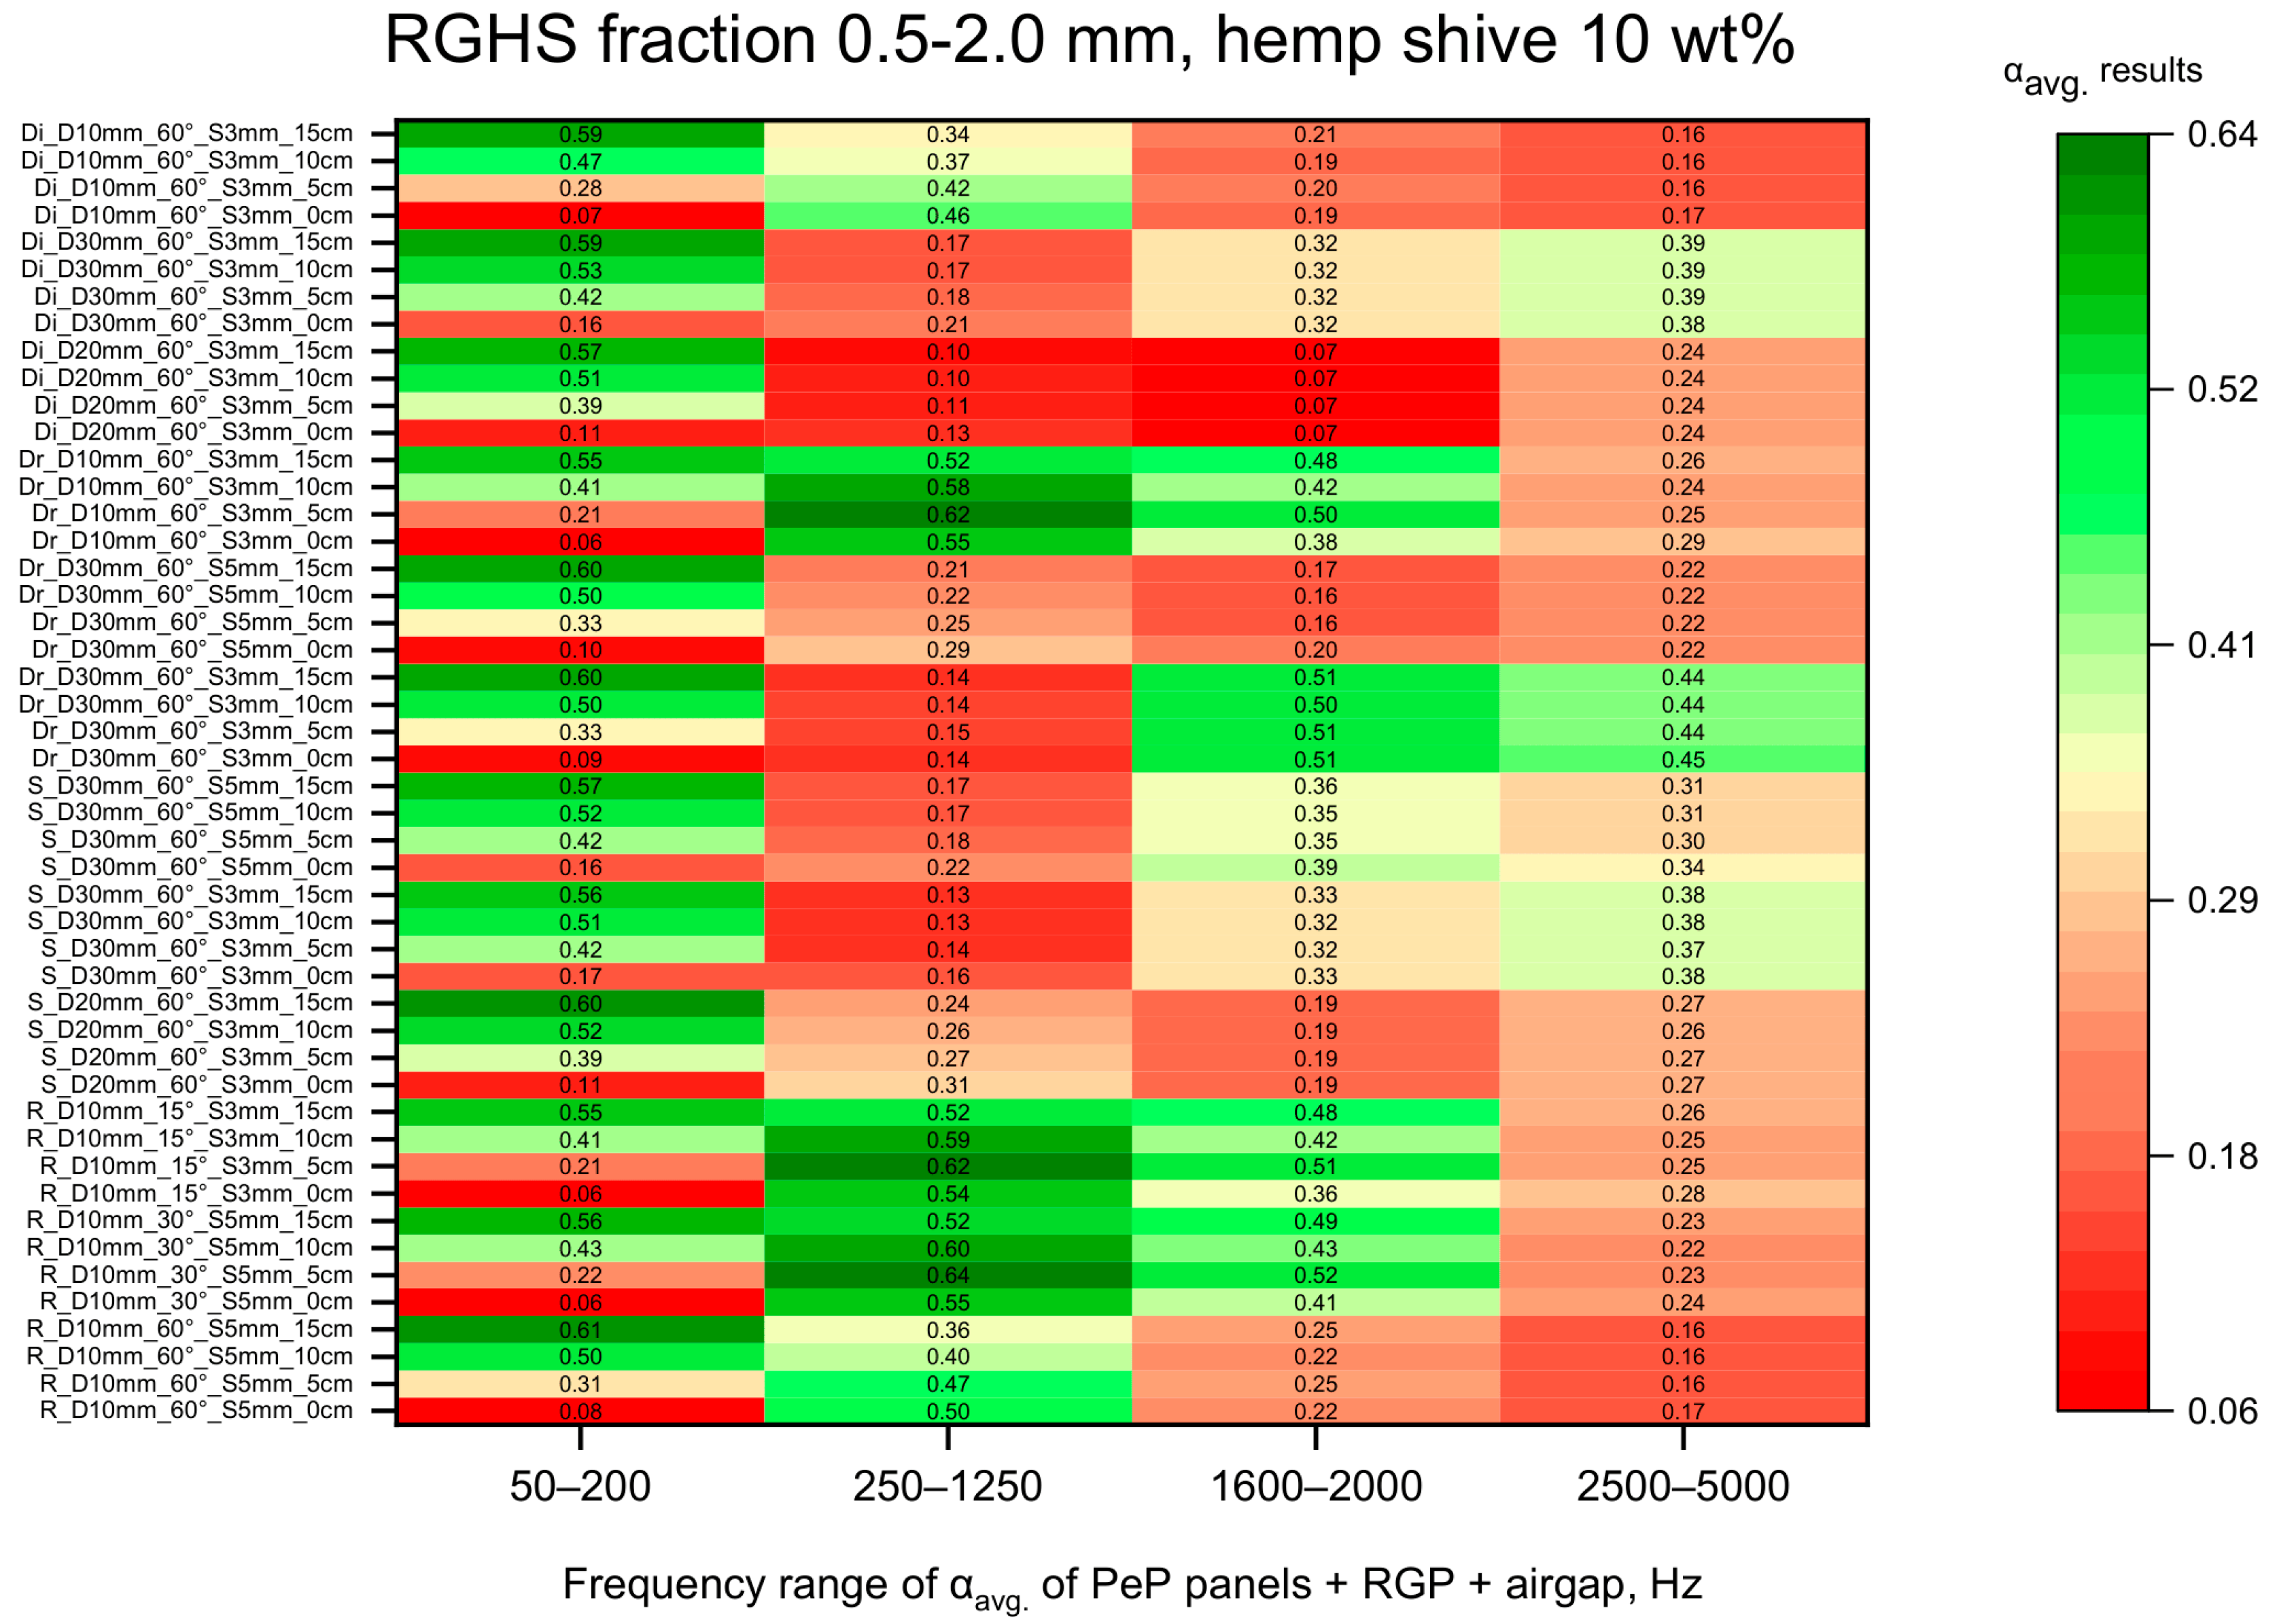
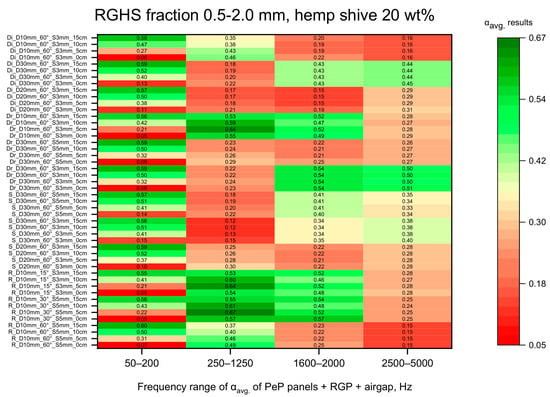
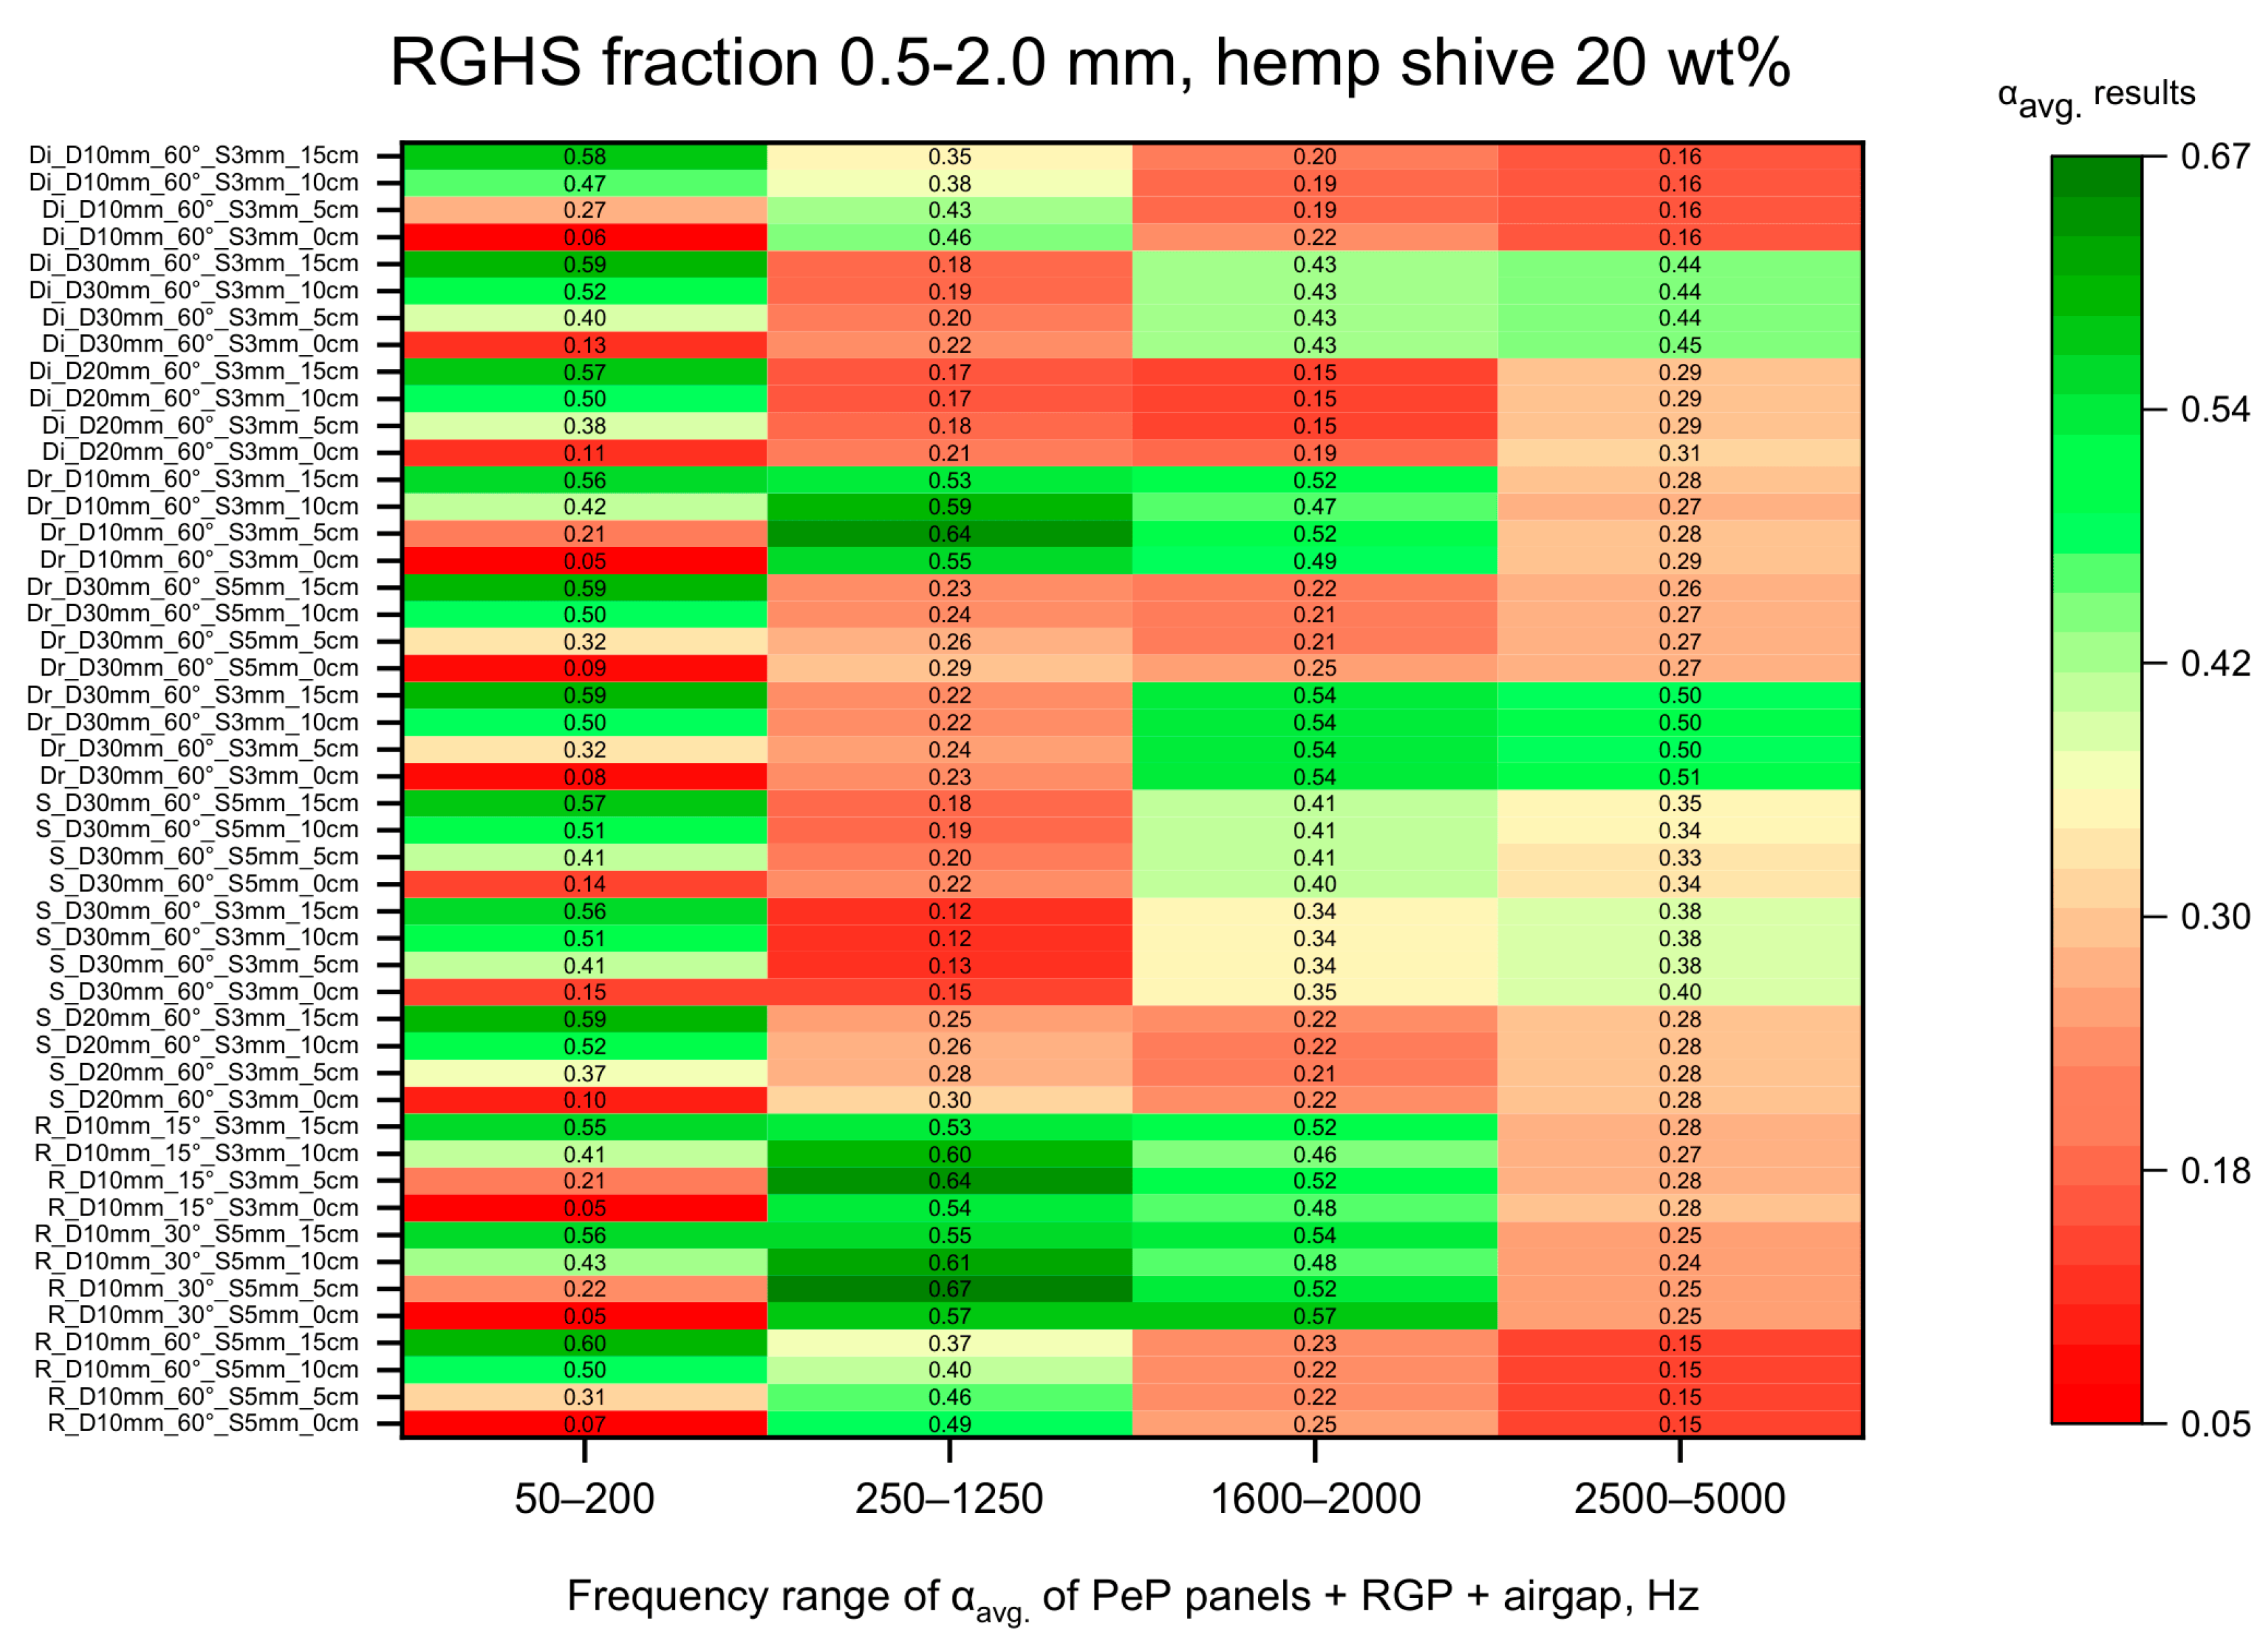
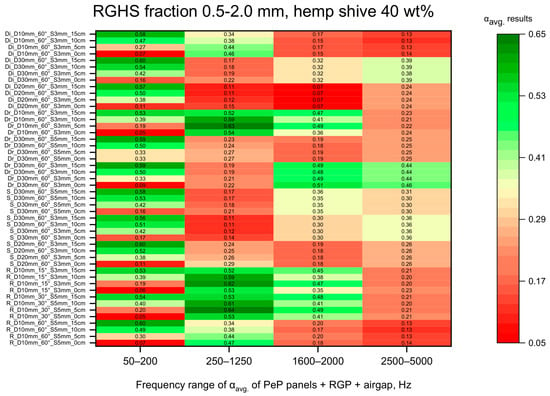
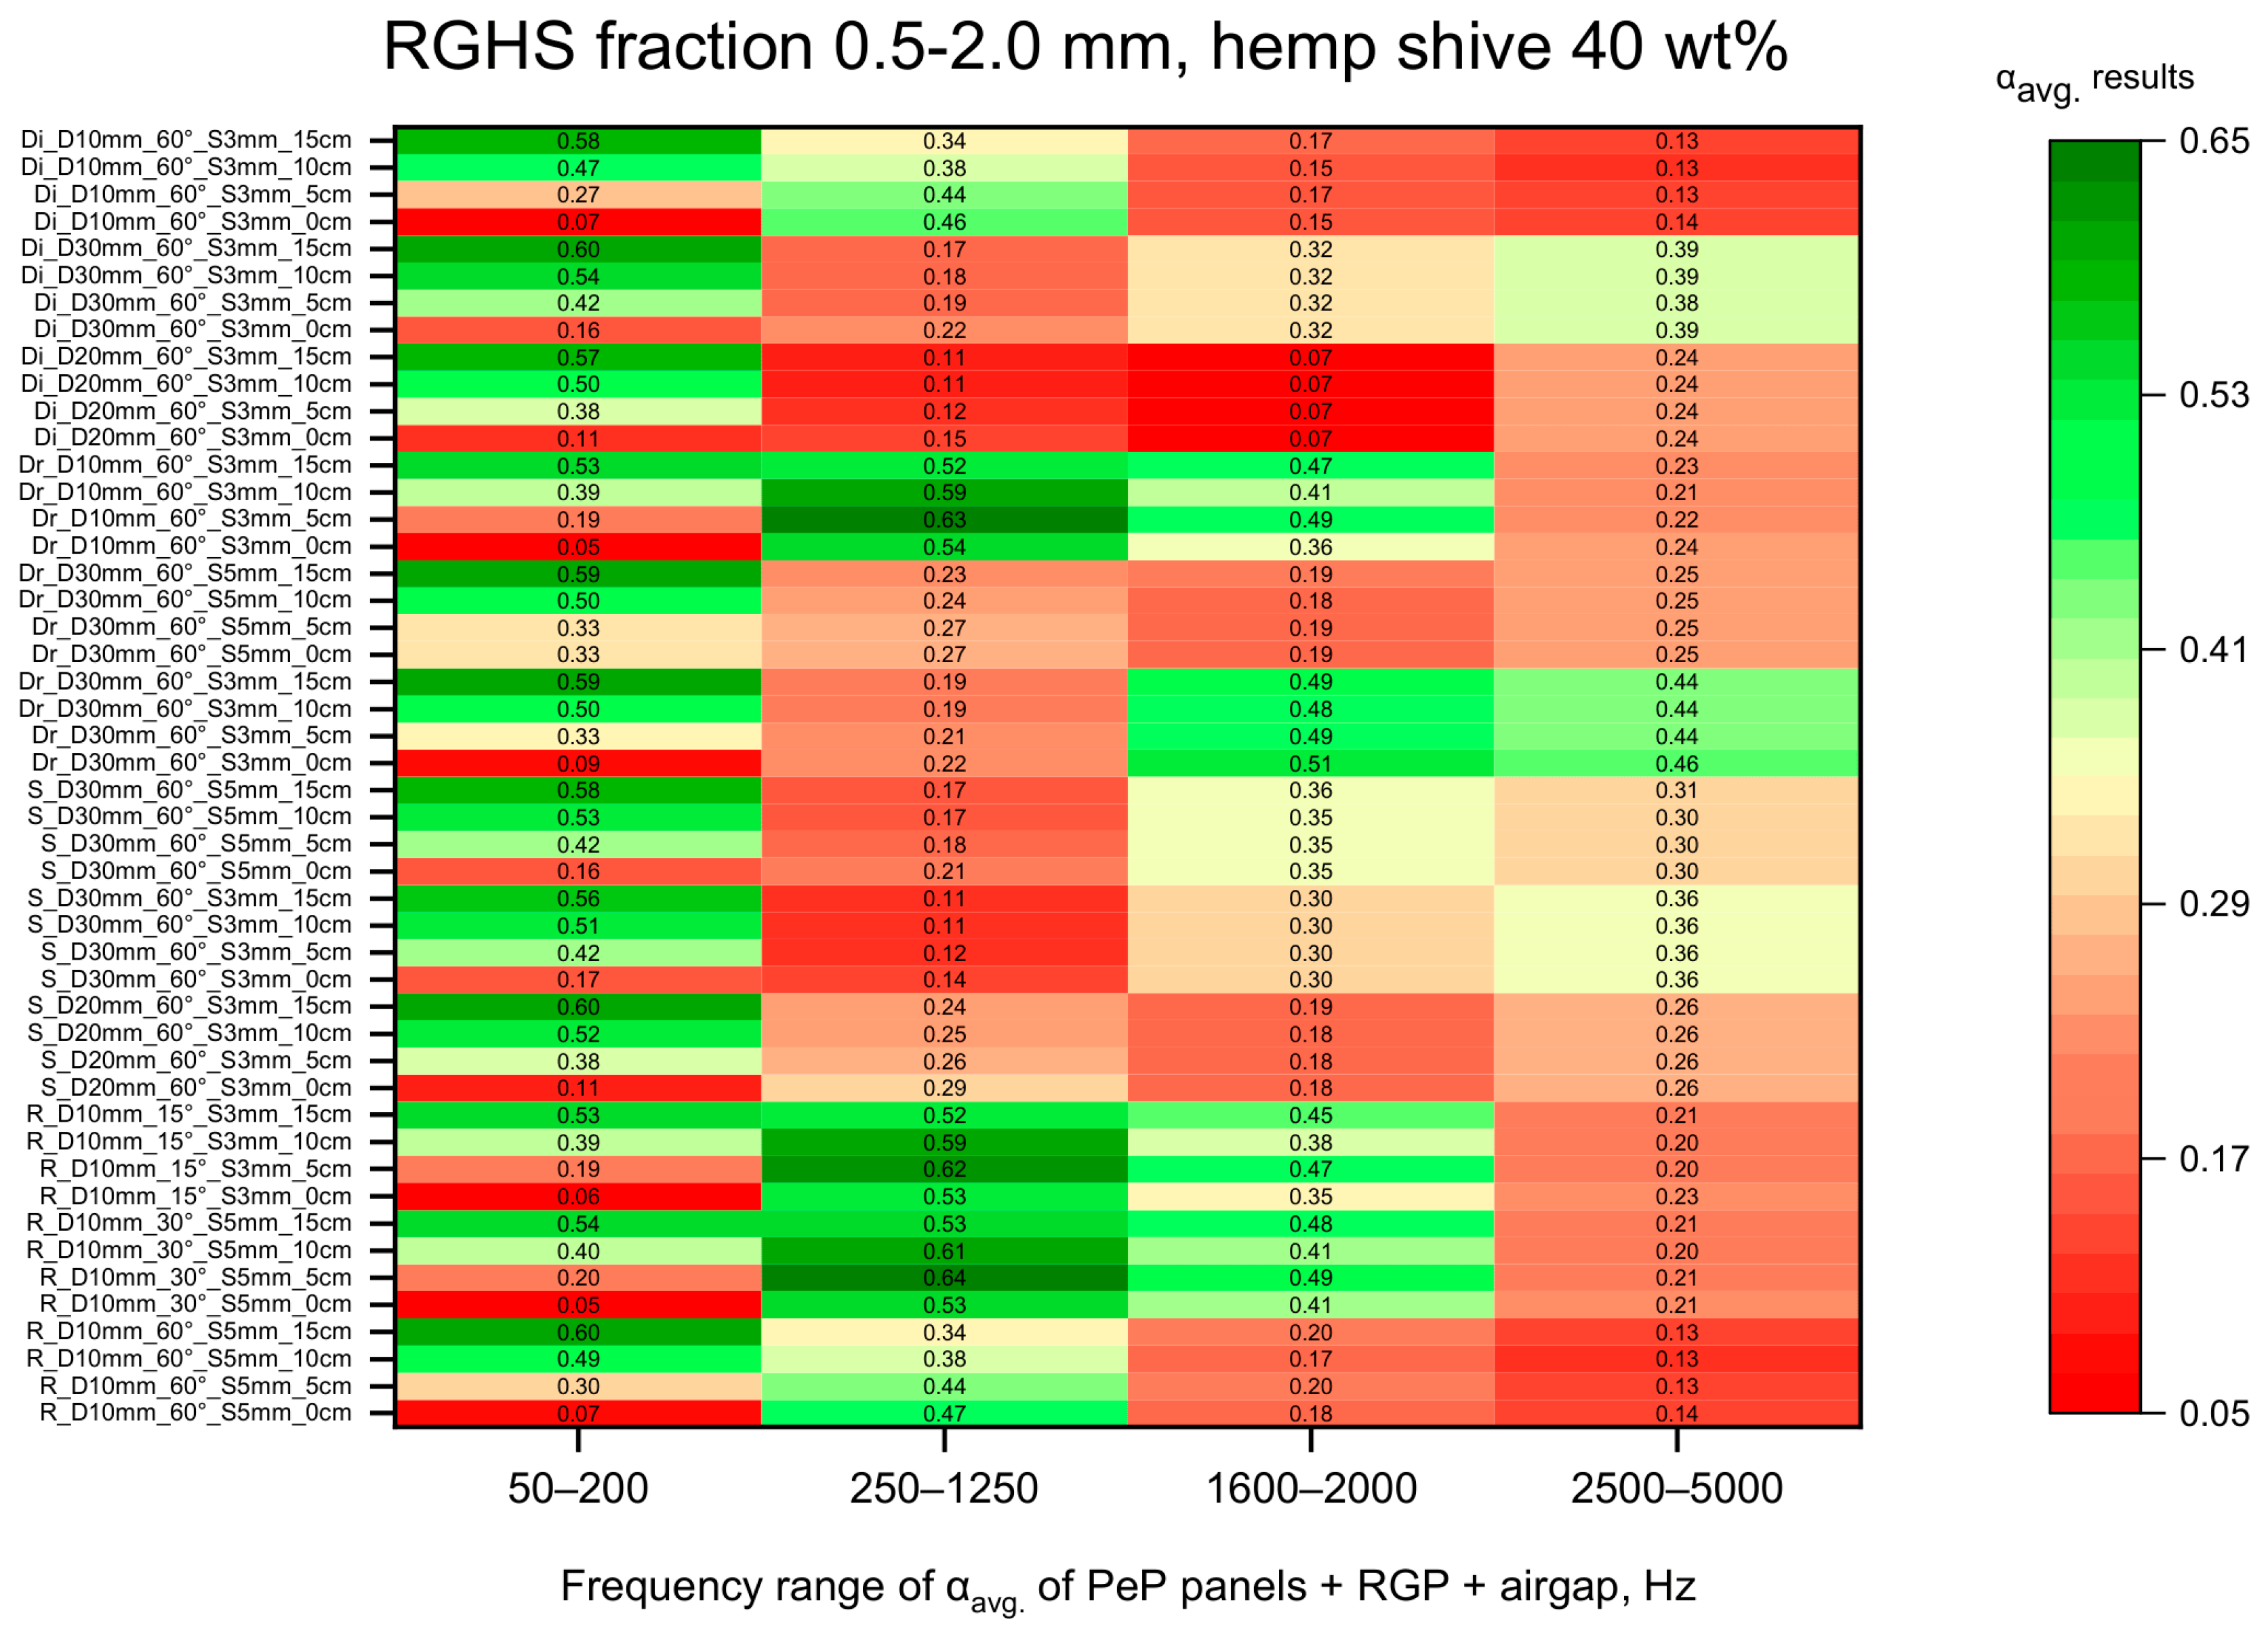
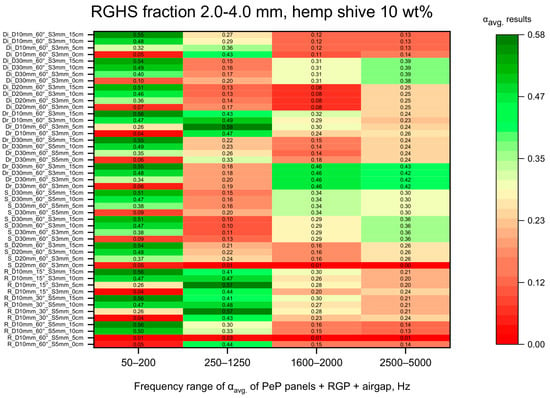
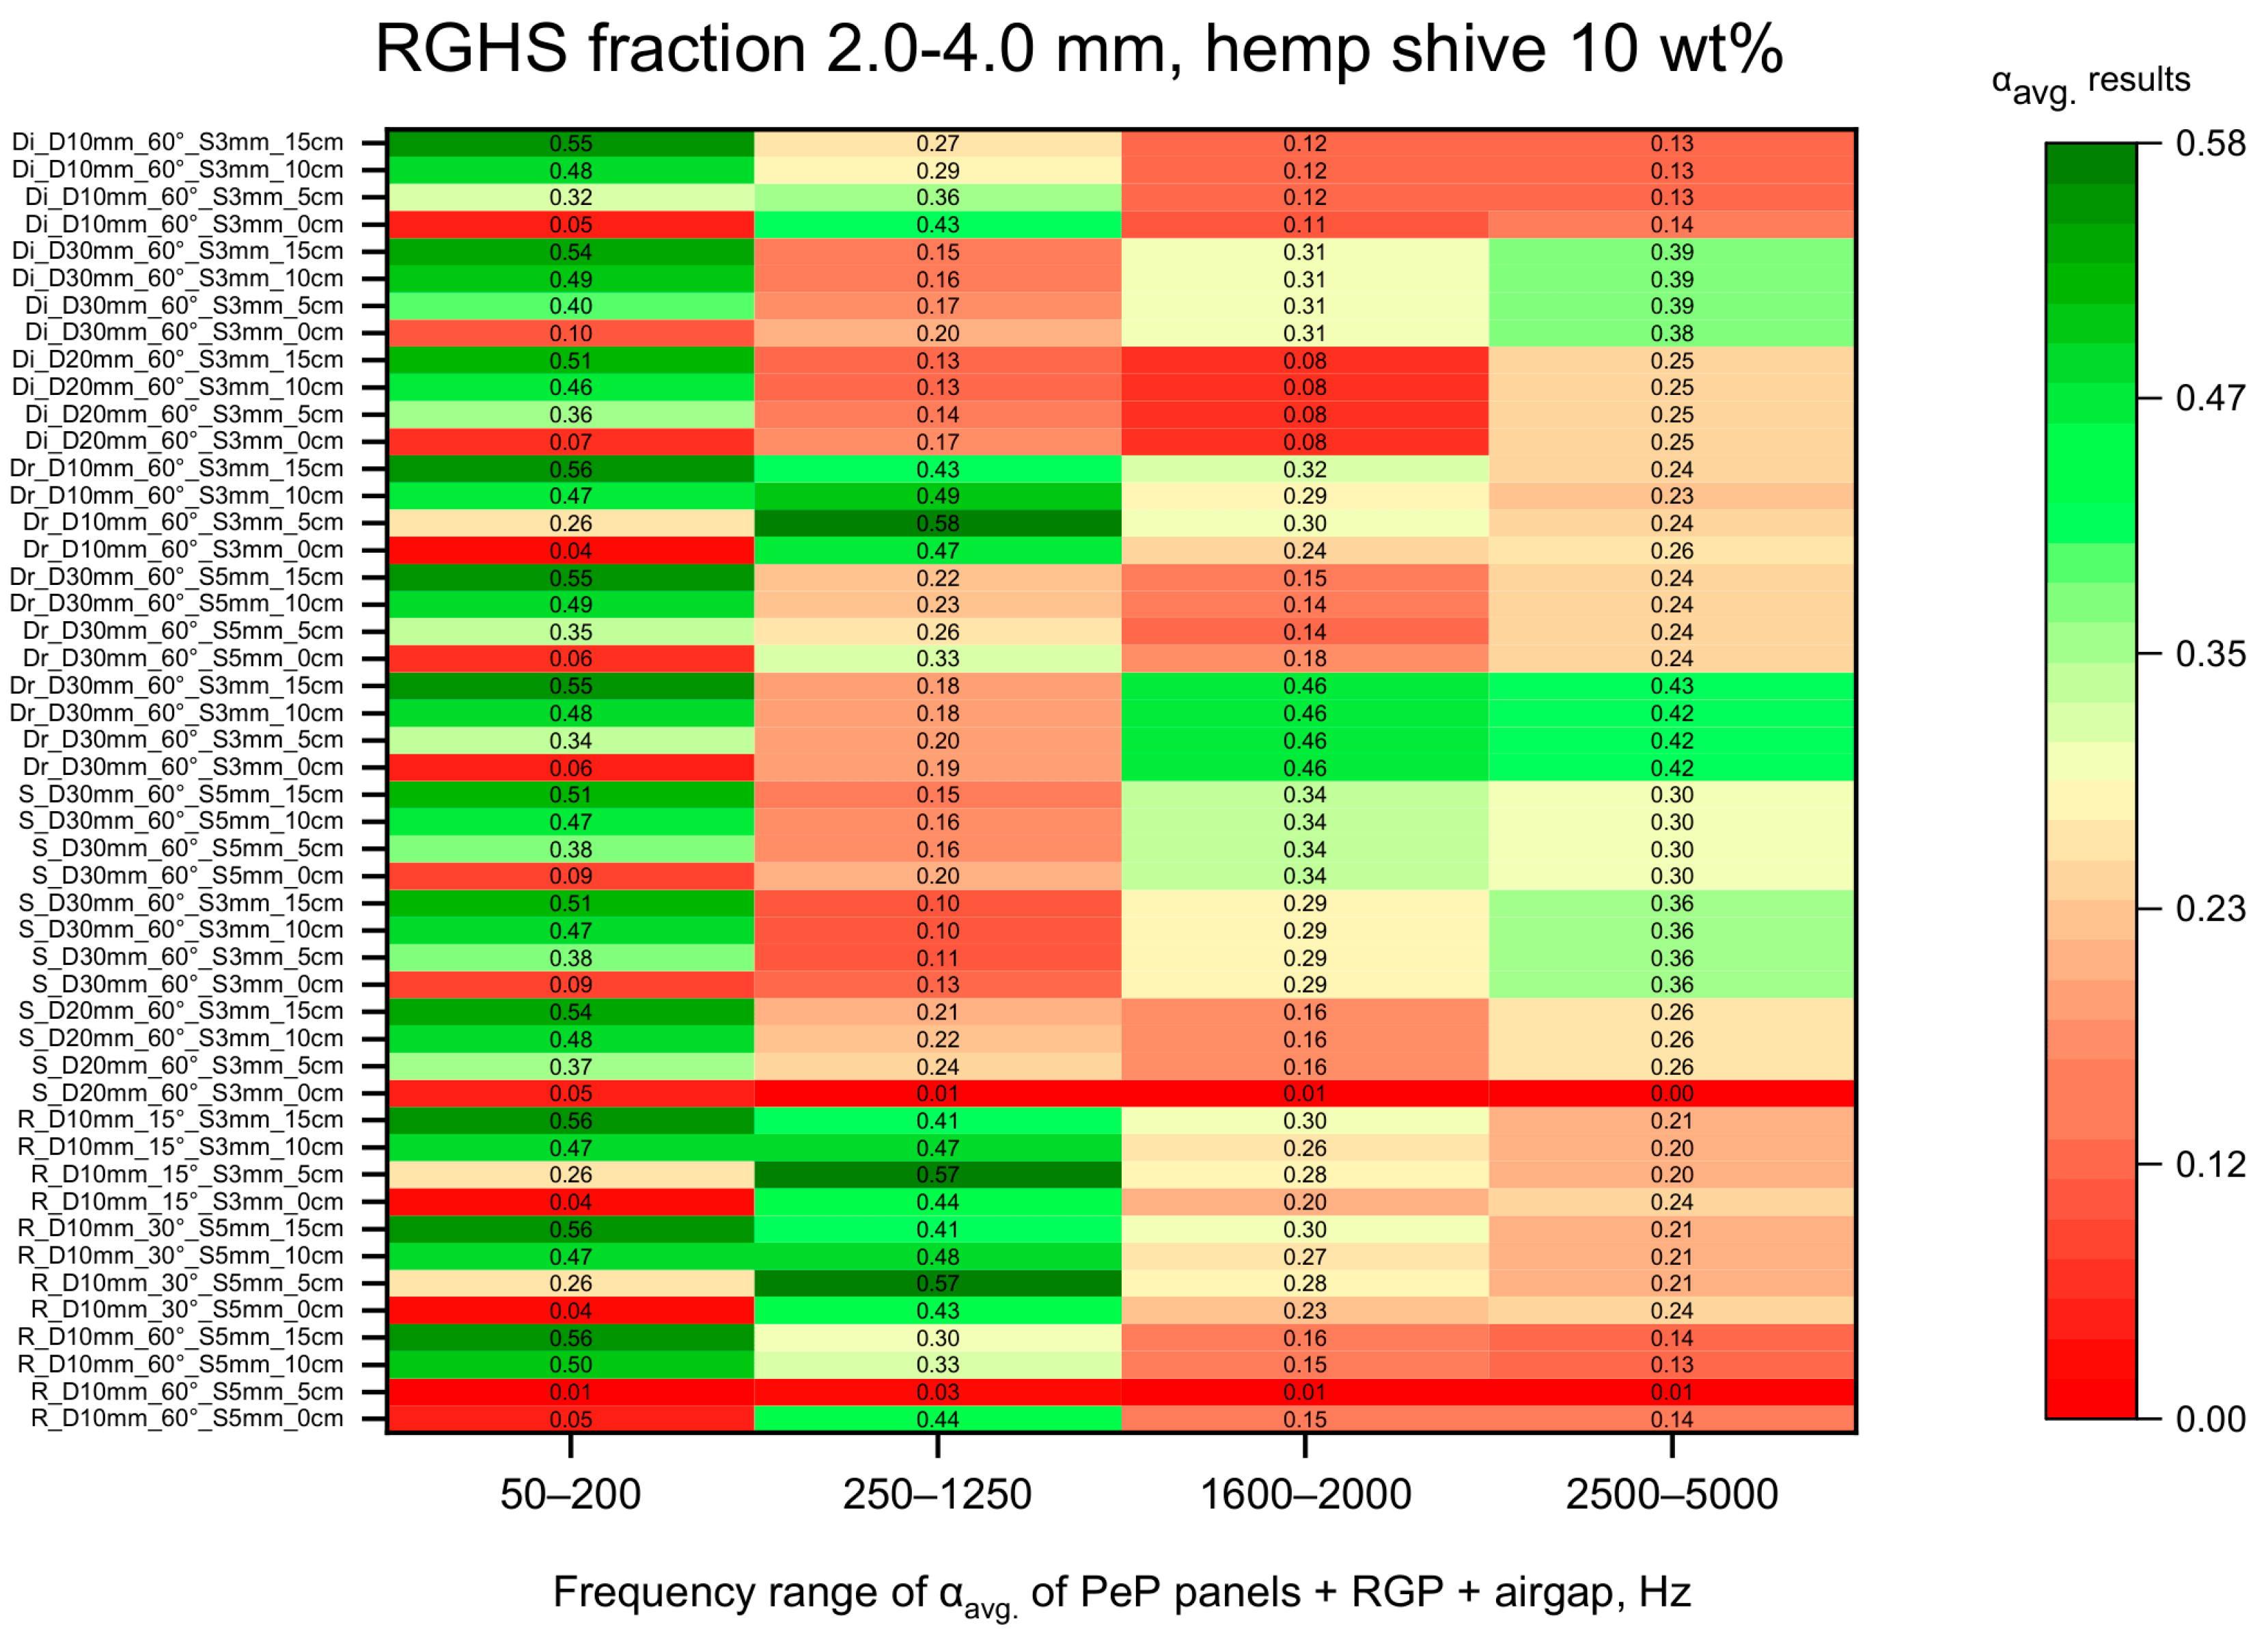
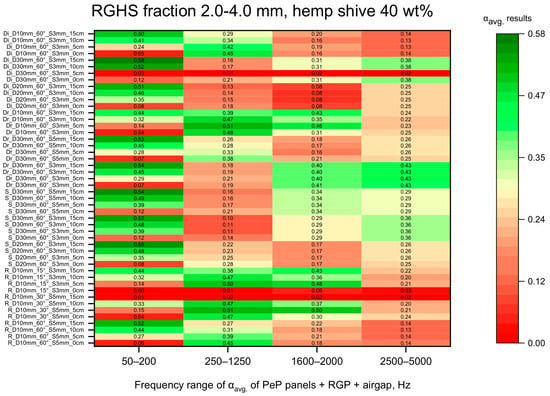
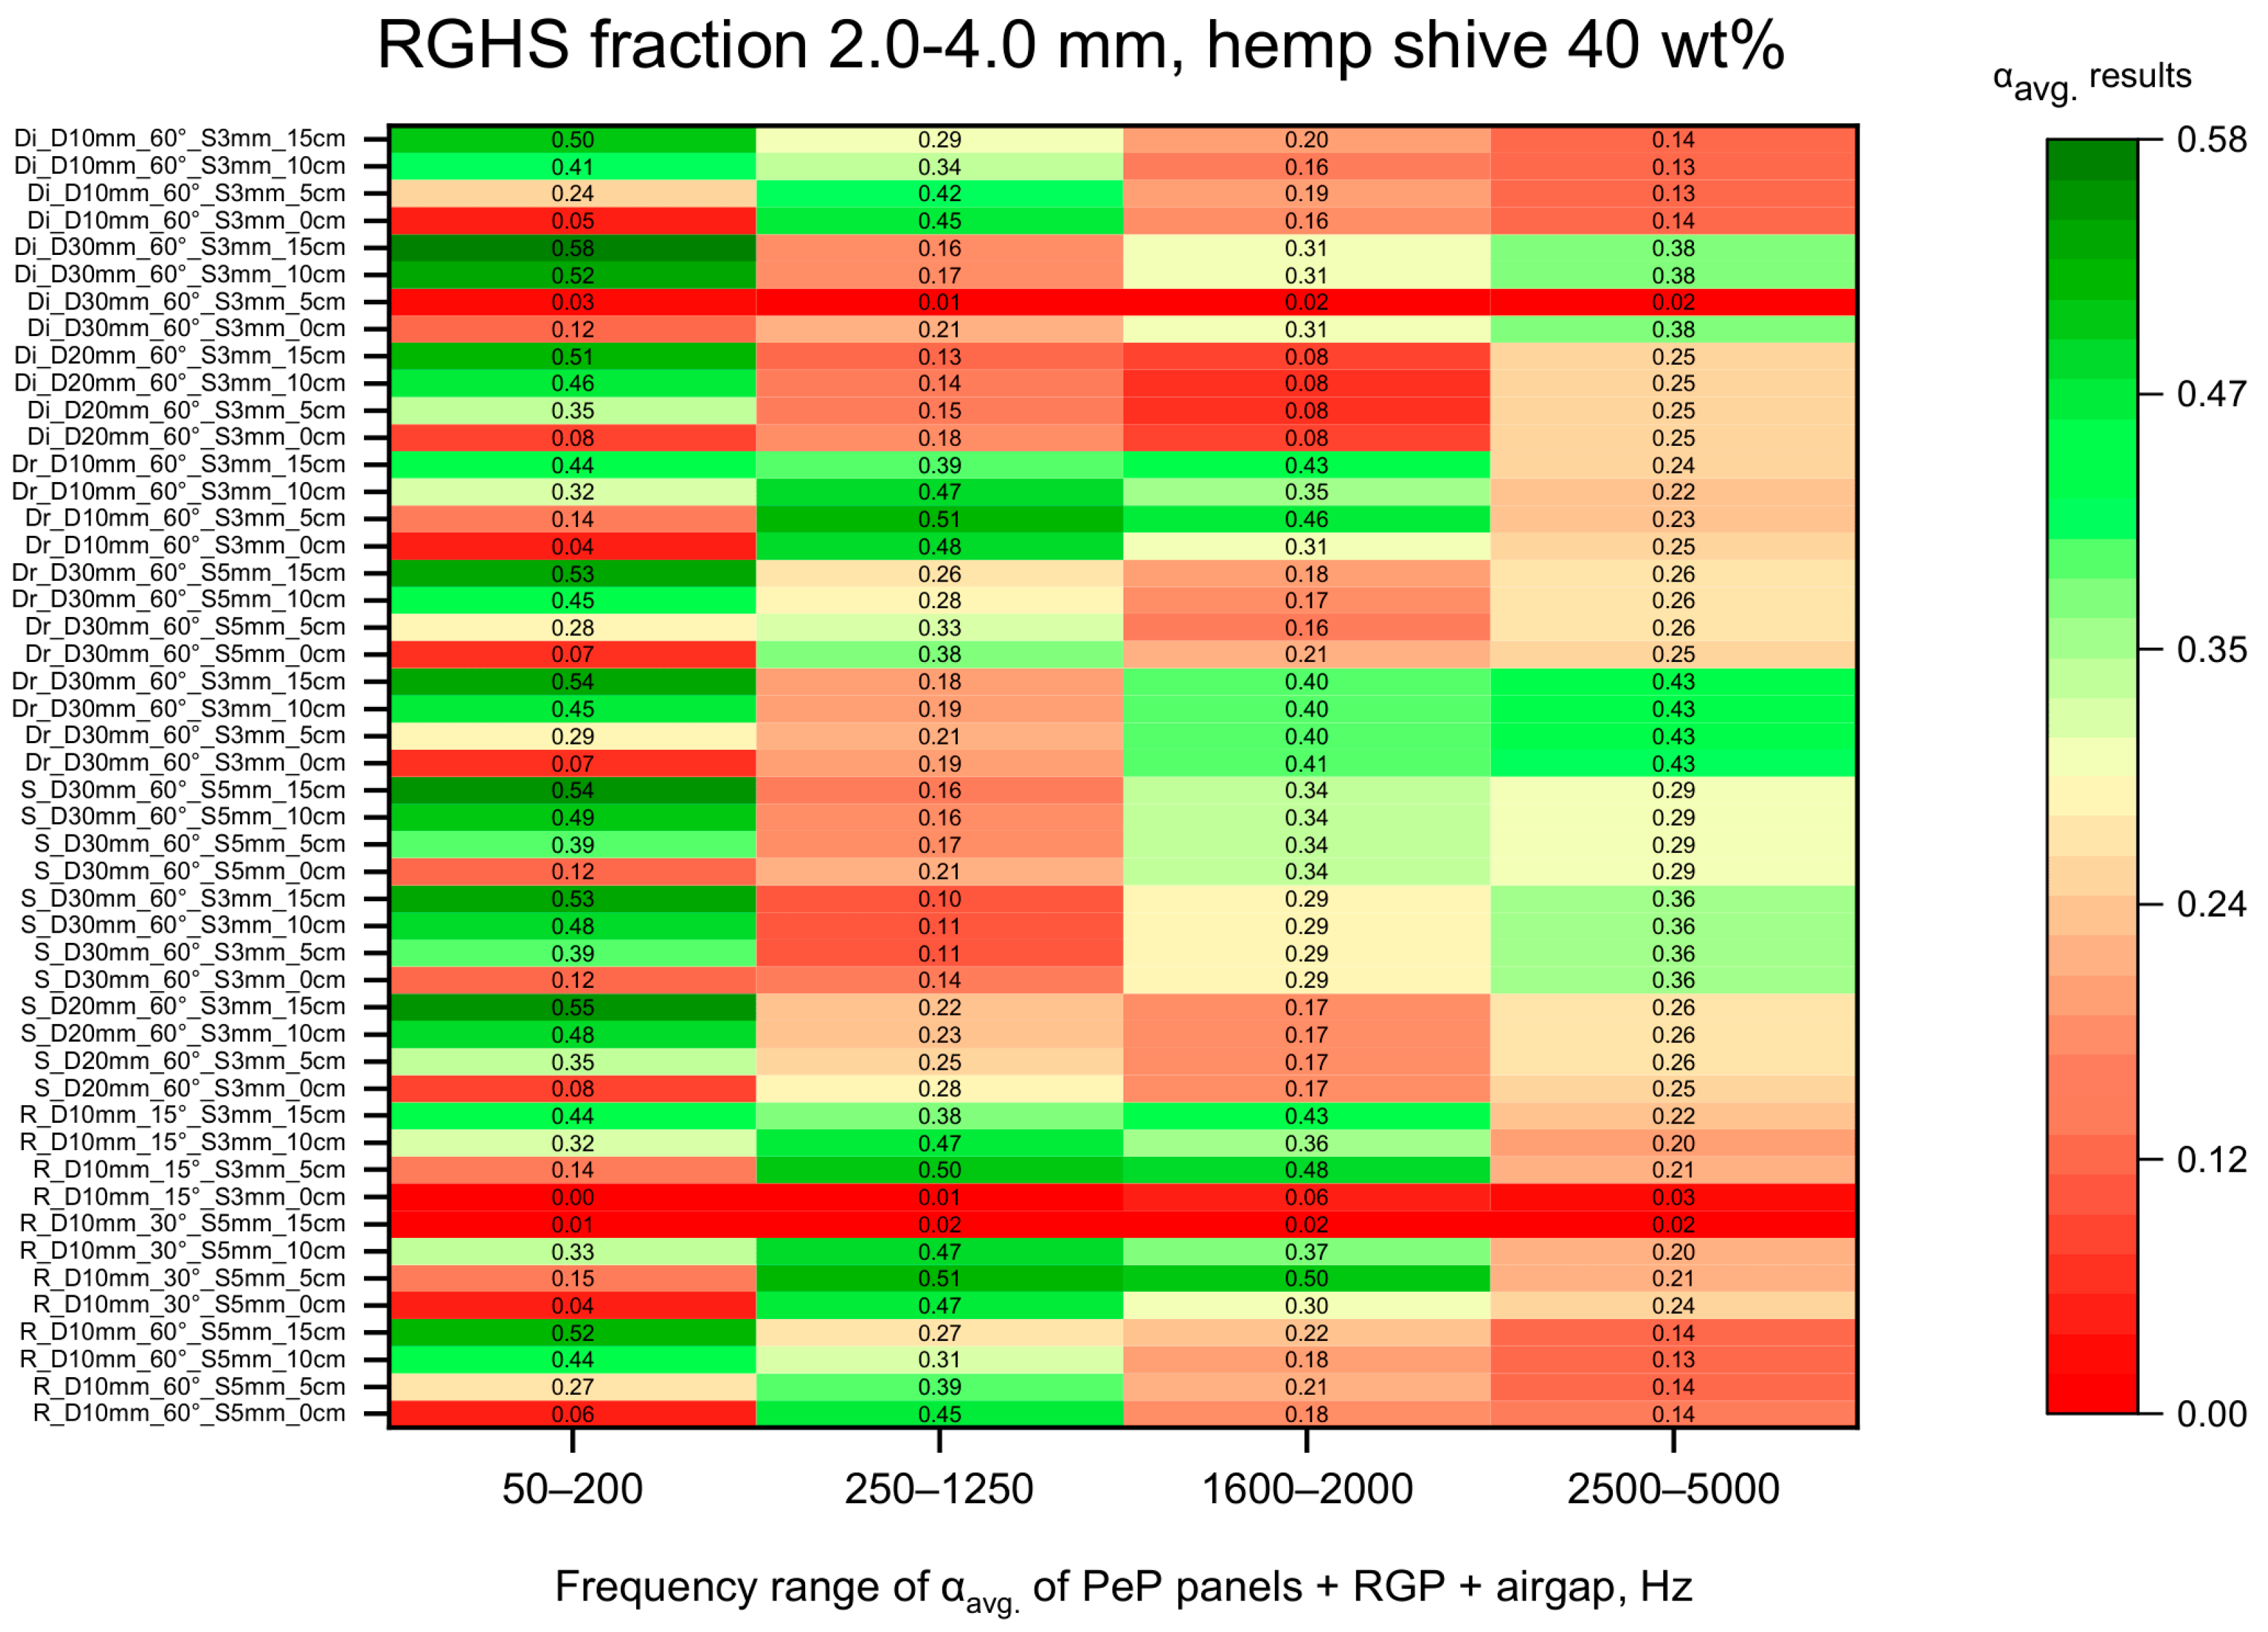
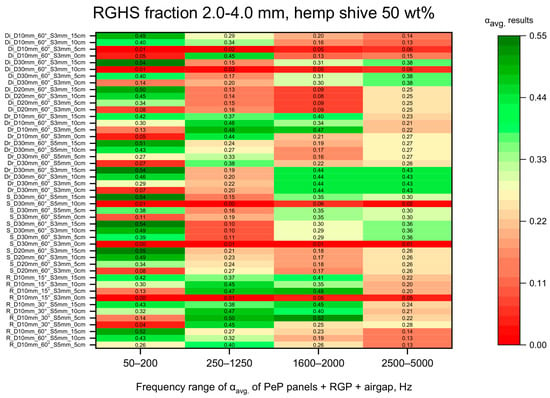
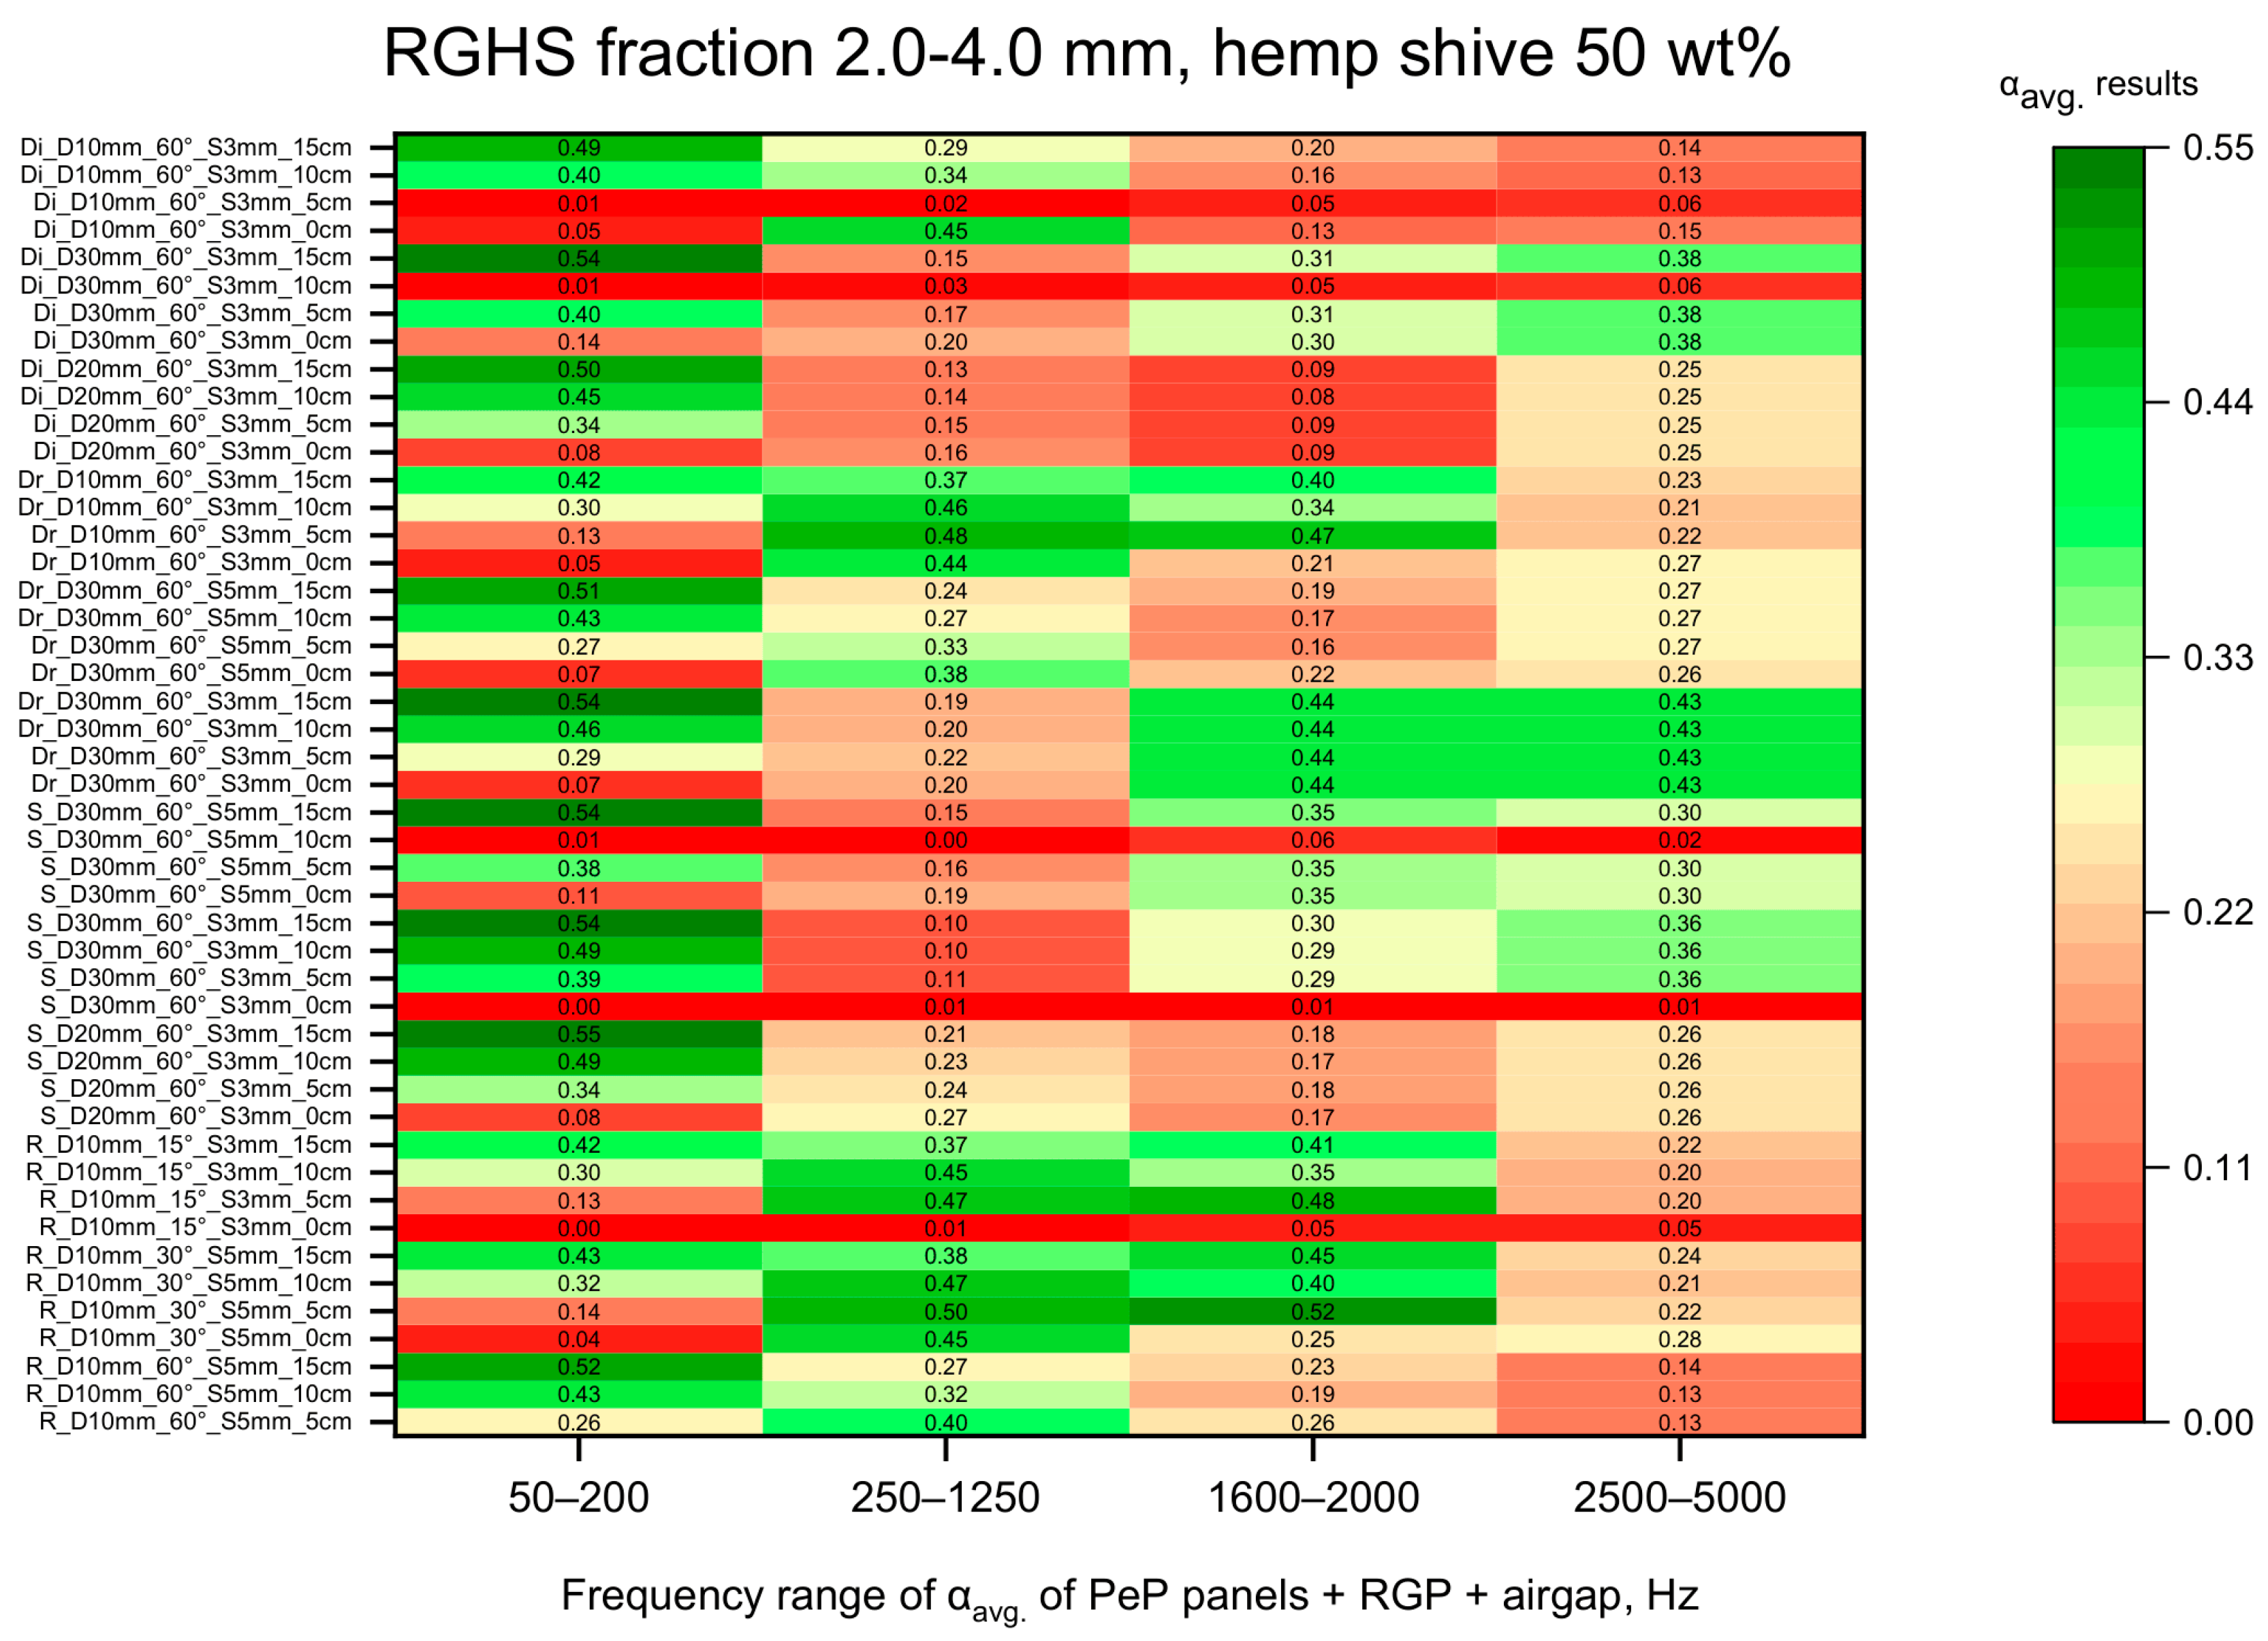
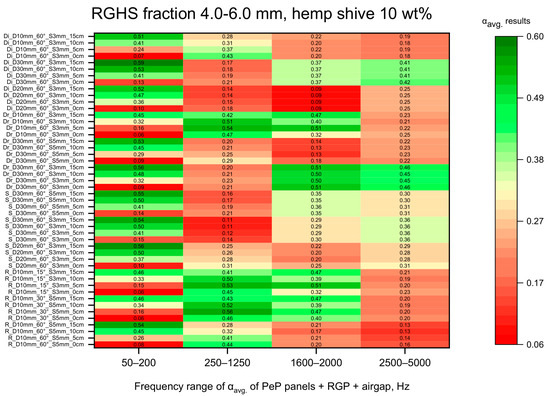
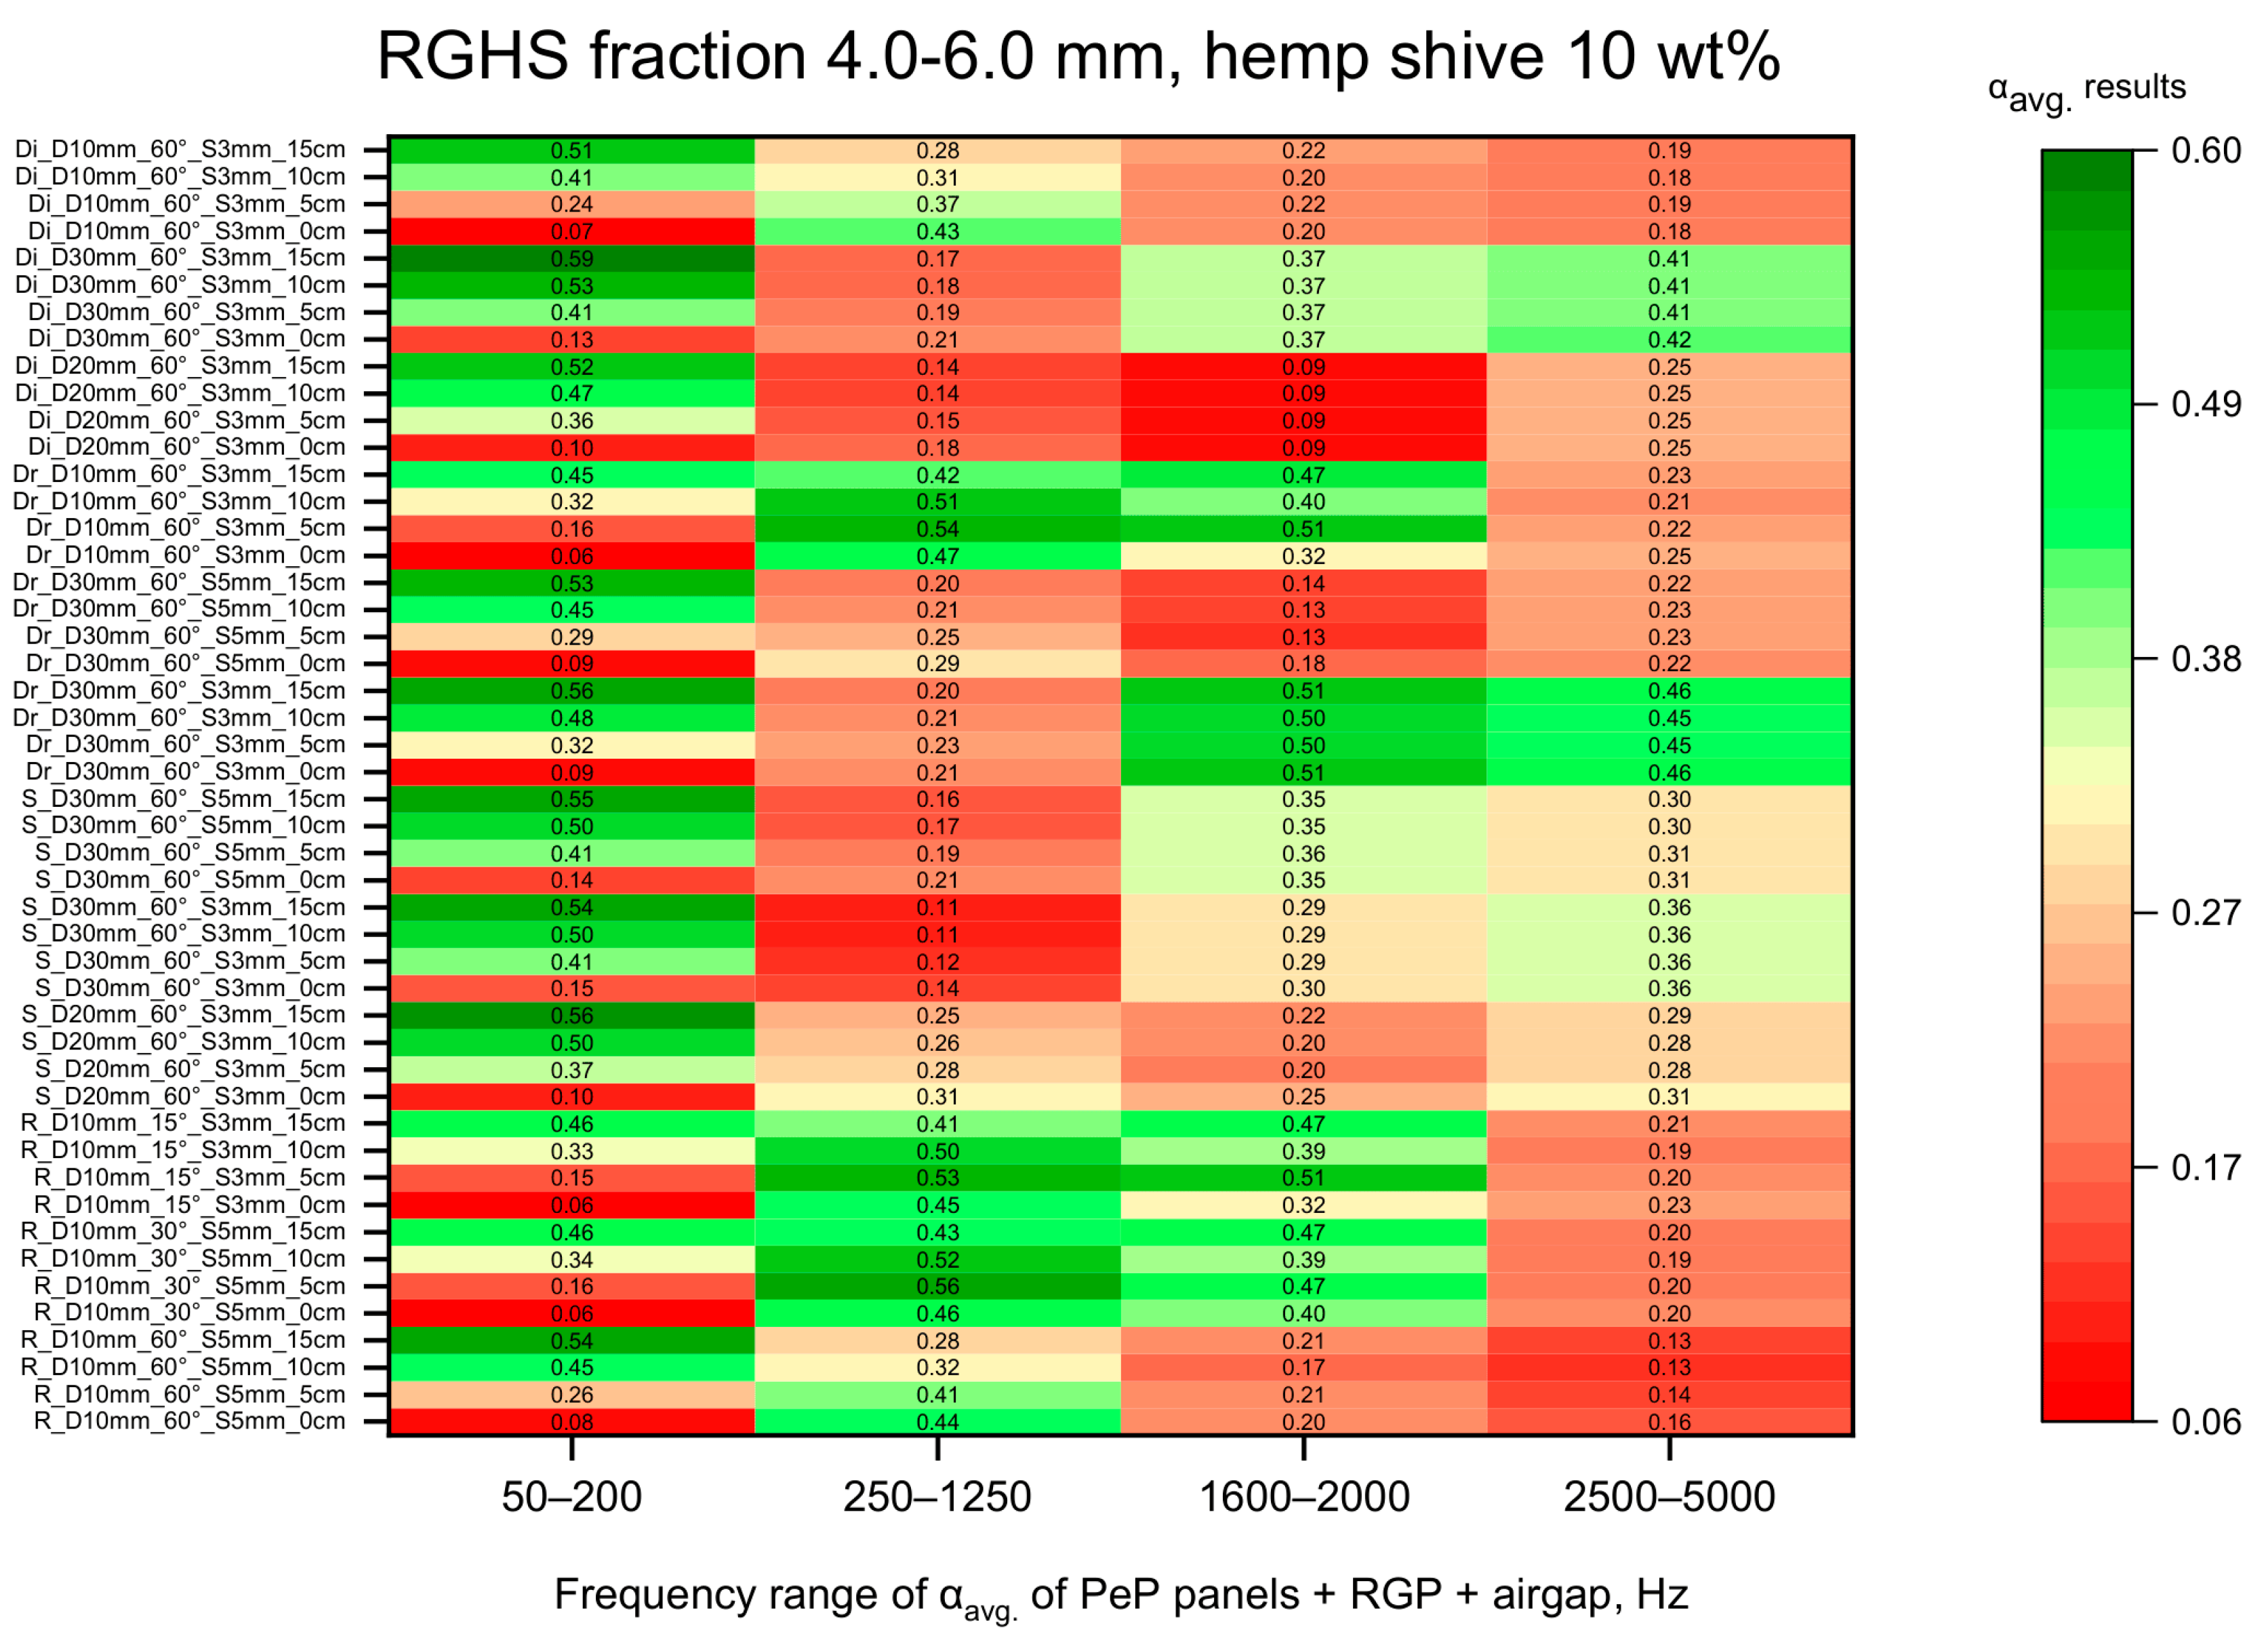
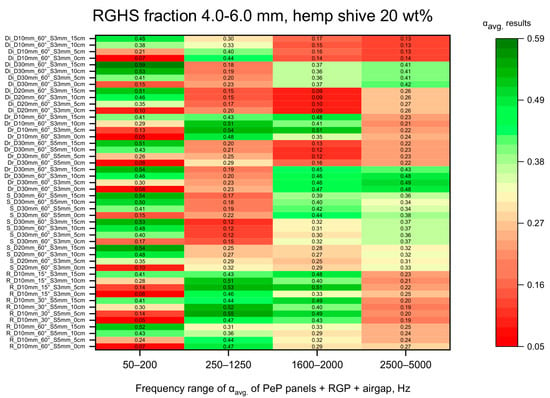
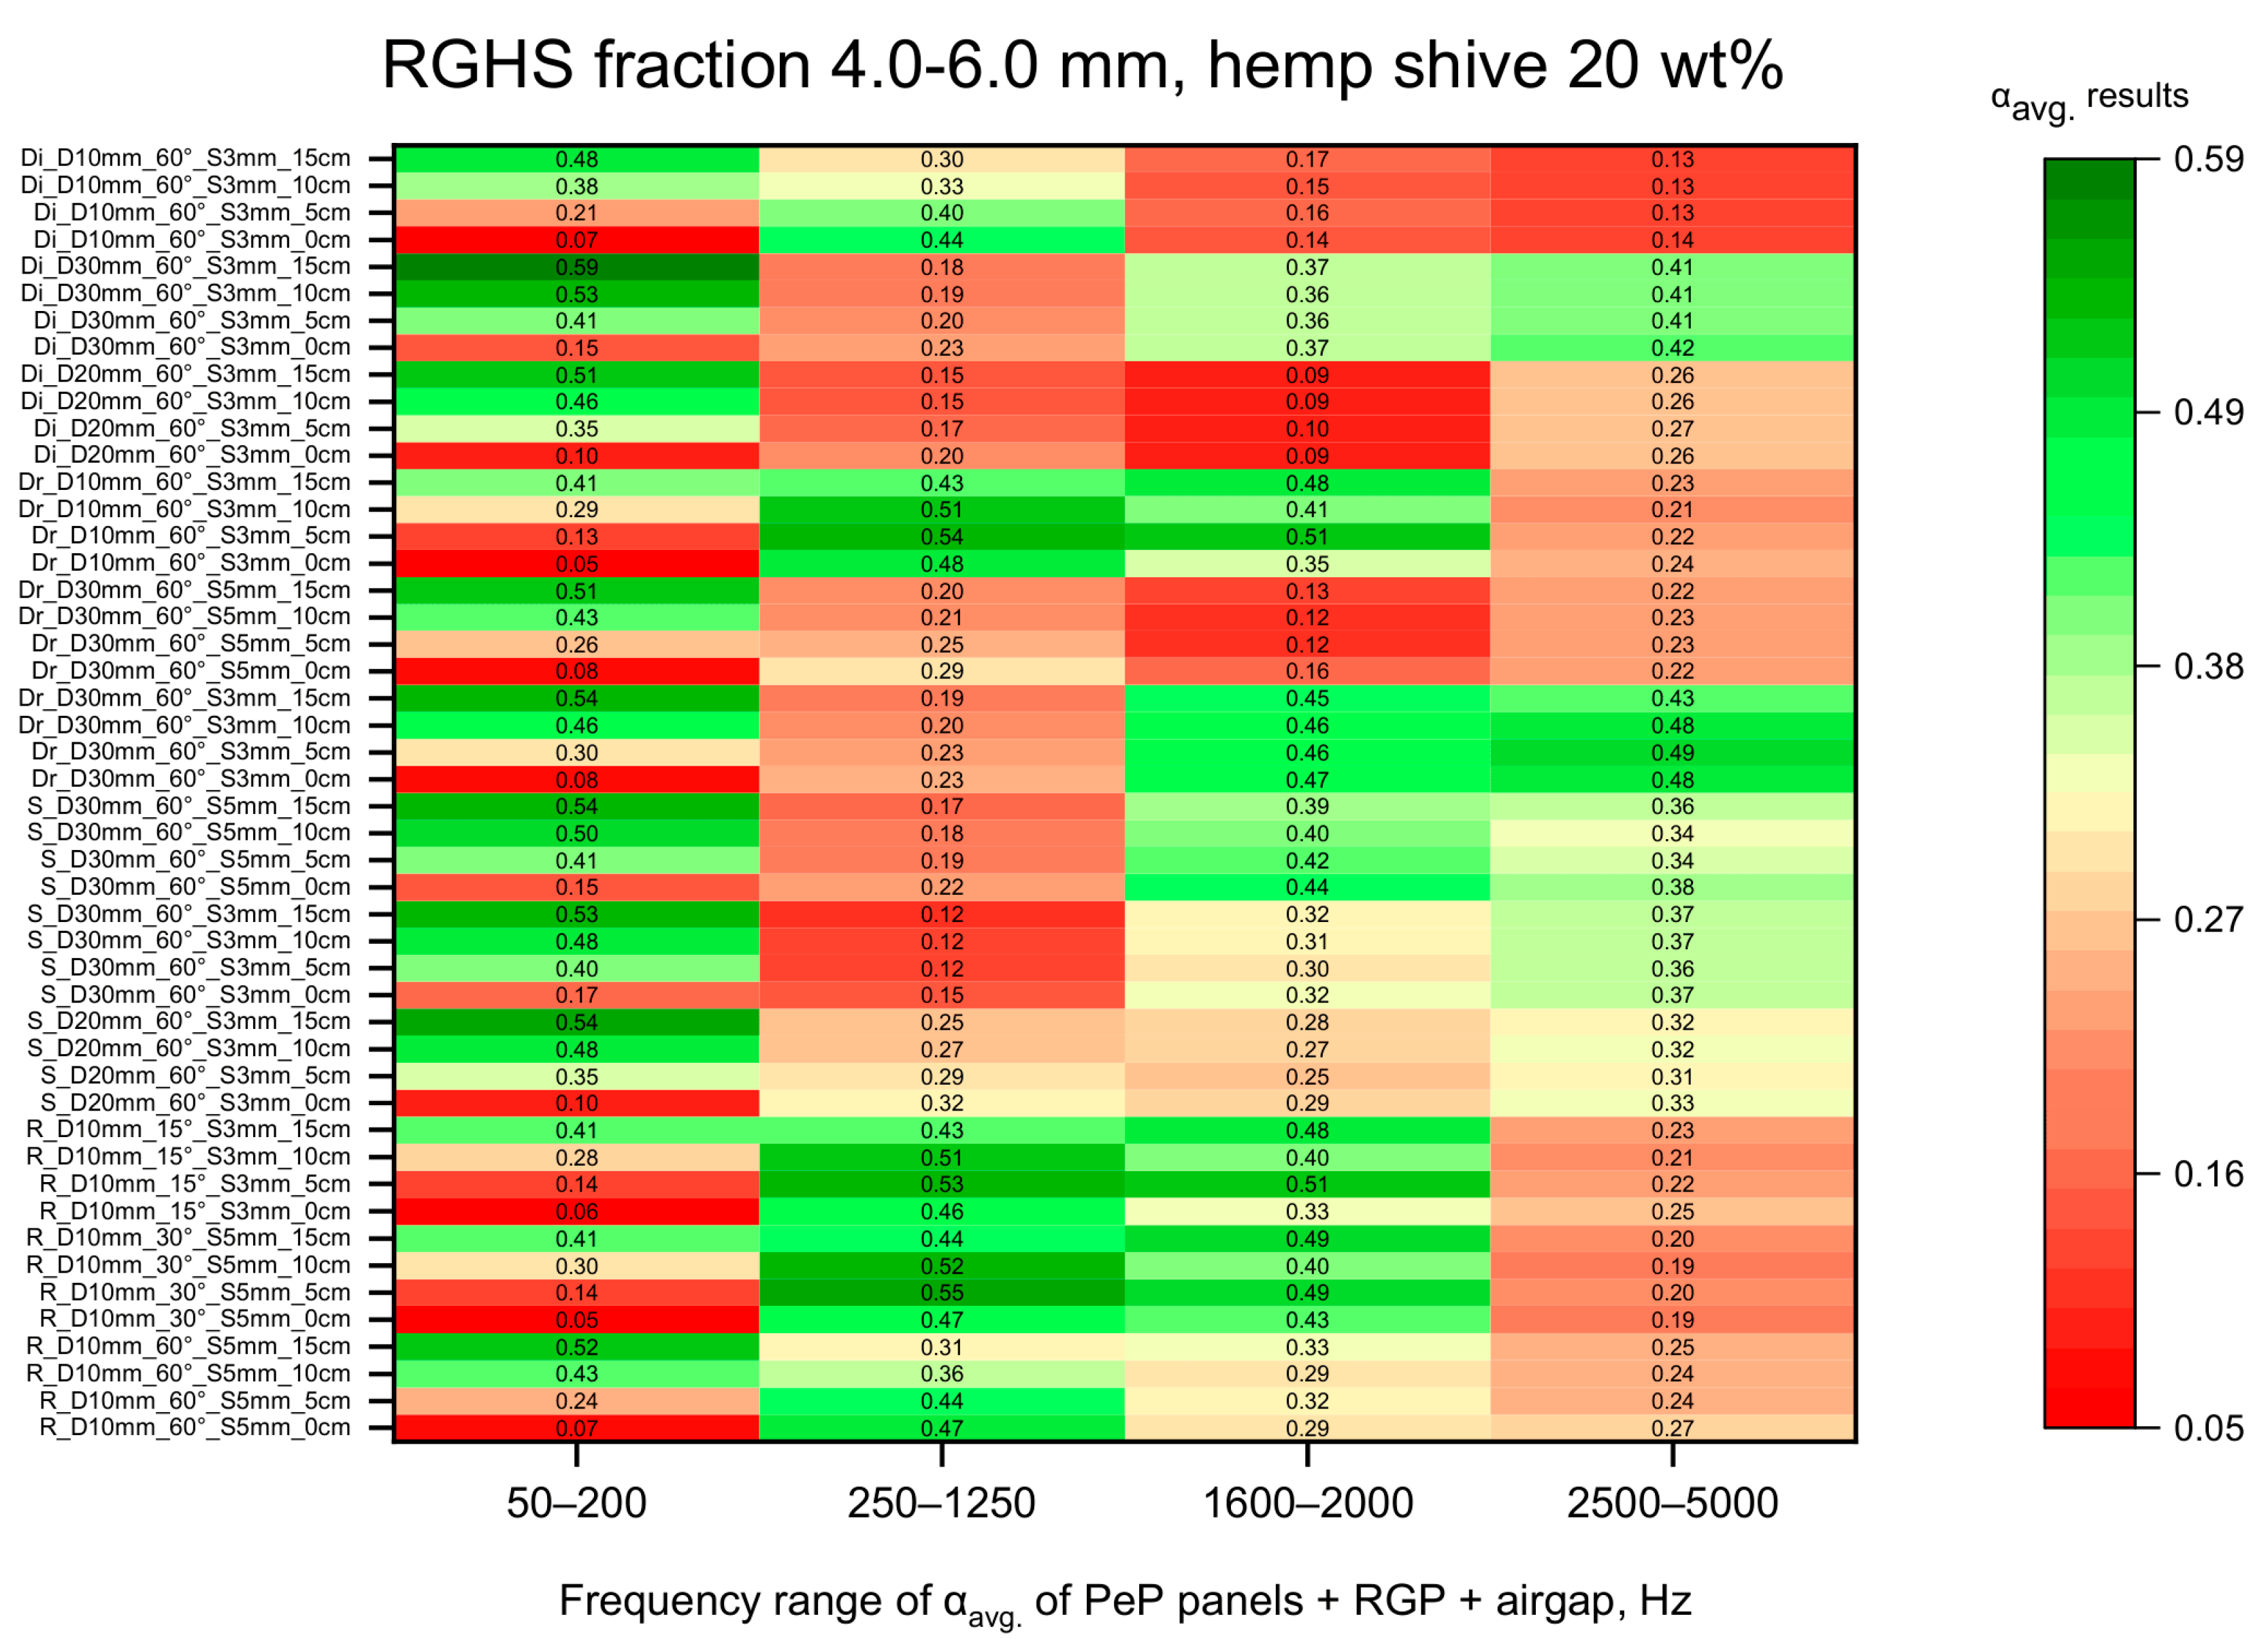
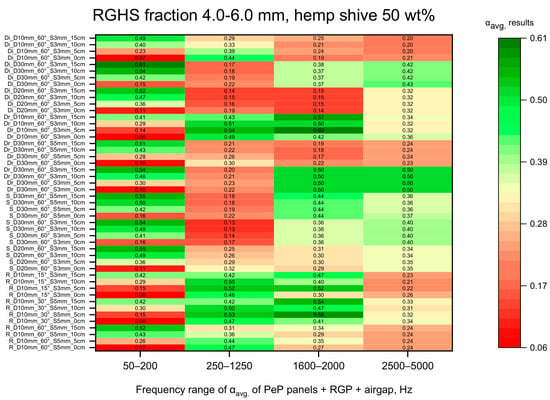
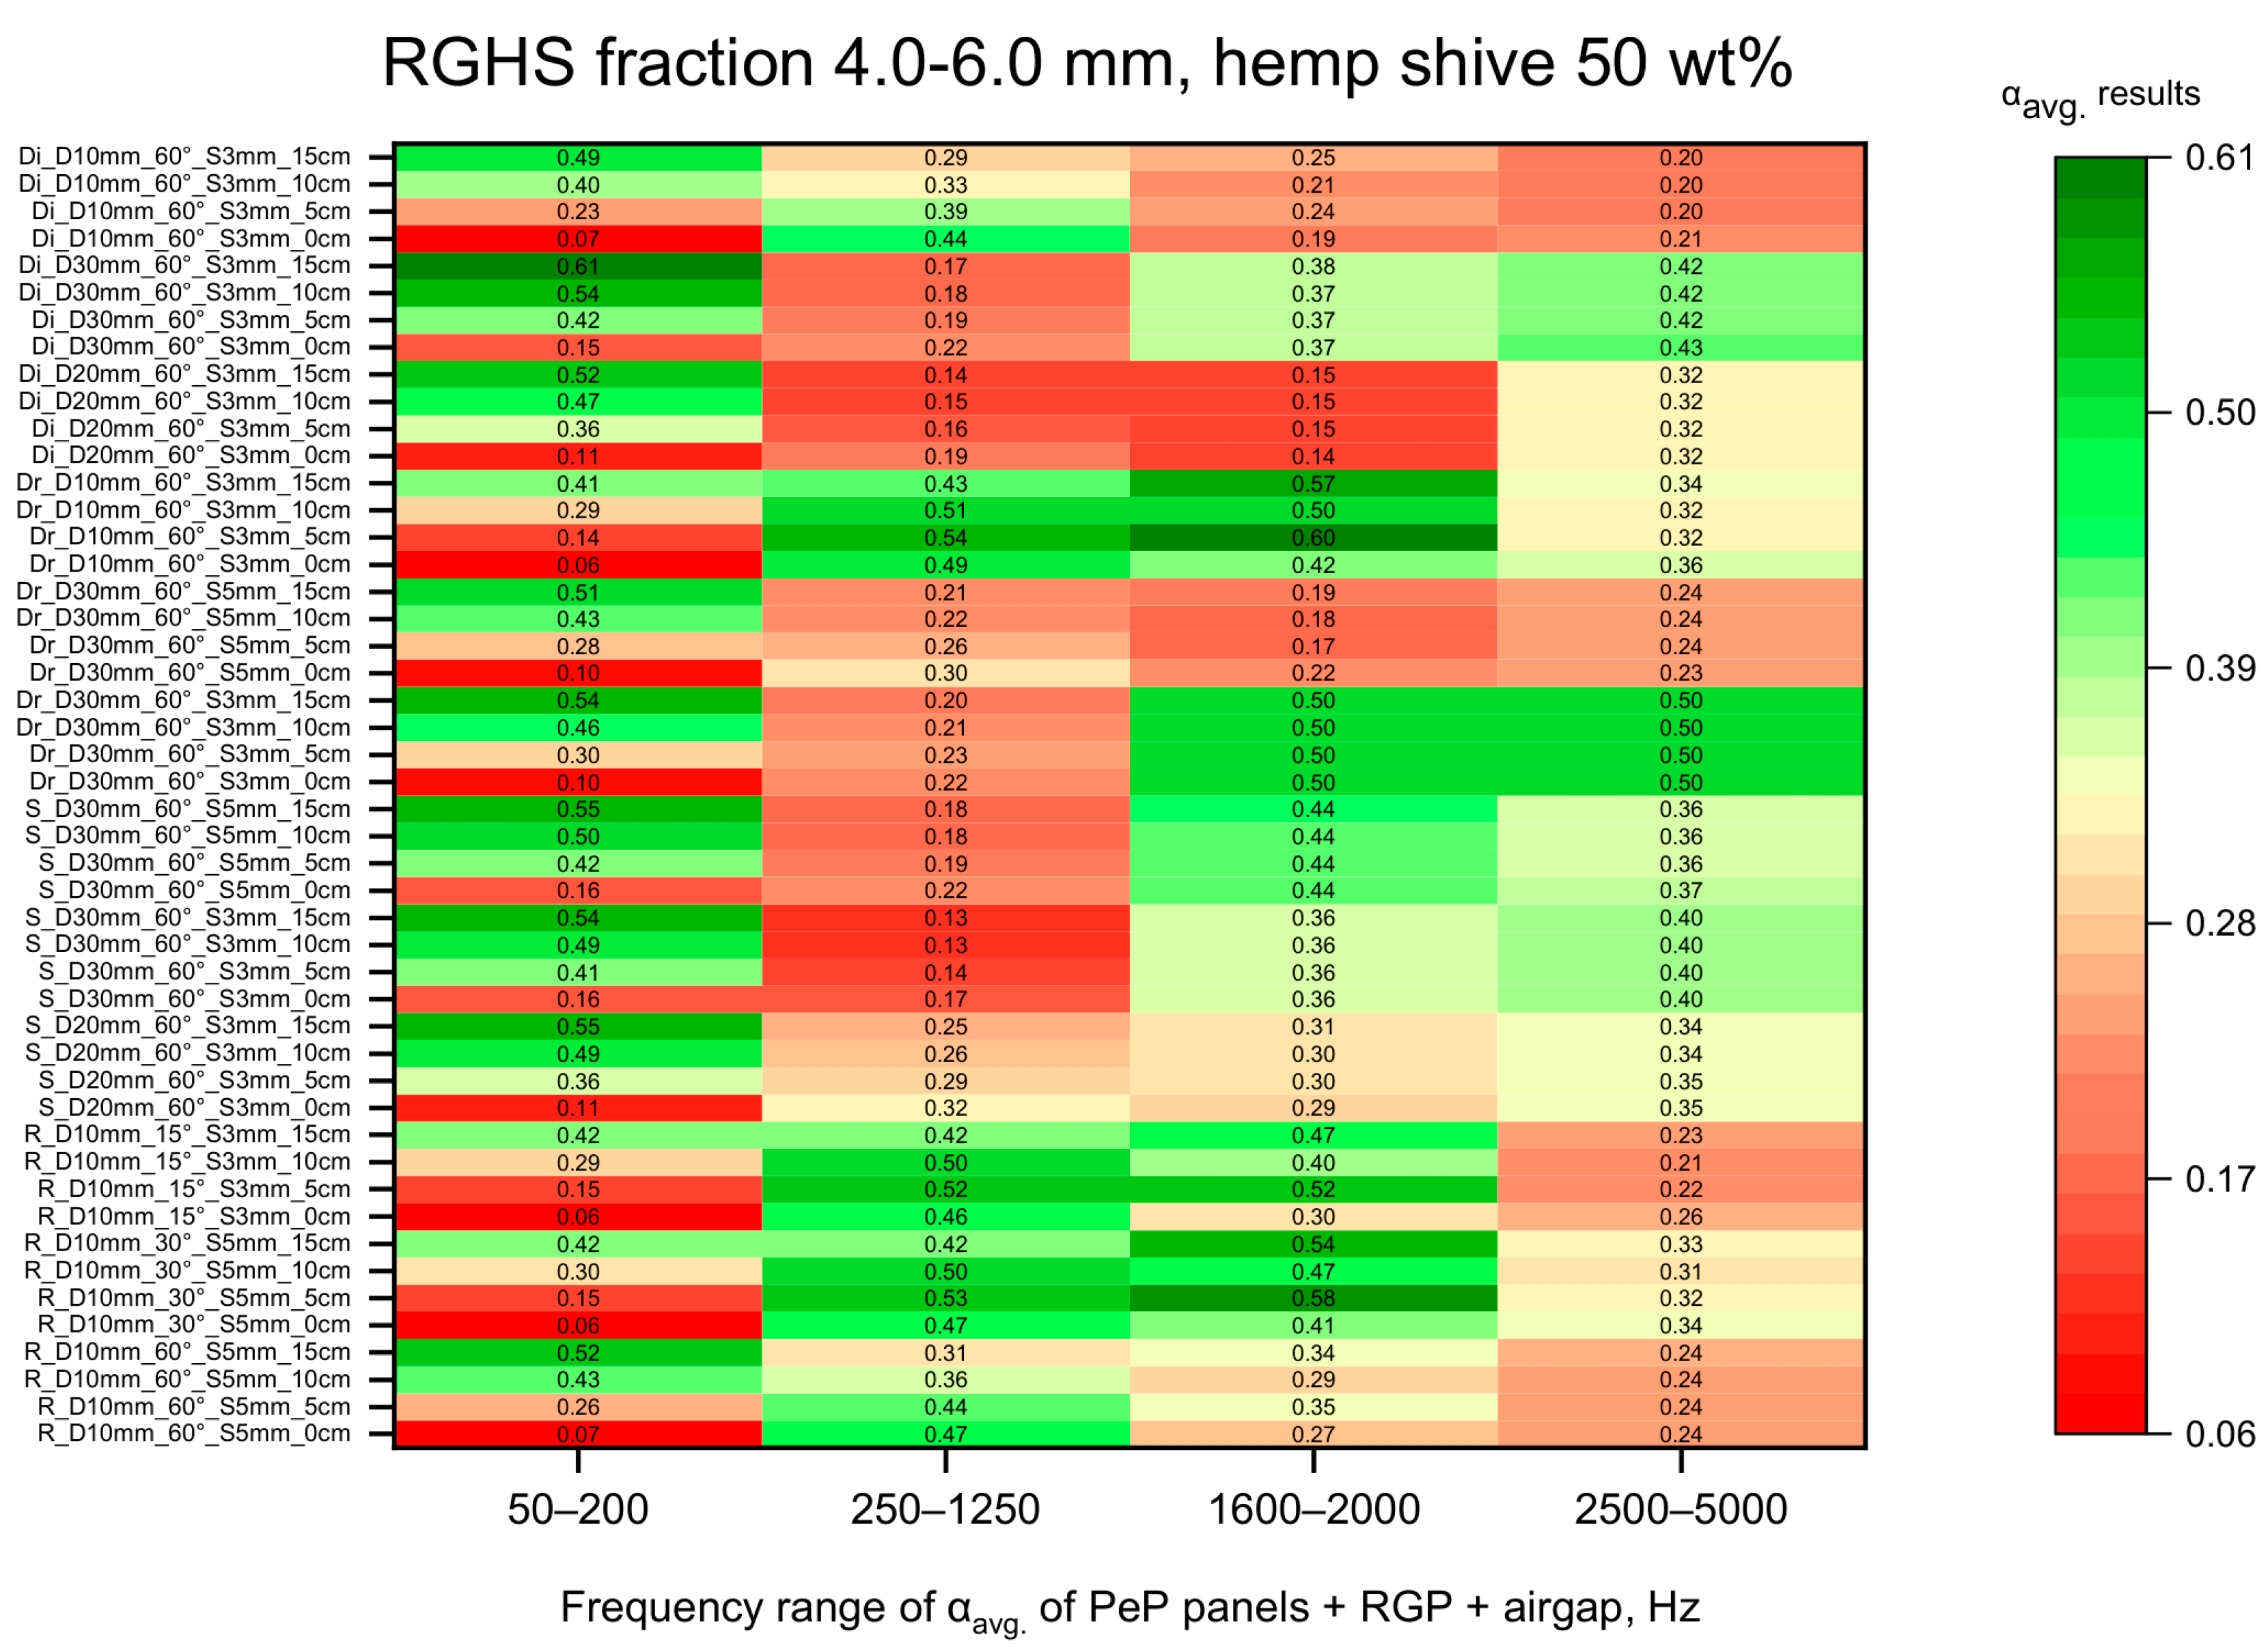
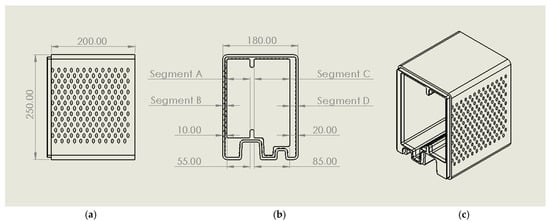
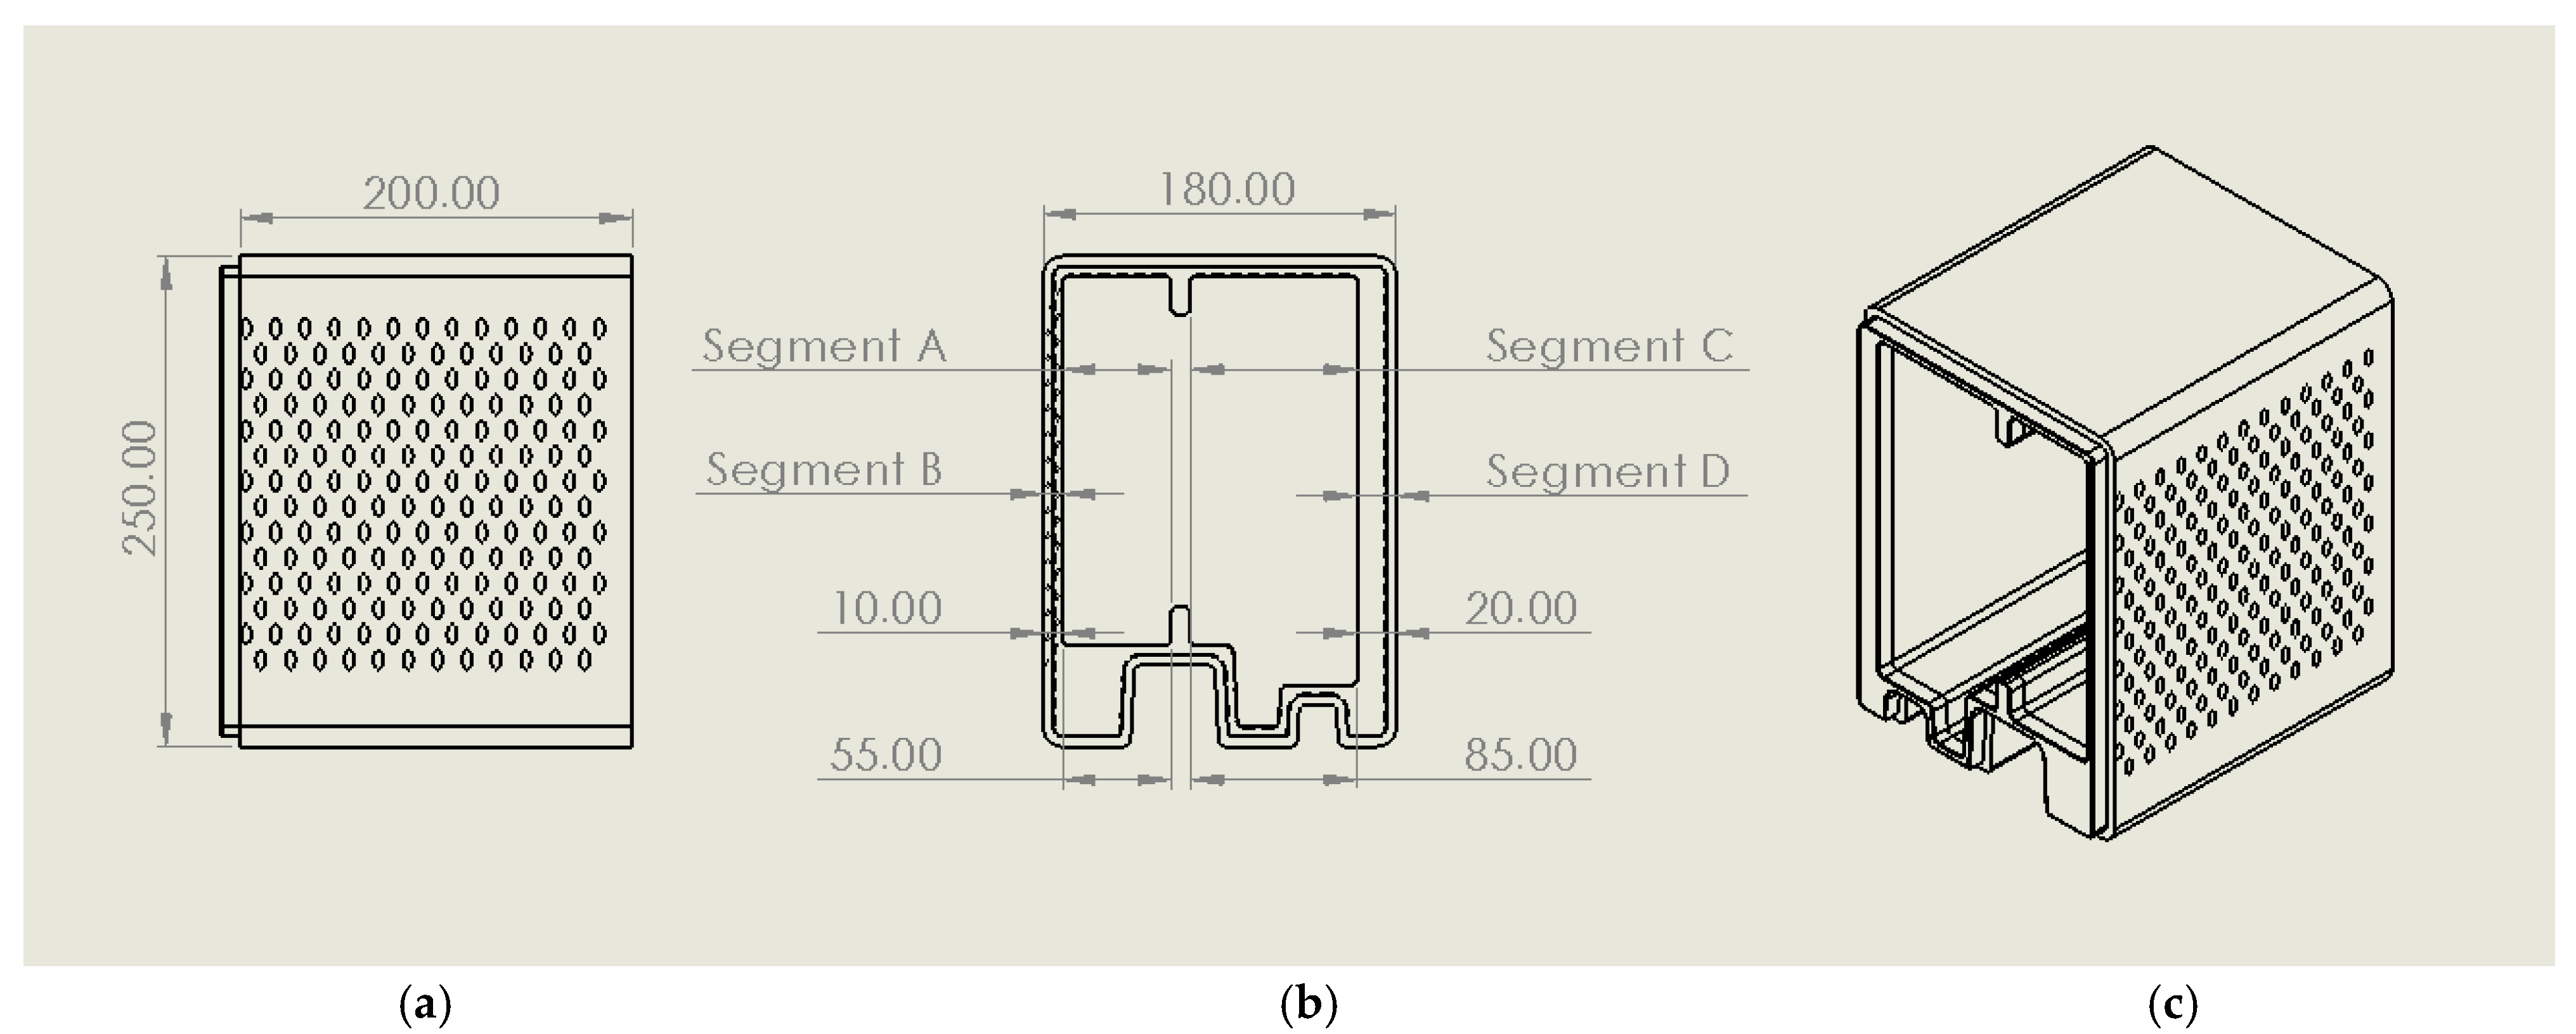
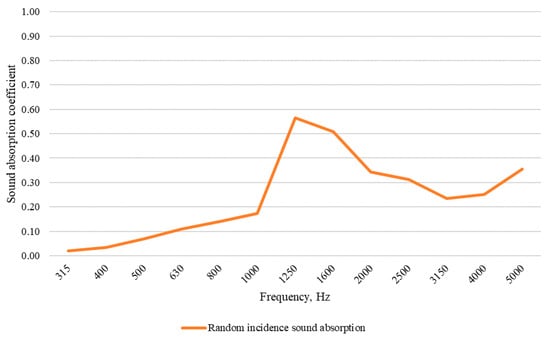
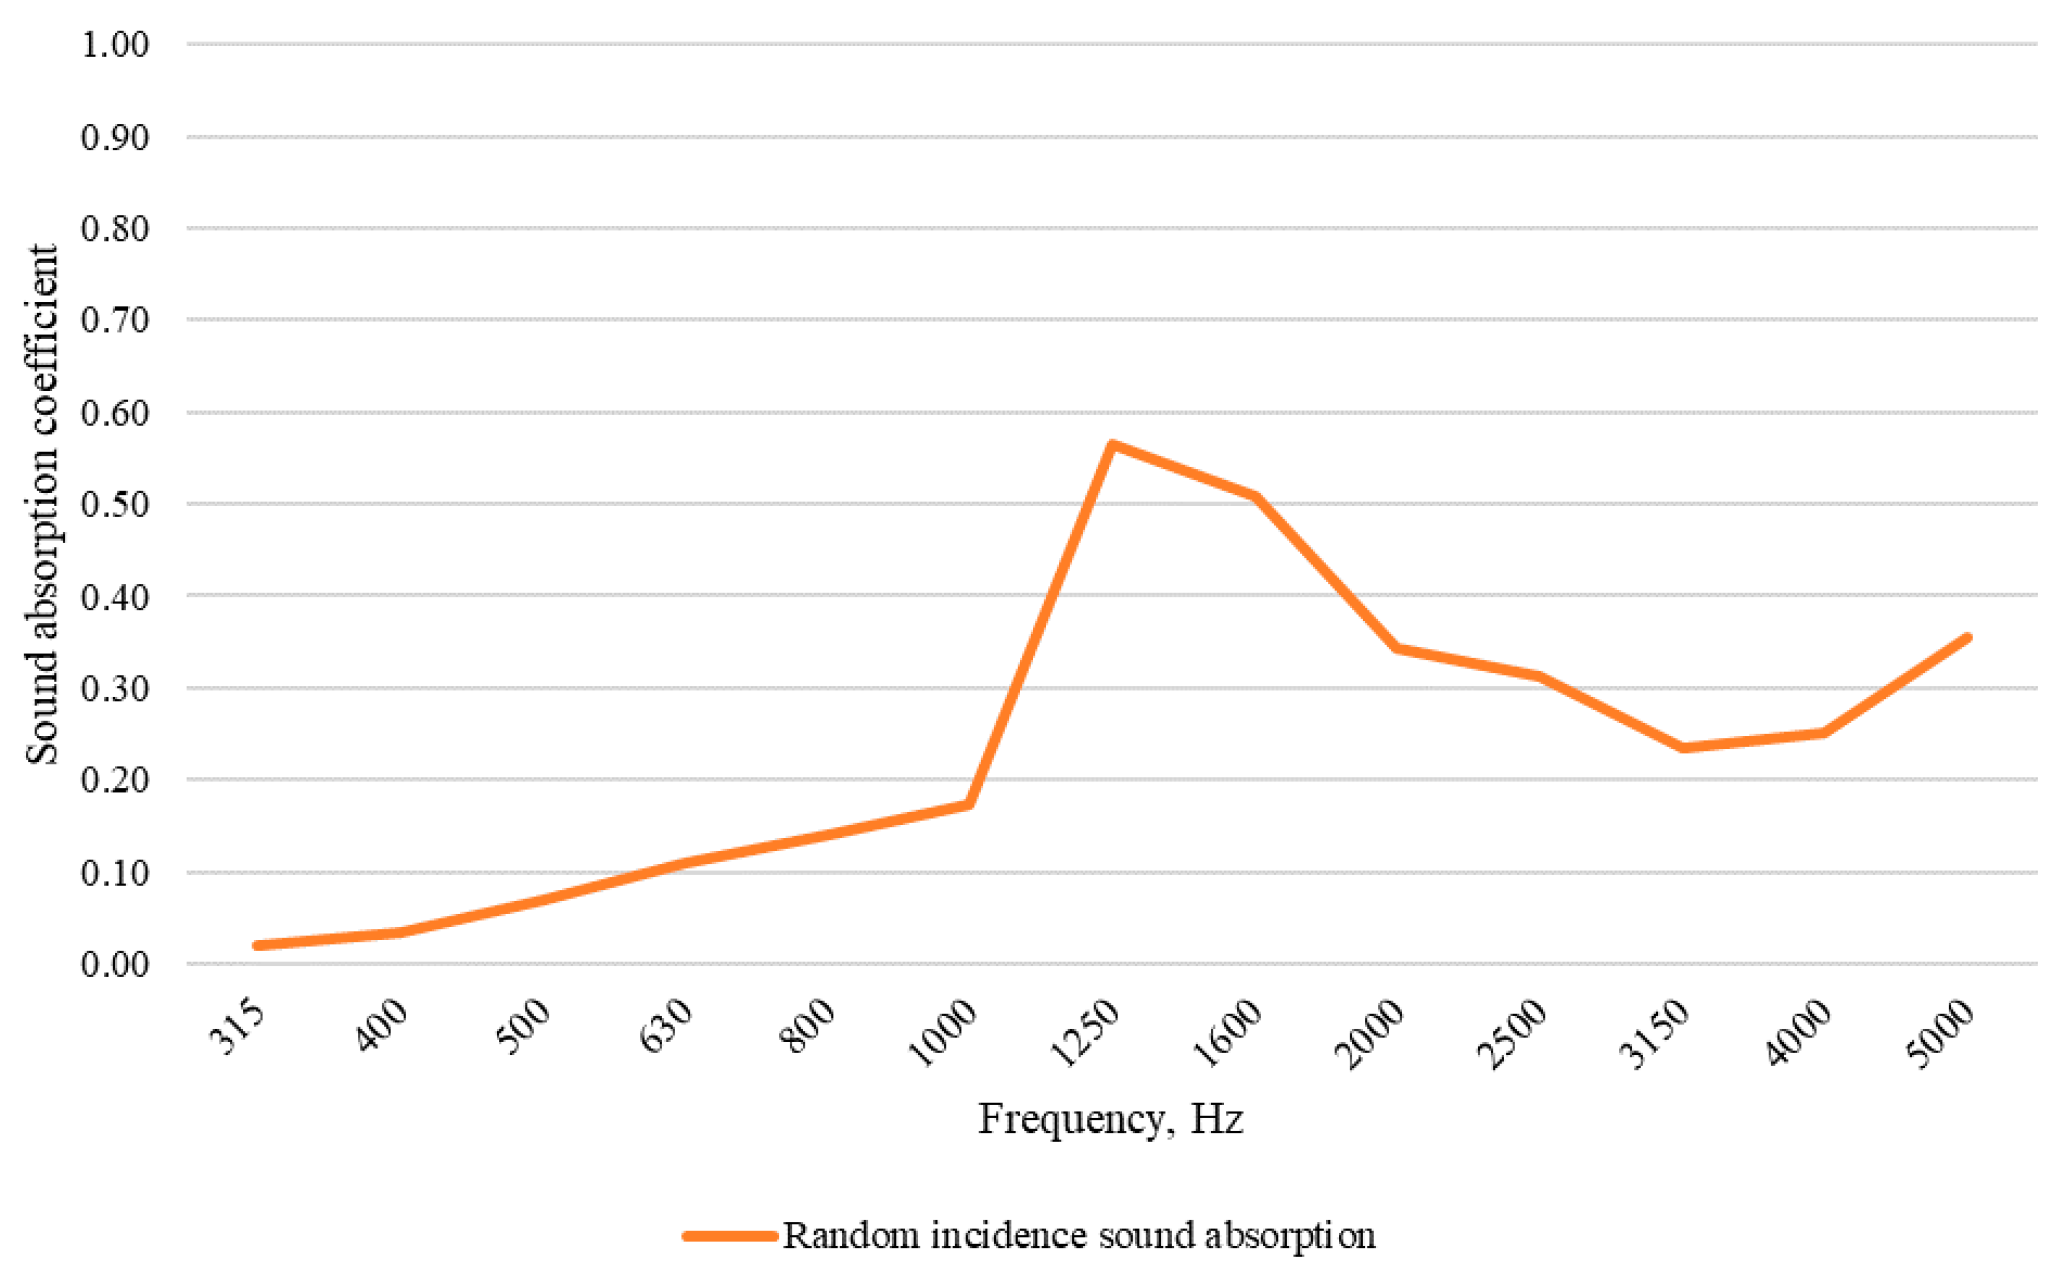
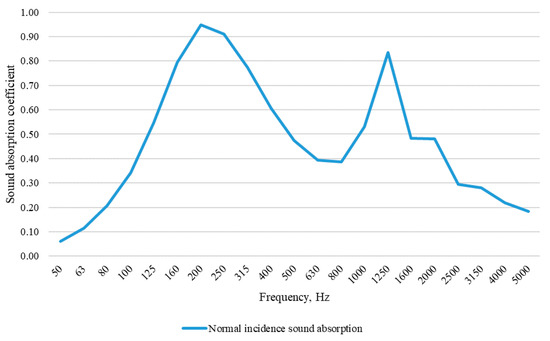
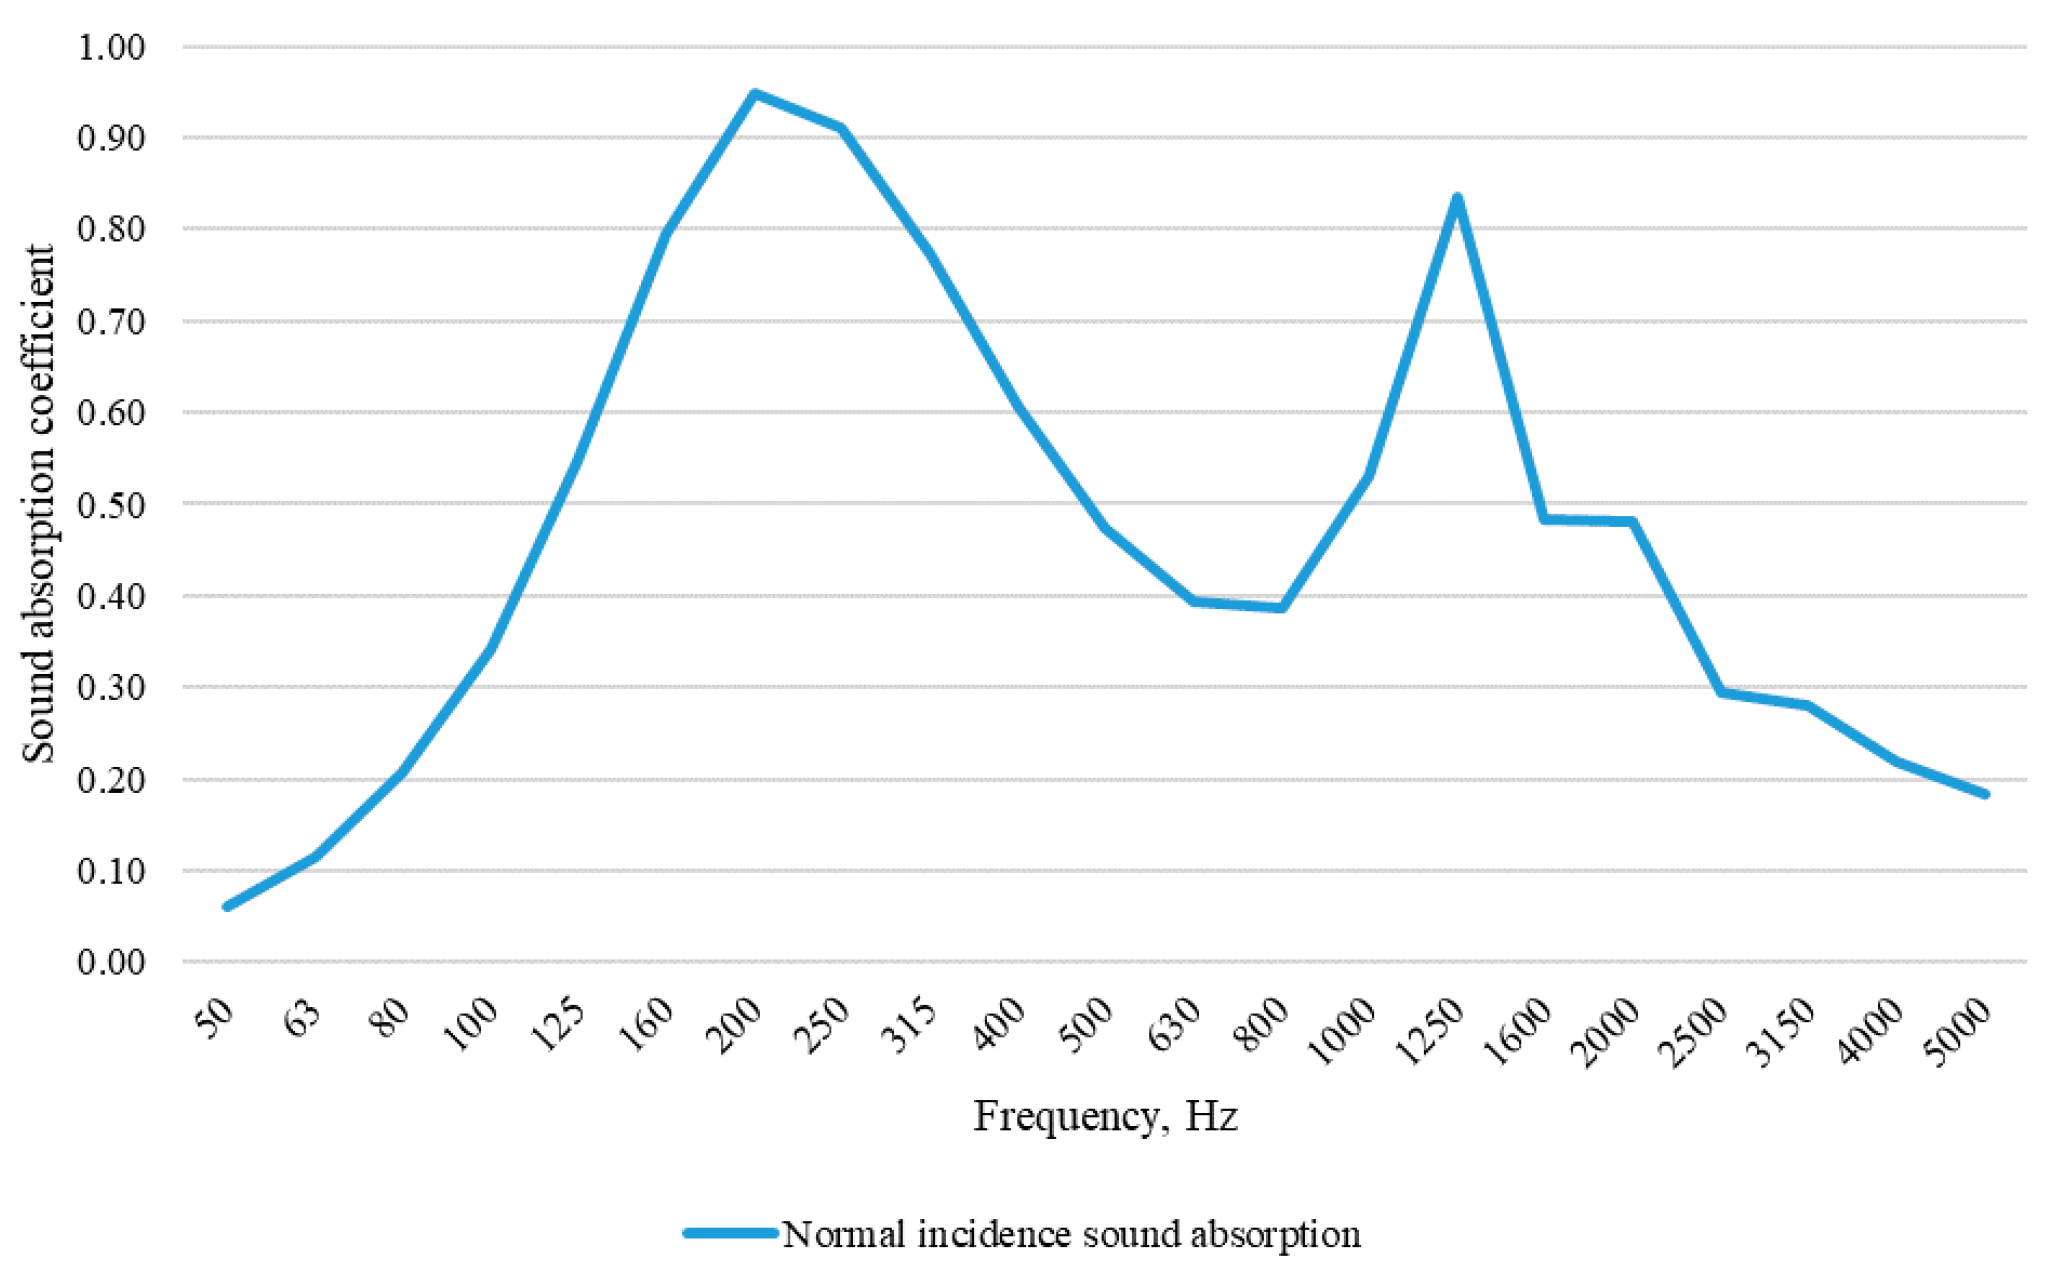
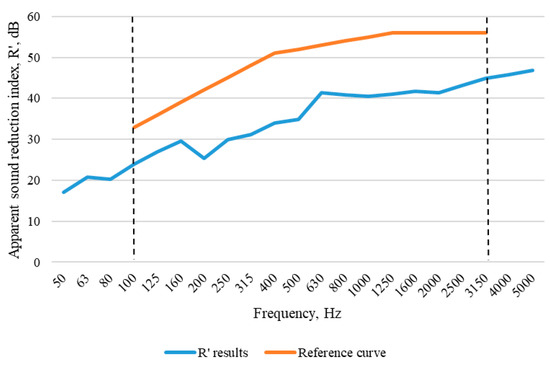
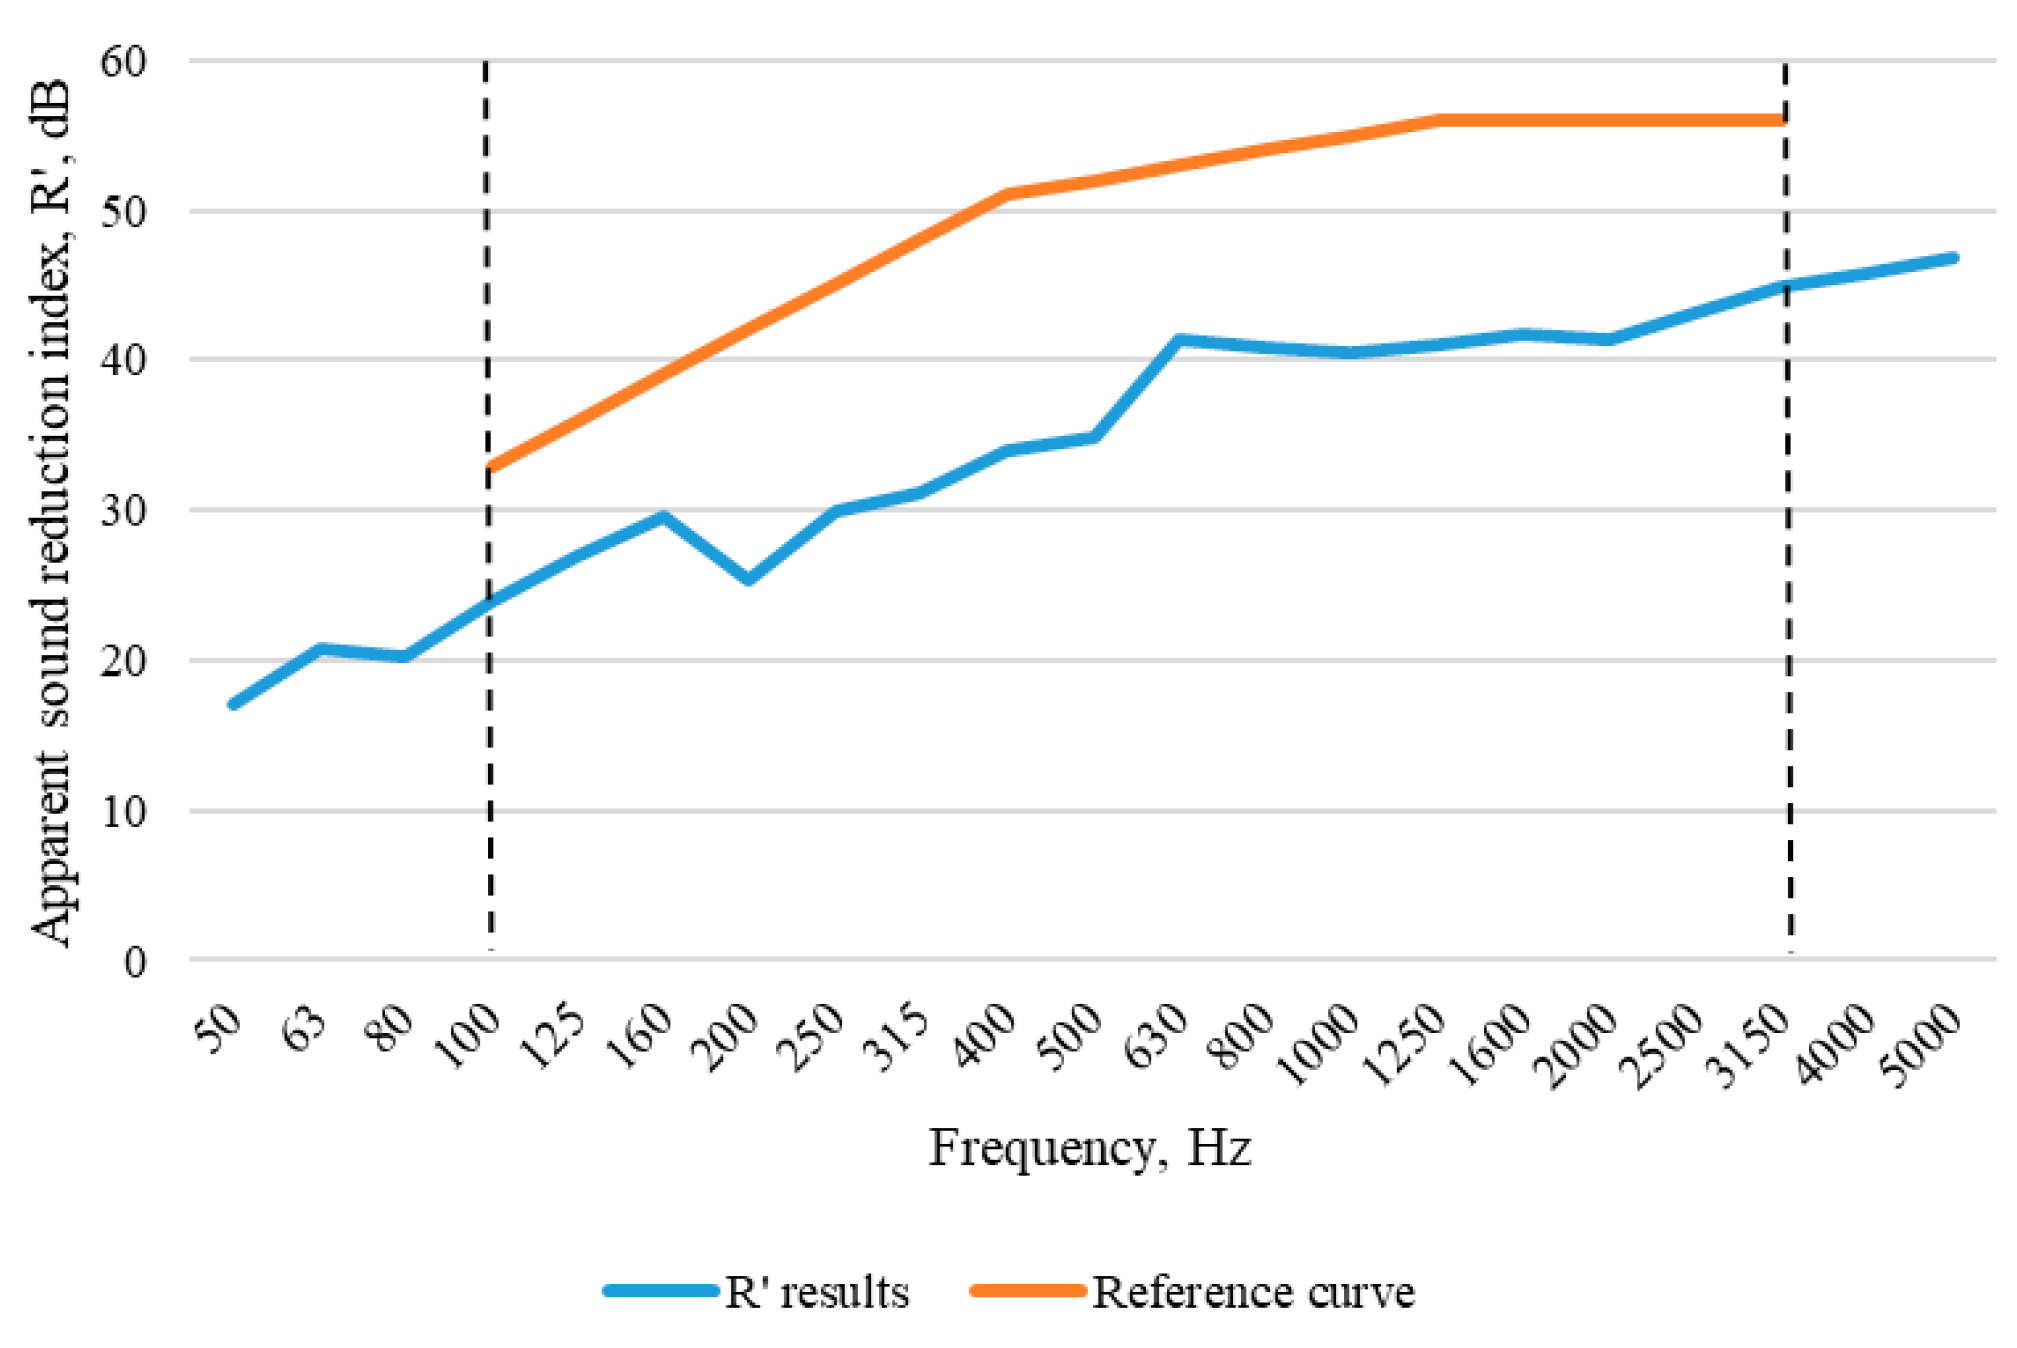

Disclaimer/Publisher’s Note: The statements, opinions and data contained in all publications are solely those of the individual author(s) and contributor(s) and not of MDPI and/or the editor(s). MDPI and/or the editor(s) disclaim responsibility for any injury to people or property resulting from any ideas, methods, instructions or products referred to in the content. |
© 2026 by the authors. Licensee MDPI, Basel, Switzerland. This article is an open access article distributed under the terms and conditions of the Creative Commons Attribution (CC BY) license.