


Abstract
Digital transformation is embedding carbon metrics into construction project management through automated procurement and sustainability dashboards. Yet carbon intensity measures depend critically on how emissions are normalized, creating ambiguity in sustainability assessment. This study examines how alternative carbon intensity scaling choices affect firm rankings and portfolio outcomes within the Construction & Engineering industry. Using carbon-efficient indices for publicly traded U.S. construction firms, emissions are normalized by revenues, costs, assets, market value, enterprise value, and employment. Alternative normalization choices lead to systematic within-industry reshuffling of firm rankings driven by differences in economic fundamentals. While average financial performance does not differ systematically across metrics, portfolio turnover and financed emissions vary substantially. These results show that normalization design is a consequential element of digital sustainability systems rather than a neutral technical choice. The study provides industry-specific evidence on measurement-induced reshuffling and highlights practical implications for contractor benchmarking and digital construction governance.
1. Introduction
Digital transformation is reshaping construction project management by enabling data-driven planning, real-time monitoring, and integrated decision-making across the project life cycle. At the same time, sustainability metrics—particularly carbon-related indicators—are increasingly embedded in financial markets, regulatory systems, and benchmarking frameworks. Pedersen et al. [1] show that sustainability metrics are increasingly incorporated into investment and portfolio construction frameworks. The European Commission [2] formalized climate benchmark regulations that embed sustainability criteria into financial benchmarking systems. The U.S. Securities and Exchange Commission [3] adopted enhanced climate-related disclosure requirements that institutionalize carbon metrics within reporting frameworks. Standardized carbon accounting frameworks further reinforce this institutionalization. The Partnership for Carbon Accounting Financials (PCAF) [4] provides a formal methodology for attributing financed emissions to portfolio holdings. Consequently, carbon-related metrics are increasingly incorporated into digital construction management systems to guide procurement decisions, evaluate contractors, and benchmark project-level sustainability performance.
As carbon metrics become institutionalized across capital markets and industry benchmarking systems, a fundamental question arises: how sensitive are sustainability assessments to the specific design of carbon intensity measures? Carbon intensity is typically constructed by scaling emissions by economic or financial denominators such as revenues, assets, costs, market value, enterprise value, or employment. Yet alternative normalization choices may mechanically reshape firm rankings, portfolio allocations, and reported financed emissions, even when underlying emissions remain unchanged. Understanding the extent to which sustainability benchmarking outcomes depend on scaling design—rather than purely environmental performance—is therefore essential in digitally integrated evaluation environments.
This shift occurs alongside broader changes in capital markets and regulatory frameworks that emphasize the measurement and management of carbon exposure. Matsumura et al. [5] show that corporate carbon emissions and climate disclosures are associated with firm value. Choi et al. [6] document that investor attention to global warming influences asset prices. Ilhan et al. [7] provide evidence that carbon exposure is embedded in option-implied downside risk. Bolton and Kacperczyk [8] demonstrate that carbon transition risk is priced in global equity markets. Hsu et al. [9] identify a pollution premium associated with firms’ environmental exposure. Greenstone et al. [10] argue that mandatory climate disclosure would reveal economically significant corporate carbon damages. Aswani et al. [11] examine whether carbon emissions are associated with stock returns and provide mixed evidence on the existence of a return premium. Atilgan et al. [12] further investigate whether the carbon premium reflects compensation for systematic risk or investor-driven mispricing.
Aswani et al. [11] examine whether carbon emissions are associated with stock returns and provide mixed evidence on the existence of a return premium. Atilgan et al. [12] further investigate whether the carbon premium reflects compensation for systematic risk or investor-driven mispricing.
At the regulatory level, the European Commission [2] introduced climate benchmark regulations that formalize sustainability-related benchmark standards. The European Commission [13] subsequently established minimum requirements for EU climate transition and Paris-aligned benchmarks. In the United States, the U.S. Securities and Exchange Commission [3] adopted enhanced climate-related disclosure requirements that further institutionalize standardized carbon metrics in financial reporting and decision-making.
In response, carbon intensity measures—defined as emissions normalized by revenues, assets, costs, market value, enterprise value, or employment—have become central inputs in ESG ratings, climate benchmarks, and carbon-efficient investment strategies. Pástor et al. [14] show that sustainability-related characteristics are reflected in green return decompositions. Pedersen et al. [1] demonstrate how ESG constraints reshape efficient portfolio construction. Krueger et al. [15] document that institutional investors incorporate climate risk into portfolio allocation decisions.
Institutional investors increasingly rely on financed emissions metrics to assess portfolio-level carbon exposure and guide decarbonization strategies. The Partnership for Carbon Accounting Financials (PCAF) [4] formalizes the accounting framework for financed emissions. Atta-Darkua et al. [16] analyze the implications of portfolio decarbonization strategies for institutional investors. Hartzmark and Shue [17] show that impact-oriented capital allocation can generate unintended equilibrium effects.
Yet, despite their widespread adoption, carbon intensity metrics remain conceptually ambiguous. Chatterji et al. [18] document substantial divergence across ESG ratings due to methodological differences. Berg et al. [19] show that ESG rating disagreement is largely driven by measurement and aggregation choices. Dimson et al. [20] further highlight systematic differences across ESG rating providers. Gibson Brandon et al. [21] demonstrate that ESG rating disagreement affects stock returns.
Within the carbon domain, Busch et al. [22] emphasize that methodological variation materially affects reported carbon performance. Baur and Oll [23] show that carbon-related portfolio design can alter diversification outcomes. Petitjean [24] documents that environmental policy measures can influence financial performance in ways that depend on measurement structure. These findings suggest that carbon metrics are not neutral descriptors but methodological design choices that shape perceived environmental performance.
A closely related contribution (Dutta et al. [25]) demonstrates that alternative carbon emissions scaling variables produce substantial reshuffling of firm rankings within sectors and materially affect the construction of carbon-efficient indices. Their findings establish that carbon intensity normalization is a first-order design decision rather than a benign technical adjustment.
The construction sector provides a particularly relevant setting in which to examine these issues. Construction and engineering activities account for a substantial share of global carbon emissions through both operational energy use and embodied emissions in materials and infrastructure. At the same time, the industry is characterized by pronounced heterogeneity in project mix, capital intensity, labor utilization, and subcontracting structures. Firms operate under project-based delivery models in which asset deployment and workforce composition vary widely across contracts and over time. Consequently, alternative carbon intensity denominators may interact strongly with underlying production characteristics, making normalization choices especially consequential in this industry. Moreover, because construction project management systems increasingly embed carbon metrics directly into procurement dashboards and contractor evaluation tools, measurement choices influence operational decisions rather than merely investor perceptions.
Despite the growing importance of digital sustainability analytics in construction, little is known about how alternative carbon intensity measures reshape rankings, implementation frictions, and financed emissions within a single, project-based industry. Existing research—including Dutta et al. [25]—focuses primarily on sector-level comparisons and capital market applications, leaving open the question of how carbon scaling design affects digitally embedded contractor evaluation systems.
This study addresses this gap by examining how alternative carbon intensity scaling choices affect sustainability assessments within the U.S. Construction & Engineering industry (SIC 15–17) over the period 2004–2021. Building directly on the index construction framework of Dutta et al. [25], I construct carbon-efficient indices using emissions scaled by revenues, costs, assets, market value, enterprise value, and employment, and evaluate their implications for firm rankings, portfolio turnover, and financed emissions.
The results indicate economically meaningful reshuffling across alternative carbon intensity scaling choices. Regression analyses show that different normalization variables induce systematic tilts toward corresponding firm fundamentals, thereby altering relative positioning within the industry. While these compositional shifts do not translate into systematically different average financial performance, they lead to material differences in portfolio implementation characteristics. In particular, turnover and financed emissions outcomes vary substantially across scaling metrics. These findings suggest that normalization design meaningfully shapes portfolio composition and reported sustainability outcomes, even when aggregate financial performance remains broadly comparable.
By linking carbon metric design to portfolio composition, turnover intensity, and financed emissions in a digitally enabled construction environment, this paper makes three contributions. This study contributes to the literature in several distinct ways.
Prior research has documented carbon intensity reshuffling at broad market or sectoral levels, yet it remains unclear whether normalization-induced rank shifts carry economically meaningful implications within a single production-intensive industry where carbon metrics directly influence procurement, contractor evaluation, and capital allocation decisions.
First, it extends Dutta et al. [25] by providing industry-specific evidence from a project-based and production-intensive sector—Construction & Engineering—where sustainability metrics are operationalized through digital management systems and directly influence procurement and contractor benchmarking. By restricting the analysis to a single industry, I isolate within-industry reshuffling effects without cross-sector technology confounds, demonstrating that carbon intensity reshuffling is not merely a broad market phenomenon but also a structurally meaningful mechanism within a homogeneous production environment.
Second, the paper shows that automation and enhanced data integration in digital construction management do not eliminate measurement ambiguity; rather, they amplify the consequences of normalization design. As carbon metrics become embedded in digital dashboards, bidding platforms, and ESG-linked evaluation systems, the choice of scaling denominator mechanically reshapes relative performance rankings within the industry.
Third, the study provides practical guidance for digital construction governance by demonstrating that carbon metrics function as structural design choices rather than neutral measurement tools. Alternative normalization rules systematically influence contractor rankings, portfolio turnover, and reported financed emissions outcomes. In this setting, normalization is not a technical detail but a governance-relevant decision that shapes competitive positioning and capital allocation within the construction sector.
Overall, the findings underscore that effective digital transformation in construction depends not only on technological sophistication but also on the conceptual foundations of the sustainability metrics embedded within project management systems. Careful attention to carbon intensity normalization is essential to ensure that digital sustainability tools support consistent, transparent, and economically meaningful environmental decision-making.
2. Literature Review
2.1. Carbon Risk, Asset Pricing, and Climate Disclosure
A growing body of research examines how carbon emissions and climate-related risks are reflected in firm value and asset prices. Matsumura et al. [5] show that higher carbon emissions are associated with lower firm valuation, while voluntary carbon disclosure is positively valued by investors. Bolton and Kacperczyk [8] document that carbon transition risk is priced in global equity markets. Hsu et al. [9] identify a pollution premium associated with firms’ environmental exposure. Zhang [26] provides cross-country evidence that carbon exposure generates systematic return patterns. Ilhan et al. [7] show that carbon risk is embedded in option-implied downside risk. Okimoto and Takaoka [27] demonstrate that carbon exposure affects credit markets through credit default swap pricing. Choi et al. [6] find that investor attention to global warming influences asset prices. Mazzarano et al. [28] document that transition risk affects stock returns and dividend policies. Pástor et al. [14] argue that green return differentials may reflect investor preferences. Atilgan et al. [12] examine whether the carbon premium reflects compensation for risk or mispricing. Aswani et al. [11] provide mixed evidence on the association between carbon emissions and stock returns. Fahmy [29] shows that shifts in climate awareness affect asset pricing dynamics.
Institutional and regulatory developments further reinforce the financial materiality of carbon metrics. Krueger et al. [15] provide survey-based evidence that institutional investors increasingly incorporate climate risk into portfolio construction decisions. Atta-Darkua et al. [16] further show that institutional decarbonization strategies reshape portfolio allocations. The European Commission [2] introduced climate benchmark regulations that embed sustainability criteria into financial benchmarks. The European Commission [13] established minimum standards for EU climate transition and Paris-aligned benchmarks. The U.S. Securities and Exchange Commission [3] adopted enhanced climate-related disclosure requirements that institutionalize carbon metrics within capital markets. Downar et al. [30] find that carbon disclosure mandates affect emissions and financial operating performance. Jouvenot and Krueger [31] provide evidence from a natural experiment that mandatory carbon disclosure influences firm emissions. Greenstone et al. [10] argue that mandatory disclosure would reveal economically significant corporate carbon damages. Davies and Van Wesep [32] analyze the unintended consequences of divestment strategies. Edmans et al. [33] examine the implications of socially responsible divestment for capital allocation. Hartzmark and Shue [17] show that impact-oriented capital allocation can produce counterproductive equilibrium effects. Pedersen et al. [1] demonstrate how ESG constraints reshape the efficient frontier in portfolio optimization. Pástor et al. [14] decompose green returns and highlight the role of investor preferences in sustainability-related pricing.
Collectively, this literature establishes that carbon exposure is financially material and increasingly embedded in capital allocation decisions. However, most studies treat carbon intensity metrics as given inputs rather than examining the structural consequences of alternative normalization choices.
2.2. Measurement Divergence and ESG Rating Disagreement
Parallel literature documents substantial disagreement across ESG and sustainability ratings. Chatterji et al. [18] show that ESG rating agencies produce divergent scores due to differences in measurement scope and aggregation methodologies. Berg et al. [19] demonstrate that ESG rating disagreement is largely driven by measurement and weighting variation. Dimson et al. [20] further document systematic differences across ESG rating providers. Gibson Brandon et al. [21] show that ESG rating disagreement influences stock returns and capital allocation decisions. Within the carbon domain specifically, Busch et al. [22] demonstrate that data quality and methodological variation materially affect reported carbon performance.
A defining feature of carbon metrics is the normalization of emissions by economic or operational denominators such as revenues, costs, assets, market capitalization, enterprise value, or employment. While normalization is intended to enhance comparability across firms of different sizes, differences in aggregation and scaling can generate materially different firm rankings and portfolio allocations. Broader debates around carbon diversification (Baur & Oll [23]), eco-friendly policies and financial performance (Petitjean [24]), and internal carbon pricing (Byrd et al. [34]) further underscore that measurement design can shape both perceived sustainability performance and real economic outcomes.
Recent work by Dutta et al. [25] provides systematic evidence that alternative carbon emissions scaling choices materially affect sector peer comparisons and carbon-efficient index construction. Even when based on identical emissions data, scaling decisions induce substantial reshuffling of firm rankings and alter portfolio composition. OECD [35] similarly highlights persistent challenges in achieving accurate and comparable carbon intensity metrics at granular levels.
Despite these insights, limited attention has been given to how normalization-induced reshuffling operates within a single production-intensive industry where sustainability metrics are embedded directly into operational decision systems.
2.3. Digital Construction Management and Operationalization of Carbon Metrics
Digital transformation has become a central organizing principle in contemporary construction project management. The adoption of Building Information Modeling (BIM), digital twins, integrated project delivery platforms, and data-driven decision-support systems has reshaped how construction projects are planned, monitored, and evaluated across their life cycles. These technologies enable real-time coordination among stakeholders, enhanced cost and schedule control, and increasingly, the integration of sustainability metrics into project governance structures.
In the Construction & Engineering industry, carbon intensity measures are operationalized not only within capital markets but also within procurement platforms, contractor evaluation systems, and performance dashboards. Public authorities and large project owners increasingly rely on standardized carbon indicators to assess contractor eligibility, guide procurement decisions, and benchmark sustainability performance. Financed emissions accounting standards such as PCAF [4] formalize the attribution of firm-level emissions to portfolios, linking measurement architecture directly to investment outcomes.
In digitally enabled construction environments, automation amplifies the consequences of measurement design. Sustainability scores can be updated frequently and embedded into bidding platforms and supplier dashboards, transforming carbon metrics from passive reporting tools into operational decision rules. As a result, differences in scaling methodology can directly affect contractor selection, supplier eligibility, portfolio turnover, and reported carbon savings. Valuation-sensitive metrics may introduce instability into digital decision systems, potentially disrupting long-term supplier relationships that are critical in complex infrastructure projects.
Against this institutional backdrop—characterized by regulatory standardization, capital market pricing of carbon risk, ESG rating divergence, and rapid digitalization—understanding how alternative carbon intensity measures reshape firm rankings and sustainability outcomes is particularly important for construction project management. The present study builds on prior literature by examining normalization-induced reshuffling within a single production-intensive industry and by linking measurement architecture to financial neutrality, turnover intensity, and financed emissions outcomes in digitally enabled construction management systems.
Despite the rapid integration of carbon metrics into digital construction management systems, prior literature rarely examines how normalization rules propagate mechanically through ranking systems and portfolio construction algorithms. Most empirical studies treat carbon intensity measures as exogenous indicators of environmental performance, implicitly assuming comparability across scaling choices. However, in digitally automated procurement and benchmarking platforms, normalization operates as a structural design parameter rather than a neutral adjustment. This distinction motivates the analytical framework adopted in this study: by restricting the analysis to a single industry and transforming emissions measures into within-industry percentile ranks, the framework isolates normalization-induced reshuffling effects from cross-sector technological heterogeneity. The subsequent portfolio construction and financed emissions analysis translate these ranking shifts into economically observable consequences—namely turnover intensity and reported carbon savings—thereby directly linking measurement architecture to implementation outcomes. Table A1 in the Appendix A.1 section summarizes the related literature and its main findings.
3. Measurement Framework and Hypotheses
Digital construction management systems increasingly rely on carbon intensity metrics to evaluate firms, guide procurement decisions, and monitor sustainability performance. These metrics normalize carbon emissions by economic or operational denominators such as revenues, costs, assets, market value, enterprise value, or labor inputs. While normalization is intended to improve comparability, Chatterji et al. [18] show that differences in ESG measurement methodologies can produce divergent firm evaluations. Berg et al. [19] demonstrate that ESG rating divergence is largely driven by variation in measurement and aggregation choices. Dutta et al. [25] provide evidence that alternative carbon scaling denominators materially reshuffle sector rankings and alter carbon-efficient index construction.
To systematically examine this issue, this study proposes a structured analytical framework that links normalization design to portfolio-level consequences. The framework consists of four interconnected components: (i) firm-level carbon emissions as the numerator, (ii) alternative financial or operational scaling denominators, (iii) within-industry percentile rank transformation, and (iv) index-based portfolio translation. The scope of the framework is restricted to a single production-intensive industry in order to isolate within-industry reshuffling effects while minimizing cross-sector technological confounds.
Within this structure, alternative scaling choices mechanically alter carbon intensity ratios, which in turn reshape percentile ranks and propagate into portfolio weights, turnover, and financed emissions outcomes. The framework therefore distinguishes normalization-induced reshuffling from genuine emission reductions and provides a transparent mechanism for assessing the economic and governance implications of metric design.
3.1. Carbon Intensity Scaling and Fundamental Tilts
Construction firms are heterogeneous along dimensions such as capital intensity, subcontracting reliance, labor deployment, and valuation multiples. Scaling emissions by different denominators emphasizes different production factors. For example, asset-based measures may penalize equipment-intensive firms, while revenue-based measures may disadvantage firms operating large, low-margin infrastructure projects. Building on Dutta et al. [25], such normalization choices are expected to produce systematic tilts toward firms with corresponding accounting or valuation characteristics rather than purely reflecting environmental efficiency.
H1:
The use of alternative carbon intensity scaling variables is associated with systematic differences in the fundamental composition of carbon-efficient indices within the Construction & Engineering industry.
3.2. Carbon Metrics and Financial Performance
Climate finance research provides mixed evidence on whether carbon exposure commands a return premium. Bolton and Kacperczyk [8] show that carbon transition risk is priced in global equity markets. Ilhan et al. [7] provide evidence that carbon exposure is reflected in option-implied downside risk. Hsu et al. [9] document a pollution premium associated with firms’ environmental characteristics. Aswani et al. [11] report mixed findings on the association between carbon emissions and stock returns. However, if scaling choices primarily reweight firms based on accounting or valuation characteristics rather than capturing distinct climate risk factors, differences in financial performance across carbon-efficient indices should be limited within a single industry.
H2:
The average returns of alternative carbon-efficient indices are not systematically different from each other or from those of the construction market benchmark.
3.3. Carbon Metrics and Portfolio Turnover
Market-value or enterprise-value-based metrics are mechanically sensitive to fluctuations in equity prices. Choi et al. [6] show that investor attention to global warming affects asset prices. Mazzarano et al. [28] document that transition risk influences stock returns and dividend policies. Given these documented attention and transition-risk pricing effects, valuation-based scaling may induce greater ranking instability. In contrast, accounting-based denominators typically evolve more gradually.
H3:
Portfolio turnover differs systematically across carbon-efficient indices constructed using alternative carbon intensity scaling denominators.
3.4. Carbon Metrics and Financed Emissions
Financed emissions have become a central metric in institutional portfolio management. Krueger et al. [15] show that institutional investors increasingly incorporate climate risk into portfolio allocation decisions. The Partnership for Carbon Accounting Financials (PCAF) [4] formalizes the accounting framework for financed emissions attribution. While carbon-efficient indices are designed to reduce emission exposure, the magnitude of these reductions may depend critically on normalization choices. Atta-Darkua et al. [16] demonstrate that portfolio decarbonization strategies can materially reshape portfolio composition. Hartzmark and Shue [17] show that sustainability-oriented capital allocation may generate equilibrium effects that differ from intended decarbonization outcomes.
H4:
Carbon-efficient indices reduce financed emissions relative to the construction benchmark, and emission reductions vary systematically across scaling denominators.
4. Data and Sample Construction
4.1. Sample Construction
Empirical analysis focuses on publicly traded U.S. firms in the Construction & Engineering industry, defined by SIC codes 15–17. This industry classification includes general building contractors, heavy construction firms, and specialty trade contractors, which together represent the core segments of construction and engineering activities. Restricting the sample to a single industry allows me to isolate within-industry reshuffling effects while minimizing cross-industry heterogeneity in production technology and emission structures.
Carbon emissions data (Scope 1 and Scope 2 CO2e emissions) are obtained from S&P Global Trucost, a widely used provider of firm-level greenhouse gas emissions data. Trucost compiles emissions information from company sustainability reports, regulatory filings, and disclosures to platforms such as CDP. When firms do not directly report emissions in a given year, Trucost applies a proprietary environmentally extended input–output (EEIO) methodology to generate model-based estimates. Accordingly, the emissions data reflect a combination of firm-reported and vendor-estimated values. I use the consolidated emissions figures provided by Trucost and do not independently interpolate or adjust the reported data. In cases where firms restate historical emissions, I rely on the most recently available restated values in the database to maintain internal consistency across fiscal years.
Scope 3 emissions are not included in the primary analysis. I focus on Scope 1 and Scope 2 emissions because they represent direct and energy-related indirect emissions that are more consistently measured and reported across firms. In the construction industry, Scope 3 emissions are often substantial but exhibit considerable heterogeneity in disclosure practices, boundary definitions, and estimation methodologies. Reporting rates for Scope 3 are materially lower than for Scope 1 and Scope 2, and vendor-estimated values are more prevalent, which raises concerns about measurement error and cross-firm comparability.
Given that the objective of this study is to examine within-industry reshuffling effects driven by alternative scaling denominators, incorporating Scope 3 emissions—whose measurement is less standardized and more model-dependent—could introduce additional noise that is unrelated to scaling choices. Focusing on Scope 1 and Scope 2 emissions ensures greater data consistency and comparability across firms while aligning with common practice in empirical asset pricing and carbon intensity research.
These emissions data are merged with firm-level financial information from Compustat. All financial denominators used to construct carbon intensity measures are obtained from Compustat annual data. Revenues (SALES) and cost of goods sold (COGS) are measured as total fiscal year flows. Total assets (AT) and number of employees (EMP) are measured at fiscal year end. Market value (MV) is measured at the end of June of year t, consistent with the portfolio rebalancing convention, and enterprise value (EV) is computed at the same date as market capitalization.
To mitigate distortions from extreme or mechanically inflated intensity ratios, I require all financial denominators to be strictly positive and at least USD 1 million. Observations with negative or near-zero denominators are excluded from the sample. This restriction ensures that carbon intensity measures are economically meaningful and not driven by small-denominator effects.
The sample period spans from 2004 to 2021, reflecting the increasing availability and consistency of carbon emissions disclosures over time. To mitigate disclosure timing concerns, index weights and scaling variables are constructed using lagged financial information consistent with standard asset pricing practices. Specifically, carbon intensity measures are computed using emissions and firm characteristics from fiscal year t − 1, and portfolios are rebalanced at the end of June in year t. Portfolio returns and turnover are then measured from July of year t to June of year t + 1.
Accordingly, although emissions data are available through fiscal year 2021, portfolios formed in June 2022 (using 2021 emissions data) generate returns and turnover observed through June 2023. No portfolios are formed beyond the last fiscal year for which emissions data are available. Turnover is first reported for July 2006–June 2007 because turnover requires two consecutive rebalancing dates to compute changes in portfolio weights. The final sample consists of firm-year observations with non-missing emissions and financial data required to compute alternative carbon intensity measures.
By focusing on a single carbon-intensive, project-based industry and combining emissions with detailed firm fundamentals, the sample provides a suitable setting to evaluate how alternative normalization choices reshape carbon efficiency rankings within digitally enabled construction management environments.
4.2. Carbon Intensity Reshuffling
Carbon intensity metrics are widely used in sustainability analytics to compare firms’ environmental efficiency. However, the choice of normalization variable can materially affect how firms are ranked in terms of carbon performance. In the construction industry, where firms differ substantially in capital intensity, labor utilization, and cost structure, alternative scaling variables may generate different assessments of relative carbon efficiency.
To examine this effect, I use carbon intensity scaled by revenues (CO2e/SALES) as the benchmark metric. I compute percentile rankings of firms within the Construction & Engineering industry based on this revenue-scaled measure. I then compare these benchmark rankings with percentile rankings derived from alternative scaling variables, including cost of goods sold, assets, market value, enterprise value, and employment.
The difference between these rankings captures the degree of carbon intensity reshuffling induced by alternative normalization choices. This reshuffling reflects how firms move within the carbon efficiency distribution when emissions are scaled by different measures of economic activity or firm size. By focusing on within-industry ranking shifts, I isolate the impact of metric design from cross-industry heterogeneity and provide a direct assessment of how carbon measurement choices influence sustainability evaluations in digitally enabled construction management contexts.
4.3. Percentile Rank Construction
Percentile ranks are constructed separately within each industry-year cross-section using a discrete grouping procedure. For each variable of interest, firms are sorted in ascending order within the Construction & Engineering industry for a given assessment year. Using a 100-group ranking procedure, firms are assigned to integer rank groups ranging from 0 to 99. Tied observations are assigned to the same group index consistent with the default ranking convention.
To ensure comparability across years and eliminate potential group-index offsets, the minimum group value within each industry-year is subtracted so that the lowest-ranked firm receives a value of zero. The resulting group index is then divided by the maximum group value observed in that industry-year. Formally, if denotes the group index assigned to firm in year , the scaled percentile measure is defined as:
This transformation yields a normalized score bounded between 0 and 1 within each industry-year, with 0 corresponding to the lowest value and 1 to the highest value of the ranked variable. The procedure preserves relative ordering while ensuring consistent scaling across time and across alternative normalization specifications.
4.4. Regression Specification
To clarify the empirical design, I estimate the following baseline regression:
where denotes the percentile rank of carbon intensity under an alternative scaling metric within the industry-year, and represents the corresponding revenue-based benchmark rank. is the percentile rank of the relevant fundamental ratio within the same industry-year.
The regressions include industry fixed effects () and year fixed effects () to control for time-invariant industry characteristics and aggregate temporal shocks. Standard errors are two-way clustered by industry and year.
All rank variables are constructed within each industry-year cross-section. Specifically, firms are ranked relative to their industry peers in each year, and the ranks are transformed into percentile scores that range from 0 to 1. This transformation ensures that, within each industry-year, the distribution of rank values is uniformly scaled between 0 (lowest value) and 1 (highest value), with equal spacing across observations.
No additional firm-level control variables are included, consistent with [25] as the objective is to isolate the mechanical reshuffling effect induced by alternative scaling denominators rather than to model firm-level determinants of emissions.
4.5. Index Methodology
The benchmark index is constructed from publicly traded U.S. firms classified in the Construction & Engineering industry (SIC codes 15–17). In each year, the index includes all eligible firms within this industry, with constituent weights proportional to market capitalization. The index is rebalanced annually at the end of June, consistent with standard asset pricing conventions (Fama & French [36]). To address the disclosure lag in firm-level carbon emissions, all index weights are computed using firm characteristics measured at the end of the prior fiscal year (Zhang [26]).
Formally, let denote the number of Construction & Engineering firms in a given year , and suppress the time subscript for notational simplicity. Let denote the market value of firm . The weight of firm in the benchmark construction market index is defined as:
where the denominator represents the aggregate market capitalization of the Construction & Engineering industry.
I next construct carbon-efficient indices that reallocate weights within the construction industry toward firms with lower carbon intensity. Carbon intensity is measured as the ratio of firm-level carbon emissions, , to a scale variable, . The scale variable includes revenues, cost of goods sold, market value, enterprise value, total assets, or employment, reflecting alternative normalization approaches commonly used in sustainability assessment.
Firms are ranked annually within the Construction & Engineering industry based on their carbon intensity, and the corresponding percentile rank is denoted by . The weight assigned to firm in the carbon-efficient index is defined as:
This weighting scheme ensures that the carbon-efficient index remains fully invested in the Construction & Engineering industry while overweighting firms with relatively lower carbon intensity and underweighting more carbon-intensive firms. By construction, differences between the benchmark and carbon-efficient indices arise solely from within-industry reallocation rather than from changes in industry composition.
Although alternative portfolio construction methods are possible, this approach provides a transparent and intuitive extension of the standard value-weighted construction market index. It aligns closely with how carbon metrics are operationalized in industry-specific sustainability benchmarks and digital construction management systems.
4.6. Financed Emissions
Financed emissions capture the share of corporate carbon emissions that is attributed to an investor based on their capital ownership in the constituent firms of an index. Following the Partnership for Carbon Accounting Financials (PCAF) [4], this approach assumes that an investor is responsible for a proportion of a firm’s emissions that corresponds to their ownership stake. For example, an investor holding 1% of a firm’s market capitalization is attributed 1% of that firm’s total CO2e emissions. Financed emissions have become a widely used metric in portfolio-level climate analysis and carbon risk assessment (Krueger et al. [15]).
Consider an investor who allocates one dollar to a Construction & Engineering index. Let denote the portfolio weight assigned to firm , and let denote the market value of that firm. The investor’s ownership share in firm is therefore given by . The carbon emissions attributed to the investor from firm equal this ownership share multiplied by the firm’s total emissions, .
Aggregating across all constituent firms yields the index-level financed emissions (FE), measured in tons of CO2e per USD invested:
where denotes the portfolio weight of firm i and represents firm-level emissions measured in metric tons of CO2e. Consistent with Dutta et al. [25], financed emissions are expressed in metric tons of CO2e per USD 1 million invested. This scaling ensures comparability across portfolios of different sizes and is applied uniformly across all tables and figures in the manuscript.
Carbon savings are computed as the percentage difference in financed emissions between the carbon-efficient index and the benchmark index. Under this definition, carbon savings are reported as negative percentages when the carbon-efficient index exhibits lower financed emissions than the benchmark. This convention is consistent with Dutta et al. [25] and reflects relative reductions in financed emissions compared to the benchmark portfolio.
This measure provides a transparent link between portfolio allocation decisions and carbon exposure, allowing for direct comparison of financed emissions across alternative carbon-efficient indices constructed using different normalization choices. Detailed descriptions of the carbon-efficient index construction procedure are provided in Appendix A.1.
5. Empirical Results: Carbon Intensity Reshuffling
5.1. Carbon Intensity Scaling and Fundamental Tilts in Construction
Figure 1 visualizes the within-industry reshuffling effects induced by alternative carbon intensity scaling denominators. Each panel plots firm-level percentile ranks of carbon intensity constructed using an alternative financial denominator against the revenue-based benchmark rank within the Construction & Engineering industry. The 45-degree line represents perfect concordance in rankings across scaling methods.
Figure 1.
Cross-Sectional Reshuffling of Firm Carbon Intensity Ranks Under Alternative Scaling Denominators. Each panel compares firm-level carbon intensity ranks based on an alternative denominator with the revenue-based benchmark rank within the Construction & Engineering industry. The circles represent firm-level observations, and the 45-degree line indicates perfect agreement in ranks across scaling methods. The dispersion of observations around the 45-degree line shows that alternative scaling choices materially reshuffle firms’ relative carbon intensity positions.
While the correlations between alternative and revenue-based rankings range from moderate to high, substantial dispersion around the diagonal is evident across all panels. In particular, valuation-based scaling variables (market value and enterprise value) exhibit lower rank correlations and greater deviation from the diagonal, indicating more pronounced reshuffling relative to accounting- and activity-based denominators. Even for scaling variables with relatively higher correlations, such as cost of goods sold and total assets, the spread of observations away from the 45-degree line reveals economically meaningful shifts in within-industry carbon intensity positions.
Overall, the figure demonstrates that alternative normalization choices do not simply rescale emissions proportionally; rather, they materially reorder firms’ relative carbon intensity standings within the industry. This visual evidence complements the regression and portfolio results by highlighting the cross-sectional magnitude of reshuffling effects.
Table 1 examines how alternative carbon intensity scaling rules reshape relative rankings within the Construction & Engineering industry. The dependent variable measures the change in percentile rank between a carbon-efficient index constructed using an alternative scaling denominator and the revenue-scaled benchmark index. The independent variable is the within-industry percentile rank of the corresponding fundamental ratio.
Dependent variable = R(CO2e/SCALE) − R(CO2e/SALES)
Table 1.
Carbon intensity reshuffling and firm fundamentals: Construction & Engineering industry.
This table reports regression results examining differences in carbon intensity rankings relative to the revenue-scaled benchmark within the Construction & Engineering industry (SIC 15–17). The dependent variable is the difference between a firm’s percentile rank based on an alternative scaling metric (CO2e/SCALE) and its percentile rank under revenue scaling (CO2e/SALES), i.e., R(CO2e/SCALE) − R(CO2e/SALES). The independent variables are rank-transformed fundamental ratios corresponding to each scaling variable (e.g., R(COGS/SALES), R(MV/SALES), etc.). Regressions include year fixed effects to control for time variation. Standard errors are clustered at the firm level. ***, **, and * denote statistical significance at the 1%, 5%, and 10% levels, respectively. The sample consists of publicly traded U.S. firms in the Construction & Engineering industry with available carbon emissions data from 2004 to 2021.
Across all specifications, the coefficient on the matched fundamental ratio is negative and statistically significant at the 1% level. This pattern indicates that differences in carbon-efficient rankings are systematically driven by the mechanical interaction between the scaling denominator and firms’ underlying production or valuation structure. In other words, alternative normalization rules do not simply rescale emissions—they reweight firms according to specific economic characteristics.
The magnitude of the coefficients is economically meaningful. For example, the market-value-scaled specification yields a coefficient of −0.598. Moving from the 25th to the 75th percentile of the MV-to-sales ratio implies an expected rank shift of approximately 0.598 × 0.50 ≈ 0.30, corresponding to a 30 percentile-point reshuffling relative to the revenue benchmark. Similar magnitudes appear for enterprise value (−0.561), assets (−0.483), employment (−0.527), and cost of goods sold (−0.412). These effects indicate substantial within-industry reordering rather than marginal adjustments.
Importantly, the adjusted R2 values range from 22.4% to 31.6%, suggesting that between one-quarter and one-third of the variation in rank differences is explained solely by the corresponding fundamental ratio. This level of explanatory power indicates that normalization-induced reshuffling is not idiosyncratic but structurally linked to firms’ economic profiles.
The strongest reshuffling effects emerge for valuation-based denominators (MV and EV), consistent with the fact that equity market fluctuations amplify rank instability. Employment- and asset-based metrics also generate sizable tilts, reflecting heterogeneity in labor and capital intensity across construction firms. These patterns are economically intuitive: in a project-based industry characterized by diverse subcontracting structures and capital deployment strategies, scaling emissions by alternative denominators mechanically favors specific production models.
From a governance perspective, these findings imply that carbon intensity normalization embeds implicit preferences over cost structure, valuation profile, capital intensity, and workforce composition. In digitally enabled procurement systems—where carbon metrics may be embedded directly into contractor dashboards—these tilts can materially influence which firms are labeled “carbon efficient,” even when underlying emissions are identical. Thus, normalization operates as a structural design parameter rather than a neutral reporting adjustment.
5.2. Fundamental Tilts in Carbon-Efficient Indices
Table 2 examines whether alternative carbon intensity scaling rules systematically tilt carbon-efficient portfolios toward firms with corresponding economic characteristics. The dependent variable measures the difference in portfolio weights between an alternative scaling-based carbon-efficient index and the revenue-scaled benchmark. The key independent variable is the within-industry percentile rank of the matched fundamental ratio.
Table 2.
Fundamental tilts of carbon-efficient index weights: Construction & Engineering subsample.
This table reports regression results examining the fundamental tilts of carbon-efficient index weights within the Construction & Engineering subsample. The dependent variable is the difference in portfolio weights between carbon-efficient indices constructed using alternative scaling variables (CO2e/SCALE) and the benchmark revenue-scaled index (CO2e/SALES). The key independent variables are rank-transformed fundamental ratios corresponding to each scaling choice: cost intensity (COGS/SALES), market capitalization intensity (MV/SALES), enterprise value intensity (EV/SALES), asset intensity (AT/SALES), and labor intensity (EMP/SALES). All regressions include year fixed effects to control for common temporal shocks. The sample consists of 664 firm–year observations for U.S. Construction & Engineering firms. Reported t-statistics are shown in parentheses. ***, **, and * denote statistical significance at the 1%, 5%, and 10% levels, respectively.
Across all specifications, the coefficients on the corresponding fundamental ratios are positive and statistically significant at the 1% level. This pattern indicates that alternative normalization choices mechanically overweight firms with higher values of the associated economic attribute. In other words, scaling emissions by a given denominator does not merely adjust for firm size; it structurally shifts portfolio weights toward firms whose production or valuation profiles align with that denominator.
The economic magnitudes are substantial. For example, the employment-based specification produces a coefficient of 0.3625. A shift from the 25th to the 75th percentile of the employment-to-sales ratio implies an expected portfolio weight increase of approximately 0.3625 × 0.50 ≈ 0.18, corresponding to an 18 percentile-point overweighting relative to the revenue benchmark. Asset-based scaling yields a similarly strong effect (0.2719), while cost-based (0.2561), enterprise-value-based (0.2217), and market-value-based (0.1984) metrics also produce economically meaningful tilts.
The adjusted R2 values range from 14.6% to 20.1%, indicating that between one-sixth and one-fifth of the cross-sectional variation in portfolio reweighting is explained solely by the matched fundamental ratio. This explanatory power suggests that normalization-induced tilts are systematic and economically grounded rather than driven by residual noise.
Importantly, the strongest tilt emerges under employment-based scaling. This result is consistent with the labor-intensive and project-based nature of construction activities, where workforce composition varies substantially across firms. Asset-based scaling also produces sizable effects, reflecting heterogeneity in capital deployment and equipment intensity. Valuation-based denominators generate somewhat smaller—but still statistically robust—tilts, indicating that market-based measures introduce financial structure effects into sustainability portfolio construction.
Taken together, these findings demonstrate that carbon-efficient portfolio construction in the construction sector is tightly linked to firms’ underlying production and organizational characteristics. Because digital construction management systems increasingly embed carbon metrics into procurement dashboards and contractor evaluation algorithms, these mechanically induced tilts imply that normalization choices embed implicit preferences over cost structure, capital intensity, labor utilization, and valuation profiles. As a result, alternative carbon intensity measures can materially influence which firms are classified as “carbon efficient,” even when emissions data are identical.
5.3. Financial Performance of Carbon-Efficient Indices
Panel A of Table 3 evaluates whether alternative carbon intensity scaling choices generate systematic differences in financial performance within the Construction & Engineering industry. Specifically, we report annual raw returns for carbon-efficient indices constructed using six alternative normalization variables (Sales, COGS, market value, enterprise value, total assets, and employment), alongside the industry market benchmark.
Table 3.
Financial performance across carbon-efficient indices: Construction & Engineering subsample (Annual raw returns).
This table reports the financial performance and implementation characteristics of carbon-efficient indices constructed using alternative carbon intensity scaling measures within the Construction & Engineering subsample. Panel A presents annual buy-and-hold returns (July t to June t + 1) for portfolios sorted on emissions scaled by SALES, COGS, MV, EV, AT, and EMP, alongside the value-weighted industry benchmark (μ), over the period July 2005 to June 2023. Panel B reports annual portfolio turnover rates, defined as the percentage change in portfolio weights over the same rebalancing window (July t to June t + 1), for the period July 2006 to June 2023. Panel C presents abnormal returns and abnormal turnover relative to the benchmark portfolio, computed as mean differences in annual returns and turnover rates. Statistical inference is based on time-series tests of mean differences, with significance denoted at the 1%, 5%, and 10% levels.
Across the full sample period (July 2005–June 2023), average annual returns range from 15.6% (employment-scaled) to 16.8% (COGS-scaled), closely tracking the benchmark return of 16.6%. The narrow dispersion in long-run averages suggests that scaling choices do not generate economically meaningful differences in unconditional return performance. Importantly, no normalization variable consistently dominates across market cycles.
However, time-series variation reveals economically informative patterns. During market-wide stress episodes—such as the global financial crisis (2008–2009) and the post-COVID-19 recovery (2020–2021)—return dispersion across scaling methods temporarily widens. For example, in the recovery period (July 2020–June 2021), COGS- and EV-scaled indices slightly outperform sales- and employment-based indices. This pattern likely reflects differential exposure to operating leverage and capital structure effects embedded in alternative denominators. Value-based scaling variables (e.g., MV, EV) mechanically tilt portfolios toward firms with lower relative emissions intensity conditional on market valuation, which may overlap with higher-growth or higher-profitability firms during expansionary periods. In contrast, input-based denominators such as Employment may overweight more labor-intensive firms whose recovery dynamics differ from capital-intensive peers.
These results clarify the mechanism linking scaling methodology to financial outcomes. Although Table 1 documents substantial reshuffling in firm rankings across normalization choices, Panel A shows that this reallocation primarily alters portfolio composition rather than generating distinct return premia. In other words, carbon intensity scaling functions as a portfolio construction rule that changes factor exposures (e.g., size, leverage, or operating efficiency) without systematically pricing carbon efficiency as an independent risk factor within this sector.
From a policy and asset allocation perspective, this finding carries two implications. First, differences in ESG or carbon metrics may meaningfully affect perceived environmental leadership and capital allocation decisions without necessarily altering short-run financial performance. Second, regulators and benchmark providers should recognize that normalization choices embed implicit economic assumptions—yet these assumptions do not appear to translate into persistent abnormal returns in this industry context. Thus, the debate over carbon intensity scaling is less about return enhancement and more about measurement philosophy, comparability, and transparency.
Overall, the evidence suggests that alternative carbon intensity metrics reshape portfolio weights and turnover dynamics but do not produce economically large or systematic differences in raw returns. This strengthens the interpretation that normalization is a first-order design choice affecting classification and capital allocation signals, rather than a source of standalone return premia in Construction & Engineering.
5.4. Turnover Characteristics of Carbon-Efficient Indices
Table 4 evaluates how alternative carbon intensity scaling choices affect portfolio turnover within the Construction & Engineering industry. While Panel A shows that normalization does not materially alter average return performance, Panel B reveals that scaling choices have economically meaningful consequences for portfolio stability and rebalancing intensity.
Table 4.
Annual turnover rates.
Across all specifications, carbon-efficient indices exhibit substantially higher turnover than the construction market benchmark. Average annual turnover ranges from 12.0% (employment-scaled) to 14.8% (market-value-scaled), compared with 9.5% for the benchmark. This 25–55% increase relative to the market portfolio indicates that carbon-efficient screening introduces persistent reallocation pressure, even when return outcomes remain similar.
Importantly, turnover patterns vary systematically by denominator choice. Indices based on market-based scaling variables (MV and EV) consistently display the highest turnover. This result reflects the methodological structure of valuation-based normalization: because the denominator incorporates market prices, fluctuations in equity values mechanically alter carbon intensity rankings, even when firms’ underlying emissions remain stable. Consequently, valuation volatility translates directly into ranking instability and portfolio reshuffling.
In contrast, activity-based denominators such as sales, COGS, total assets, and employment produce relatively lower—though still elevated—turnover. These accounting-based measures evolve more gradually over time, anchoring carbon intensity rankings to operational scale rather than market sentiment. The evidence therefore indicates that normalization affects not only firm classification but also the temporal stability of sustainability signals.
This distinction has direct economic and policy implications. First, higher turnover implies greater transaction costs, implementation frictions, and potential tracking error—particularly relevant for institutional investors managing carbon-efficient mandates. Second, in digitally automated construction management systems where ESG metrics are integrated into procurement algorithms and contractor selection platforms, valuation-sensitive normalization may induce frequent reallocations unrelated to environmental performance improvements. In such contexts, carbon metrics may amplify market volatility rather than reflect structural decarbonization progress.
Taken together, the evidence strengthens the interpretation that carbon intensity normalization is not a neutral technical adjustment. Although alternative scaling choices do not generate systematic return premia, they materially influence portfolio dynamics, rebalancing frequency, and operational complexity. Thus, the practical consequences of normalization lie less in financial outperformance and more in turnover risk, implementation cost, and the stability of sustainability-based capital allocation decisions.
5.5. Abnormal Returns and Abnormal Turnover
Table 5 assesses whether carbon-efficient indices generate abnormal performance or impose additional rebalancing costs relative to the construction market benchmark. Across all scaling choices, abnormal returns are economically small and statistically insignificant. The point estimates range from −0.88% to 0.06%, with t-statistics close to zero, indicating no systematic return premium or penalty associated with alternative carbon intensity measures.
Table 5.
Abnormal returns and turnover rates.
In contrast, abnormal turnover is uniformly positive and highly statistically significant across all specifications. Carbon-efficient indices exhibit excess turnover ranging from 2.4% to 5.1% per year relative to the benchmark. The largest abnormal turnover is observed for indices based on market-value and enterprise-value-scaled emissions, consistent with greater sensitivity of these metrics to changes in firm valuations and rankings.
Taken together, these results reinforce the interpretation that carbon metric choice in construction does not generate abnormal returns but does materially affect portfolio rebalancing intensity. In digitally enabled construction management and automated sustainability assessment systems, such excess turnover represents a nontrivial implementation cost. These findings highlight a key trade-off: while alternative carbon metrics may alter perceived sustainability performance, they do so primarily through increased reallocation and turnover rather than through improved financial outcomes.
5.6. Financed Emissions of Carbon-Efficient Indices
Table 6 evaluates how alternative carbon intensity scaling choices affect financed emissions within the Construction & Engineering industry. Whereas Table 3 showed that normalization has limited implications for return performance but meaningful effects on turnover, Table 4 examines whether these methodological choices translate into differences in actual carbon exposure per dollar invested.
Table 6.
Financed emissions across carbon-efficient indices: Construction & Engineering subsample (Financed emissions in CO2e tons per USD 1 million invested).
This table reports financed carbon emissions and emission savings for carbon-efficient indices constructed using alternative carbon intensity measures within the Construction & Engineering subsample. Panel A presents annual financed emissions per USD 1 million invested, measured in tons of CO2e, over the 2004–2021 period. The benchmark portfolio (μ) is the value-weighted Construction & Engineering market index. Panel B reports financed emission saving rates relative to the benchmark, defined as the percentage reduction in financed CO2e emissions per USD 1 million invested. Negative values indicate lower emissions compared to the market index. Results are shown for indices constructed using emissions scaled by SALES, COGS, MV, EV, AT, and EMP.
Across the full sample period (2004–2021), all carbon-efficient indices exhibit substantially lower financed emissions than the construction market benchmark. On average, financed emissions range from 37.9 (MV-scaled) to 50.8 (COGS-scaled) tons of CO2e per USD 1 million invested, compared with 63.2 tons for the benchmark portfolio. This represents a reduction of approximately 20–40% relative to the industry market portfolio. Thus, carbon-efficient screening materially lowers financed carbon exposure in an inherently emissions-intensive sector.
Importantly, emission reductions vary systematically by denominator choice. Indices based on market-based scaling variables (MV and EV) consistently produce the lowest financed emissions throughout the sample period. This pattern is consistent with the methodological structure of valuation-based normalization. Because emissions are scaled by market value or enterprise value, firms with relatively high valuations and lower emissions intensity are more likely to receive higher portfolio weights. In practice, this tilts the portfolio toward firms with stronger profitability, growth expectations, or capital market performance, which often coincide with lower emissions per valuation dollar.
By contrast, accounting-based denominators such as sales and COGS yield higher financed emissions relative to MV- and EV-scaled indices. These measures anchor carbon intensity to operational scale rather than market valuation. As a result, firms with large revenue bases but relatively carbon-intensive production processes may still qualify as carbon-efficient under certain accounting-based metrics, leading to higher aggregate financed emissions compared to valuation-scaled approaches. Asset- and employment-based measures fall between these extremes, reflecting intermediate sensitivity to operational scale and capital intensity.
The cross-year pattern further reinforces this interpretation. During periods of elevated industry-wide emissions intensity—such as 2008–2009—absolute emission levels rise across all portfolios, yet the relative ordering across scaling methods remains stable. This persistence indicates that the observed differences are structural consequences of normalization methodology rather than temporary market fluctuations.
Taken together, Table 3 and Table 4 clarify the economic trade-off embedded in carbon intensity design. While normalization choices do not generate systematic return premia, they produce economically meaningful differences in financed carbon exposure. Thus, carbon intensity scaling is not merely a statistical adjustment but a portfolio construction rule that shapes real environmental outcomes.
For policymakers, benchmark providers, and digitally automated construction management systems, this distinction is critical. The choice of denominator implicitly determines how capital is allocated across firms and how decarbonization progress is measured. As sustainable finance increasingly relies on financed emissions metrics, transparency regarding normalization methodology becomes essential for comparability, accountability, and policy alignment.
5.7. Financed Emission Saving Rates
Table 7 reports financed emission saving rates relative to the construction market benchmark, measured as the percentage reduction in CO2e per USD 1 million invested. While Panel A established that all carbon-efficient portfolios reduce absolute financed emissions, Panel B quantifies the magnitude of these reductions relative to the industry baseline.
Table 7.
Financed emission saving rates relative to the construction market index (percent reduction in CO2e per USD 1 million invested).
Across all normalization choices and throughout the sample period (2004–2021), carbon-efficient indices deliver economically substantial emission savings. Average reductions range from −17.1% for COGS-scaled measures to −38.7% and −38.5% for MV- and EV-scaled measures, respectively. In practical terms, valuation-based scaling nearly doubles the percentage emission savings achieved under cost-based normalization.
The systematic ordering across denominators is economically informative. Market-value- and enterprise-value-scaled indices consistently produce the largest savings—often exceeding 40% in later years (e.g., 2016–2019). This reflects the structural property of valuation-based normalization: emissions are divided by market-based measures that embed investor expectations and capital market performance. Firms with stronger valuations relative to emissions intensity receive higher weights, mechanically amplifying the carbon reduction effect at the portfolio level.
By contrast, COGS- and sales-based scaling yield more moderate savings (approximately 17–28%). These denominators anchor carbon intensity to operating activity rather than market pricing. As a result, firms with large revenue or cost bases but comparatively carbon-intensive production processes may still remain eligible for higher portfolio weights, attenuating the relative emission reduction. Asset- and employment-based measures fall between these extremes, reflecting partial alignment with production scale while remaining less sensitive to valuation effects.
Importantly, the relative ranking of normalization methods remains stable across the entire sample period, including during macroeconomic disruptions such as the global financial crisis and the COVID-19 period. This persistence indicates that the observed differences are structural consequences of metric design rather than episodic market shocks.
When interpreted jointly with Table 3, a clear economic trade-off emerges. Scaling choices do not materially alter return performance, yet they generate large and persistent differences in financed emission savings. Thus, alternative carbon intensity metrics can produce sharply divergent assessments of sustainability performance—even within a single industry and holding the underlying emissions data constant.
For digitally enabled construction management systems, ESG benchmarks, and automated sustainability dashboards, this result has direct implications. The apparent magnitude of “carbon savings” is highly sensitive to normalization methodology. Policymakers and benchmark designers should therefore recognize that reported decarbonization performance reflects not only underlying emission reductions but also methodological assumptions embedded in scaling choices. Transparency in denominator selection becomes essential for comparability, credibility, and alignment with climate policy objectives.
6. Implications for Digital Construction Management
The empirical findings of this study have direct implications for digitally enabled construction project management systems. As carbon intensity metrics are increasingly embedded into procurement platforms, contractor dashboards, and performance monitoring tools, measurement design choices become operational rather than merely analytical. This section interprets the reshuffling, turnover, and financed emission results through the lens of digital construction management.
6.1. Fundamental Reshuffling and Contractor Rankings
The results demonstrate that alternative carbon intensity scaling choices lead to systematic reshuffling of firm rankings within the Construction & Engineering industry. The regression evidence indicates that deviations from the revenue-based benchmark are strongly associated with firm fundamentals, with adjusted R2 values ranging from 14.6% to 20.1%. Employment-scaled measures generate the strongest fundamental tilts, while asset- and valuation-based scaling also produce economically meaningful reallocation effects.
In a digitally enabled contractor evaluation system, such reshuffling implies that sustainability rankings are highly sensitive to normalization choices. A dashboard relying on CO2e/EMP may systematically disadvantage labor-intensive firms, whereas a CO2e/ASSETS metric may penalize capital-intensive operators. These effects are not driven by differences in absolute emissions but by the economic dimension emphasized in the denominator. Consequently, digital procurement systems may inadvertently embed preferences over production structure rather than purely environmental efficiency.
6.2. Turnover and Implementation Frictions
Although alternative scaling choices do not generate statistically significant differences in average financial performance (returns range from 15.6% to 16.8%, with insignificant abnormal returns), they materially affect portfolio turnover. Carbon-efficient indices exhibit average annual turnover between 12% and 15%, compared with 9.5% for the benchmark. Abnormal turnover ranges from 2.4% to 5.1%, with valuation-based metrics producing the highest reshuffling.
In a digital construction management context, higher turnover translates into operational instability. Contractor shortlists, preferred supplier pools, or sustainability-qualified vendor lists may change more frequently when valuation-sensitive metrics are used. While digital platforms reduce administrative frictions associated with updating rankings, frequent reshuffling may disrupt long-term project coordination, increase onboarding costs, and weaken relational contracting structures that are central to construction delivery. Thus, measurement sensitivity introduces implementation frictions even when financial neutrality is preserved.
6.3. Operational Implications for Digitally Enabled Contractor Evaluation
The financed emission results further highlight the importance of metric design. All carbon-efficient indices reduce financed emissions relative to the construction benchmark, but the magnitude of reductions varies substantially across scaling choices. Average emission savings range from approximately 17% under cost-based scaling to nearly 39% under market- or enterprise-value-based scaling.
In practice, a BIM-integrated sustainability dashboard using CO2e/MV or CO2e/EV may report more than double the emission savings of a dashboard using CO2e/SALES, despite relying on identical underlying emissions data. Such differences may influence how project owners communicate sustainability achievements, structure procurement incentives, or set contractor eligibility thresholds. Importantly, these differences arise from normalization design rather than operational decarbonization.
Taken together, the findings indicate that digitalization amplifies, rather than resolves, ambiguity in sustainability measurement. As carbon metrics become embedded into automated contractor evaluation systems, normalization choices shape contractor rankings, stability of supplier pools, and perceived emission reductions. Effective digital transformation in construction therefore requires not only technological sophistication but also careful governance of metric design. Carbon intensity normalization should be treated as a strategic design decision within digital project management systems rather than a technical reporting detail.
7. Limitation and Future Research Direction
Despite its contributions, this study has several limitations. First, the analysis focuses on a single industry—the Construction & Engineering industry—which enables a clean identification of within-industry normalization-induced reshuffling effects but may limit external validity. Although this industry provides a particularly relevant production-intensive setting, reshuffling dynamics may differ in sectors characterized by alternative cost structures, asset intensity, or valuation patterns. The documented sensitivity therefore reflects industry-specific index mechanics rather than a universal structural law.
Second, the study relies on Scope 1 and Scope 2 emissions data. These emissions are more consistently reported and comparable across firms, which enhances measurement reliability. However, they do not capture the full supply-chain footprint reflected in Scope 3 emissions. In industries with extensive subcontracting and complex value chains, Scope 3 emissions may materially influence intensity rankings. As such, the results should be interpreted as reflecting normalization sensitivity within the more standardized emissions scopes.
Third, the empirical design isolates the mechanical reshuffling effects induced by alternative scaling denominators but does not model firms’ endogenous responses to carbon benchmarking frameworks. The analysis focuses on how ranking and portfolio outcomes change when the normalization rule changes, holding firm behavior constant. In practice, firms may adjust operational structure, capital allocation, or disclosure strategies in response to benchmarking criteria. Such behavioral adaptation could either amplify or attenuate the ranking sensitivity documented in this study.
Fourth, while the manuscript discusses implications for digitally enabled sustainability systems, the empirical analysis is based on public-firm ranking and portfolio construction mechanics rather than direct observation of procurement rules, contractor eligibility thresholds, or project-level decision systems. Accordingly, any operational implications should be interpreted as conditional on the embedding of ranking-based carbon metrics into automated evaluation environments.
These limitations suggest several avenues for future research.
First, extending the analysis to additional carbon-intensive or digitally integrated industries would help assess the generalizability of normalization-induced reshuffling effects. Cross-industry comparisons could clarify whether the construction industry represents a particularly sensitive case or part of a broader benchmarking phenomenon.
Second, incorporating Scope 3 emissions—where reliably measured—would allow researchers to examine whether value-chain carbon intensity amplifies or dampens normalization-induced rank shifts.
Third, future research could explore the dynamic consequences of normalization design, including firms’ behavioral responses to carbon benchmarking criteria, potential feedback effects on investment decisions, and the interaction between measurement rules and capital allocation.
Finally, further work could examine how carbon metric normalization interacts with regulatory frameworks and standardized disclosure regimes, particularly in settings where intensity metrics are formally embedded in benchmarking or reporting standards. Understanding how measurement architecture shapes comparative positioning remains an important question at the intersection of climate finance and industry-specific sustainability governance.
8. Conclusions
This study examines how alternative carbon intensity normalization choices reshape within-industry sustainability rankings in the U.S. Construction & Engineering industry. The evidence demonstrates that different scaling denominators systematically reallocate firm rankings, reflecting differences in accounting, valuation, and production characteristics rather than purely environmental performance.
Although alternative normalization approaches do not generate systematically different average financial returns within this industry, they materially affect portfolio construction outcomes, including turnover intensity and financed emissions measures. These findings indicate that normalization design meaningfully shapes benchmarking results, even when aggregate return performance remains comparable.
The central contribution of the study is to document the sensitivity of within-industry carbon rankings and index outcomes to scaling choice in a production-intensive sector. By restricting the analysis to a single industry and applying a transparent percentile-ranking and index-construction framework, the study isolates normalization-induced reshuffling effects from cross-industry technological heterogeneity.
More broadly, the results highlight that carbon intensity metrics function not merely as descriptive indicators but as structural design parameters within ranking-based evaluation systems. Where such metrics are embedded in benchmarking frameworks or automated sustainability dashboards, normalization choices may influence relative positioning and reallocation dynamics. Accordingly, careful specification and transparent justification of scaling rules are essential to ensure that sustainability benchmarking remains stable, interpretable, and economically meaningful.
Overall, the findings underscore that measurement architecture plays a critical role in shaping comparative sustainability assessments within industry settings. As carbon metrics continue to inform capital allocation, reporting, and benchmarking frameworks, understanding the consequences of normalization design remains an important area for continued research.
Funding
This work was supported by the Hankuk University of Foreign Studies Research Fund. (HUFS2026).
Data Availability Statement
Restrictions apply to the availability of the data used for this study. The data were obtained from a commercial, third-party database under license and are available from the data vendor subject to their terms of use and payment of required fees.
Conflicts of Interest
The author declares no conflicts of interest.
Appendix A
Appendix A.1. Comprehensive Summary of Related Literature
Table A1.
Comprehensive summary of related literature.
Appendix A.2. Step-by-Step Portfolio Construction Procedure
This appendix provides a fully reproducible description of the carbon-efficient index construction procedure.
Step 1. Define Eligible Universe
For each June rebalancing date in year :
- Begin with all publicly traded U.S. firms classified in SIC 15–17.
- Retain firms with:
- ○
- Non-missing Scope 1 and Scope 2 emissions for fiscal year
- ○
- Non-missing scaling denominator for fiscal year
- ○
- Strictly positive denominator value,
- ○
- Denominator ≥ USD 1 million.
- Market value (MV) and enterprise value (EV) are measured at the end of June in year .
The resulting cross-section defines the eligible universe .
Step 2. Compute Carbon Intensity
For each scaling specification :
Emissions include Scope 1 and Scope 2 CO2e from S&P Global Trucost.
Step 3. Construct Percentile Ranks
Within each industry-year cross-section:
- Sort firms in ascending order of carbon intensity .
- Assign 100 discrete rank groups (0–99).
- Compute scaled percentile:
Lower carbon intensity corresponds to lower rank values.
Step 4. Construct Carbon-Efficient Weights
Let baseline market-cap weights be:
Carbon-efficient weights are constructed as:
Thus, firms with lower carbon intensity (lower percentile rank) receive larger weights.
Step 5. Portfolio Returns and Turnover
- Returns measured from July to June
- Turnover computed as:
References
- Pedersen, L.H.; Fitzgibbons, S.; Pomorski, L. Responsible investing: The ESG-efficient frontier. J. Financ. Econ. 2021, 142, 572–597. [Google Scholar] [CrossRef] [Scilit]
- European Commission. Regulation (EU) 2019/2089 of the European Parliament and of the Council of 27 November 2019 amending Regulation (EU) 2016/1011 as regards EU climate transition benchmarks, EU Paris-aligned benchmarks, and sustainability-related disclosures for benchmarks. Off. J. Eur. Union 2019. Available online: https://eur-lex.europa.eu/eli/reg/2019/2089/oj/eng (accessed on 1 January 2026).
- US Securities and Exchange Commission. Final Rule on the Enhancement and Standardization of Climate-Related Disclosures for Investors; (Release No. 33–11275); US Securities and Exchange Commission: Washington, DC, USA, 2024.
- Partnership for Carbon Accounting Financials (PCAF). The Global GHG Accounting and Reporting Standard for Financed Emissions, 2nd ed.; PCAF: Wilmington, DE, USA, 2022. [Google Scholar]
- Matsumura, E.M.; Prakash, R.; Vera-Muñoz, S.C. Firm-value effects of carbon emissions and carbon disclosures. Account. Rev. 2014, 89, 695–724. [Google Scholar] [CrossRef] [Scilit]
- Choi, D.; Gao, Z.; Jiang, W. Attention to global warming. Rev. Financ. Stud. 2020, 33, 1112–1145. [Google Scholar] [CrossRef] [Scilit]
- Ilhan, E.; Sautner, Z.; Vilkov, G. Carbon tail risk. Rev. Financ. Stud. 2021, 34, 1540–1571. [Google Scholar] [CrossRef] [Scilit]
- Bolton, P.; Kacperczyk, M. Global pricing of carbon-transition risk. J. Financ. 2023, 78, 3677–3754. [Google Scholar] [CrossRef] [Scilit]
- Hsu, P.H.; Li, K.; Tsou, C.Y. The pollution premium. J. Financ. 2023, 78, 1343–1392. [Google Scholar] [CrossRef] [Scilit]
- Greenstone, M.; Leuz, C.; Breuer, P. Mandatory disclosure would reveal corporate carbon damages. Science 2023, 381, 837–840. [Google Scholar] [CrossRef] [Scilit]
- Aswani, J.; Raghunandan, A.; Rajgopal, S. Are carbon emissions associated with stock returns? Rev. Financ. 2024, 28, 75–106. [Google Scholar] [CrossRef] [Scilit]
- Atilgan, Y.; Demirtas, K.O.; Edmans, A.; Gunaydin, A.D. Does the Carbon Premium Reflect Risk or Mispricing? SSRN Working Paper No. 4573622; ECGI: Brussels, Belgium, 2023. [Google Scholar]
- European Commission. Commission Delegated Regulation (EU) 2020/1818 of 17 July 2020 supplementing Regulation (EU) 2016/1011 as regards minimum standards for EU climate transition benchmarks and EU Paris-aligned benchmarks. Off. J. Eur. Union 2020, L 406, 17–25. [Google Scholar]
- Pástor, Ľ.; Stambaugh, R.F.; Taylor, L.A. Dissecting green returns. J. Financ. Econ. 2022, 146, 403–424. [Google Scholar] [CrossRef] [Scilit]
- Krueger, P.; Sautner, Z.; Starks, L.T. The importance of climate risks for institutional investors. Rev. Financ. Stud. 2020, 33, 1067–1111. [Google Scholar] [CrossRef] [Scilit]
- Atta-Darkua, V.; Glossner, S.; Krueger, P.; Matos, P. Decarbonizing Institutional Investor Portfolios: Helping to Green the planet or Just Greening Your Portfolio? SSRN Working Paper No. 4212568; ECGI: Brussels, Belgium, 2023. [Google Scholar]
- Hartzmark, S.M.; Shue, K. Counterproductive Impact Investing: The Impact Elasticity of Brown and Green Firms; SSRN Working Paper No. 4359282; ECGI: Brussels, Belgium, 2023. [Google Scholar]
- Chatterji, A.K.; Durand, R.; Levine, D.I.; Touboul, S. Do ratings of firms converge? Implications for managers, investors and strategy researchers. Strateg. Manag. J. 2016, 37, 1597–1614. [Google Scholar] [CrossRef] [Scilit]
- Berg, F.; Koelbel, J.F.; Rigobon, R. Aggregate confusion: The divergence of ESG ratings. Rev. Financ. 2022, 26, 1315–1344. [Google Scholar] [CrossRef] [Scilit]
- Dimson, E.; Marsh, P.; Staunton, M. Divergent ESG ratings. J. Portf. Manag. 2020, 47, 75–87. [Google Scholar] [CrossRef] [Scilit]
- Gibson Brandon, R.; Krueger, P.; Schmidt, P.S. ESG rating disagreement and stock returns. Financ. Anal. J. 2021, 77, 104–127. [Google Scholar] [CrossRef] [Scilit]
- Busch, T.; Johnson, M.; Pioch, T. Corporate carbon performance data: Quo vadis? J. Ind. Ecol. 2022, 26, 350–363. [Google Scholar] [CrossRef] [Scilit]
- Baur, D.G.; Oll, J. From financial to carbon diversification: The potential of physical gold. Energy Econ. 2019, 81, 1002–1010. [Google Scholar] [CrossRef] [Scilit]
- Petitjean, M. Eco-friendly policies and financial performance: Was the financial crisis a game changer for large U.S. companies? Energy Econ. 2019, 80, 502–511. [Google Scholar] [CrossRef] [Scilit]
- Dutta, S.; Hwang, J.; Patatoukas, P.N. Fundamentals of carbon emissions scaling: Implications for sector peer comparisons and carbon efficient indexing. Energy Econ. 2025, 143, 108300. [Google Scholar] [CrossRef] [Scilit]
- Zhang, S. Carbon returns across the globe. J. Financ. 2024, 80, 615–645. [Google Scholar] [CrossRef] [Scilit]
- Okimoto, T.; Takaoka, S. Credit default swaps and corporate carbon emissions in Japan. Energy Econ. 2024, 133, 107504. [Google Scholar] [CrossRef] [Scilit]
- Mazzarano, M.; Guastella, G.; Pareglio, S.; Xepapadeas, A.; Borghesi, S. “Carbon” boards and transition risk: Explicit and implicit exposure implications for total stock returns and dividend payouts. Energy Econ. 2024, 137, 107779. [Google Scholar] [CrossRef] [Scilit]
- Fahmy, H. The rise in investors’ awareness of climate risks after the Paris Agreement and the clean energy–oil–technology prices nexus. Energy Econ. 2022, 106, 105738. [Google Scholar] [CrossRef] [Scilit]
- Downar, B.; Ernstberger, J.; Reichelstein, S.; Schwenen, S.; Zaklan, A. The impact of carbon disclosure mandates on emissions and financial operating performance. Rev. Account. Stud. 2021, 26, 1137–1175. [Google Scholar] [CrossRef] [Scilit]
- Jouvenot, V.; Krueger, P. Mandatory Corporate Carbon Disclosure: Evidence from a Natural Experiment; SSRN Working Paper; ECGI: Brussels, Belgium, 2019. [Google Scholar]
- Davies, S.W.; Van Wesep, E.D. The unintended consequences of divestment. J. Financ. Econ. 2018, 128, 558–575. [Google Scholar] [CrossRef] [Scilit]
- Edmans, A.; Levit, D.; Schneemeier, J. Socially Responsible Divestment; SSRN Working Paper No. 4121445; ECGI: Brussels, Belgium, 2022. [Google Scholar]
- Ben-Amar, W.; Gomes, M.; Khursheed, H.; Marsat, S. Climate change exposure and internal carbon pricing adoption. Bus. Strategy Environ. 2022, 31, 2854–2870. [Google Scholar] [CrossRef] [Scilit]
- OECD. Towards More Accurate, Timely, and Granular Product-Level Carbon Intensity Metrics: Challenges and Potential Solutions; OECD Publishing: Paris, France, 2024. [Google Scholar]
- Fama, E.F.; French, K.R. The cross-section of expected stock returns. J. Financ. 1992, 47, 427–465. [Google Scholar]
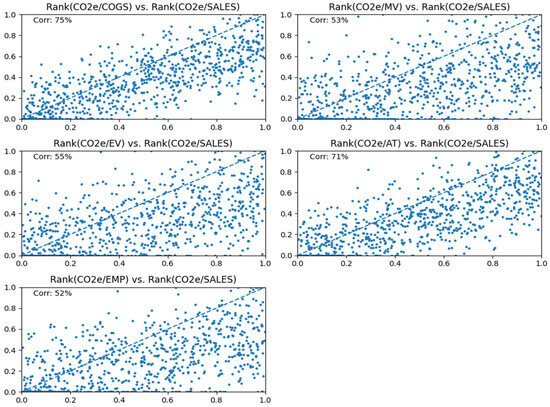
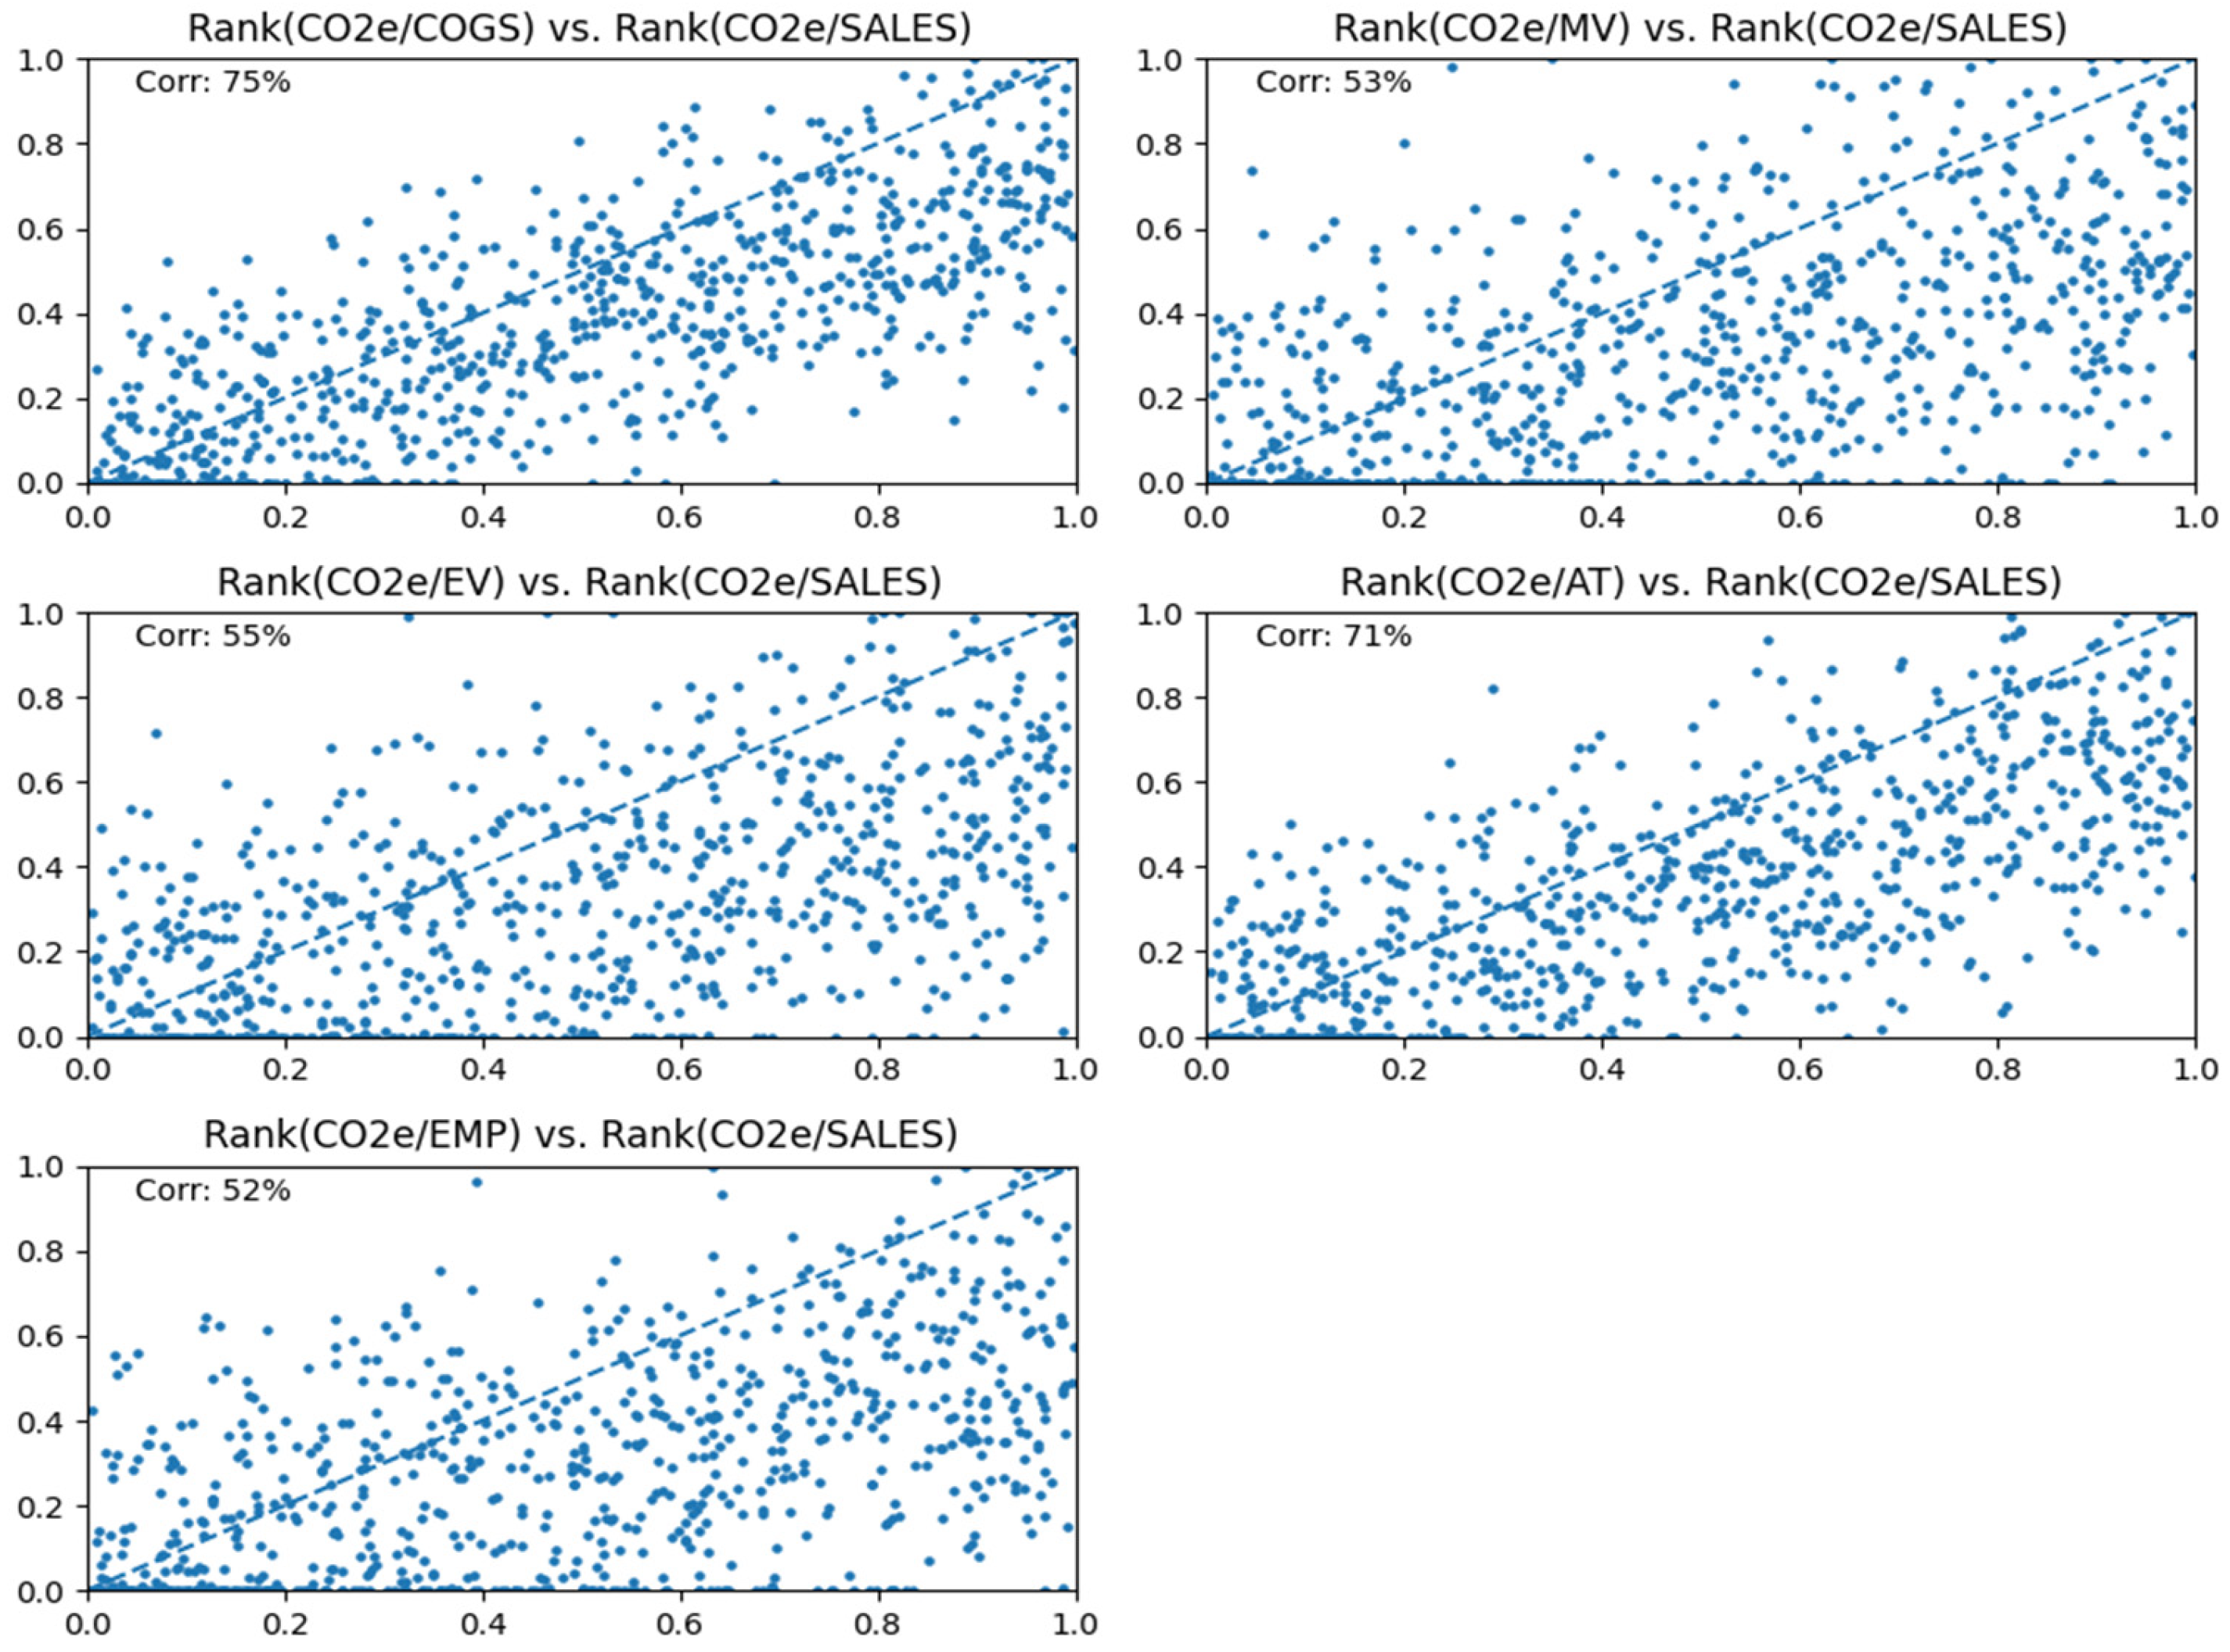

Disclaimer/Publisher’s Note: The statements, opinions and data contained in all publications are solely those of the individual author(s) and contributor(s) and not of MDPI and/or the editor(s). MDPI and/or the editor(s) disclaim responsibility for any injury to people or property resulting from any ideas, methods, instructions or products referred to in the content. |
© 2026 by the author. Licensee MDPI, Basel, Switzerland. This article is an open access article distributed under the terms and conditions of the Creative Commons Attribution (CC BY) license.