


Abstract
Since children spend a significant portion of their developmental years in educational settings, the environmental quality of these institutions—specifically, the extent to which they expose their occupants to green space and heat stress—is a critical determinant of well-being and academic performance. This study assesses the green environmental quality of 121 educational institutions (kindergartens, and elementary and secondary schools) in Debrecen, Hungary. The main objective of the research is to identify educational institutions that require immediate intervention to address their lack of green spaces, improve the green environment, and mitigate the urban heat island (UHI) effect. A further aim of the study is to understand how different urban planning practices over the past century have led to the current situation. Therefore, we utilized high-resolution geospatial data (specifically, WorldView-2 imagery) to classify schoolyard vegetation; Landsat data to derive Land Surface Temperature (LST); and the Hoover index to quantify institutions’ spatial concentration. We developed a composite indicator to categorize green environmental quality and heat stress exposure. Our results reveal deep spatial and institutional inequalities. 47.5% of students attend institutions with low environmental quality. While kindergartens typically offer green-rich environments, secondary schools with significant student populations—which are primarily concentrated in the dense historical downtown—are trapped in “grey” zones possessing poor environmental quality. Furthermore, we identify a “green paradox” in socialist housing estates: despite abundant surrounding greenery, schools here record high LST values due to the heat-trapping morphology of vertical concrete structures. The study also highlights institutional maladaptation, such as converting schoolyards into parking lots and using rubber pavements for safety reasons, which contributes to the deterioration of environmental quality. We conclude that current urban planning and school architecture must shift paradigms, treating schoolyards as integral components of the public green infrastructure network through climate-adaptive design. In addition, stakeholders should develop the green environment of educational institutions comprehensively, taking into account both on-site and surrounding green spaces.
1. Introduction
With increasing urbanization and global climate change, a growing body of literature examines children’s exposure to various environmental factors, including green spaces and the urban heat island effect. Studies prove that it is essential that children live and grow up in a healthy environment that supports their physical, psychological, cognitive, and emotional development and well-being [1,2,3]. Children’s increased exposure to “greenness” may help to reduce various health risks, including childhood obesity [4,5] and attention deficit hyperactivity disorder (ADHD) [6]; it is also positively associated with reducing screen time [7,8].
Since children, including adolescents, spend a significant part of their daily lives in educational institutions such as kindergartens and schools, these institutions and their surroundings must also provide a green, healthy, and aesthetically pleasing environment. Several studies have found a correlation between students’ academic performance and the greenness of schoolyards and school environments [9,10,11,12]. Schoolyards are often considered one of the most important spaces in schools, as they not only provide opportunities for children to play, engage in sports, and relax, but they also facilitate children’s cognitive and social developmental processes (see, for example, [13,14,15,16]). Furthermore, schoolyards rich in greenery, especially trees, can increase children’s connectedness to nature and their environmental engagement [17,18]. Green schoolyards have also been shown to be effective tools for reducing social inequalities, as children living in low-income and racial/ethnic minority communities often have less access to safe, high-quality, and well-maintained urban green spaces [19,20]. Therefore, local governments have launched programs in many cities around the world to make schoolyards greener and to improve the overall quality of schools’ outdoor environments [21,22,23,24,25].
Many studies place research on school environments in a broader urban context. For example, Baró et al. [26] assessed the green infrastructure in and around elementary schools in Barcelona, measuring canopy cover in the school compounds and within a 300 m radius around the schools. Gallez et al. [27] examined the green and blue land cover and tree canopy cover in 300/500 m buffer zones around primary schools in four European cities. Furthermore, Li et al. [28] provided evidence that greater canopy density around schools can positively influence adolescents’ academic performance. Sivarajah et al. [29] found that trees more positively affect students’ academic performance than other vegetation types. Finally, a recent study by Aerts et al. [30] urges that schoolyards be developed simultaneously with urban green spaces to improve students’ attention and well-being effectively. These studies go beyond emphasizing the importance of making schoolyards greener; they also support the development of green infrastructure around schools.
As global climate change intensifies, greening (i.e., making greener) schoolyards and school environments becomes extremely important, as trees can mitigate the urban heat island effect effectively [31]. Studies have shown that many schools are located in urban heat islands; for example, a study reviewing the United States found that 76% of the 6.2 million students enrolled in 12,000 public schools attend schools placed in extreme heat islands [32]. Another recent study found that thousands of schools in California have experienced canopy loss, while extreme heat and drought are becoming more frequent in the state [33]. Furthermore, according to a 2022 report by the European Environment Agency, nearly half of Europe’s schools are in areas with strong urban heat island effects [34]. For example, a study by Antoniadis et al. [35] shows that the surface temperature of schools with asphalt-paved schoolyards is much higher than that of schools with tree canopies, which can cause thermal discomfort and even heat stress in pupils. Students’ increased exposure to heat poses various health risks and can also affect academic performance. More specifically, large-scale research by Park et al. [36] showed that heat exposure during the learning period “directly slows the rate of human capital formation, in part through persistent disruptions to the learning process.” A study by McCormack [37] associates hot temperatures with increased student absences and behavioral problems. In response, the European Union has launched a “COOLSCHOOLS” project (https://coolschools.eu) that aims to implement nature-based solutions in schools to adapt to climate change (i.e., creating climate shelters). It will analyze the benefits of the interventions [38].
In summary, the quantity and quality of green spaces within and around an educational institution, as well as whether the educational institution is located in an urban heat island, are important factors influencing children’s development, academic performance, and overall well-being. However, few studies examine the environmental conditions of educational institutions located in different areas with typical built-up characteristics [39,40], nor do many investigate how the urban planning prevailing in different eras of the city is responsible for the current situation. This is especially true for post-socialist countries in Central and Eastern Europe, where subsequent urban planning regimes set different planning goals and prioritized the development of different areas in the city [41,42,43].
Therefore, we have set ourselves two main goals in this study. First, we will examine the extent to which students enrolled in 121 educational institutions in Debrecen are exposed to green spaces and to the urban heat island effect. Educational institutions with asphalt-paved schoolyards, a “gray” surrounding environment, inaccessible urban green spaces, and high land surface temperatures require immediate interventions to create a healthy environment for children. Second, we seek to understand the responsibility of past and present urban planning in generating the current situation.
With this research we intend to address two research gaps. First, by conducting a citywide, institution-level screening framework that integrates “within-schoolyard” and “around-schoolyard” environmental conditions, we go beyond the dominant literature, which often focuses on intervention sites, behavioral outcomes, or thermal comfort measurements in a small number of schools [3,35,44]. Second, while environmental justice in the post-socialist urban context is well discussed at a general level, schools and children’s exposure are not commonly investigated in that literature.
2. Data and Methods
2.1. Study Area
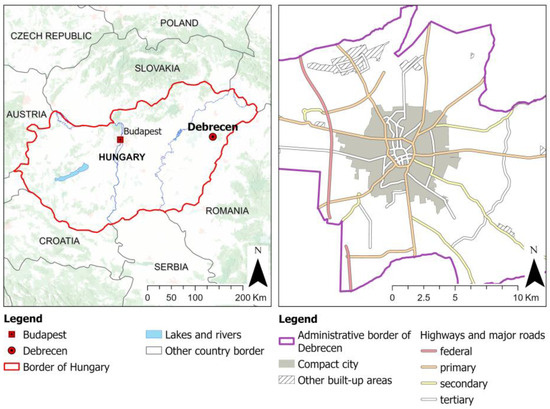
We conducted our research in Debrecen, the second most populous city in Hungary. Debrecen (47°31′54″ N 21°37′28″ E) is located in Hajdú-Bihar County, in the eastern part of Hungary (Figure 1). With an area of 461.25 square kilometers, it is the third-largest settlement in the country. In our analysis, we consider Debrecen’s “compact city” area, which represents the largest contiguous built-up area within the city’s administrative boundaries, defined morphologically to exclude spatially detached or weakly connected built-up areas shaped by socialist-era administrative measures and mergers.
Figure 1.
Debrecen’s location in Hungary and the boundaries of the compact city.
Like most Hungarian cities, Debrecen’s population has been decreasing for decades. According to the most recent census in 2022, its population dropped to less than 200,000 from 211,000 in 2011. However, in the past decade, the city has undergone rapid economic development and industrialization. Recently, several foreign multinational companies—primarily those in the automotive industry and in lithium-ion battery production—have established manufacturing plants in the city. For example, German carmaker BMW has built a 400-hectare gigafactory, and CATL, the world’s leading lithium-ion battery manufacturer, is now completing construction of its largest European factory, covering more than 220 hectares [45]. Thanks to these developments, the city’s population has begun to grow slowly, with the local government expecting greater growth and a future population of 250,000. Furthermore, neighboring suburban settlements are experiencing even faster population growth. Debrecen provides several urban services, including education, for these residents.
Debrecen has one of the largest education systems in Hungary. According to Educational Authority data, there are 121 educational institutions in the city, including kindergartens and elementary and secondary schools. More than 38,000 students are enrolled in these institutions. Given that there are only 33,000 children under 18 in the city, this suggests that Debrecen’s education system (primarily its secondary schools) also provides services to children from neighboring settlements. Additionally, the city is home to the University of Debrecen, one of the largest universities in Hungary, with 30,000 students.
NextGIS Overture Map data suggests that there are approximately 60 urban green spaces in Debrecen, most of which are less than 1 hectare in size, satisfying local demands. The city has five larger parks, each of at least 1 hectare, among which the Great Forest (Nagyerdő) park stands out with its more than 30 hectares of green space and complex ecosystem services. The total area of urban green spaces is 192 hectares, comprising only 2.54% of Debrecen’s built-up area and 0.42% of the city’s administrative area. This means that the average green space per capita in Debrecen is 9.5 square meters, which is slightly higher than the WHO recommendation of at least 9 square meters of green space per capita [46]. Furthermore, there are 16,373 hectares of forest, mainly in the eastern part of the city, while more than 90% of the city’s 19,126 hectares of agricultural areas are located in the west.
Hungary’s annual average temperature is rising. The annual average temperature in 2023 and 2024 was higher than in any year since 1901. Additionally, in 2024, the number of hot days with temperatures exceeding 30 °C reached 60, with 28 heat waves being recorded; both are considered records for the past 120 years (see, for example, Szabó et al. [47]). The Great Hungarian Plain on which Debrecen is located is extremely exposed to the effects of climate change and includes the most drought-prone areas in Hungary [48]. Urban heat islands may affect Debrecen’s urban climate more frequently due to long-term changes in meteorological conditions [49].
2.2. Data Collection
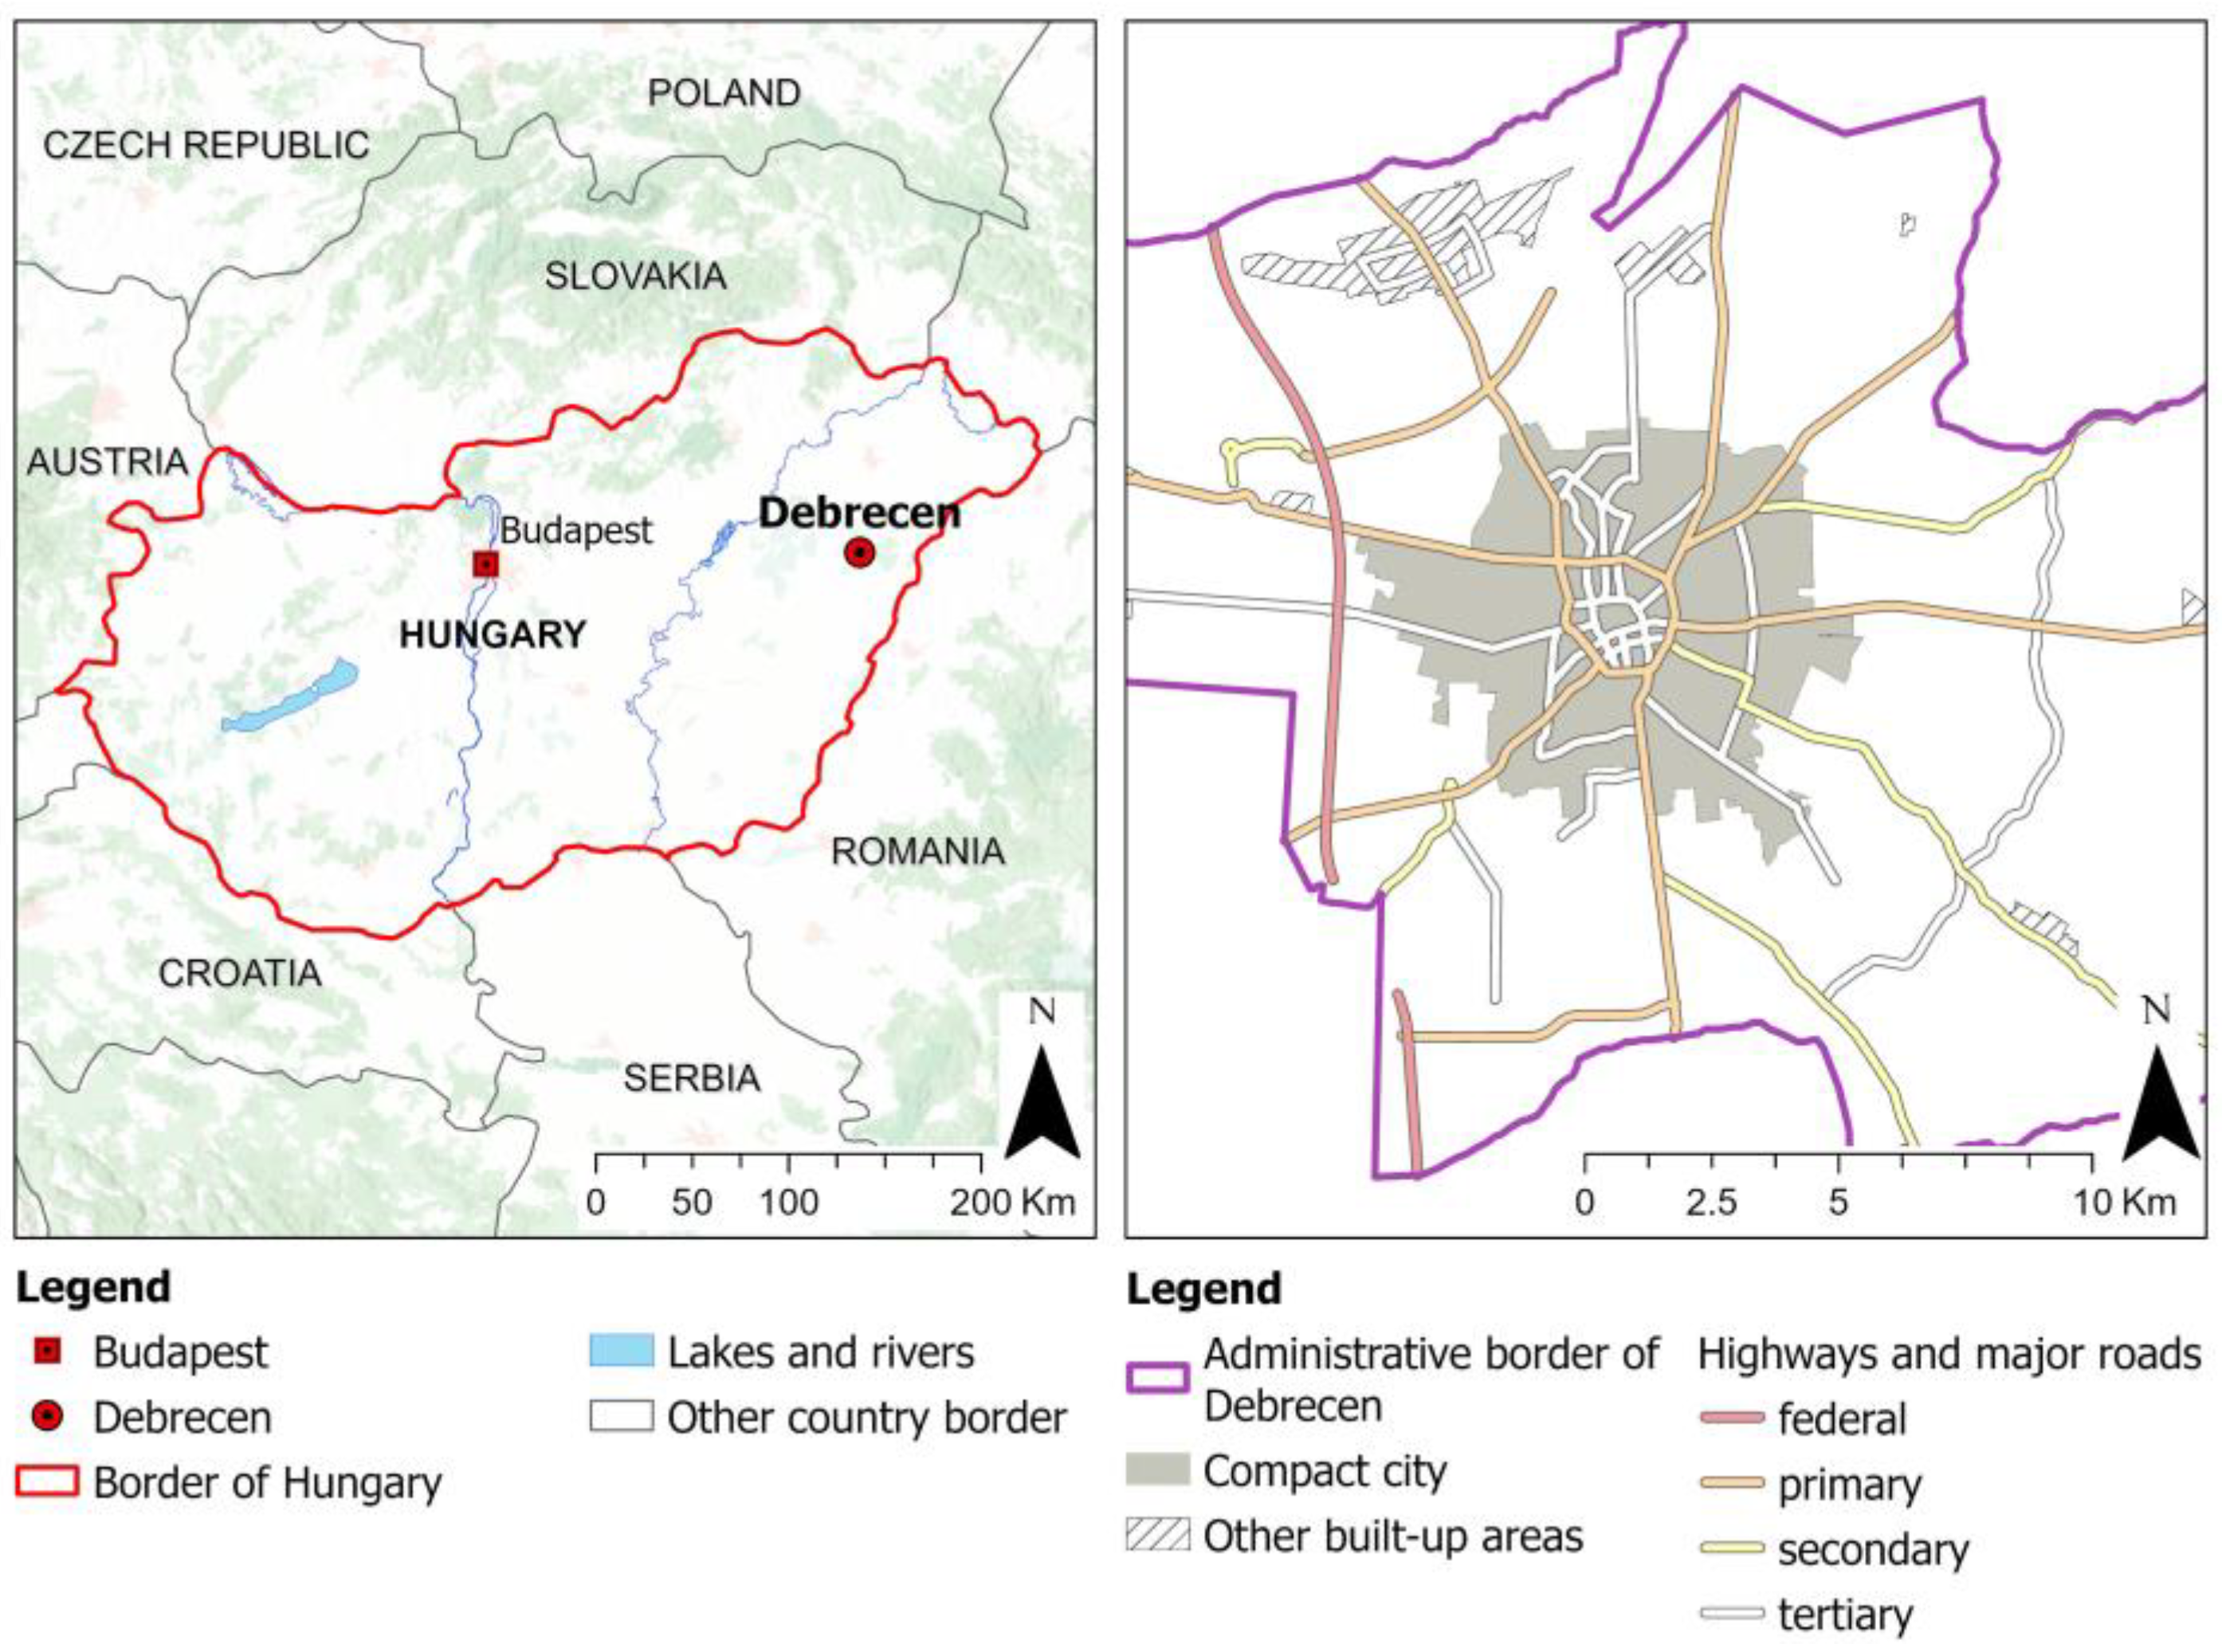
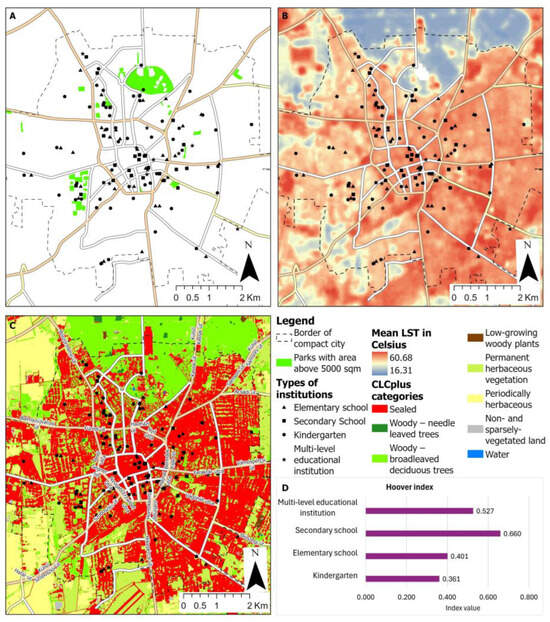
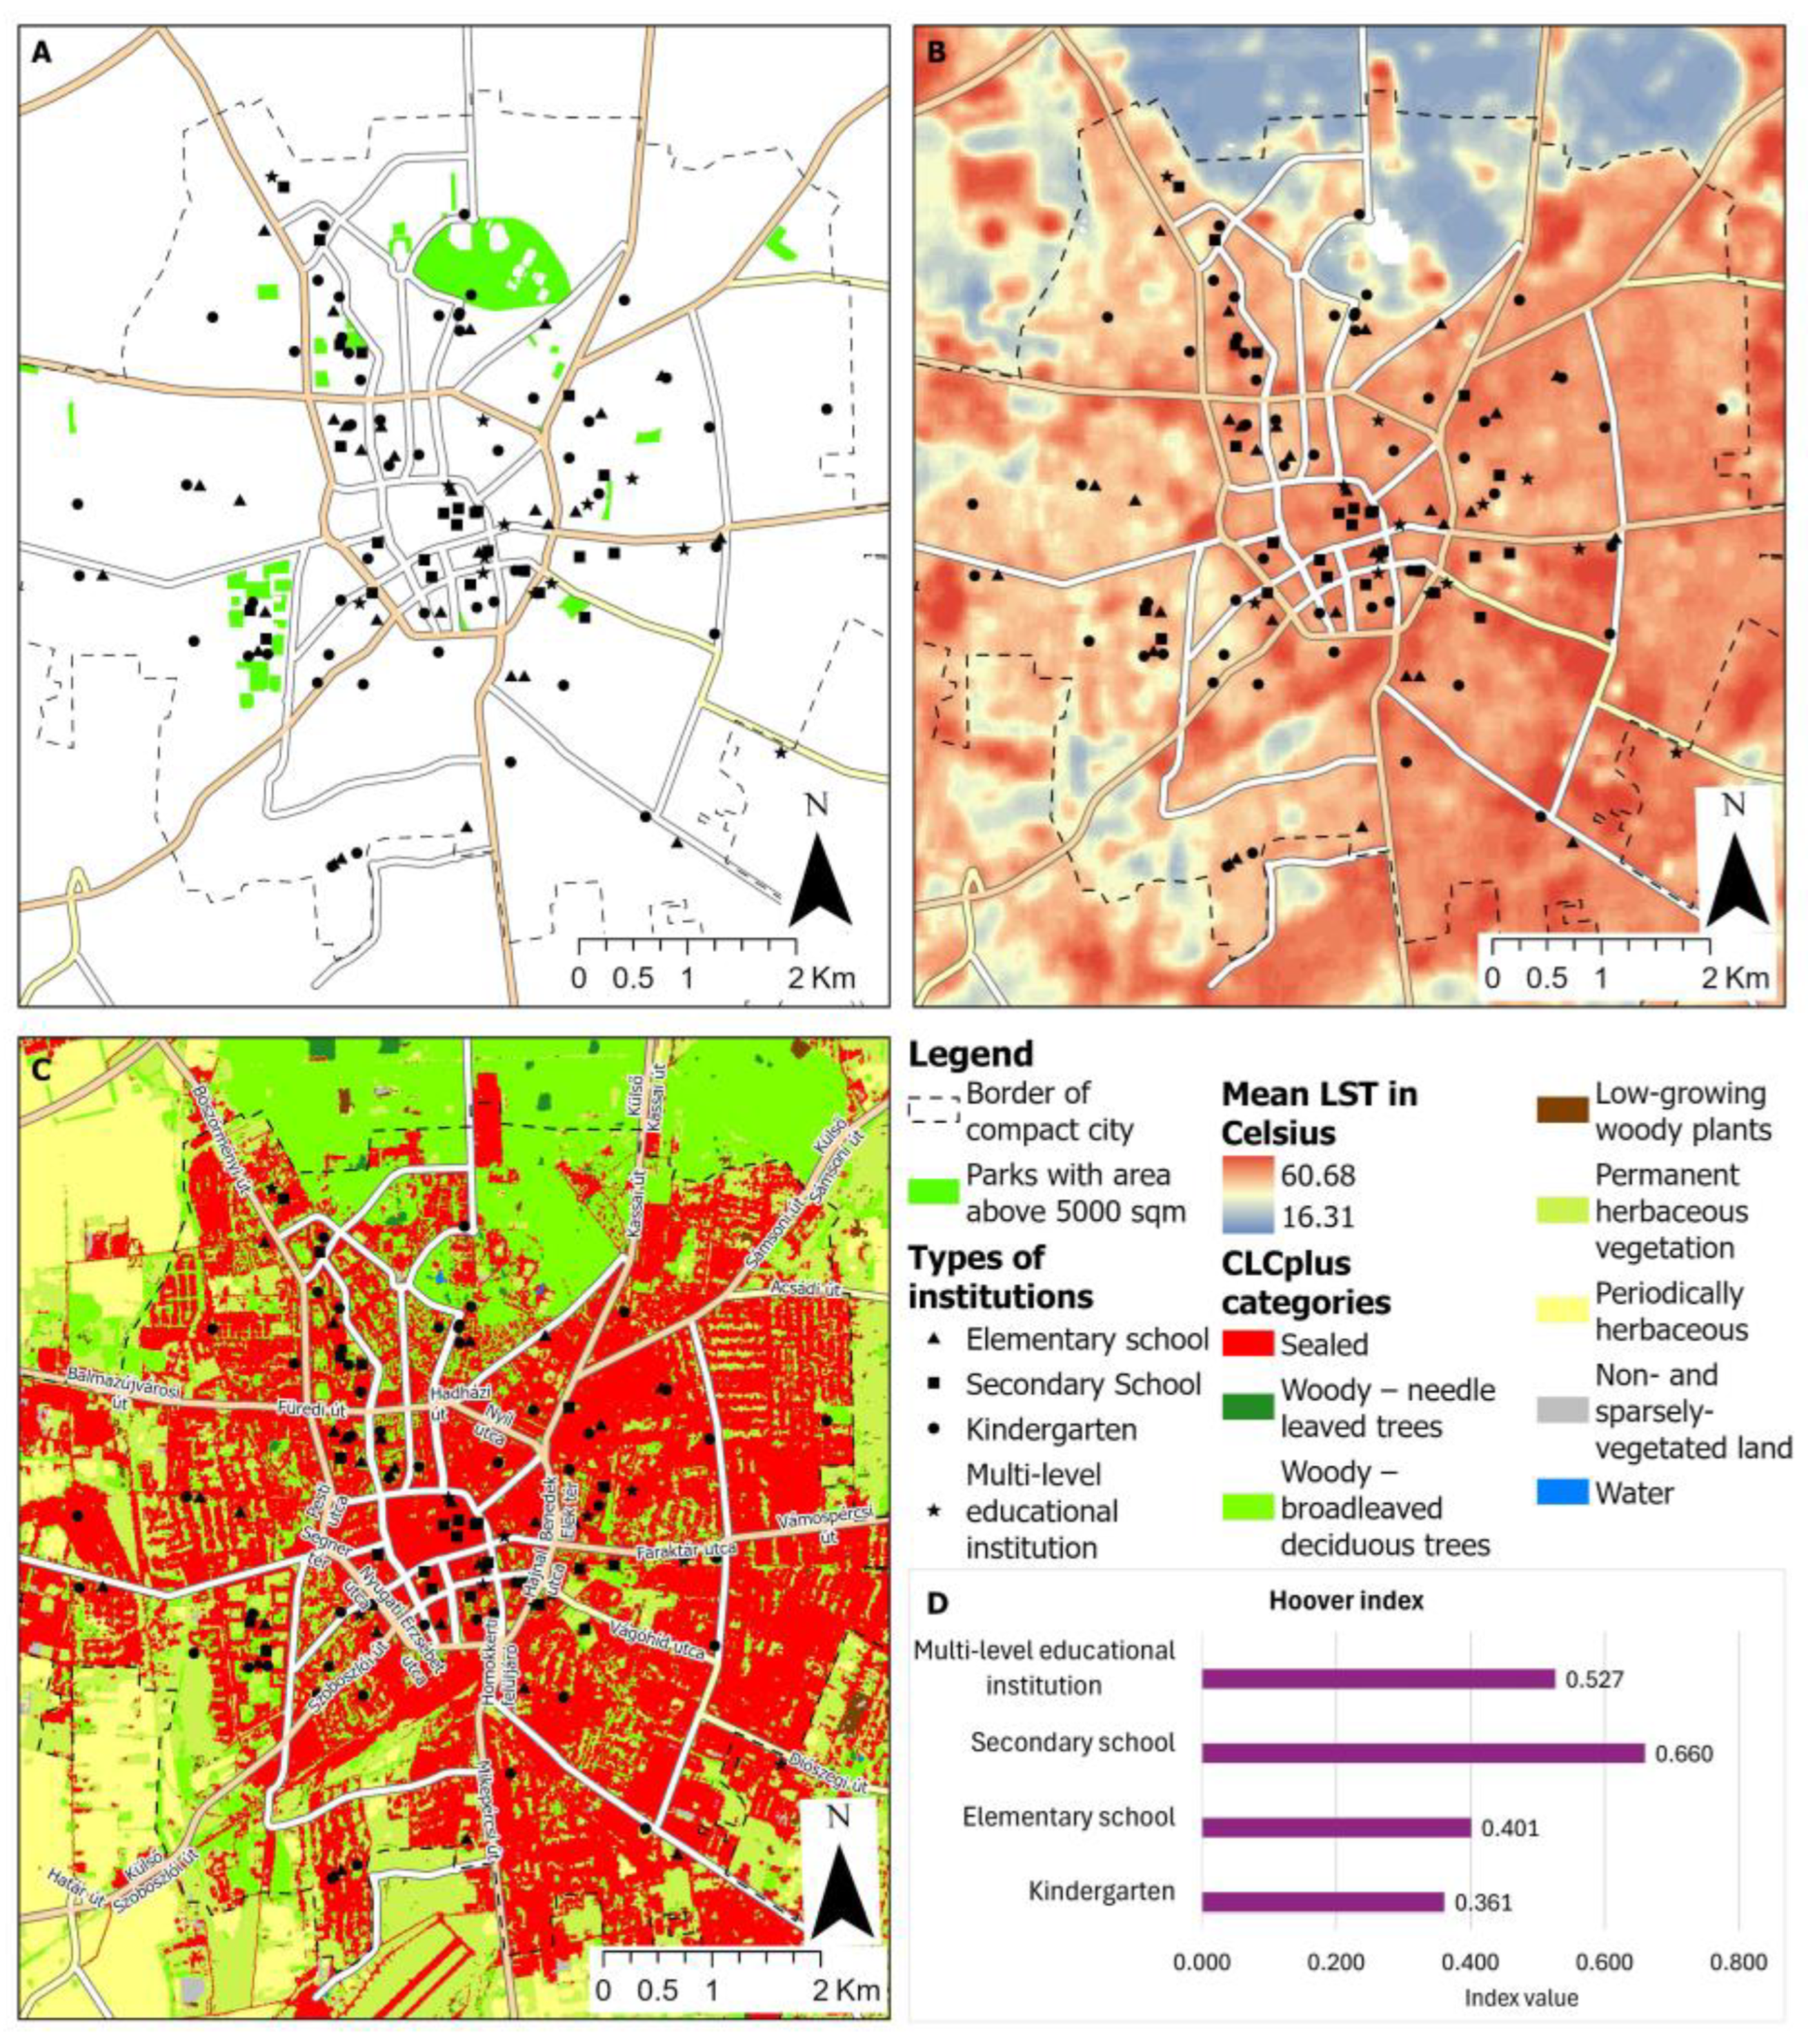
Using data from the public education information system operated by the Educational Authority, we geolocated a total of 121 educational institutions in Debrecen (Figure 2). This database also contained data on the number of students enrolled in different educational institutions. In 2023, 38,152 students were enrolled in Debrecen’s educational institutions, with 5749 children in kindergartens and 11,094 and 16,603 children in elementary and secondary schools, respectively. In addition, 4706 children studied in multi-level educational institutions, which are institutions that combine different levels of the education system (e.g., kindergarten with elementary school, or the latter with secondary school).
Figure 2.
Distribution of educational institutions and parks (A), and LST (B) in Debrecen, as well as the CLCplus Backbone 2021 categories (C). (D) shows the value of the Hoover Index according to different types of educational institutions.
We undertook the geolocation process via Google Maps. Using the cadastral map of Debrecen, we determined each institution site’s cadastral parcel identifiers. The dataset included the parcels’ polygon data parcels and the building footprints located on them. This allowed us to identify the schoolyards’ central coordinates.
We classified a multispectral image of the WorldView-2 (WV-2) sensor to determine the proportion of green vegetation in each schoolyard. The image was taken on 24 July 2016, with no cloud cover. We improved the 2 m resolution of multispectral bands by applying pan-sharpening using the Gram-Schmidt method in ENVI/IDL 5.3 software [50,51]. We achieved a 0.5 m resolution.
We analyzed the educational institutions’ surroundings’ land cover data using the CLCplus Backbone 2021 raster dataset with a spatial resolution of 10 m, published by the Copernicus Land Monitoring Service [52].
We extracted public park data from the polygon POI layer of the OpenStreetMap dataset curated by NextGIS. We included areas identified as parks in the dataset and measuring at least 0.5 hectares in our analysis, in line with WHO guidelines [46]. We chose this threshold because parks of this size or larger are often well-equipped with playgrounds and/or sports fields, which offer an ideal alternative to schoolyards. By adopting this threshold, we excluded from our analysis some smaller urban green spaces located in the downtown area, which do not primarily accommodate facilities designed for children.
We used Land Surface Temperature (LST) data as a proxy for thermal environmental quality. However, it is essential to distinguish LST, as employed in this study, from the ambient air temperature (Tair) directly experienced by students. LST denotes the radiative temperature of the surface “skin,” which is generally higher and more variable than air temperature during the day due to the physical properties of surface materials. Nevertheless, LST is a crucial determinant of the urban microclimate, influencing the sensible heat flux that warms the lower atmosphere. Previous research has demonstrated a strong and significant correlation between LST and near-surface air temperature, thereby validating the use of LST as a robust proxy for spatial analysis in contexts in which dense networks of air temperature sensors are unavailable. While LST does not perfectly capture human thermal comfort indices (which also consider humidity and wind), studies indicate that LST is effective in identifying relative thermal “hotspots” and areas of potential heat stress. For example, Goldblatt et al. [53] found that satellite-derived LST could reliably classify areas into “very hot” thermal comfort categories. Furthermore, the high spatial resolution of satellite imagery facilitates the detection of micro-scale thermal disparities between paved schoolyards and green spaces that would be overlooked by standard meteorological monitoring.
Both approaches (i.e., LST and air temperature) are used in studies on educational institutions’ thermal conditions. For example, Cho [54], Graff Zivin et al. [55], and Park et al. [56] used air temperature to examine the association between elevated heat and students’ academic performance, while Méndez-Lázaro et al. [57] classified schools in Puerto Rico into different risk levels associates with heat-related symptoms based on LST values.
We obtained LST data from Landsat Level 2 datasets provided by the U.S. Geological Survey’s Earth Resources Observation and Science (EROS) Center. Specifically, we used Landsat 8–9 Operational Land Imager/Thermal Infrared Sensor (OLI/TIRS) Collection 2 data [58]. We collected LST data on 7, 15, and 23 June 2024, at approximately 11:20 a.m. local time, with a spatial resolution of 30 m. During processing, we used the quality assurance (QA) layer to mask out low-quality pixels.
2.3. Methods
Our analysis was based primarily on geospatial methods and we conducted it in ArcGIS Pro 3.5.3. We determined the extent and proportion of vegetated areas within schoolyards from WV-2 imagery using image classification and spatial analysis. For the image classification, we differentiated three categories: (1) trees, (2) low vegetation such as grass or bushes, and (3) non-vegetated areas, encompassing other types of land cover. We collected 211 points of training data for each category. We employed the XGBoost machine learning algorithm [59] for image classification, utilizing a 5-fold cross-validation approach within a Python 3.12 environment. The classification achieved an overall accuracy of 94.5% (Table 1), with a weighted F1-score of 0.945, signifying a high level of concordance between the classification map and the reference data. As demonstrated by Szabó et al. [60], the F1-score serves as a reliable indicator of classification performance, maintaining stability even in scenarios in which true negative cases predominate. Moreover, the close alignment between accuracy and F1-score values indicates a robust and replicable model, as low variance in accuracy metrics is a critical marker of model stability and reproducibility. These metrics affirm that the resulting vegetation map provides a dependable foundation for subsequent analyses related to green space exposure and thermal comfort.
Table 1.
Classification performance of WV-2 image.
We clipped the citywide WV-2 image and classification to schoolyard areas, masked buildings after verifying the footprint layer, and had a ModelBuilder model automatically calculate the green surface area and proportion using zonal statistics.
Based on the CLCplus Backbone 2021 dataset, we quantified land cover categories within 300 m buffer zones drawn around the centroid of each schoolyard. Within these buffer zones, we also calculated the area of parks larger than 0.5 hectares.
After applying the standard USGS formula to convert digital numbers (DN) to temperature values in Kelvin [ST = (DN × 0.00341802) + 149.0] and transforming it to Celsius, we extracted the values for three acquisition dates by averaging the LST of the schoolyard centroid and its adjacent pixels. We then averaged the three resulting values to enhance the robustness of the temperature estimates.
Parallel to the environmental assessment, we analyzed the spatial distribution of educational institutions to determine whether they are evenly dispersed across the urban fabric or concentrated in specific zones. To quantify this spatial inequality, we employed the Hoover index (H) [61], comparing the distribution of institutions with the areal extent of different neighborhood types. We calculated the index using the following equation:
where Ei represents the proportion of the total number of educational institutions located in neighborhood type i, and Ai denotes the proportion of the city’s total built-up area occupied by neighborhood type i. The resulting value ranges from 0 (perfect equality) to 1 (maximum concentration) (see more in Figure 2 and Section 3.3).
We developed a composite environmental quality indicator (EQI), which is a comparative, planning-oriented diagnostic to classify the environmental quality of educational institutions into three categories (bottom, middle, and top terciles), supporting the interventions rather than serving as a direct measure of well-being or thermal comfort. EQI therefore integrates two complementary dimensions: (i) environmental provision, reflecting the potential of green infrastructure to support shading, evapotranspiration and usable outdoor space for breaks and physical activity, and (ii) surface thermal burden, reflecting spatial patterns of LST. Provision is represented by (a) schoolyard green space per student and (b) neighborhood-scale opportunities proxied by the share of tree-covered areas and areas of parks within 300 m. Exposure is represented by satellite-derived LST, interpreted as a surface-thermal indicator suitable for identifying hot spots. This “provision and exposure” structure follows established principles in composite indicators, where multiple dimensions of a complex construct are combined for transparent comparison and decision support [62].
Because component indicators are expressed in different units and ranges, we apply min–max normalization to map each component to a common [0, 1] scale before aggregation; we reverse-normalize LST so that lower surface temperatures correspond to more favorable conditions. Min–max scaling is a widely used and transparent normalization method in composite-indicator construction [62]. In the absence of an empirically defensible basis for assigning differential importance across the provision and exposure dimensions, we use equal weights as a transparent baseline to avoid introducing additional, untestable normative assumptions. This is a common practice when the theoretical structure, empirical knowledge, or stakeholder agreement is insufficient to justify alternative schemes [62,63,64]. Based on the EQI scores, we grouped institutions into three equally sized categories: low environmental quality (41 institutions), medium environmental quality (40 institutions), and high environmental quality (40 institutions).
3. Results
3.1. General Assessment of Environmental Quality in Educational Settings
The analysis reveals significant disparities in the environmental conditions provided by educational institutions in Debrecen. A substantial proportion of the student population is exposed to unfavorable environmental conditions; specifically, 47.5% of children attend institutions classified as having low environmental quality. In these institutions, all green indicators fall below city-specific averages, and the mean Land Surface Temperature (LST) is 1.86 °C higher than the average calculated for the compact city.
Conversely, institutions offering high environmental quality—characterized by performance well above city-specific values—accommodate only 20.1% of the total student population. As detailed in Table 2, the contrast in green infrastructure is marked: high-quality institutions provide an average schoolyard green space of 21.3 m2/person and a 27.2% tree canopy cover within a 300 m buffer. In comparison, low-quality institutions offer only 4.3 m2/person and 6.0% tree cover, respectively.
Table 2.
Average values of green indicators and mean LST by environmental quality category. Educational institutions with low environmental quality host 47.5% of the total student population.
3.2. Disparities by Institutional Type
Environmental quality varies distinctly across different levels of education (Table 3). Kindergartens exhibit the most favorable conditions, with the highest average category-normalized EQI value (1.12); notably, 49.1% of kindergartens offer high environmental quality. However, this benefit is limited to a small demographic, as only 5749 children attend these 53 institutions. The remaining 84.9% of the student population attends elementary, secondary, or multi-level educational institutions, where environmental conditions are significantly poorer.
Table 3.
Average values of green indicators and mean LST by different types of educational institutions. Kindergartens perform well in terms of environmental quality, while secondary schools with the largest enrollments underperform in this regard.
The category-normalized EQI values for elementary, secondary, and multi-level institutions consistently fall below the city-specific average. Secondary schools, which host the largest share of the student body (43.5%), perform particularly poorly regarding available green space and thermal environmental quality. Only 11.5% of secondary school students experience high environmental quality, compared to 27.9% in elementary schools and 44.5% in kindergartens. Multi-level institutions also demonstrate low environmental quality, recording the lowest proportions of both tree-covered areas and parkland within their 300 m buffer zones.
3.3. Spatial Distribution and Urban Morphology
When we quantify spatial concentration via the Hoover index, we reveal a clear distributional gradient, on which the relatively even dispersion of early childhood institutions contrasts sharply with the high concentration of secondary education facilities. Kindergartens show the lowest EQI value (0.361), indicating a relatively even distribution across the city. Elementary schools are also moderately evenly distributed (0.401). In contrast, secondary schools exhibit the highest Hoover index (0.660), reflecting a strong spatial concentration, particularly in the downtown and housing estate areas. Multi-level institutions show a moderately uneven distribution (0.527).
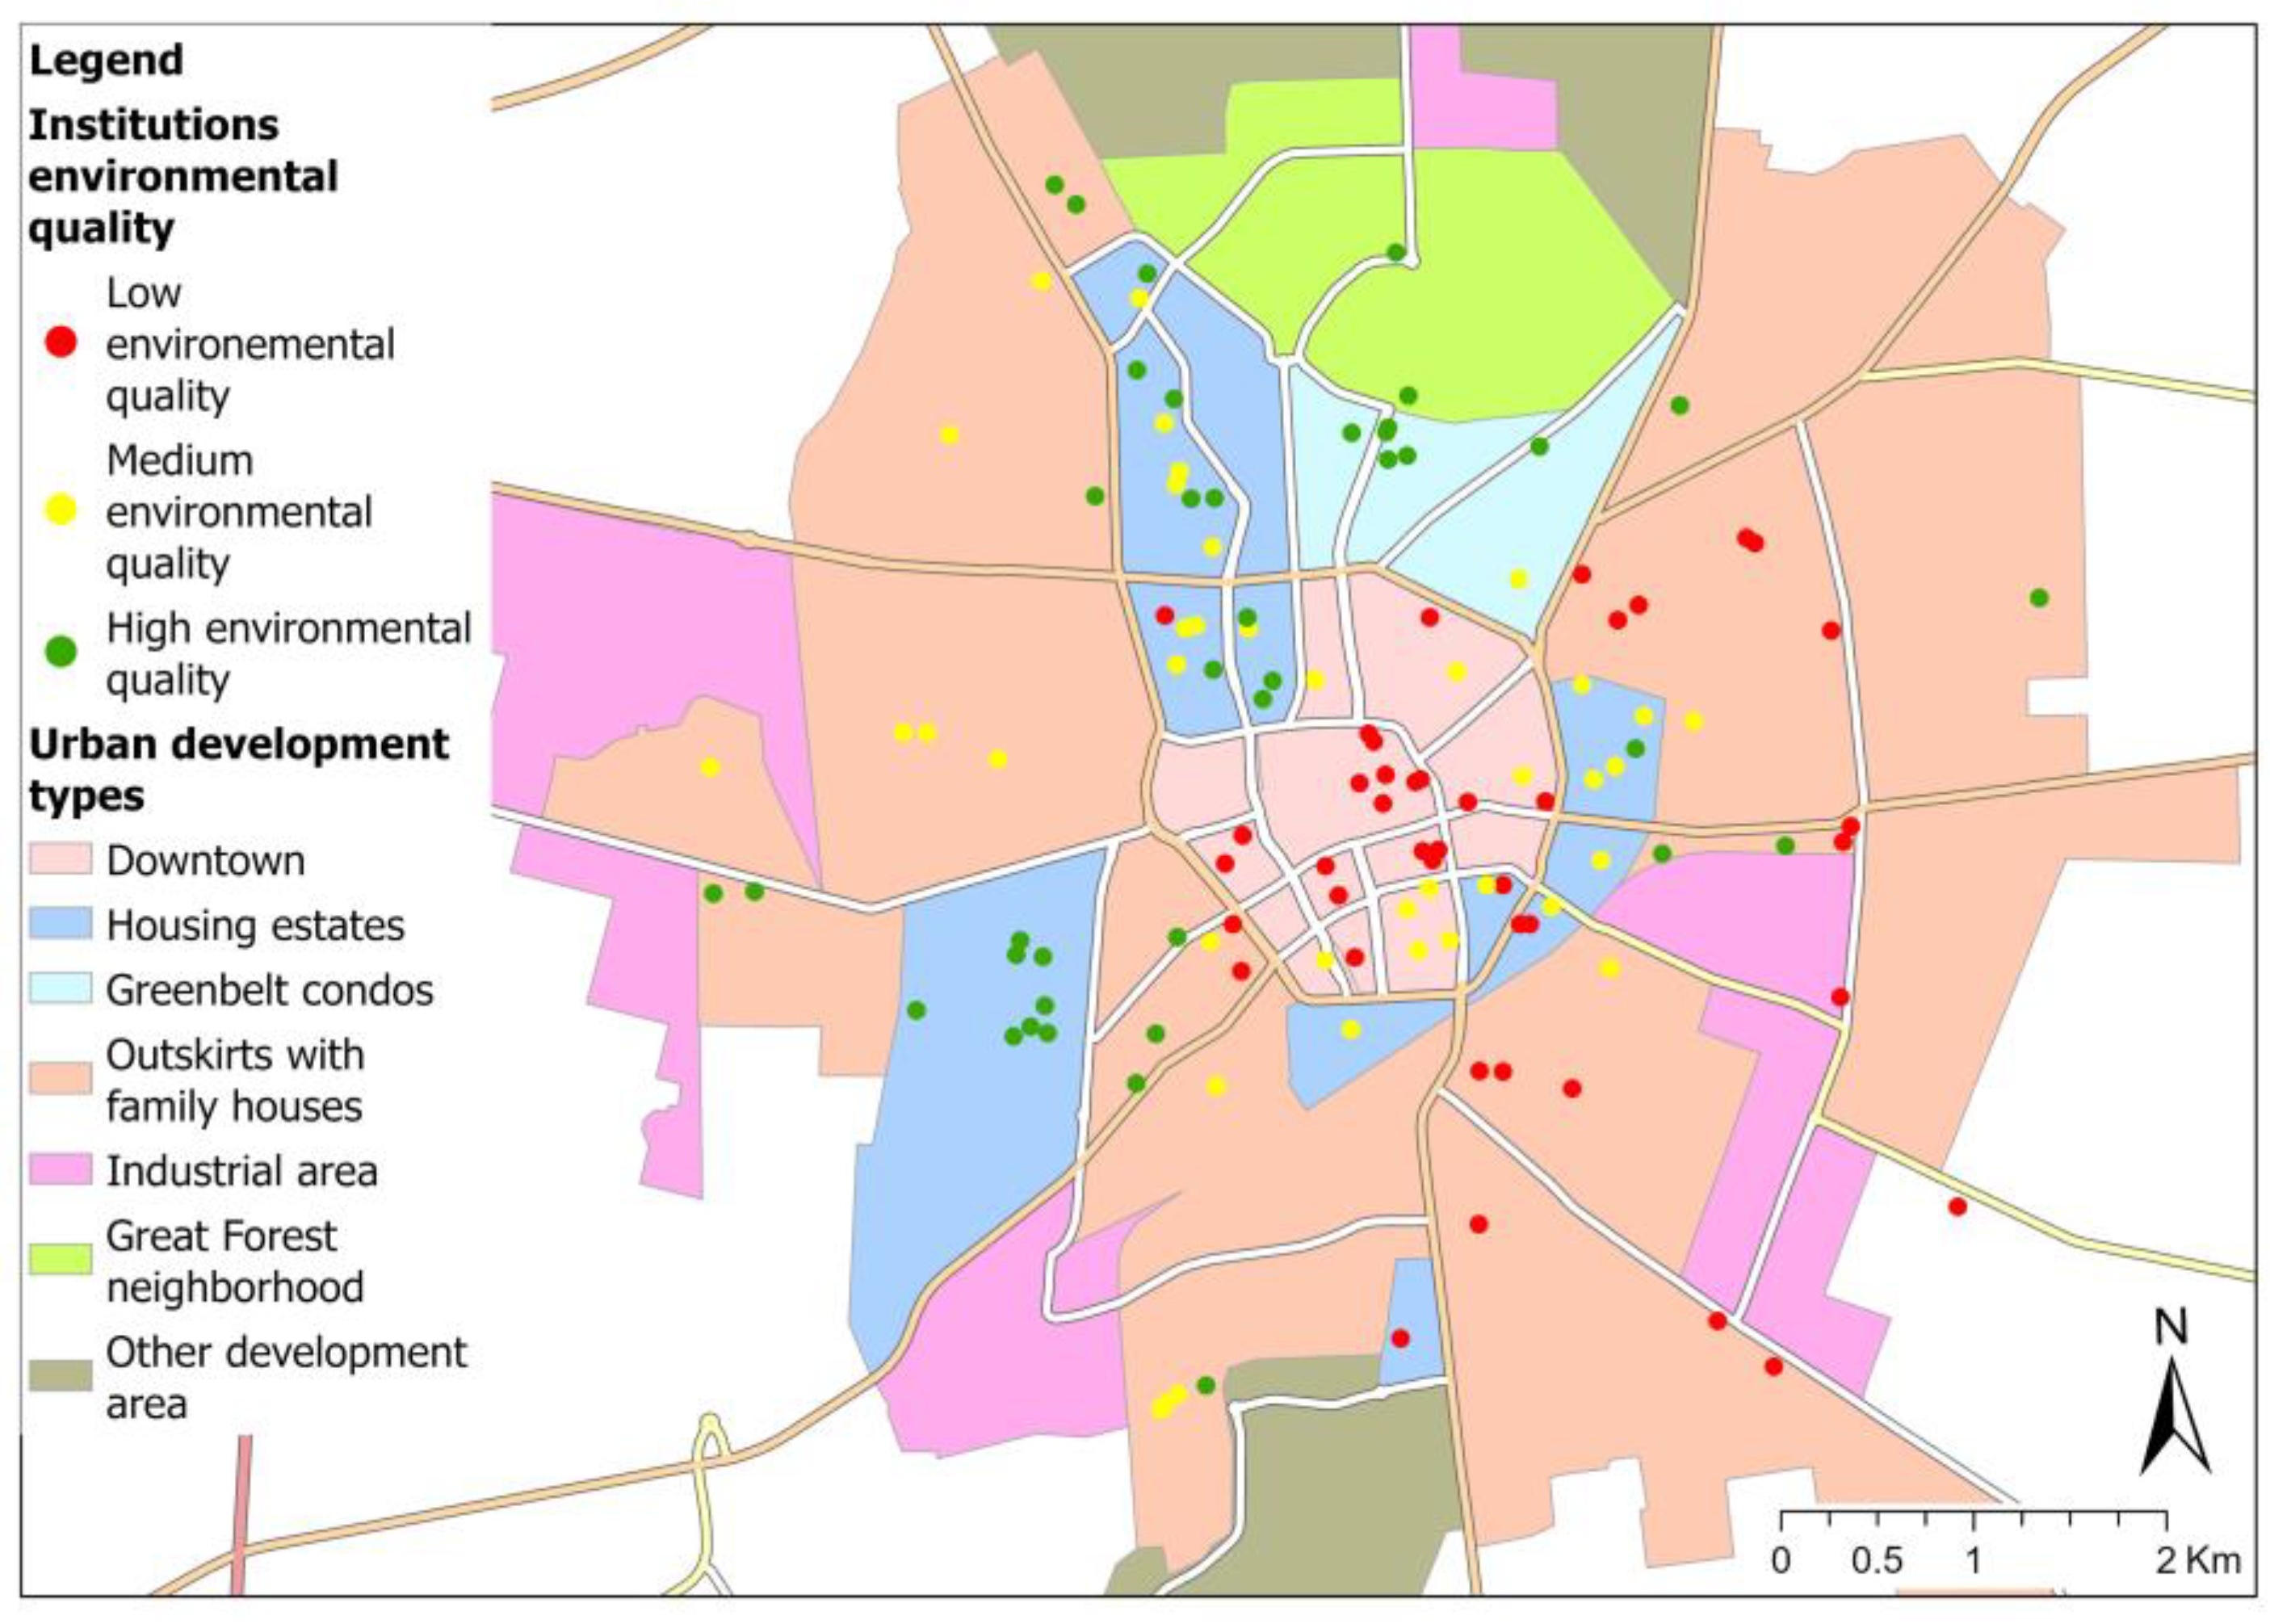
To elucidate the relationship between urban morphology and environmental exposure, we analyzed the distribution of institutions across the zones defined by the Sustainable Urban Development Strategy (SUDS) (https://www.debrecen.hu/assets/media/file/hu/46598/debrecen_megyei_jogu_varos_fenntarthato_varosfejlesztesi_strategiaja_2021-2027strategiai_munkaresz.pdf [accessed on 17 January 2026]). This spatial classification reveals that 90.9% of all educational facilities are concentrated in three specific neighborhood types—the downtown area, housing estates, and the outskirts—which impose fundamentally different environmental conditions on the student population (Figure 3 and Table 4).
Figure 3.
Location of educational institutions of different environmental quality in Debrecen.
Table 4.
Average values of green indicators and mean LST by Debreceni area. Educational institutions located in areas of socialist housing estates with prefabricated houses perform much better in terms of environmental quality than those in the downtown and the outskirts, which are often called “garden cities”.
The distinct built-up characteristics of these three dominant areas drive the observed disparities in green infrastructure and thermal environmental quality that we detail below:
- (i)
- Downtown: This area presents the most challenging environmental conditions. It hosts a high density of secondary schools (40% of such institutions), yet 69.2% of all downtown educational facilities are characterized by low environmental quality. The average category-normalized EQI value here is the lowest in the city (0.46). Due to the density of the urban fabric, secondary schools in the downtown are confined to small parcels averaging 3522 m2—roughly one-third of the city average for this type of institution —resulting in minimal schoolyard green space (1.26 m2/student).
- (ii)
- Housing estates: Housing estates offer significantly better environmental conditions than the downtown area. Although these are high-density areas, they are well-equipped with urban green spaces, resulting in an average category-normalized EQI value (1.02) that exceeds the city average. Notably, 45% of institutions here have high environmental quality. The average parcel area for educational institutions is considerable (9662 m2), with 43.3% green space coverage. Secondary schools in these zones benefit from parcels averaging 14,122 m2—four times larger than those in the downtown area—allowing 7.0 m2 of green space per student. However, despite the abundance of vegetation, mean LST remains relatively high in these zones.
- (iii)
- Outskirts: This zone contains the highest number of institutions (44), which are predominantly kindergartens. The average environmental quality (0.83) is close to the city-specific average. While these institutions provide schoolyard green space exceeding the city average, their surrounding 300 m buffer zones are characterized by very low proportions of tree cover and park areas, contributing to higher average LST values.
- (iv)
- Other areas: The remaining areas host few institutions (8.3%) but represent environmental extremes. The Great Forest neighborhood and Greenbelt condos offer the highest environmental quality, with the former showing the lowest LST and highest green indicators due to its proximity to the city’s largest park. Conversely, the single institution located in an industrial area exhibits high schoolyard greening but is compromised by poor surrounding environmental quality and a very high LST.
4. Discussion
4.1. The Environmental Quality Imperative in Educational Settings
Children and adolescents spend a substantial proportion of their developmental years within the physical confines of educational institutions. International education statistics indicate that an average academic year ranges between 170 and 190 teaching days [65,66]. In the Hungarian context, the observed 2025/2026 academic year consisted of 186 teaching days, meaning that students were present in educational institutions for at least 51% of the year. Consequently, schools’ environmental quality—which encompasses both green infrastructure and thermal environmental quality—is not merely an aesthetic consideration but a fundamental public health issue.
Our analysis of 121 educational institutions in Debrecen reveals a concerning spatial dichotomy. While kindergartens typically provide favorable environmental conditions, the institutions serving the largest student populations (i.e., secondary schools and multi-level educational institutions) are frequently situated in environmentally compromised locations. This pattern suggests that as children progress through the educational system, their exposure to heat stress increases while their access to restorative green spaces decreases. This finding is particularly critical given the growing body of literature highlighting the benefits of green school environments for children’s development, academic performance, and overall well-being [3,67]. The disparities we identified are not random; rather, they are the spatial manifestations of distinct urbanization eras, from the dense historical core to the socialist housing estates and the sprawling outskirts.
4.2. Historical Legacies: The Constraints of the Compact City
The pronounced environmental deficit observed in the downtown area is a direct legacy of 19th-century urban planning paradigms. The historical core of Debrecen, which concentrates a significant number of prestigious secondary schools, is characterized by a high density of built-up areas and a scarcity of unsealed surfaces. Many of these institutions operate in protected heritage buildings that were established in the late 19th and early 20th centuries.
At the time of their founding, these schools served much smaller student populations, for whom the original schoolyards provided adequate recreation space. However, over the last century, student enrollment has surged significantly, increasing pressure on limited open spaces. Unlike in newer developments, the morphological rigidity of the historical urban fabric prevents spatial expansion. The streets surrounding these schools are often narrow, filled with underground utilities, and prioritized for traffic, making the retrofitting of street trees or green buffers technically and financially challenging. Consequently, downtown students are exposed to a “grey” environment characterized by small, paved schoolyards and significant UHI effects.
It should be noted, however, that these downtown secondary schools are easily accessible by car, public transportation, and bicycle, which remains an important factor for many parents when considering school choice [68,69]. While poor environmental quality is obviously a disadvantage affecting downtown secondary schools, their accessibility can be considered an important advantage. Specifically, if students need less time to get to school, they will have more time to sleep. Several studies have shown that greater sleep duration in adolescents is associated with better academic performance and can positively affect executive function, mood, and behavior [70,71,72]. Therefore, the question is whether it is possible to simultaneously improve environmental quality and accessibility in the downtown area.
4.3. The Modernist Paradox: Green Abundance and Thermal Discomfort
One of the most counter-intuitive findings of this study is the environmental performance of educational institutions located in socialist housing estates. Developed primarily in the 1970s and 1980s, these neighborhoods were designed according to Modernist principles, with planners aiming to create self-sufficient neighborhoods that provided residents with basic public services, including education and urban green spaces, within the residential perimeter [73,74,75,76].
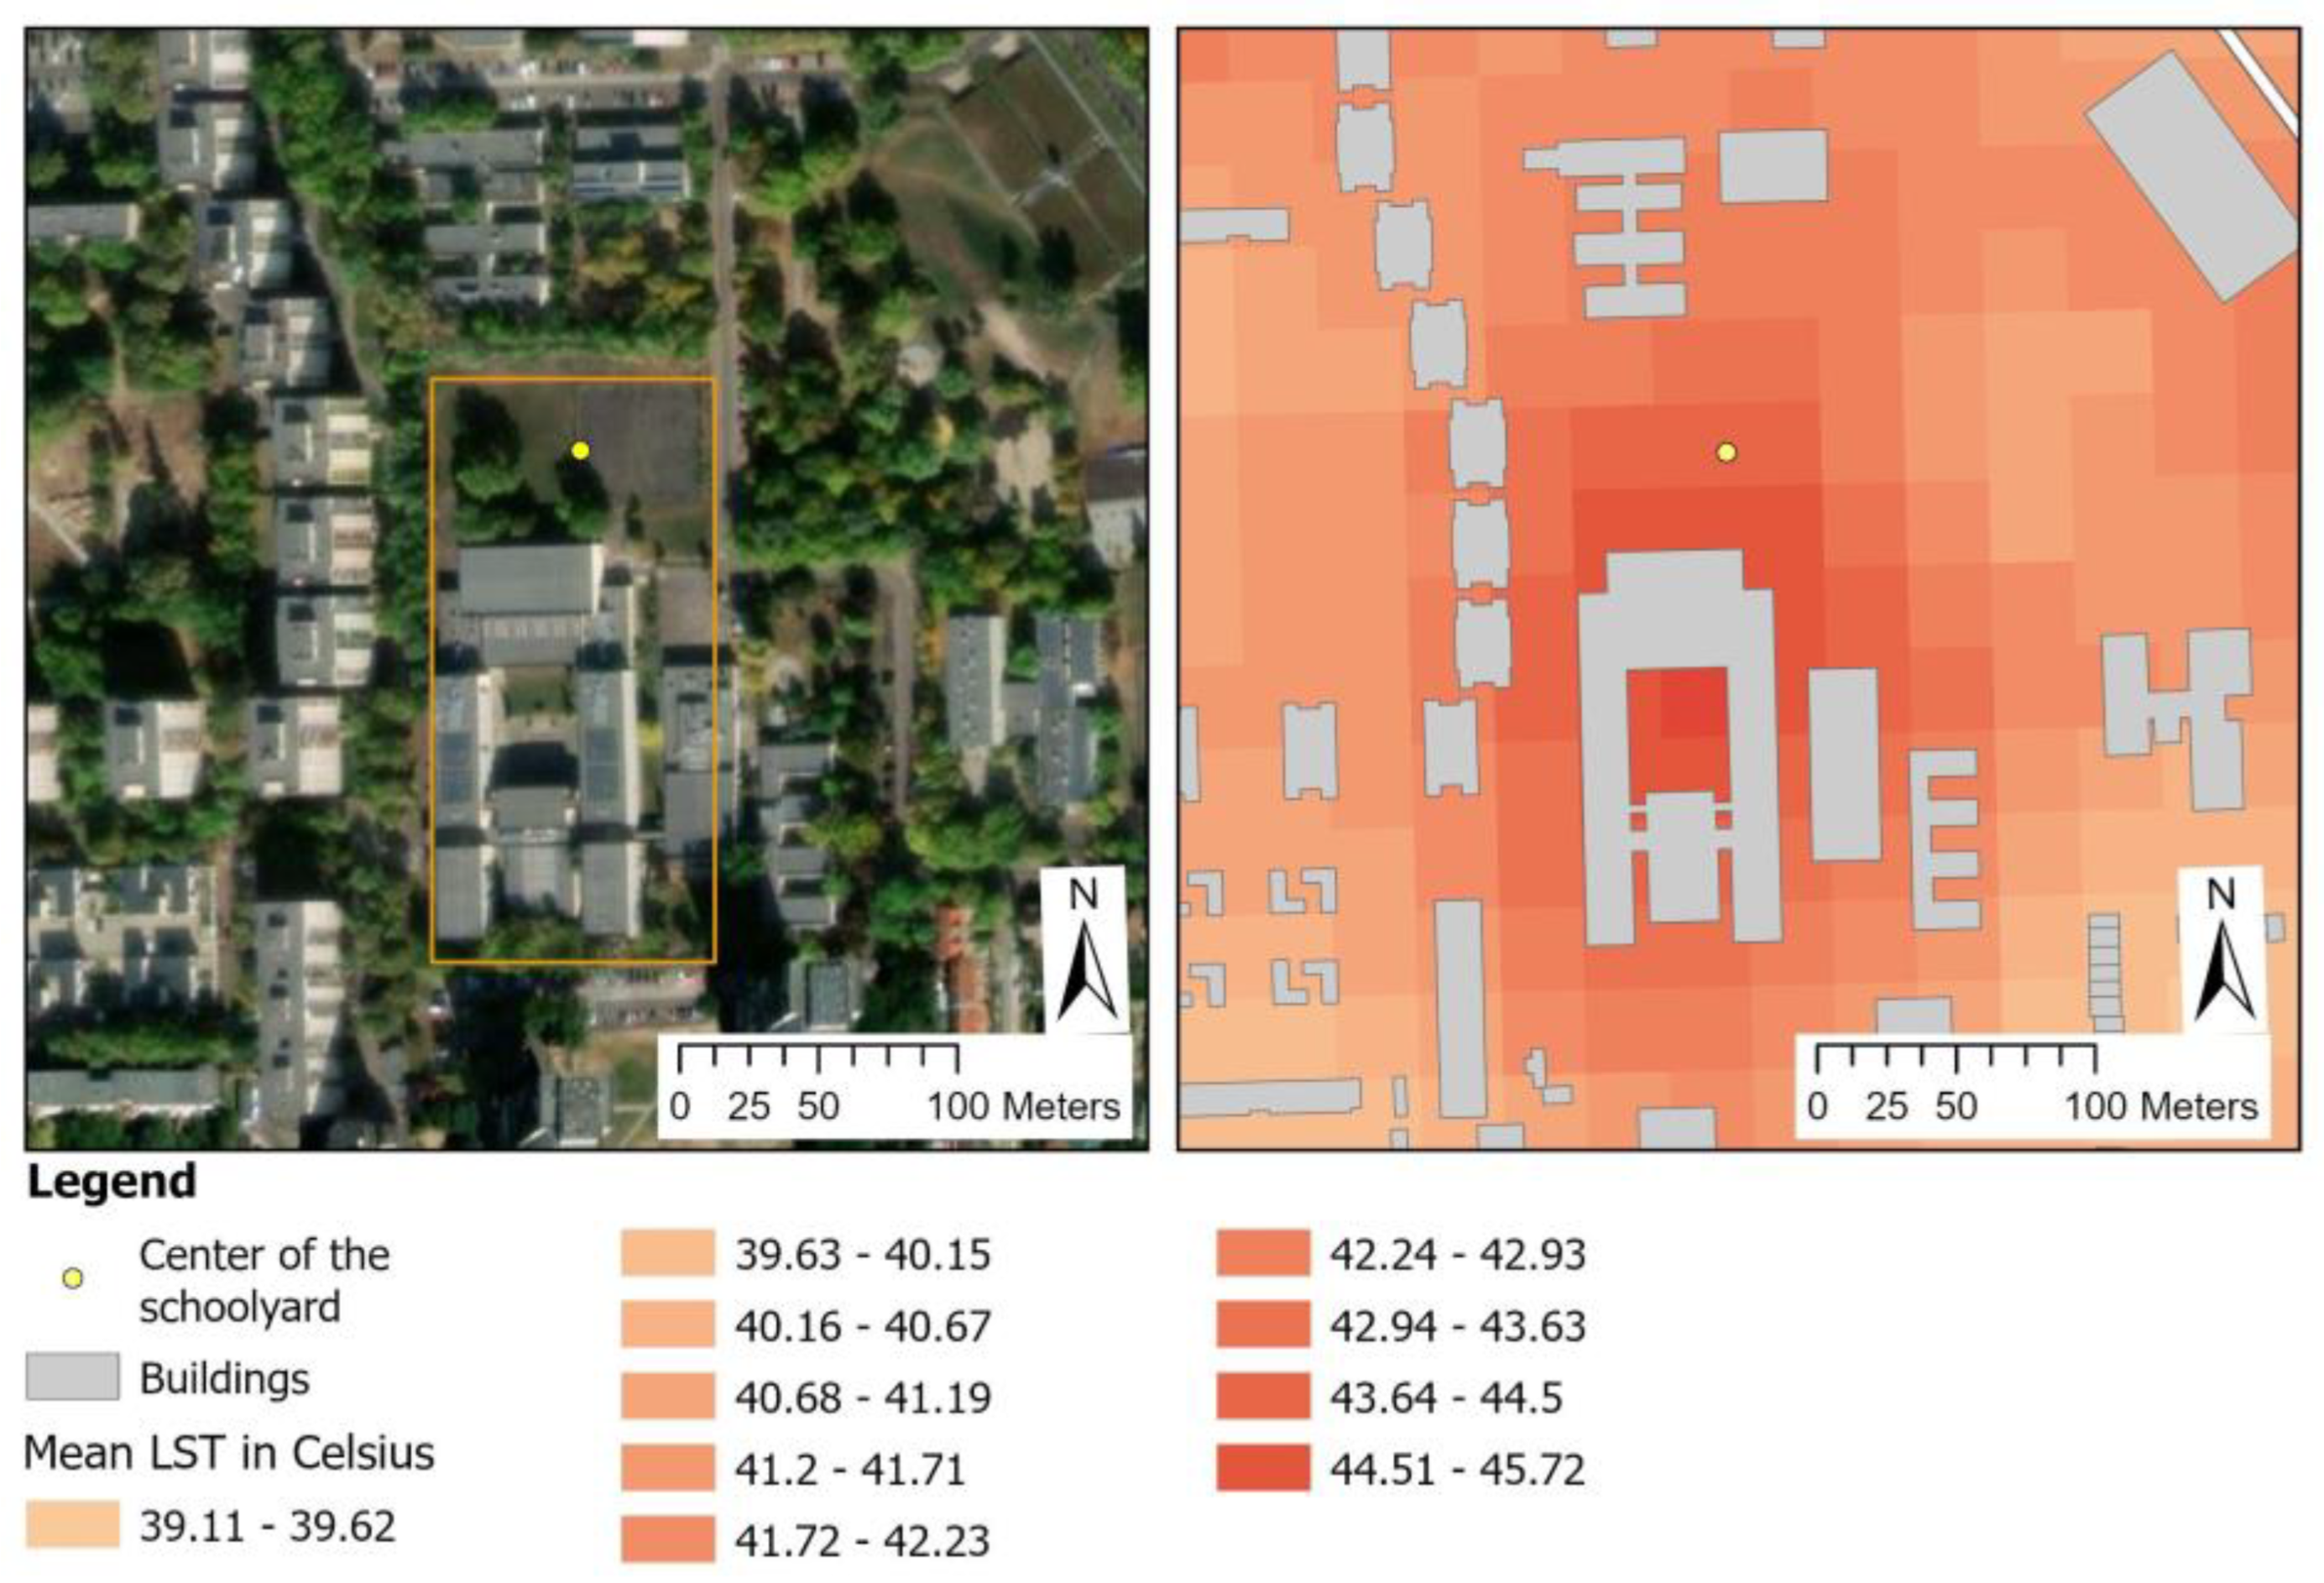
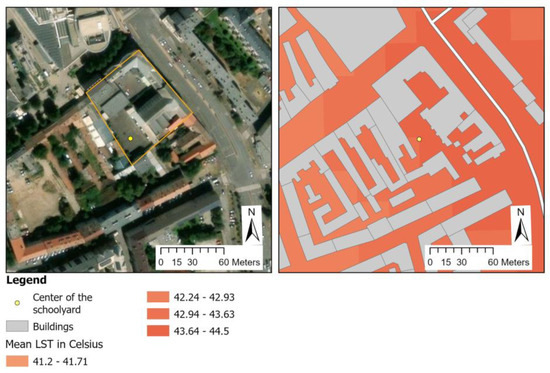
Our data confirms that schools in these areas possess large parcels and are surrounded by significant vegetation. However, despite this abundance of greenery, these areas exhibit surprisingly high LST values. A striking example is a secondary school located in a housing estate, which recorded the highest mean LST (44.2 °C) of all the institutions we studied, significantly exceeding the city average of 40.6 °C.
As illustrated in Figure 4, this phenomenon can be attributed to the specific urban morphology and material characteristics of mass housing estates. Naserikia et al. [77] explain that there is a positive correlation between LST, building fraction, and frontal density. Although the school has a 40% green cover on its parcel, it is bordered by a continuous wall of tall, prefabricated concrete buildings. This configuration likely creates a “canyon effect,” trapping heat and obstructing ventilation. Furthermore, the extensive use of concrete and asphalt—materials with high thermal mass—combined with the large, flat grey roofs on the school buildings themselves, contributes to the increased LST [78]. This “microclimate paradox” suggests that in high-density residential areas, even a significant quantity of 2D green space is insufficient to mitigate heat stress if the 3D built environment (vertical geometry, building dimensions, and materials) promotes heat accumulation. Thus, covering the building envelope with vegetation can effectively contribute to lower air temperatures [79].
Figure 4.
A secondary school (perimeter marked in yellow) exhibiting the highest LST in Debrecen, despite significant surrounding green space. The image illustrates the “canyon effect” created by adjacent high-rise prefab buildings (Source: Google Earth).
4.4. Uncontrolled Sprawl: The Environmental Deficit of the Outskirts
The outskirts of Debrecen represent a third distinct morphological type, characterized by uncontrolled inward densification during the socialist era. While half of the city’s kindergartens are located here, the overall environmental quality for educational institutions is inconsistent and often poor. This area’s development was largely unregulated during the socialist era [80]; since the outskirts’ expansion beyond their prescribed limits was prohibited, residents began to divide their building plots into multiple parts and sell them to others or their families who wanted to build single-family homes. This inward expansion of the urban fabric occurred without a concurrent development of public infrastructure.
This process resulted in a fragmented, high-density urban fabric in which the municipality owns very little land, severely limiting opportunities to create new public parks or plant street trees. Educational institutions here are often hemmed in by residential properties, leaving no room for green buffers. Unlike the socialist housing estates, which have planned green networks, the outskirts suffer from a structural lack of public green space. Consequently, despite being located in a “garden city” setting [81], these schools’ immediate environment is often dominated by fences, paved driveways, and buildings, leading to elevated LST values and a lack of tree canopy cover.
4.5. Maladaptation at the Micro-Scale: Parking and Playgrounds
Beyond macro-scale urban planning, our research highlights the detrimental effects of micro-scale interventions at the institutional level. We identified a trend of “maladaptation,” in which functional upgrades to school facilities unintentionally degrade environmental quality. Maladaptation refers to adaptation-related interventions that are intended to address one problem (e.g., safety, maintenance, or usability) but inadvertently increase vulnerability or worsen environmental outcomes, such as heat exposure or environmental quality [82,83].
An important driver of green space loss is the demand for parking. Particularly in downtown areas where on-street parking is scarce, schools frequently convert permeable green schoolyards into paved parking lots for staff (Figure 5). This conversion not only reduces the cooling capacity of the yard but also replaces evapotranspiring surfaces with heat-absorbing asphalt or concrete.
Figure 5.
Schoolyards (school perimeter marked in yellow) converted into parking spaces for school staff (Source: Google Earth).
Another significant, yet often overlooked, factor is the modernization of schoolyards, especially playgrounds. To meet safety standards, many educational institutions have replaced natural grass or sand (in the sandbox) with rubberized safety surfaces (see a similar case in Auckland reported by Cunninghame and Stanley [84]). While these surfaces reduce injury risks, they can reach high temperatures when exposed to sunlight, which further increases LST [35]. Additionally, the erosion of rubber surfaces results in microplastic pollution [85], posing a long-term health risk to children. These interventions create a hot and “sterile” outdoor environment, undermining the schoolyard’s potential to serve as a healthy restorative space.
4.6. Policy Implications and the Governance Gap
Addressing these environmental deficiencies requires navigating a complex landscape of governance and funding. Debrecen municipality’s recent “Green Code,” which outlines ambitious targets such as planting 10,000 trees and retrofitting green roofs, represents a positive policy shift. However, implementing these strategies in educational institutions faces structural barriers.
First, there is a “governance gap” regarding jurisdiction. While the local municipality is responsible for public space maintenance and kindergarten infrastructure, elementary and secondary schools are state-managed through school districts. This fragmentation often excludes schools from municipal greening programs. Second, infrastructural constraints in the downtown area mean that tree planting requires complex and expensive engineering solutions (e.g., pavement reconstruction) that exceed routine maintenance budgets.
Furthermore, national initiatives like the “Eco-school” program, while promoting environmental awareness, often lack the financial mechanisms to support physical infrastructure upgrades. Schools are encouraged to improve their greenery but must do so from their own limited budgets.
To improve the environmental quality of schools effectively, urban planning must move beyond general city-wide strategies. We recommend a targeted approach that treats schoolyards as integral components of the urban green infrastructure network. To achieve this, the following specific measures should be adopted:
- (i)
- Implementation of joint-use agreements: Municipalities should formalize agreements to finance schoolyard renovations in exchange for opening these green spaces to the local community during weekends and holidays. This approach justifies public investment in restricted areas by effectively transforming schoolyards into community pocket parks, thereby increasing the city’s overall accessible green network.
- (ii)
- Mandatory climate-adaptive design standards: Local building codes must move beyond requiring simple green space ratios and specify quality standards for educational institutions, such as mandated tree canopy percentages and the use of permeable, high-albedo paving materials to mitigate microclimatic heat stress. During the planning and assessment phase, LST data would provide important information on the necessity and effectiveness of interventions.
- (iii)
- Participatory planning and stewardship: Green interventions should involve the active participation of students, teachers, and parents in their design and maintenance. Evidence suggests that such involvement not only ensures that the design meets user needs but also fosters a sense of ownership that is crucial for the long-term survival of planted vegetation.
- (iv)
- Alternative greening technologies: For space-constrained downtown schools where traditional planting is hindered by underground utilities or spatial limits, alternative greening solutions such as vertical gardens and green roofs should be prioritized and subsidized to restore ecological function without compromising schoolyard capacity.
Most importantly, future policy frameworks must bridge the gap between municipal climate strategies and educational infrastructure management, ensuring that “greening” is supported by coordinated funding and technical expertise across administrative levels.
4.7. Possible Future Research
With regard to future research directions, a key question is whether these findings can be generalized at the national level. To address this, our upcoming research will apply the same methodology to the top 100 secondary schools in Hungary, selected according to various rankings. The primary objective of this subsequent analysis is to determine whether the “downtown constraint”—that is, the co-occurrence of high academic prestige and compromised environmental quality—is a systemic characteristic of elite Hungarian education, mirroring the pattern observed in Debrecen. Furthermore, we intend to investigate the statistical relationship between environmental quality (specifically green space availability, as well as thermal environmental quality and thermal comfort) and students’ academic performance. We anticipate that this analysis will reveal whether variations in environmental settings exert a detectable influence on academic performance, even among the highest-ranking institutions, thereby informing a national dialogue on the modernization of educational infrastructure. As a national assessment of basic competences is conducted annually in Hungary, our results can be used to explore associations between environmental indicators.
4.8. Limitations of This Research
This study combines high-resolution schoolyard greenness information with neighborhood-scale land cover assessment and satellite-derived LST to develop a spatially explicit assessment of the thermal environmental quality of educational institutions in Debrecen. At the same time, we acknowledge several limitations that affect the interpretation of our results.
First, LST is an imperfect proxy for the “experienced” thermal environment. LST captures surfaces’ radiative temperature and is well suited to identifying the spatial patterns of potential hot spots, but it does not directly measure the near-surface microclimate in which students and teachers operate. Human thermal comfort depends on air temperature, humidity, wind, and mean radiant temperature, among other factors [86]. Empirically, the relationship between LST and air temperature is often spatially and temporally variable and cannot be assumed to be stable across urban contexts [77,87]. Consequently, our results should be interpreted primarily as evidence of surface thermal patterns in and around schoolyards, rather than as direct estimates of heat stress or thermal comfort at pedestrian level.
Second, our study introduces a complex environmental quality indicator, which improves interpretability and comparability but necessarily involves methodological choices. The min–max scaling, the inversion of the LST component, and the equal-weight summation all imply an assumption that components contribute comparably to overall environmental quality. While this is a pragmatic and transparent modelling decision, research on composite indicators shows that weighting and normalization decisions can significantly affect rankings and policy interpretations [88]. Moreover, even seemingly minor choices in min–max thresholding can produce rank changes via implicit re-weighting [89]. A formal sensitivity analysis (e.g., testing alternative weights or robustness under different scaling/classification options) would therefore be a valuable extension of this study’s methodology, enabling a more accurate assessment of the stability of the composite indicator.
Third, our study integrates multi-source datasets from different years, which introduces temporal inconsistencies. We assume that the main structural characteristics of schoolyards and their surroundings are relatively stable over time, but local changes (tree removal/planting, resurfacing, construction activity, etc.) could affect the exact correspondence between greenness indicators and contemporary thermal patterns. This limitation underscores the value of repeated high-resolution observations and time-aligned datasets for tracking change and evaluating the effects of interventions.
Taken together, these limitations do not undermine the key contribution of the study—namely, its provision of a citywide, spatially consistent assessment of educational institutions and their green context—but they do imply that conclusions about heat exposure, comfort, and downstream social outcomes should be framed cautiously and, where possible, complemented with on-site measurements and outcome-focused data in future research.
5. Conclusions
This study provides a comprehensive assessment of the environmental quality of 121 educational institutions in Debrecen, revealing that student exposure to green spaces and elevated temperatures is deeply stratified by institutional type and urban morphology. Our findings demonstrate a clear environmental gradient: while kindergartens generally offer restorative, green-rich settings, secondary schools and multi-level educational institutions—which serve the majority of the student population—are frequently located in environmentally compromised areas.
Three critical spatial patterns emerged from our analysis. First, the historical downtown area acts as an “environmental trap” for prestigious secondary schools, where heritage protection and high urban density preclude the expansion of green spaces, resulting in sealed surfaces and elevated heat stress. Second, we identified signs of an apparent “green paradox” in socialist housing estates: despite abundant tree cover and large land parcels, schools in these zones often record the highest LST likely due to the heat-trapping effects of vertical concrete geometries and extensive artificial roofing. Third, the outskirts’ uncontrolled sprawl has created a fragmented urban fabric in which schools are constrained and enclosed by residential development, lacking the necessary green buffers to mitigate local climate impacts.
Beyond macro-scale urban planning, our research highlights the detrimental role played by institutional maladaptation. The conversion of permeable schoolyards into parking lots and the widespread installation of heat-absorbing rubber safety surfaces often negate the potential benefits of outdoor spaces, transforming them into sterile, thermally uncomfortable environments. These findings suggest that current urban greening strategies, such as the city’s “Green Code,” must be better integrated with educational infrastructure management. We argue for a paradigm shift that views schoolyards not as insular and isolated private entities but as essential components of the public green infrastructure network, requiring joint-use agreements, climate-adaptive design standards, and coordinated funding mechanisms.
Overall, our results suggest that cities in post-socialist countries possessing a typical urban fabric should implement a variety of measures to improve the green and thermal environment of educational institutions, based on their location and position in different built-up area types.
Author Contributions
G.C.: Conceptualization, Methodology, Formal analysis, Writing—Original Draft, Writing—Review and Editing, Funding acquisition; B.B.-B.: Methodology, Formal analysis, Data Curation, Writing—Original Draft; J.Z.F.: Conceptualization, Methodology, Formal analysis, Writing—Original Draft, Writing—Review and Editing, Visualization. All authors have read and agreed to the published version of the manuscript.
Funding
The study was supported by the National Research, Development and Innovation Office [Grant number: K142121] and the University of Debrecen Program for Scientific Publication.
Data Availability Statement
Data will be made available on request.
Conflicts of Interest
The authors declare no conflicts of interest.
References
- Dadvand, P.; Nieuwenhuijsen, M.J.; Esnaola, M.; Forns, J.; Basagaña, X.; Alvarez-Pedrerol, M.; Rivas, I.; López-Vicente, M.; De Pascual, M.C.; Su, J.; et al. Green spaces and cognitive development in primary schoolchildren. Proc. Natl. Acad. Sci. USA 2015, 112, 7937–7942. [Google Scholar] [CrossRef] [Scilit]
- Islam, M.Z.; Johnston, J.; Sly, P.D. Green space and early childhood development: A systematic review. Rev. Environ. Health 2020, 35, 189–200. [Google Scholar] [CrossRef] [Scilit]
- van Dijk-Wesselius, J.E.; Maas, J.; Hovinga, D.; van Vugt, M.; van den Berg, A.E. The impact of greening schoolyards on the appreciation, and physical, cognitive and social-emotional well-being of schoolchildren: A prospective intervention study. Landsc. Urban Plan. 2018, 180, 15–26. [Google Scholar] [CrossRef] [Scilit]
- Lovasi, G.S.; Schwartz-Soicher, O.; Quinn, J.W.; Berger, D.K.; Neckerman, K.M.; Jaslow, R.; Lee, K.K.; Rundle, A. Neighborhood safety and green space as predictors of obesity among preschool children from low-income families in New York City. Prev. Med. 2013, 57, 189–193. [Google Scholar] [CrossRef] [Scilit] [PubMed]
- Sanders, T.; Feng, X.; Fahey, P.P.; Lonsdale, C.; Astell-Burt, T. Greener neighbourhoods, slimmer children? Evidence from 4423 participants aged 6 to 13 years in the Longitudinal Study of Australian children. Int. J. Obes. 2015, 39, 1224–1229. [Google Scholar] [CrossRef] [Scilit]
- Markevych, I.; Tesch, F.; Datzmann, T.; Romanos, M.; Schmitt, J.; Heinrich, J. Outdoor air pollution, greenspace, and incidence of ADHD: A semi-individual study. Sci. Total Environ. 2018, 642, 1362–1368. [Google Scholar] [CrossRef] [Scilit] [PubMed]
- Akpinar, A. Urban green spaces for children: A cross-sectional study of associations with distance, physical activity, screen time, general health, and overweight. Urban For. Urban Green. 2017, 25, 66–73. [Google Scholar] [CrossRef] [Scilit]
- Sanders, T.; Feng, X.; Fahey, P.P.; Lonsdale, C.; Astell-Burt, T. The influence of neighbourhood green space on children’s physical activity and screen time: Findings from the longitudinal study of Australian children. Int. J. Behav. Nutr. Phys. Act. 2015, 12, 126. [Google Scholar] [CrossRef] [Scilit]
- Browning, M.H.E.M.; Rigolon, A. School green space and its impact on academic performance: A systematic literature review. Int. J. Environ. Res. Public Health 2019, 16, 429. [Google Scholar] [CrossRef] [Scilit]
- Kuo, M.; Barnes, M.; Jordan, C. Do experiences with nature promote learning? Converging evidence of a cause-and-effect relationship. Front. Psychol. 2019, 10, 305. [Google Scholar] [CrossRef] [Scilit]
- Kweon, B.-S.; Ellis, C.D.; Lee, J.; Jacobs, K. The link between school environments and student academic performance. Urban For. Urban Green. 2017, 23, 35–43. [Google Scholar] [CrossRef] [Scilit]
- Wu, C.-D.; McNeely, E.; Cedeño-Laurent, J.G.; Pan, W.-C.; Adamkiewicz, G.; Dominici, F.; Lung, S.-C.C.; Su, H.-J.; Spengler, J.D. Linking student performance in Massachusetts elementary schools with the greenness of school surroundings using remote sensing. PLoS ONE 2014, 9, e108548. [Google Scholar] [CrossRef] [Scilit] [PubMed]
- Chawla, L.; Keena, K.; Pevec, I.; Stanley, E. Green schoolyards as havens from stress and resources for resilience in childhood and adolescence. Health Place 2014, 28, 1–13. [Google Scholar] [CrossRef] [Scilit] [PubMed]
- Larsson, A.; Rönnlund, M. The spatial practice of the schoolyard. A comparison between Swedish and French teachers’ and principals’ perceptions of educational outdoor spaces. J. Adventure Educ. Outdoor Learn. 2021, 21, 139–150. [Google Scholar] [CrossRef] [Scilit]
- Lousen, I.; Arvidsen, J.; Pawlowski, C.S. Children’s play behaviour and engagement with the schoolyard environment. Int. J. Play 2024, 13, 311–327. [Google Scholar] [CrossRef] [Scilit]
- Schipperijn, J.; Madsen, C.D.; Toftager, M.; Johansen, D.N.; Lousen, I.; Amholt, T.T.; Pawlowski, C.S. The role of playgrounds in promoting children’s health—A scoping review. Int. J. Behav. Nutr. Phys. Act. 2024, 21, 72. [Google Scholar] [CrossRef] [Scilit]
- Jansson, M.; Mårtensson, F.; Gunnarsson, A. The meaning of participation in school ground greening: A study from project to everyday setting. Landsc. Res. 2014, 43, 163–179. [Google Scholar] [CrossRef] [Scilit]
- Luís, S.; Dias, R.; Lima, M.L. Greener Schoolyards, Greener Futures? Greener Schoolyards Buffer Decreased Contact with Nature and Are Linked to Connectedness to Nature. Front. Psychol. 2020, 11, 567882. [Google Scholar] [CrossRef] [Scilit]
- Williams, T.G.; Logan, T.M.; Zuo, C.T.; Liberman, K.D.; Guikema, S.D. Parks and safety: A comparative study of green space access and inequity in five US cities. Landsc. Urban Plan. 2020, 201, 103841. [Google Scholar] [CrossRef] [Scilit]
- Zhang, Z.; Stevenson, K.T.; Martin, K.L. Exploring geographical, curricular, and demographic factors of nature use by children in urban schoolyards in Raleigh, NC, USA. Urban For. Urban Green. 2021, 65, 127323. [Google Scholar] [CrossRef] [Scilit]
- Barenie, M.J.; Howie, E.K.; Weber, K.A.; Thomsen, M.R. Evaluation of the Little Rock Green Schoolyard initiative: A quasi-experimental study protocol. BMC Public Health 2023, 23, 1022. [Google Scholar] [CrossRef] [Scilit]
- Buckley, G.L.; Boone, C.G.; Morgan Grove, J. The Greening of Baltimore’s Asphalt Schoolyards. Geogr. Rev. 2017, 107, 516–535. [Google Scholar] [CrossRef] [Scilit]
- Flax, L.; Korthals Altes, R.; Kupers, R.; Mons, B. Greening schoolyards—An urban resilience perspective. Cities 2020, 106, 102890. [Google Scholar] [CrossRef] [Scilit]
- Giezen, M.; Pellerey, V. Renaturing the city: Factors contributing to upscaling green schoolyards in Amsterdam and The Hague. Urban For. Urban Green. 2021, 63, 127190. [Google Scholar] [CrossRef] [Scilit]
- Ignell, S.; Wiström, B.; Levinsson, A.; Jansson, M. “It is not a complicated question but it is very complex”—Insights on school ground greening from practitioners. Urban For. Urban Green. 2025, 110, 128867. [Google Scholar] [CrossRef] [Scilit]
- Baró, F.; Camacho, D.A.; Pérez Del Pulgar, C.; Triguero-Mas, M.; Anguelovski, I. School greening: Right or privilege? Examining urban nature within and around primary schools through an equity lens. Landsc. Urban Plan. 2021, 208, 104019. [Google Scholar] [CrossRef] [Scilit]
- Gallez, E.; Fraile Mujica, C.P.; Gadeyne, S.; Canters, F.; Baró, F. Nature-based school environments for all children? comparing exposure to school-related green and blue infrastructure in four European cities. Ecol. Indic. 2024, 166, 112374. [Google Scholar] [CrossRef] [Scilit]
- Li, D.; Chiang, Y.-C.; Sang, H.; Sullivan, W.C. Beyond the school grounds: Links between density of tree cover in school surroundings and high school academic performance. Urban For. Urban Green. 2019, 38, 42–53. [Google Scholar] [CrossRef] [Scilit]
- Sivarajah, S.; Smith, S.M.; Thomas, S.C. Tree cover and species composition effects on academic performance of primary school students. PLoS ONE 2018, 13, e0193254. [Google Scholar] [CrossRef] [Scilit]
- Aerts, R.; Van Calster, H.; Ozen, M.; Benchrih, R.; Heyman, S.; Swerts, E.; Wuyts, A.; Lammens, L.; Lommelen, E.; Leone, M.; et al. Green space at school and attention in primary school children in Belgium: A stratified matched case-control study. Urban For. Urban Green. 2025, 105, 128680. [Google Scholar] [CrossRef] [Scilit]
- Ettinger, A.K.; Bratman, G.N.; Carey, M.; Hebert, R.; Hill, O.; Kett, H.; Levin, P.; Murphy-Williams, M.; Wyse, L. Street trees provide an opportunity to mitigate urban heat and reduce risk of high heat exposure. Sci. Rep. 2024, 14, 3266. [Google Scholar] [CrossRef] [Scilit] [PubMed]
- Climate Central. Public Schools in Urban Heat Islands. 2025. Available online: https://www.climatecentral.org/climate-matters/schools-and-urban-heat-2025 (accessed on 22 October 2025).
- Velasquez-Camacho, L.; Willaredt, M.; Singh, P.; Ossola, A. Bleeding green: California’s schools are rapidly losing tree canopy cover. Urban For. Urban Green. 2025, 113, 129117. [Google Scholar] [CrossRef] [Scilit]
- European Environment Agency. Briefing: Towards ‘Just Resilience’: Leaving no One Behind when Adapting to Climate Change. 2022. Available online: https://www.eea.europa.eu/en/analysis/publications/towards-just-resilience-leaving-no-one-behind-when-adapting-to-climate-change (accessed on 23 October 2025).
- Antoniadis, D.; Katsoulas, N.; Papanastasiou, D.Κ. Thermal environment of urban schoolyards: Current and future design with respect to children’s thermal comfort. Atmosphere 2020, 11, 1144. [Google Scholar] [CrossRef] [Scilit]
- Park, R.J.; Behrer, A.P.; Goodman, J. Learning is inhibited by heat exposure, both internationally and within the United States. Nat. Hum. Behav. 2021, 5, 19–27. [Google Scholar] [CrossRef] [Scilit]
- McCormack, M. Education Under Extremes: Temperature, Student Absenteeism, and Disciplinary Infractions. 2023. Available online: https://kristen-mccormack.com/files/mccormack_jmp.pdf (accessed on 23 October 2025).
- European Environment Agency. Climate-ADAPT: Paris Oasis Schoolyard Programme, France. 2022. Available online: https://climate-adapt.eea.europa.eu/en/metadata/case-studies/paris-oasis-schoolyard-programme-france (accessed on 17 November 2025).
- Widaningrum, D.L.; Andika, A. Land Cover Change and Sustainability Condition Around Educational Institutions: Insights from Yogyakarta, Indonesia. IOP Conf. Ser. Earth Environ. Sci. 2025, 1488, 012033. [Google Scholar] [CrossRef] [Scilit]
- Zhang, Z.; Luan, W.; Tian, C.; Su, M. Impact of Urban Expansion on School Quality in Compulsory Education: A Spatio-Temporal Study of Dalian, China. Land 2025, 14, 265. [Google Scholar] [CrossRef] [Scilit]
- Kovács, Z.; Farkas, Z.J.; Egedy, T.; Kondor, A.C.; Szabó, B.; Lennert, J.; Baka, D.; Kohán, B. Urban sprawl and land conversion in post-socialist cities: The case of metropolitan Budapest. Cities 2019, 92, 71–81. [Google Scholar] [CrossRef] [Scilit]
- Vasilevska, L.; Vranic, P.; Marinkovic, A. The effects of changes to the post-socialist urban planning framework on public open spaces in multi-story housing areas: A view from Nis, Serbia. Cities 2014, 36, 83–92. [Google Scholar] [CrossRef] [Scilit]
- Zarecor, K.E. What Was So Socialist about the Socialist City? Second World Urbanity in Europe. J. Urban Hist. 2018, 44, 95–117. [Google Scholar] [CrossRef] [Scilit]
- Lanza, K.; Alcazar, M.; Hoelscher, D.M.; Kohl, H.W. Effects of trees, gardens, and nature trails on heat index and child health: Design and methods of the Green Schoolyards Project. BMC Public Health 2021, 21, 98. [Google Scholar] [CrossRef] [Scilit]
- Csomós, G.; Szalai, Á.; Farkas, J.Z. A sacrifice for the greater good? On the main drivers of excessive land take and land use change in Hungary. Land Use Pol. 2024, 147, 107352. [Google Scholar] [CrossRef] [Scilit]
- WHO. Urban Green Spaces: A Brief for Action. World Health Organization. Regional Office for Europe. 2017. Available online: https://www.who.int/europe/publications/i/item/9789289052498 (accessed on 7 September 2025).
- Szabó, P.; Bartholy, J.; Pongrácz, R. Seasonal temperature and precipitation record breakings in Hungary in a warming world. GEM Int. J. Geomath. 2024, 15, 2. [Google Scholar] [CrossRef] [Scilit]
- Kis, A.; Szabó, P.; Pongrácz, R. Analysis of detected and future drought conditions—A case study for the Great Hungarian Plain. Theor. Appl. Climatol. 2025, 156, 303. [Google Scholar] [CrossRef] [Scilit]
- László, E.; Bottyán, Z.; Szegedi, S. Long-term changes of meteorological conditions of urban heat island development in the region of Debrecen, Hungary. Theor. Appl. Climatol. 2016, 124, 365–373. [Google Scholar] [CrossRef] [Scilit]
- Maurer, T. How To Pan-Sharpen Images Using the Gram-Schmidt Pan-Sharpen Method—A International-Society-for-Photogrammetry-and-Remote-Sensing Hannover Workshop 40-1(W-1). Int. Arch. Photogramm. Remote Sens. Spat. Inf. Sci. 2013, XL-1/W1, 239–244. [Google Scholar] [CrossRef] [Scilit]
- Li, H.; Jing, L.; Tang, Y. Assessment of Pansharpening Methods Applied to WorldView-2 Imagery Fusion. Sensors 2017, 17, 89. [Google Scholar] [CrossRef] [Scilit]
- Copernicus Land Monitoring Service. CLCplus Backbone 2021. 2021. Available online: https://sdi.eea.europa.eu/catalogue/srv/api/records/71fc9d1b-479f-4da1-aa66-662a2fff2cf7?language=all (accessed on 9 October 2025). [CrossRef]
- Goldblatt, R.; Addas, A.; Crull, D.; Maghrabi, A.; Levin, G.G.; Rubinyi, S. Remotely Sensed Derived Land Surface Temperature (LST) as a Proxy for Air Temperature and Thermal Comfort at a Small Geographical Scale. Land 2021, 10, 410. [Google Scholar] [CrossRef] [Scilit]
- Cho, H. The effects of summer heat on academic achievement: A cohort analysis. J. Environ. Econ. Manag. 2017, 83, 185–196. [Google Scholar] [CrossRef] [Scilit]
- Graff Zivin, J.; Song, Y.; Tang, Q.; Zhang, P. Temperature and high-stakes cognitive performance: Evidence from the national college entrance examination in China. J. Environ. Econ. Manag. 2020, 104, 102365. [Google Scholar] [CrossRef] [Scilit]
- Park, R.J.; Goodman, J.; Hurwitz, M.; Smith, J. Heat and learning. Am. Econ. J.-Econ. Policy 2020, 12, 306–339. [Google Scholar] [CrossRef] [Scilit]
- Méndez-Lázaro, P.A.; Cabrera-Rivera, L.T.; Rueda-Roa, D.; Muller-Karger, F.E.; Morales, M.H.; Sánchez-Sepúlveda, M.V.; Rodríguez, E.; Martínez, O.; Morales, E.; Chardón-Maldonado, P.; et al. Assessing the impacts, risks, and vulnerabilities of extreme heat in learning environments of Puerto Rico in 2023. J. Clim. Chang. Health 2025, 26, 100581. [Google Scholar] [CrossRef] [Scilit]
- U.S. Geological Survey; USGS Earth Resources Observation and Science (EROS) Center. Landsat 8-9 Operational Land Imager/Thermal Infrared Sensor Level-2, Collection 2; U.S. Geological Survey: Reston, VA, USA, 2020. [CrossRef]
- Chen, T.; Guestrin, C. XGBoost: A Scalable Tree Boosting System. In Proceedings of the 22nd ACM SIGKDD International Conference on Knowledge Discovery and Data Mining, San Francisco, CA, USA, 13–17 August 2016; pp. 785–794. [Google Scholar] [CrossRef] [Scilit]
- Szabó, S.; Holb, I.J.; Abriha-Molnár, V.É.; Szatmári, G.; Singh, S.K.; Abriha, D. Classification Assessment Tool: A program to measure the uncertainty of classification models in terms of class-level metrics. Appl. Soft. Comput. 2024, 155, 111468. [Google Scholar] [CrossRef] [Scilit]
- Rogerson, P.A.; Plane, D.A. The Hoover Index of Population Concentration and the Demographic Components of Change: An Article in Memory of Andy Isserman. Int. Reg. Sci. Rev. 2013, 36, 97–114. [Google Scholar] [CrossRef] [Scilit]
- Nardo, M.; Saisana, M.; Saltelli, A.; Tarantola, S. Handbook on constructing composite indicators: Methodology and user guide; OECD Statistics Working Papers No. 2005/03; OECD: Paris, France, 2005. [Google Scholar] [CrossRef]
- Decancq, K.; Lugo, M.A. Weights in multidimensional indices of wellbeing: An overview. Econom. Rev. 2013, 32, 7–34. [Google Scholar] [CrossRef] [Scilit]
- Greco, S.; Ishizaka, A.; Tasiou, M.; Torrisi, G. On the methodological framework of composite indices: A review of the issues of weighting, aggregation, and robustness. Soc. Indic. Res. 2019, 141, 61–94. [Google Scholar] [CrossRef] [Scilit]
- European Education and Culture Executive Agency. The Organisation of School Time in Europe. Primary and General Secondary Education 2022/2023; European Education and Culture Executive Agency: Brussels, Belgium, 2021; Available online: https://eurydice.eacea.ec.europa.eu/publications/organisation-school-time-europe-primary-and-general-secondary-education-20222023 (accessed on 17 November 2025).
- Institute of Education Sciences. State Education Practices (SEP). 2025. Available online: https://nces.ed.gov/programs/statereform/tab1_1-2020.asp (accessed on 17 November 2025).
- Liu, J.; Green, R.J. The effect of exposure to nature on children’s psychological well-being: A systematic review of the literature. Urban For. Urban Green. 2023, 81, 127846. [Google Scholar] [CrossRef] [Scilit]
- Herskovic, L. The Effect of Subway Access on School Choice. Econ. Educ. Rev. 2020, 78, 102021. [Google Scholar] [CrossRef] [Scilit]
- Mandic, S.; Sandretto, S.; Hopkins, D.; Wilson, G.; Kidd, G.; García Bengoechea, E. School choice, distance to school and travel to school patterns among adolescents. J. Transp. Health 2023, 33, 101704. [Google Scholar] [CrossRef] [Scilit]
- Barlaan, D.R.; Pangelinan, B.A.; Johns, A.; Schweikhard, A.; Cromer, L.D. Middle school start times and young adolescent sleep, behavioral health, and academic performance outcomes: A narrative review. J. Clin. Sleep Med. 2022, 18, 2681–2694. [Google Scholar] [CrossRef] [Scilit]
- O’Brien, E.M.; Mindell, J.A. Sleep and risk-taking behavior in adolescents. Behav. Sleep Med. 2005, 3, 113–133. [Google Scholar] [CrossRef] [Scilit]
- Wheaton, A.G.; Chapman, D.P.; Croft, J.B. School Start Times, Sleep, Behavioral, Health, and Academic Outcomes: A Review of the Literature. J. Sch. Health 2016, 86, 363–381. [Google Scholar] [CrossRef] [Scilit]
- Sailer-Fliege, U. Characteristics of post-socialist urban transformation in East Central Europe. GeoJournal 1999, 49, 7–16. [Google Scholar] [CrossRef] [Scilit]
- Csomós, G.; Farkas, J.Z.; Kovács, Z. Access to urban green spaces and environmental inequality in post-socialist cities. Hung. Geogr. Bull. 2020, 69, 191–207. [Google Scholar] [CrossRef] [Scilit]
- Mitković, M.; Igić, M. Challenges and opportunities in the redevelopment of public open space within multi-family housing estates in post-socialist Czech Republic. J. Fac. Civ. Eng. Archit. 2025, 40, 15–34. [Google Scholar] [CrossRef] [Scilit]
- Sapunova, M.; Gladkova, E.; Malko, A.; Engel, B. Living in Soviet Housing Estates: Urban Space, Transformation and Multiple Narratives. Eur.-Asia Stud. 2025, 77, 1172–1202. [Google Scholar] [CrossRef] [Scilit]
- Naserikia, M.; Hart, M.A.; Nazarian, N.; Bechtel, B.; Lipson, M.; Nice, K.A. Land surface and air temperature dynamics: The role of urban form and seasonality. Sci. Total Environ. 2023, 905, 167306. [Google Scholar] [CrossRef] [Scilit]
- Rawat, M.; Singh, R.N. A study on the comparative review of cool roof thermal performance in various regions. Energy Built Environ. 2022, 3, 327–347. [Google Scholar] [CrossRef] [Scilit]
- Alexandri, E.; Jones, P. Temperature decreases in an urban canyon due to green walls and green roofs in diverse climates. Build. Environ. 2008, 43, 480–493. [Google Scholar] [CrossRef] [Scilit]
- Csomós, G.; Farkas, Z.J.; Kolcsár, R.A.; Szilassi, P.; Kovács, Z. Measuring socio-economic disparities in green space availability in post-socialist cities. Habitat Int. 2021, 117, 102434. [Google Scholar] [CrossRef] [Scilit]
- Sampo, R. Processes of Residential Differentiation in Socialist Cities. Literature review on the cases of Budapest, Prague, Tallinn and Warsaw. Eur. J. Spat. Dev. 2004, 2, 1. [Google Scholar] [CrossRef] [Scilit]
- Barnett, J.; O’Neill, S. Maladaptation. Glob. Environ. Change 2010, 20, 211–213. [Google Scholar] [CrossRef] [Scilit]
- Juhola, S.; Glaas, E.; Linnér, B.-O.; Neset, T.-S. Redefining maladaptation. Environ. Sci. Policy 2016, 55, 135–140. [Google Scholar] [CrossRef] [Scilit]
- Cunninghame, A.R.; Stanley, M.C. Vegetation complexity and greenspace diversity in urban schools. Urban For. Urban Green. 2024, 101, 128544. [Google Scholar] [CrossRef] [Scilit]
- Koutnik, V.S.; Leonard, J.; El Rassi, L.A.; Choy, M.M.; Brar, J.; Glasman, J.B.; Cowger, W.; Mohanty, S.K. Children’s playgrounds contain more microplastics than other areas in urban parks. Sci. Total Environ. 2023, 854, 158866. [Google Scholar] [CrossRef] [Scilit] [PubMed]
- Atmaca, I.; Kaynakli, O.; Yigit, A. Effects of radiant temperature on thermal comfort. Build. Environ. 2007, 42, 3210–3220. [Google Scholar] [CrossRef] [Scilit]
- Li, L.; Zha, Y.; Wang, R. Relationship of surface urban heat island with air temperature and precipitation in global large cities. Ecol. Indic. 2020, 117, 106683. [Google Scholar] [CrossRef] [Scilit]
- Becker, W.; Saisana, M.; Paruolo, P.; Vandecasteele, I. Weights and importance in composite indicators: Closing the gap. Ecol. Indic. 2017, 80, 12–22. [Google Scholar] [CrossRef] [Scilit]
- Kelemen, A.; Szabó, Z.K.; Bozóki, S.; Szádoczki, Z.; Hartvig, Á.D. A sensitivity analysis of composite indicators: Min/max thresholds. Environ. Sustain. Indic. 2024, 23, 100453. [Google Scholar] [CrossRef] [Scilit]

Disclaimer/Publisher’s Note: The statements, opinions and data contained in all publications are solely those of the individual author(s) and contributor(s) and not of MDPI and/or the editor(s). MDPI and/or the editor(s) disclaim responsibility for any injury to people or property resulting from any ideas, methods, instructions or products referred to in the content. |
© 2026 by the authors. Licensee MDPI, Basel, Switzerland. This article is an open access article distributed under the terms and conditions of the Creative Commons Attribution (CC BY) license.