Abstract
Polyester yarn bundle geogrids are widely used materials in flexible retaining structures due to their high toughness and high-strength mechanical properties. To investigate the mechanical characteristics and the interfacial mechanical properties of these geogrids, a series of pull-out tests were conducted under different pull-out rates and filling water contents. Based on the test results, a DEM-FDM coupled numerical model for pull-out behavior was established to analyze the pull-out deformation behavior of the geogrids. Combined with the theoretical analysis of the load-bearing characteristics of the geogrids, the reinforcement mechanism of polyester yarn bundle geogrids was revealed. The results show that there exists a critical pull-out rate of 1 mm/min that maximizes the pull-out resistance; the interface friction angle decreases with an increase in pull-out rate, while the interface cohesion shows an opposite trend. The filling water content presents a more significant weakening effect on the soil–geogrid interface strength under low stress, resulting in a strain-softening type of pull-out curve. Unlike fine-ribbed plastic geogrids, the sliding frictional resistance of polyester yarn bundle geogrids accounts for 80% of the total pull-out resistance during the pull-out process. The mechanical interlocking force, which arises from the bulges on the mid-section of transverse ribs and the downward bending of longitudinal rib edges, is subject to dynamic changes in the course of the pull-out process. The geogrid exhibits overall shear failure under low normal stress ( 200 kPa) and penetration shear failure under high normal stress ( 200 kPa). In practical engineering installation, polyester yarn bundle geogrids should be placed as parallel as possible to maximize the frictional resistance with filled soil and should take care of the geogrid joints for enhanced durability of the geogrids.
1. Introduction
As a high-performance geosynthetic material, geogrids have been widely applied in engineering fields such as retaining structures, subgrade reinforcement, slope protection, and foundation treatment due to their excellent mechanical properties [1,2,3,4]. Reinforced geogrid restricts the deformation of interlayer soil through the relative friction between reinforcements and soil, thereby improving the stability and shear strength of structures. Therefore, the mechanical properties of the reinforcement–soil interface are key indicators for the design of reinforced structures [5,6,7]. Meanwhile, to further optimize the geogrid structure design and enhance the mechanical properties of geogrids, it is necessary to conduct in-depth research on the geogrid reinforcement mechanism.
The pull-out test is the most direct research method for the mechanical properties of the geogrid–soil interface. At present, a large number of scholars have carried out geogrid pull-out tests under various working conditions. Altay et al. [8] designed a pull-out test between geogrids and clay, analyzed the influence of fill water content on the reinforcement–soil interface, and found that the interfacial interaction force is stronger at the optimal water content (OWC). Bai et al. [9] explored the reinforcement–soil interface characteristics under different temperatures and found that under freezing conditions, the shear characteristics of the interface are significantly enhanced due to a certain expansion of the fill. Makkar et al. [10] summarized the influence of fill particle size on the reinforcement-soil interface and quantified the strength of the reinforcement–soil interface. Safa et al. [11] and Liu et al. [12] pointed out that increasing the pull-out rate within a certain range can improve the ultimate pull-out force of geogrids, and the degree of improvement depends on the magnitude of normal stress. Many other scholars had explored the influence of geogrid patterns on the reinforcement–soil interface characteristics by adjusting the geogrid mesh size, strengthening mesh nodes, and other methods [13,14,15,16].
Regarding the reinforcement mechanism of geogrids, numerical simulation is mainly adopted for research at present, and theoretical laws are summarized based on the results of indoor tests and numerical simulations [17,18]. Li et al. [19] established a DEM model for the pull-out of multi-grid geogrids. They found that the pull-out force mainly acted on the front segments of the first row of transverse ribs, where a strong interlocking effect was generated between the soil and the geogrid. Attache et al. [20] simulated geogrid pull-out using FLAC3D software, analyzed the influence of corrugated protrusions on the geogrid surface on geogrid pull-out, and found that the protrusions on the geogrid surface can significantly enhance the pull-out resistance of geogrids. Fu et al. [21] used the DEM-FDM to reveal the deformation of geogrids during the pull-out process and explained the interaction mechanism between soil particles and geogrids. Liang et al. [22] proposed a geogrid shear stress–displacement damage softening model based on the results of pull-out tests, revealing the development of shear stress at the reinforcement–soil interface and progressive failure modes at different pull-out stages. In addition, many scholars have focused on the bearing characteristics of the transverse and longitudinal ribs of geogrids, emphasizing the contribution of transverse ribs to pull-out resistance [23,24,25,26].
Most of the test materials used in the above pull-out tests were plastic geogrids, which had narrow longitudinal and transverse ribs and possessed the advantages of being lightweight and easy to install. With the continuous improvement of engineering requirements for the durability and strength of geogrids, polyester yarn-bundled geogrids have gradually replaced plastic geogrids and been applied in various high and large reinforced engineering projects [27,28,29,30]. However, research on the interfacial mechanical properties of this geogrid type is relatively scarce. Research on the geogrid reinforcement mechanism has typically focused on the effects of geogrid aperture size and shape [31,32,33], failing to further reveal the interaction between the ribs and the filled soil and, thus, hindering a thorough understanding of the failure mechanism of reinforced soil structures in engineering practice. Additionally, it mostly adopts a single research method of numerical simulation or theory, making it hard to verify the research results from multiple angles.
To address these issues, this paper investigates the pull-out behavior of a polyester yarn bundle grid through experimental studies, analyzing the effects of pull-out rate and soil moisture content on the soil–reinforcement interface. Based on experimental data, a DEM-FDM coupled pull-out numerical model was established to reveal the overall displacement behavior of the grid during pull-out. This model highlighted the deformation characteristics of the wide transverse ribs in the polyester yarn bundle grid and the distribution of friction force at the grid–soil interface. Finally, through theoretical calculations, the geogrid’s load-bearing characteristics were determined, and its failure modes under varying stresses were identified, providing recommendations for the practical engineering application of polyester yarn bundle geogrids.
2. Pull-Out Test
2.1. Geogrid Pull-Out Test Device
The test employed a self-developed pull-out testing apparatus, as shown in Figure 1. The pull-out device primarily consists of four components: the model box, the lateral loading device, the vertical loading device, and the data monitoring system. The model box measures 40 cm × 35 cm × 40 cm, with its four sides made of steel plates of 1.5 cm thickness. It is divided into two loading chambers (upper and lower), with heights of 15 cm and 25 cm, respectively. The vertical loading device incorporates a hydraulic jack, a gantry frame, and a pressure sensor, while the horizontal loading device comprises a motor, a threaded rod, a clamping fixture, and displacement/tensile force sensors. Test data from mechanical parameter sensors is transmitted to the computer via data cables and monitored in numerical software.
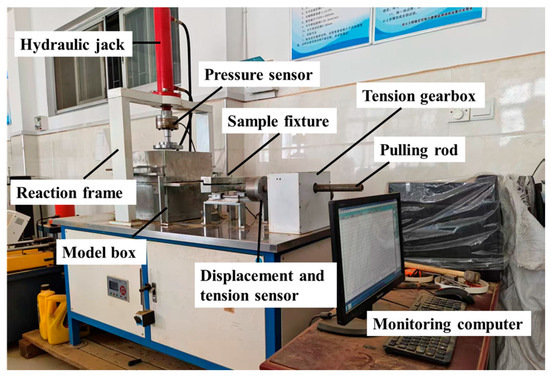
Figure 1.
Pull-out testing apparatus.
2.2. Test Materials
The material employed in the pull-out tests was a novel polyester yarn bundle geogrid, as shown in Figure 2a. Based on the basic mesh size of the geogrid, specimens measuring 100 cm in length and 20 cm in width were cut, as shown in Figure 2b. Due to the size constraints of the model box, the grid’s loading dimensions within the box were set to 22 cm × 20 cm to preserve sufficient longitudinal rib length for fixture mounting. The specific parameter specifications of this geogrid are detailed in Table 1.
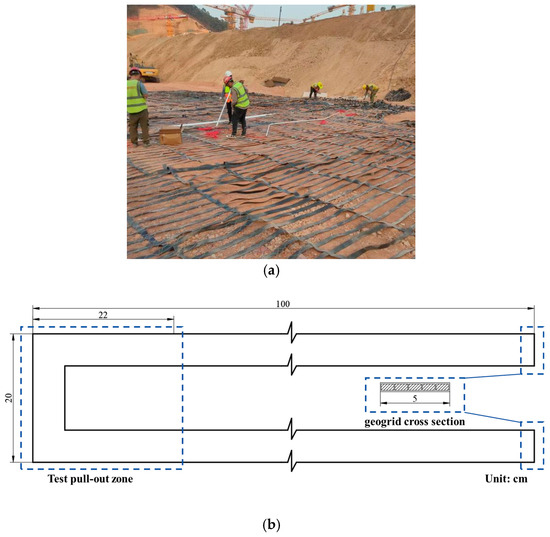
Figure 2.
Geogrid configuration and dimensions: (a) geogrid construction and laying; (b) loading and overall dimensions of geogrid in pull-out test.

Table 1.
Physical parameters of geogrid.
2.3. Test Filling Soil
The test fill material utilized locally sourced, reworked loess from Yueyang. The black curve in Figure 3a represents the actual gradation curve, and Figure 3b is the direct shear curve of the loess. Calculations based on this curve yielded a coefficient of uniformity (Cu) of 5.49 and a coefficient of curvature (Cc) of 1.04, indicating excellent gradation of this loess. Other physical parameters of the filled soil are shown in Table 2.
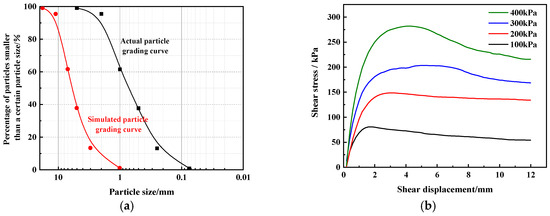
Figure 3.
Physical and mechanical properties of filling soil: (a) gradation curve; (b) direct shear curve.
Table 2.
Physical properties of filling soil.
2.4. Experimental Scheme
This pull-out test varied parameters including moisture content, pull-out rate, and normal stress. Experimental studies investigated the interfacial pull-out characteristics of geogrids under various operating conditions. By removing transverse ribs and conducting dual longitudinal rib pull-out tests, the contribution of transverse and longitudinal ribs to the pull-out force during the process was determined. Specific test conditions are detailed in Table 3. The pull-out test was carried out under undrained conditions. To ensure full soil consolidation and attainment of the target compaction degree, a dial indicator was used to measure the displacement of the model top cover, as shown in Figure 4. Consolidation of the filled soil was considered achieved if the variation in the dial indicator reading was less than 5% within a 15 min period.
Table 3.
Pull-out test scheme.
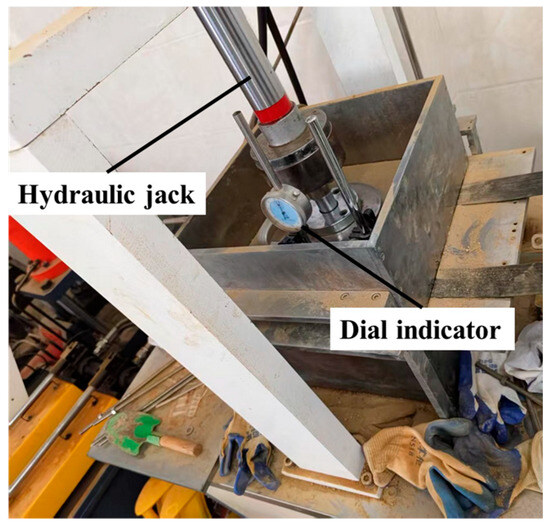
Figure 4.
Fill soil consolidation diagram.
3. Analysis of Pull-Out Test Results
3.1. Effects of Different Pull-Out Rates
Figure 5 shows the relationship curves between pull-out force and loading end displacement under different drawing rates. It can be seen from the figure that at the same pull-out rate, the peak pull-out force increases with the rise in normal stress, and the growth amplitude is relatively uniform. The pull-out force exhibits a nonlinear increase with the growth of displacement, and its development pattern can be roughly divided into the following three stages: (1) during the initial pull-out stage, the force increases slowly with the displacement, but the rate of increase gradually accelerates; (2) when displacement reaches 5 mm, the pull-out force increases linearly and reaches a peak the location of the peak shifts backward as normal stress increases; and (3) after reaching the peak value, the curve gradually stabilizes, and the pull-out force remains constant as displacement increases. The relationship curves under partial low normal stress conditions exhibit strain-softening behavior, with the force showing a distinct descending segment after peaking.
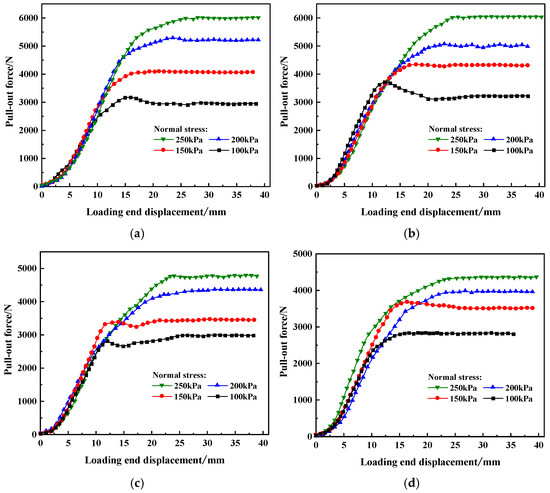
Figure 5.
Relationship curves of pull-out force and loading end displacement under different pull-out rates: (a) v = 0.5 mm/min; (b) v = 1.0 mm/min; (c) v = 2.0 mm/min; (d) v = 3.0 mm/min.
Under low normal stress, the soil is relatively loose. So during the pull-out process, relative sliding occurs between soil particles, which reduces the soil–reinforcement interface strength and leads to a distinct strain–softening pattern in the curve. In addition, the pull-out force curve still exhibits a slight increase during the stable stage under low stress. It indicates that the relative sliding between soil particles can fill the voids within the soil, which makes the soil denser and results in a slight improvement in the soil–reinforcement interface strength.
The pullout force values in the stable stage of the relationship curves were taken as the ultimate pullout resistance, and the shear stress at the soil–reinforcement interface was calculated according to Formula (1).
where Pr is the ultimate pull-out resistance of the geogrid; L and B are the embedded length and width of the geogrid in the soil.
Linear fitting was performed on the shear stress and normal stress at the soil–reinforcement interface under different pullout rates, and the fitting results are shown in Figure 6a. The fitting coefficient R2 is close to 1, indicating a good fitting effect. The reinforcement–soil interface parameters and were calculated from the fitted straight lines, and their variation with the pull-out rate is shown in Figure 6b. The interface friction angle decreases nonlinearly with the increase in pull-out rate, whereas the interface cohesion exhibits the opposite trend. When comparing the interface strength parameters at two pull-out rates of 0.5 mm/min and 3 mm/min, we can find that with the increase in pull-out rate, decreases from 12.71° to 5.82°, representing a reduction of 54.2%. Meanwhile, increases from 9.24 kPa to 18.79 kPa, with a growth rate of 103.4%. It is evident that the pull-out rate exerts a significant influence on the interface strength parameters.
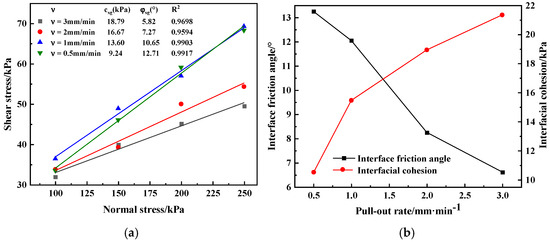
Figure 6.
Strength characteristics of the soil–reinforcement interface under different pull-out rates: (a) fitted shear strength lines; (b) variation relationship of interface parameters.
To analyze the mechanism, when the pull-out rate is excessively high, the soil surrounding the geogrid cannot rearrange in a timely manner, resulting in relatively small dislocation between soil particles. Moreover, the rapid sliding of the reinforcement material disrupts the original interlocking structure between particles, which weakens the mechanical interlocking effect between the geogrid surface and soil particles. This is macroscopically manifested as a reduction in the friction angle. The fine-grained fraction of the soil on the geogrid surface forms a thin film. When the pull-out rate increases, the fine-grained film cannot detach in a timely manner, which causes the film to be compacted and densified at the interface, forming a continuous and dense bonding layer. The bonding layer can enhance the bonding effect between the reinforcement and soil. As the pull-out rate increases, the degree of compaction of fine particles gradually rises, and the strength of the bonding layer is continuously enhanced.
The pull-out friction coefficient f is an important quantitative index for characterizing the frictional behavior of the soil–reinforcement interface, which can be calculated using the following Formula (2):
where the is normal stress.
Figure 7 shows the relationship curves between the pull-out friction coefficient f and the normal stress under various pull-out rates, and exponential functions are adopted for curve fitting. In general, the pull-out friction coefficient f decreases nonlinearly with the increase in normal stress. When the normal stress reaches a certain threshold value, the decreasing rate of f tends to slow down. At low pull-out rates of 0.5 mm/min and 1 mm/min, is relatively high. In contrast, at high pull-out rates of 2 mm/min and 3 mm/min, it decreases significantly with a relatively large declining rate. This indicates that an excessively high pull-out rate can considerably weaken the strength of the soil–reinforcement interface.
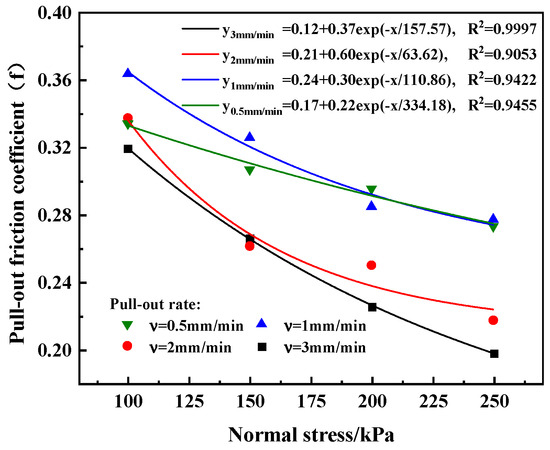
Figure 7.
Relationship between pull-out friction coefficient and normal stress under different pull-out rates.
Figure 8 shows the variation curves of the peak geogrid pull-out force with pull-out rate under different normal stresses. It can be seen from the figure that the peak pull-out force exhibits a variation trend of first increasing and then decreasing with the increase in pull-out rate. Furthermore, with the increase in pull-out rate, there exists a critical pull-out rate of 1 mm/min, at which the peak pull-out force of the geogrid reaches the maximum value. This indicates that an appropriate pull-out rate enables the soil surrounding the geogrid to rearrange in a timely manner, which can better improve the mechanical interlocking effect between the geogrid surface and soil particles and enhance the frictional force of the soil–reinforcement interface.
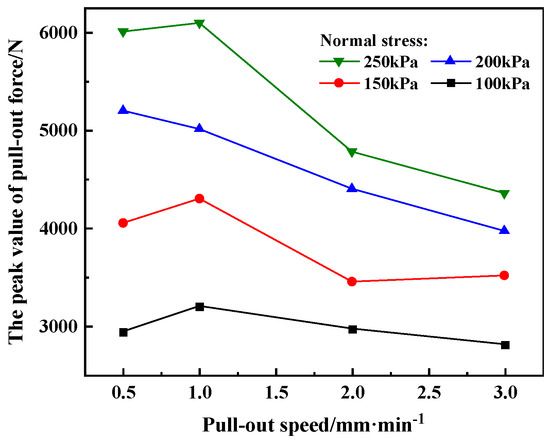
Figure 8.
Variation law of peak pull-out force with pull-out rates under different normal stresses.
3.2. Effects of Different Moisture Contents
To investigate the effect of fill moisture content on the pull-out behavior of geogrids, pull-out tests were conducted at three moisture content gradients of 5%, 10%, and 15% with a constant pull-out rate of 2 mm/min. Figure 9 presents the relationship curves between pull-out force and loading end displacement under different moisture contents and various normal stresses. As the figure shows, the pull-out extreme value of the geogrid in the stable pull-out stage decreases with the growth of fill moisture content. Moreover, under the normal stress of 100 kPa, the stable extreme value decreases considerably. When the moisture content increases from ω = 5% to ω = 15%, the stable extreme value drops from 2975 kPa to 2104 kPa, representing a decrease of 29%. It indicates that water forms a film at the soil–reinforcement interface, which acts as a lubricant to reduce the frictional resistance between the geogrid and soil. The lubricating effect is more pronounced at lower normal stresses.
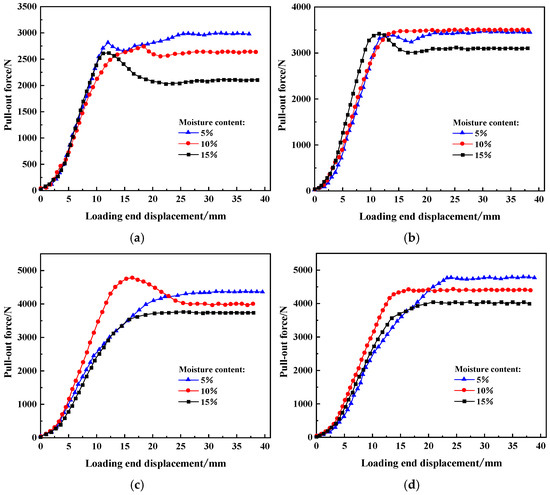
Figure 9.
Effects of moisture content on pull-out force under various normal stresses: (a) 100 kPa; (b) 150 kPa; (c) 200 kPa; (d) 250 kPa.
As shown in Figure 10a, the fitted lines represent the relationship between shear stress and normal stress under different moisture contents. Based on the fitting results, the strength parameters and of the soil–reinforcement interface were obtained, and the curves illustrating their relationships with fill moisture content are presented in Figure 10b. Compared with the influence of pull-out rate on the strength parameters of the soil–reinforcement interface, the variations in and values under different moisture contents are relatively small. Specifically, the decreases with an increase in moisture content, whereas the shows a trend of first increasing and then decreasing as moisture content rises, with a peak value of 20.34 kPa attained at a moisture content of 10%.
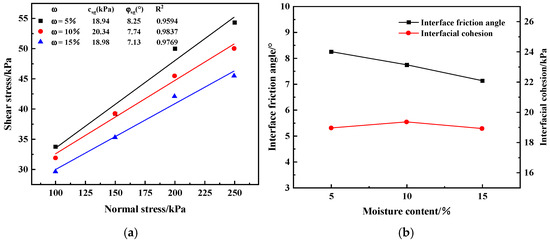
Figure 10.
Strength characteristics of the soil–reinforcement interface under different moisture contents: (a) fitted shear strength lines; (b) variation relationship of interface parameters.
Figure 11 shows the relationship curves between the pull-out friction coefficient f and normal stress under different moisture contents. As can be seen from the figure, the value of f decreases overall with the growth of moisture content . The relationship curve at a moisture content of 5% tends to stabilize with increasing normal stress, while the other two curves corresponding to higher moisture contents still exhibit a significant downward trend as normal stress increases. This further demonstrates the lubricating effect of water on the soil–reinforcement interface.
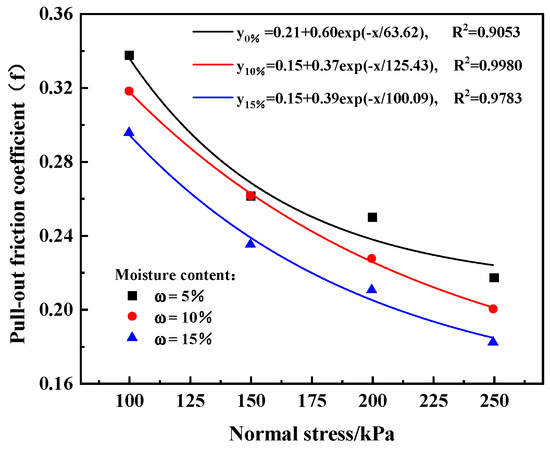
Figure 11.
Relationship between pull-out friction coefficient and normal stress under different moisture contents.
3.3. Friction Characteristics Model for Geogrid Interface
Currently, the classical soil–reinforcement interface models primarily include the ideal elastoplastic model, the hyperbolic model, and the bilinear model. The hyperbolic model is the most commonly used constitutive model for describing the strain–hardening curves in pull-out tests of geosynthetics, with its model expression shown in Formula (3).
where is pull-out force; is tensile displacement; a and b are fitting parameters.
The ideal elastoplastic model comprises two stages. During the first stage, when the interfacial shear stress is below the peak shear stress, the material behaves elastically. The interfacial shear stress increases linearly with increasing drawing displacement. Upon reaching the peak shear stress, the material transitions to the second stage, exhibiting ideal plastic behavior. Here, the shear stress remains constant, forming a horizontal line in the relationship curve with drawing displacement. The model expression is shown in Formula (4).
where is interfacial tangential stiffness; is tensile displacement; is the pull-out displacement corresponding to the ultimate shear strength.
Based on the ideal elastic-plastic model, a bilinear model can be further optimized. This model is also divided into two stages: the first stage represents the linear relationship between shear stress and tensile displacement before the shear stress reaches its peak; the second stage represents the linear relationship reflecting the strain hardening of the reinforcement. The model expression is shown in Formula (5).
where and are the shear modulus and the hardening shear modulus of the elastic interface, respectively.
Based on the grid-based pull-out test, the results obtained at a pull-out rate of 2 mm/min and a soil moisture content of 5% were selected for analysis. The fitting results of different models are shown in Table 4 and Figure 12. It can be observed that under different normal stresses, the bilinear model exhibits a higher R2 value compared to the ideal elastic–plastic model and the hyperbolic model, indicating its superior fitting performance.
Table 4.
Fitting coefficient of R2 results.
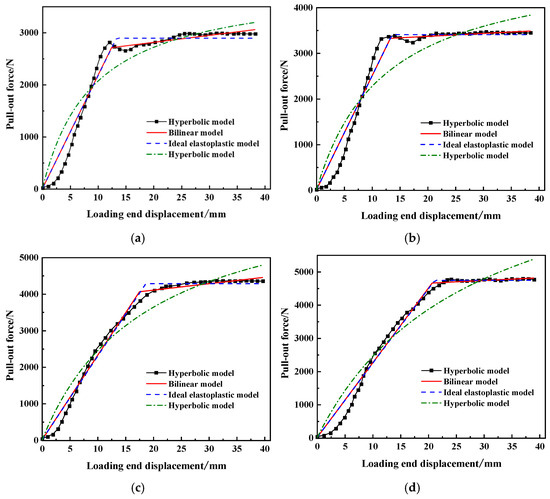
Figure 12.
Fitting results for pull-out curves under different normal stresses: (a) 100 kPa; (b) 150 kPa; (c) 200 kPa; (d) 250 kPa.
4. Pull-Out Test Numerical Simulation
Pull-out tests are usually numerically simulated by means of the Discrete Element Method (DEM), where ball elements are adopted to simulate both the fill and the geogrid, with parameter calibration conducted for the pull-out process. However, considering that the geogrid employed in this pull-out test features relatively wide transverse and longitudinal ribs, simply modeling the geogrid with ball elements cannot adequately simulate the continuity of the soil–reinforcement interface. Therefore, the Finite Difference Method (FDM) was adopted to simulate the geogrid.
4.1. Model Structure
A full-scale model was established for the pull-out test. Considering computational efficiency and accuracy, the particle size of the fill in the model box was appropriately enlarged, with the gradation curve after enlargement shown as the red curve in Figure 3a. After servo preloading was applied to the generated fill model, the ball elements in the central region were deleted, and a geogrid model was established in this area. Finally, servo confining pressure was imposed on the wall elements at the model boundaries to ensure tight contact between the fill and the geogrid. As shown in Figure 13, the structural diagram of the pull-out model illustrates the detailed structure of the geogrid and its placement within the fill.
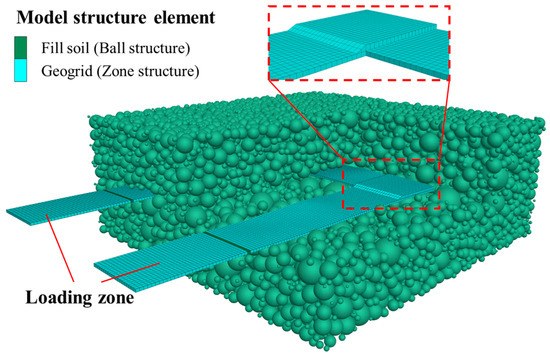
Figure 13.
Schematic diagram of the numerical mode.
4.2. Model Parameter Calibration
A constant velocity of 2 mm/min was applied to the end elements of the geogrid to simulate the pull-out process, and the stress and displacement at the front end of the pull-out zone were monitored. The model parameters were calibrated based on the measured data of physical tests, with the calibrated parameters and corresponding results presented in Table 5 and Figure 14. As shown in the figure, to eliminate errors caused by test equipment and operations, the stress–hardening segment in the early stage of the pull-out displacement curve was corrected. The numerical simulation results are well in agreement with the corrected displacement curve.
Table 5.
Results of numerical model parameter calibration: (a) structural element calibration; (b) ball–ball contact element calibration; (c) wall–ball contact element calibration.
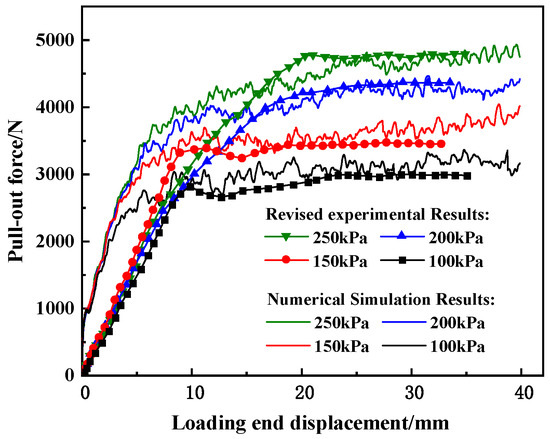
Figure 14.
Comparison between experimental and numerical simulation results.
4.3. Analysis of Numerical Simulation Results
4.3.1. Geogrid Displacement and Deformation Results
Figure 15 illustrates the displacement characteristics of the geogrid when the loading ends reach 5 mm, 10 mm, 20 mm, and 40 mm. To visualize the deformation of the geogrid itself, the amplification factor Def-fac was set to eight. As shown in the figure, when the loading end displacement is less than 10 mm, the displacement of different parts of the geogrid varies significantly. Then the displacement of each part of the geogrid becomes relatively uniform, and the transverse ribs start to produce considerable movement. In the overall pull-out direction, the displacement of the geogrid transverse ribs exhibits an arc-shaped distribution pattern with smaller values in the middle and larger values at both ends. As the loading end displacement increases, the curvature of the arc becomes more pronounced.
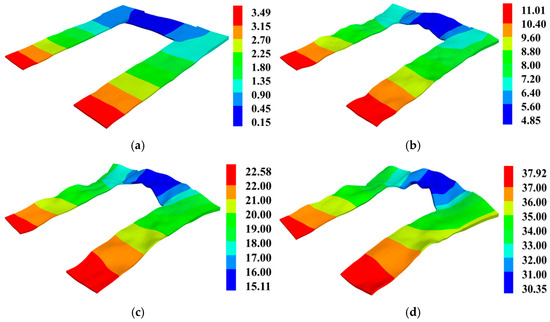
Figure 15.
Schematic diagram of geogrid displacement and deformation: (a) displacement of 5 mm; (b) displacement of 10 mm; (c) displacement of 20 mm; (d) displacement of 40 mm.
The middle part of the geogrid transverse ribs undergoes significant bulging deformation, presenting an overall arch-like shape. This indicates that the transverse ribs generate substantial mechanical interlocking force by penetrating upward into the soil during the pull-out process. Meanwhile, subjected to the tensile stress induced by the upward bulging of the transverse ribs and the compressive stress from the soil around the geogrid edges, the left and right ends of the joints between the transverse and longitudinal ribs bend downward. These bent sections are embedded into the soil, which also enhances the interlocking force between the geogrid and the soil.
The maximum normal displacement of the grid cross-ribs under various normal stresses is extracted, yielding the variation curve between displacement extremes and normal stress, as shown in Figure 16. The figure reveals that the maximum normal displacement of the grid cross-ribs exhibits nonlinear growth with increasing normal stress. When the normal stress exceeds 200 kPa, the displacement extremum rises rapidly, indicating that the grid cross ribs become further embedded into the soil particles.
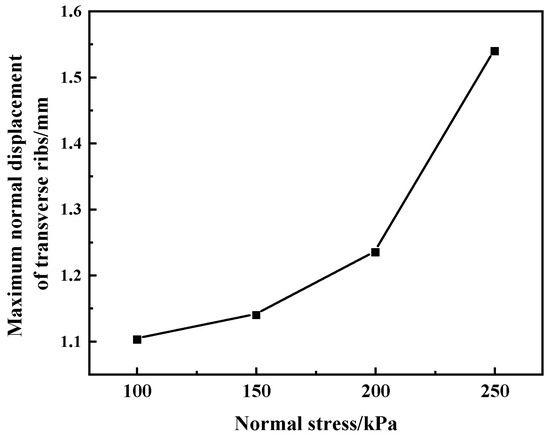
Figure 16.
Variation in extreme displacement in the transverse rib direction with normal stress.
4.3.2. Stress Analysis of Soil–Reinforcement Interface
The force vector nephograms of the wall–ball contact elements were extracted when the displacement at the loading end reached 5 mm, 20 mm, and 40 mm, and the stress state of the soil–reinforcement interface was analyzed, as shown in Figure 17. As shown in the figure, the friction force represented by the blue–green arrows is relatively uniformly distributed across all parts of the geogrid. As the pull-out displacement increases, there is little significant change in the size and distribution of the arrows, indicating that the friction force at the soil–reinforcement interface remains relatively stable during the pull-out process. The contact force indicated by the red arrows has a relatively large magnitude, which represents the mechanical interlocking force generated by the extrusion between soil particles and the geogrid. It can be observed that during the early and middle pull-out stages, the mechanical interlocking force originates predominantly from the front ends of the geogrid transverse ribs and the protrusions at transverse-longitudinal rib junctions. Combined with the content in Section 4.3.1, in the later stage of pull-out, the transverse ribs undergo significant deformation, leading to a relatively backward distribution of mechanical interlocking force, which is roughly concentrated in the middle of the transverse ribs. This indicates that the magnitude and acting position of the mechanical interlocking force change dynamically during the pull-out process, which is correlated with the deformation of the geogrid itself.
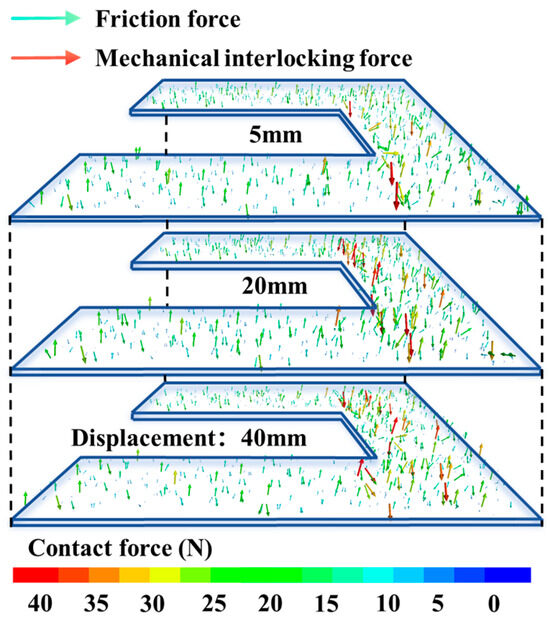
Figure 17.
Stress vector nephogram of soil–reinforcement interface.
5. Theoretical Analysis of the Bearing Characteristics of Geogrids
The pull-out resistance exerted on the geogrid during the pull-out process is mainly composed of two components: the sliding friction between the geogrid and soil and the resistance generated by the extrusion and interlocking between the transverse ribs and soil. Therefore, the pull-out resistance of the geogrid can be expressed as the following Equation (6):
where is the sliding friction of the soil–reinforcement interface; is the interlocking resistance of the soil–reinforcement interface.
Among these parameters, can be expressed as the following Equation (7):
where is the ratio of the actual surface area of the geogrid to its embedded area, with a value of 0.61 adopted in this study; is the soil–reinforcement interface sliding friction angle.
The can be expressed as the following Equation (8):
where is the ratio of the effective front-end area of the transverse ribs for calculating the bearing capacity component of the geogrid transverse ribs, which is assigned a value of 1 in this study; n is the number of transverse ribs in the embedded segment, which is assigned a value of 1. is the thickness of the transverse ribs. Considering the thickness at the joints between the longitudinal and transverse ribs, the equivalent thickness of the transverse ribs is determined as 3.25 mm in accordance with the principle of volume equivalence; is the bearing stress acting on the transverse rib elements.
acting on the transverse rib elements is mainly affected by the failure mode of the reinforced soil. Currently, there are two classical failure modes for reinforced soil, namely the general shear failure mode proposed by Nielsen [34] and the puncture shear failure mode proposed by Jewell et al. [35], which correspond to the theoretical upper-bound solution and lower-bound solution, respectively.
in the general shear failure mode can be expressed as the following Equation (9):
where is the internal friction angle of the soil, which is taken as 33.7° based on the direct shear test results.
in the puncture shear failure mode can be expressed as the following Equation (10):
The pull-out test on double longitudinal ribs was performed by removing the transverse ribs, and the test results are presented in Figure 18. As shown in the figure, the pull-out curve of the double longitudinal ribs exhibits a very obvious stress-softening phenomenon: the pull-out force drops sharply after reaching the peak value and finally stabilizes at a constant value. The values of the stable segments of each curve were taken as the sliding friction force, and the soil–reinforcement interface sliding friction angle was calculated to be 9.88°.
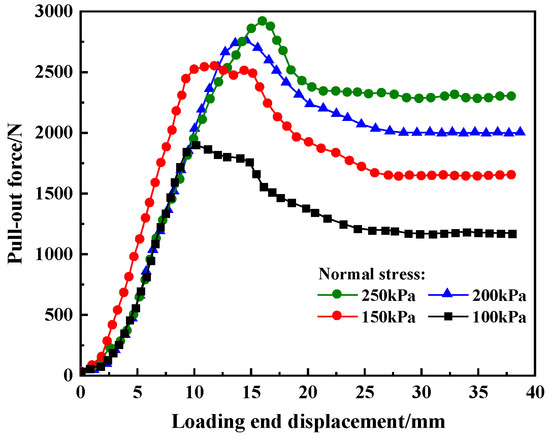
Figure 18.
Force–displacement curve for double longitudinal rib pull-out.
According to the ratio of the loading area in this geogrid pull-out test to the area of the actual geogrid element, the sliding friction force results were scaled up proportionally to obtain more realistic sliding friction force values, and the overall calculation results are presented in Table 6. It can be seen from the table that for the actual geogrid element, its pull-out interlocking resistance accounts for approximately 20% of the total pull-out resistance, while the sliding friction force accounts for around 80%. This indicates that the geogrid primarily relies on its wide and slender longitudinal ribs to provide frictional resistance during the pull-out process. It is different from conventional plastic fine-rib geogrid, for which the pull-out interlocking resistance can account for 60% of the total pull-out force. Therefore, in practical engineering applications, attention should be paid to the protection of the geogrid longitudinal ribs, and the longitudinal ribs should be laid as parallel as possible during geogrid installation to maximize the effect of frictional resistance.
Table 6.
Pull-out resistance of theoretical and experimental results under different normal stresses.
Figure 19 shows the relationship curve between pull-out force and normal stress, with a comparison of theoretical and experimental results. As can be seen from the figure, the experimental result is closer to the theoretical results proposed by Nielsen under low normal stress ( 200 kPa), while it gradually approaches the theoretical result of Jewell et al. under high normal stress ( 200 kPa). This pattern is also reflected in the numerical simulation results of the normal displacement variation in the grid cross-ribs, as shown in Figure 16. In fact, the theory proposed by Nielsen is based on Prandtl’s ultimate bearing capacity theory of foundations, and it is targeted at the ultimate bearing capacity failure of strip shallow foundations. This indicates that under low normal stress conditions, the wide and long geogrid exhibits a pull-out failure mode similar to a shallow strip foundation, which is general shear failure. With the increase in normal stress, vertical shear failure occurs in the soil surrounding the geogrid, and the geogrid penetrates into the soil. So its failure mode is closer to puncture shear failure, which is also consistent with the deformation mode of the transverse ribs in the numerical simulation.
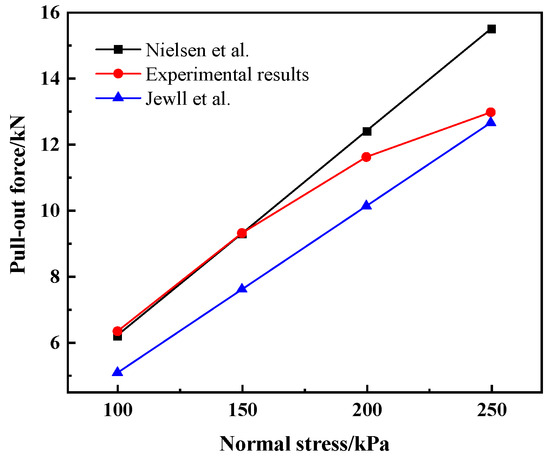
Figure 19.
Comparison of theoretical and experimental pull-out resistance (the mentioned references are [34,35]).
6. Conclusions
For polyester yarn bundled geogrid, the pull-out rate has a significant impact on the strength of the soil–reinforcement interface, with a critical pull-out rate of 1 mm/min at which the peak pull-out force is maximized. The interface friction angle decreases with the increase in pull-out rate, while the interface cohesion shows the opposite trend. The increase in fill moisture content reduces the pull-out resistance through the lubrication effect, resulting in a strain–softening pattern of the pull-out curve. Under low normal stress conditions ( 200 kPa), excessively high pull-out rates and moisture contents exert a more pronounced weakening effect on the interface, which is manifested by a significant reduction in the pull-out friction coefficient .
Numerical simulation results indicate that during the pull-out process, the longitudinal ribs undergo displacement and deformation first, and the transverse ribs exhibit a displacement pattern of being smaller in the middle and larger at both ends under the drive of the longitudinal ribs. The transverse ribs of the geogrid experience substantial deformation, presenting an upward arch-like shape, while the edges of the joints between the longitudinal and transverse ribs bend downward and embed into the soil. The sliding friction force at the interface is uniformly distributed, and the mechanical interlocking force migrates backward from the front ends of the transverse ribs to the middle as the pull-out progresses, which is dynamically related to the geogrid deformation.
Sliding friction accounts for 80% of the total pull-out resistance of the polyester yarn bundled geogrid, which mainly relies on the longitudinal ribs to provide frictional resistance. The failure mode varies with normal stress: at low stress levels ( 200 kPa), it manifests as global shear failure, while at high stress levels ( 200 kPa), it transitions to penetration shear failure. Therefore, in actual engineering practice, the geogrid should be laid as flat as possible, and the thickness of the fill material should be kept uniform during layered placement to maximize the geogrid’s friction resistance. The maintenance and reinforcement of the grid ribs and node areas are also required to enhance the grid’s durability.
Author Contributions
Conceptualization, J.T., W.Z., P.Z. and Y.L.; methodology, J.T., W.Z., P.Z. and Y.L.; validation, J.T., W.Z. and P.Z.; formal analysis, J.T., W.Z. and P.Z.; investigation, J.T., W.Z. and P.Z.; resources, P.Z. and Y.L.; data curation, J.T., W.Z. and P.Z.; writing—original draft preparation, J.T.; writing—review and editing, J.T. and Y.L.; visualization, J.T., W.Z. and P.Z.; supervision, Y.L. All authors have read and agreed to the published version of the manuscript.
Funding
This research was funded by the Science and Technology Research and Development Program of China Railway Group Limited (2022-Major-03).
Data Availability Statement
The original contributions presented in the study are included in the article; further inquiries can be directed to the corresponding author.
Conflicts of Interest
Authors Wei Zhao and Pengyu Zhu are employed by the China Railway No. 2 Engineering Group Co., Ltd. The remaining authors declare that this research was conducted in the absence of any commercial or financial relationships that could be construed as a potential conflict of interest.
References
- Liu, H.; Zhang, Z.; Long, Z.; He, B.; Chen, F.; Chen, Z.; Lin, Y. Mechanical model of tensile loading of geotechnical reinforcement materials. Materials 2025, 18, 214. [Google Scholar] [CrossRef]
- Zhu, Y.; Zhan, Z.; Hong, Y.; Guo, P.; He, M.; Chen, R. Experimental study on mechanical and deformation characteristics of geogrid-reinforced soil retaining walls. Int. J. Geosynth. Ground Eng. 2024, 10, 74. [Google Scholar] [CrossRef]
- Lin, Y.; Hou, K.; Zhou, Y.; Zhu, P. Seismic displacement of a three-stage anchored slope: 3D limit analysis with dynamic yield acceleration. Soil Dyn. Earthq. Eng. 2026, 201, 110005. [Google Scholar] [CrossRef]
- Lin, Y.; Zhang, Z.; Zhou, Y.; Duan, J.; Yang, G. Investigation on lateral pressure on a sheet-pile wall with EPS layer supporting an expansive soil slope. Case Stud. Constr. Mater. 2024, 21, e03945. [Google Scholar] [CrossRef]
- Fox, P.J. Analytical Solutions for Internal Stability of a Geosynthetic-Reinforced Soil Retaining Wall at the Limit State. J. Geotech. Geoenviron. Eng. 2022, 148, 04022076. [Google Scholar] [CrossRef]
- Bilgin, O. Failure mechanisms governing reinforcement length of geogrid reinforced soil retaining walls. Eng. Struct. 2009, 31, 1967–1975. [Google Scholar] [CrossRef]
- Lin, Y.; Lu, L.; He, D.; Chen, X.; Duan, J. Prediction on the seismic response of a multi-stage anchored slope by a time-dependent displacement analysis. Eur. J. Environ. Civ. Eng. 2025, 29, 2740–2765. [Google Scholar] [CrossRef]
- Altay, G.; Kayadelen, C.; Taşkıran, T.; Kaya, Y.Z. A laboratory study on pull-out resistance of geogrid in clay soil. Measurement 2019, 139, 301–307. [Google Scholar] [CrossRef]
- Bai, Q.; Liu, J.; Wang, Y.; Du, H.; Wang, B. Experimental investigation of interface characteristics between geogrid and coarse-grained soil in a seasonally frozen area. Appl. Sci. 2022, 12, 10187. [Google Scholar] [CrossRef]
- Makkar, F.M.; Chandrakaran, S.; Sankar, N. Experimental investigation of response of different granular soil–3d geogrid interfaces using large-scale direct shear tests. J. Mater. Civ. Eng. 2019, 31, 04019012. [Google Scholar] [CrossRef]
- Safa, M.; Maleka, A.M.; Arjomand, M.; Khorami, M.; Shariati, M. Strain rate effects on soil-geosynthetic interaction in fine-grained soil. Geomech. Eng. 2019, 19, 533–542. [Google Scholar]
- Liu, J.; Pan, J.; Liu, Q.; Xu, Y. Experimental study on the interface characteristics of geogrid-reinforced gravelly soil based on pull-out tests. Sci. Rep. 2024, 14, 8669. [Google Scholar] [CrossRef]
- Du, W.; Nie, R.; Tan, Y.; Zhang, J.; Qi, Y.; Zhao, C.Y. Influence of strengthened nodes on the mechanical performance of aeolian sand–geogrid interface. Materials 2023, 16, 4665. [Google Scholar] [CrossRef]
- Lakirouhani, A.; Abbasian, M.; Medzvieckas, J.; Kliukas, R. The effect of relative density, granularity and size of geogrid apertures on the shear strength of the soil/geogrid interface. J. Civ. Eng. Manag. 2024, 30, 691–707. [Google Scholar] [CrossRef]
- Abdi, M.R.; Mirzaeifar, H.; Asgardun, Y. Novel soil-pegged geogrid (PG) interactions in pull-out loading conditions. Geotext. Geomembr. 2022, 50, 764–778. [Google Scholar] [CrossRef]
- Gao, W.; Lin, Y.; Wang, X.; Zhou, T.; Zheng, C. Interface mechanics of double-twisted hexagonal gabion mesh with coarse-grained filler based on pullout test. Materials 2024, 17, 164. [Google Scholar] [CrossRef] [PubMed]
- Lin, Y.; Lu, L.; Duan, J. Estimation on the earthquake-induced displacement of an inhomogeneous and anisotropic anchored slope considering a time-dependent yield acceleration. Soil Dyn. Earthq. Eng. 2025, 191, 109220. [Google Scholar] [CrossRef]
- Lin, Y.; Jin, J.; Jiang, Z.; Liu, W.; Liu, H.; Li, R.; Liu, X. Seismic response of combined retaining structure with inclined rock slope. Struct. Eng. Mech. 2022, 84, 591–604. [Google Scholar]
- Li, J.; Jia, Y.F.; Miao, C.X.; Xie, M.X. Discrete element analysis of the load transfer mechanism of geogrid-ballast interface under pull-out load. Adv. Civ. Eng. 2020, 2020, 8892922. [Google Scholar] [CrossRef]
- Attache, S.; Mellas, M. Numerical study of large-scale pull-out test of horizontal corrugated strips. Int. J. Geotech. Eng. 2020, 14, 62–70. [Google Scholar] [CrossRef]
- Fu, J.; Li, J.; Chen, C.; Rui, R. Dem-fdm coupled numerical study on the reinforcement of biaxial and triaxial geogrid using pullout test. Appl. Sci. 2021, 11, 9001. [Google Scholar] [CrossRef]
- Liang, X.; Jin, J.; Yang, G.; Wang, X.; Zhou, Y. Pullout characteristics and damage softening model of the geogrid-soil interface. Adv. Mater. Sci. Eng. 2022, 2022, 8047519. [Google Scholar] [CrossRef]
- Pant, A.; Datta, M.; Ramana, G.V.; Bansal, D. Measurement of role of transverse and longitudinal members on pullout resistance of PET geogrid. Measurement 2019, 148, 106944. [Google Scholar] [CrossRef]
- Moraci, N.; Gioffrè, D.A. Simple method to evaluate the pullout resistance of extruded geogrids embedded in a compacted granular soil. Geotext. Geomembr. 2006, 24, 116–128. [Google Scholar] [CrossRef]
- Cardile, G.; Gioffre, D.; Moraci, N.; Calvarano, L.S. Modelling interference between the geogrid bearing members under pullout loading conditions. Geotext. Geomembr. 2017, 45, 169–177. [Google Scholar] [CrossRef]
- Bathurst, R.J.; Ezzein, F.M. Geogrid and soil displacement observations during pullout using a transparent granular soil. Geotech. Test. J. 2015, 38, 673–685. [Google Scholar] [CrossRef]
- Malicki, K.; Górszczyk, J.; Dimitrovová, Z. Recycled Polyester Geosynthetic Influence on Improvement of Road and Railway Subgrade Bearing Capacity—Laboratory Investigations. Materials 2021, 14, 7264. [Google Scholar] [CrossRef]
- Baadiga, R.; Balunaini, U.; Saride, S. Influence of geogrid properties on rutting and stress distribution in reinforced flexible pavements under repetitive wheel loading. J. Mater. Civ. Eng. 2021, 33, 04021338. [Google Scholar] [CrossRef]
- Baadiga, R.; Balunaini, U.; Saride, S.; Madhav, M. Effect of geogrid type and subgrade strength on the traffic benefit ratio of flexible pavements. Transp. Infrastruct. Geotechnol. 2021, 10, 180–210. [Google Scholar] [CrossRef]
- Al-Barqawi, M.; Aqel, R.; Wayne, M.; Titi, H.; Elhajjar, R. Polymer Geogrids: A Review of Material, Design and Structure Relationships. Materials 2021, 14, 4745. [Google Scholar] [CrossRef]
- Ma, X.; Bai, F. The role of geogrid aperture shape and size in strengthening aeolian sands: Insights from a coupled dem-fdm approach. Comput. Geotech. 2025, 180, 107067. [Google Scholar] [CrossRef]
- Liu, L.; Shu, Z.; Gao, J.; Chen, C.; Pan, L.; Ren, P.W. Experimental research on the influence of geogrid morphological parameters on the mechanical characteristics and deformation rules of reinforced foundations. Constr. Build. Mater. 2025, 500, 144100. [Google Scholar] [CrossRef]
- Buragadda, V.; Orekanti, E.R.; Garu, V.Y.; Edagotti, P.K. Influence of reinforcement geometrical parameters on plate anchor uplift capacity. Transp. Infrastruct. Geotechnol. 2024, 11, 1828–1859. [Google Scholar] [CrossRef]
- Nielsen, M. Pullout Resistance of Welded Wire Mats Embedded in Soil. Master’s Thesis, Utah State University, Logan City, UT, USA, 1984. [Google Scholar]
- Jewell, R.A.; Milligan, G.W.E.; Sarsby, R.W.; Dubois, D. Interaction between Soil and Geogrids. In Proceedings of the Symposium on Polymer Grid Reinforcement in Civil Engineering, London, UK, 22–23 March 1984. [Google Scholar]


Disclaimer/Publisher’s Note: The statements, opinions and data contained in all publications are solely those of the individual author(s) and contributor(s) and not of MDPI and/or the editor(s). MDPI and/or the editor(s) disclaim responsibility for any injury to people or property resulting from any ideas, methods, instructions or products referred to in the content. |
© 2026 by the authors. Licensee MDPI, Basel, Switzerland. This article is an open access article distributed under the terms and conditions of the Creative Commons Attribution (CC BY) license.