


Abstract
This study investigates the flexural behavior and practical application of Reinforced Concrete (RC) beams strengthened with Ultra-High Performance Concrete (UHPC). Flexural tests were conducted on ten beam specimens to systematically analyze the effects of steel fiber dosage, reinforcement ratio, and beam height on the failure modes, load-bearing capacity, and deformation characteristics of the strengthened beams. The results were compared with those of unstrengthened control beams (CB). Experimental observations indicated excellent interfacial bonding between the UHPC layer and the RC beam, with no debonding failure occurred. All specimens exhibited typical under-reinforced flexural failure characteristics, and their load–deformation curves displayed three distinct stages. Compared to the control beams, the ultimate load-bearing capacities of the strengthened beams increased by 9.5–15.7% with varying steel fiber dosages, 16.4–110.2% with varying reinforcement ratios, and 6.2–518.8% with varying beam heights. Furthermore, the UHPC layer significantly enhanced the flexural stiffness of the beams. Although ductility was slightly reduced, all strengthened beams demonstrated clear yield characteristics prior to failure, avoiding brittle fracture. Additionally, nonlinear numerical simulations performed using MATLAB R2020a showed high agreement with the experimental results, verifying the accuracy of the analytical procedure. Based on the validated model, a parametric study was conducted to further investigate the influence of beam height, reinforcement ratio, and interface coefficients on flexural performance. The findings confirm the reliability and effectiveness of the UHPC strengthening technique.
1. Introduction
Ultra-high performance concrete (UHPC), a class of reactive powder concrete (RPC) reinforced with steel fibers, was first developed by Richard and Cheyrezy [1]. It exhibits exceptional mechanical and physical properties, including high strength, superior toughness and durability, low permeability, minimal shrinkage and creep, and excellent volumetric stability [2,3,4]. The design of UHPC relies on particle packing optimization, wherein coarse aggregates are eliminated and steel fibers are introduced to enhance strength and ductility [5]. This fiber reinforcement enables the UHPC matrix to demonstrate tensile strain-hardening behavior, characterized by a sustained increase in tensile strength over a significant strain range after cracking, with ultimate tensile strains reaching 0.3–0.5% [6]. Furthermore, UHPC offers superior resistance to permeability, freeze–thaw cycles, and chemical attack compared to conventional concrete [7]. Studies have also indicated that embedding reinforcing bars within UHPC further improves its strain-hardening capacity, yielding visible-crack tensile strengths exceeding 30 MPa [8]. Evolutionarily, UHPC represents an advanced iteration of material technology, derived from normal-strength concrete (NSC) and high performance concrete (HPC).
Given its superior mechanical and durability profiles, UHPC has been widely investigated for the strengthening of existing structures. Graybeal [9] conducted full-scale tests on UHPC bridge girders with varying spans and shear-span ratios, while Voo et al. [10] performed structural tests demonstrating that UHPC substantially enhances ductile behavior. Additionally, Yang et al. [11] and Yoo et al. [12] investigated the effect of the longitudinal reinforcement ratio on UHPC beams, concluding that the combination of reinforcing bars and steel fibers effectively controls crack width and improves ductility. More recently, Nadir, W et al. [13] proposed a hybrid strengthening technique utilizing a UHPC overlay reinforced with fiber-reinforced polymer (FRP) bars to improve the shear performance of reinforced concrete (RC) beams. Their results indicated that this method significantly increased the ultimate load capacity (Pu) and shifted the failure mode from shear to flexure.
The proven structural effectiveness of UHPC has opened new avenues for the rehabilitation of RC members. Research interest has increasingly shifted toward thin UHPC overlays, particularly for enhancing flexural performance. Thin-layer strengthening leverages the superior tensile behavior of UHPC while minimizing added thickness, offering excellent constructability—attributes that are particularly advantageous in space-restricted or localized rehabilitation scenarios. Consequently, understanding the flexural load-bearing mechanisms of RC members strengthened with thin UHPC layers has emerged as a critical research focus.
Substantial research has been conducted to elucidate the mechanisms governing flexural enhancement and interface composite action in UHPC-strengthened members. Early investigations by Hor Yin et al. [14] confirmed that applying a reinforced UHPC layer to the tension zone of RC slabs effectively suppresses flexural–shear crack propagation. Safdar et al. [15] demonstrated that the strengthening configuration and layer thickness significantly influence flexural capacity and crack development. Expanding on this, Prem, P.R. et al. [16,17] reported that thin UHPC layers (10–20 mm) can markedly improve stiffness and load-carrying capacity, although effectiveness depends heavily on the initial damage state and reinforcement ratio. Further studies by Zhang [18] and Jiang et al. [19] highlighted the necessity of maintaining an appropriate compression zone height and sufficient reinforcement utilization to ensure ductile behavior. Experimental work by Deng [20], Kong [21], and Pimentel [22] consistently confirmed a positive correlation between UHPC layer thickness and improvements in flexural resistance and ductility. Meanwhile, Murthy [23] and Al-Osta [24] explored alternative strategies, such as prefabricated UHPC strips and multi-side wrapping, noting trade-offs between strength enhancement and ductility reduction. Research on composite UHPC–NC or RPC–NC beams by Liao [25], Guo [26], and Li [27] further indicated that prestressing and optimized layer configurations can elevate cracking loads, refine crack distribution, and enhance global stiffness.
Parallel to structural performance, the interface behavior between UHPC and normal concrete (NC) is critical for achieving composite action. Tayeh [28,29] and Carbonell [30] established that UHPC and NC possess intrinsic bonding compatibility, which is enhanced under moist curing. Kang [31] and Jang [32] emphasized that proper surface preparation significantly improves shear resistance, whereas high-temperature curing may degrade the interface. Systematic assessments by Zhang et al. [33,34] identified the influence of substrate moisture, curing age, and surface roughness, while Wu and Zhang [35] developed bond–slip models incorporating material strengths. Complementary studies by Feng [36,37], Guan [38], and Wang [39] provided insights into the effects of substrate strength, dowel action, and groove configurations, collectively refining predictive models for interfacial shear. Generally, consensus suggests that while UHPC thin-layer strengthening substantially enhances flexural capacity and stiffness, the reliability of the UHPC–concrete interface remains a decisive factor.
Despite valuable insights gained from previous studies regarding capacity enhancement and crack mitigation, most existing analyses rely on the assumption of a perfect bond at the UHPC–concrete interface. This idealized assumption fails to capture bond–slip and localized debonding phenomena that inevitably arise under service and ultimate loading conditions. In practice, interfacial slip can significantly alter strain compatibility, modify internal force redistribution, and influence the governing failure mechanism, thereby affecting the overall reliability of the strengthening system. While some studies have examined shear-related interfacial behavior, systematic investigations that explicitly incorporate interface slip into flexural capacity assessment remain scarce. Accordingly, this study aims to elucidate the influence of interfacial slip on the flexural performance of UHPC thin-layer–strengthened RC members, with the objective of advancing theoretical understanding and improving the precision of design methodologies.
2. Experimental Program
2.1. Research Approach and Objectives
A comparative experimental approach was adopted in this study, comprising one unstrengthened reinforced concrete (RC) control beam and nine beams strengthened with Ultra-High Performance Concrete (UHPC), all focused on evaluating the flexural behavior of the strengthened structures. The experimental program encompassed three main tasks: testing of the control beam, flexural testing of the UHPC-strengthened beams, and comprehensive characterization of the constituent materials. Detailed mechanical properties and the flexural responses under applied loading were systematically monitored throughout the experiments. The collected data provide robust empirical evidence for understanding the flexural performance of the strengthened beams and serve as a solid foundation for developing accurate analytical models and deriving relevant theoretical formulations.
In practical engineering, although applying a UHPC strengthening layer to the beam soffit (tensile zone) is more complex than the inverted casting performed in the laboratory, it remains highly feasible through modern construction techniques. First, pressure grouting or enclosed formwork casting can be employed, leveraging the high flowability (self-compacting property) of UHPC to ensure filling quality and compaction in narrow spaces. Second, for large-scale applications, UHPC shotcreting (spraying) techniques can be utilized. To ensure adequate bonding, the existing concrete interface must undergo rigorous treatment, such as sandblasting or high-pressure water jetting, to expose the aggregates. Furthermore, the use of interfacial bonding agents or post-installed reinforcement can further enhance the interfacial shear transfer capacity.
The deployment of novel structural strengthening techniques necessitates systematic experimental validation and theoretical derivation. The primary objective of this process is twofold: to evaluate the applicability and reliability of innovative technologies in practical scenarios, and concurrently, to obtain essential material parameters required for constructing precise computational models. These accurate models are indispensable for facilitating subsequent nonlinear sectional analysis and structural performance prediction.
2.2. Materials
The primary materials utilized in the experimental program included Normal Concrete (NC), Ultra-High Performance Concrete (UHPC), and HRB400-grade reinforcing steel. The cement for NC was sourced from Hunan South Cement Co., Ltd. (Changsha, China), the UHPC dry-mix was provided by Hunan Guli Engineering New Materials Co., Ltd. (Changsha, China), and the reinforcing steel was obtained from Anyang Iron & Steel Group Co., Ltd. (Anyang, China). Given that the mechanical properties of these materials directly influence the accuracy of subsequent theoretical calculations for the strengthened beams, all tests were conducted in strict accordance with relevant current standards and specifications. Standardized testing procedures were employed to accurately determine key mechanical parameters for each material type, including the elastic modulus, compressive strength, and tensile strength.
2.2.1. Mechanical Properties of Normal Concrete (NC)
The Normal Concrete (NC) utilized in this study was prepared according to the requirements of the JGJ55-2011 standard (Design Code for Ordinary Concrete Mix Proportion) [40], with a designated compressive strength grade of C45. The mix composition included 42.5R-grade Portland cement, medium sand, crushed stone (with a maximum particle size of 20 mm), and a water-reducing admixture. The detailed mix proportions are precisely outlined in Table 1.
Table 1.
NC mix ratio (kg/m3).
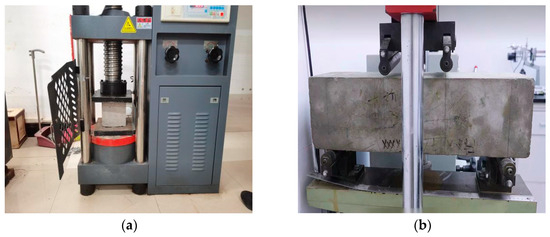
As illustrated in Figure 1, the mechanical properties of the Normal Concrete (NC) were systematically evaluated using a universal testing machine (Jinan Zhongchuang Industry Test System Co., Ltd., Jinan, China) in accordance with the GB/T 50081-2019 standard [41]. The experimental program involved the determination of the static compressive elastic modulus, axial compressive strength, cubic compressive strength, and flexural strength. The cubic compressive strength tests were conducted on standard 150 mm cubic specimens, with three replicates per group. Both the elastic modulus and axial compressive strength were measured using 150 × 150 × 300 mm prism specimens, with six parallel specimens tested for each group. The loading rates for the compressive strength, elastic modulus, and axial compressive strength tests were strictly controlled at 0.5 MPa/s. Flexural strength tests were performed on 150 × 150 × 550 mm prismatic specimens, using three replicates per group, at a loading rate of 0.06 MPa/s.
Figure 1.
Performance tests of ordinary concrete materials: (a) Cube Compressive Strength Test of Normal Concrete; (b) Flexural Strength Test of Normal Concrete.
The fundamental mechanical properties of the C45 normal concrete used in this study are summarized in Table 2.
Table 2.
Material mechanical properties of NC.
2.2.2. Mechanical Properties of UHPC
The mix proportions of the UHPC dry mixture used in this study are presented in Table 3. The constituent materials were as follows: Portland cement P.II 52.5 (28-day compressive strength of 58 MPa); white silica fume (particle size 80–100 nm); gray fly ash (particle size 8–20 μm); quartz powder (average particle size 50.1 μm, density 2.63 g/cm3); 20–40 mesh quartz sand (particle size 0.3–0.6 mm); polycarboxylate-based superplasticizer (water-reduction rate > 30%); copper-coated straight steel fibers (diameter 0.2 ± 0.05 mm, length 13 ± 1 mm, tensile strength > 2000 MPa, dosage 2%). The mixture had a water-to-binder ratio of 0.18, and the 7-day compressive strength exceeded 120 MPa.
Table 3.
UHPC mix ratio (kg/m3).
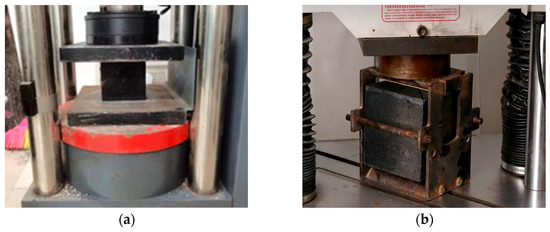
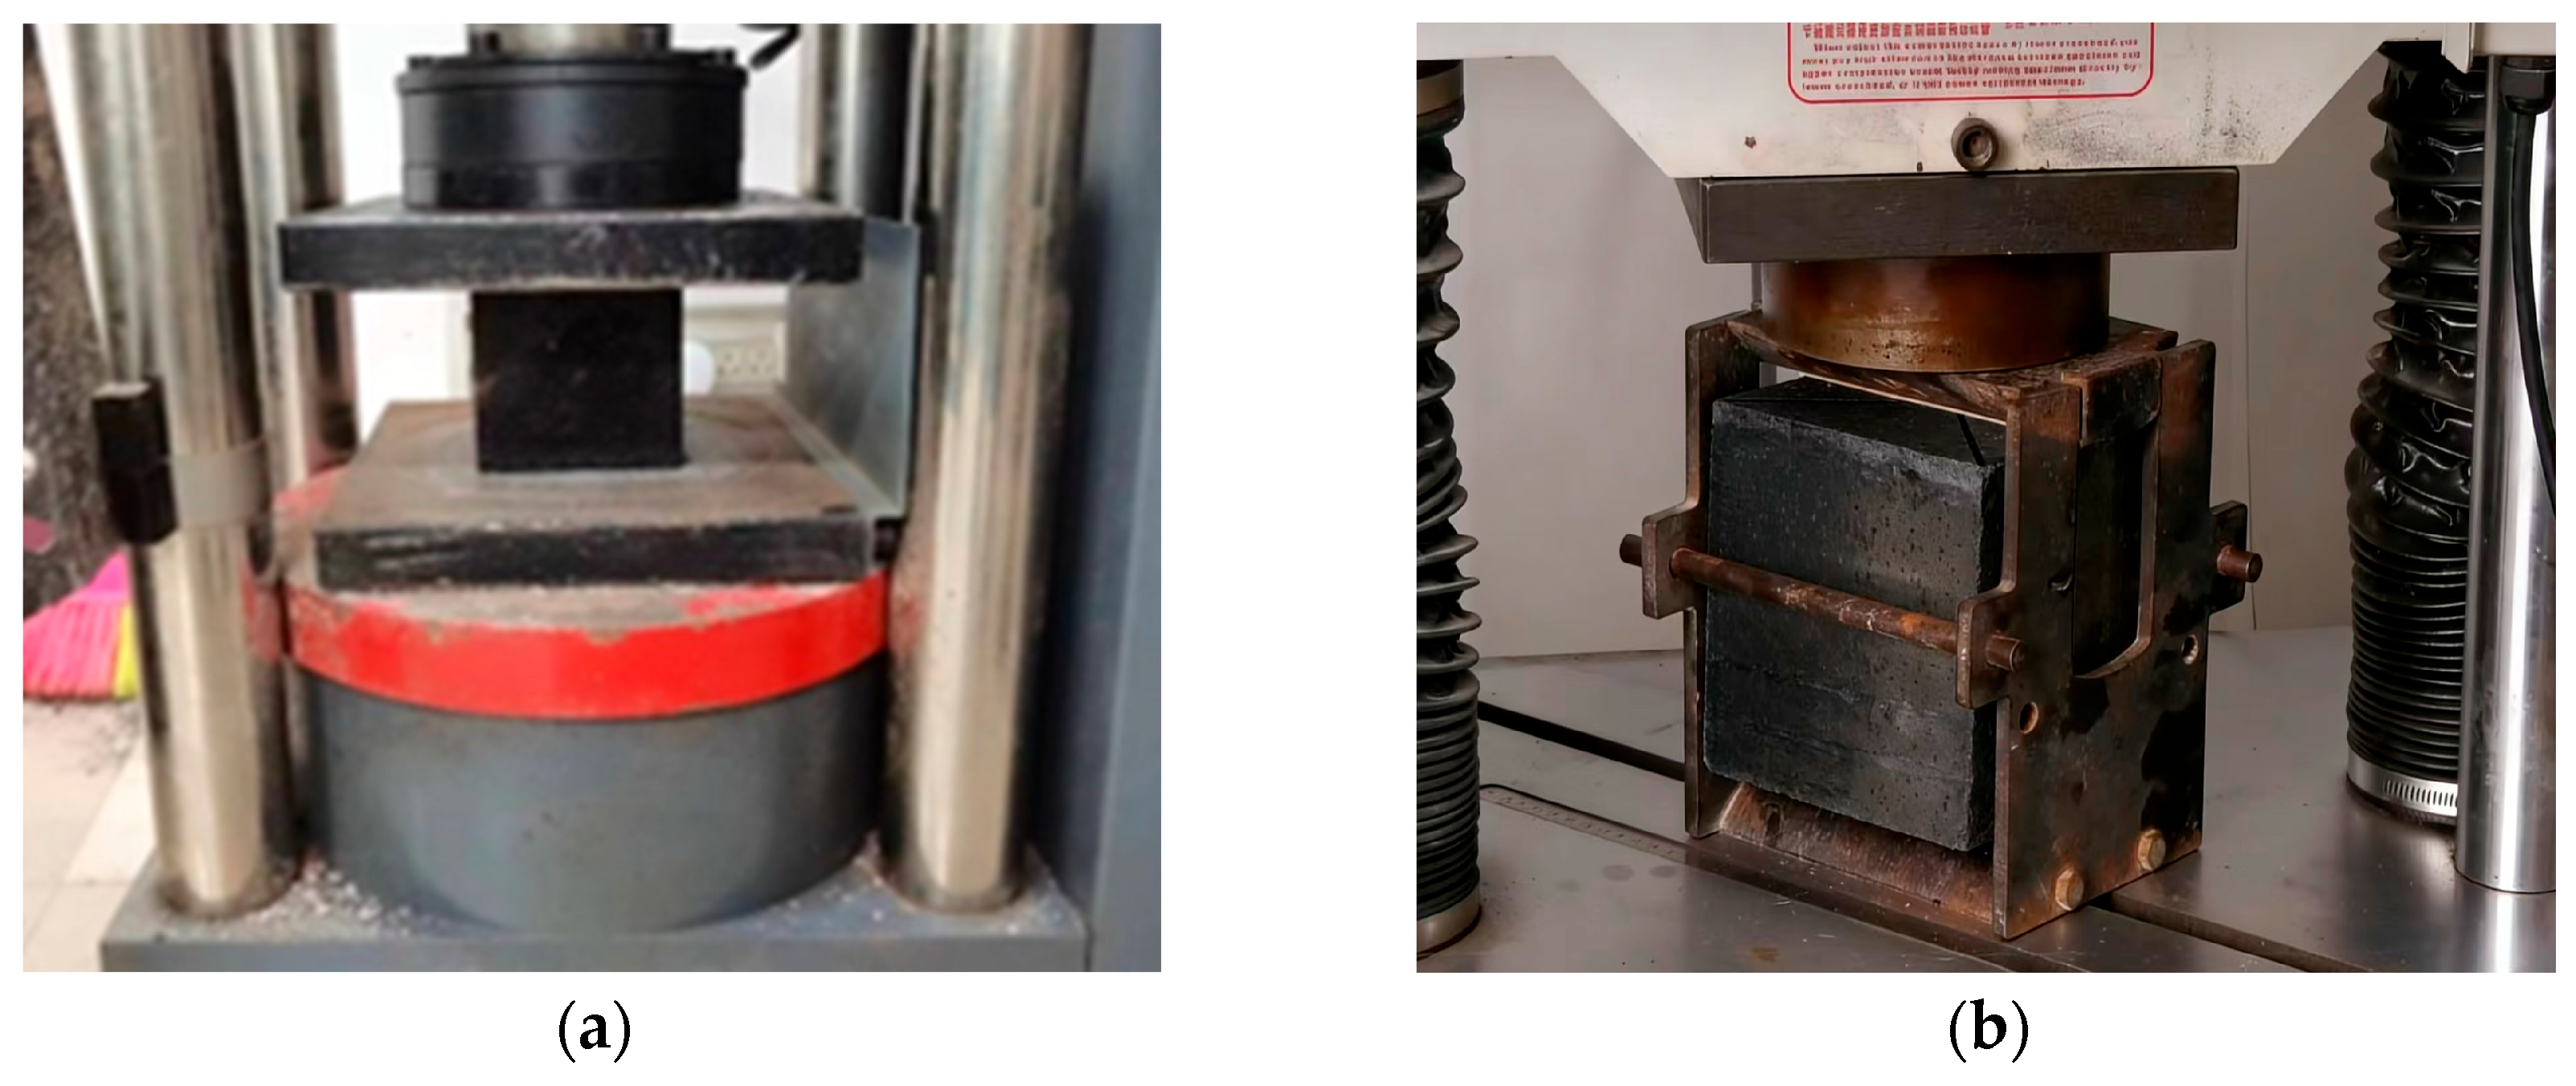
As shown in Figure 2, the mechanical properties of the ultra-high performance concrete (UHPC) were comprehensively evaluated using a universal testing machine (Jinan Zhongchuang Industry Test System Co., Ltd., Jinan, China) in accordance with the GB/T31387-2015 standard [42]. The experimental program included cubic compressive strength tests, determination of the elastic modulus and axial compressive strength, and splitting tensile strength tests. The cubic compressive strength tests were conducted using standard 100 mm cubic specimens, while the elastic modulus and axial compressive strength were measured using 100 × 100 × 300 mm prism specimens, with a uniform loading rate of 1 MPa/s. For the splitting tensile strength tests, standard 100 mm cubic specimens were employed, with the loading rate controlled at 0.06 MPa/s. Three parallel specimens were prepared for each test, cast simultaneously with the strengthened beams, and cured under identical conditions to ensure consistency between material properties and structural test conditions. During the splitting tests, fibers were observed to be uniformly distributed across the fractured surfaces, and no significant fiber clustering was found. The measured mechanical properties of UHPC are summarized in Table 4.
Figure 2.
Testing of Ultra-High Performance Concrete Material Properties: (a) Concrete cube specimen; (b) Cube splitting test.
Table 4.
Mechanical properties of UHPC materials.
2.2.3. Mechanical Properties of Reinforcing Steel
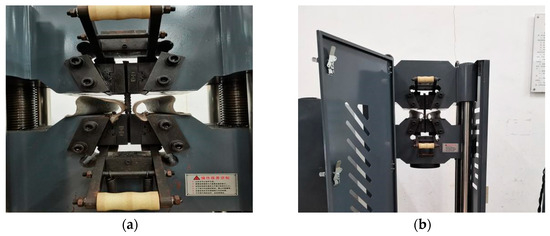
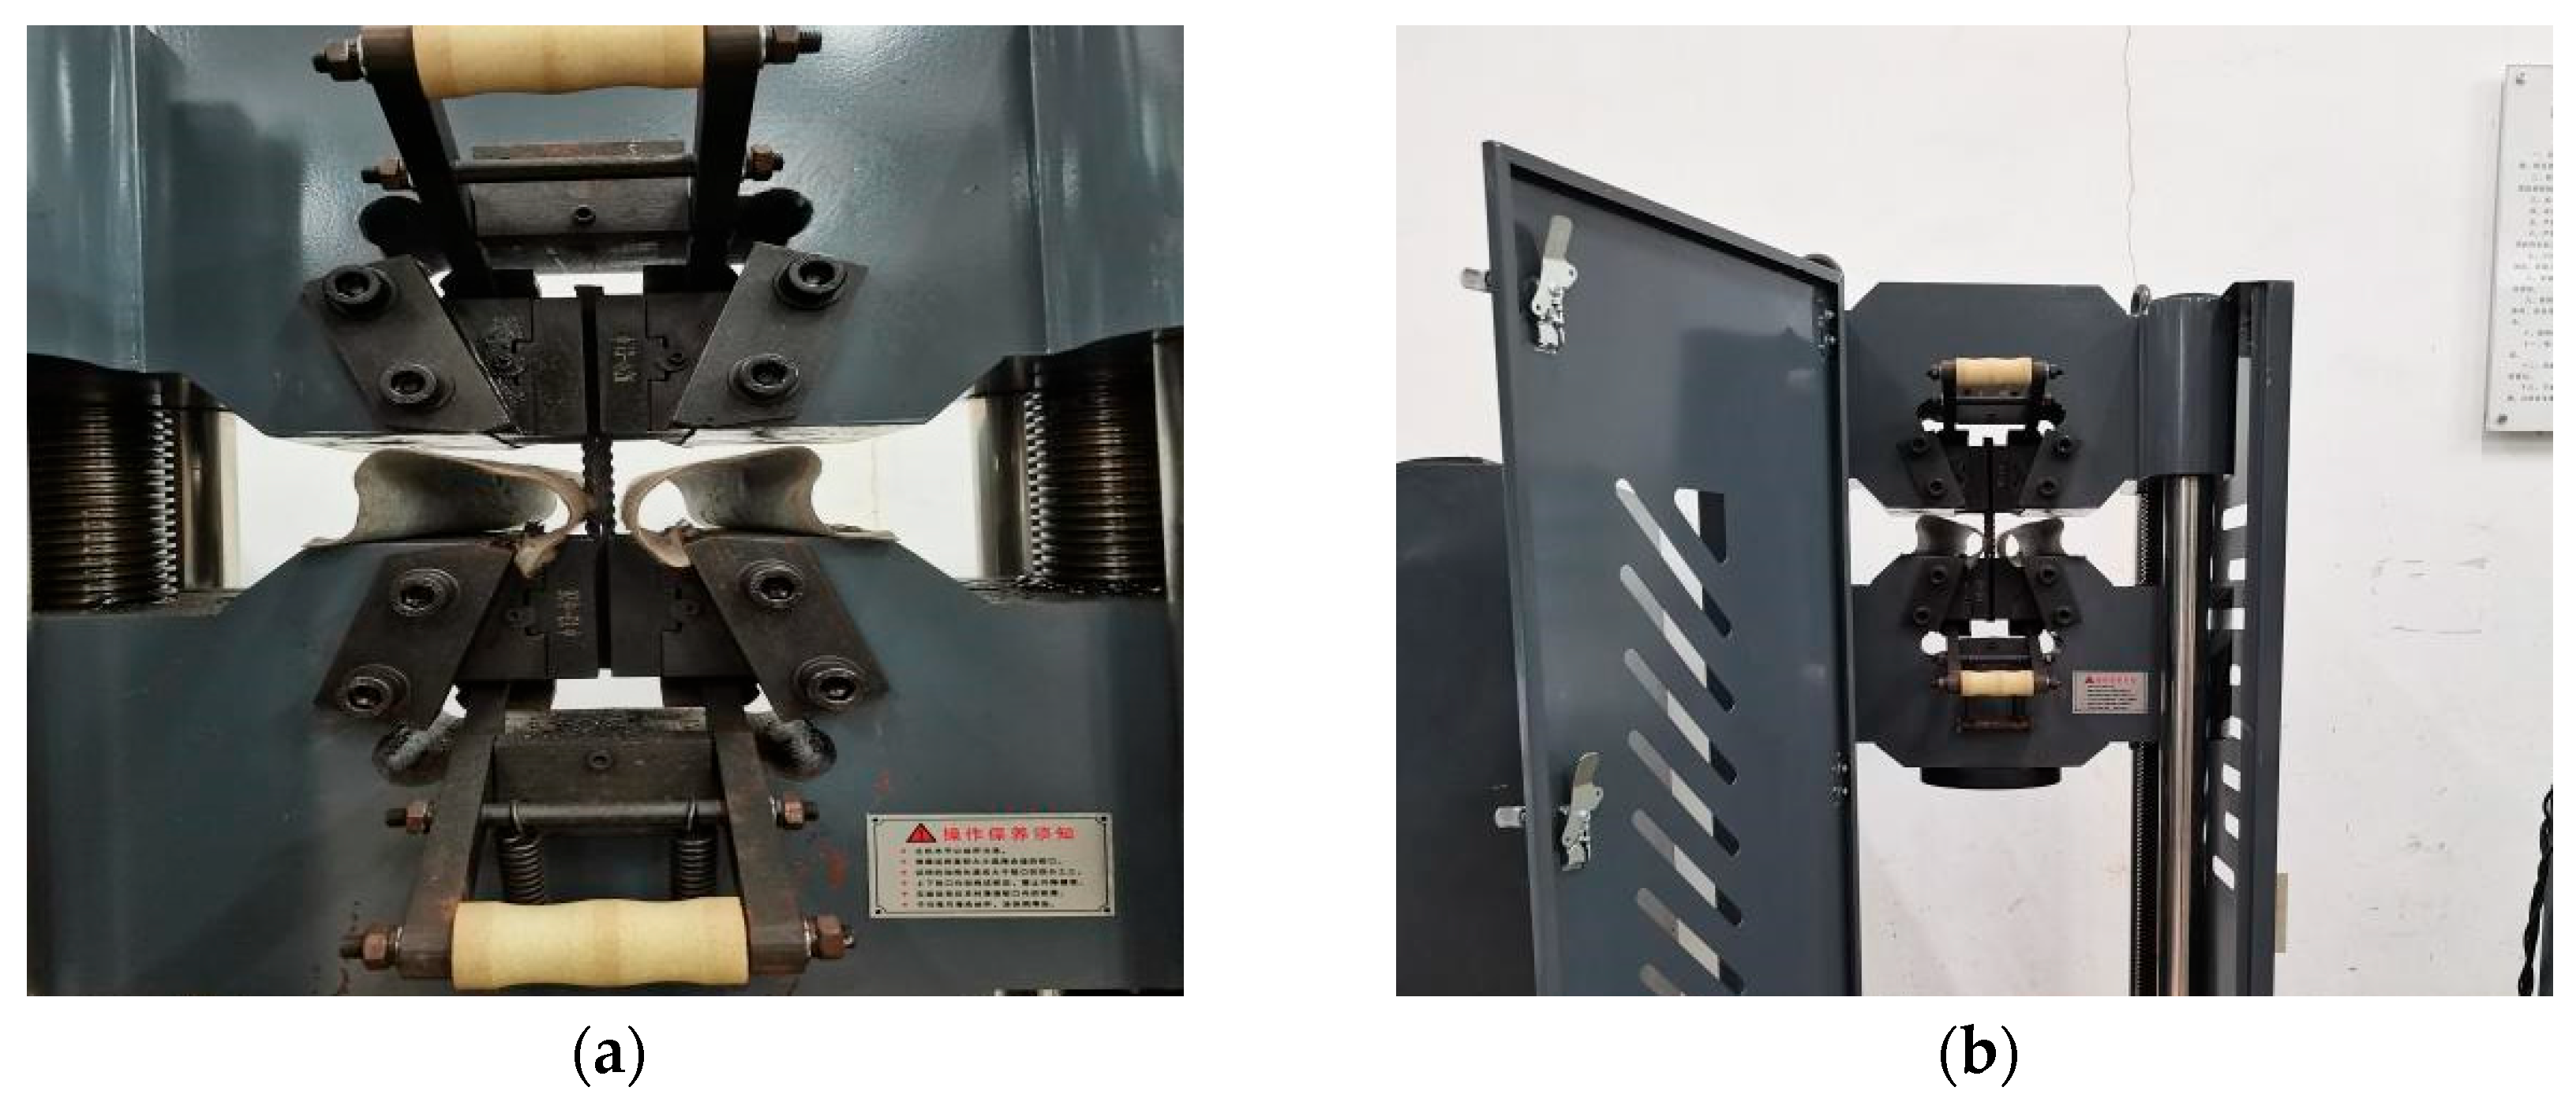
The tests were conducted using HRB400-grade reinforcing steel with nominal diameters of 8 mm, 12 mm, and 16 mm and a universal testing machine (Jinan Zhongchuang Industry Test System Co., Ltd., Jinan, China). In accordance with the GB/T228.1-2010 standard [43], tensile tests were performed on these steel specimens (test setup shown in Figure 3), and the measured yield strength and ultimate tensile strength values are summarized in Table 5.
Figure 3.
Performance Testing of Ordinary Reinforcement Steel Material: (a) Φ12 mm reinforcing bar; (b) Φ16 mm reinforcing bar.
Table 5.
Mechanical properties of steel reinforcement.
2.3. Design of Test Beams
2.3.1. Test Parameters
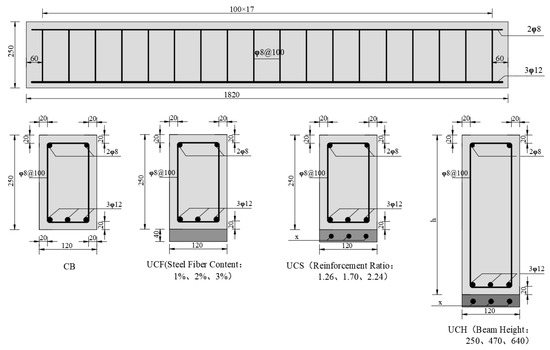
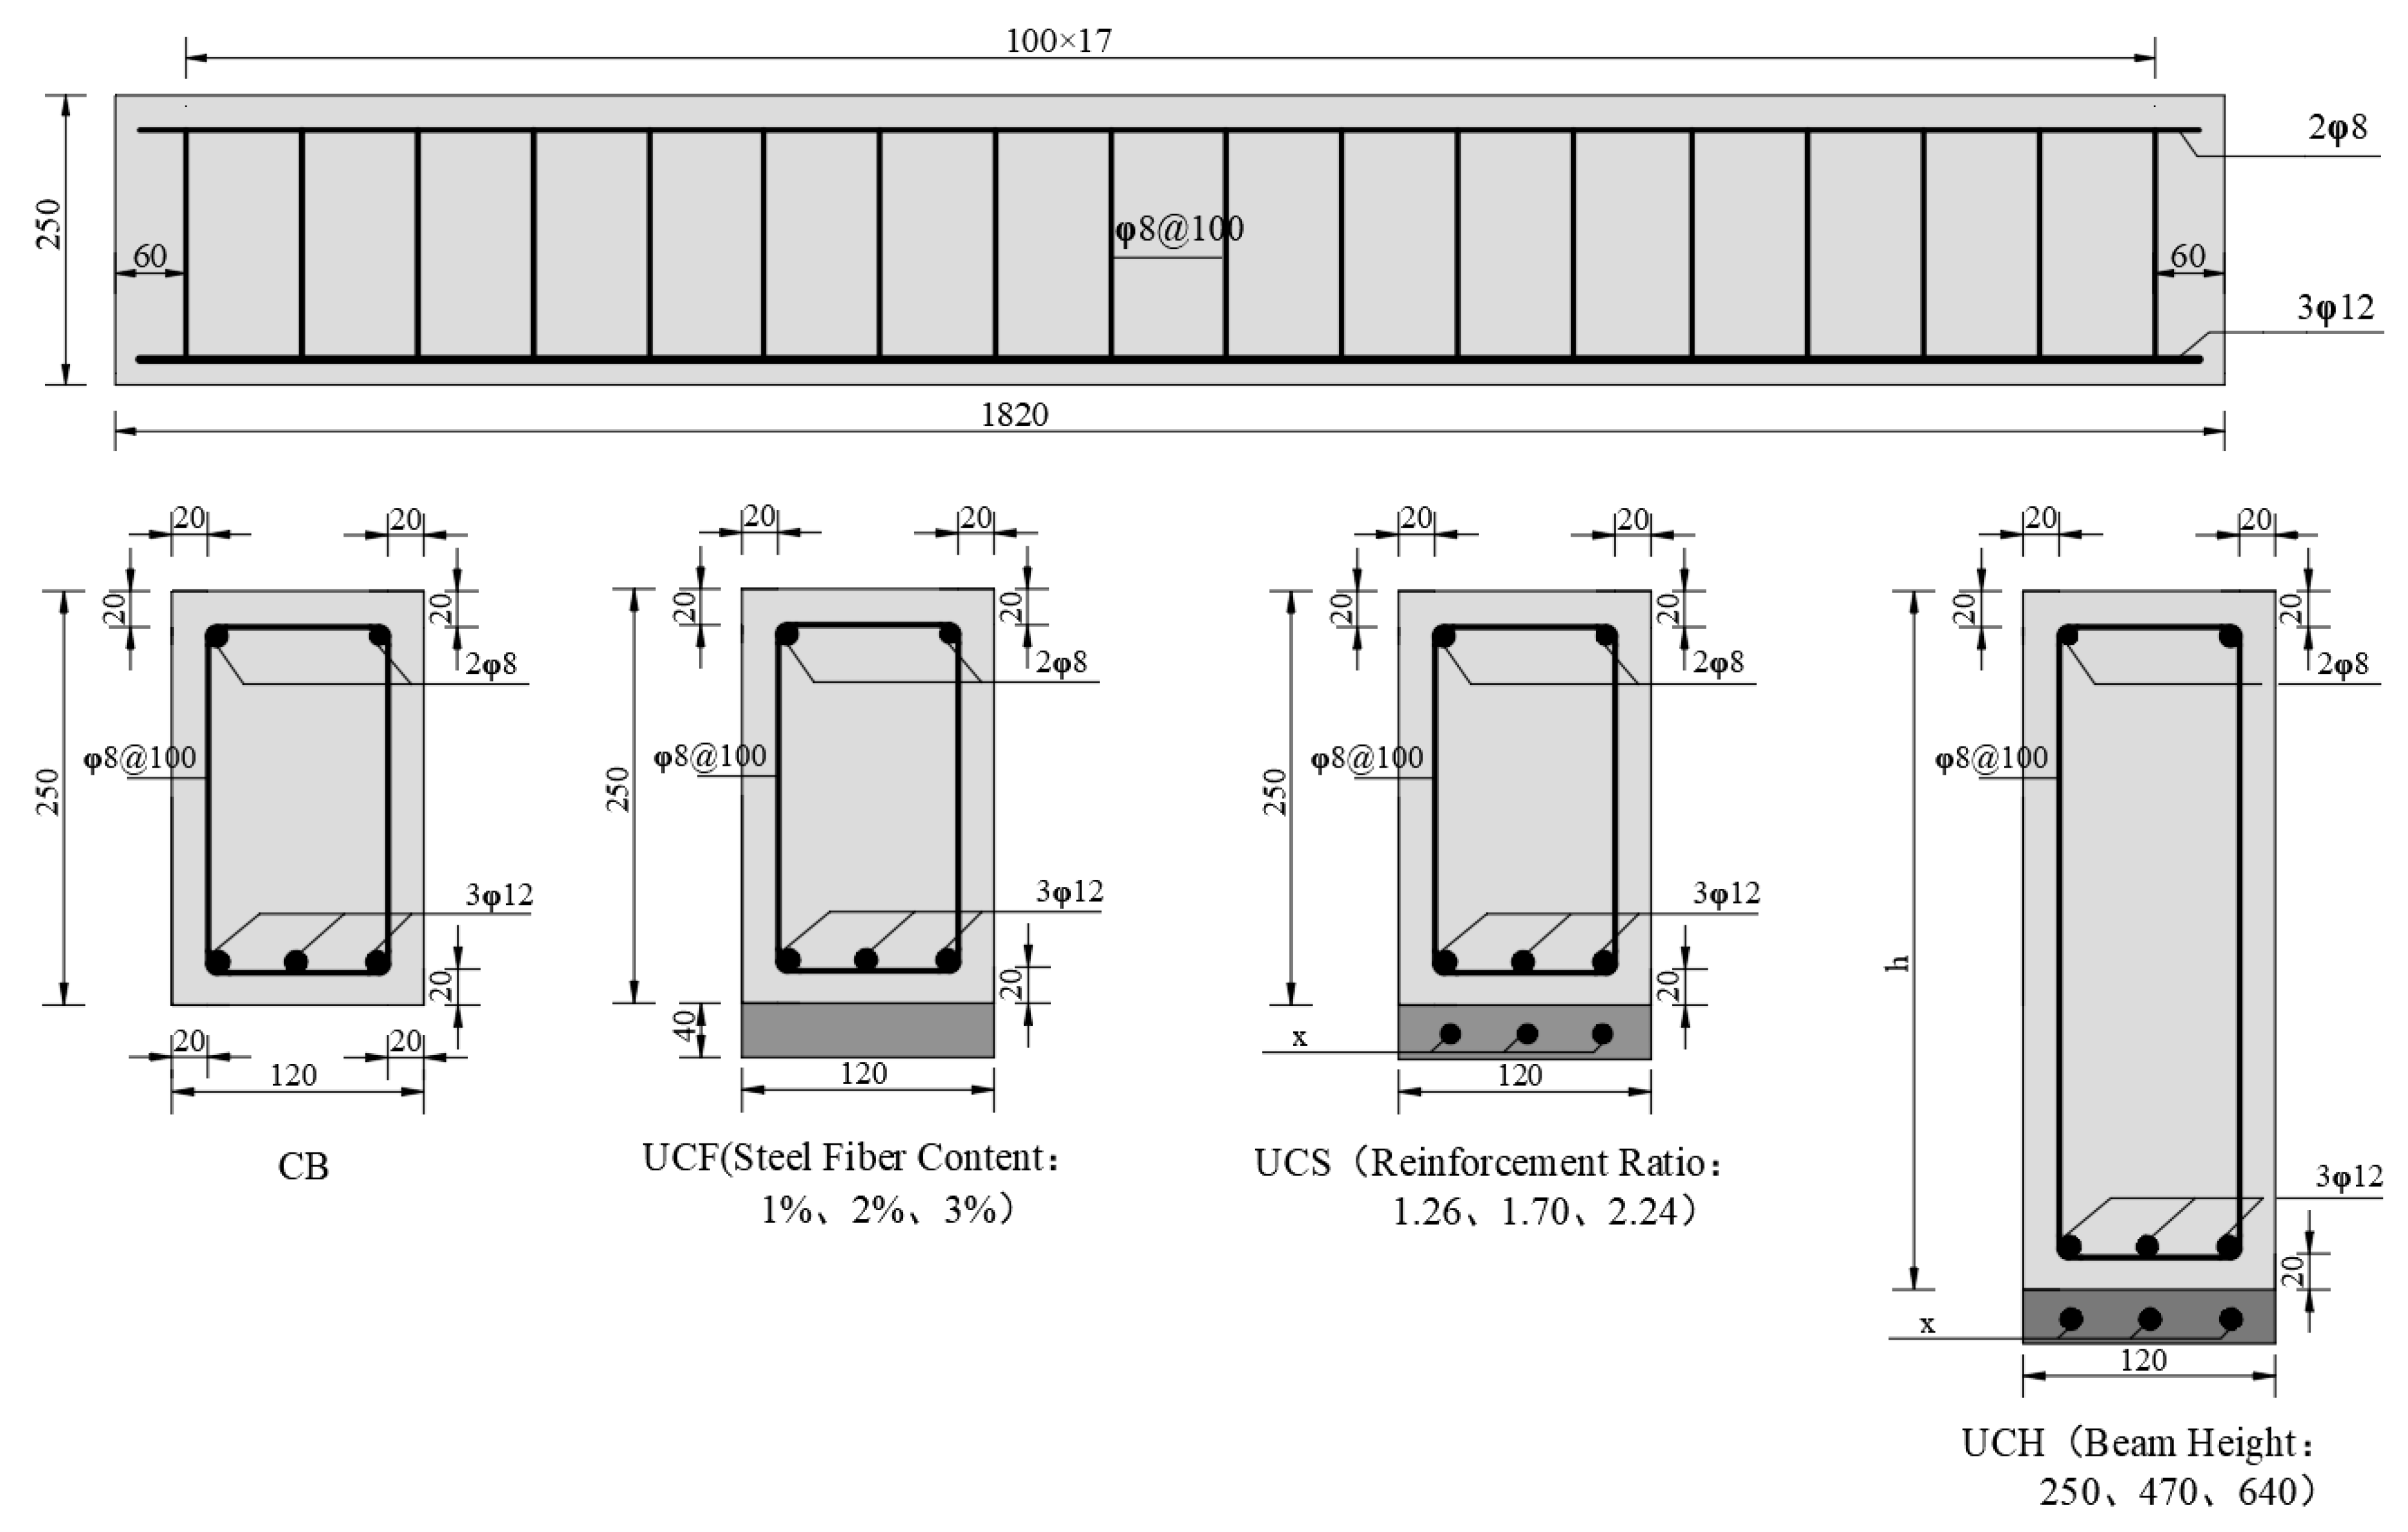
A total of ten rectangular beam specimens were prepared in this study, including one unstrengthened RC control beam and nine beams strengthened with UHPC. The detailed specimen parameters were as follows: cross-sectional dimensions of 120 × 250 mm, total length of 1820 mm, and a clear span of 1600 mm; pure bending zone length of 600 mm and shear span of 1000 mm. The bottom reinforcement consisted of three 12 mm tensile bars, while the top was reinforced with two 8 mm compression bars, with a concrete cover of 20 mm. Stirrups were 8 mm in diameter, spaced at 100 mm intervals. For all strengthened specimens, the UHPC overlay had a thickness of 40 mm; for the reinforced UHPC specimens, three 12 mm or three 16 mm conventional steel bars were additionally embedded within the UHPC layer. Specimen identification, steel fiber content, reinforcement ratio, and section height are listed in Table 6. The geometric dimensions of the test beams are illustrated in Figure 4.
Table 6.
Specification table of test beam.
Figure 4.
Geometry of the Test Beam (units: mm).
The identification and corresponding parameters of the test beams are presented in Table 6. One unstrengthened RC beam (labeled as CB) served as the control specimen for flexural testing, providing a baseline to evaluate the original beam’s bending performance and a reference for comparison with the strengthened beams. The remaining nine strengthened beams were all UHPC-strengthened beams, categorized as follows: three beams with varying steel fiber content (UCF, UHPC Fiber), three beams with varying reinforcement ratios (UCS, UHPC Steel), and three beams with varying section heights (UCH, UHPC High).
2.3.2. Specimen Fabrication Procedure
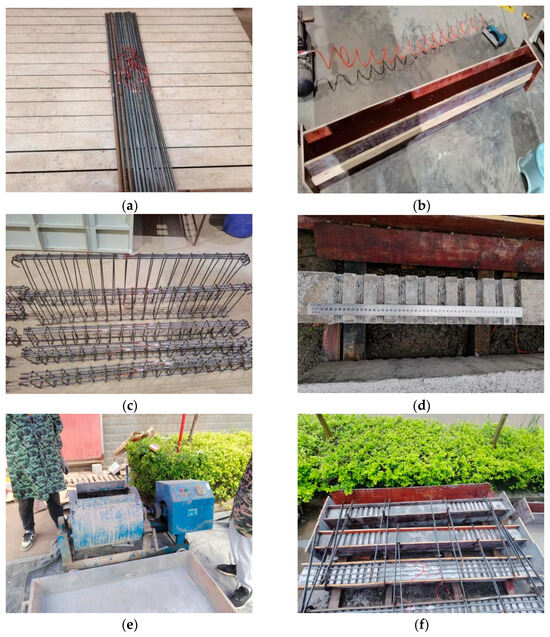
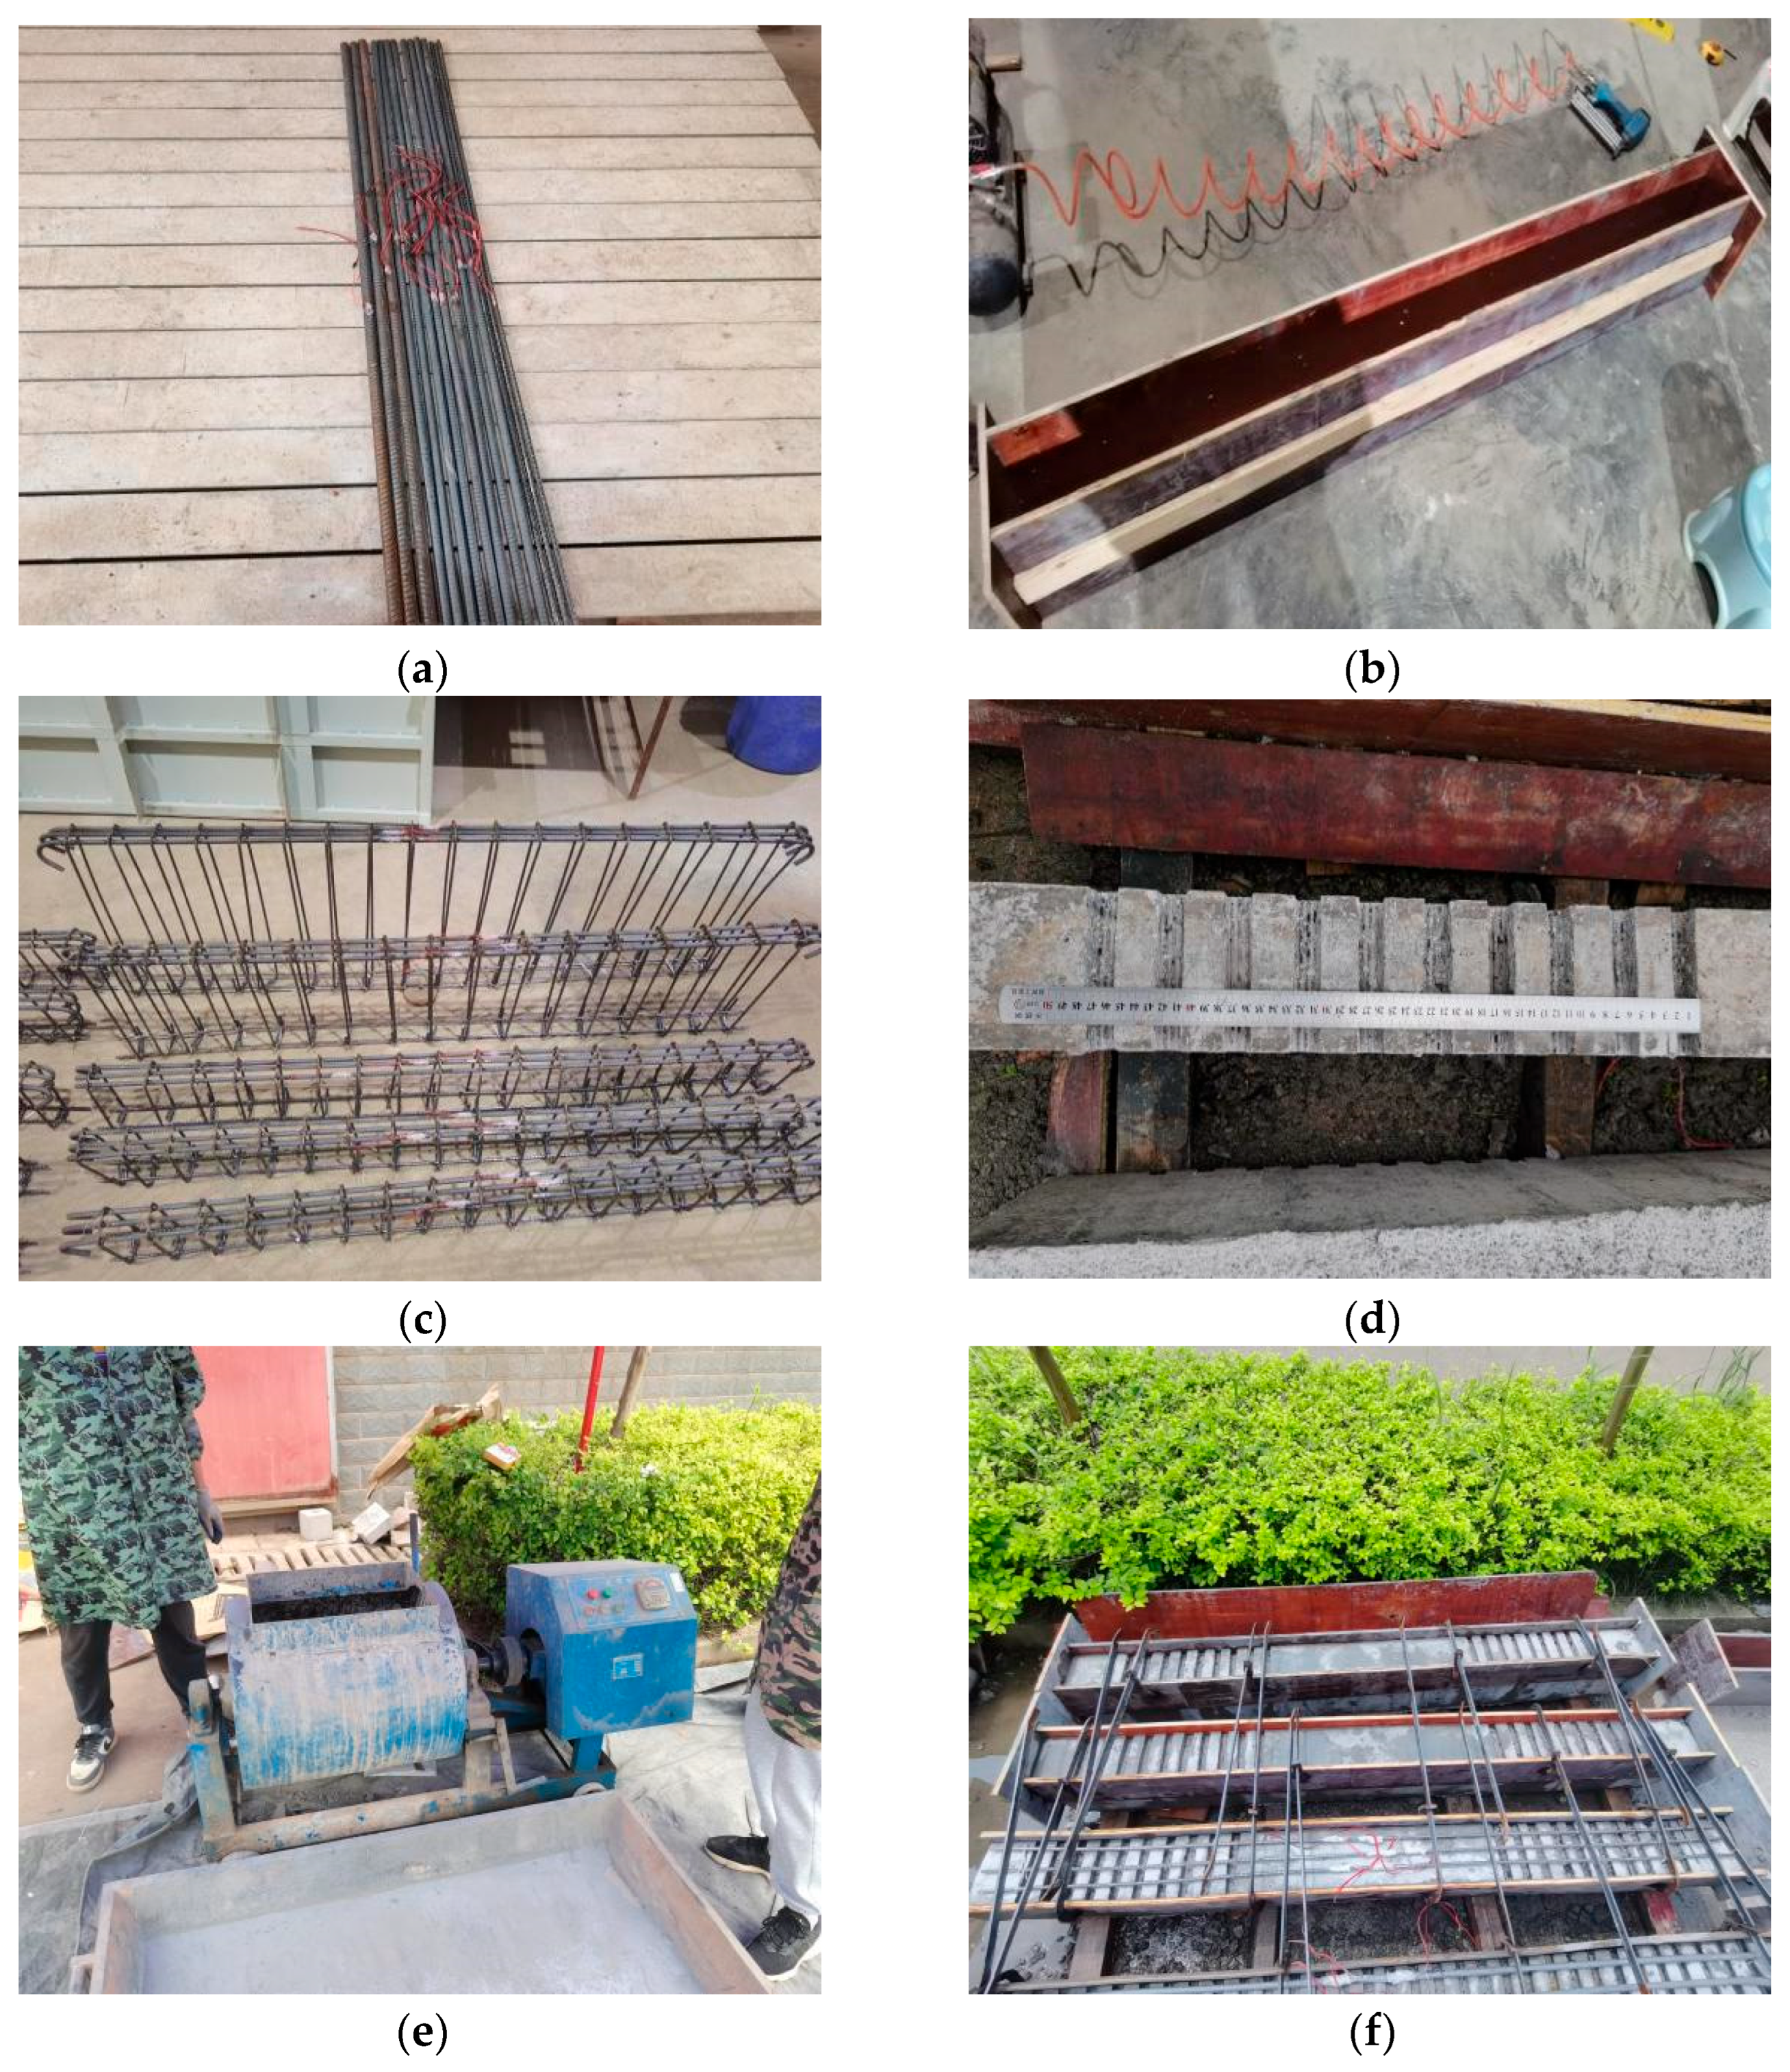
The detailed fabrication procedure of the test beams is illustrated in Figure 5 and consisted of the following four steps:
Figure 5.
The casting of the test beam: (a) Attach strain gauges to the reinforcing bars; (b) Mold fabrication; (c) Tying of reinforcement cages; (d) Grooving at the interface; (e) UHPC mixing; (f) Casting of the strengthening layer.
- Casting of the Beams: Casting of the Beams: All beam specimens were cast monolithically. During the mixing of UHPC, A high-shear forced mixer was utilized. The dry powders (cement, silica fume, and sand) were premixed first to ensure a uniform matrix, followed by the gradual addition of water and superplasticizer. The steel fibers were then sifted into the mixture gradually through a vibrating sieve while the mixer was running, rather than being added all at once. After adding all fibers, the mixing was continued for an additional 3–5 min until a consistent “liquid-like” rheology was observed, which indicates that the fibers have been fully dispersed by the viscous shear forces of the matrix. When applying the UHPC layer to the RC beam, the mixture was poured from one end to the other in a continuous flow to avoid air entrapment and fiber orientation disruption caused by multi-point pouring. During casting, flow table tests were performed to verify the workability. Post-test observations of the failure surfaces of the specimens also confirmed that the fibers were uniformly distributed without significant bundling or orientation bias. Immediately after casting, the concrete surfaces were covered with plastic sheets for moisture retention and subjected to periodic water spraying. The formwork was removed after three days, and the specimens were subsequently cured under standard laboratory conditions for 60 days until the concrete reached the designed strength, after which the relevant tests were conducted.
- Interface Pre-Treatment: To enhance the bond between the existing concrete and the UHPC overlay, the surface of the original RC beams was mechanically grooved prior to UHPC casting, with groove dimensions of 20 × 20 mm (width × depth). The pre-treatment process included: removing surface laitance with a wire brush, flushing residual debris with a high-pressure water jet, and maintaining the interface in a wet condition for more than 24 h to ensure optimal bonding.
- Construction of the Strengthening Layer: The strengthening layer was applied using the following procedure: installation of a dedicated formwork system → precise placement of reinforcement mesh for the UHPC layer → layered casting of UHPC material.
- Curing of Composite Beams: After casting the UHPC layer, the specimens were immediately covered with plastic sheets for moisture curing. The formwork was removed 48 h after initial setting, and curing continued under standard laboratory conditions for 28 days until the material properties stabilized. Subsequently, static flexural tests were performed. Figure 5 documents the UHPC casting process and the final form of the strengthened beam specimens.
2.4. Flexural Test Loading Scheme and Instrumentation Layout
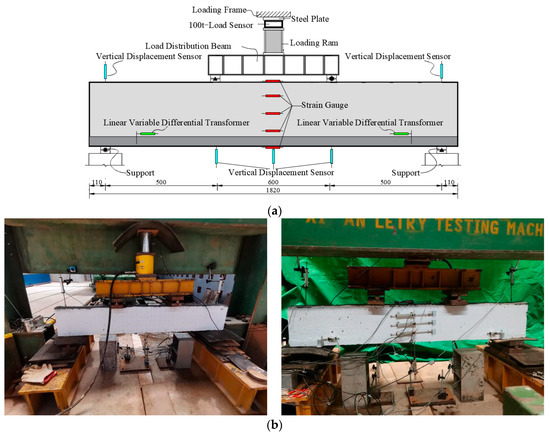
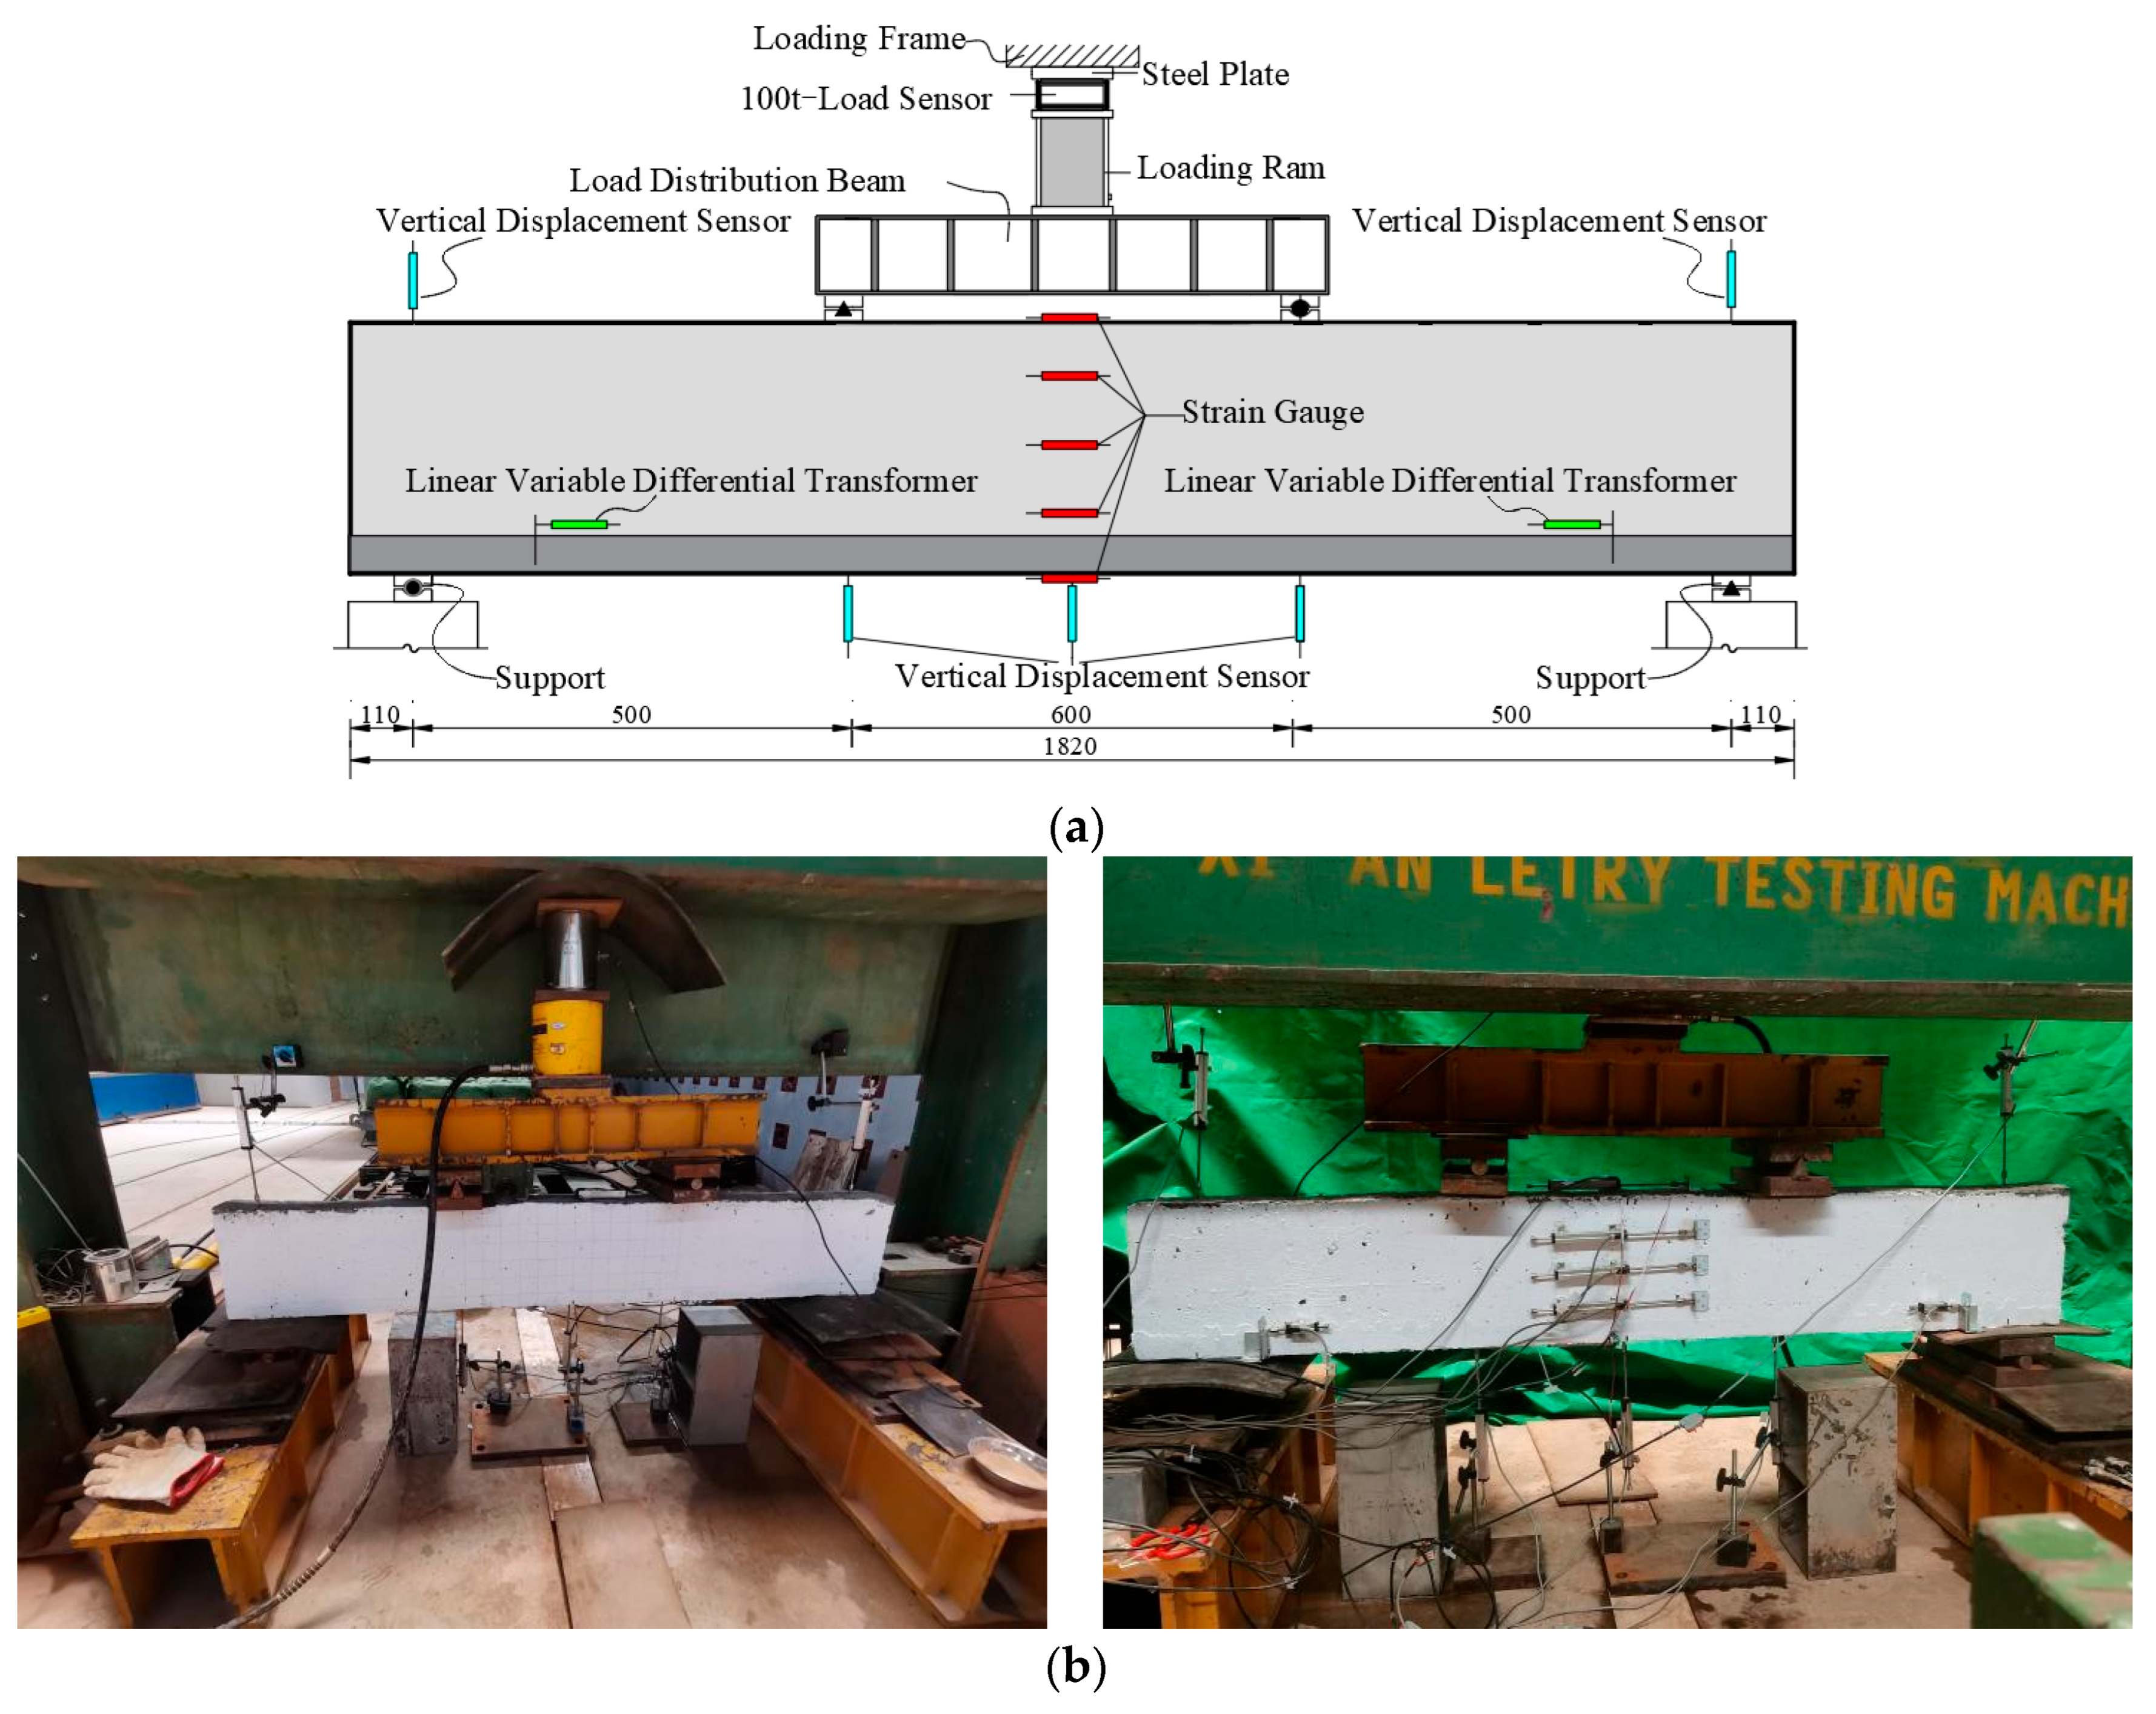
The flexural test loading scheme and data acquisition system layout are illustrated in Figure 6. All ten specimens were subjected to four-point bending tests to evaluate their flexural performance. Prior to the formal tests, a preloading procedure was conducted in accordance with the GB/T 50152-2012 [44] standard to verify the reliability of the test setup, loading system, and measuring instruments, and to make necessary adjustments to the relevant parameters.
Figure 6.
Diagram of the Loading Device and Measurement Point Arrangement for the Test Beam (units: mm): (a) Schematic illustration of the loading device; (b) Schematic of the experimental loading device.
The formal loading procedure was conducted using a staged control strategy:
- Initial Loading Stage (Pre-Cracking of Concrete): A force-controlled method was employed, applying the load at a rate of 0.1 kN/s, with each load increment set at 5 ± 0.5 kN.
- Post-Cracking Stage: The same loading rate was maintained, while the load increment was increased to 10 ± 1 kN per step.
- Post-Yielding Stage of Reinforcement: The loading mode was switched to displacement control, with a mid-span deflection increment of 0.1 mm applied continuously.
- Test Termination Criteria: Loading was stopped when the applied load dropped to 85% of the maximum load-carrying capacity.
The data acquisition system included the following:
- Interface Slip: The relative slip between the UHPC overlay and the RC substrate was recorded using horizontal displacement transducers.
- Strain Monitoring: Electrical resistance strain gauges were employed to measure the strain development in both the tensile concrete zone and the longitudinal reinforcement.
- Displacement Monitoring: High-precision displacement transducers were used to measure vertical displacements at mid-span, loading points, and supports.
- Crack Observation: The maximum crack width was recorded at each load increment.
All test data were collected and stored in real time using a 3816 N strain data acquisition system. This multi-parameter synchronous monitoring approach provided reliable data for a comprehensive analysis of the flexural behavior of the strengthened beams.
3. Test Results and Data Analysis
The mechanical performance of reinforced concrete (RC) members under bending can be evaluated using several key parameters, including cracking strength, ultimate load-carrying capacity, sectional stiffness, and ductility characteristics. In this study, the unstrengthened control beam (CB) was first subjected to systematic performance testing and evaluation to verify its suitability as a baseline for comparison. To investigate the effects of UHPC strengthening on the flexural behavior of RC beams, four-point bending tests were conducted to obtain the following critical data: characteristic load values for each specimen, structural deformation responses (load–displacement relationships), key crack development patterns (load–crack width relationships), final failure modes, and the collaborative performance of the interface (load–slip curves). Comprehensive analysis of these experimental results provided systematic insights into the mechanisms by which the UHPC overlay enhances the flexural performance of reinforced concrete beams.
3.1. Comparative Analysis of Flexural Test Results
3.1.1. Failure Modes and Characteristic Load Values
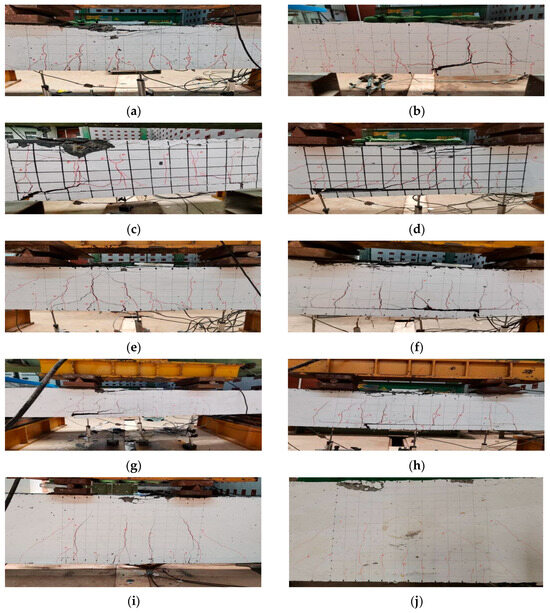
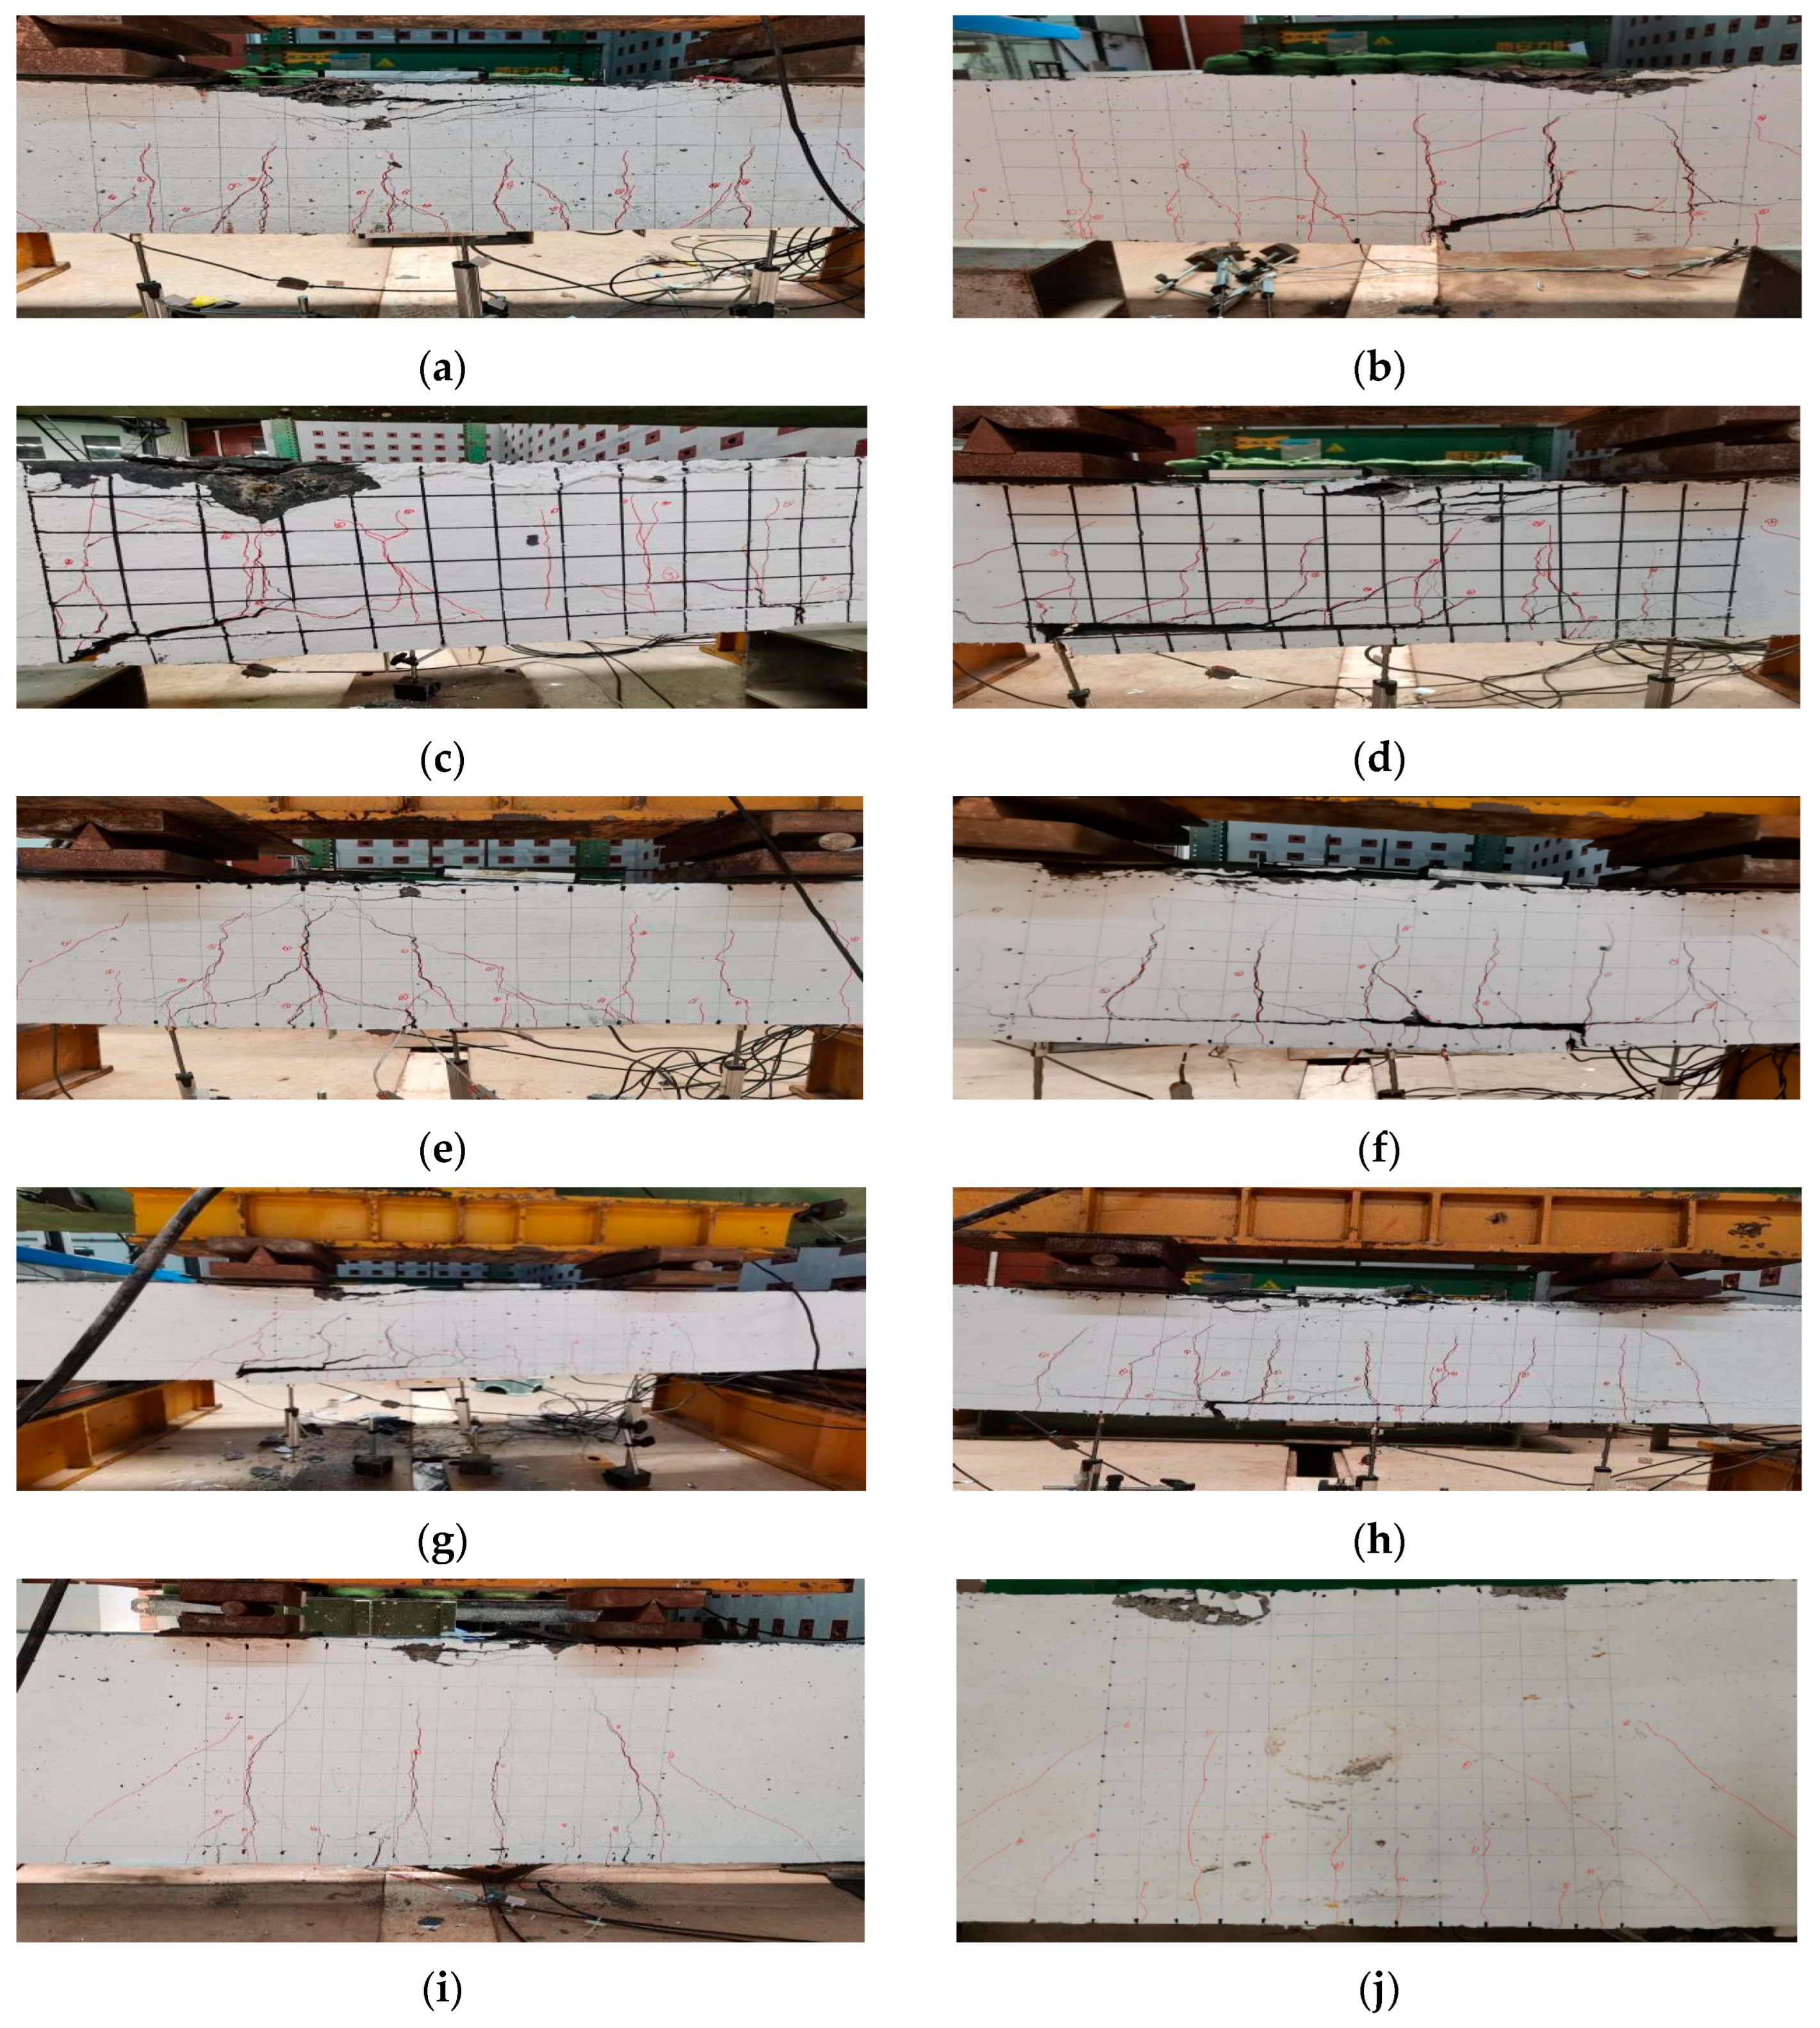
Figure 7 illustrates the final failure conditions and crack development patterns of all specimens under four-point bending. Observations indicate that all ten beams exhibited typical flexural failure behavior with sufficient reinforcement: the longitudinal reinforcement in the tensile zone yielded first, followed by rapid propagation of the primary cracks, ultimately leading to crushing of the concrete in the compression zone once the strain exceeded its ultimate limit. Notably, in the strengthened beams, gradual pullout of steel fibers from the UHPC overlay was clearly observed during the failure stage, accompanied by characteristic fiber fracture sounds. Interface displacement monitoring data revealed that the relative slip between the UHPC layer and the substrate concrete was close to zero in all strengthened beams, demonstrating excellent cooperative deformation behavior and superior bond performance at the UHPC–concrete interface.
Figure 7.
Diagram of failure modes of test beams: (a) CB; (b) UCF-1; (c) UCF-2; (d) UCF-3; (e) UCS-1.26; (f) UCS-1.70; (g) UCS-2.24; (h) UCH-250; (i) UCH-470; (j) UCH-640.
During loading of the control beam (CB), the first crack, approximately 2.7 cm in length, appeared when the applied load reached 20.7 kN, corresponding to a beam mid-span displacement of 1.69 mm. As the load increased to 115.2 kN, the displacement reached 6.12 mm, with cracks connecting and widening rapidly. When the load further increased to the maximum of 128.9 kN, crushing of the concrete at the top compression zone and spalling were observed, indicating that the ultimate load-carrying capacity of the original beam had been reached.
During loading of the UHPC-strengthened beam (UCF-1), the first crack, approximately 3.2 cm in length, appeared when the applied load reached 41.8 kN, corresponding to a mid-span displacement of 1.31 mm. As the load increased to 138.1 kN, the displacement reached 7.93 mm, with cracks connecting and widening rapidly. When the load was further increased to the maximum of 149.2 kN, crushing of the concrete in the top compression zone and spalling were observed, indicating that the ultimate load-carrying capacity of the strengthened beam had been reached.
During loading of the UHPC-strengthened beam (UCF-2), the first crack, approximately 2.8 cm in length, appeared when the applied load reached 46.5 kN, corresponding to a mid-span displacement of 1.78 mm. As the load increased to 119.8 kN, the displacement reached 7.11 mm, with cracks connecting and widening rapidly. When the load was further increased to the maximum of 145.5 kN, crushing of the concrete in the top compression zone and spalling were observed, indicating that the ultimate load-carrying capacity of the strengthened beam had been reached.
During loading of the UHPC-strengthened beam (UCF-3), the first crack, approximately 4.5 cm in length, appeared when the applied load reached 54.1 kN, corresponding to a mid-span displacement of 2.92 mm. As the load increased to 124.4 kN, the displacement reached 8.60 mm, with cracks connecting and widening rapidly. When the load was further increased to the maximum of 141.2 kN, crushing of the concrete in the top compression zone and spalling were observed, indicating that the ultimate load-carrying capacity of the strengthened beam had been reached.
During loading of the UHPC-strengthened beam (UCS-1.26), the first crack, approximately 3.1 cm in length, appeared when the applied load reached 44.8 kN, corresponding to a mid-span displacement of 1.26 mm. As the load increased to 129.9 kN, the displacement reached 5.36 mm, with cracks connecting and widening rapidly. When the load was further increased to the maximum of 143.1 kN, crushing of the concrete in the top compression zone and spalling were observed, indicating that the ultimate load-carrying capacity of the strengthened beam had been reached.
During loading of the UHPC-strengthened beam (UCS-1.70), the first crack, approximately 4.3 cm in length, appeared when the applied load reached 48.3 kN, corresponding to a mid-span displacement of 2.85 mm. As the load increased to 168.8 kN, the displacement reached 7.13 mm, with cracks connecting and widening rapidly. When the load was further increased to the maximum of 194.6 kN, crushing of the concrete in the top compression zone and spalling were observed, indicating that the ultimate load-carrying capacity of the strengthened beam had been reached.
During loading of the UHPC-strengthened beam (UCS-2.24), the first crack, approximately 3.8 cm in length, appeared when the applied load reached 44.9 kN, corresponding to a mid-span displacement of 2.83 mm. As the load increased to 235.8 kN, the displacement reached 9.35 mm, with cracks connecting and widening rapidly. When the load was further increased to the maximum of 270.9 kN, crushing of the concrete in the top compression zone and spalling were observed, indicating that the ultimate load-carrying capacity of the strengthened beam had been reached.
During loading of the UHPC-strengthened beam (UCH-250), the first crack, approximately 5.0 cm in length, appeared when the applied load reached 42.4 kN, corresponding to a mid-span displacement of 1.95 mm. As the load increased to 116.9 kN, the displacement reached 5.12 mm, with cracks connecting and widening rapidly. When the load was further increased to the maximum of 136.9 kN, crushing of the concrete in the top compression zone and spalling were observed, indicating that the ultimate load-carrying capacity of the strengthened beam had been reached.
During loading of the UHPC-strengthened beam (UCH-470), the first crack, approximately 2.9 cm in length, appeared when the applied load reached 46.9 kN, corresponding to a mid-span displacement of 0.92 mm. As the load increased to 486.7 kN, the displacement reached 6.62 mm, with cracks connecting and widening rapidly. When the load was further increased to the maximum of 565.3 kN, crushing of the concrete in the top compression zone and spalling were observed, indicating that the ultimate load-carrying capacity of the strengthened beam had been reached.
During loading of the UHPC-strengthened beam (UCH-640), the first crack, approximately 3.7 cm in length, appeared when the applied load reached 47.3 kN, corresponding to a mid-span displacement of 1.52 mm. As the load increased to 817.8 kN, the displacement reached 3.40 mm, with cracks connecting and widening rapidly. When the load was further increased to the maximum of 916.6 kN, crushing of the concrete in the top compression zone and spalling were observed, indicating that the ultimate load-carrying capacity of the strengthened beam had been reached.
The specific failure modes are shown in Figure 7.
The main characteristic flexural load values of the ten test beams are summarized in Table 7. In the table, Pcr represents the cracking load of the test beams, and Pu represents the ultimate load.
Table 7.
Characteristic value of test beam load (units: kN).
Based on the data in Table 7, regarding crack resistance, the cracking loads of the UCF-1, UCF-2, and UCF-3 strengthened beams increased by 101.9%, 124.6%, and 161.4%, respectively, compared with the CB control beam. This improvement is primarily attributed to the excellent tensile performance of the UHPC overlay, which can sustain higher flexural tensile stresses prior to cracking. In terms of load-carrying capacity, due to increases in section height and reinforcement ratio, the ultimate loads of the UCS-1.70, UCS-2.24, UCH-470, and UCH-640 strengthened beams increased by 16.3%, 51.0%, 338.6%, and 518.8%, respectively, relative to the CB beam. Notably, the yielding of the tensile reinforcement in the original RC beams occurred significantly later than that of the reinforcement in the UHPC layer, indicating that the tensile capacity of the UHPC overlay was fully utilized and material strength was effectively exploited. These results confirm that the UHPC strengthening layer actively participates in the composite action of the beam and significantly enhances the flexural performance of the original RC structure.
Overall, the RC beams strengthened with UHPC exhibited a significant improvement in flexural performance. The test results indicate that the steel fiber content effectively enhances the crack resistance of the beams but has a limited effect on the ultimate load capacity, whereas increases in reinforcement ratio and section height can substantially improve the ultimate flexural capacity of the strengthened beams.
3.1.2. Load–Main Crack Width Relationship
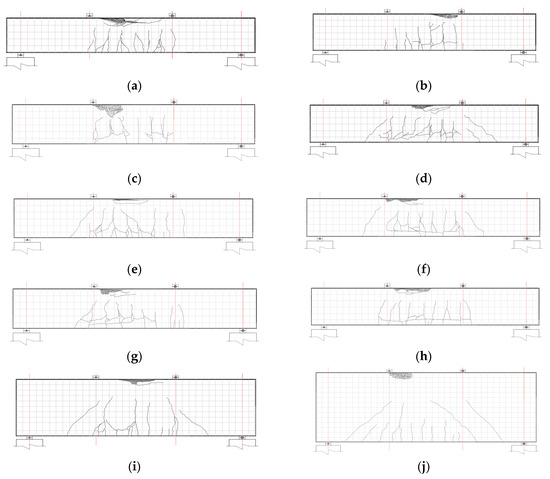
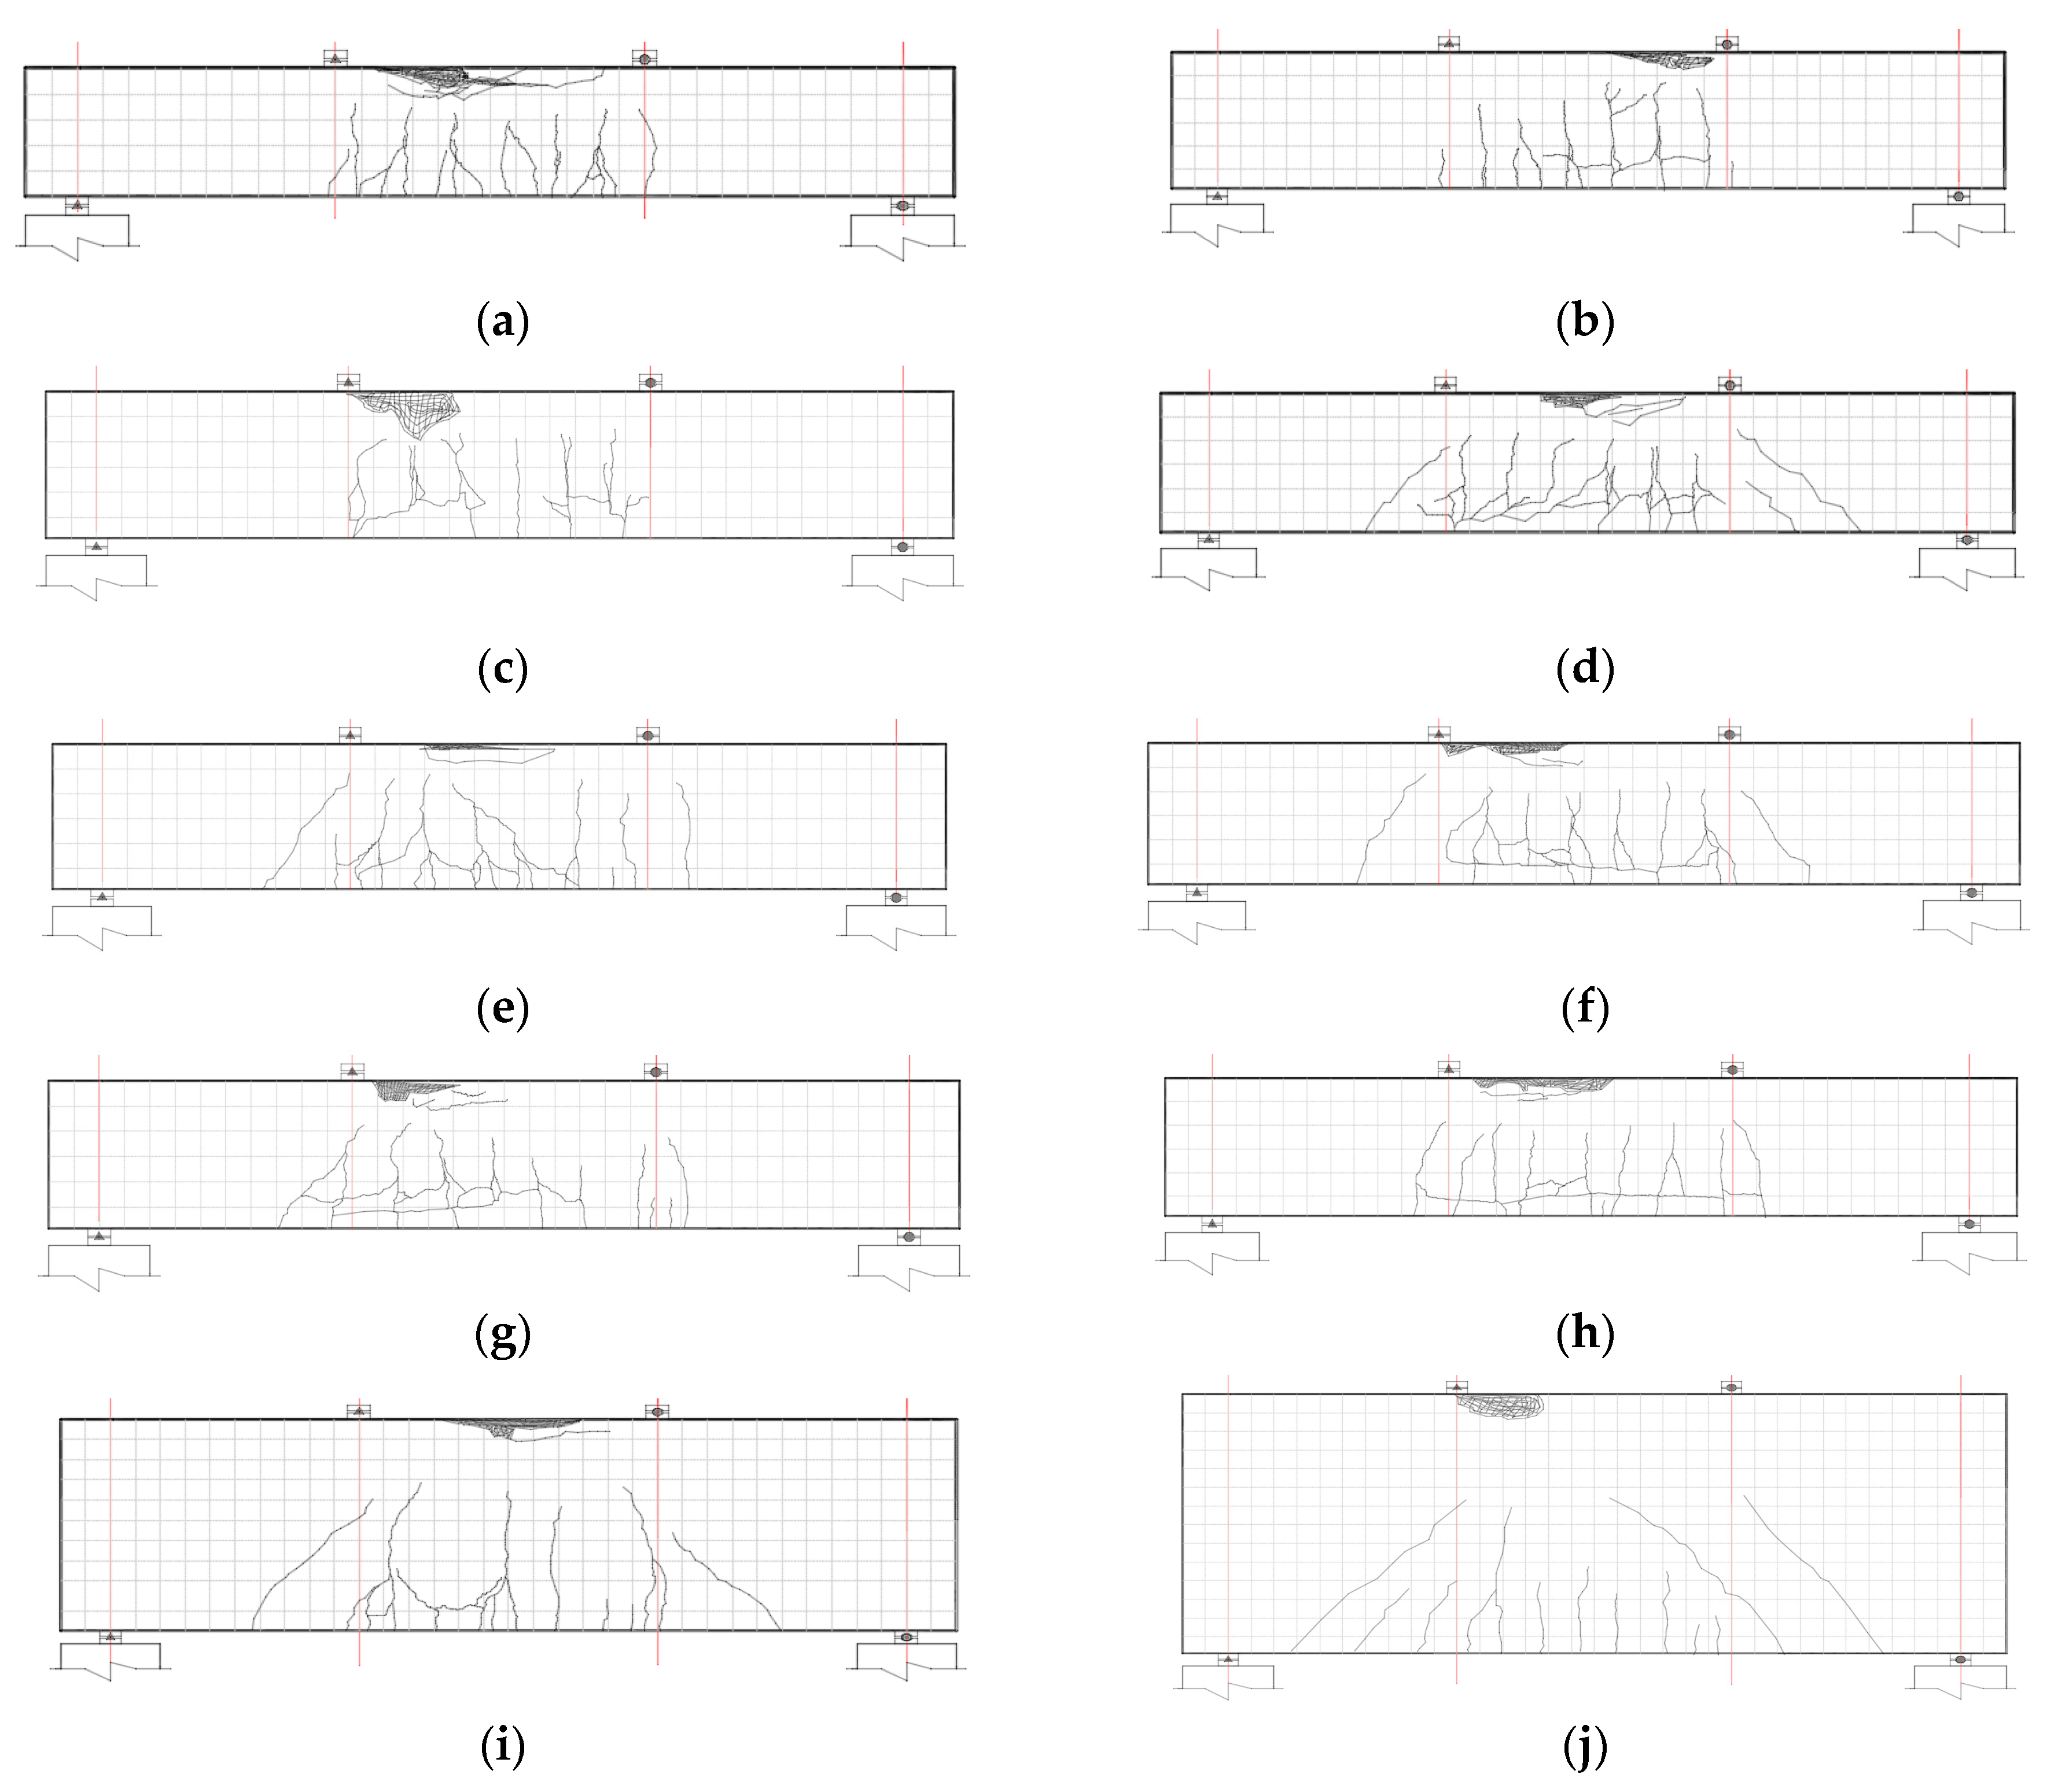
The crack distribution of the test beam is shown in Figure 8.
Figure 8.
The development diagram of beam cracks: (a) CB; (b) UCF-1; (c) UCF-2; (d) UCF-3; (e) UCS-1.26; (f) UCS-1.70; (g) UCS-2.24; (h) UCH-250; (i) UCH-470; (j) UCH-640.
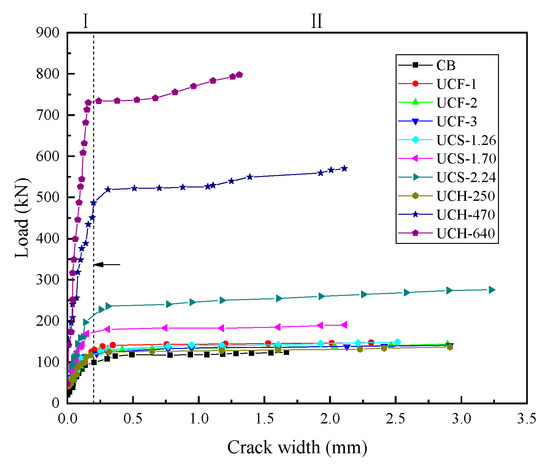
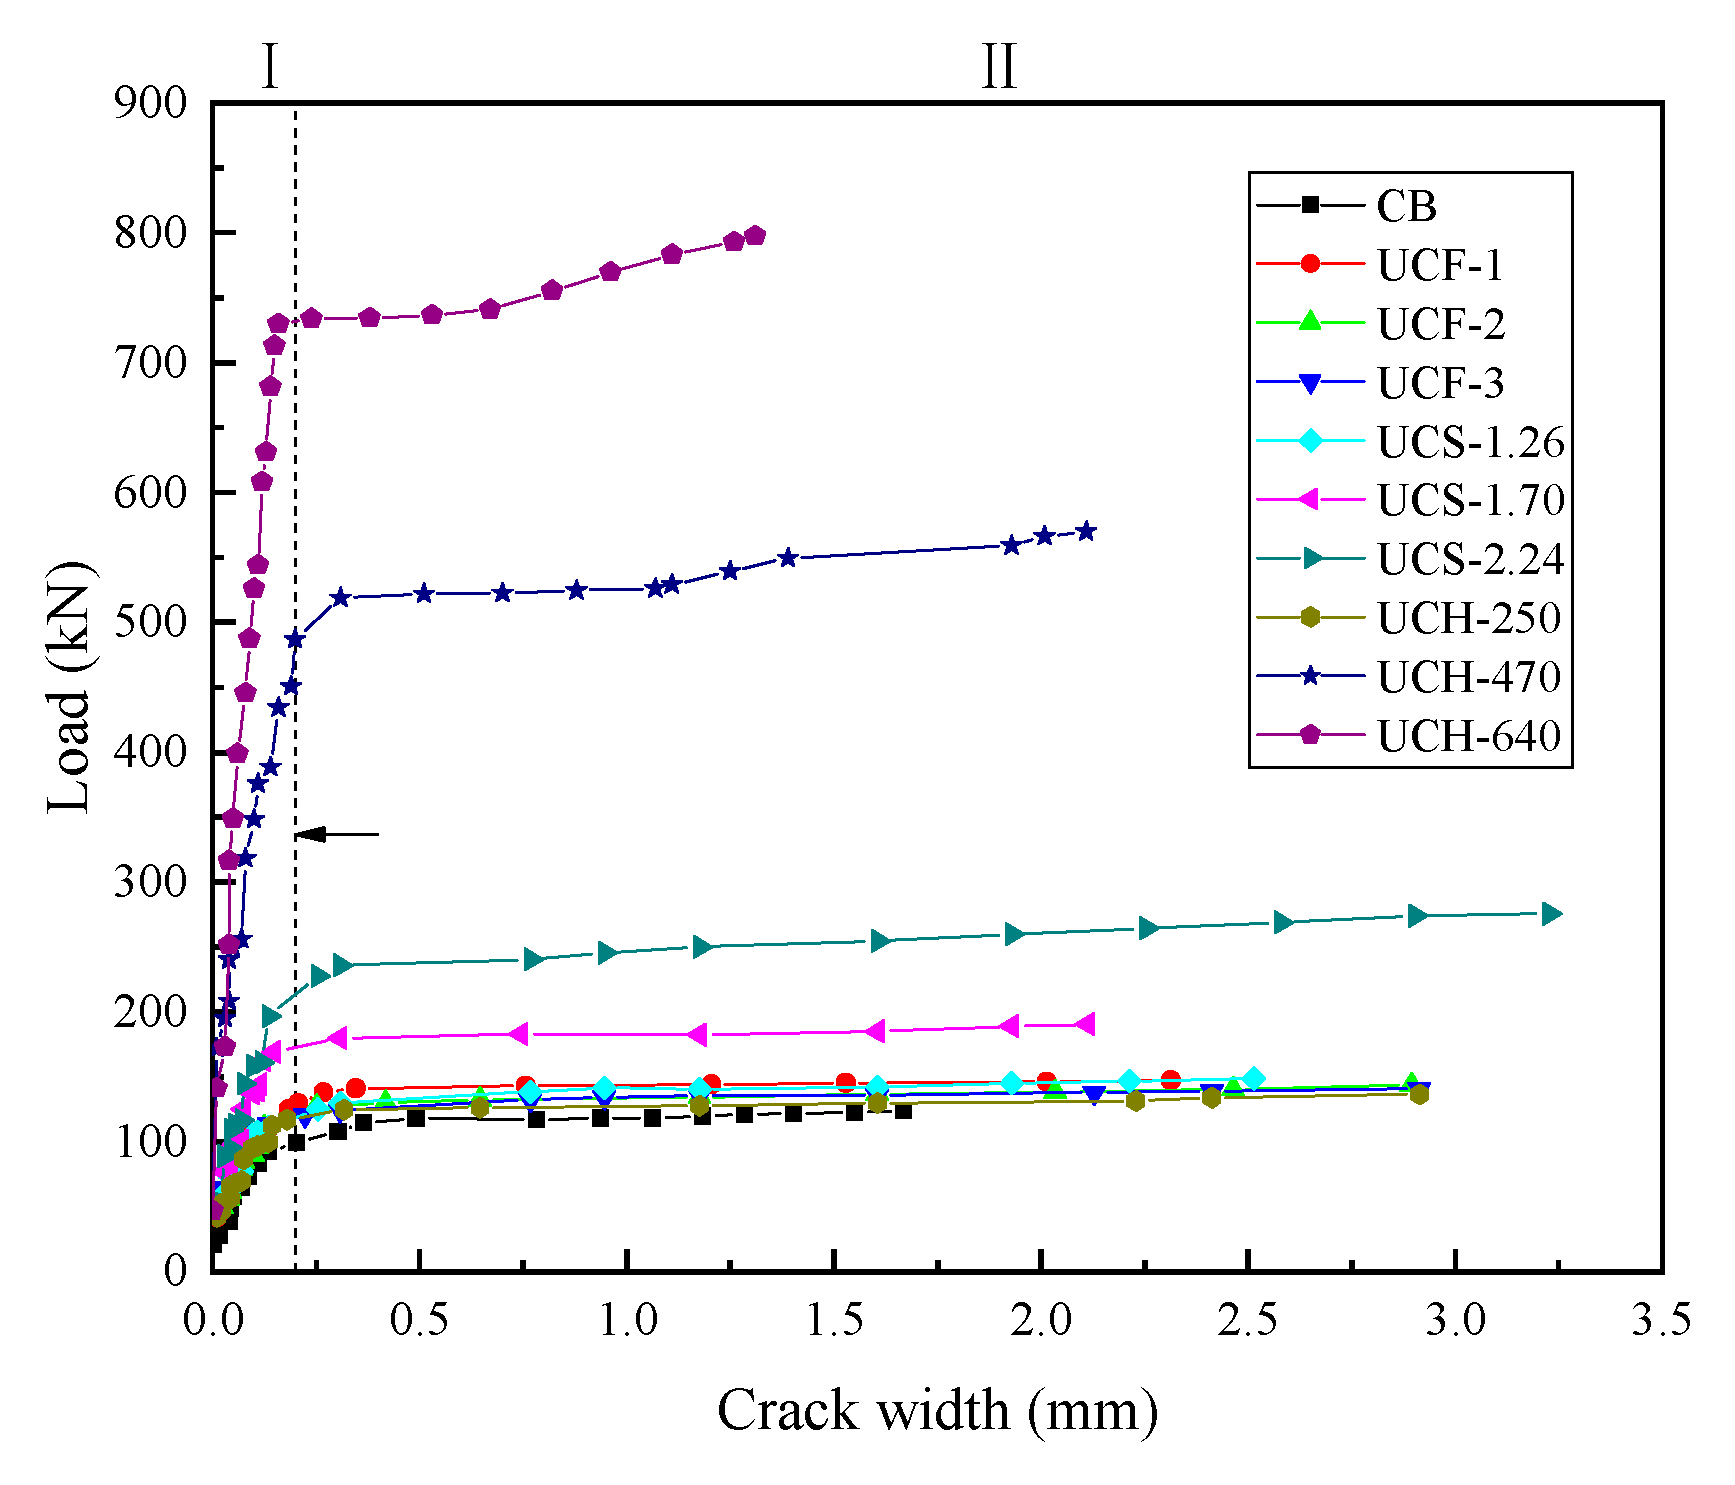
Figure 9 illustrates the load–width relationships of the primary cracks in the tensile zones of the RC beams and their UHPC strengthening layers. The experimental data indicate that the UHPC overlay significantly enhances the crack resistance of the beams, as evidenced by markedly higher cracking loads compared to the CB control beam and a substantially reduced crack propagation rate. This demonstrates that the strengthened beams can sustain greater bending loads even at relatively small crack widths. Based on observations, the flexural cracking process of the strengthened beams can generally be divided into two typical stages:
Figure 9.
Load–width curve chart of main cracks in test beams.
Stage I: Linear Development of Multiple Cracks (Crack Width 0.02–0.20 mm): In this stage, the UHPC strengthening layer exhibited a typical multiple-crack development pattern, characterized by a continuous increase in the number of microcracks, while the propagation rate of each crack remained relatively slow.
Stage II: Accelerated Crack Propagation (Crack Width > 0.20 mm): When the beam reached approximately 80% of its ultimate load capacity, multiple cracks in the UHPC layer gradually interconnected to form primary cracks with widths of around 0.20 mm. As the internal reinforcement yielded, the crack-controlling effect of the UHPC layer weakened, leading to a rapid propagation phase of cracks in both the UHPC overlay and the RC beam.
The analysis of the experimental data indicates that the UHPC strengthening layer exhibits excellent crack-inhibiting capability. The mechanism for the increased initial cracking strength lies in the ability of the steel fibers within the UHPC layer to effectively hinder the formation of cracks at the beam’s tensile zone, thereby significantly enhancing the crack resistance of the structure.
3.1.3. Load–Deflection Relationship and Ductility Analysis
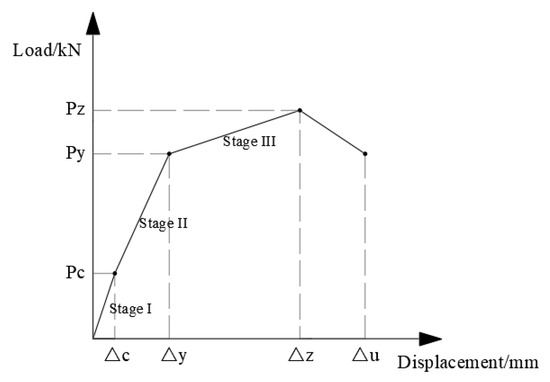
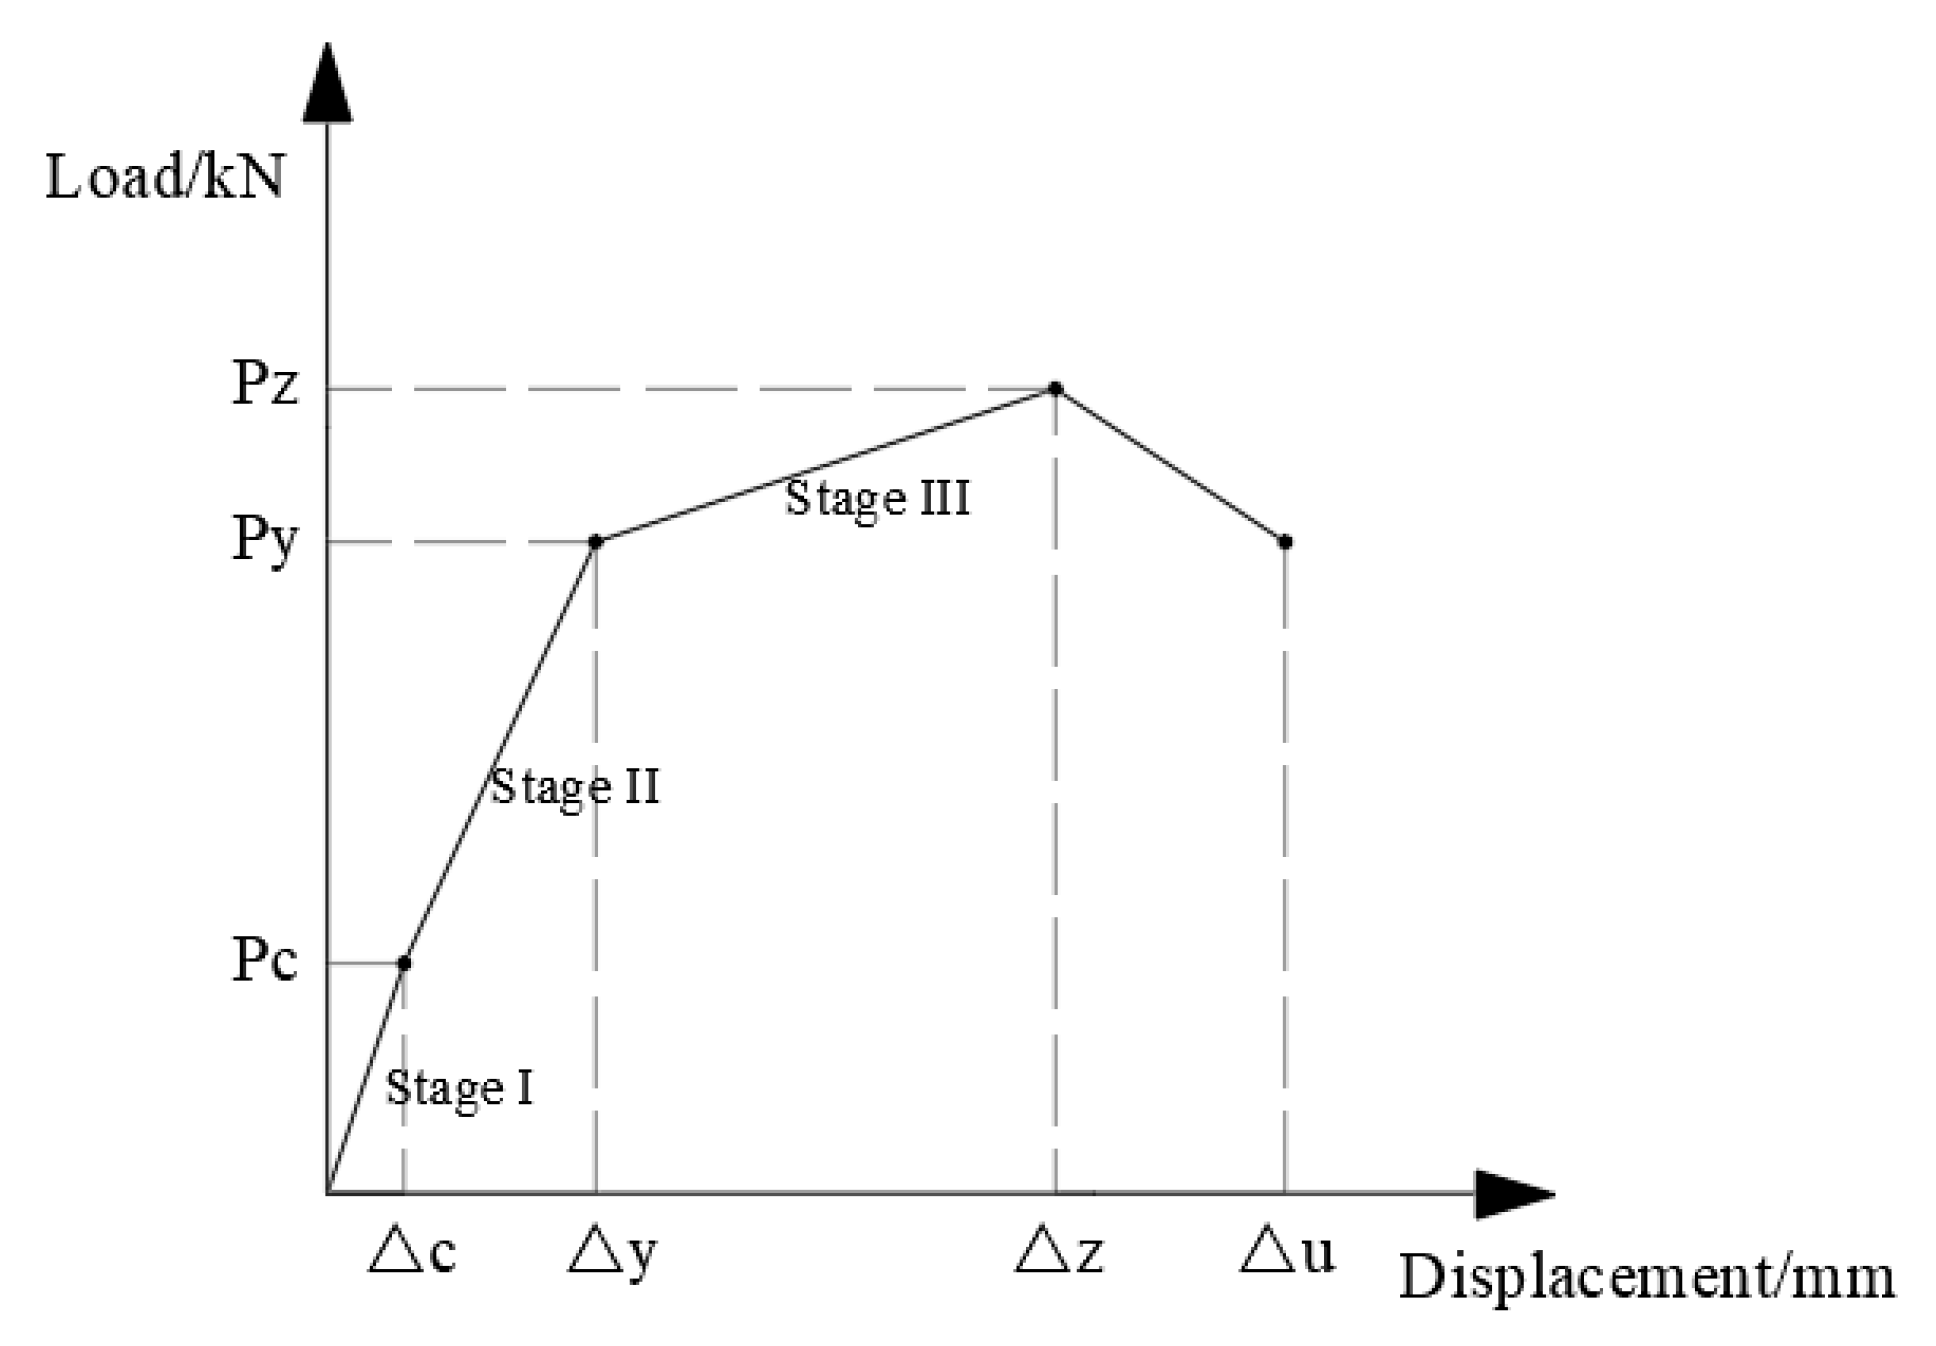
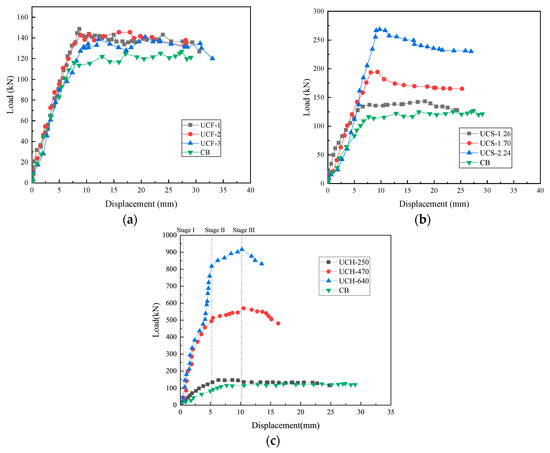
Based on the experimental data, the load–midspan deflection curves of all test beams were plotted, as shown in Figure 10. The typical flexural behavior of the specimens during the bending failure process can be summarized in three stages:
Figure 10.
Load–displacement plot.
Stage I: Elastic Working Stage: During this initial loading period, the beam’s load–deflection relationship exhibited a clear linear behavior. At this stage, the normal concrete layer, the UHPC strengthening layer, and the longitudinal reinforcement all remained in elastic deformation, collectively resisting the tensile stresses in the beam’s tension zone. Although the materials approached their stress limits toward the end of this stage, no visible cracks appeared in the beam section; however, internal microcracks may have begun to develop, signaling the impending transition to the next stage.
Stage II: Crack Formation and Load Redistribution Stage: This stage begins when the first visible macroscopic crack appears in the beam. At this point, the tensile strain in the concrete reaches its limit, and load transfer relies primarily on the UHPC strengthening layer and the longitudinal reinforcement. Due to the high toughness of the UHPC and the presence of steel fibers, the formation of cracks does not immediately lead to structural failure; instead, the beam is able to continue carrying loads in the cracked state. As the load increases, the cracks gradually propagate, and the materials exhibit elastoplastic behavior, with the reinforcement progressively entering the plastic deformation range until yielding occurs.
Stage III: Final Failure Stage: When the beam entered the ultimate failure stage, the reinforcement could no longer sustain additional tensile forces, and the load–deflection curve tended to flatten while the beam deflection increased rapidly. The number and width of cracks within the UHPC layer intensified, with cracks propagating upward into more regions of the beam. The concrete in the compression zone underwent plastic flow and eventually crushing under the increasing compressive stress, ultimately causing a sharp drop in the beam’s load-carrying capacity until the specimen could no longer sustain further loads and failed.
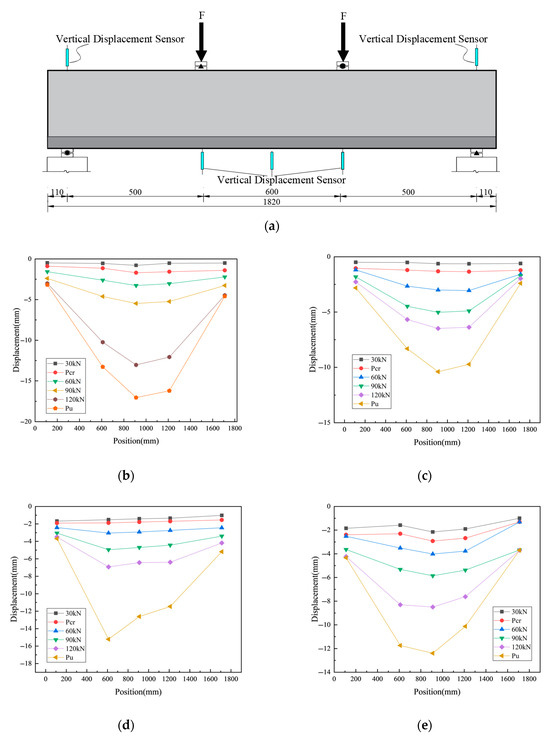
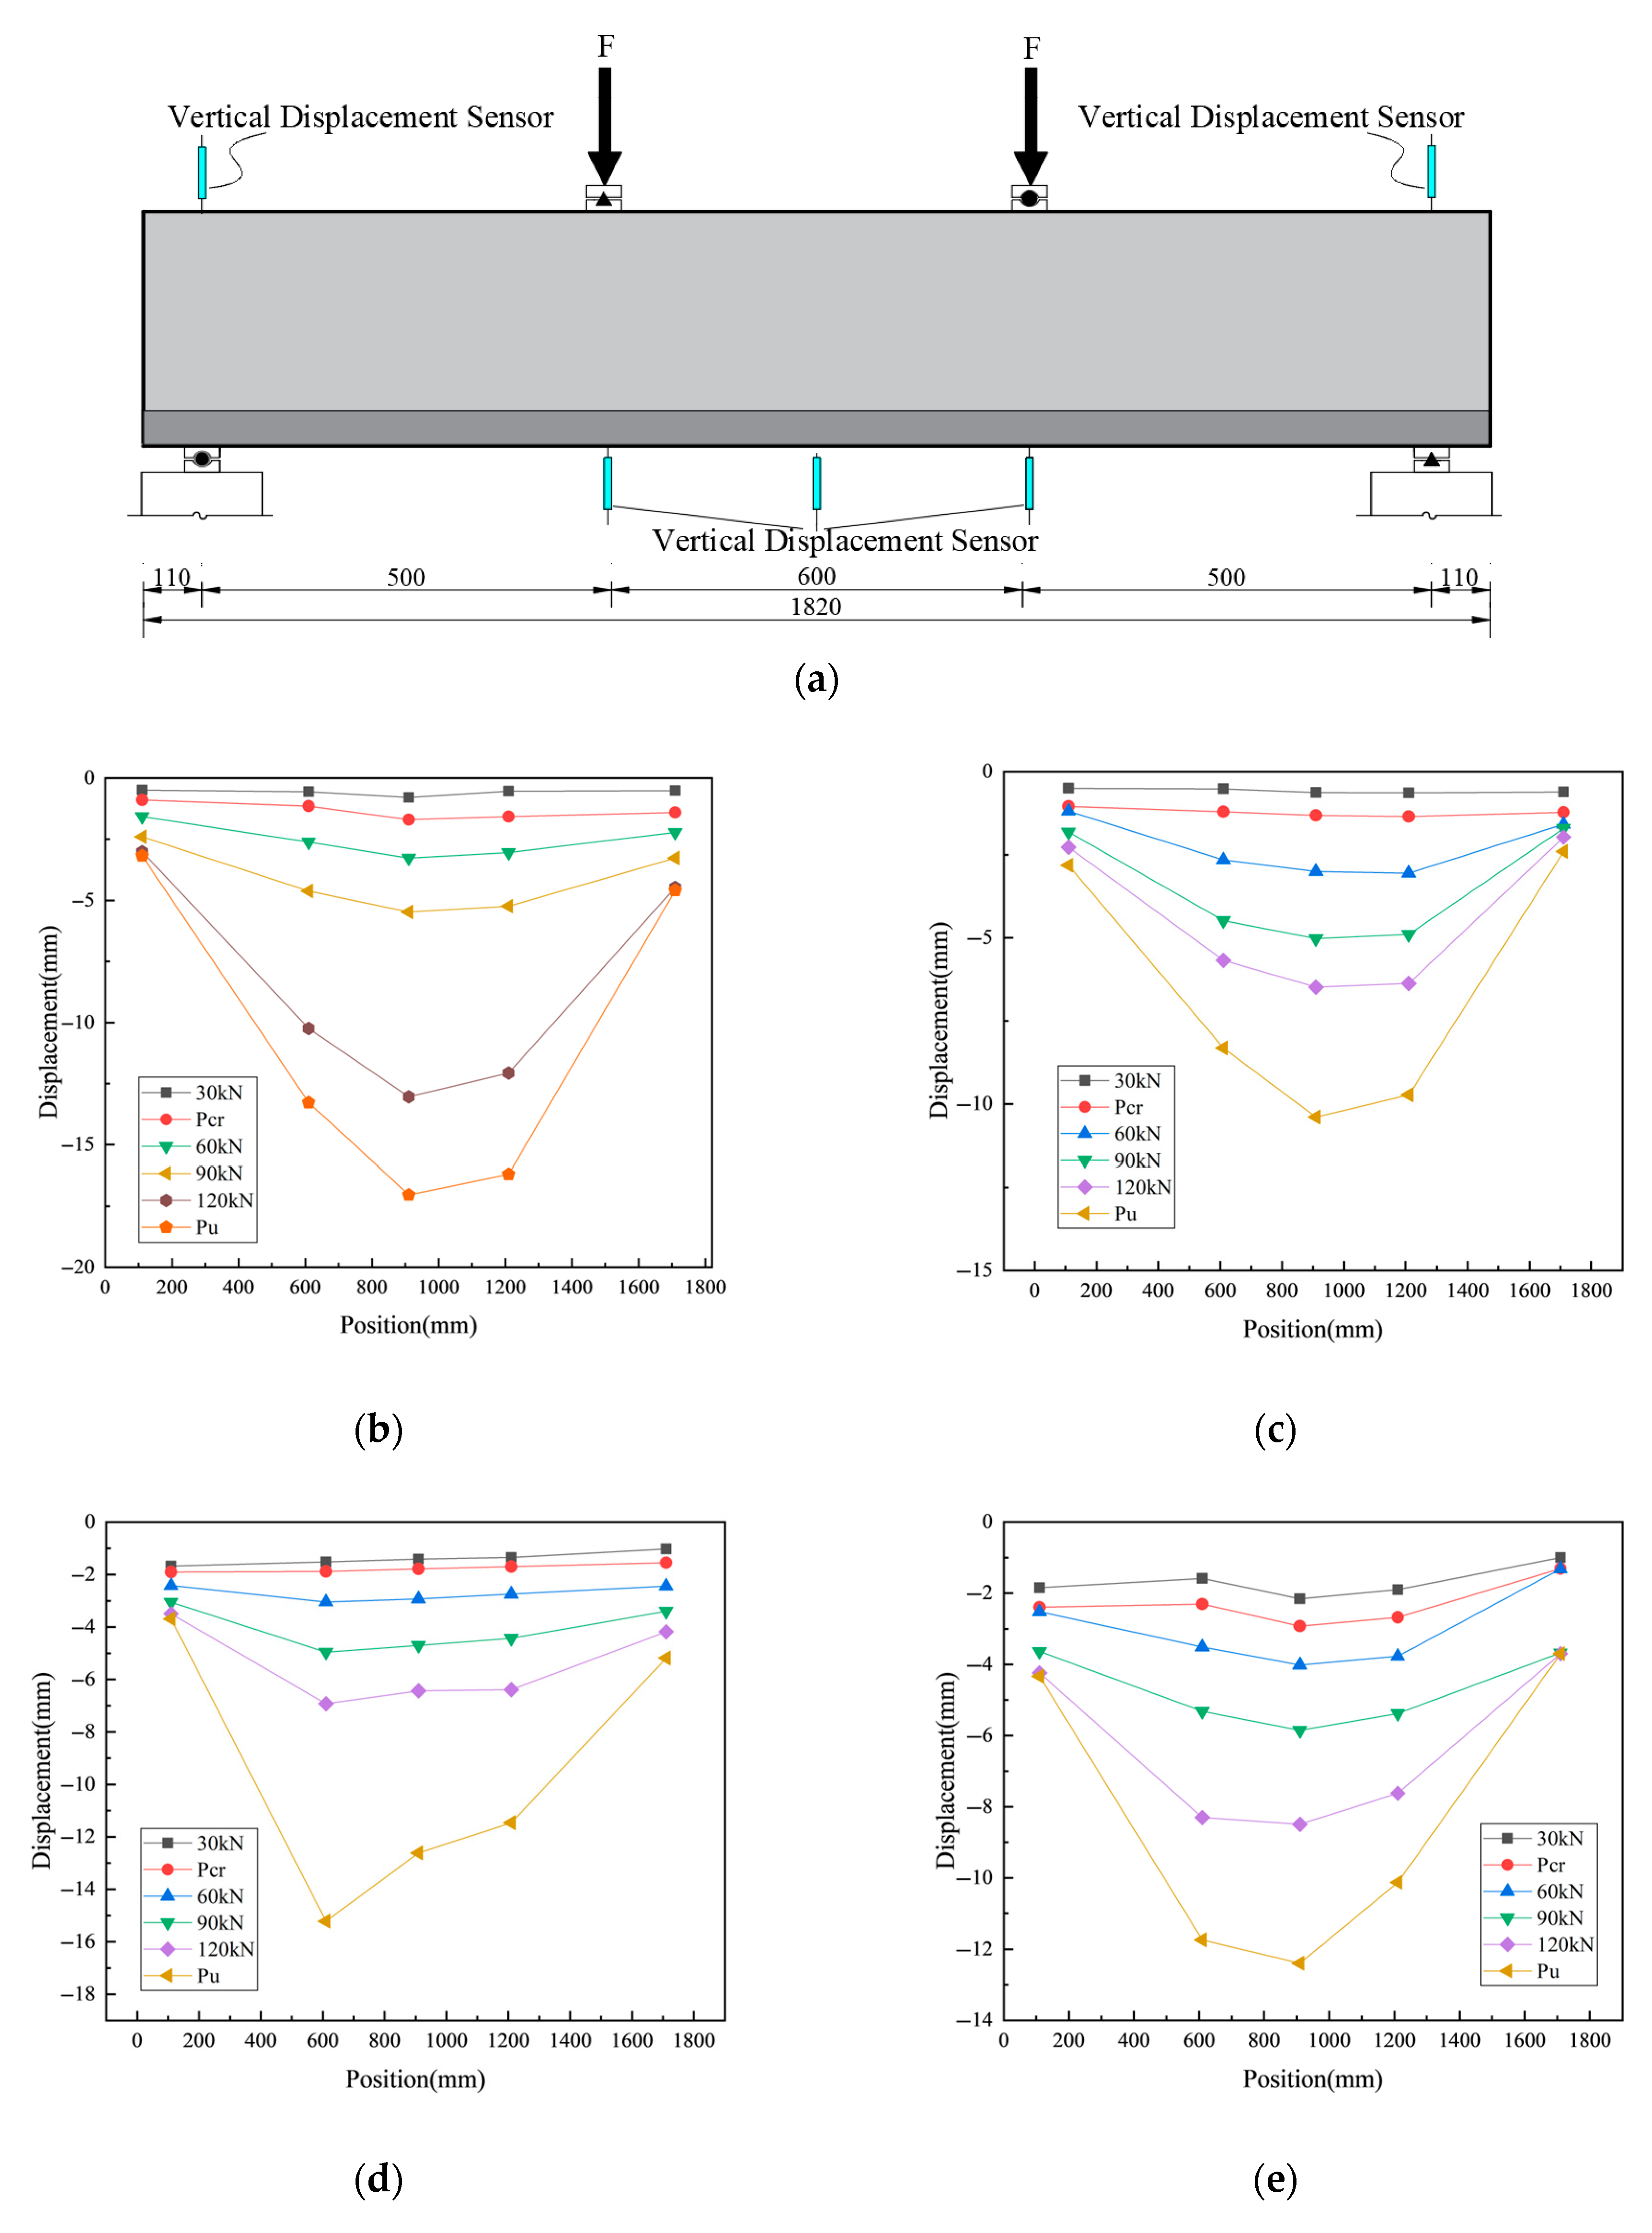
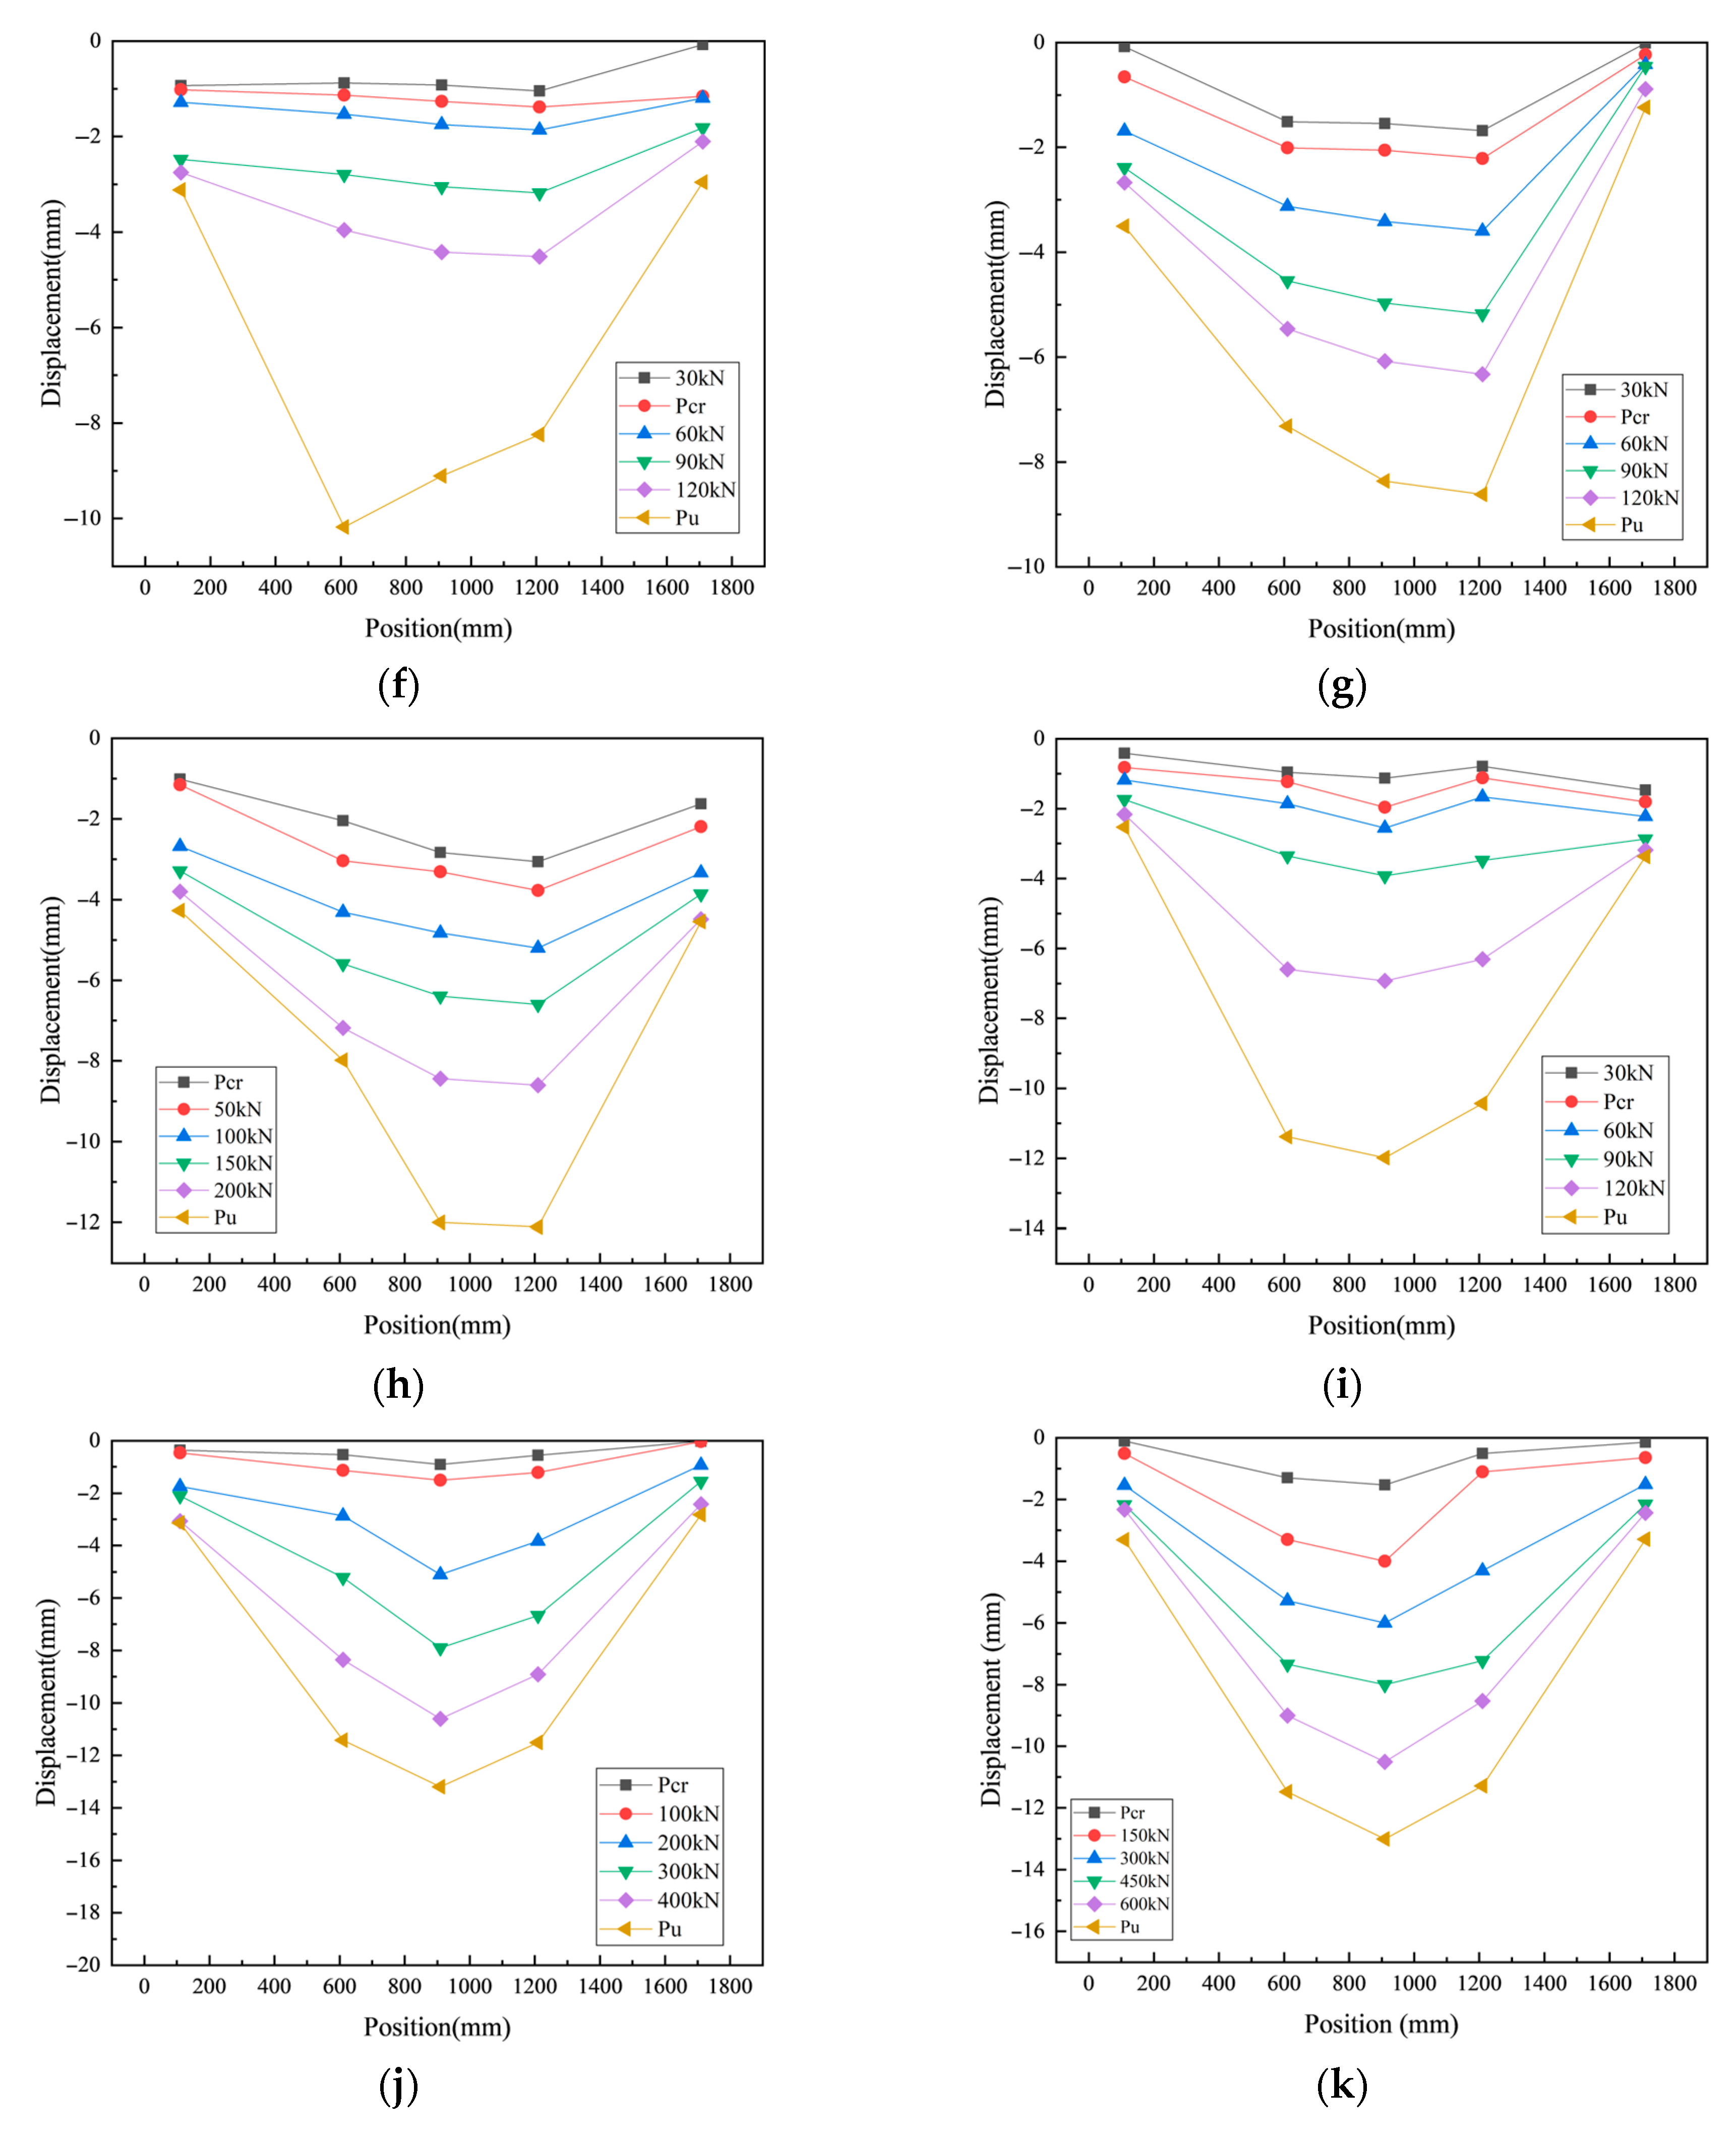
The load–midspan deflection curves of the ten test beams, grouped according to the controlled variables, are shown in Figure 11, and the corresponding load–deflection deformation diagrams are presented in Figure 12. The load values at key points for each stage are listed in Table 8.
Figure 11.
Experiment beam load–mid-span deflection curve diagram: (a) UCF; (b) UCS;(c) UCH.
Figure 12.
Load–deflection deformation diagram of the test beam (units: mm): (a) Layout of the vertical displacement sensor; (b) CB; (c) UCF-1; (d) UCF-2; (e) UCF-3; (f) UCS-1.26; (g) UCS-1.70; (h) UCS-2.24; (i) UCH-250; (j) UCH-470; (k) UCH-640.
Table 8.
Load Analysis of Test Beam Stage.
Compared with the control beam (CB), the strengthened beams UCF-1, UCF-2, and UCF-3 exhibited an increase of approximately 13% in ultimate flexural capacity. For the UCS-series beams (UCS-1.26, UCS-1.70, and UCS-2.24), the ultimate load capacities were enhanced by 16.4%, 51.0%, and 110.2%, respectively, relative to the CB beam. The UCH-series beams (UCH-250, UCH-470, and UCH-640) demonstrated even more pronounced improvements, with increases of 6.2%, 338.6%, and 518.8%, respectively. These results clearly indicate that the UHPC strengthening layer has a positive effect on enhancing the load-carrying capacity of the original RC beams, which is consistently observed in the UCF, UCS, and UCH groups. However, the influence of steel fiber volume fraction on the ultimate flexural capacity of UHPC-strengthened beams appears to be limited, whereas the increases in reinforcement ratio and overall beam depth contribute significantly to the improvement in ultimate capacity.
When the beam is in Stage I, it behaves within the elastic range, and the load–deflection response exhibits an approximately linear relationship. When the applied load reaches Pc, the beam enters Stage II, during which the tensile strain in the concrete attains its limit, and the tensile resistance is mainly transferred to the UHPC strengthening layer and the longitudinal reinforcement. As the load increases further to Py, the beam transitions into Stage III. At this stage, the reinforcing bars can no longer sustain additional tensile forces, causing the load–deflection curve to flatten, while the mid-span deflection increases rapidly.
In the design of RC structural strengthening, it is essential not only to satisfy the load-carrying requirements under normal service conditions but also to ensure that the structure possesses sufficient plastic deformation capacity to dissipate energy under accidental loads such as earthquakes or impacts. When a high-strength UHPC layer is used for flexural strengthening, although the tensile zone performance of the UHPC–RC composite is significantly enhanced, the compressive zone of the normal concrete is not simultaneously improved, which may lead to brittle failure due to over-reinforcement. Therefore, this study systematically investigated the ductility performance of the UHPC-strengthened beams through flexural testing.
The displacement ductility factor is an important indicator for evaluating the plastic deformation capacity of RC structures. The displacement ductility factor, , is calculated as the ratio of the ultimate displacement, , to the yield displacement, , as expressed in Equation (1). This parameter effectively reflects the inelastic deformation capacity of the structure prior to failure.
In the evaluation of flexural ductility for structural members, the mid-span deflection is commonly used to calculate the displacement ductility factor. In this study, the ductility factor, , is consistently defined based on the mid-span deflection corresponding to the yielding of the RC reinforcement. The ultimate deflection, , is defined as the mid-span deflection when the applied load reaches 85% of the peak load capacity. The results are summarized in Table 9.
Table 9.
Comparison of Beam Ductility.
In the table, .
The analysis of the experimental data indicates that the UHPC strengthening layer significantly enhances the flexural stiffness of the RC beams, resulting in improved flexural performance and effectively optimizing the serviceability under normal loading conditions. Although the increase in stiffness slightly reduces ductility, none of the UHPC-strengthened beams exhibited brittle failure, and all specimens demonstrated clear yielding behavior prior to failure.
3.1.4. Load–Strain Relationship
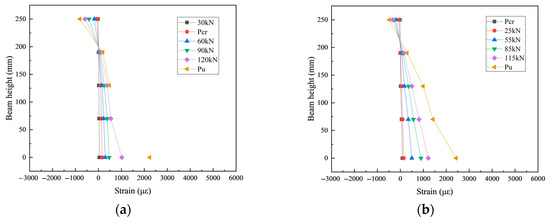
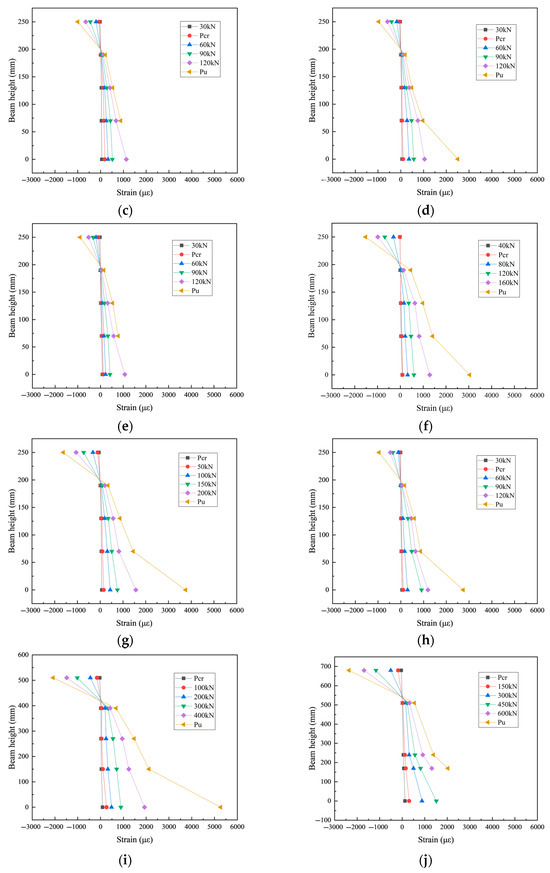
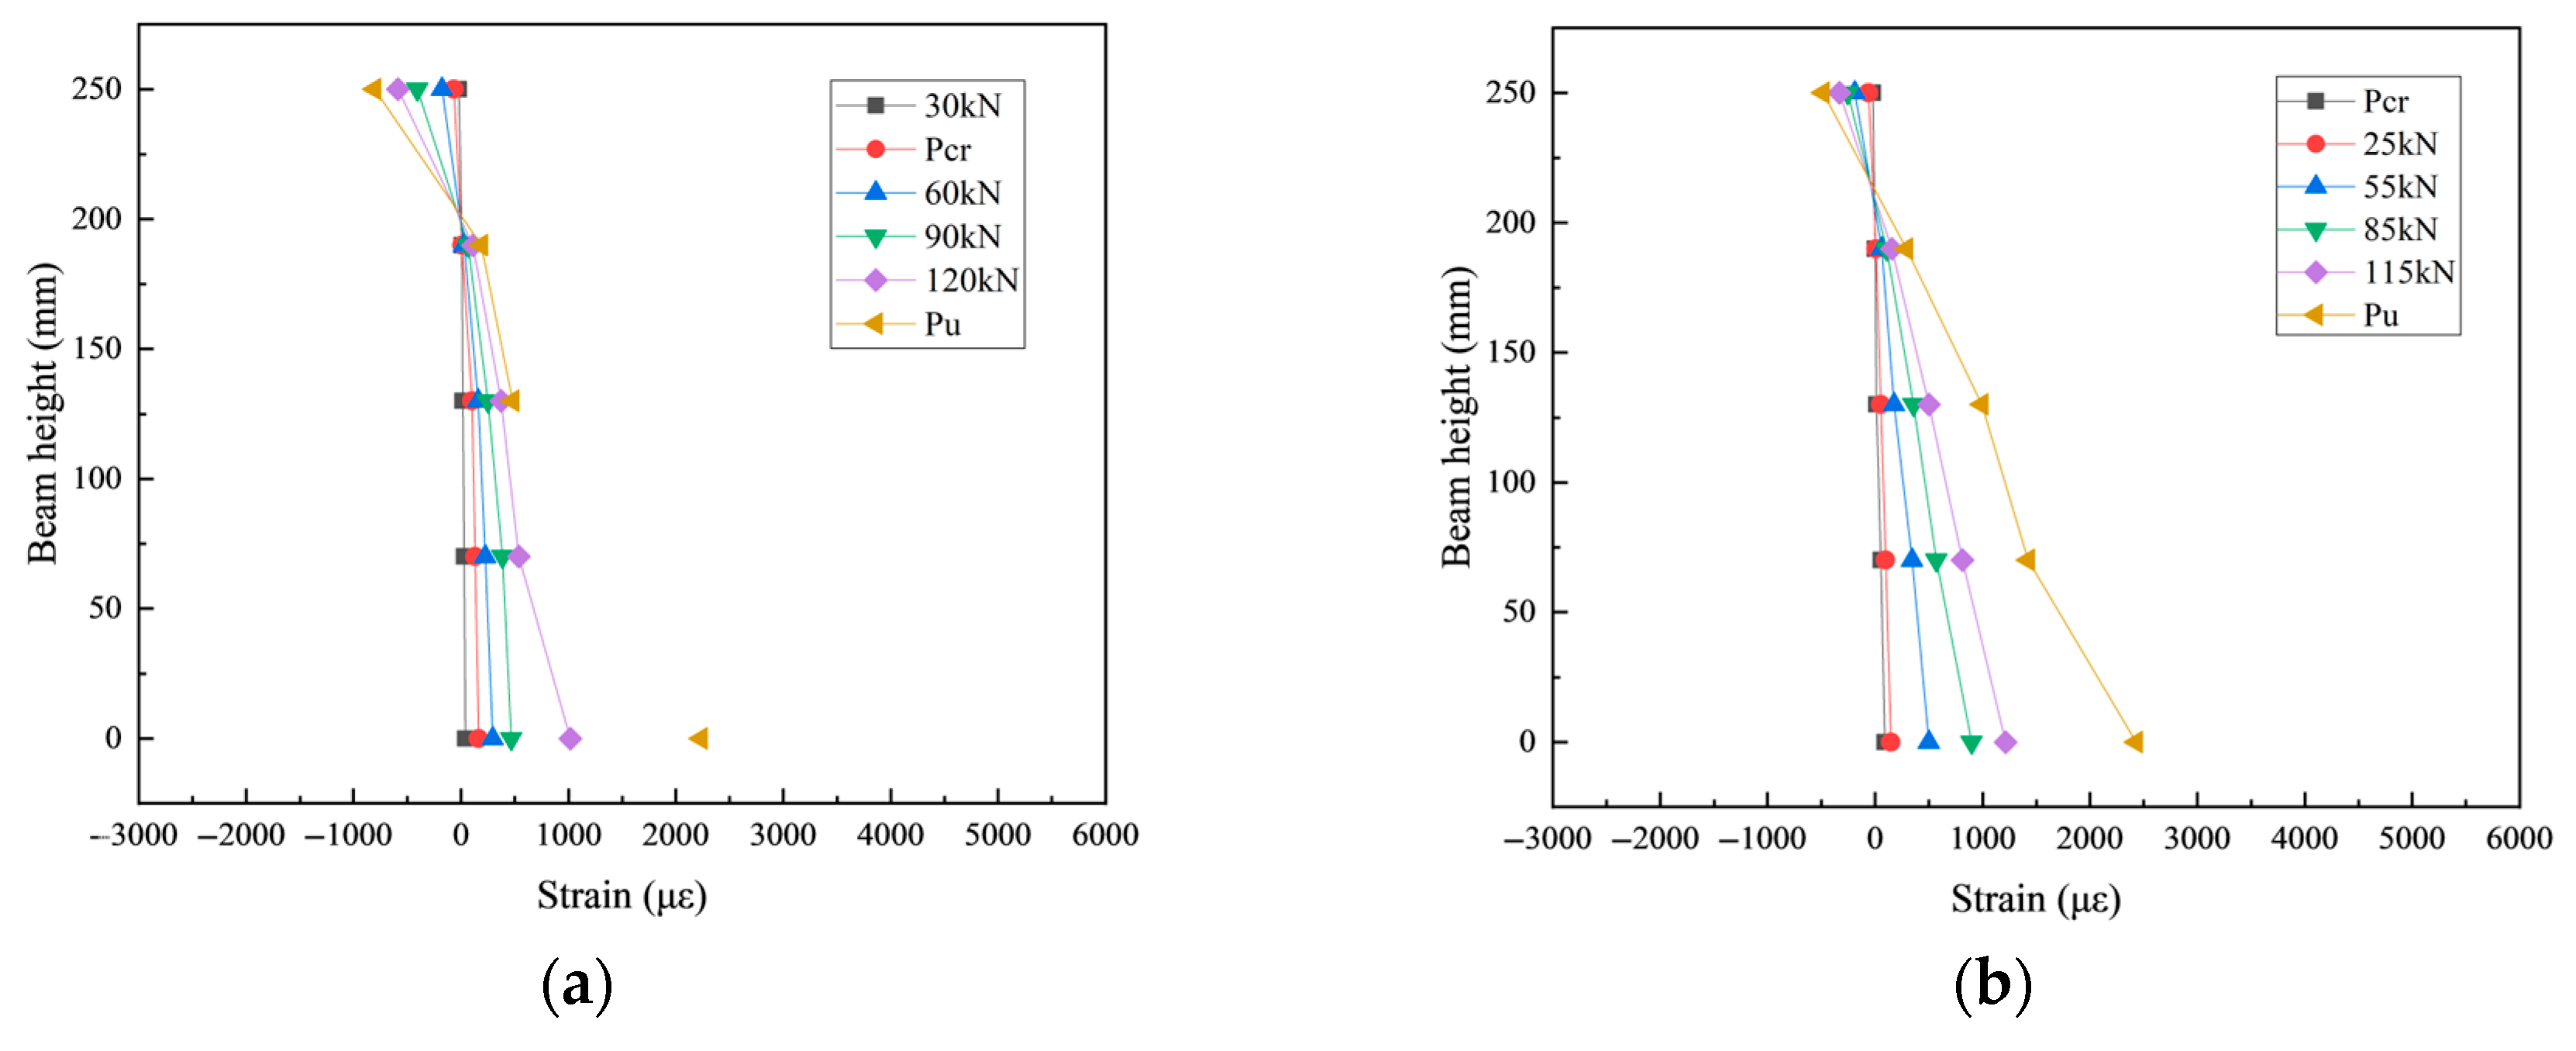
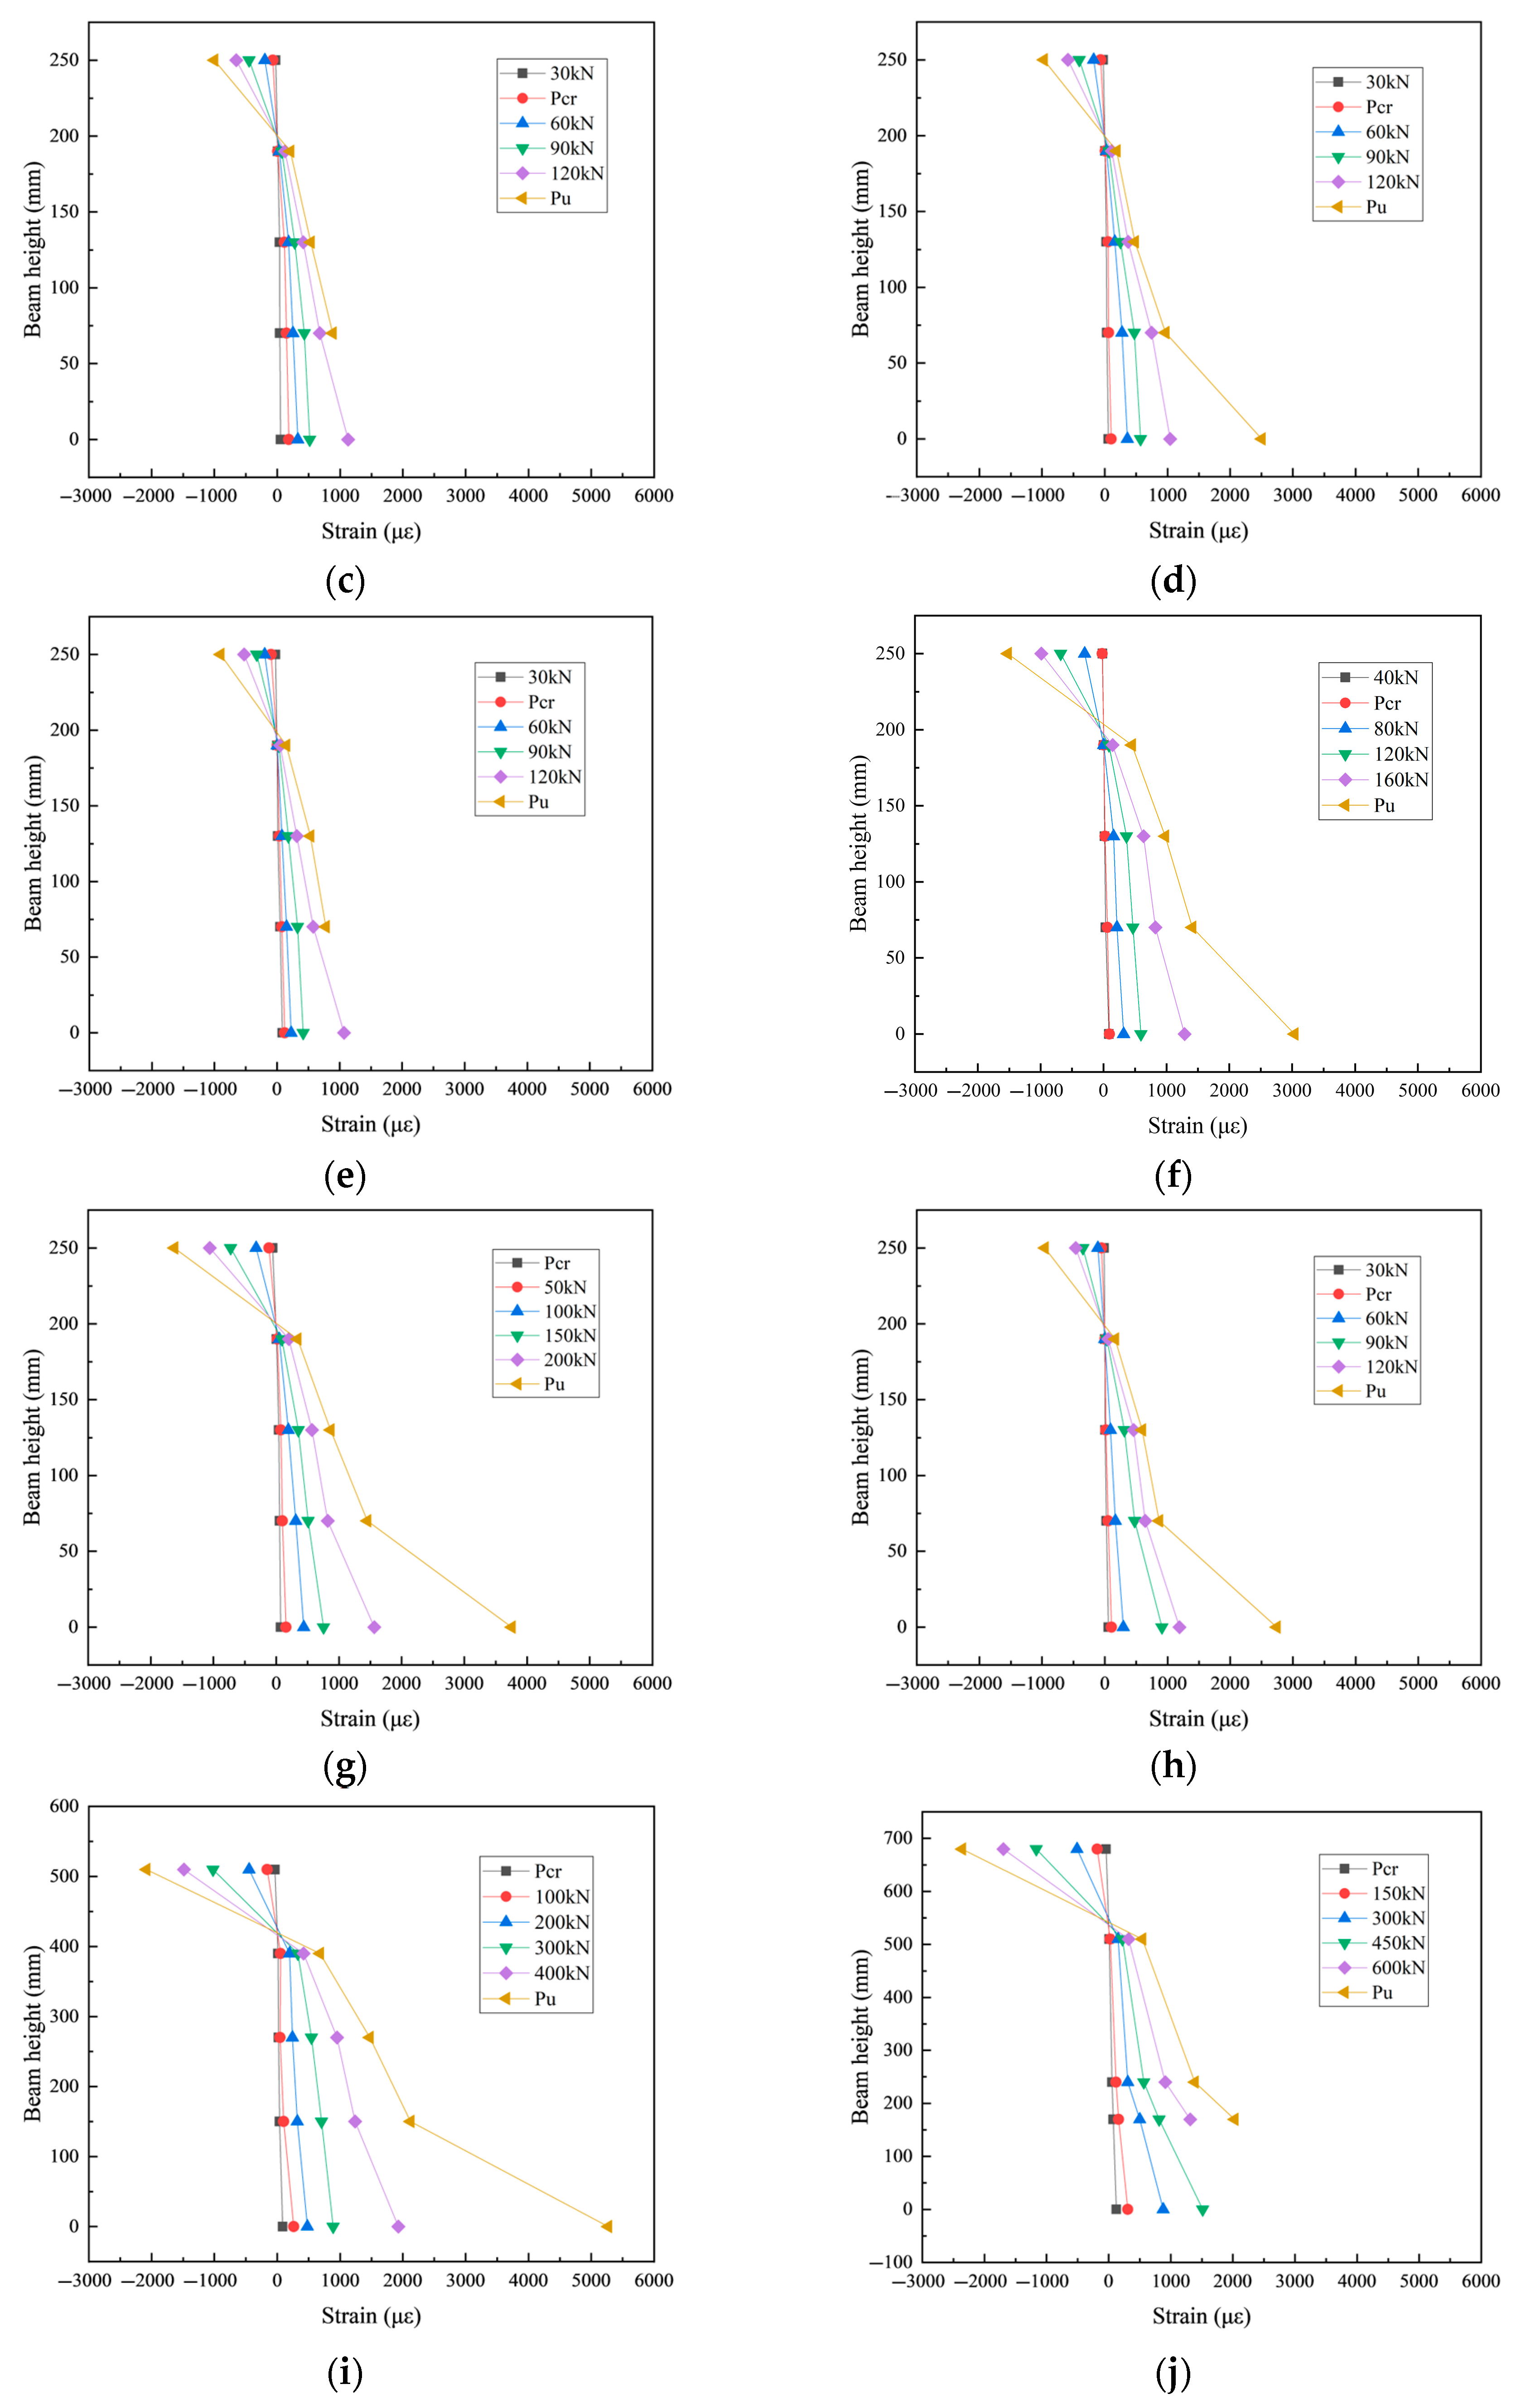
Figure 13 illustrates the measured strain distribution at the mid-span section of the UHPC-strengthened beams with different parameters and the control beam during the incremental loading process.
Figure 13.
Test beam beam height–strain diagram: (a) CB; (b) UCF-1; (c) UCF-2; (d)UCF-3; (e) UCS-1.26; (f) UCS-1.70; (g) UCS-2.24; (h) UCH-250; (i) UCH-470; (j) UCH-640.
The experimental results indicate that the strain distribution across the sections of beams with different reinforcement ratios exhibits an approximately linear variation, confirming that the concrete strain in the UHPC-strengthened beams generally satisfies the plane section assumption.
3.1.5. Load–Interface (UHPC–RC) Slip Relationship
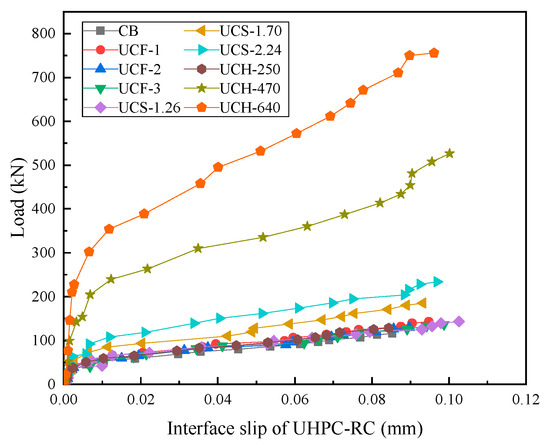
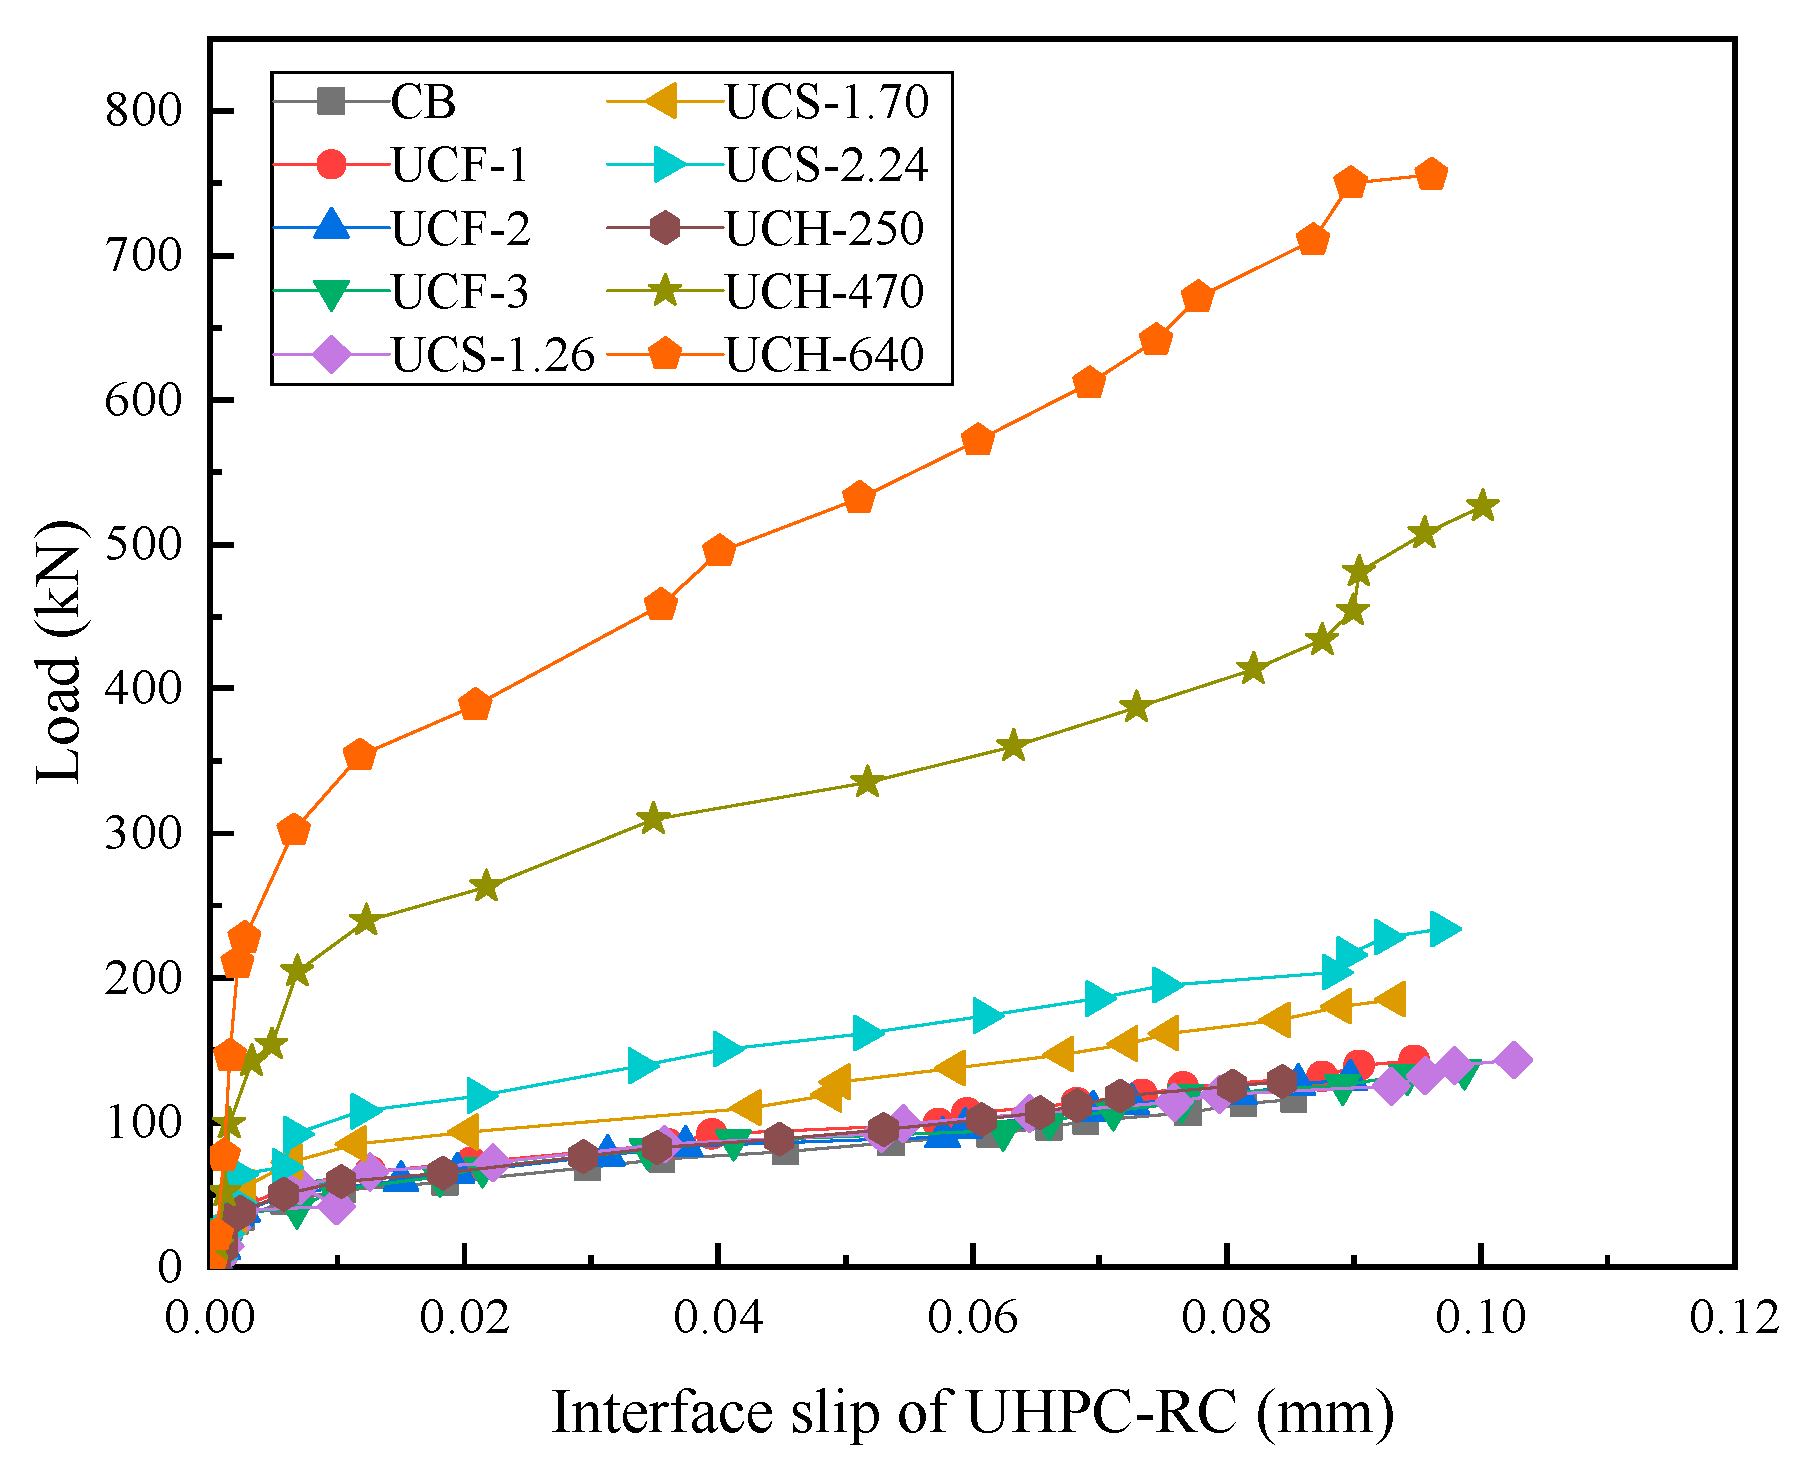
In composite RC structures strengthened with high-performance materials, the difference in elastic moduli between the new and existing materials can lead to deformation incompatibility under flexural loading, resulting in relative slip at the interface. The bond strength at the interface directly affects the performance of the strengthening material; insufficient bonding may cause brittle failure due to delamination of the strengthening layer. In this study, displacement transducers were used to monitor the interface behavior, and it was observed that simply supported strengthened beams exhibited the maximum slip at the shear span. The load–slip relationships at this location for all specimens are presented in Figure 14.
Figure 14.
Reinforced beam interface load–slip curve chart.
As shown in Figure 14, before the appearance of horizontal cracks at the interface, the slip increased slowly and approximately linearly. After horizontal cracking occurred at the UHPC–RC interface, the slope of the load–slip curve noticeably decreased, indicating a reduction in interfacial bond stiffness and a slightly accelerated slip rate. However, the experimental observations revealed that the horizontal cracks propagated slowly, and the interface slip did not significantly intensify with increasing load. Prior to reaching the ultimate state, the maximum slip remained below 0.20 mm, exerting only a minor effect on the overall structural performance. Notably, none of the strengthened beams exhibited delamination before the UHPC layer fractured. These results clearly demonstrate the excellent bond performance between UHPC and normal concrete, confirming that under flexural loading, the UHPC–RC interface possesses sufficient bond strength to ensure structural integrity while fully exploiting the high-strength characteristics of the UHPC strengthening layer.
4. Nonlinear Sectional Analysis of Test Beams
Nonlinear sectional analysis plays a critical role in structural engineering research. Experimental studies are often limited by budget and time constraints, making systematic multi-parameter comparisons challenging. Computer-based numerical simulation techniques can effectively complement experimental investigations and provide strong support for parametric sensitivity analyses.
In this study, a specialized nonlinear analysis program was developed on the MATLAB R2020a platform to numerically simulate the full flexural response of the beam specimens. The reliability of the self-developed sectional nonlinear analysis program was verified through comparison with the experimental results. Furthermore, the program was employed to investigate the effects of key factors—such as steel fiber content, beam height, reinforcement ratio, and interface treatment—on the performance of UHPC-strengthened beams, and a systematic sensitivity evaluation of these parameters was conducted.
4.1. Numerical Analysis of Flexural Capacity of Sections
4.1.1. Material Constitutive Model
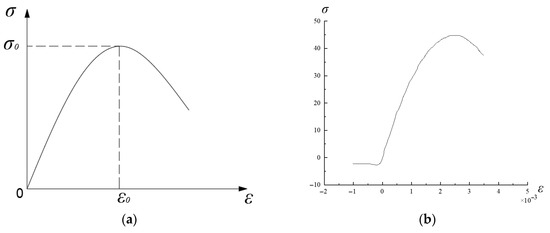
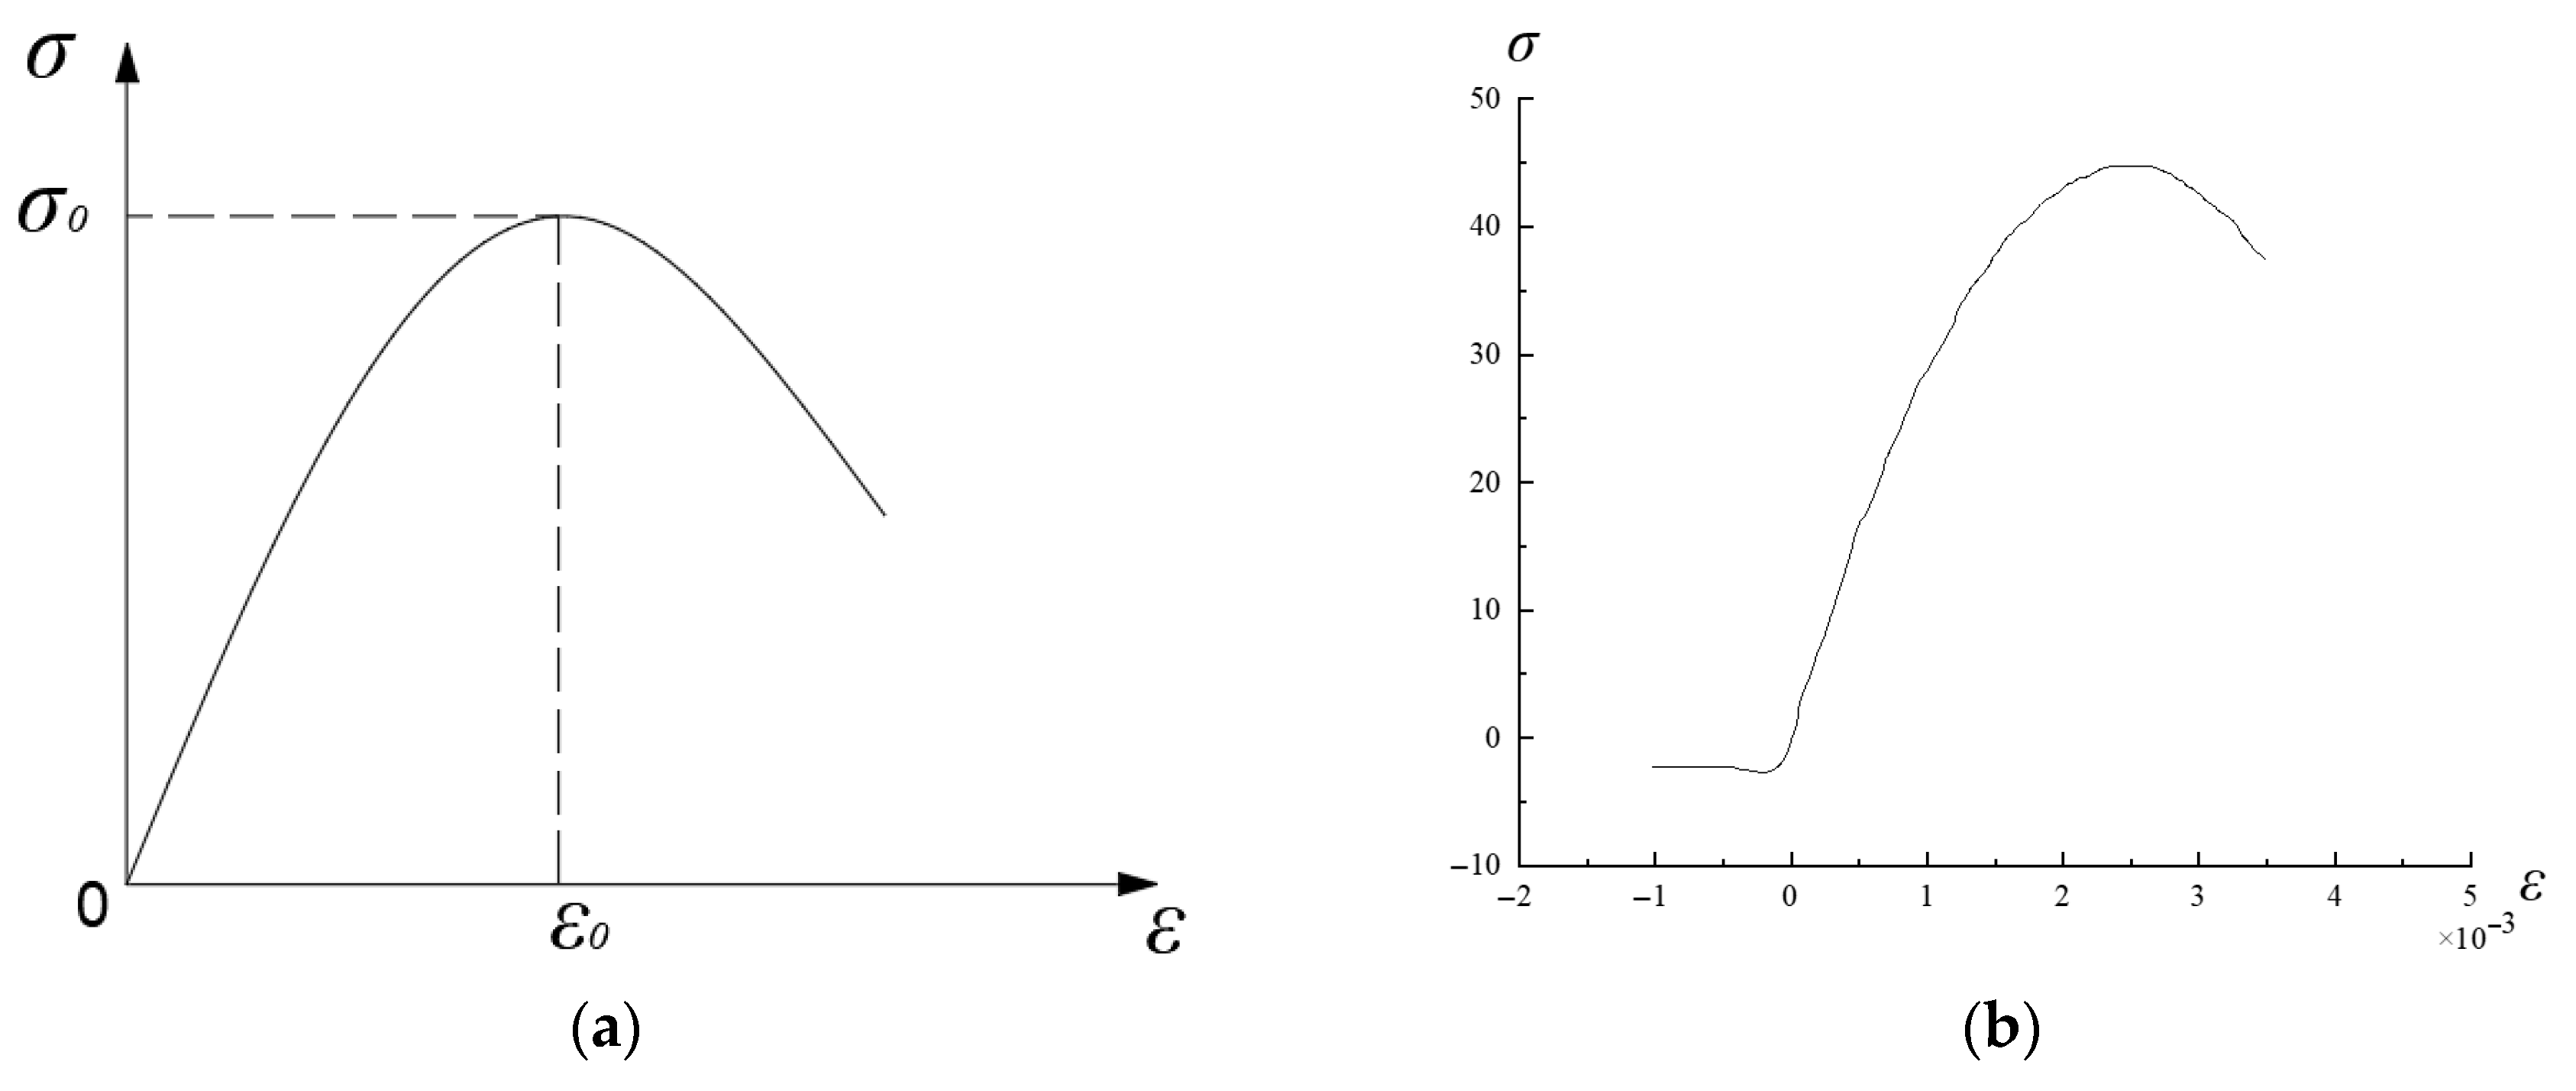
Figure 15 shows that the compressive stress–strain relationship of normal concrete (NC) follows the constitutive model recommended by GB50010-2010 [45] for calculating the flexural capacity of bending members’ cross sections. The specific mathematical expression is given in Equation (2).
Figure 15.
The constitutive relationship of ordinary concrete under compression: (a) stress–strain curve of conventional concrete; (b) MATLAB stress–strain curve.
In the equation, fc represents the compressive strength of the concrete; ε0 is the strain corresponding to the ultimate compressive strength; and σc is the compressive stress when the compressive strain equals εc.
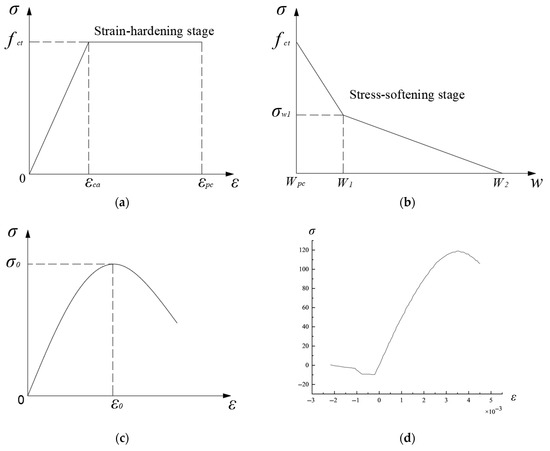
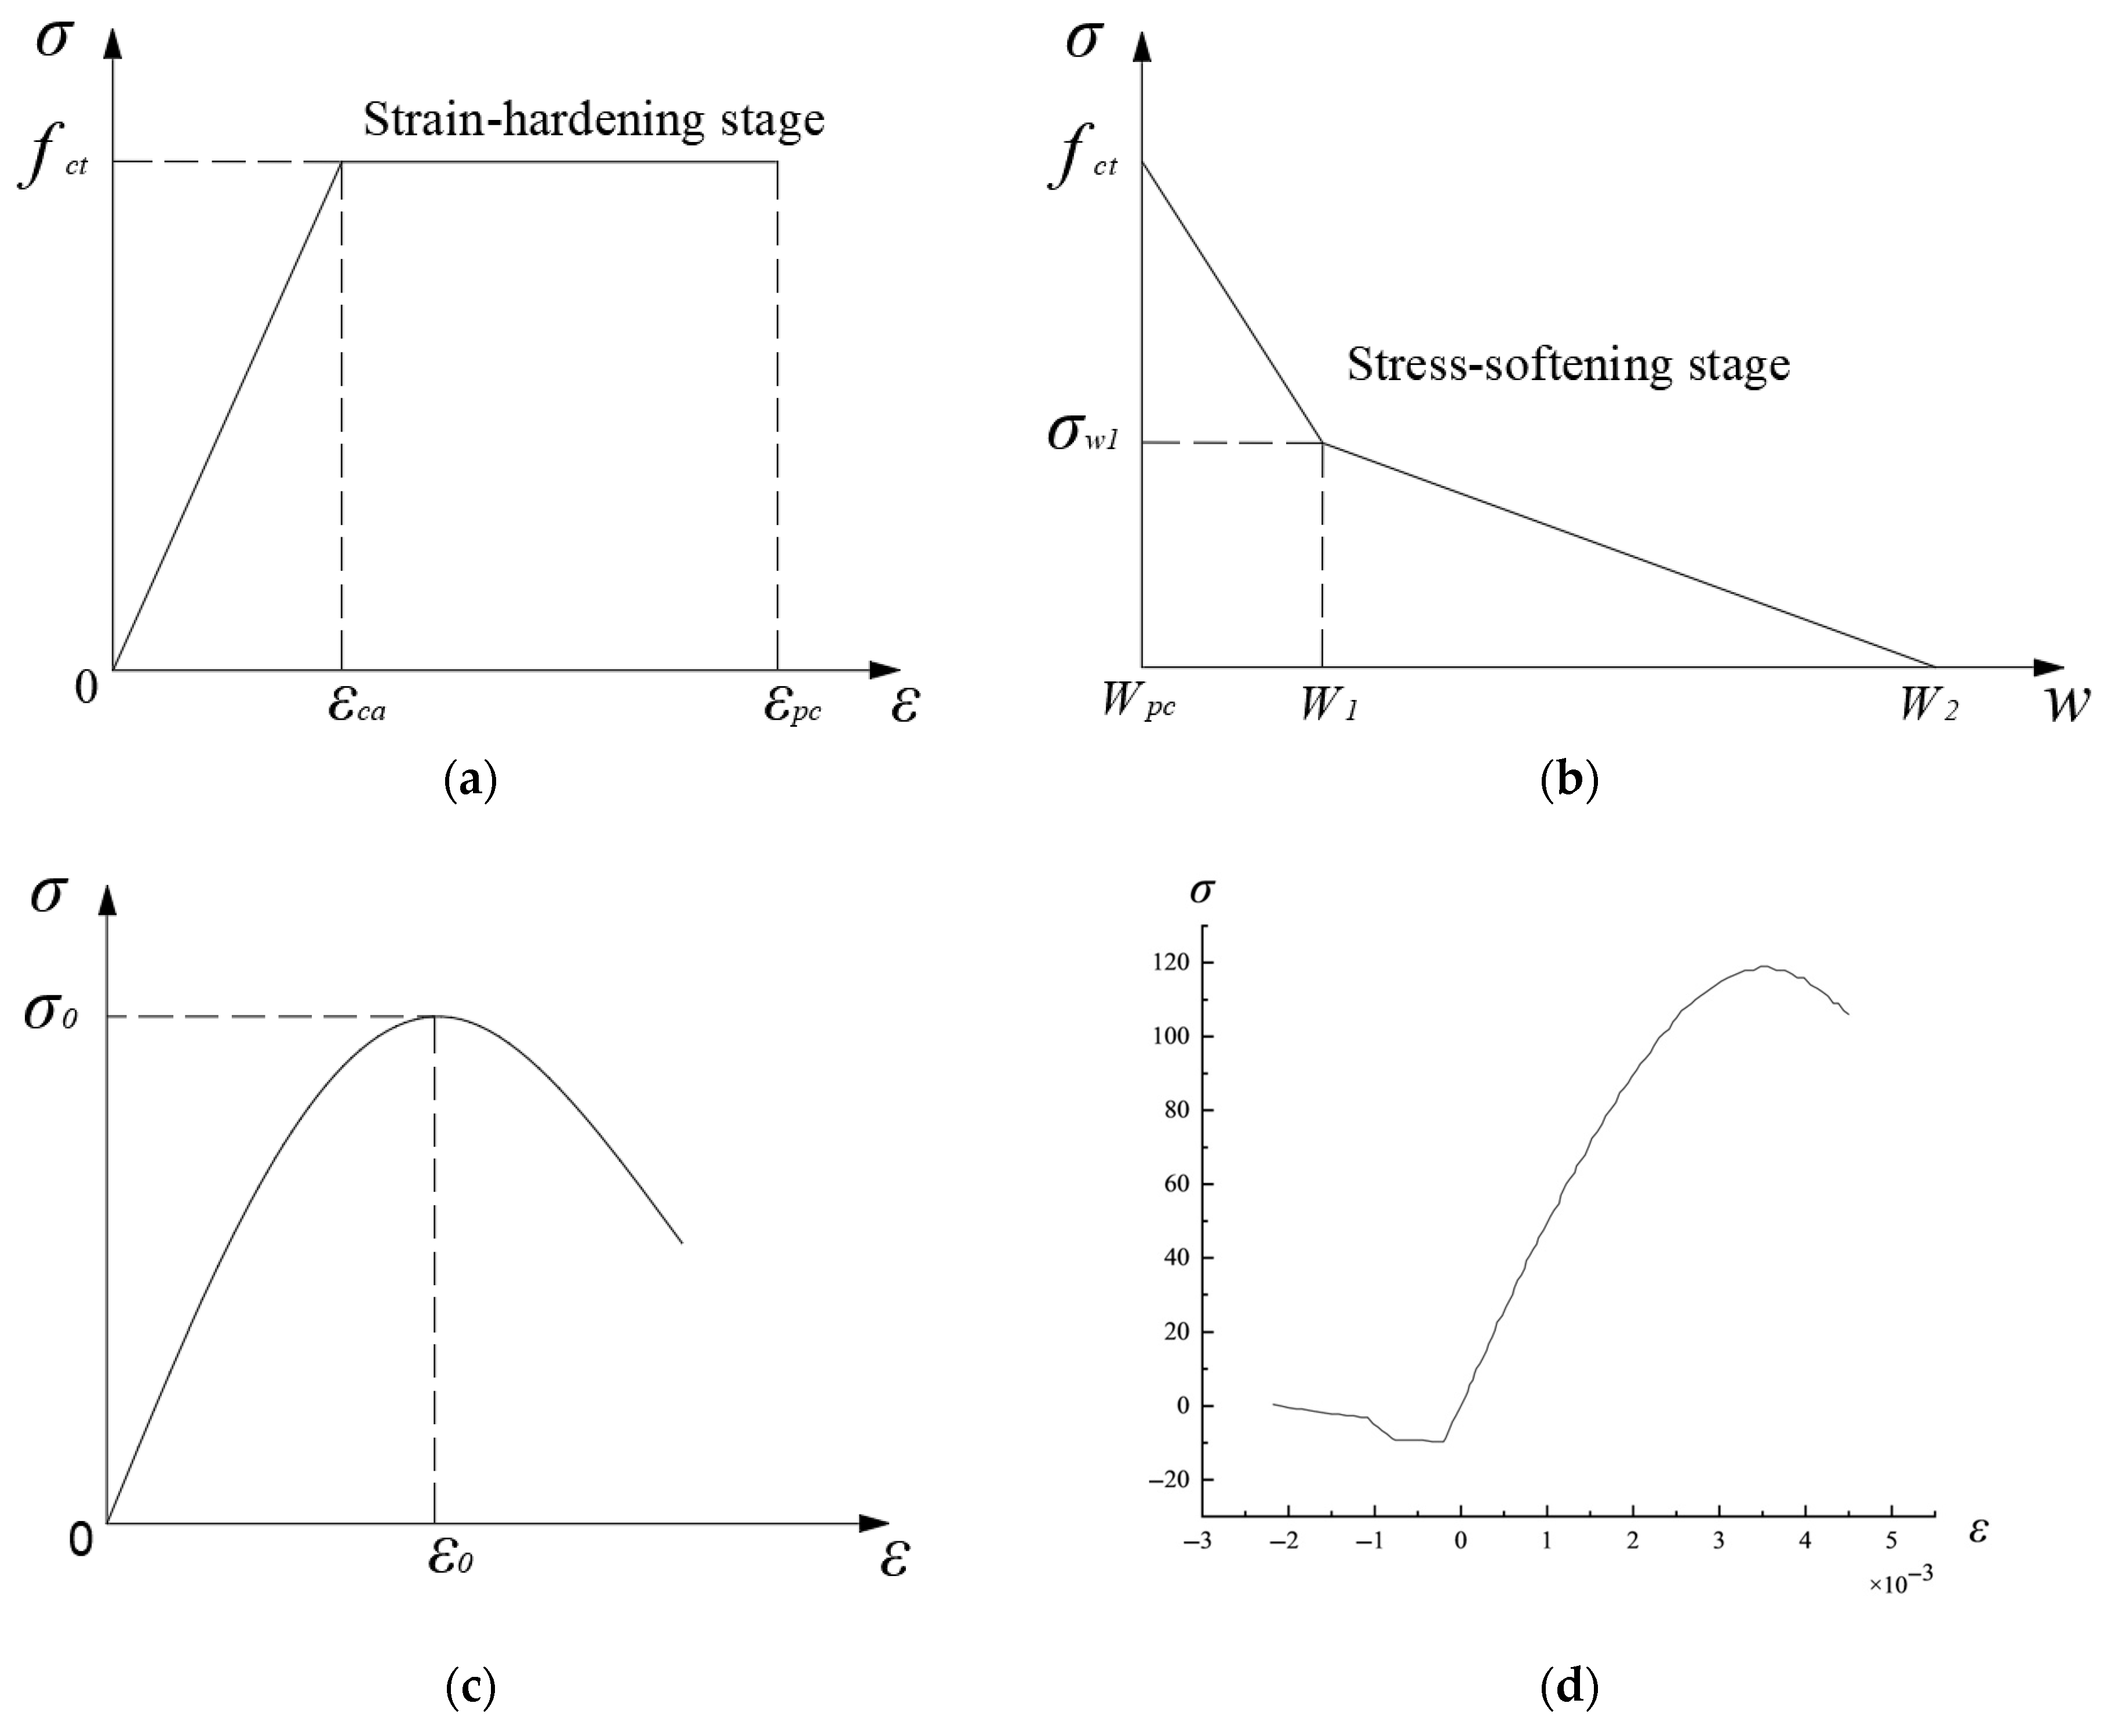
Figure 16 presents the compressive constitutive model for UHPC proposed by Yang Jian [46]. Due to the unique post-cracking strain-hardening behavior of UHPC, it can maintain a high tensile strength after cracking, and this characteristic becomes even more pronounced when reinforced. Therefore, the post-cracking strain-hardening behavior of UHPC must be considered in the flexural analysis of PUHPC-strengthened beams. In this study, the tensile constitutive relationship of UHPC is described using the bilinear model recommended in [14], with the specific expressions given in Equations (3)–(5).
Figure 16.
Ultra-high performance concrete constitutive relationship: (a) UHPC Tensile Stress–Strain Curve; (b) UHPC Tensile Stress–Strain Curve; (c) UHPC Compressive Stress–Strain Curve; (d) MATLAB Stress–Strain Curve.
Compressive Stress–Strain Relationship of UHPC.
In the equation, the ascending branch is modeled using the CEB-FIP (1993) [47] approach. , ; ; represents the axial compressive strength of UHPC; is the initial elastic modulus; and is the secant modulus at the peak stress point.
Tensile Stress–Strain Relationship of UHPC.
- Strain-Hardening Stage
- Stress-Softening Stage
In the equation, ; ; ; ; ; represents the average stress in the strain-hardening stage; and denote the crack widths at the peak stress and at fracture, respectively; and correspond to the stress and crack width at the turning point of the stress-softening stage; and is the stress at fracture.
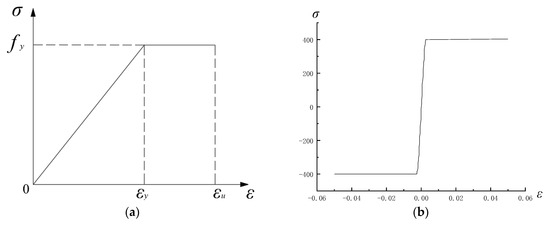
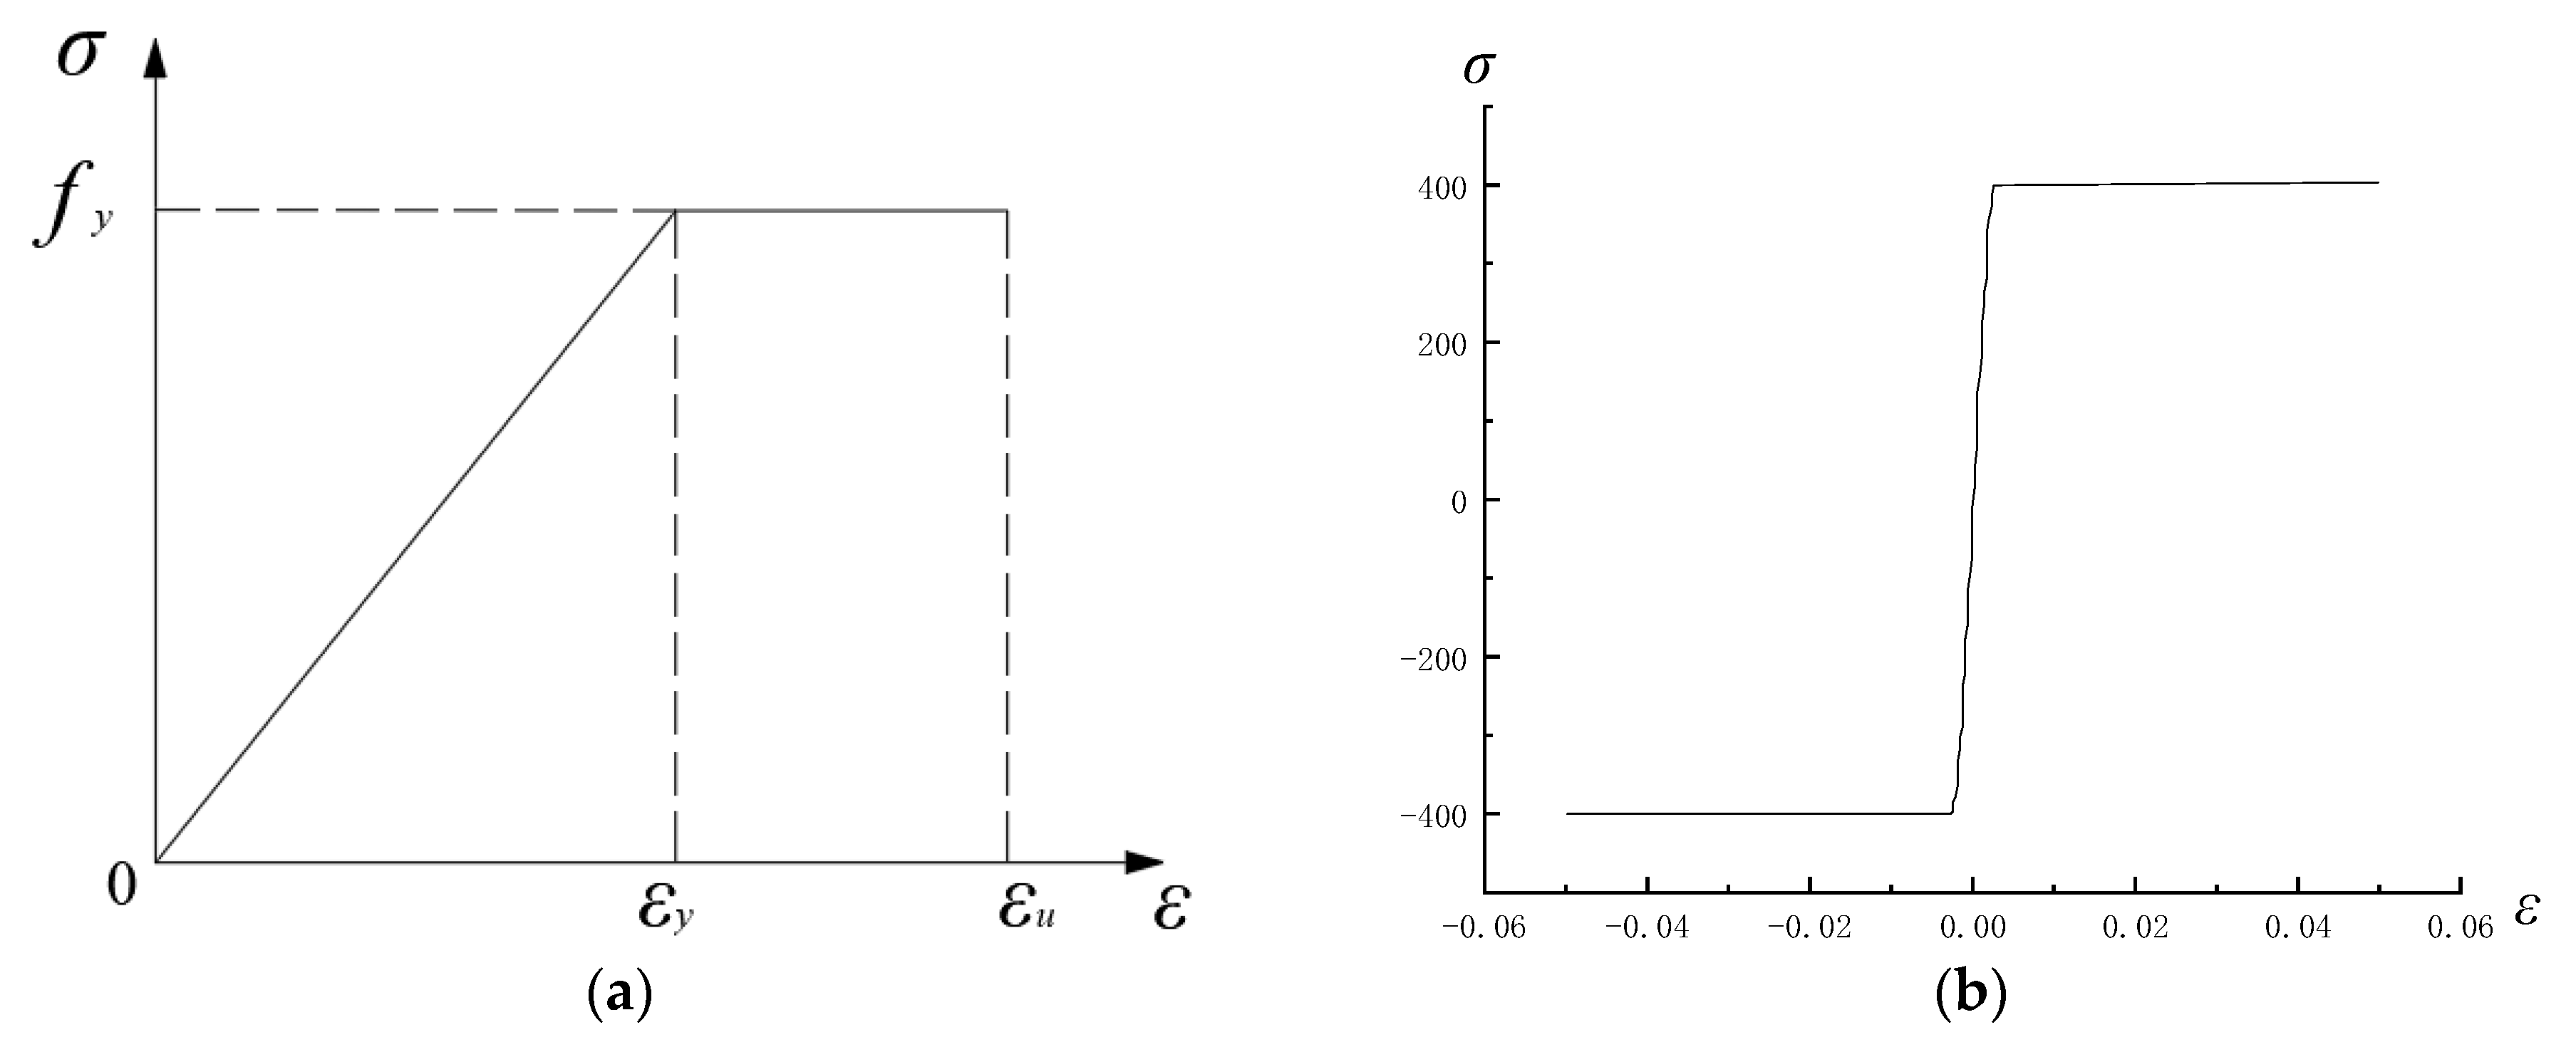
Figure 17 illustrates that the tensile and compressive constitutive behavior of reinforcing steel is modeled using an ideal elastic–plastic bilinear model. This model neglects the strain-hardening stage after yielding; that is, once the steel reaches the yield strength , the stress remains constant while the strain continues to develop. The yield strength and elastic modulus used in the model are obtained from material tests. The specific constitutive expressions are provided in Equation (6).
Figure 17.
Reinforcement constitutive relationship: (a) Stress–Strain Curve of Reinforcing Steel; (b) MATLAB Stress–Strain Curve.
Stress–Strain Relationship of Ordinary Reinforcing Steel
In the equation, represents the elastic modulus of the reinforcing steel; is the strain corresponding to steel yielding; is the strain at ultimate strength; and is the stress at yielding.
4.1.2. Numerical Analysis Program for Flexural Capacity of Rectangular Sections
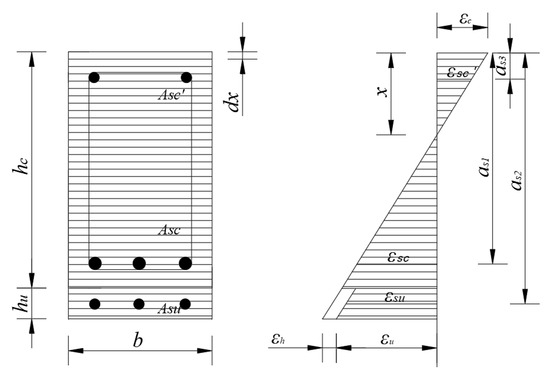
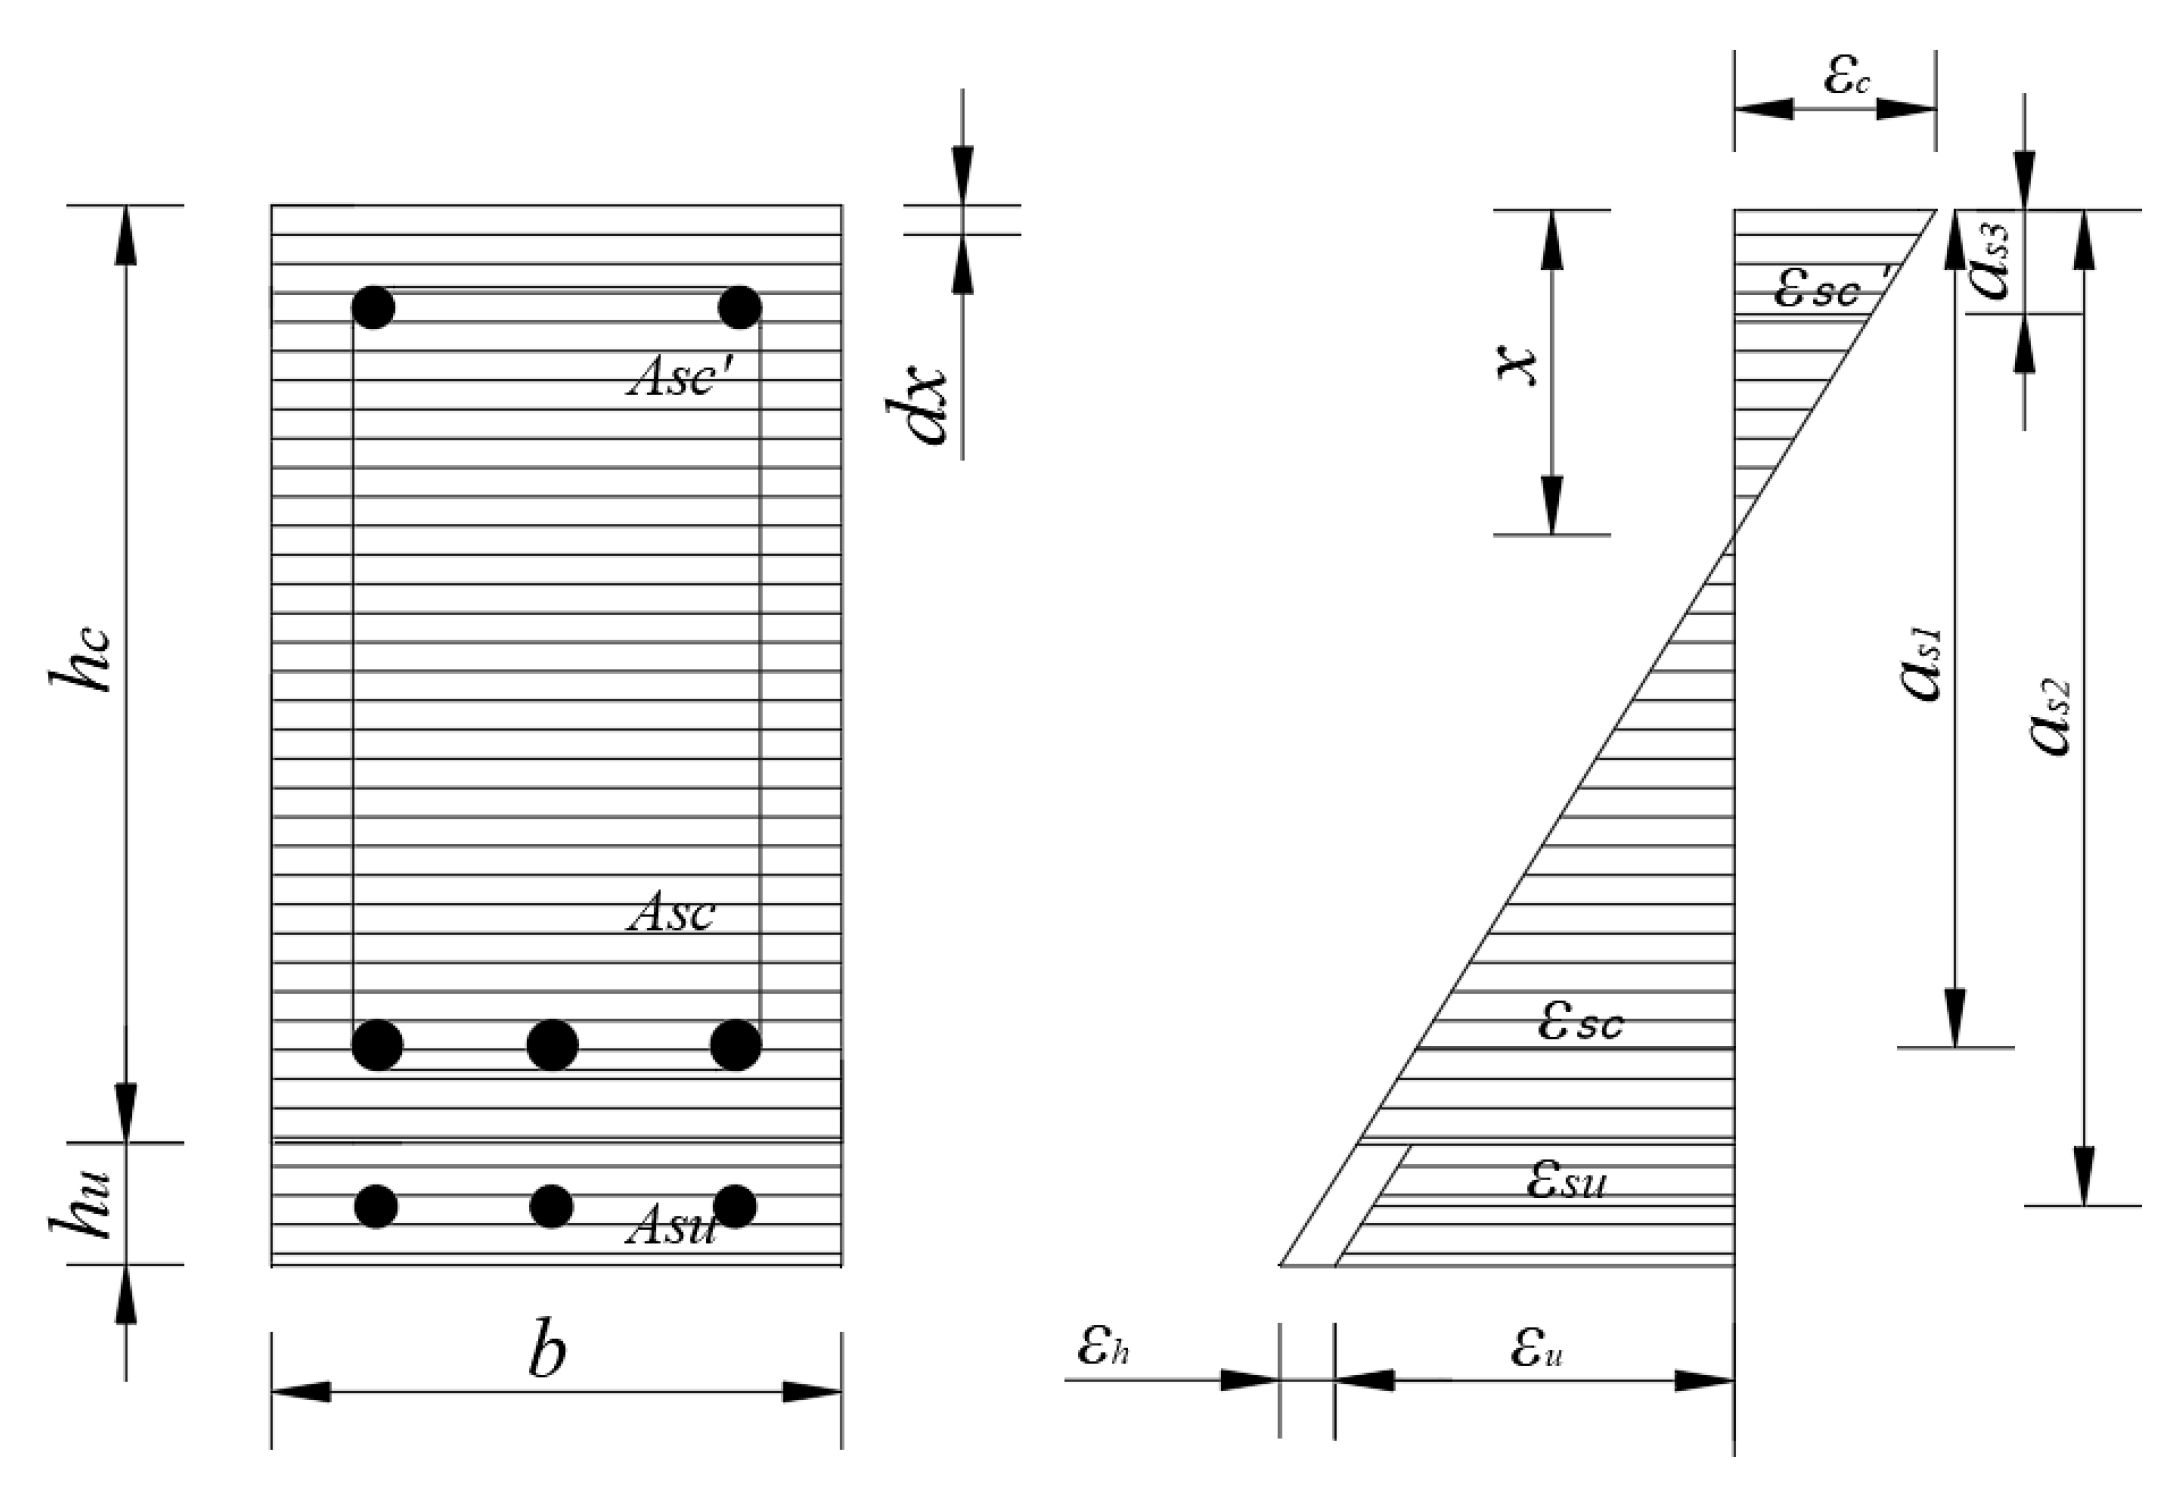
In composite RC structures strengthened with high-performance materials, the difference in elastic moduli between new and existing materials can cause incompatible deformations under bending loads, leading to interface slip. This slip primarily manifests as a strain difference between the UHPC strengthening layer and the original RC structure under load. Based on the aforementioned theoretical assumptions, Figure 18 illustrates the strain and stress distribution across the section.
Figure 18.
Cross-section strain distribution diagram.
According to the sectional strain distribution in Figure 17, when the section is divided into n layers of fiber elements along its height, the strain compatibility condition can be expressed by Equation (7):
where is the compressive strain of concrete; is the strain of the tensile steel in the original member; is the strain of the steel in the strengthening layer; is the strain of the UHPC; is the strain difference caused by interface slip; is the distance from the tensile steel in the original member to the neutral axis; is the distance from the steel in the strengthening layer to the neutral axis; is the height of the neutral axis; is the thickness of the UHPC strengthening layer; and b is the section width.
The internal force equilibrium conditions can be expressed by Equations (8)–(10):
where is the cross-sectional area of the longitudinal tensile steel in the original member; is the cross-sectional area of the additional steel in the UHPC strengthening layer; is the cross-sectional area of the longitudinal compressive steel in the original member; is the compressive stress of the ith layer of concrete; is the compressive stress of the steel in the compressive zone of the concrete; is the tensile stress of the steel in the tensile zone of the concrete; is the tensile stress of the steel in the UHPC; is the tensile stress of the UHPC in the strengthening layer; and is the width of the ith fiber strip.
Based on the principle of moment equilibrium, the formula for calculating the flexural capacity of the structure is derived as shown in Equation (11):
where is the height of the ith fiber strip, and is the distance from the compressive steel in the original member to the neutral axis.
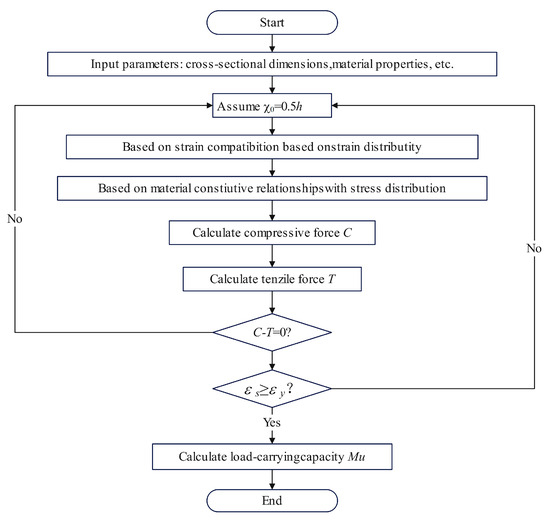
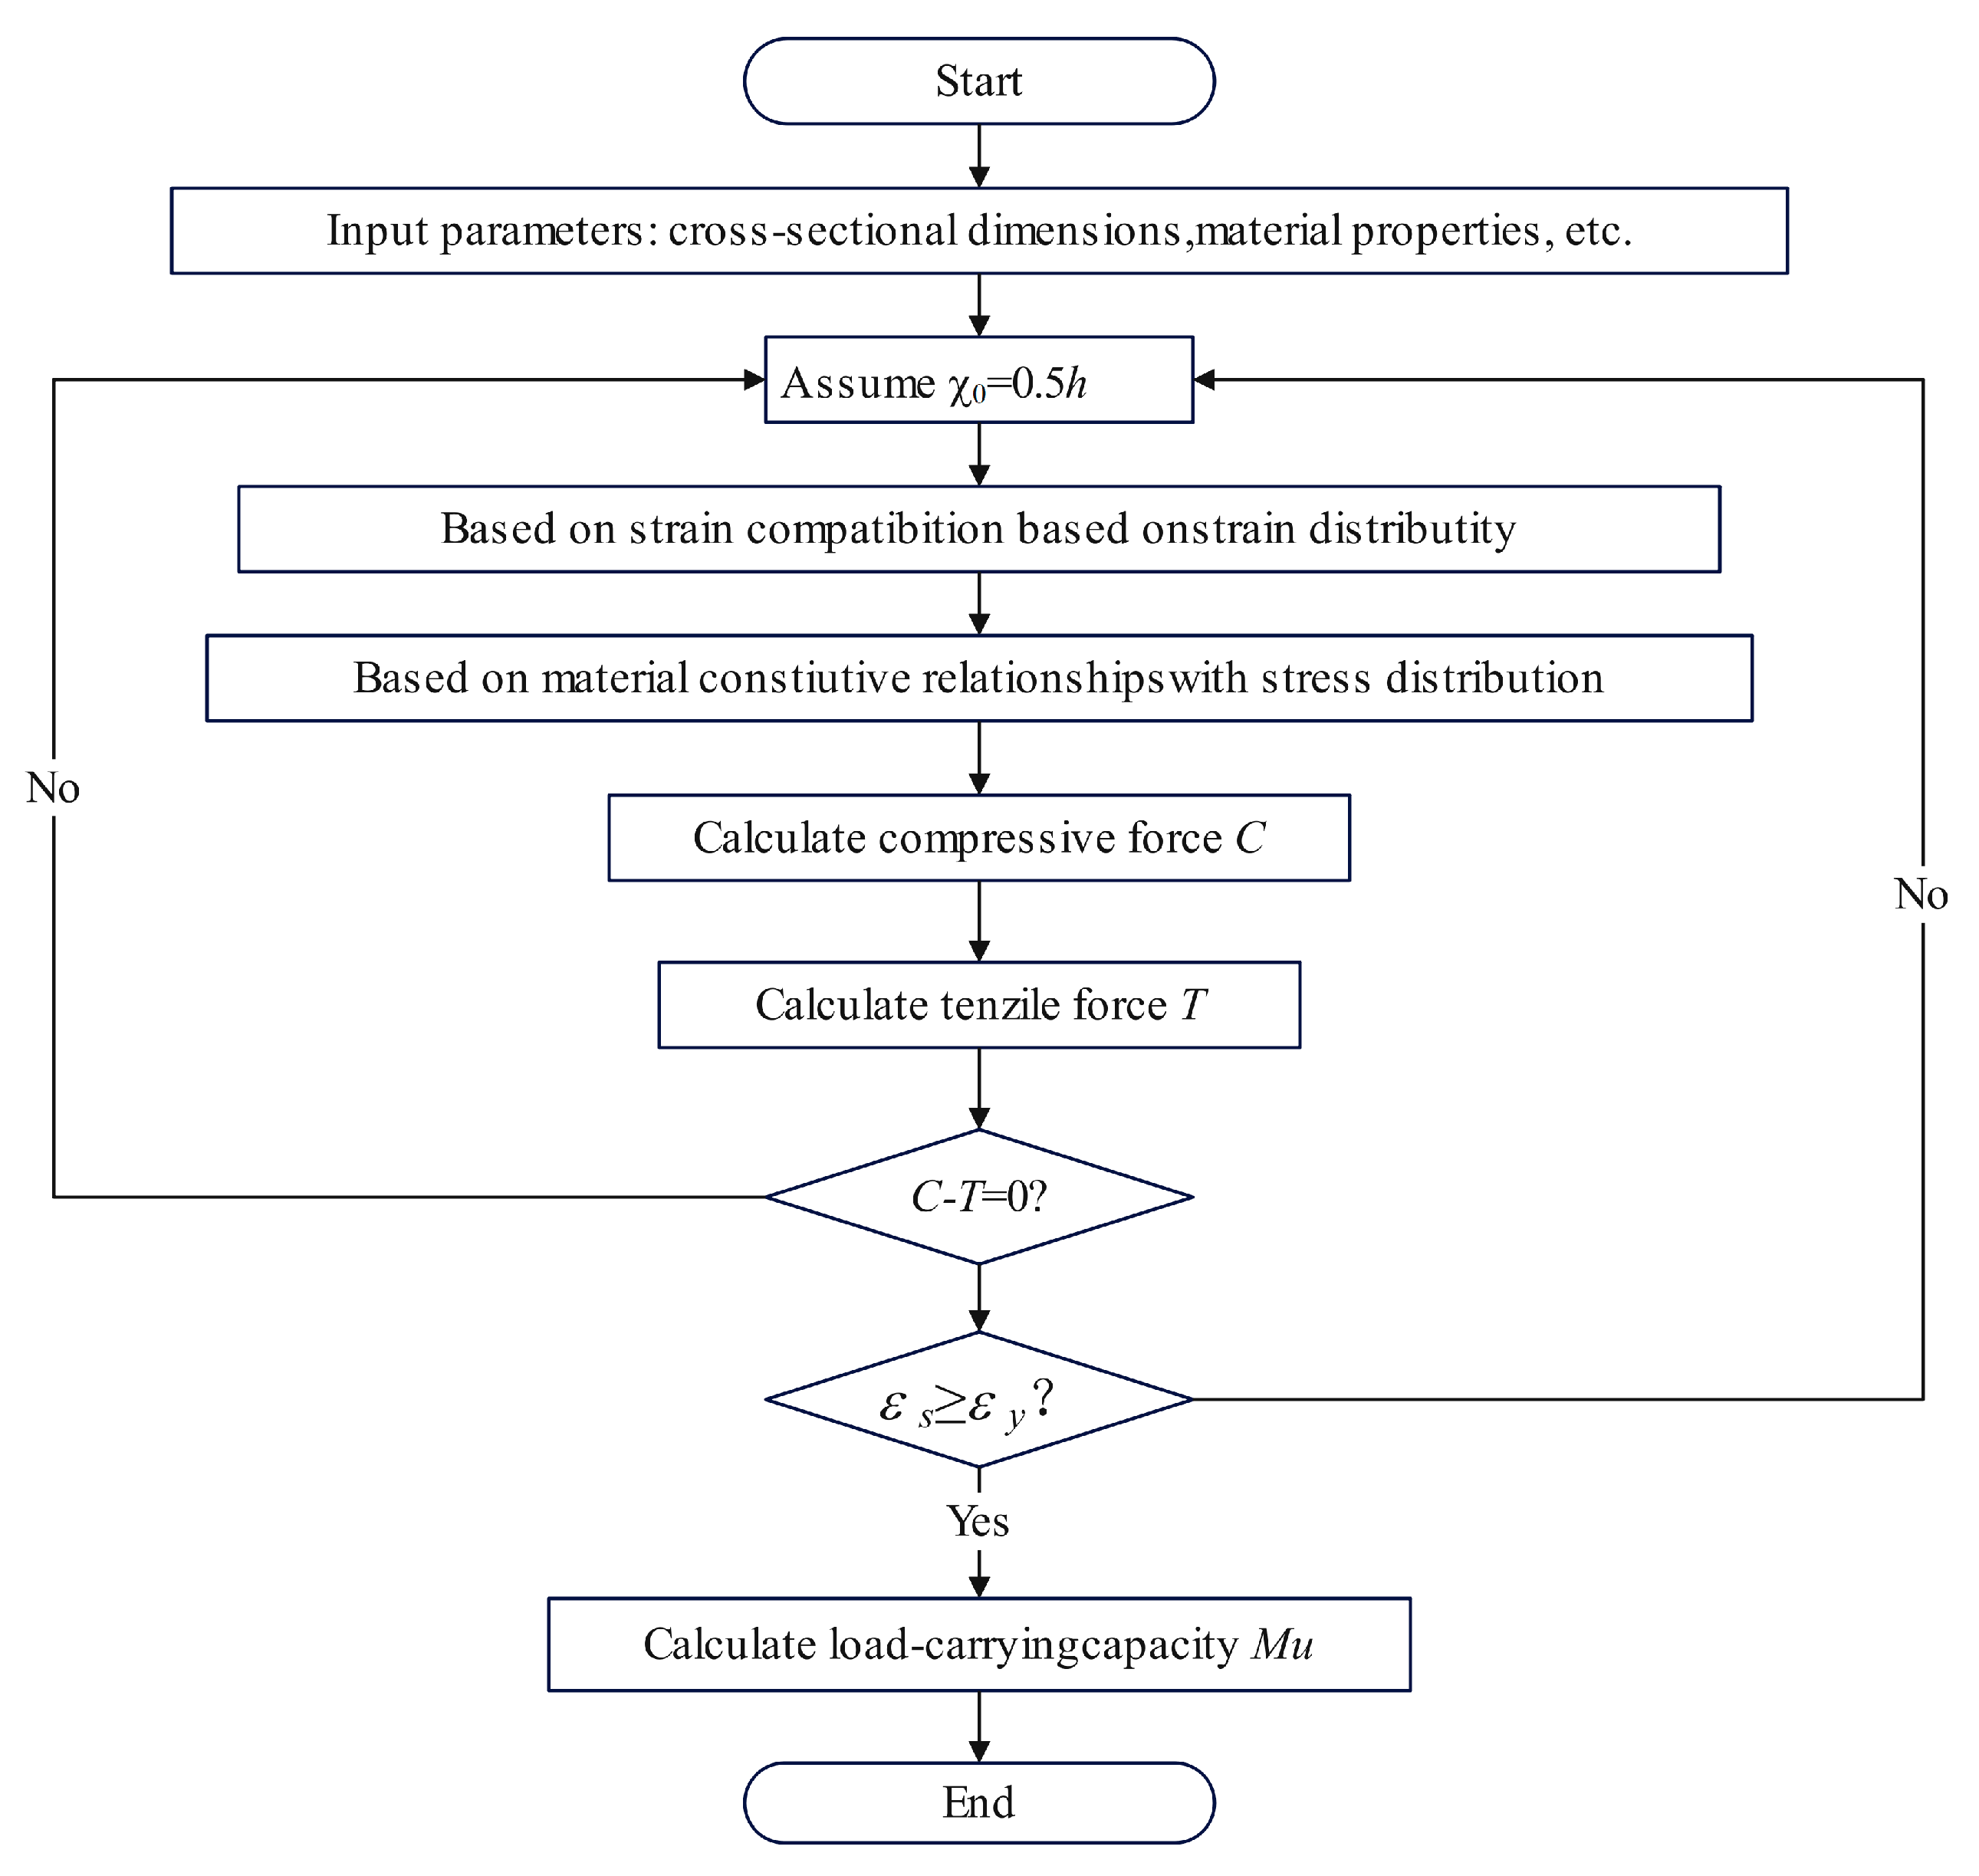
Based on the above theoretical analysis, a numerical analysis program was developed to calculate the flexural capacity of RC beams strengthened with reinforced UHPC thin layers. The detailed calculation procedure is shown in Figure 19.
Figure 19.
Numerical analysis program diagram.
4.2. Analysis Results Verification
4.2.1. Analysis and Verification of the Control Beam (CB) Results
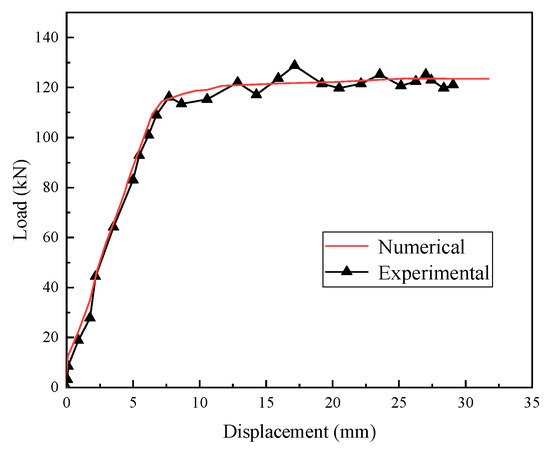
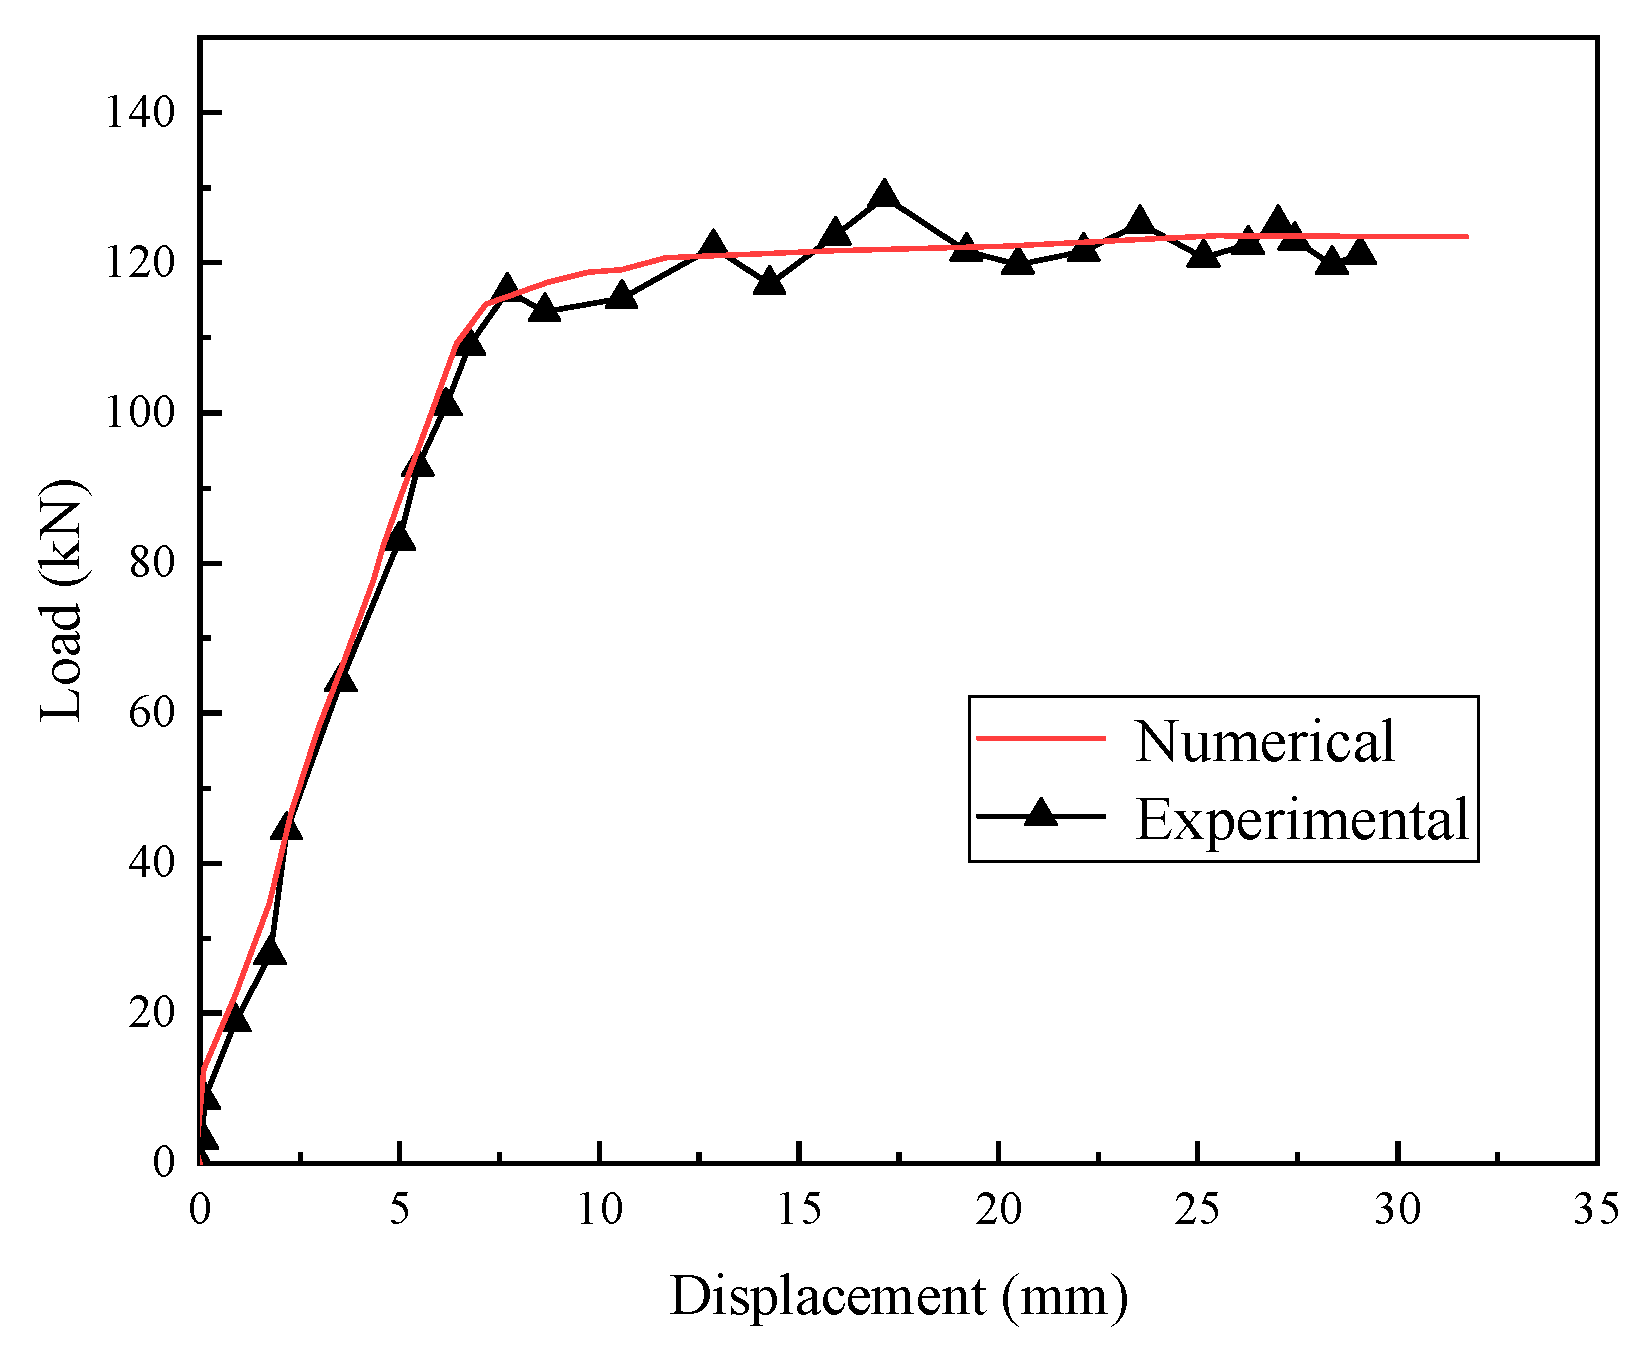
The load–deflection response serves as a crucial indicator for assessing the flexural performance of reinforced concrete (RC) members and provides a means to validate the accuracy of nonlinear analyses. Figure 20 compares the experimentally measured and numerically predicted load–deflection curves of the control beam (CB). The results demonstrate a close agreement in both the overall deformation behavior and flexural stiffness, confirming the reliability of the numerical model.
Figure 20.
The comparison chart of the CB beam test results and the numerical simulation load–deflection curve.
The theoretical values and the characteristic load values of the CB beam are presented in Table 10. The yield load corresponds to the load at which the reinforcement first yields, while the ultimate load represents the peak capacity calculated theoretically. The comparison indicates that the discrepancy between the numerical and experimental results is within 5%, thereby validating the appropriateness of the selected constitutive models for concrete and reinforcement.
Table 10.
Comparative analysis of CB beam’s numerical simulation and experimental load characteristic values.
In Table 10, .
4.2.2. Analysis and Verification of the UCF Group Results
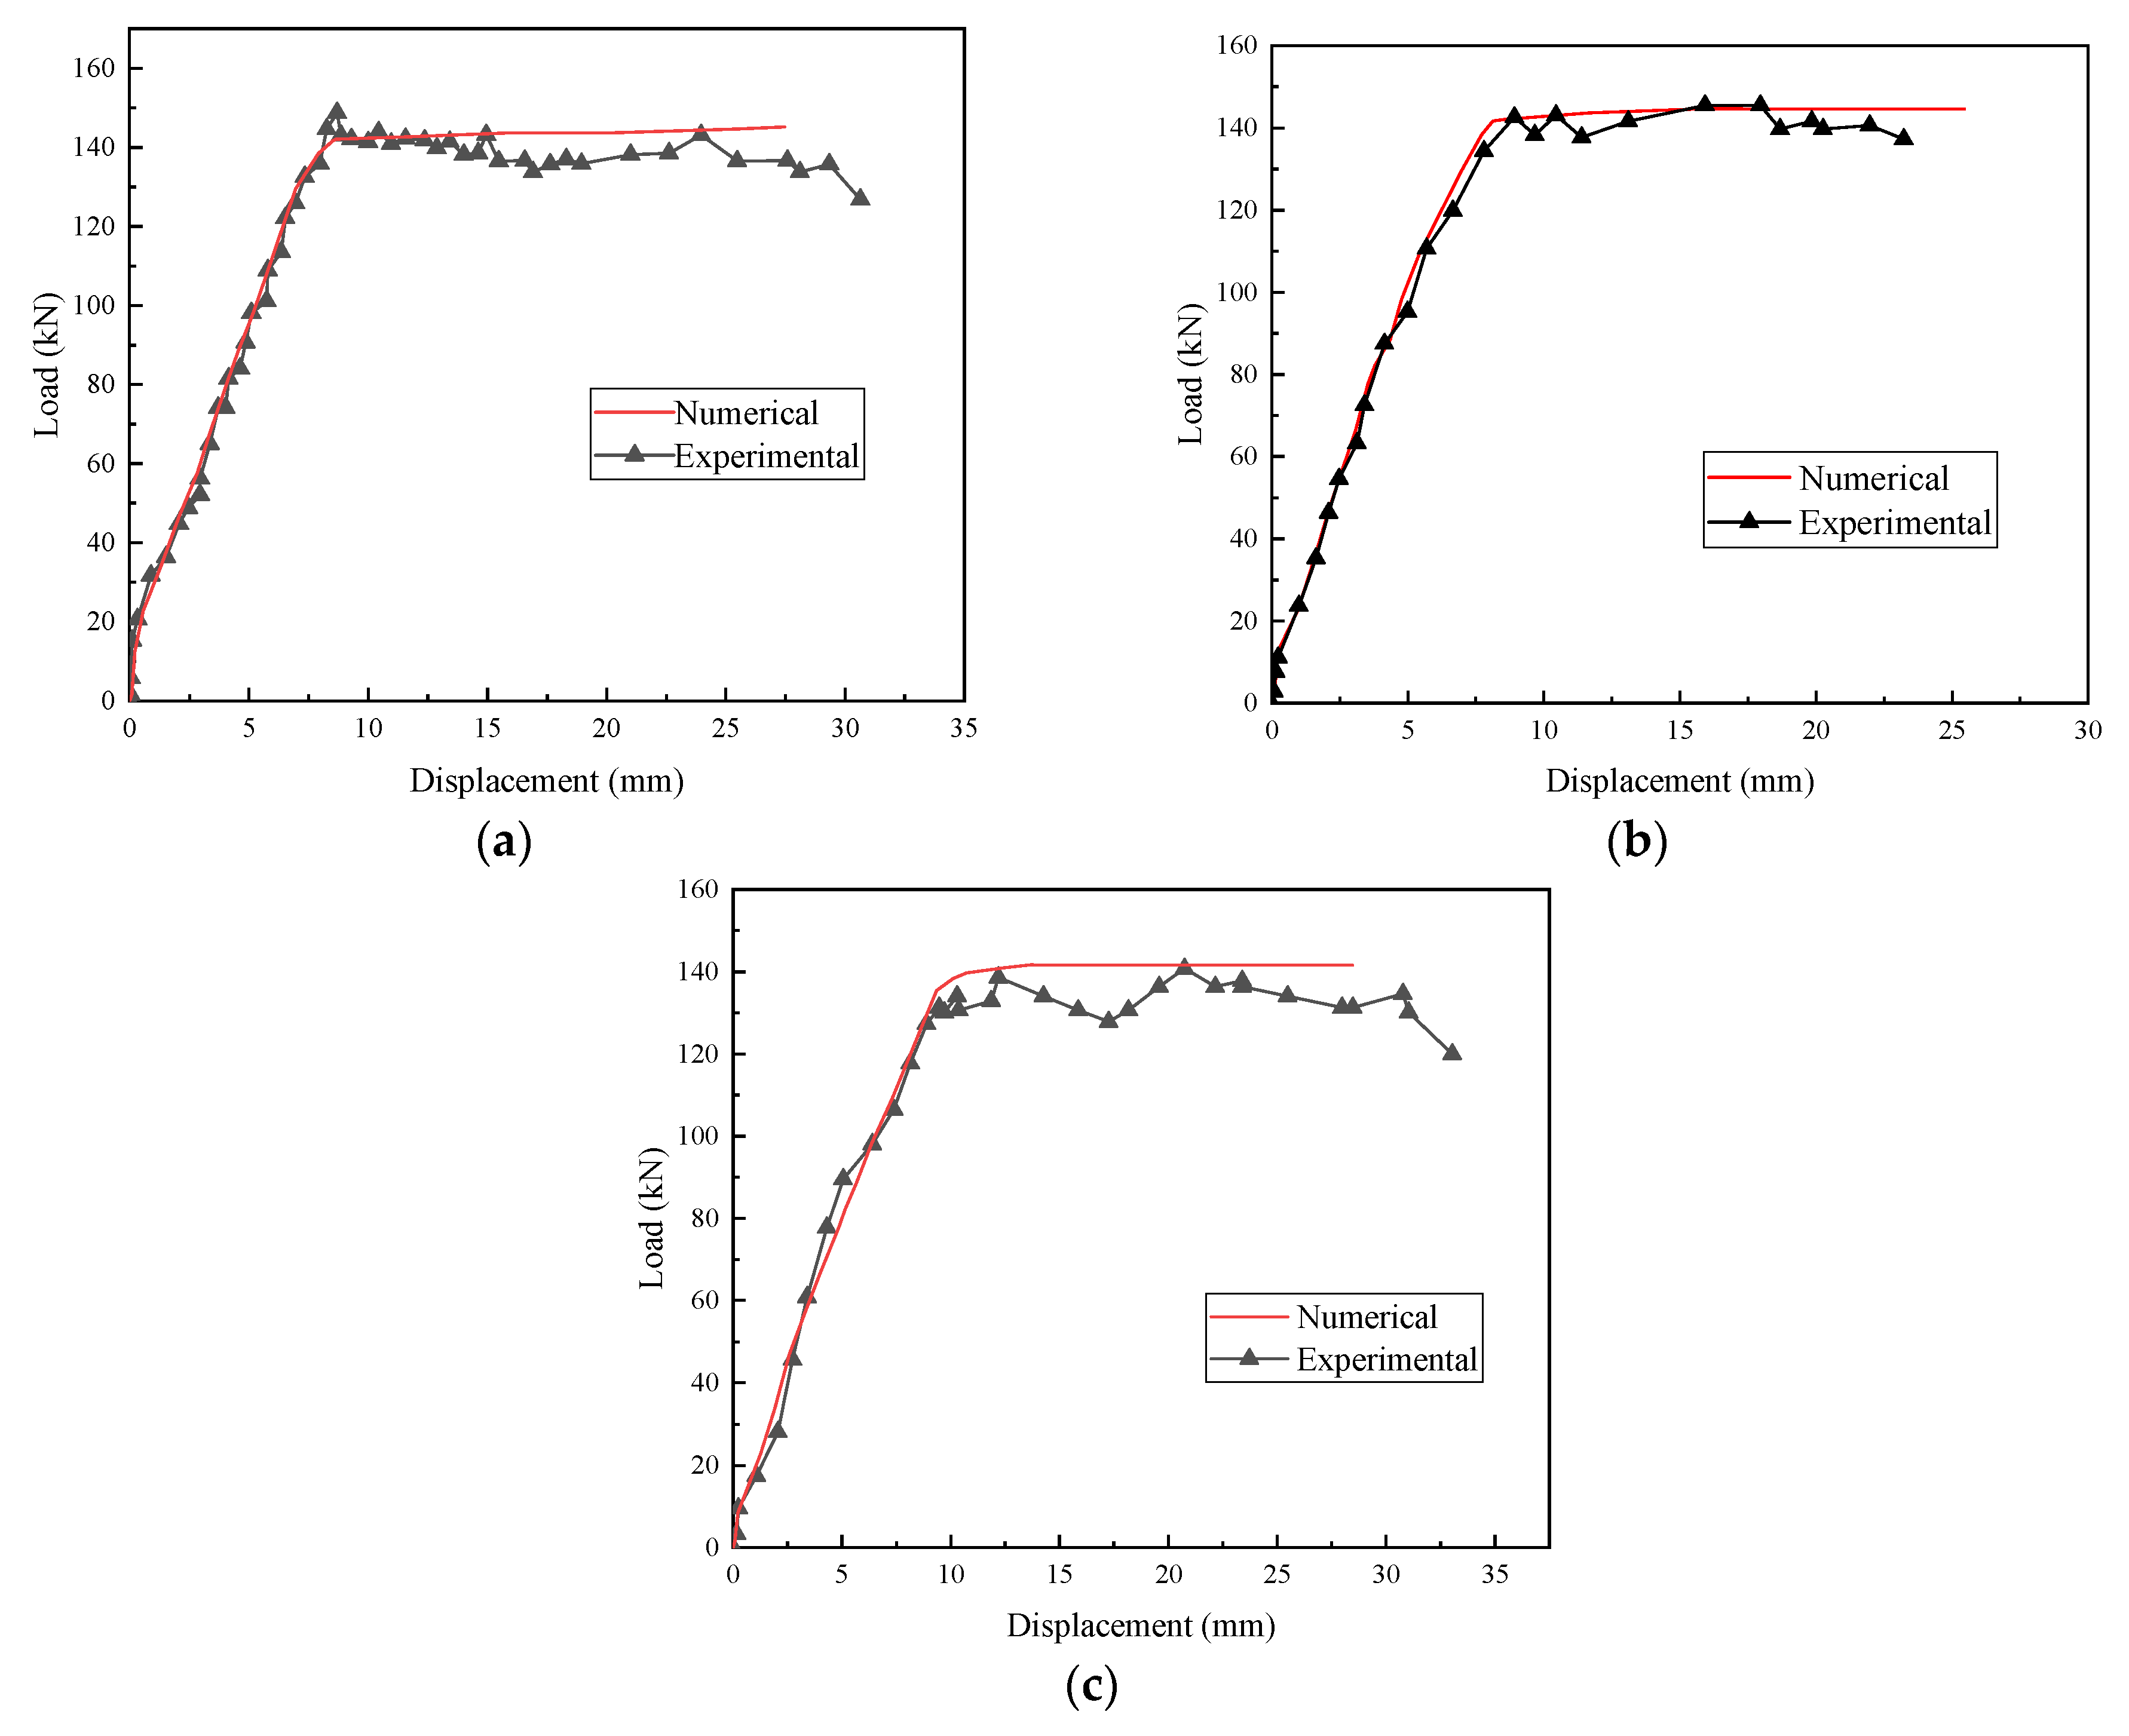
Figure 21 presents the load–deflection curves during the loading process for the UCF-1, UCF-2, and UCF-3 test beams, compared with the results from the nonlinear analysis program. The numerical predictions show a good agreement with the experimental data in terms of the load–displacement behavior, and the flexural stiffness of both is essentially consistent.
Figure 21.
Comparative analysis of experimental results and numerical simulation load–deflection curves for the UCF test group: (a) UCF-1; (b) UCF-2; (c) UCF-3.
The theoretical values and the characteristic load values of the UCF-1, UCF-2, and UCF-3 beams are presented in Table 11. The yield load corresponds to the load at which the reinforcement first yields, while the ultimate load represents the peak capacity calculated theoretically. The comparison indicates that the discrepancy between the numerical predictions and the experimental values is within 5%, thereby validating the appropriateness of the selected constitutive models for both concrete and reinforcement. In Table 11, .
Table 11.
Comparison results of UCF group numerical analysis and test load characteristic values.
4.2.3. Analysis and Verification of the UCS Group Results
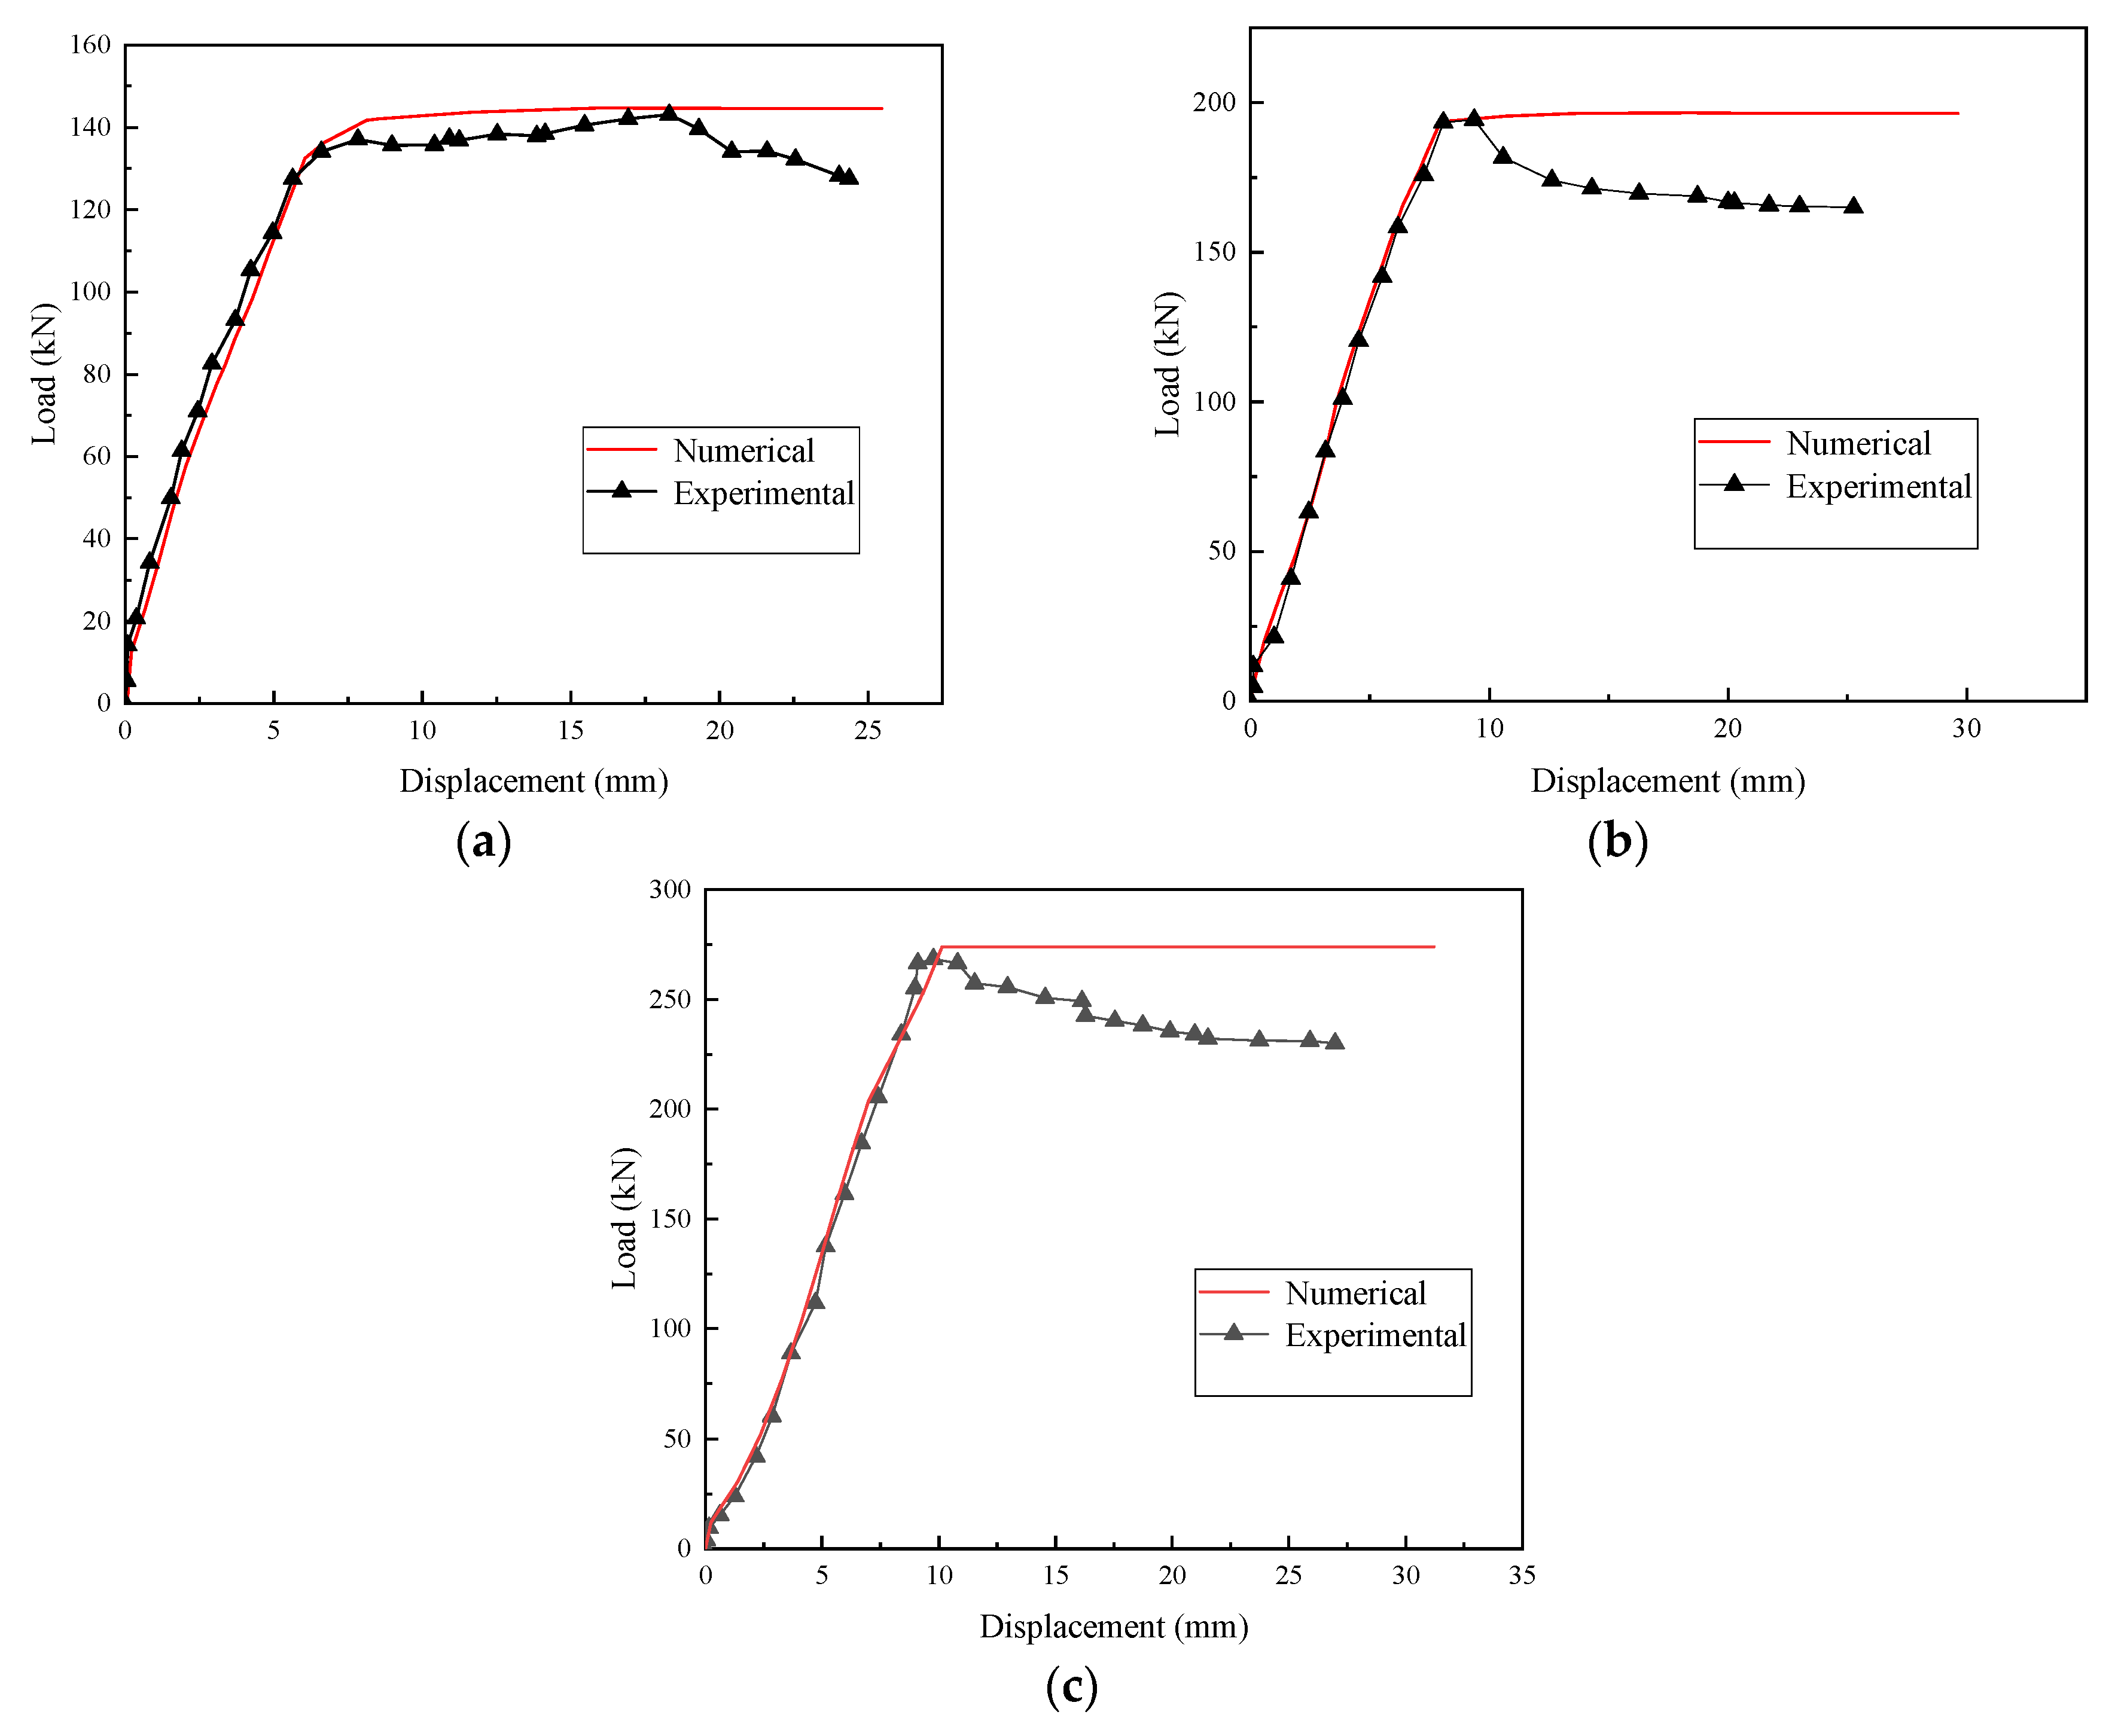
Figure 22 presents the load–deflection curves during the loading process for the UCS-1.26, UCS-1.70, and UCS-2.24 test beams, compared with the results from the nonlinear analysis program. The numerical predictions show a good agreement with the experimental data in terms of the load–displacement behavior, and the flexural stiffness of both is essentially consistent.
Figure 22.
Comparative analysis of experimental results and numerical simulation load–deflection curves for the UCS test group: (a) UCS-1.26; (b) UCS-1.70; (c) UCS-2.24.
The theoretical values and the characteristic load values of the UCS-1.26, UCS-1.70, and UCS-2.24 beams are presented in Table 12. The yield load corresponds to the load at which the reinforcement first yields, while the ultimate load represents the peak capacity calculated theoretically. The comparison indicates that the discrepancy between the numerical predictions and the experimental values is within 5%, thereby validating the appropriateness of the selected constitutive models for both concrete and reinforcement.
Table 12.
Comparison results of UCS group numerical analysis and test load characteristic values.
In Table 12, .
4.2.4. Analysis and Verification of the UCH Group Results
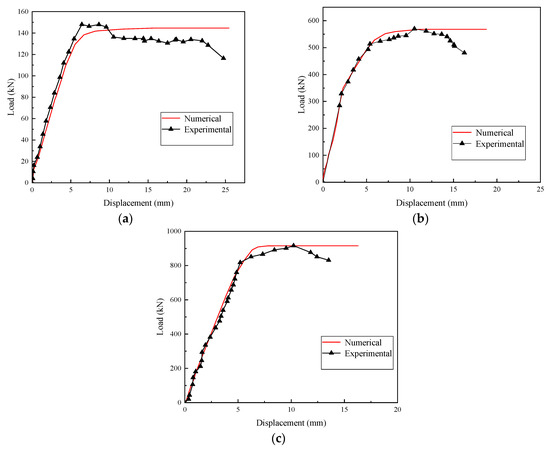
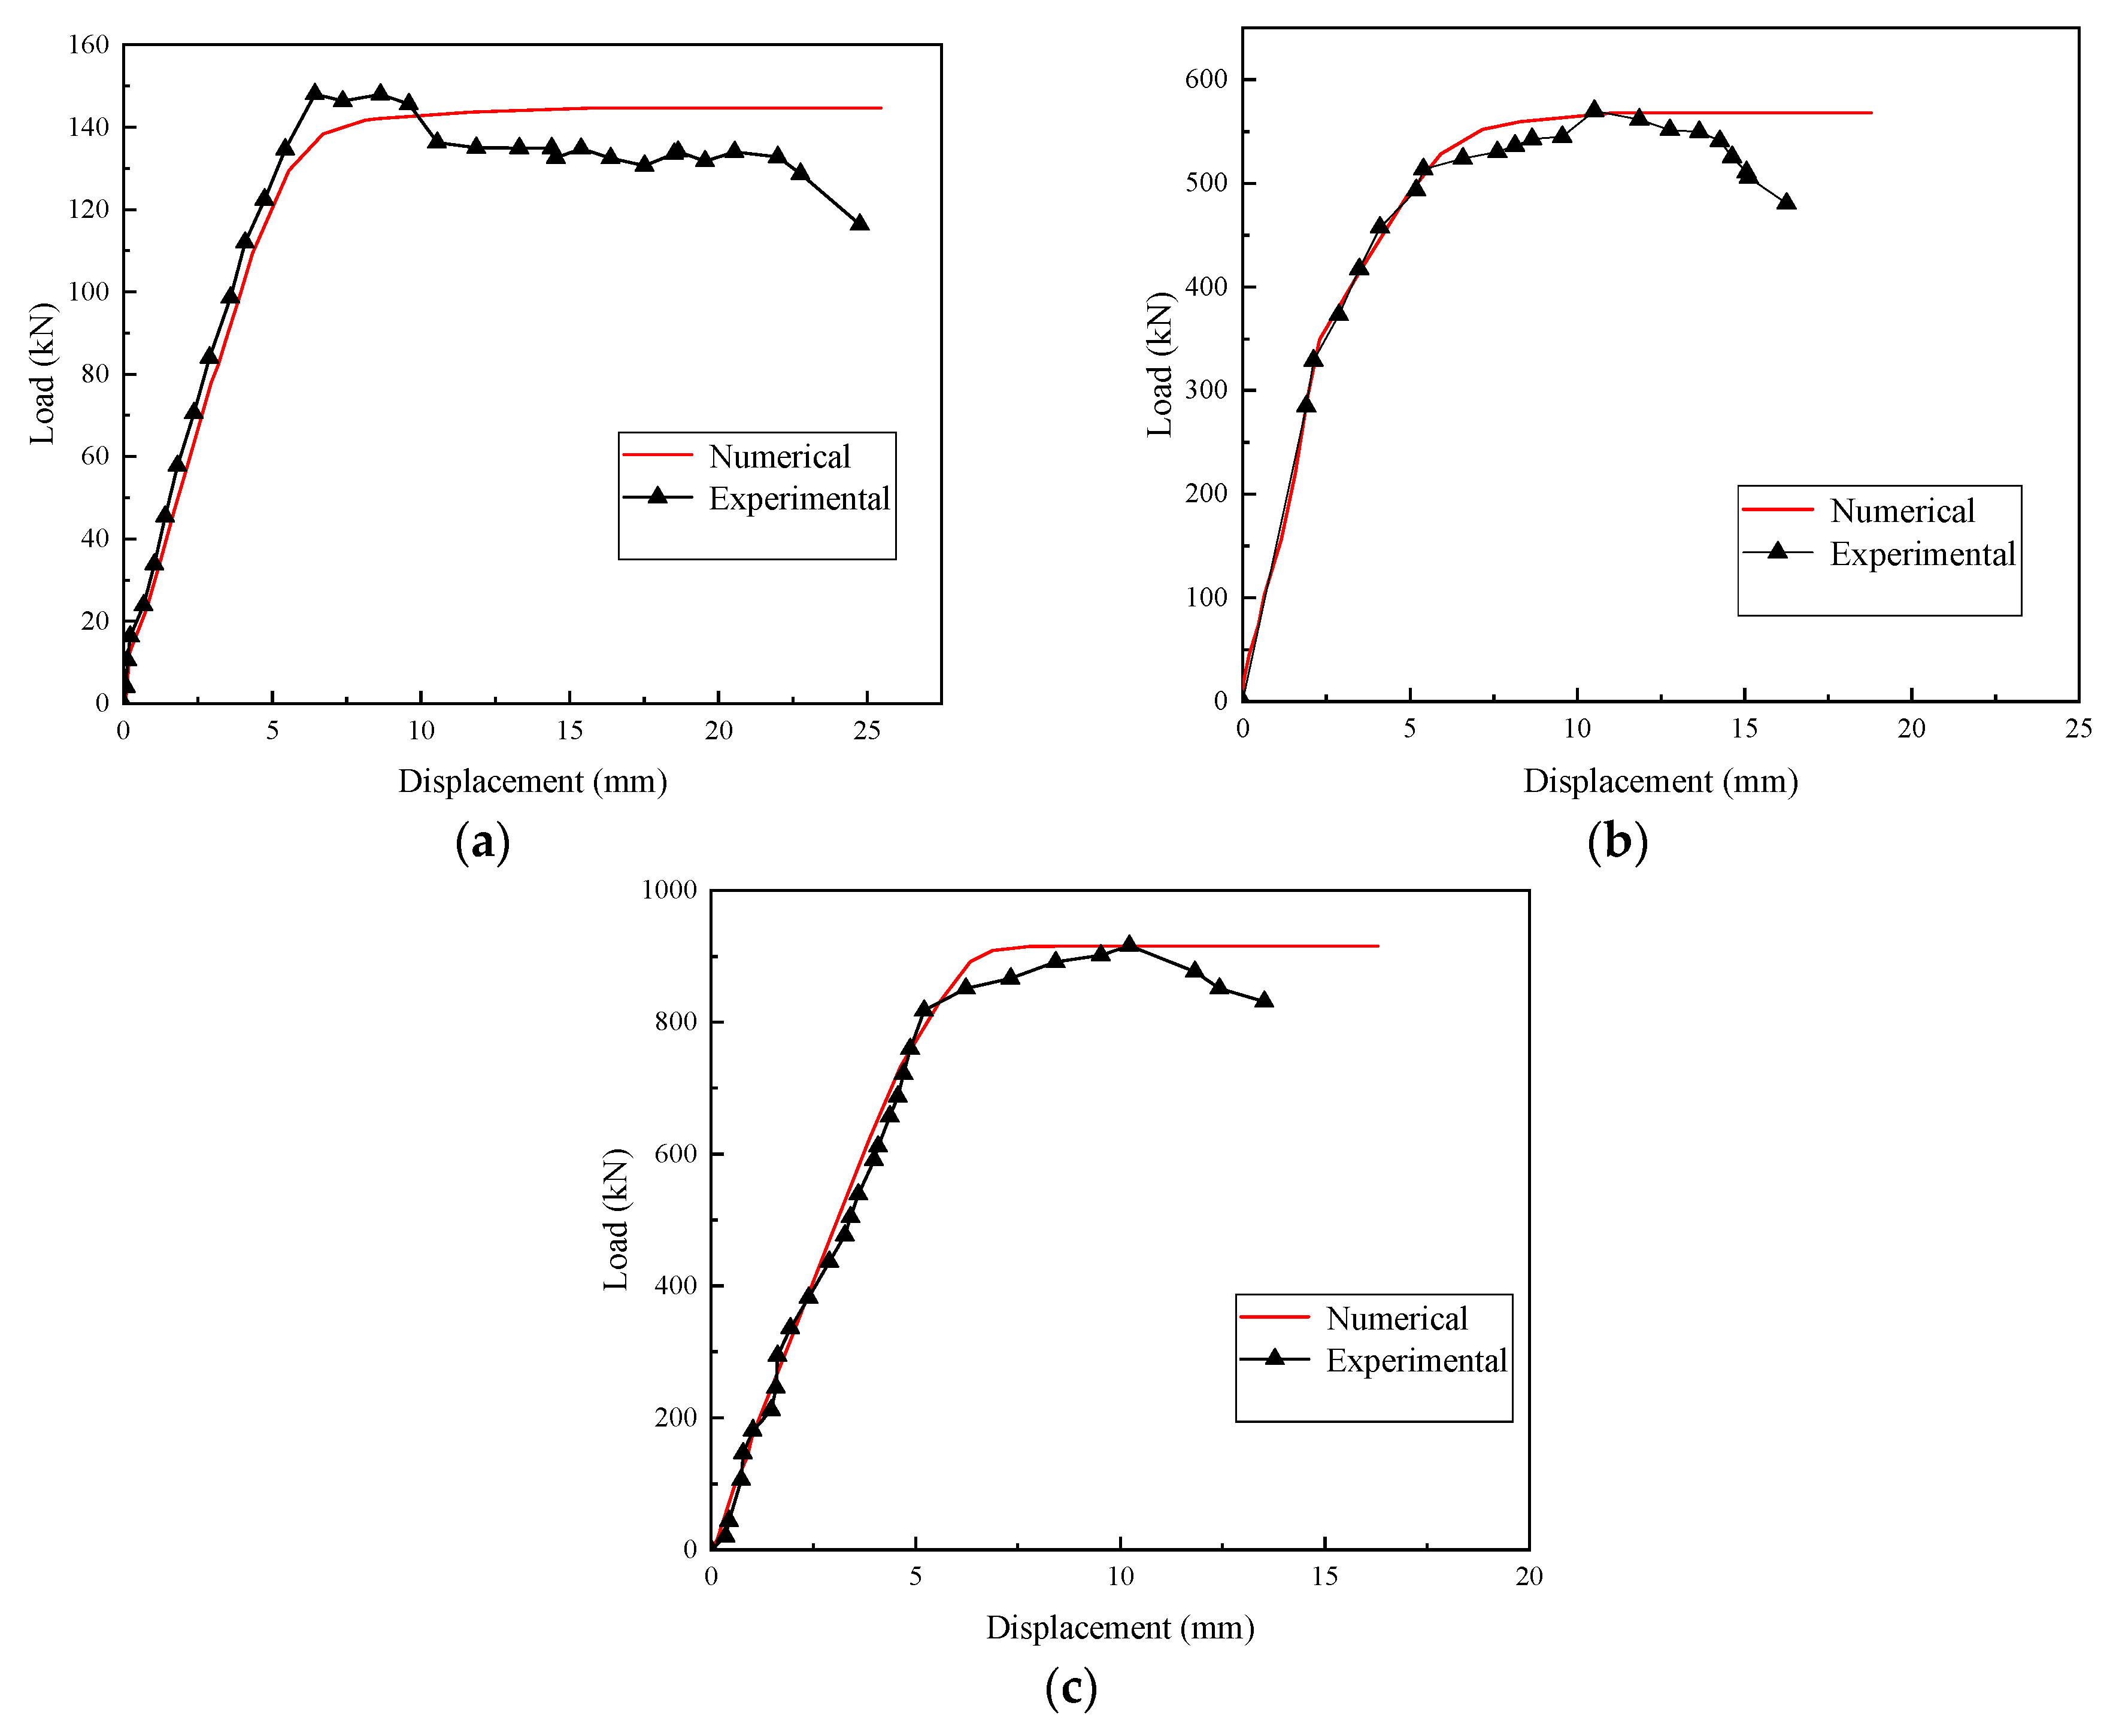
Figure 23 presents the load–deflection curves during the loading process for the UCH-250, UCH-470, and UCH-640 test beams, compared with the results from the nonlinear analysis program. The numerical predictions show a good agreement with the experimental data in terms of the load–displacement behavior, and the flexural stiffness of both is essentially consistent.
Figure 23.
Comparative analysis of experimental results and numerical simulation load–deflection curves for the UCH test group: (a) UCH-250; (b) UCH-470; (c) UCH-640.
In Table 13, .
Table 13.
Comparison results of UCH group numerical analysis and test load characteristic values.
4.3. Parametric Analysis
Due to limitations in the experimental setup, this study conducts a parametric analysis of the UHPC strengthening technique using nonlinear numerical simulations. The analysis focuses on three key parameters—beam height, reinforcement ratio, and interface slip—to investigate their effects on the flexural strengthening performance, thereby complementing the experimental study.
Studies have shown that as the beam height increases, the proportion of a UHPC strengthening layer of the same thickness within the composite section decreases, which may affect the contribution of the UHPC layer to the overall load-bearing capacity. To address this, numerical models with varying parameters were established: RC beams with heights ranging from 100 mm to 640 mm, reinforcement ratios from 0.5% to 5%, and a uniform UHPC strengthening layer thickness of 40 mm. In addition, the effects of interface bond performance on the strengthening behavior were quantified using an interface efficiency coefficient and a treatment factor , providing a more reliable theoretical basis for engineering applications. In the parametric sensitivity analysis, only one study parameter was varied at a time, while the other fixed parameters were maintained consistent with the reference beam (CB). The specific baseline parameters were: a beam height of 250 mm, a reinforcement ratio of 1.47%, and interface coefficients and both set to 0 (representing the perfect bond condition).
Based on the developed numerical analysis program, this study systematically investigated the interface parameters between the post-cast UHPC strengthening layer and ordinary concrete. The specific values of the design parameters are detailed in Table 14.
Table 14.
The values of design parameters.
Here, ; is the strain at which interface slip initiates; is the strain at the ultimate interface slip when the strengthening layer ceases to contribute; is the ratio between the strain in the reinforcement of the strengthening layer caused by interface slip and the original strain.
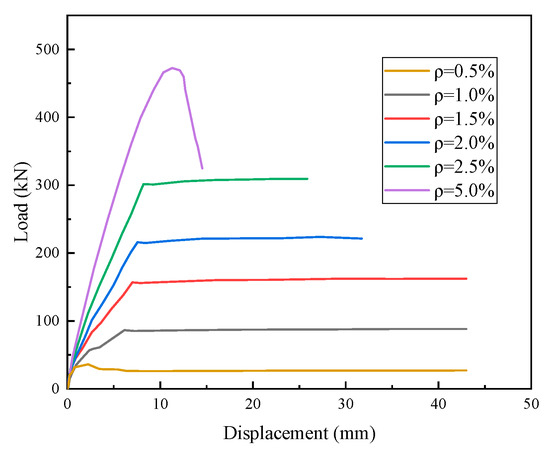
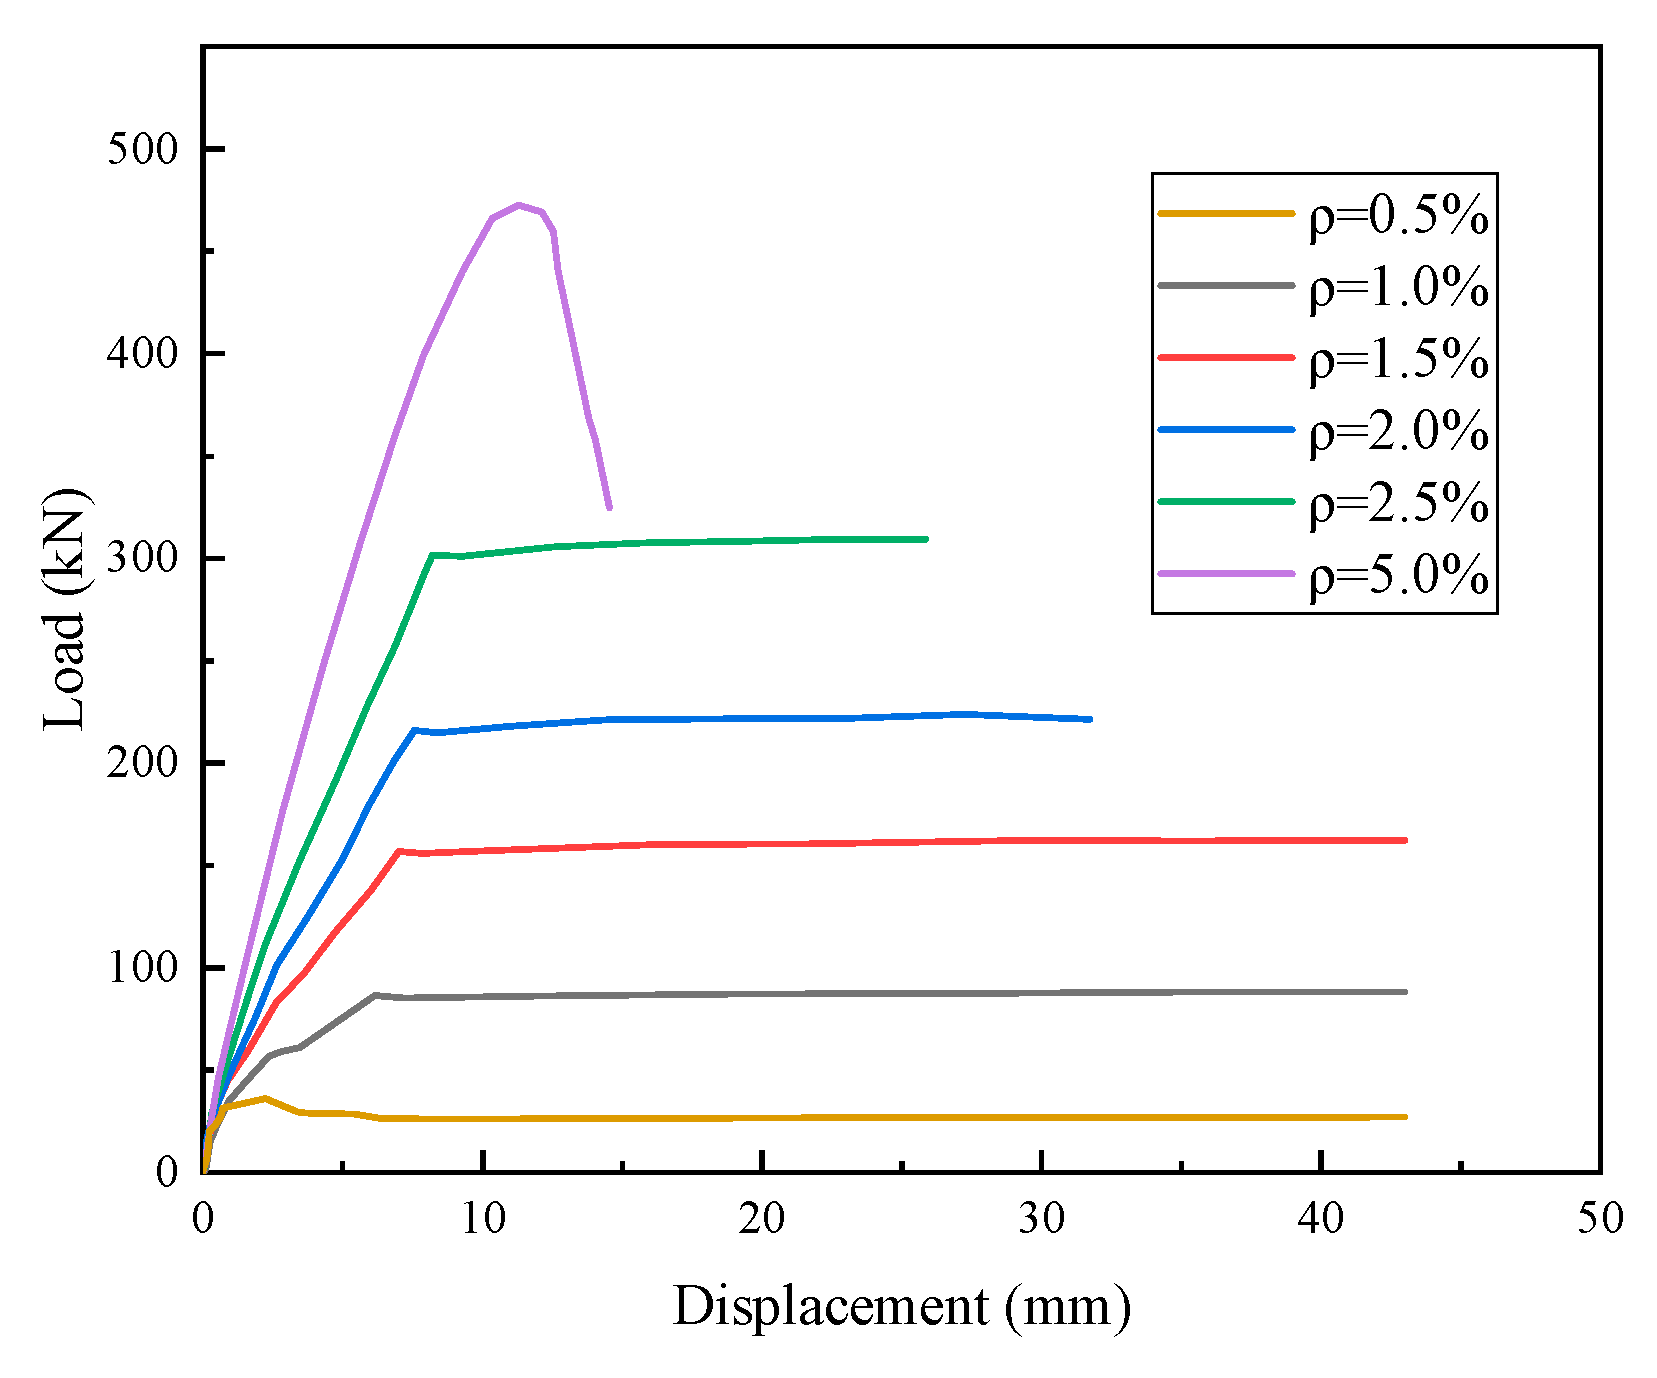
Figure 24 illustrates the Load–Deflection Curves for UHPC-strengthened beams with varying reinforcement ratios. The results clearly demonstrate a significant enhancement in the ultimate load-carrying capacity of the strengthened beams across all tested ratios, with the load capacity increasing further and markedly as the reinforcement ratio rises. Importantly, an obvious transition in the failure mechanism is observed: the beam with a 0.5% reinforcement ratio failed in a typical under-reinforced mode, characterized by the yielding of the tensile reinforcement before the concrete crushed. In sharp contrast, the beam incorporating a 5.0% reinforcement ratio exhibited an over-reinforced failure mode, where concrete crushing occurred prematurely before the tensile reinforcement could fully yield.
Figure 24.
Load–Deflection Comparison for Different Reinforcement Ratios.
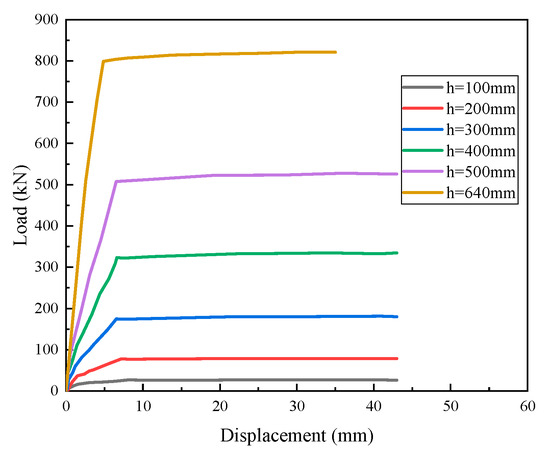
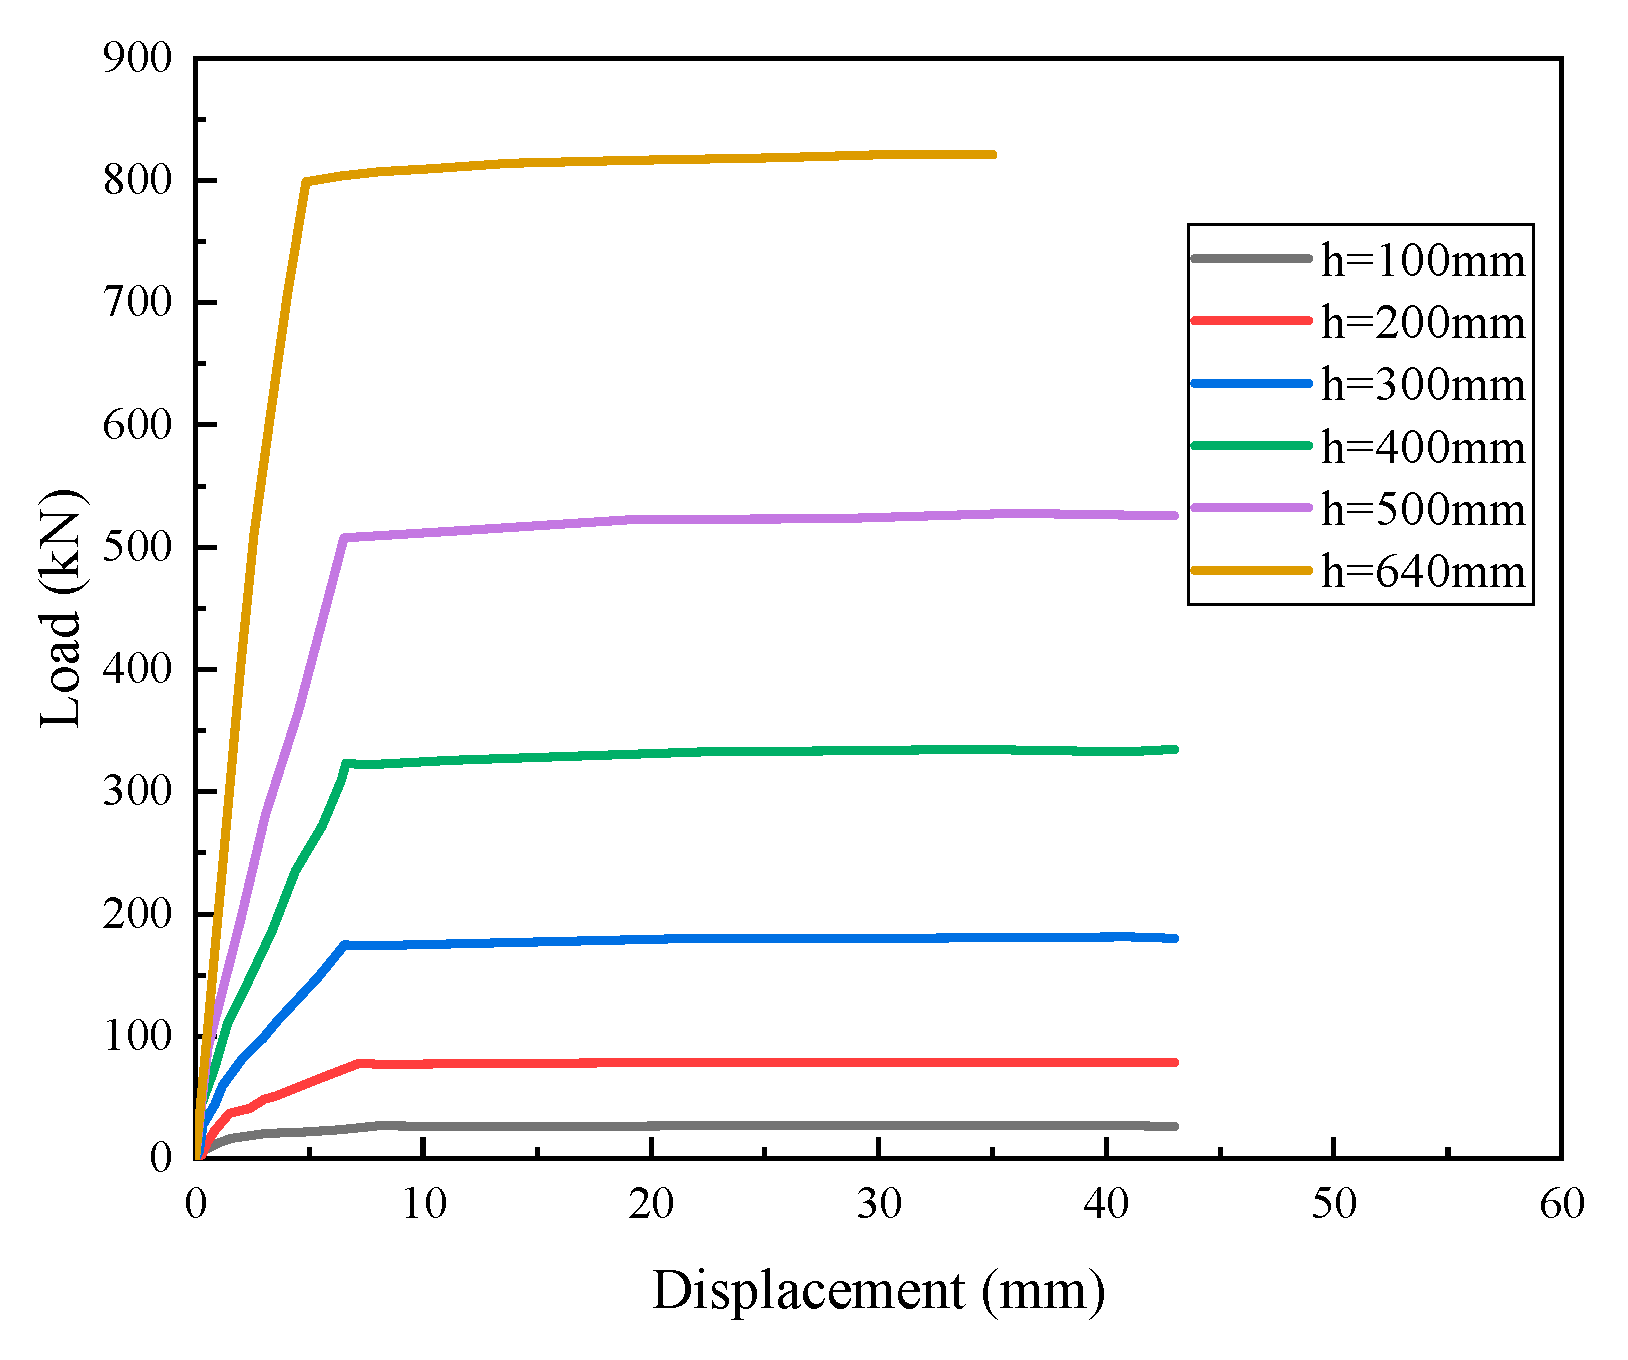
Figure 25 displays the Load–Deflection Curves of UHPC-strengthened beams incorporating varying beam heights. The experimental results consistently indicate that, for a given UHPC strengthening layer, increasing the height of the RC beam leads to significant improvements in both ultimate load-carrying capacity and flexural stiffness.
Figure 25.
Comparison of Load–Deflection Curves for Different Beam Heights.
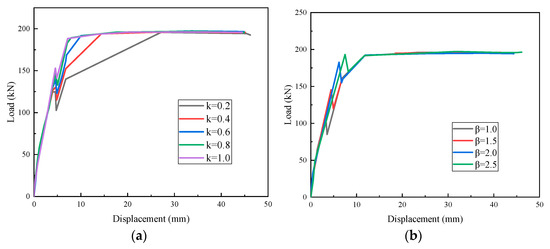
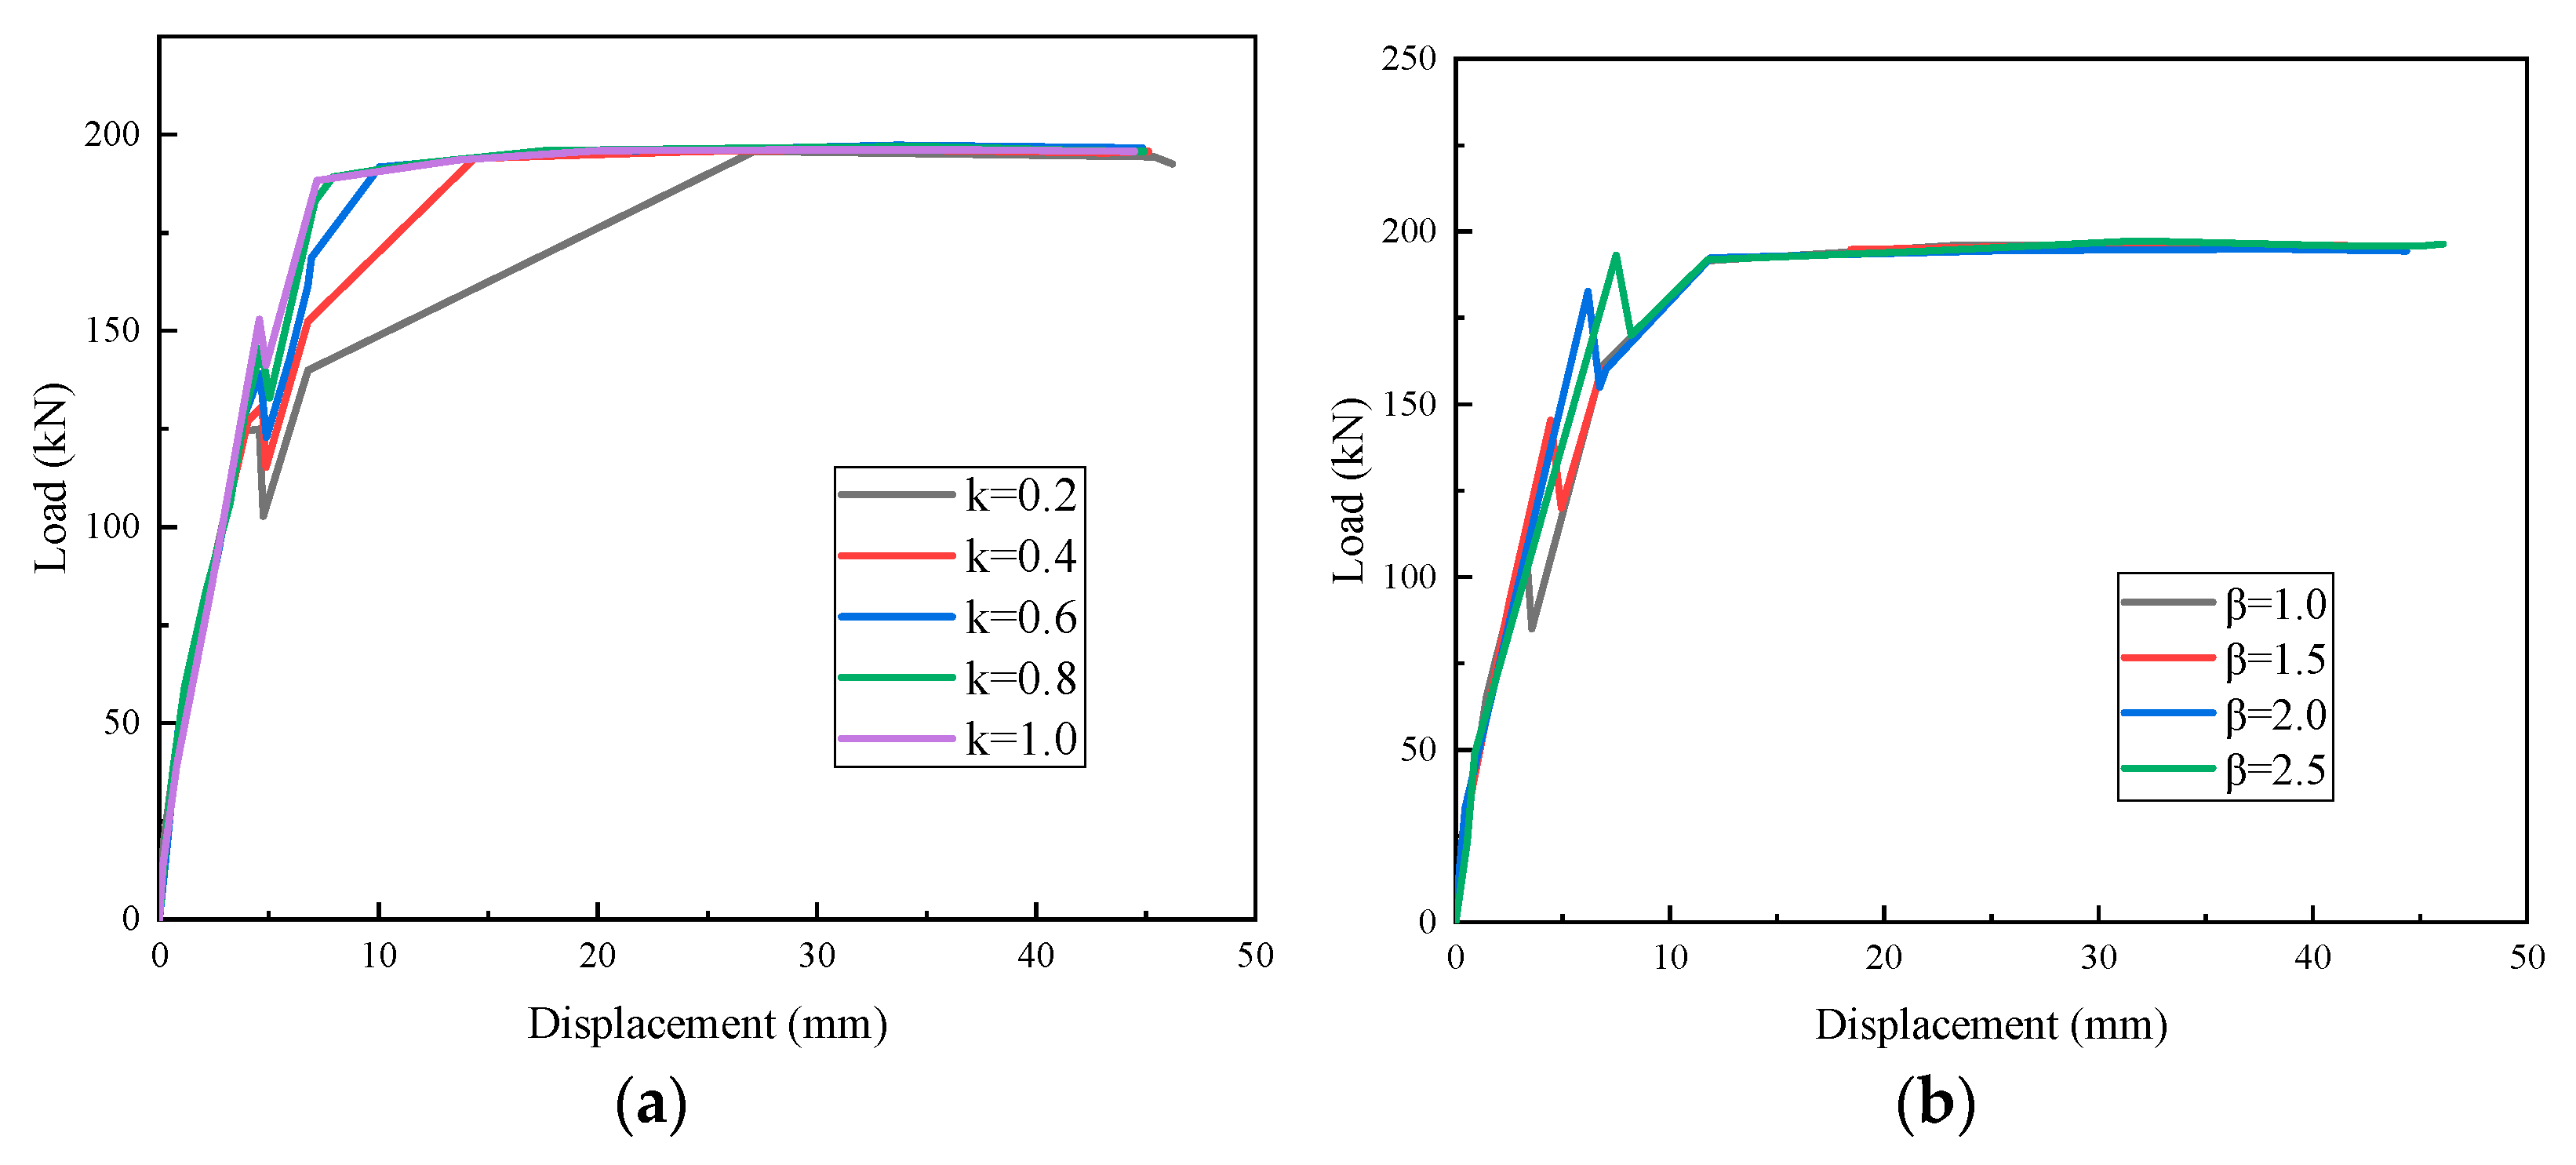
As shown in Figure 26, UHPC-strengthened beams with different interface efficiency coefficients and interface treatment factors exhibit a noticeable influence of interface slip on the load-bearing capacity. As the interface efficiency coefficient decreases, the peak load occurs later, and the UHPC-strengthened beam requires a larger deflection to reach its ultimate load-carrying state. Conversely, as the interface treatment factor increases, interface slip occurs later, allowing the UHPC strengthening layer to better cooperate with the original concrete beam. The results indicate that variations in and have a relatively minor effect on the ultimate load capacity.
Figure 26.
Comparison chart of load–deflection curves with different interface influence coefficients: (a) Interface efficiency coefficient ; (b) Interface treatment factor .
5. Conclusions and Outlook
This study systematically analyzed the failure characteristics, load-carrying capacity, and deformation behavior of RC beams strengthened with an Ultra-High Performance Concrete (UHPC) layer through static loading tests on ten experimental specimens. The investigation primarily focused on the influence of key parameters: steel fiber volume fraction, reinforcement ratio, and beam height of the UHPC layer. The main findings are summarized below:
- All ten tested beams exhibited typical flexural failure characteristic of under-reinforced members. The load–deflection curves could be distinctly divided into three characteristic stages, reflecting the sequential evolution of structural performance. Crucially, the bond interface between the UHPC layer and the RC substrate remained integral, with no evidence of debonding failure observed throughout the testing process.
- The UHPC strengthening layer significantly inhibited the initiation and propagation of cracks. Increasing the steel fiber volume fraction in the UHPC layer linearly enhanced the cracking load. Specifically, the strengthened beams (UCF-1, UCF-2, UCF-3) showed cracking load increases of 101.9%, 124.6%, and 161.4%, respectively, compared to the control beam (CB), demonstrating the effectiveness of steel fibers in mitigating crack development.
- Comparison of the load–displacement curves before and after strengthening reveals that the ultimate load capacities of the strengthened beams (UCF1, UCF2, and UCF3) increased by 15.7%, 12.9%, and 9.5%, respectively, compared to the control beam (CB). For the UCS series (UCS1.26, UCS1.70, and UCS2.24), the corresponding increases were 16.4%, 51.0%, and 110.2%, while for the UCH series (UCH250, UCH470, and UCH640), the capacities rose by 6.2%, 338.6%, and 518.8%. These results demonstrate that UHPC strengthening consistently enhances the load-bearing capacity across the UCF, UCS, and UCH groups. Notably, UCH470 and UCH640 exhibited significantly larger increments compared to UCH250, indicating that for a given UHPC strengthening layer, the beam height is positively correlated with the ultimate load capacity. It can be further inferred that the steel fiber content in the UHPC layer has a limited influence on the ultimate capacity, whereas increases in the reinforcement ratio and beam height significantly enhance the ultimate load-bearing performance. It should be noted that the substantial increments in the UCH series are attributed to the combined effects of the increased sectional depth (geometric contribution) and the high-performance material properties of the UHPC layer.
- The UHPC strengthening layer significantly enhanced the flexural stiffness of the RC beams, but it also resulted in a reduction of structural ductility. Notably, none of the strengthened beams exhibited brittle failure, and all demonstrated clear yielding characteristics prior to ultimate failure.
- A nonlinear numerical analysis model of UHPC-strengthened beams was developed using MATLAB R2020a, and the reliability of the program was verified through a full-range loading simulation in comparison with experimental results. Parametric analyses of key factors, including reinforcement ratio, beam height, and interface coefficients, indicated the following: as the reinforcement ratio and beam height of the UHPC layer increase, the ultimate load capacity of the strengthened beams improves. In particular, increasing the beam height results in a significant enhancement of flexural stiffness. As the interface efficiency coefficient decreases, the peak load occurs later, and a larger deflection is required for the UHPC-strengthened beam to reach its ultimate load. Conversely, as the interface treatment factor increases, interface slip occurs later, allowing the UHPC layer to better cooperate with the original concrete beam. However, variations in and have a relatively minor effect on the ultimate load capacity.
This research confirms the effectiveness of UHPC in improving the flexural performance of RC beams, demonstrating its high potential for practical application in retrofitting deteriorated RC bridge structures. Given the constraints of laboratory conditions and resource limitations, the current work needs to be extended to fully realize its engineering application potential. Further investigations are required in the following areas:
- This study focused on the flexural performance of UHPC-strengthened beams and did not address other comprehensive mechanical properties such as shear, impact resistance, and fatigue. Future research should conduct systematic multi-condition analyses to comprehensively evaluate the influence mechanisms of UHPC strengthening layers on the structural performance of RC beams.
- In practical bridge strengthening projects, UHPC is typically used for the rehabilitation of damaged RC beams. Due to time and site limitations, this study did not conduct tests on pre-damaged beams. Considering that strain lag effects and their influence on the UHPC–RC interface bond performance may reduce strengthening efficiency, this issue should be a key focus in future research.
- Further investigation of interface treatment strategies is warranted. In this study, only grooving was applied to the RC–UHPC interface. Other interface treatment methods could be explored to evaluate their effects on the flexural performance of the strengthened specimens. It should be noted that due to experimental constraints, the interface slip was not directly measured in this study. However, numerical parametric analyses on and provide preliminary insights into the interface behavior. Future research should include dedicated interface slip tests to further calibrate and validate these analytical models.”
- The nonlinear numerical analysis methods for UHPC-strengthened beams require further refinement. Consideration of internal force variations under applied prestressing conditions, along with optimization of numerical simulation parameters and other relevant conditions, could make the analysis more representative of practical engineering scenarios and thereby improve the reliability of the results. Furthermore, while this study covers a specific range of beam heights, caution should be exercised when extrapolating these trends to full-scale bridge girders due to the inherent size effects in concrete structures.
Author Contributions
Conceptualization, H.Z. and Y.H.; methodology, H.Z. and Y.H.; software, Y.H.; validation, H.Z., Y.H. and Z.G.; formal analysis, Y.H. and Z.G.; investigation, H.H.; resources, H.Z.; data curation, Y.H.; writing—original draft preparation, Y.H.; writing—review and editing, H.Z.; visualization, H.H.; supervision, H.Z.; project administration, H.Z.; funding acquisition, H.Z. All authors have read and agreed to the published version of the manuscript.
Funding
This research was funded by [National Natural Science Foundation of China], grant number [52308168 and 51608189], [Natural Science Foundation of Hunan Province], grant number [2019JJ40313 and 2019JJ50130], [Scientific Research Foundation of Hunan Provincial Education Department], grant number [22B0564 and 24A0393] and [Innovative Training Program for College Students in Hunan Province], grant number [S202411535078].
Data Availability Statement
The data that support the findings of this study are available from the corresponding author upon reasonable request.
Acknowledgments
The authors would like to thank the anonymous reviewers and the editor for their helpful comments and suggestions.
Conflicts of Interest
The authors declare no conflicts of interest.
References
- Richard, P.; Cheyrezy, M. Composition of Reactive Powder Concretes. Cem. Concr. Res. 1995, 25, 1501–1511. [Google Scholar] [CrossRef] [Scilit]
- Hung, C.-C.; El-Tawil, S.; Chao, S.-H. A Review of Developments and Challenges for UHPC in Structural Engineering: Behavior, Analysis, and Design. J. Struct. Eng. 2021, 147, 3121001. [Google Scholar] [CrossRef] [Scilit]
- Fehling, E.; Schmidt, M.; Walraven, J.; Leutbecher, T.; Fröhlich, S. (Eds.) Ultra-High Performance Concrete UHPC, 1st ed.; Wiley: Hoboken, NJ, USA, 2014; ISBN 978-3-433-03087-5. [Google Scholar]
- Shi, C.; Wu, Z.; Xiao, J.; Wang, D.; Huang, Z.; Fang, Z. A Review on Ultra High Performance Concrete: Part I. Raw Materials and Mixture Design. Constr. Build. Mater. 2015, 101, 741–751. [Google Scholar] [CrossRef] [Scilit]
- Cao, J.; Zhang, Y.; Shao, X.; Huang, S.; Cai, W.; Zhang, X. Review of Research on Ultra-High Performance Concrete (UHPC) Bridges, 2024. Munic. Eng. Technol. 2025, 43, 1–17. [Google Scholar] [CrossRef]
- Zhang, Y.; Zhu, Y.; Qu, S.; Kumar, A.; Shao, X. Improvement of Flexural and Tensile Strength of Layered-Casting UHPC with Aligned Steel Fibers. Constr. Build. Mater. 2020, 251, 118893. [Google Scholar] [CrossRef] [Scilit]
- Graybeal, B.; Tanesi, J. Durability of an Ultrahigh-Performance Concrete. J. Mater. Civ. Eng. 2007, 19, 848–854. [Google Scholar] [CrossRef] [Scilit]
- Shao, X.; Cao, J.; Yi, D.; Chen, B.; Huang, Z. Basic Performance Study of Orthotropic Steel Deck-Thin RPC Composite Bridge Deck. China J. Highw. Transp. 2012, 25, 40–45. [Google Scholar] [CrossRef]
- Graybeal, B.A. Characterization of the Behavior of Ultra-High Performance Concrete; University of Maryland: College Park, MD, USA, 2005; ISBN 0-542-18305-6. [Google Scholar]
- Voo, Y.L.; Poon, W.K.; Foster, S.J. Shear Strength of Steel Fiber-Reinforced Ultrahigh- Performance Concrete Beams without Stirrups. J. Struct. Eng. 2010, 136, 1393–1400. [Google Scholar] [CrossRef] [Scilit]
- Yang, I.H.; Joh, C.; Kim, B.-S. Structural Behavior of Ultra High Performance Concrete Beams Subjected to Bending. Eng. Struct. 2010, 32, 3478–3487. [Google Scholar] [CrossRef] [Scilit]
- Yoo, D.-Y.; Banthia, N.; Kim, S.-W.; Yoon, Y.-S. Response of Ultra-High-Performance Fiber-Reinforced Concrete Beams with Continuous Steel Reinforcement Subjected to Low-Velocity Impact Loading. Compos. Struct. 2015, 126, 233–245. [Google Scholar] [CrossRef] [Scilit]
- Nadir, W.; Kadhim, M.M.A.; Jawdhari, A.; Fam, A.; Majdi, A. RC Beams Strengthened in Shear with FRP-Reinforced UHPC Overlay: An Experimental and Numerical Study. Structures 2023, 53, 693–715. [Google Scholar] [CrossRef] [Scilit]
- Yin, H.; Teo, W.; Shirai, K. Experimental Investigation on the Behaviour of Reinforced Concrete Slabs Strengthened with Ultra-High Performance Concrete. Constr. Build. Mater. 2017, 155, 463–474. [Google Scholar] [CrossRef] [Scilit]
- Safdar, M.; Matsumoto, T.; Kakuma, K. Flexural Behavior of Reinforced Concrete Beams Repaired with Ultra-High Performance Fiber Reinforced Concrete (UHPFRC). Compos. Struct. 2016, 157, 448–460. [Google Scholar] [CrossRef] [Scilit]
- Prem, P.R.; Murthy, A.R. Acoustic Emission and Flexural Behaviour of RC Beams Strengthened with UHPC Overlay. Constr. Build. Mater. 2016, 123, 481–492. [Google Scholar] [CrossRef] [Scilit]
- Prem, P.R.; Ramachandra Murthy, A.; Ramesh, G.; Bharatkumar, B.H.; Iyer, N.R. Flexural Behaviour of Damaged RC Beams Strengthened with Ultra High Performance Concrete. In Advances in Structural Engineering: Materials, Volume Three; Springer: New Delhi, India, 2015; pp. 2057–2069. [Google Scholar]
- Zheng, J.; Zhang, J.; Fang, X.; Gao, S. Analysis of the Variation Pattern of the Compression Zone Height Coefficient of Beams Strengthened with Enlarged Cross-Section. Anhui Arch. 2025, 32, 63–65, 90. [Google Scholar] [CrossRef]
- Jiang, J.; Dong, Z.; Du, D.; Dong, K. Research on the Influence of Creep on the Flexural Capacity of Flexural Members Strengthened by Enlarging Cross-Section Method. Earthq. Resist. Eng. Retrofit 2022, 44, 112–118, 156. [Google Scholar] [CrossRef]
- Deng, Z.; Zhang, W. Flexural Behavior of Concrete Beams Strengthened with Hybrid Fiber Reinforced RPC. J. Harbin Eng. Univ 2015, 36, 1199–1205. [Google Scholar] [CrossRef]
- Kong, X. Research on Flexural Behavior of Reinforced Concrete Beams Strengthened with UHPC. Earthq. Resist. Eng. Retrofit 2020, 42, 46–54. [Google Scholar] [CrossRef]
- Pimentel, M.; Nunes, S. Experimental Tests on RC Beams Reinforced with a UHPFRC Layer Failing in Bending and Shear. In Proceedings of the 4th International Symposium on Ultra-High Performance Concrete and High Performance Materials, Kassel, Germany, 9–11 March 2016; pp. 9–11. [Google Scholar]
- Ramachandra Murthy, A.; Karihaloo, B.L.; Priya, D.S. Flexural Behavior of RC Beams Retrofitted with Ultra-High Strength Concrete. Constr. Build. Mater. 2018, 175, 815–824. [Google Scholar] [CrossRef] [Scilit]
- Al-Osta, M.A.; Isa, M.N.; Baluch, M.H.; Rahman, M.K. Flexural Behavior of Reinforced Concrete Beams Strengthened with Ultra-High Performance Fiber Reinforced Concrete. Constr. Build. Mater. 2017, 134, 279–296. [Google Scholar] [CrossRef] [Scilit]
- Liao, S.; Ma, Y. Study on Flexural Behavior of Reactive Powder Concrete (RPC) Prestressed Composite Beams. J. Hunan Univ. (Nat. Sci.) 2005, 32, 57–62. [Google Scholar]
- Guo, M. Experimental and Theoretical Research on Static Performance of RPC-NC Composite Beams. Ph.D. Thesis, Beijing Jiaotong University, Beijing, China, 2018. [Google Scholar]
- Li, W. Research on Flexural Behavior of Prestressed RPC-NC Composite Beams. Ph.D. Thesis, Beijing Jiaotong University, Beijing, China, 2018. [Google Scholar]
- Tayeh, B.A.; Abu Bakar, B.H.; Megat Johari, M.A. Characterization of the Interfacial Bond between Old Concrete Substrate and Ultra High Performance Fiber Concrete Repair Composite. Mater. Struct. 2013, 46, 743–753. [Google Scholar] [CrossRef] [Scilit]
- Tayeh, B.A.; Abu Bakar, B.H.; Megat Johari, M.A.; Voo, Y.L. Mechanical and Permeability Properties of the Interface between Normal Concrete Substrate and Ultra High Performance Fiber Concrete Overlay. Constr. Build. Mater. 2012, 36, 538–548. [Google Scholar] [CrossRef] [Scilit]
- Carbonell Muñoz, M.A.; Harris, D.K.; Ahlborn, T.M.; Froster, D.C. Bond Performance between Ultrahigh-Performance Concrete and Normal-Strength Concrete. J. Mater. Civ. Eng. 2014, 26, 4014031. [Google Scholar] [CrossRef] [Scilit]
- Hong, S.-G.; Kang, S.-H. Effect of Surface Preparation and Curing Method on Bond Strength Between UHPC and Normal Strength Concrete. In Proceedings of the IABSE Conference: Structural Engineering: Providing Solutions to Global Challenges, Geneva, Switzerland, 23–25 September 2015; pp. 1537–1543. [Google Scholar]
- Jang, H.-O.; Lee, H.-S.; Cho, K.; Kim, J. Experimental Study on Shear Performance of Plain Construction Joints Integrated with Ultra-High Performance Concrete (UHPC). Constr. Build. Mater. 2017, 152, 16–23. [Google Scholar] [CrossRef] [Scilit]
- Zhang, Y.; Zhang, C.; Zhu, Y.; Cao, J.; Shao, X. An Experimental Study: Various Influence Factors Affecting Interfacial Shear Performance of UHPC-NSC. Constr. Build. Mater. 2020, 236, 117480. [Google Scholar] [CrossRef] [Scilit]
- Zhang, Y.; Wang, X. Experimental Study on Interfacial Shear Performance of RC Structures Strengthened with UHPC. J. China Foreign Highw. 2017, 37, 105–111. [Google Scholar] [CrossRef]
- Wu, X.; Zhang, X. Study on Short-term Bond Performance between Prefabricated Ultra-high Performance Concrete Repair Layer and Existing Concrete Interface. J. Build. Struct 2018, 39, 156–163. [Google Scholar] [CrossRef]
- Feng, S.; Xiao, H.; Li, H. Comparative Studies of the Effect of Ultrahigh-Performance Concrete and Normal Concrete as Repair Materials on Interfacial Bond Properties and Microstructure. Eng. Struct. 2020, 222, 111122. [Google Scholar] [CrossRef] [Scilit]
- Feng, S.; Xiao, H.; Ma, M.; Zhang, S. Experimental Study on Bonding Behaviour of Interface between UHPC and Concrete Substrate. Constr. Build. Mater. 2021, 311, 125360. [Google Scholar] [CrossRef] [Scilit]
- Guan, D.; Chen, Z.; Lin, Z.; Xu, R.; Liu, J.; Guo, Z. Experimental Study on Shear Performance of Bubble Film Type Interface between Precast UHPC and Post-cast Normal Concrete. J. Build. Struct. 2021, 42, 426–432, 455. [Google Scholar] [CrossRef]
- Wang, D.; Shen, T.; Ju, Y.; Zheng, W.; Zeng, C. Study on Bond-Shear Performance between Post-cast Normal Concrete and Precast UHPC. J. Build. Struct. 2020, 41, 411–419. [Google Scholar] [CrossRef]
- JGJ 55-2011; Specification for Mix Design of Ordinary Concrete. Ministry of Housing and Urban-Rural Development of the People’s Republic of China (MOHURD): Beijing, China; China Architecture & Building Press: Beijing, China, 2011.
- GB/T 50081-2019; Standard for Test Methods of Concrete Physical and Mechanical Properties. Ministry of Housing and Urban-Rural Development of the People’s Republic of China (MOHURD), China Architecture & Building Press: Beijing, China, 2019.
- GB/T 31387-2015; Reactive Powder Concrete. Standardization Administration of the People’s Republic of China (SAC): Beijing, China; China Standard Press: Beijing, China, 2015.
- GB/T 228.1-2010; Metallic Materials—Tensile Testing—Part 1: Method of Test at Room Temperature. Standardization Administration of the People’s Republic of China (SAC): Beijing, China; China Standard Press: Beijing, China, 2010.
- GB/T 50152-2012; Standard for Test Method of Concrete Structures. Ministry of Housing and Urban-Rural Development of the People’s Republic of China (MOHURD): Beijing, China; China Architecture & Building Press: Beijing, China, 2012.
- GB 50010-2010; Code for Design of Concrete Structures (2015 Edition). Ministry of Housing and Urban-Rural Development of the People’s Republic of China (MOHURD): Beijing, China; China Architecture & Building Press: Beijing, China, 2015.
- Yang, J.; Fang, Z. Research on Flexural Behavior of Prestressed Ultra-High Performance Concrete Beams. China J. Highw. Transp. 2009, 22, 39–46. [Google Scholar] [CrossRef]
- Comite Euro-International Du Beton. CEB-FIP Model Code 1990: Design Code; Emerald Publishing Limited: Bingley, UK, 1993; ISBN 978-0-7277-3543-0. [Google Scholar]

Disclaimer/Publisher’s Note: The statements, opinions and data contained in all publications are solely those of the individual author(s) and contributor(s) and not of MDPI and/or the editor(s). MDPI and/or the editor(s) disclaim responsibility for any injury to people or property resulting from any ideas, methods, instructions or products referred to in the content. |
© 2026 by the authors. Licensee MDPI, Basel, Switzerland. This article is an open access article distributed under the terms and conditions of the Creative Commons Attribution (CC BY) license.