Article

Influence of Saturation Degree of Recycled Coarse Aggregate on the Mechanical Properties of Fully Recycled Aggregate Concrete and Mechanism Analysis

College of Civil Engineering, Hunan City University, Yiyang 413000, China
*
Author to whom correspondence should be addressed.
Buildings 2026, 16(3), 509; https://doi.org/10.3390/buildings16030509
Submission received: 9 December 2025 / Revised: 3 January 2026 / Accepted: 22 January 2026 / Published: 26 January 2026
(This article belongs to the Special Issue Applications of Advanced Composites in Civil Engineering)

Abstract

The application of fully recycled aggregate concrete (FRAC) promotes sustainable construction, but its mechanical properties are often unstable due to the high absorption and variability of recycled aggregates. This study investigates the effect of saturation degrees of recycled coarse aggregate (RCA) and recycled fine aggregate (RFA) on FRAC’s mechanical performance and failure mechanisms. Results show that optimal strength is achieved at 70% RCA and 25% RFA saturation. Reducing RFA saturation from 100% to 25% increases compressive strength by 28.8% and tensile strength by 34.6%. RFA saturation has a greater influence than sand ratio or superplasticizer dosage, second only to water–cement ratio. Analysis indicates that excessive saturation leads to pores and microcracks in the interfacial transition zone, weakening bonding. A multiple linear regression model based on recycled aggregate saturation accurately predicts FRAC properties, supporting optimized use of recycled materials and cleaner construction practices.

1. Introduction

In the report of the 20th National Congress of the Communist Party of China, it was emphasized that the efficient and intensive use of various resources should be promoted, and a circular economy system for waste recycling should be accelerated [1]. Fully recycled aggregate concrete (FRAC), which utilizes 100% recycled aggregates as a substitute for natural aggregates, offers significant social, economic, and environmental benefits [2,3,4,5]. However, experimental studies by Thomas [6], Yaguang Z [7], Bravo [8], and Shicong K [9] have shown that recycled aggregates exhibit characteristics such as high water absorption, high crushing value, low elastic modulus, heterogeneous sources, and high variability. These unfavorable properties lead to considerable differences in mechanical performance between FRAC and conventional concrete.
Several researchers, including Bao J [10], Nan L [11], and Duan Z [12], have attributed the degradation in FRAC performance to microcracks and residual adhered mortar generated during the crushing of recycled coarse aggregates. These defects weaken the interfacial transition zone (ITZ), resulting in a significant reduction in mechanical strength as the replacement ratio increases. In contrast, other studies by Xuebing Z [13], Zongping C [14], and Jiabin L [15] have indicated that the high water absorption of adhered mortar in recycled aggregates can absorb mixing water during casting, locally lowering the water–cement ratio at the ITZ and consequently offsetting the negative effects of aggregate replacement. These contrasting findings highlight that the water absorption characteristics of recycled aggregates—especially the adhered mortar—are critical factors affecting FRAC performance and must not be overlooked. However, limited research has explored how these characteristics interact with other mixture design factors such as superplasticizer dosage or sand ratio, which may influence the effectiveness of internal curing or the development of the ITZ. A more integrated approach is needed to capture these interactions and improve the reliability of FRAC design.
Research efforts have been made to investigate the effect of aggregate moisture condition on the mechanical properties of partially recycled concrete. Mefteh et al. [16] suggested that using completely dry recycled aggregates yields the best mechanical performance. However, other studies by Xuebing Z [17], Wang J [18], and Guolin W [19] found that partially saturated recycled aggregates improve performance over fully dry conditions. Brand et al. [20] reported that peak compressive and tensile strengths are achieved when recycled aggregates are partially saturated. Conversely, studies by Beixing L [21], Le T [22], and Zhao Y [23] suggested that fully saturated aggregates may alter the effective water–cement ratio, adversely affecting mechanical properties. Guerzou et al. [24] showed that using recycled aggregates in a saturated surface-dry (SSD) condition improved compressive and splitting tensile strengths by 13% and 37%, respectively, compared to dry aggregates. These divergent results indicate that the role of aggregate saturation remains unclear and lacks quantitative characterization, particularly in the context of fully recycled concrete. Furthermore, most of these studies are focused on recycled coarse aggregate (RCA), while the role of recycled fine aggregate (RFA)—which typically has higher water absorption—remains underexplored. In addition, few have applied systematic, multilevel saturation control for both RCA and RFA in a coordinated experimental framework. These gaps limit the ability to generalize findings or optimize mix designs for practical applications.
To address this gap, the present study introduces a refined, quantitative control method based on aggregate saturation degree, focusing on both RCA and RFA. The RCA was preconditioned to target saturation levels of 30%, 50%, 70%, and 90%, while RFA saturation levels were set at 25%, 50%, 75%, and 100%. An orthogonal experimental design was conducted incorporating water–cement ratio, superplasticizer dosage, and sand ratio as influencing variables. The objective was to systematically investigate the effects of aggregate saturation on the mechanical performance of FRAC. Additionally, SEM was employed to clarify the failure mechanisms associated with different saturation levels at the microstructural scale. Based on the experimental findings, this study proposes the optimal moisture condition for recycled aggregates and the corresponding mix proportion for FRAC. A multiple linear regression model is also developed to predict mechanical performance, offering practical guidance for the engineering application of sustainable concrete materials.

2. Materials and Methods

2.1. Raw Materials

(1)
Cement: Ordinary Portland Cement (P·C 42.5) produced by the Nanfang Cement Company in Yiyang, Hunan Province, China, was used. The density of the cement is 3128 kg/m3. The chemical composition analysis results are shown in Table 1.
(2)
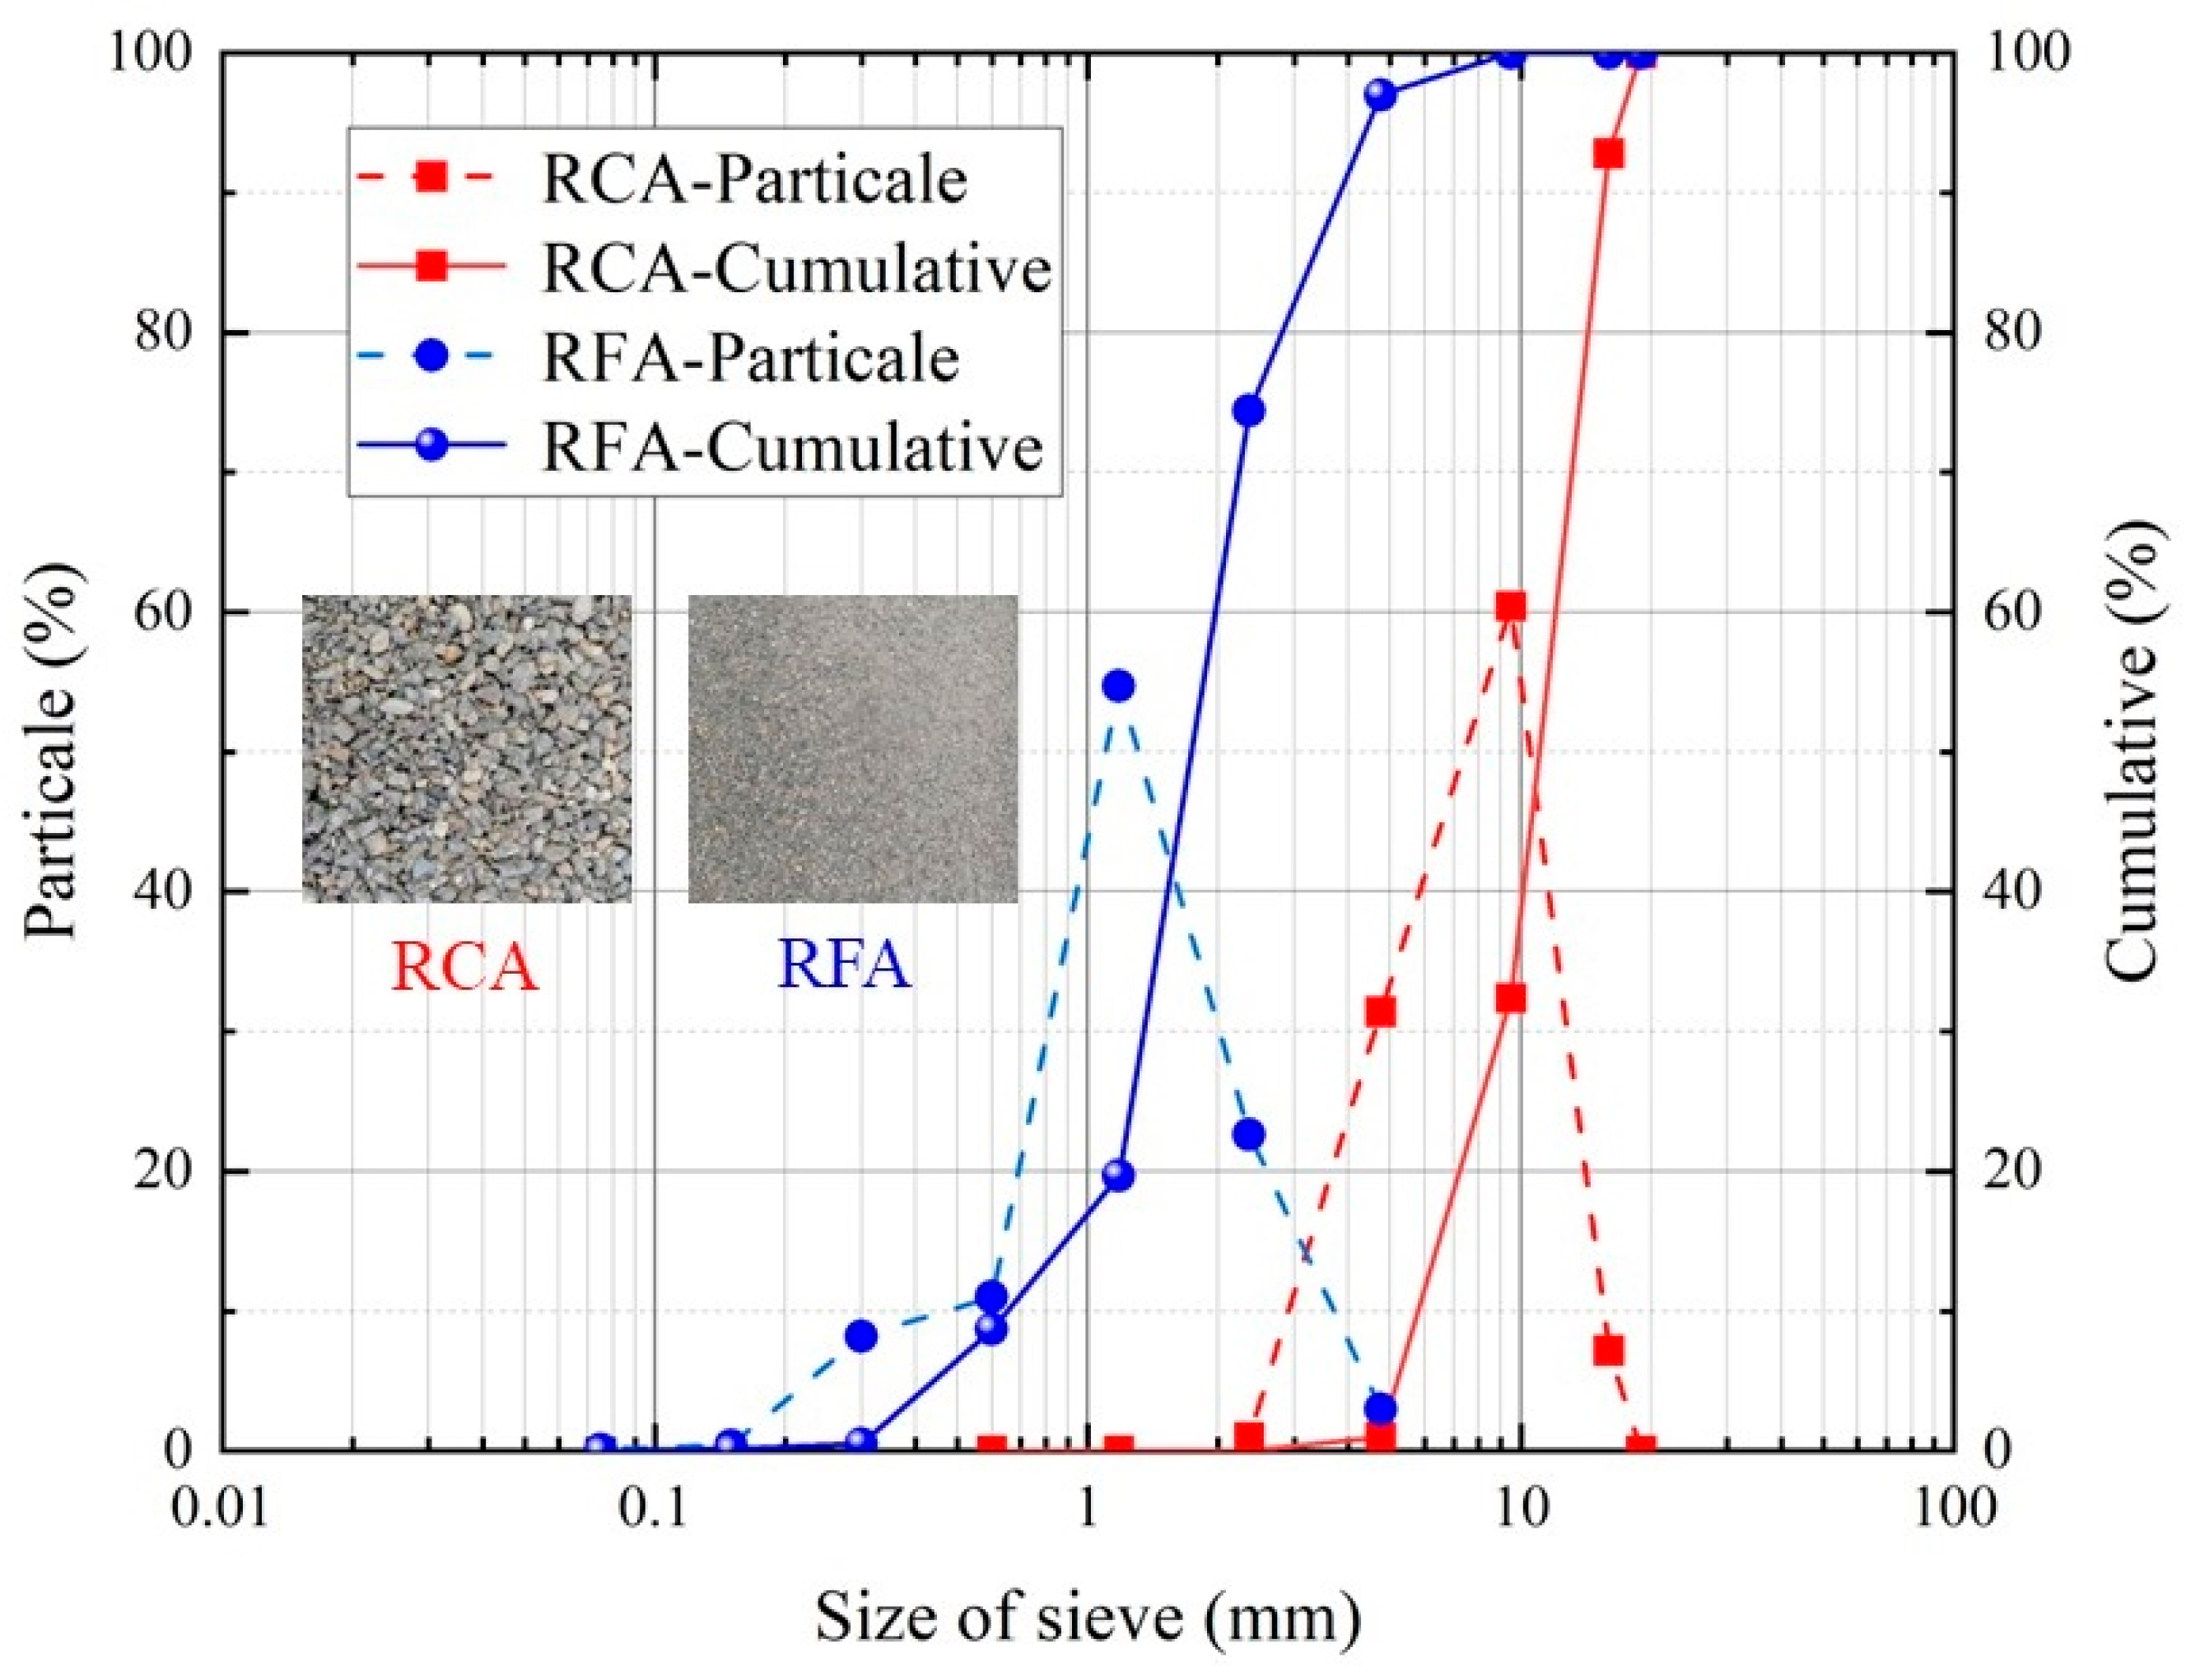
Aggregates: The aggregates were obtained by crushing and sieving discarded C15-C40 ordinary concrete specimens from the laboratory. The RCA has a particle size range of 5–20 mm, a crushing value of 9.7, and an apparent density of 2552 kg/m3. The RFA has a particle size range of 0.075–4.75 mm, a fineness modulus of 3.62, and an apparent density of 2350 kg/m3. The size distribution of the RCA and RFA is shown in Figure 1.
(3)
Superplasticizer: A liquid polycarboxylate superplasticizer was used, with a water-reducing rate of 35%.

2.2. Recycled Aggregate Saturation Degree

The moisture condition of recycled aggregates can be quantitatively described using the saturation degree (S). A higher value of S indicates a moisture state closer to full saturation. In this study, it is assumed that the interlayer bound water within the adhered mortar of recycled aggregates is largely non-evaporable under normal conditions. Therefore, the saturation degree is defined as a quantitative indicator representing the amount of free water within the recycled aggregates.
S = M ad M od M ssd M od × 100 %
where:
  • Mad—Water content of the recycled aggregate in the air-dried state (%);
  • Mod—Water content of the recycled aggregate in the oven-dried state (%); At this stage, the recycled aggregates were oven-dried to a constant weight, and their moisture content was assumed to be 0%;
  • Mssd—Water content of the recycled aggregate in the saturated surface-dry state (%).
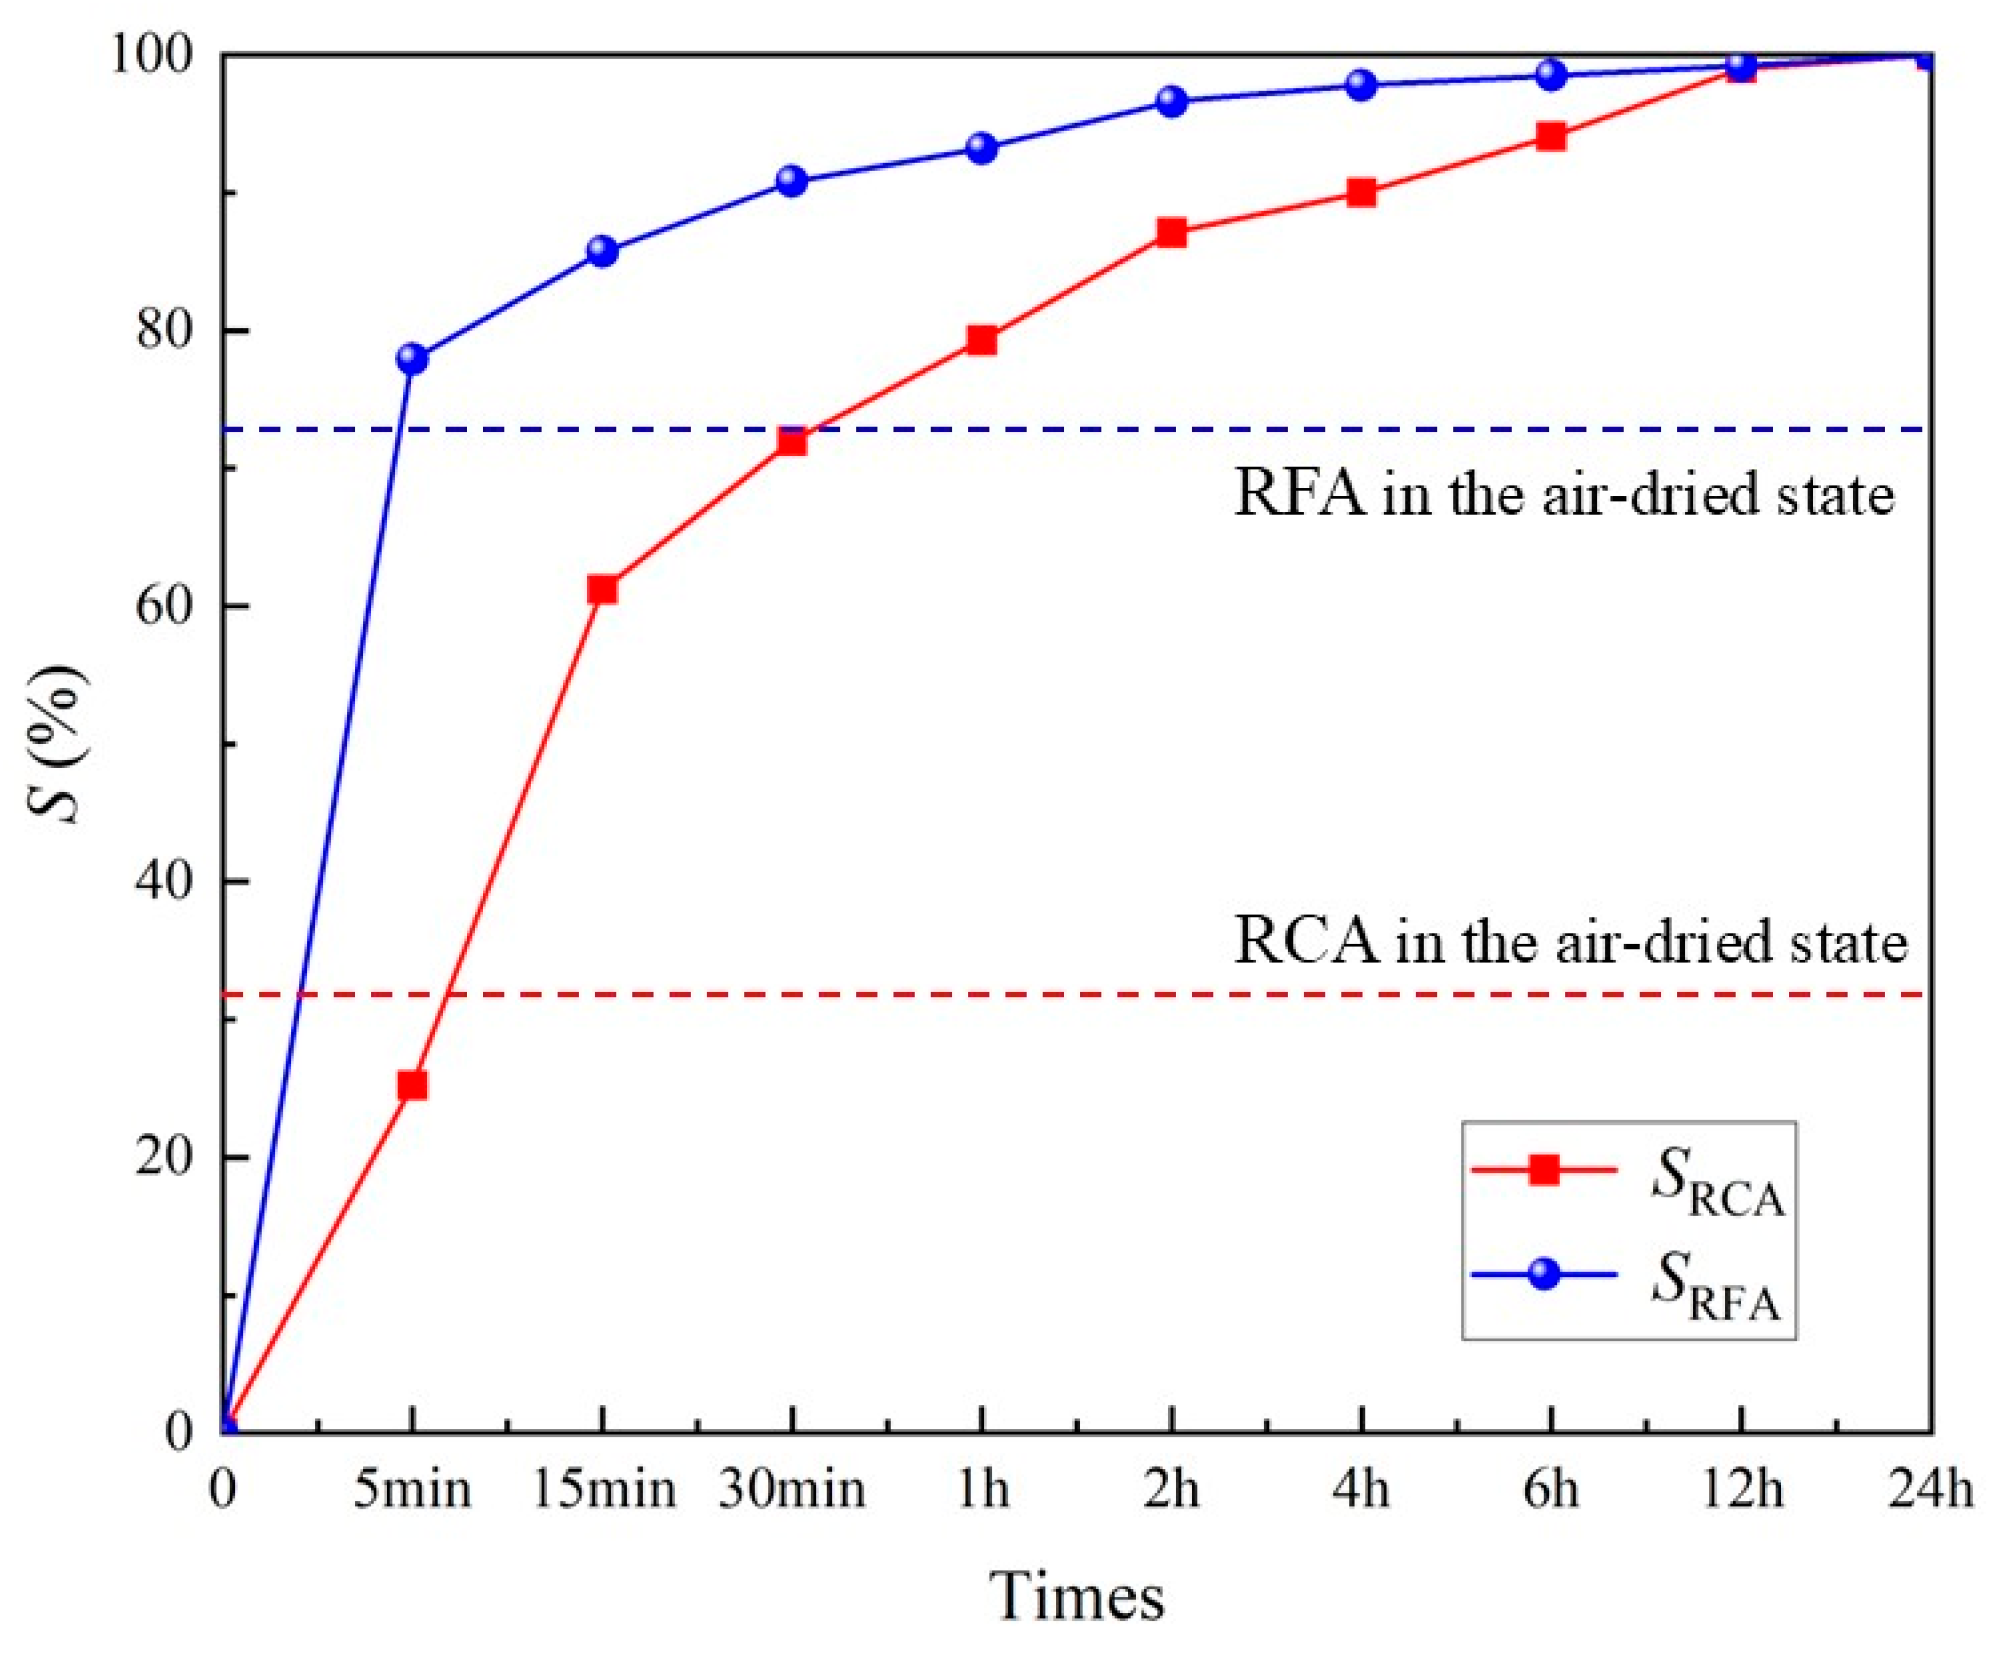
An experimental study was conducted to evaluate the 24 h saturation variation of the RCA and RFA used in this research. Prior to testing, samples were collected at 10 time intervals for both RCA and RFA, with three replicates per interval, resulting in a total of 60 samples. Each sample was placed in a container and oven-dried at 60 °C for 24 h until a constant weight was achieved. The moisture content of the aggregates at each time point was measured. The determination of aggregate moisture content followed the procedures outlined in GB/T 14685-2022, Pebble and Crushed Stone for Construction [25], in which moisture content is defined as the mass of free water divided by the oven-dried mass of the aggregate. To express the saturation level more precisely, the saturation degree was calculated as the ratio of the measured moisture content at a given time point to the aggregate’s 24 h water absorption capacity. This transformation enables a more accurate and quantitative control of aggregate moisture conditions during pretreatment. The average values were used to calculate the saturation degree, and the measured error range was within ±2%.
As shown in Figure 2, the saturation degree of RCA under air-dried conditions was approximately 32%, while that of RFA reached 74%. Based on these findings and for experimental convenience, the saturation degrees were controlled at 30%, 50%, 70%, and 90% for RCA, and at 25%, 50%, 75%, and 100% for RFA. Prior to mixing, the aggregates were either oven-dried or pre-wetted to reach the target saturation degrees, following the 24 h absorption curve obtained from the preliminary test. To ensure accuracy, the drying temperature was maintained at 60 °C, consistent with the standard drying procedure for aggregate absorption tests. As summarized in Table 2, all recycled aggregates were conditioned precisely to the desired saturation levels.

2.3. Experimental Method

An orthogonal experimental design was used in this study. Five influencing factors were selected: W/C, SP dosage, SRCA, SRFA, and sand ratio. Each factor was tested at four levels (the factor level table is shown in Table 3). The corresponding L16(45) orthogonal experimental design table is shown in Table 4.
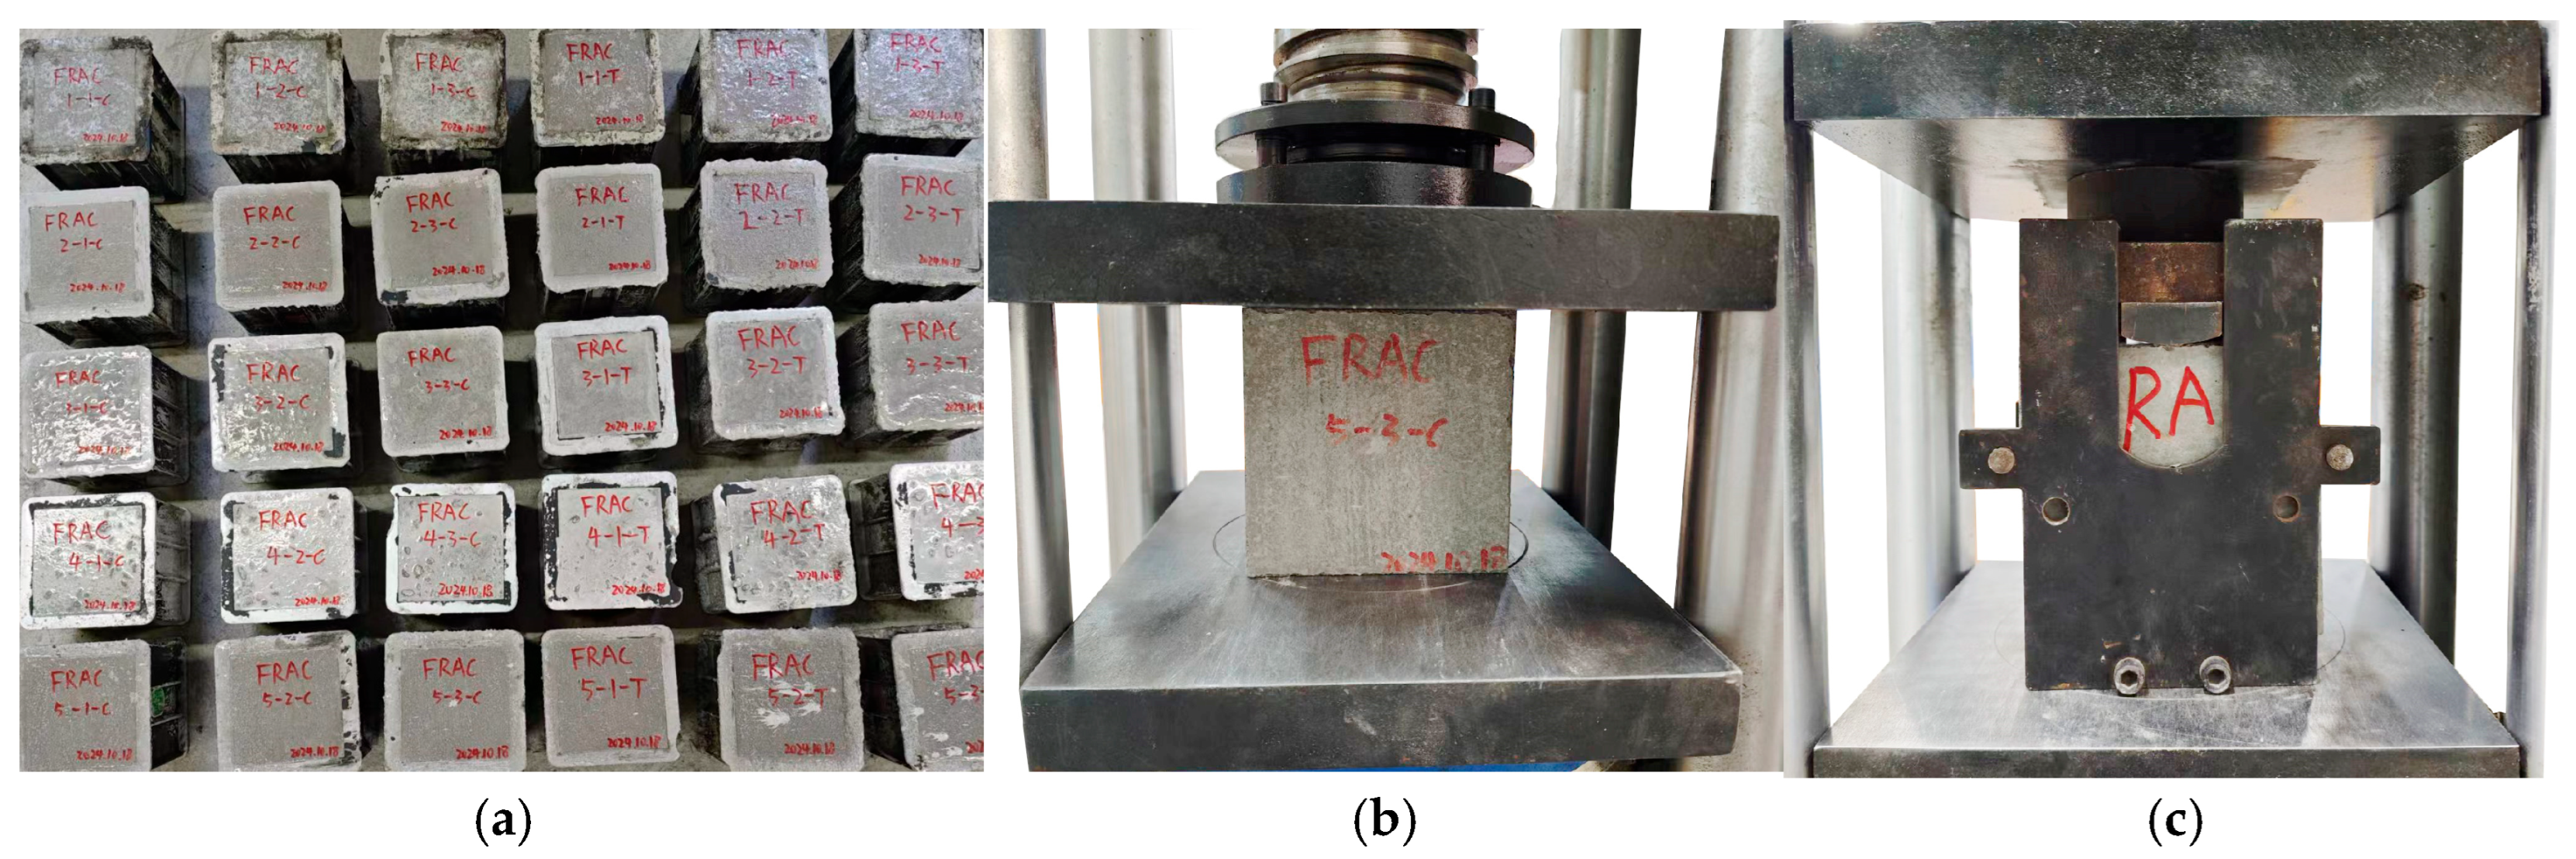
According to the Standard for Physical and Mechanical Performance Testing Methods of Concrete (GB/T 50081-2019) [26], concrete specimens were cast into 150 mm × 150 mm × 150 mm cubes. A total of 16 groups were designed based on the orthogonal experimental plan, with 6 specimens per group, resulting in 96 specimens in total. After casting, the specimens were left to stand for 24 h at an ambient temperature of 20 ± 5 °C, followed by demolding and labeling. All specimens were then cured in a standard curing environment (20 ± 2 °C, relative humidity ≥ 95%) for 28 days prior to mechanical testing. Compressive strength and splitting tensile strength tests were subsequently conducted, as illustrated in Figure 3. For compressive strength testing, the specimens were loaded axially using a hydraulic universal testing machine at a constant loading rate of 0.5 MPa/s, in accordance with GB/T 50081-2019. The tests were performed using a YAW-300C electro-hydraulic servo testing machine (Shandong Zhongli Testing Machine Co., Ltd., Jinan, China). For splitting tensile strength testing, the specimens were placed horizontally between two steel loading strips along the central axis, with the load applied vertically at a rate of 0.05 MPa/s until failure. Each test was repeated three times to ensure reliability, and the average value was recorded as the final result.
Based on the experimental results, additional tests were carried out on the optimal and least favorable combinations identified through the orthogonal analysis. Each additional group consisted of 6 specimens, totaling 12, and the preparation and curing conditions were kept consistent with those used in the initial experiment. After failure, representative specimens were selected for microscopic analysis. The fracture surfaces were examined using a field emission scanning electron microscope (FE-SEM), model SEM5000, manufactured (Chinainstru & Quantumtech Co., Ltd., Hefei, China) to observe the microstructural failure characteristics.

2.4. Statistical Analysis Methods

Statistical analysis in this study was performed using IBM SPSS Statistics 26.0 to examine the effects of experimental factors on the mechanical properties of FRAC. The analysis included range analysis, analysis of variance, correlation analysis, and multiple linear regression modeling. Range analysis was applied to determine the relative sensitivity of five variables—water–cement ratio (W/C), superplasticizer dosage (SP), RCA saturation, RFA saturation, and sand ratio—based on variations in strength across factor levels. analysis of variance was conducted to assess the statistical significance of each factor’s influence on compressive and tensile strength, using F-values and p-values. Spearman’s rank correlation analysis was used to examine monotonic relationships between variables and strength properties without assuming linearity. Furthermore, a multiple linear regression model was established using the Enter method in SPSS, with all factors included simultaneously to explore possible predictive relationships. Repeated experiments were carried out to provide additional data for verifying the model’s reliability. All statistical procedures were based on the mean values of three specimens per group to minimize random error and enhance consistency in analysis.

3. Results and Analysis

3.1. Basic Analysis

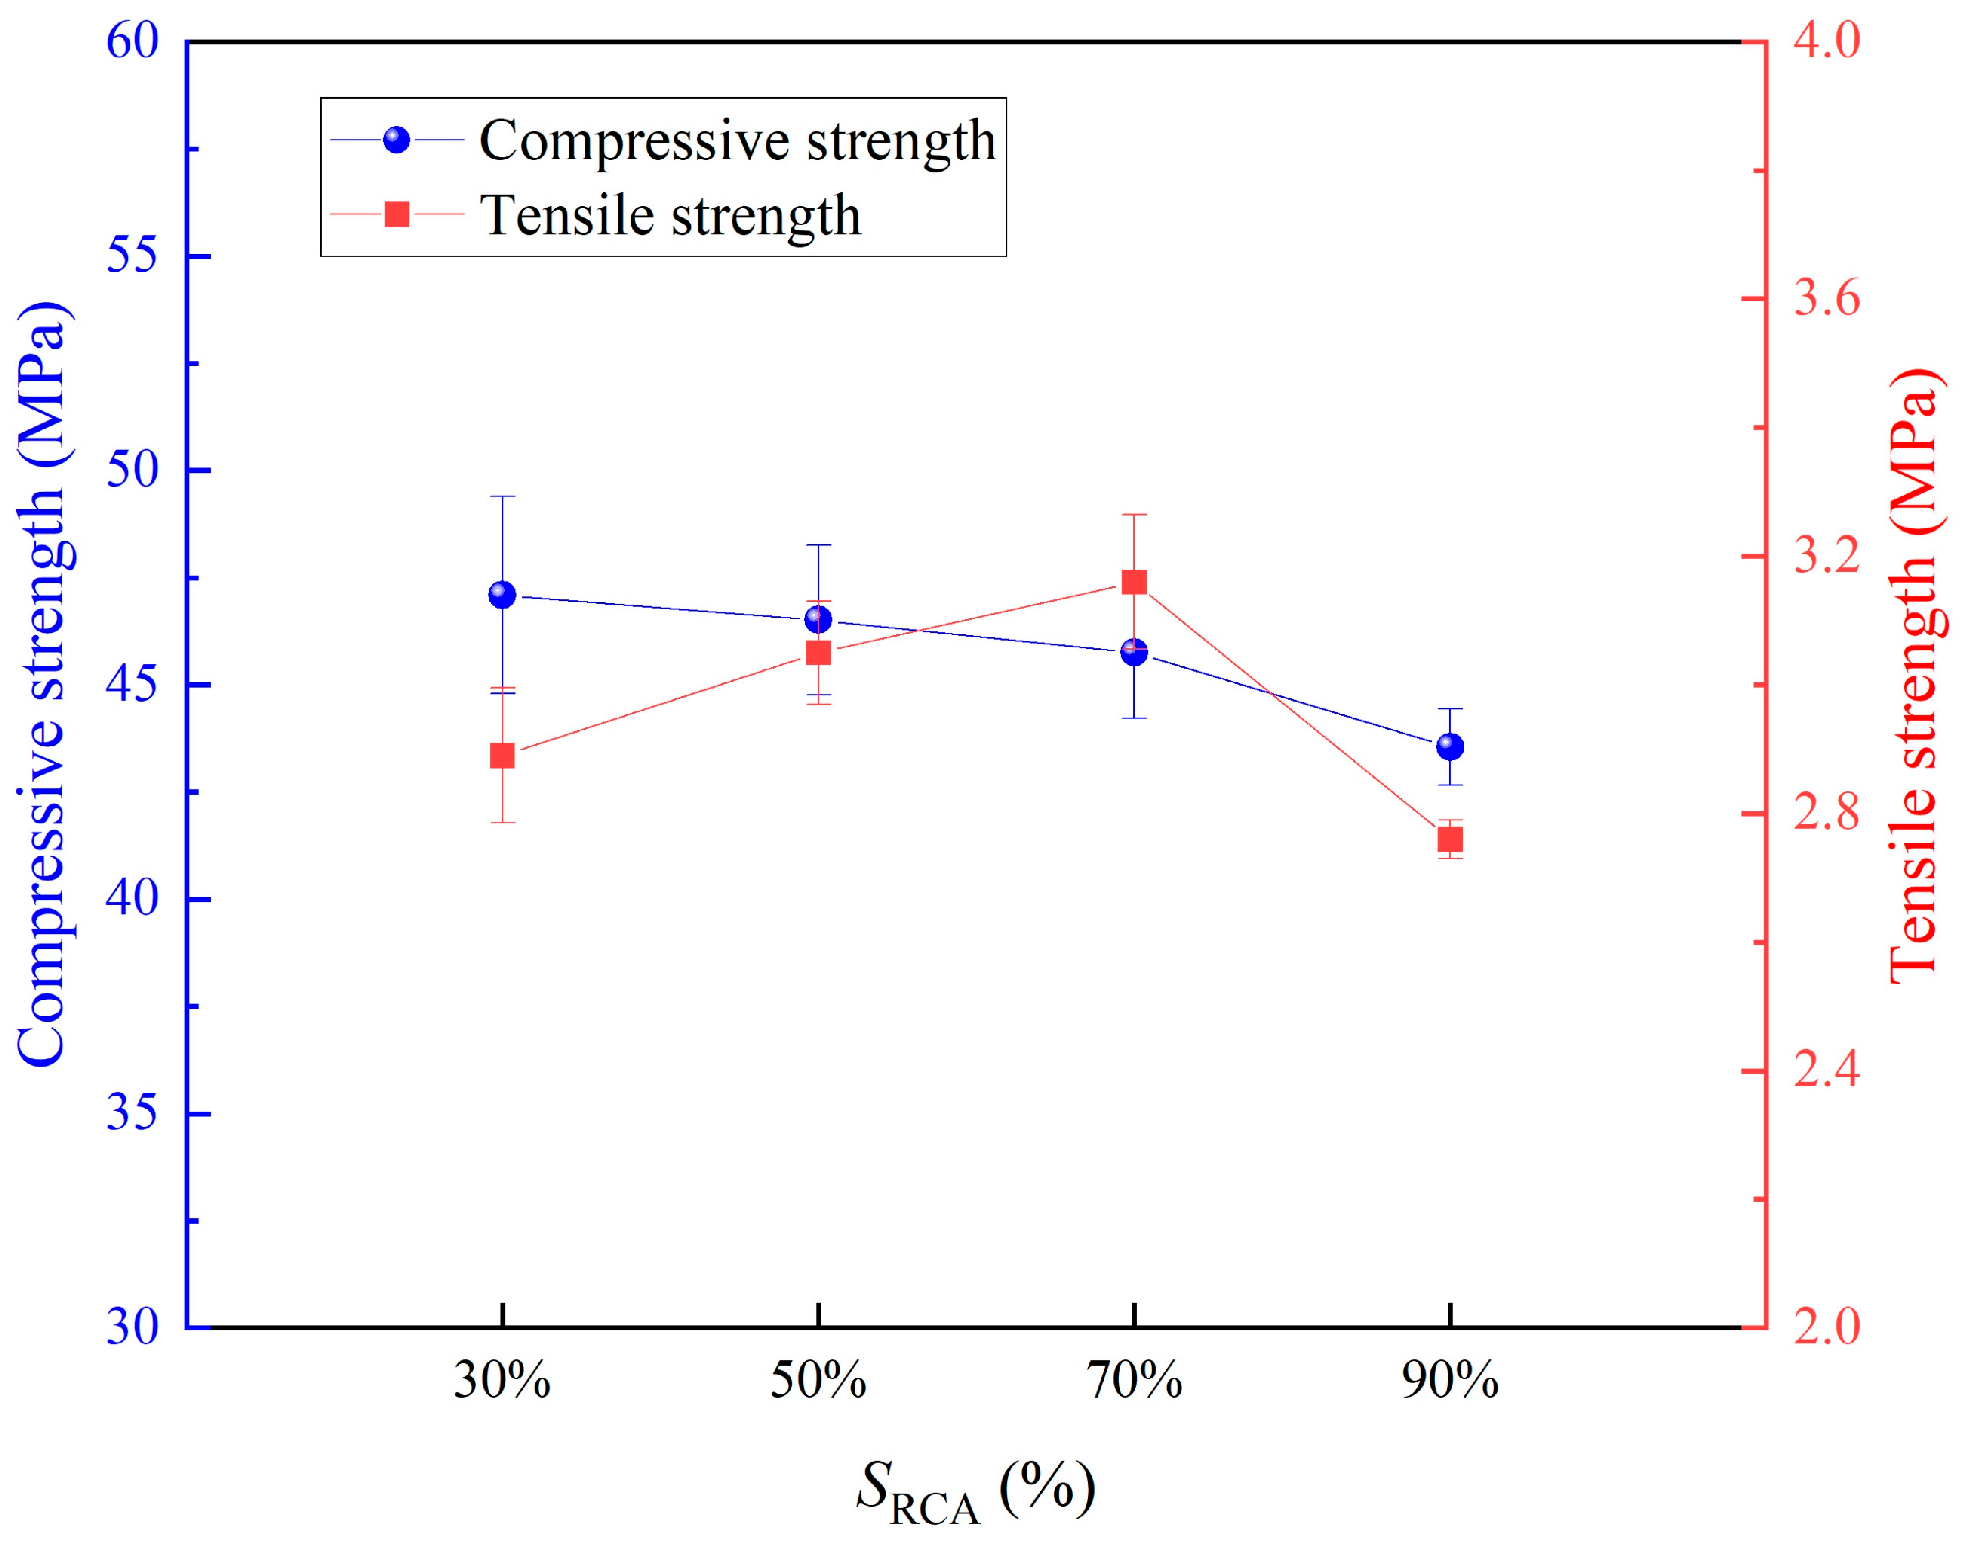
Figure 4, Figure 5, Figure 6, Figure 7 and Figure 8 illustrate the influence trends of various factors on the fundamental mechanical properties of FRAC. Each data point in Figure 4, Figure 5, Figure 6, Figure 7 and Figure 8 represents the average of three specimens for a given mix, and the error bars indicate the range between the maximum and minimum values obtained. The optimal combination for compressive strength was identified as A4B4C1D1E1, corresponding to a W/C of 0.3, SP dosage of 1.5%, SRCA of 30%, SRFA of 25%, and sand ratio of 20%. For splitting tensile strength, the highest value was achieved with the combination A4B3C3D1E4, representing a W/C of 0.3, SP dosage of 1%, SRCA of 70%, SRFA of 25%, and sand ratio of 50%.
As shown in Figure 4, an increase in SRCA led to a slight reduction in compressive strength, while tensile strength first increased and then decreased. Specifically, as SRCA increased from 30% to 90%, compressive strength decreased by 8.1%. When SRCA increased from 30% to 70%, tensile strength increased by 13.8%; however, a further increase from 70% to 90% resulted in a 14.5% decline. It is worth noting that the error bars for SRCA at 30% and 90% are relatively large, which may be attributed to inconsistent moisture distribution and quality variability of RCA at extreme saturation levels, leading to more pronounced fluctuations in strength results.
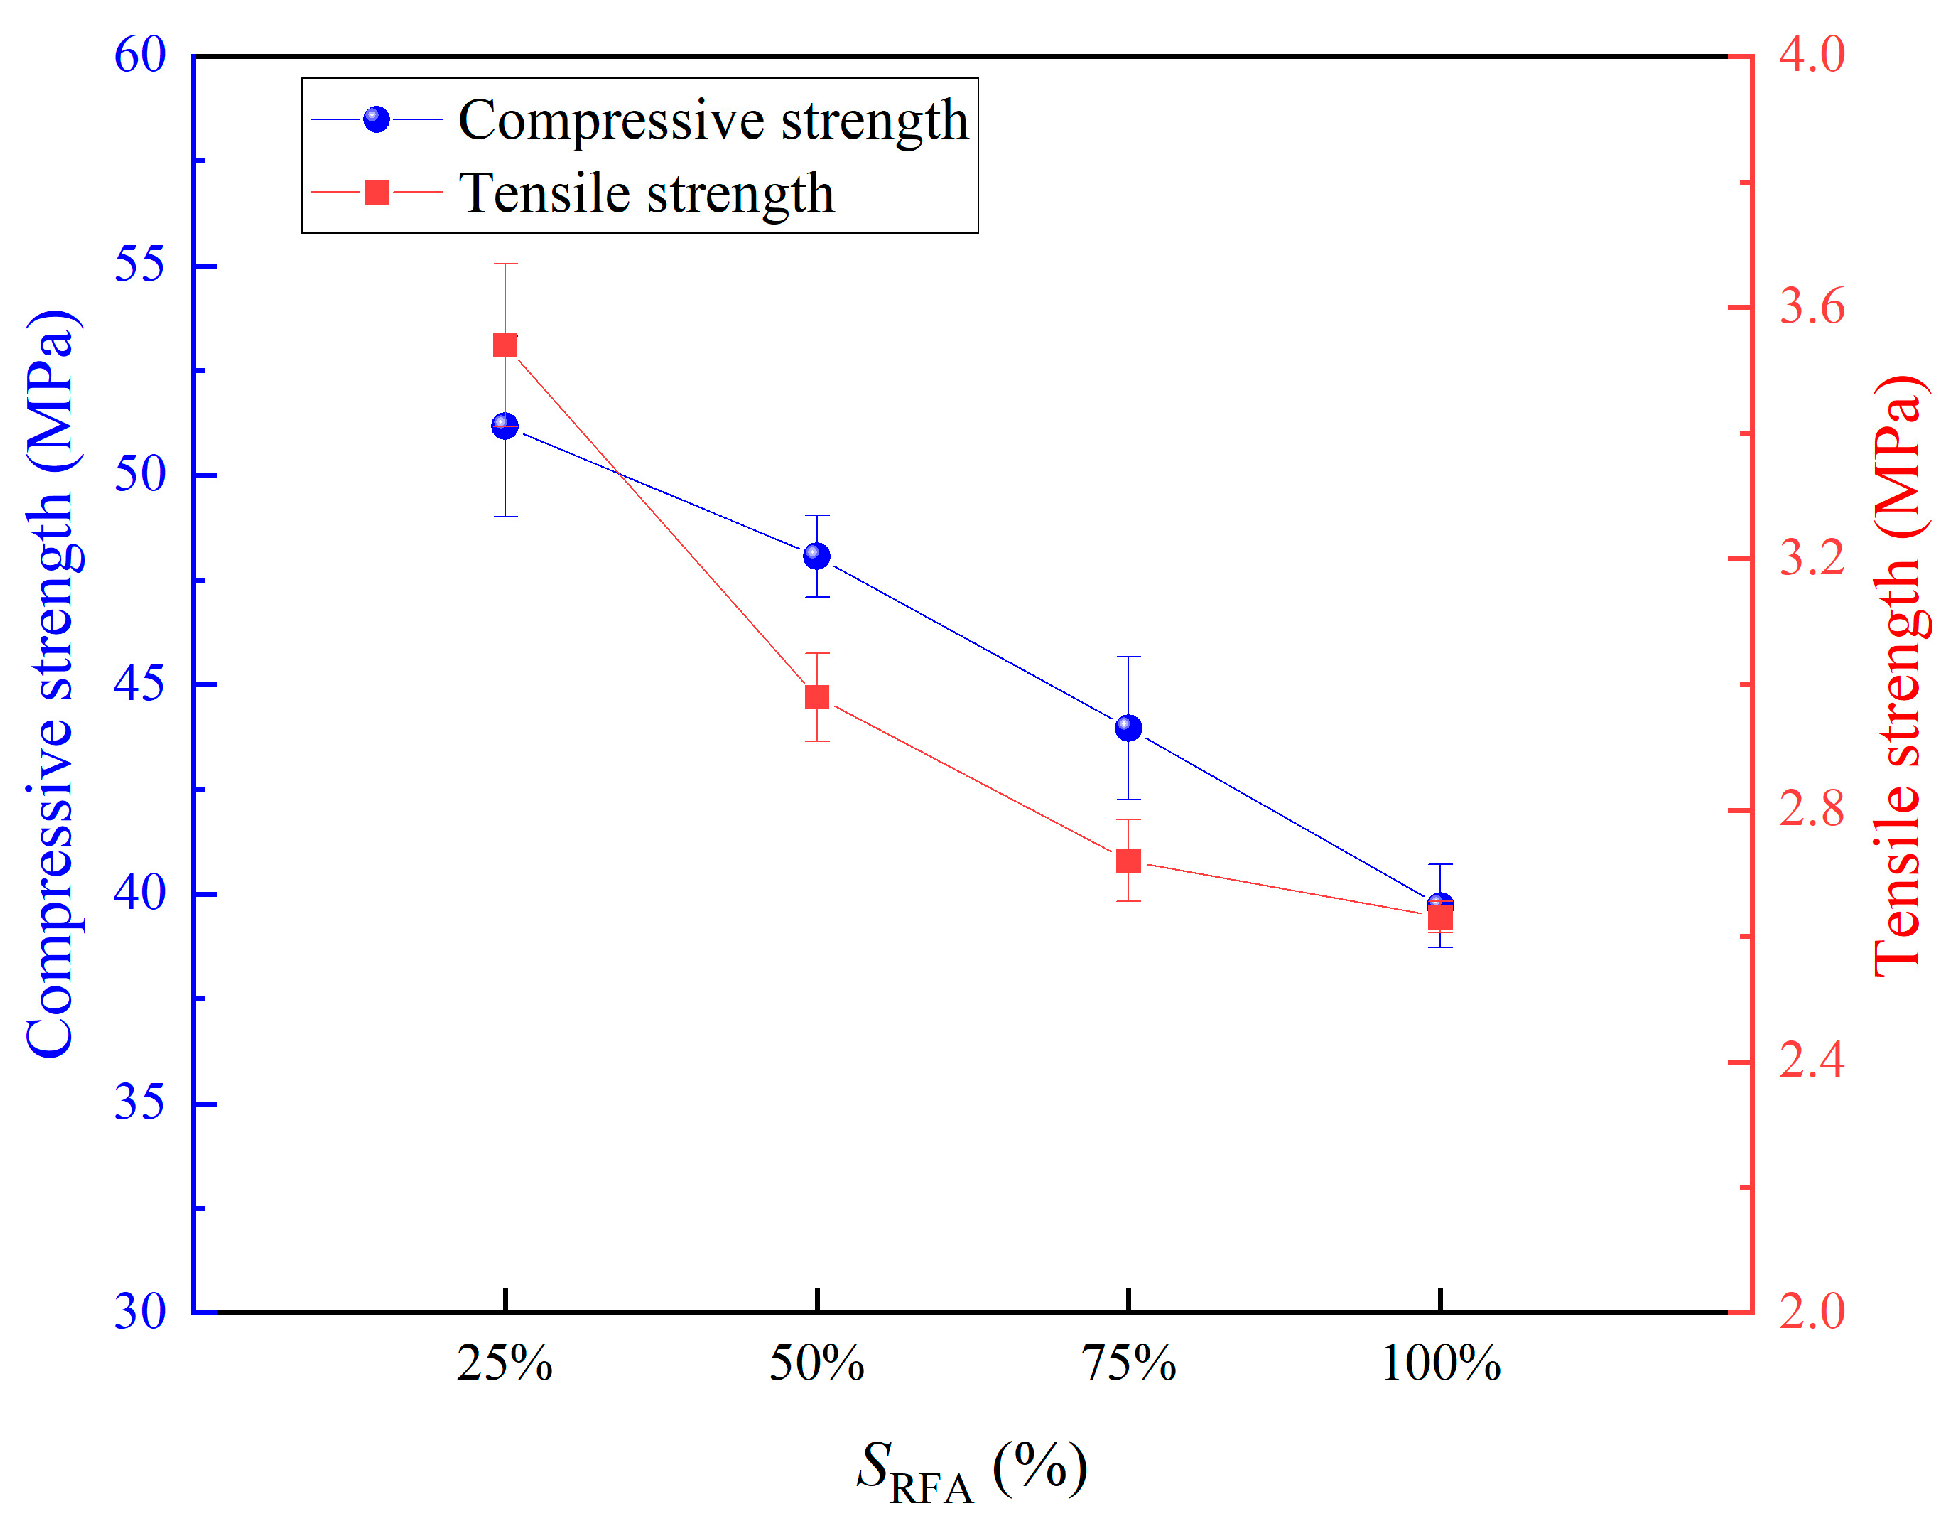
Figure 5 demonstrates that both compressive and tensile strengths decreased significantly with increasing SRFA, with tensile strength being more sensitive. When SRFA saturation rose from 25% to 100%, compressive strength declined by 28.8%, and tensile strength decreased by 34.6%. Compared to other variables, the error bars in this figure are visibly larger, especially at lower saturation levels. This may be due to the finer particle size and high absorption capacity of RFA, which can result in uneven water distribution during mixing, thus increasing the variability in mechanical performance.
These trends can be attributed to the moisture exchange behavior of recycled aggregates during cement hydration. Before reaching a saturation threshold, recycled aggregates tend to absorb more water than they release. In this state, water fills the microvoids and cracks in the adhered mortar, softening the aggregates but also reducing the local W/C at the ITZ, leading to denser hydration products and increased strength. Conversely, once the saturation threshold is exceeded, aggregates tend to release more water than they absorb. This not only compromises aggregate hardness but also increases the local W/C in the ITZ, raising porosity and ultimately weakening mechanical performance.
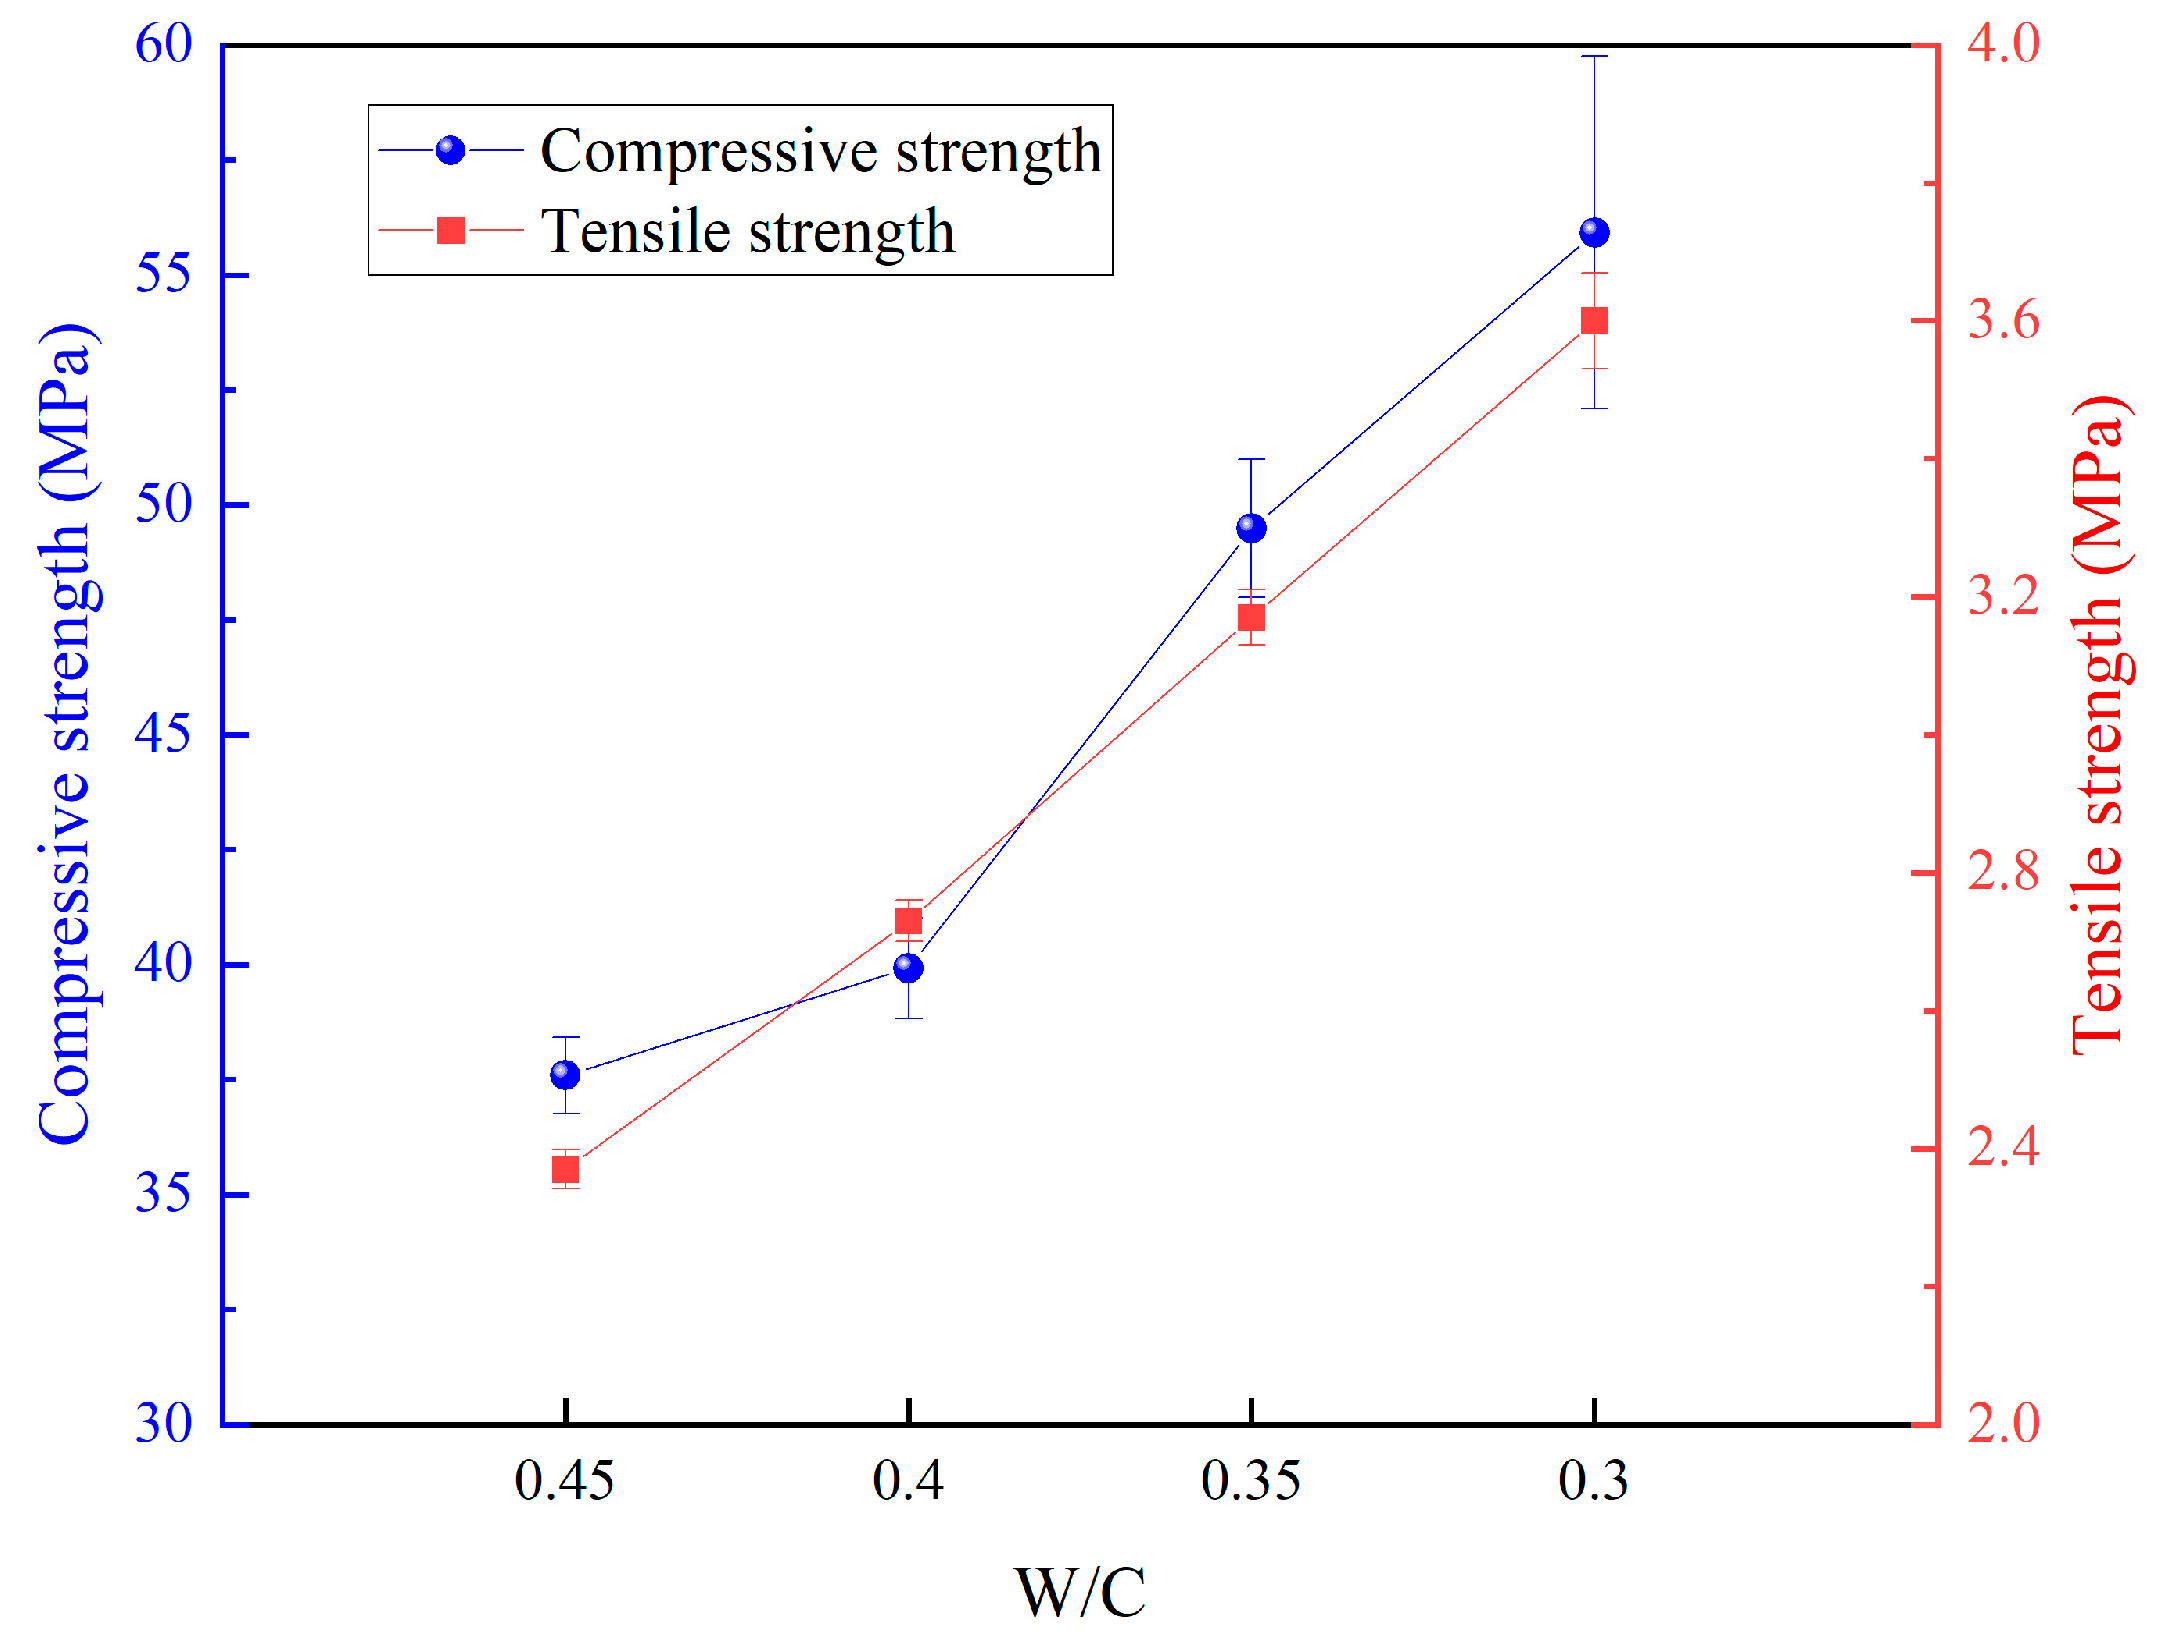
As shown in Figure 6, the influence of the W/C on the basic mechanical properties of FRAC exhibits clear monotonic behavior. When the W/C decreased from 0.45 to 0.30, the compressive strength increased by 48.7%, and the tensile strength increased by 51.9%. This pronounced linear trend indicates that the mechanical performance of FRAC continues to comply with the classical water–cement ratio law of conventional concrete. As the W/C ratio decreased, the hydration degree of the cementitious matrix was significantly improved, enhancing the ITZ bonding performance. However, the intrinsic variability of recycled aggregates was not fundamentally improved, and their discrete characteristics remained. Therefore, although the overall strength of FRAC increased, recycled aggregate remained the limiting factor for strength development. This led to relatively larger error bars at lower W/C, reflecting the growing influence of aggregate variability under stronger matrix conditions.
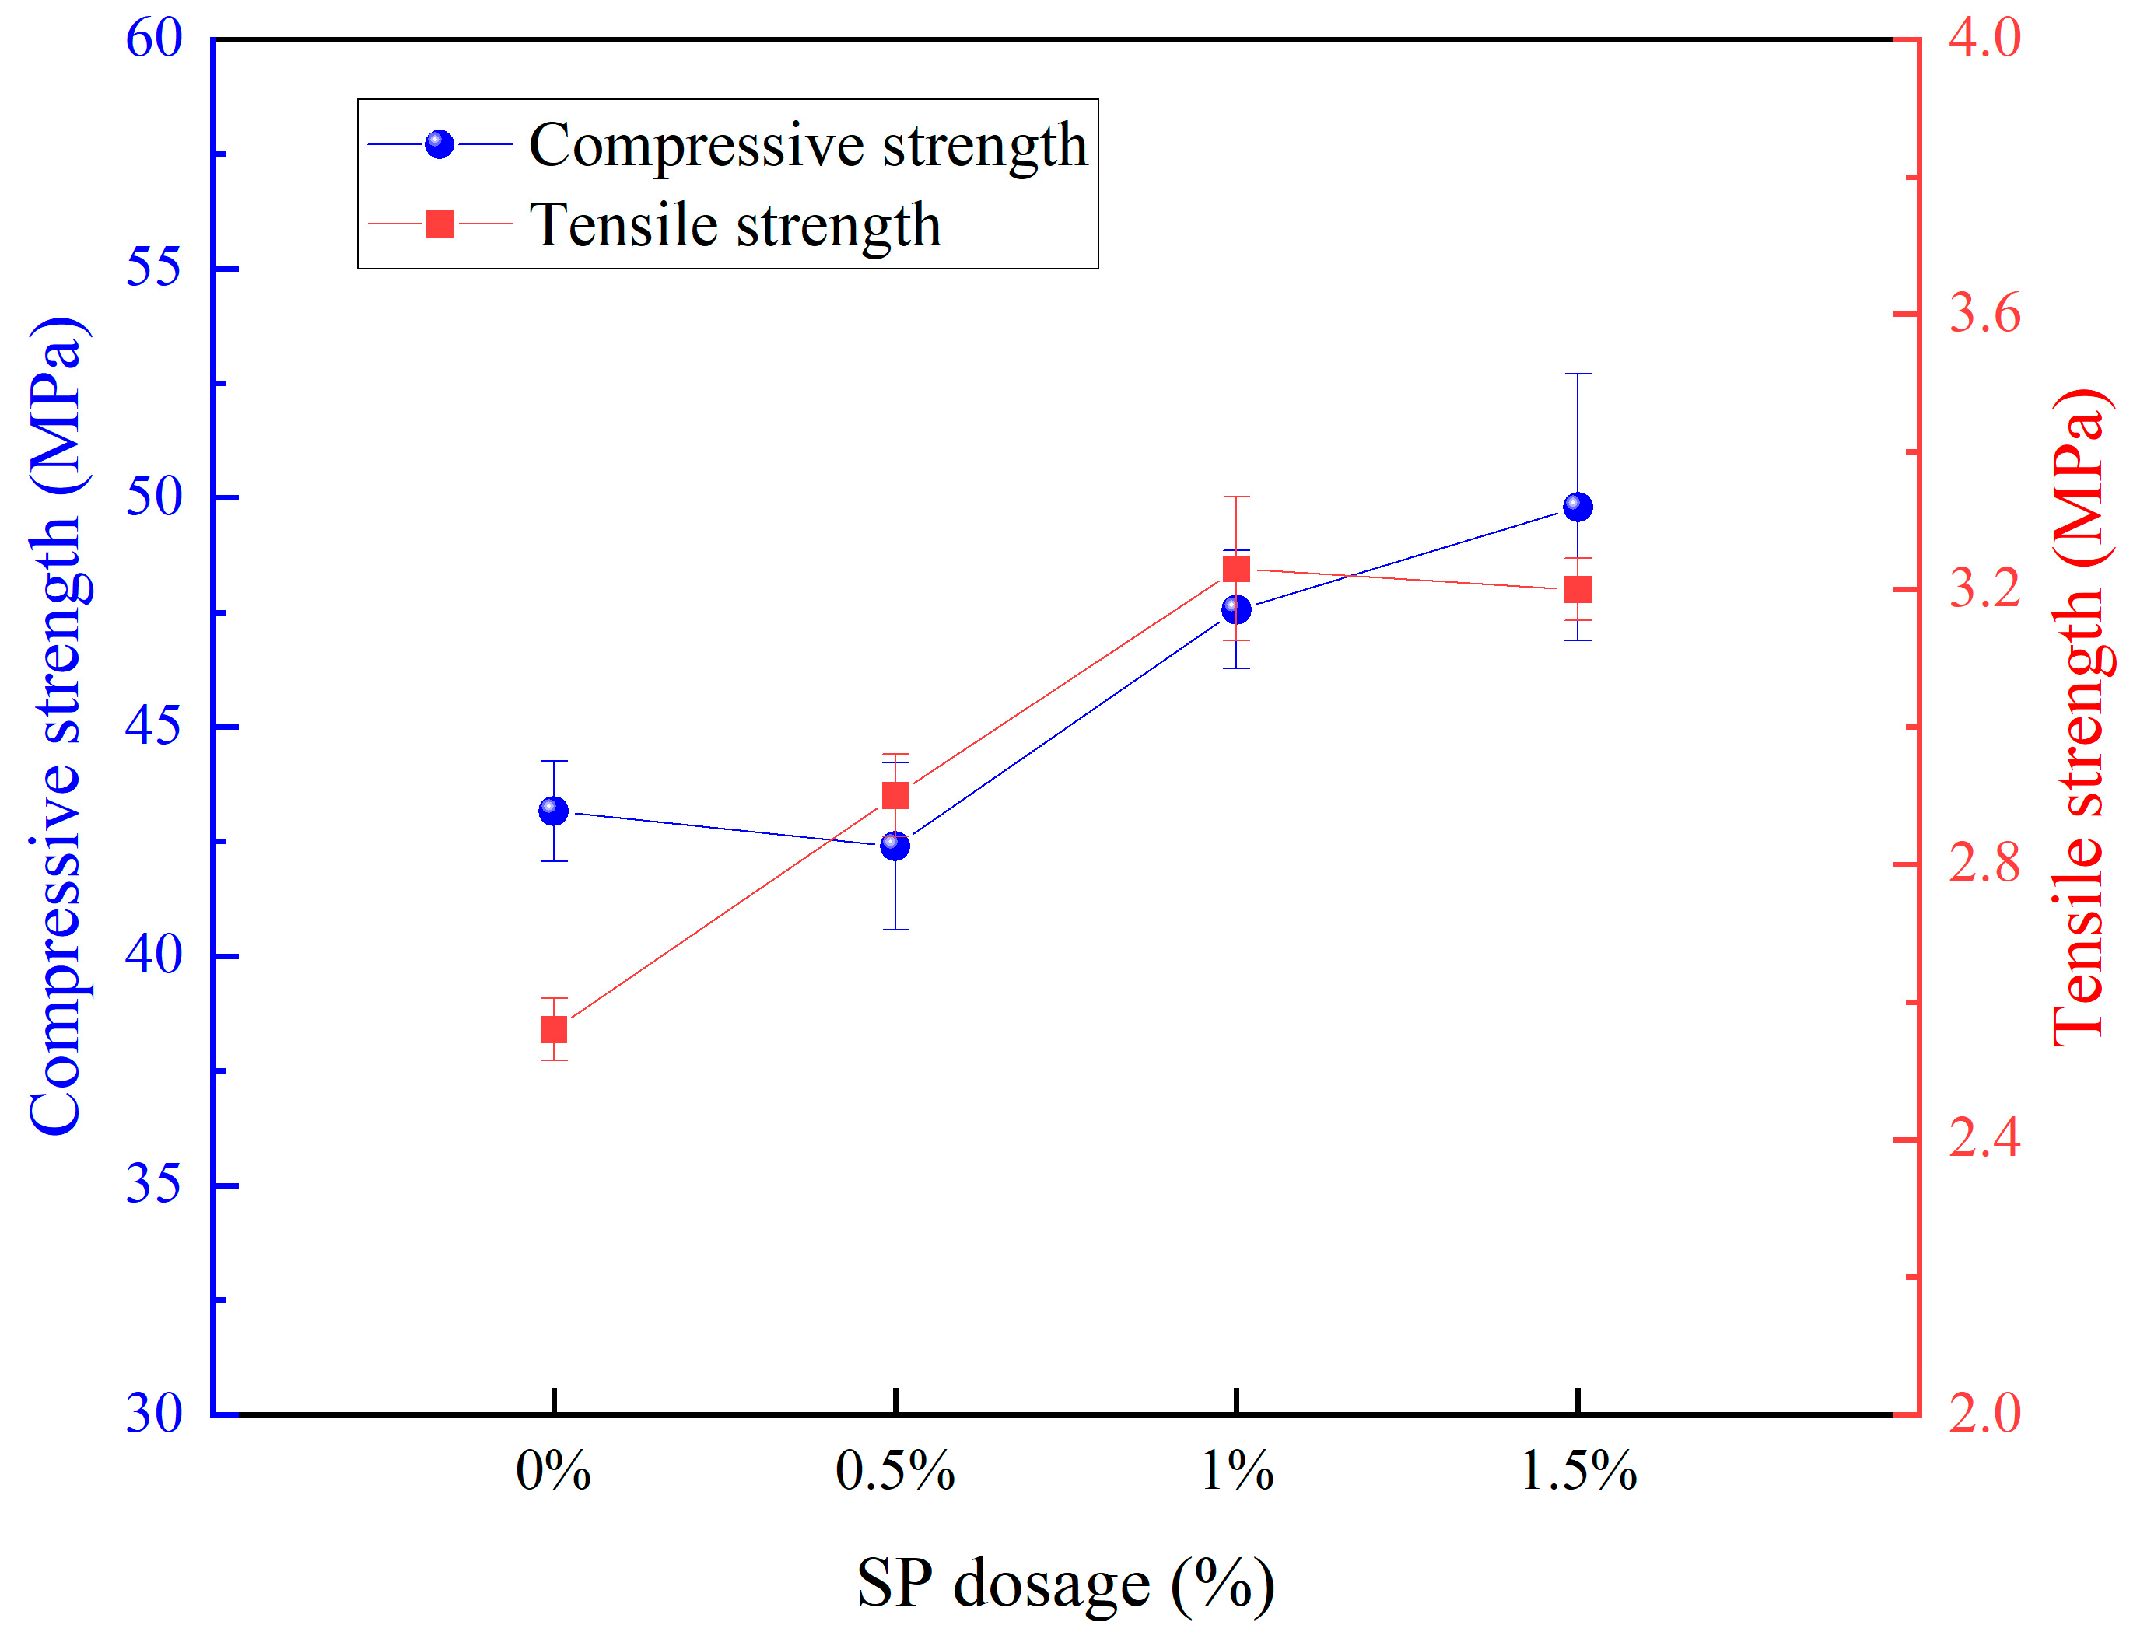
Figure 7 illustrates the effect of SP dosage. When the dosage increased from 0% to 0.5%, compressive strength showed no significant change. However, as the dosage increased from 0.5% to 1.5%, compressive strength improved by 17.5%. In terms of tensile strength, an increase from 0% to 1% led to a 26.2% gain, whereas a further increase from 1% to 1.5% resulted in a slight decline. This is primarily because tensile strength is more sensitive to the degree of cement hydration, while compressive strength is more dependent on aggregate strength. At lower SP dosages, hydration enhancement may not strongly impact compressive strength but can noticeably improve tensile strength. As dosage continues to increase, the hydration effect approaches a threshold, beyond which the more uniform distribution of superplasticizer further enhances compressive strength but has a limited effect on tensile strength. This trend highlights the dual role of SP: improving workability and promoting particle dispersion, which initially enhances hydration and later contributes to matrix densification. However, excessive SP may reduce internal cohesion, particularly affecting tensile performance. In addition, at higher dosages, SP may cause uneven paste encapsulation of aggregates or reach a saturation point in dispersion capacity, leading to localized weak zones in the matrix. These effects could partly explain the observed decline in tensile strength.
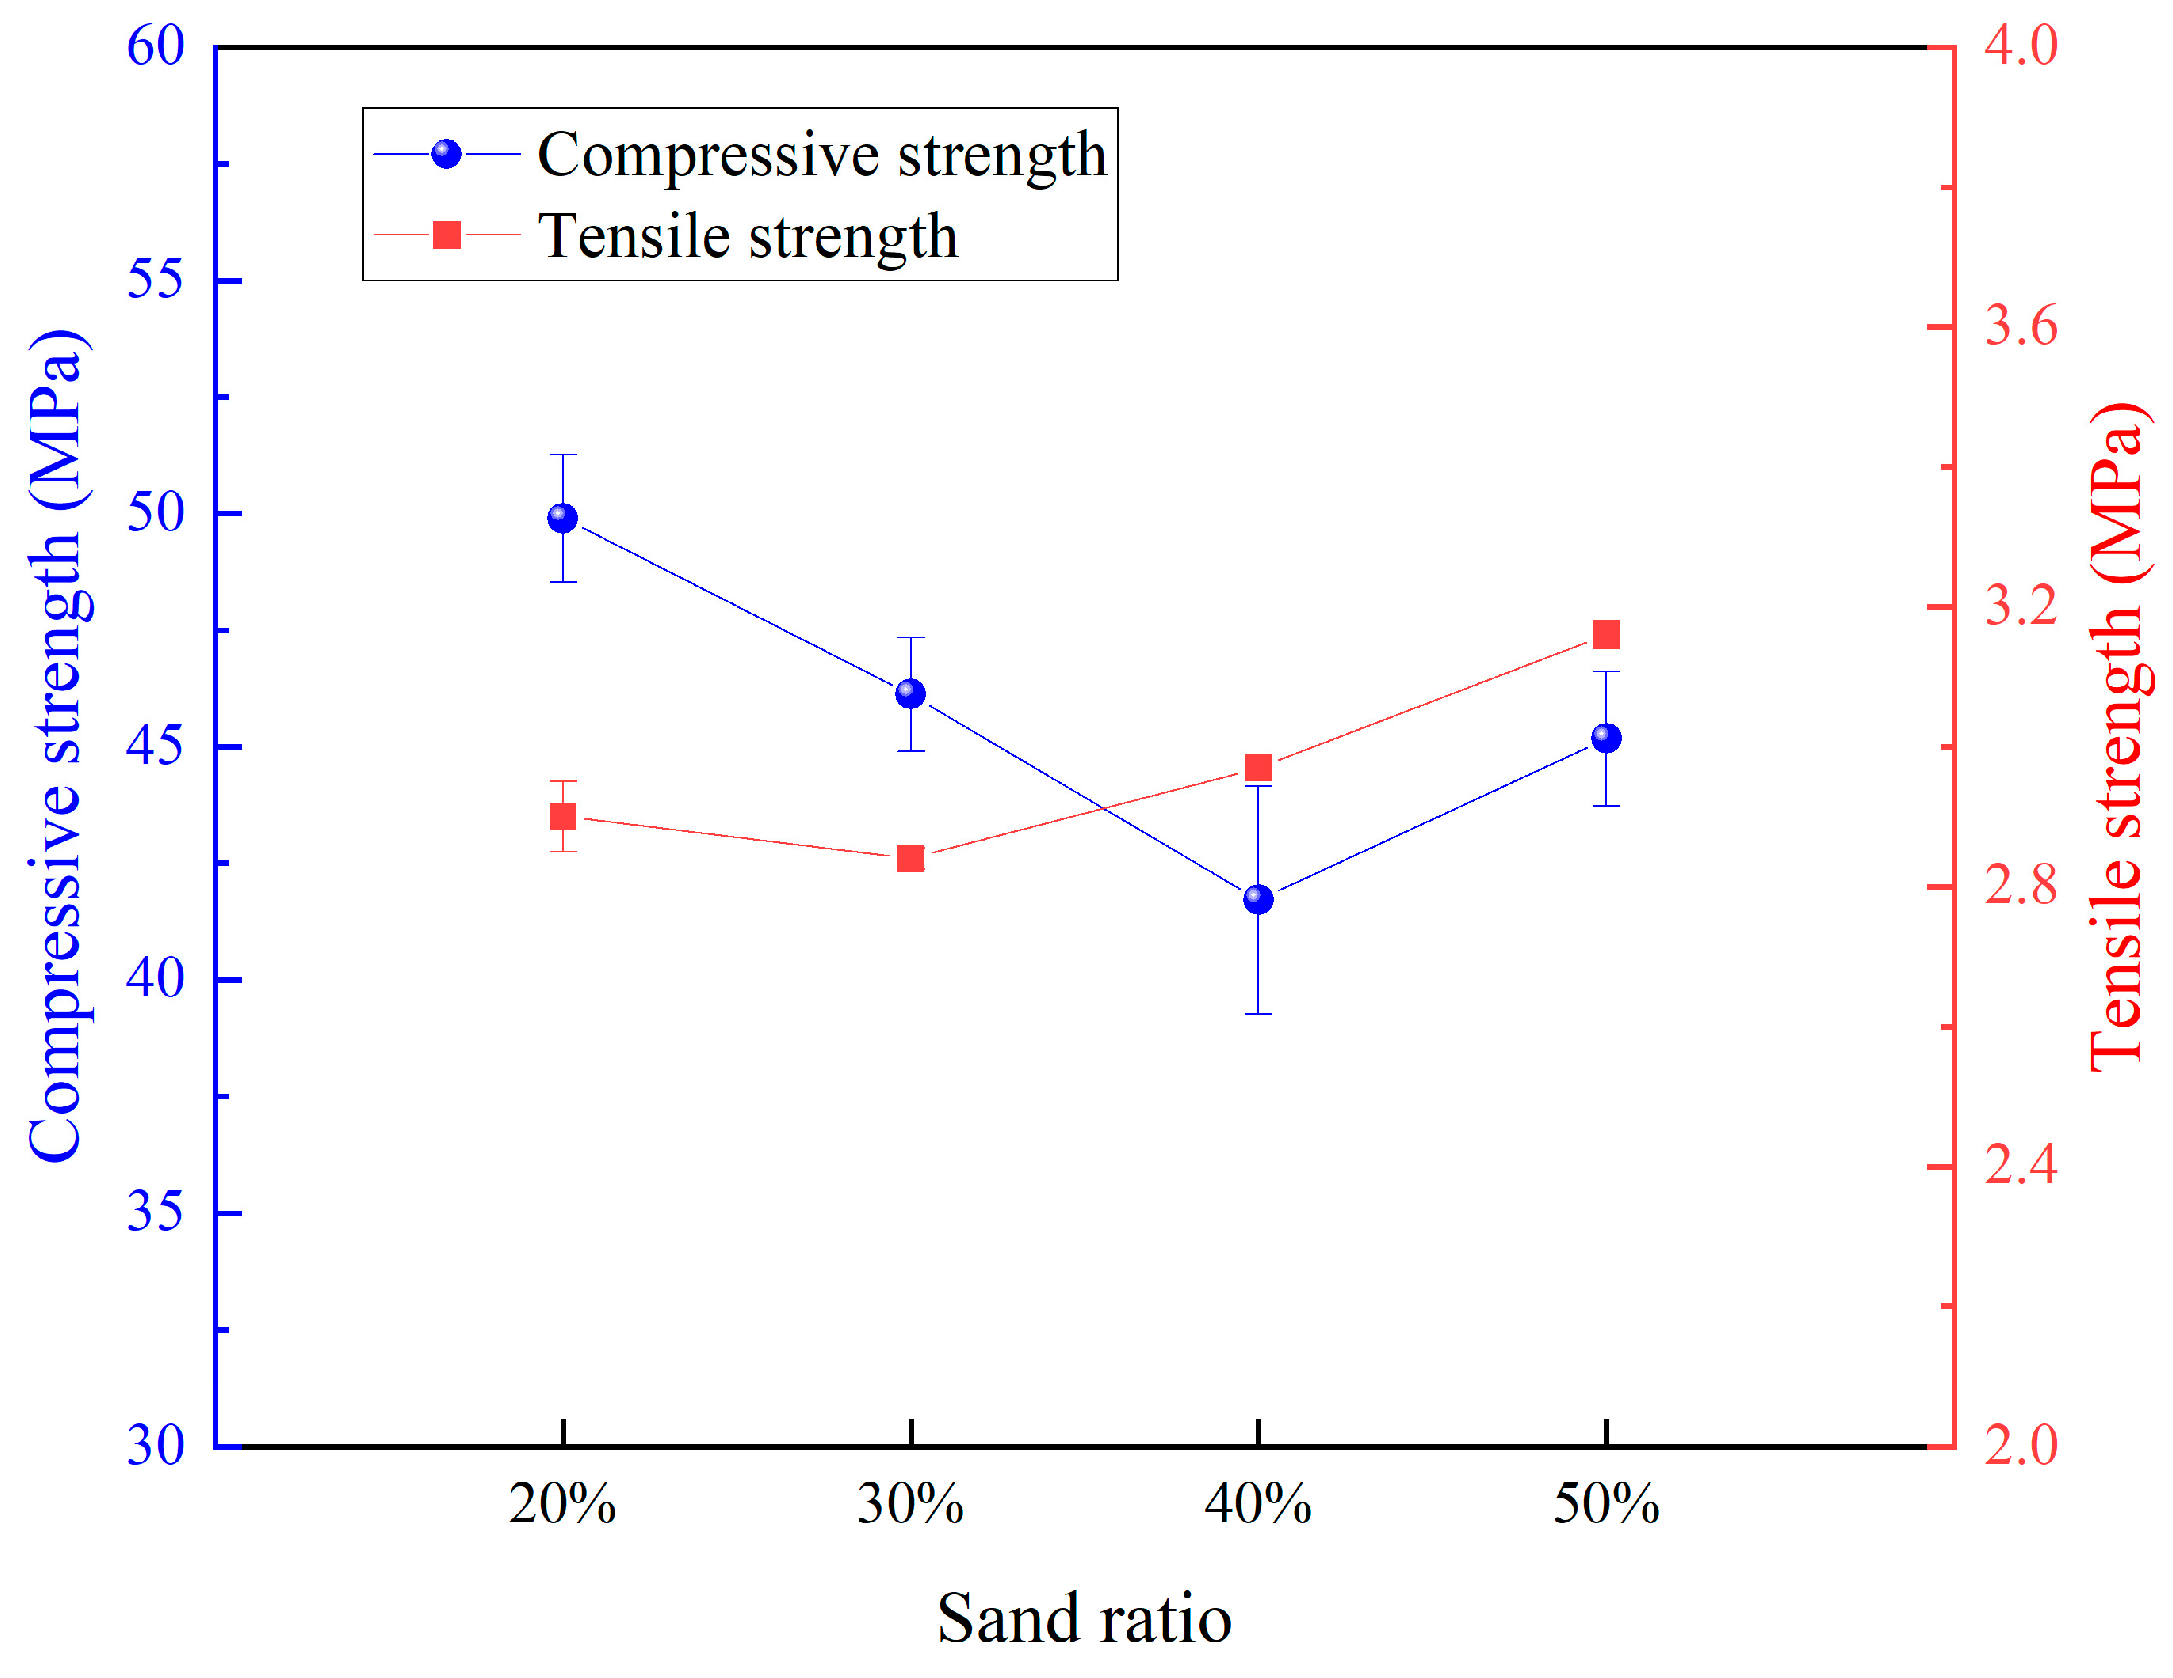
As shown in Figure 8, increasing the sand ratio initially reduced compressive strength, followed by a recovery. Meanwhile, tensile strength exhibited a slight upward trend. When the sand ratio increased from 20% to 40%, tensile strength decreased by 19.6%. However, as the sand ratio increased from 40% to 50%, compressive strength increased by 8.3%, and the overall increase in tensile strength from 20% to 50% was 11.3%.

3.2. Range Analysis

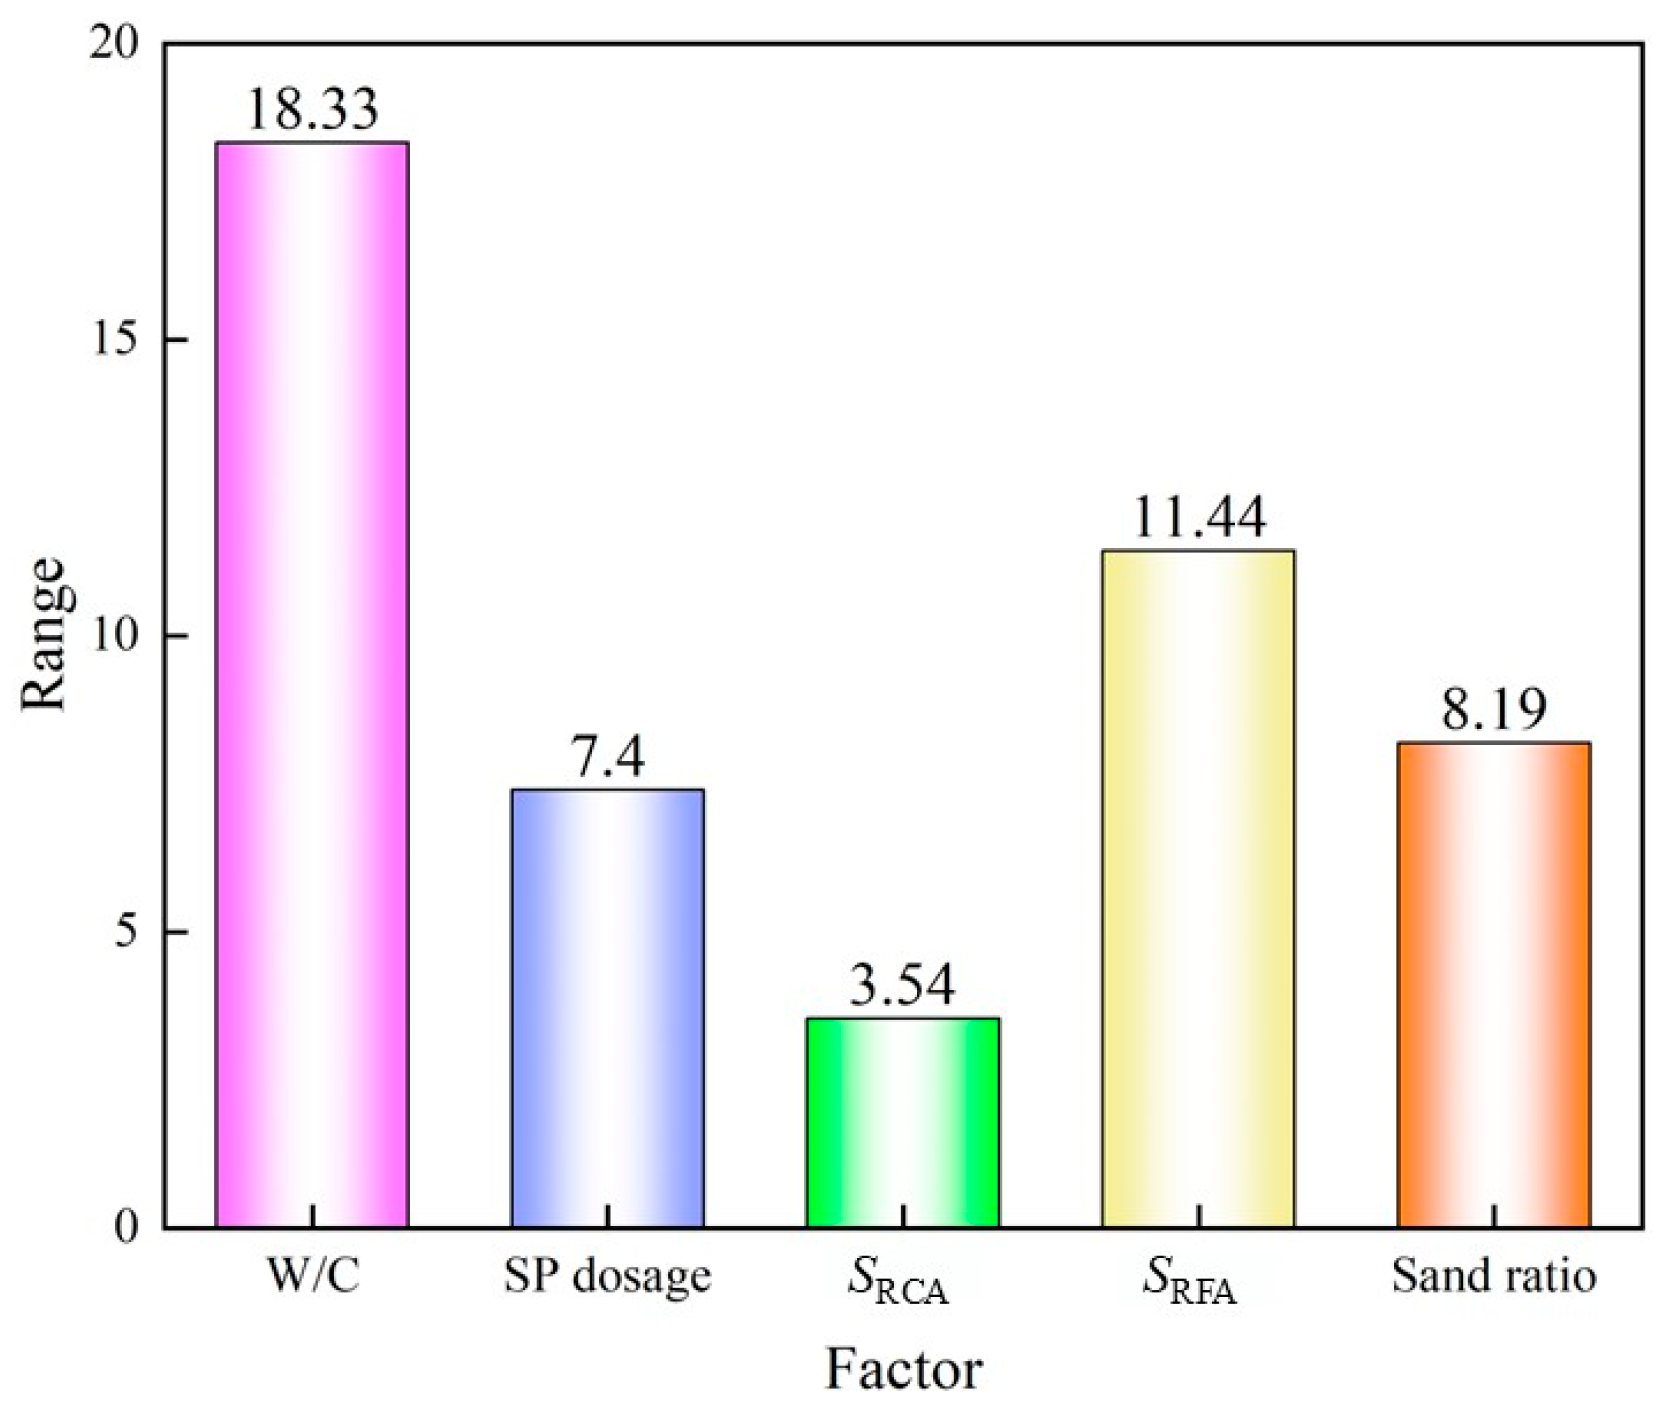
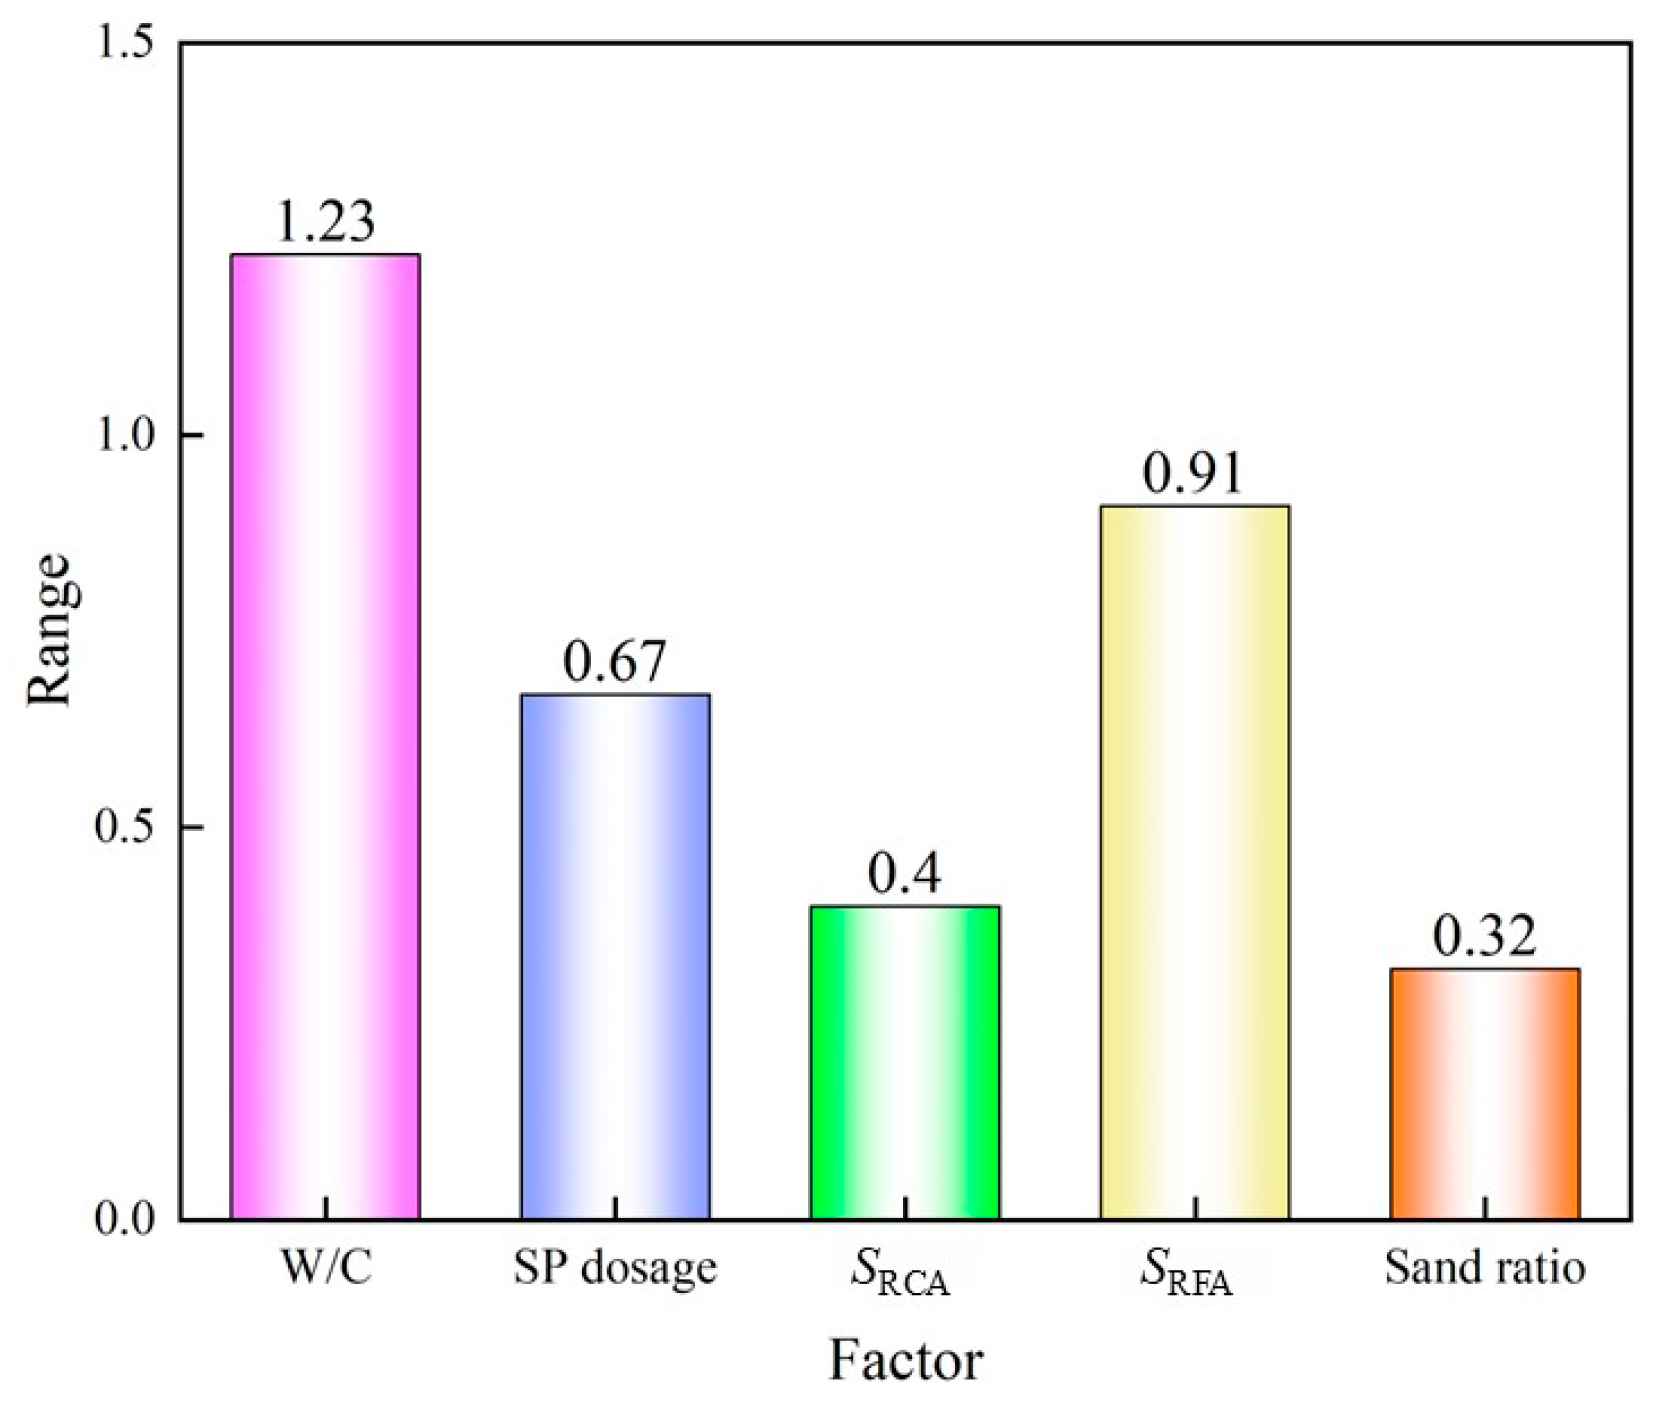
Range analysis is a commonly used method in orthogonal design that reflects the degree of influence of each factor’s level change on the evaluation indicators. The compressive strength and tensile strength results from Table 4 were processed using SPSS software, and the results are shown in Table 5. According to the calculation of ki, the optimal combination for compressive strength is A4B4C1D1E1, and the optimal combination for tensile strength is A4B3C3D1E4, which is consistent with the maximum values obtained from the intuitive analysis of the experimental results. As shown in Figure 9, the range of compressive strength variation is RA > RD > RE > RB > RC, meaning the significance of the factors affecting the compressive strength of the FRAC, in order, is: W/C > SRFA > sand ratio > SP dosage > SRCA. As shown in Figure 10, the range of tensile strength variation is RA > RD > RB > RC > RE, indicating that the significance of the factors affecting the tensile strength of FRAC, in order, is: W/C > SRFA > SP dosage > SRCA > sand ratio. These results indicate that changes in the SRFA cause significant fluctuations in the mechanical properties of the FRAC, while the SRCA has a greater impact on the compressive strength than on the tensile strength of the FRAC.

3.3. Variance Analysis

Analysis of variance is a method used in orthogonal design to study the variability of data. To further investigate the effects of various factors on the mechanical performance indicators of FRAC, a variance analysis was conducted on the data in Table 5. The data was processed using SPSS software, and the variance analysis results for compressive strength and tensile strength are shown in Table 6. SS represents the sum of squares of variance, which reflects the variation or error caused by the differences in the experimental results at each factor level. DF represents degrees of freedom, MS stands for mean square, F value is the ratio of mean square effects to mean square error, and p value indicates the significance level. Generally, the smaller the p value, the more significant the main effect of the factor. When p < 0.01, it indicates that the effect of the factor is highly significant; when 0.01 < p ≤ 0.05, the effect is significant; and when 0.05 < p, the effect is not significant. The F value corresponds to critical values at different significance levels, such as when α is 0.01 or 0.05. From the F-distribution table, if FαF0.01, the factor has a highly significant effect (marked with **); if F0.05 < FαF0.01, the factor has a significant effect (marked with *); and if FαF0.05, the factor’s effect is not significant (marked with ——).
According to Table 6, at a 95% confidence interval, the W/C, SP dosage, RFA saturation, and sand ratio have a highly significant effect on the compressive strength of FRAC, while the RCA saturation has no significant effect on compressive strength. For tensile strength, the W/C, SP dosage, SRCA, SRFA, and sand ratio all have highly significant effects. Based on the size of the F values, the main order of influence on compressive strength is FA > FD > FB > FE > FC, and the main order of influence on tensile strength is FA > FD > FB > FC > FE. The results indicate that SRFA plays a critical role in the mechanical properties of FRAC, second only to the W/C, and cannot be overlooked in terms of its role in regulating the hydration process of the concrete.

4. Multiscale Failure Analysis

4.1. Microstructural Failure Characteristics

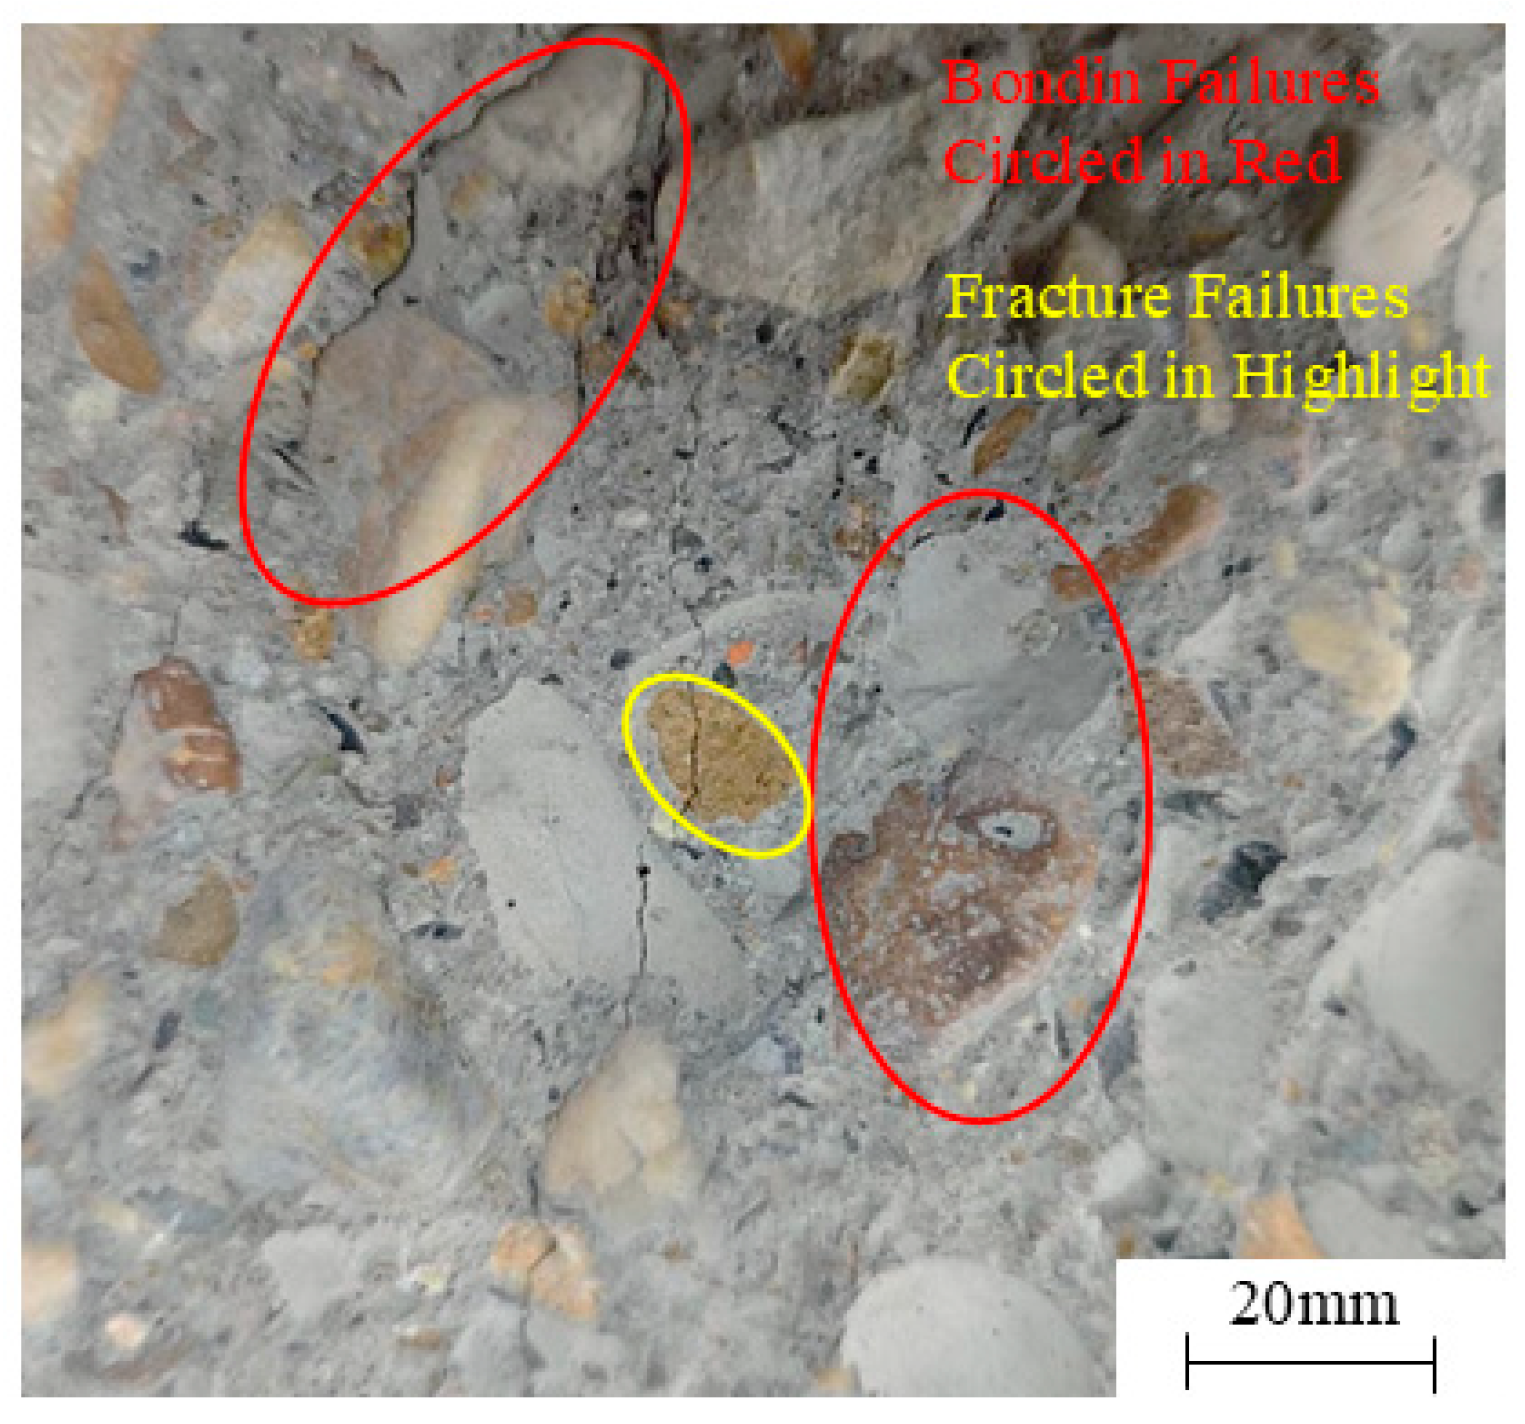
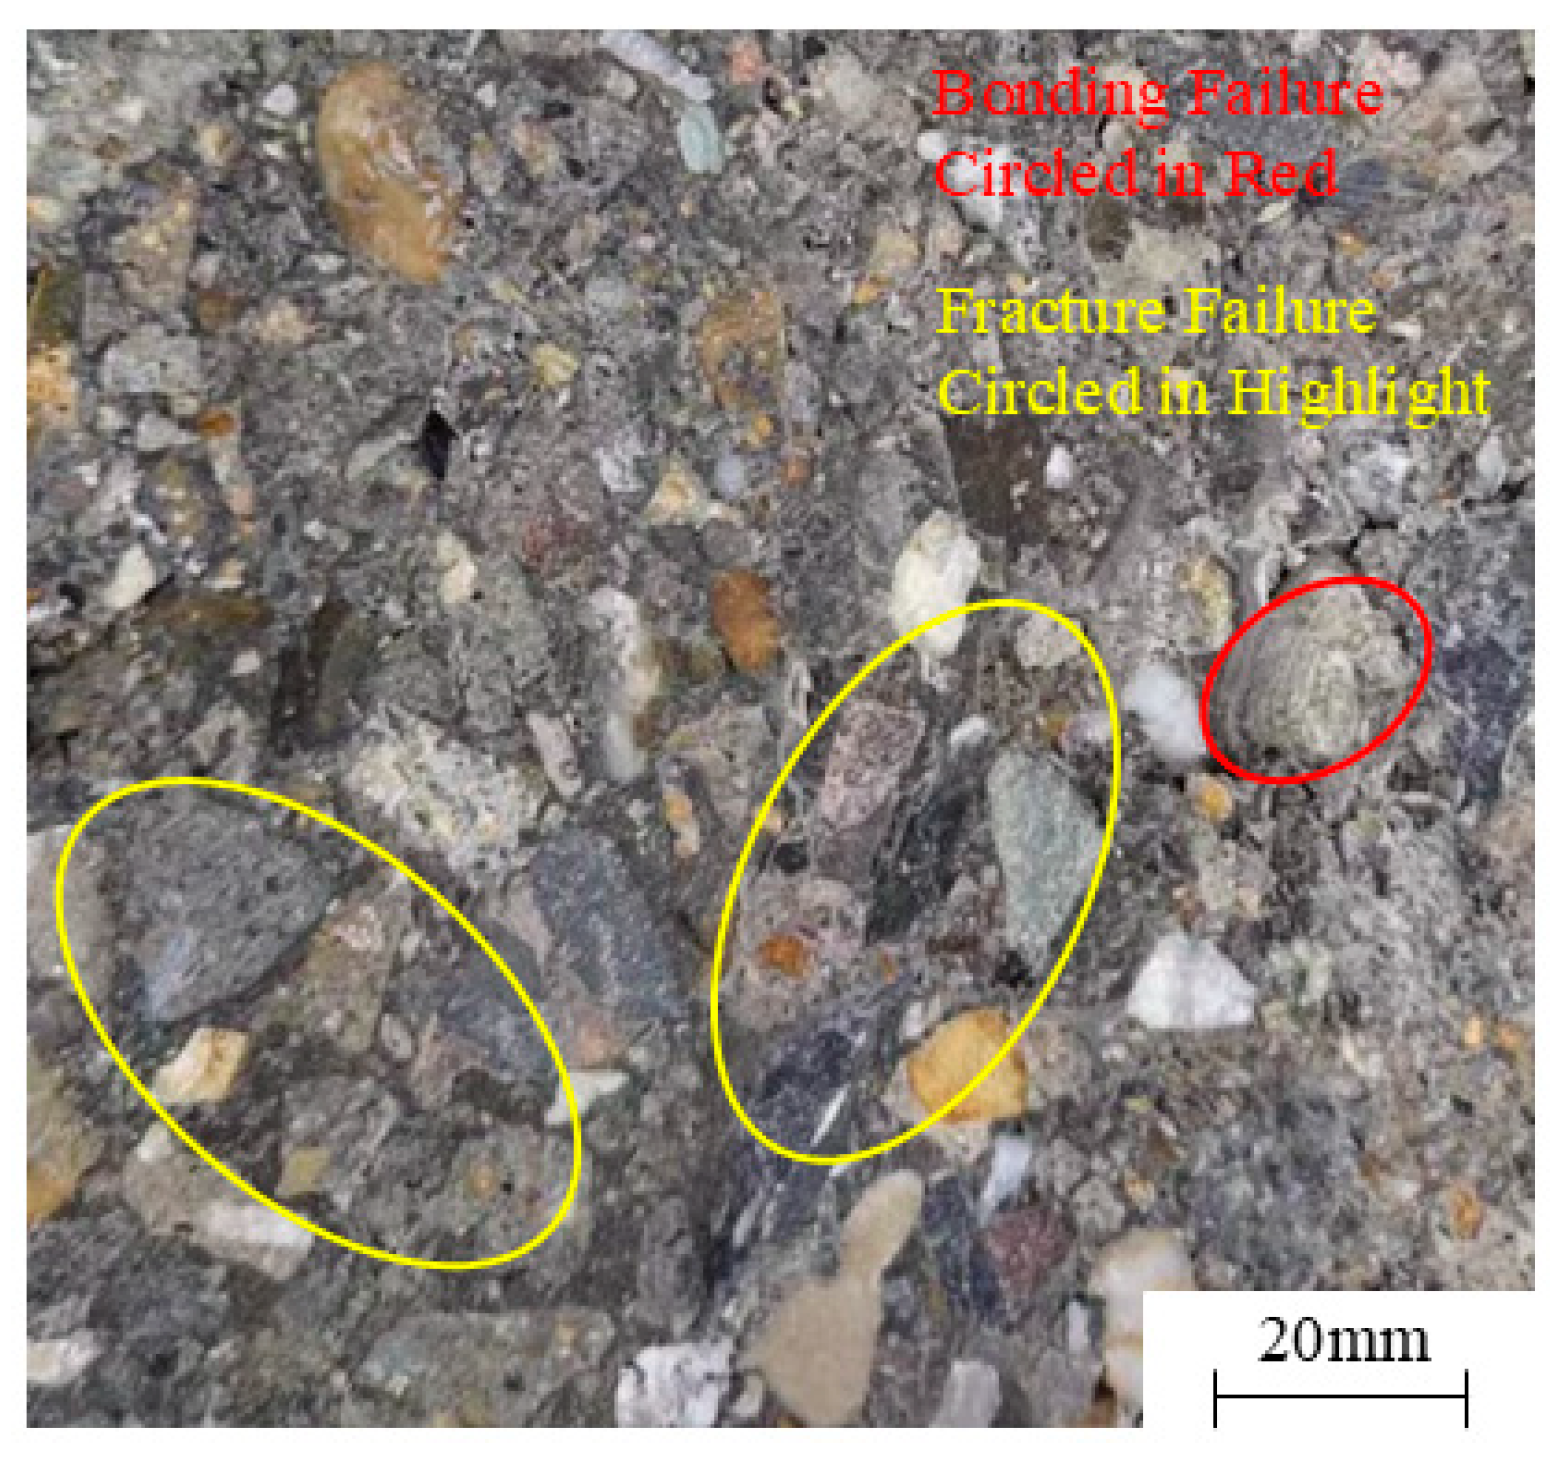
During the failure process of FRAC, different aggregate saturation degrees were found to significantly affect the microscopic failure characteristics. In this study, specimens corresponding to the best and worst-performing mix combinations were selected for comparative analysis. The macroscopic failure morphologies are shown in Figure 11 and Figure 12. Bonding failures (interfacial layer damage) are marked with red circles, while fracture failures (aggregate rupture) are highlighted.
In Figure 11 (SRCA 90%, SRFA 100%), bonding failures are predominant, indicating a weak ITZ and insufficient utilization of aggregate strength. This is attributed to the excessive saturation of recycled aggregates, which led to elevated local W/C in the ITZ, reducing the bonding force between the cement paste and the aggregates. Furthermore, the high free water content released from over-saturated aggregates increased the internal porosity of the concrete, resulting in lower strength and more pronounced interfacial damage.
In contrast, Figure 12 (SRCA 70%, SRFA 25%) exhibits fewer bonding failures and more aggregate fracture failures, indicating a denser and stronger ITZ capable of transferring higher stress. A saturation degree of 70% for RCA helps mitigate the water film effect at the interface, improving ITZ structure and bond strength. Meanwhile, a 25% saturation degree for RFA reduces porosity in the fine aggregate matrix, limits the formation of weak interfaces, and contributes to enhanced structural stability and improved compressive and tensile strength.
Additionally, the visual differences between the two figures further support these findings. In Figure 11 (W/C 0.4, sand ratio 40%), the surface appears lighter in color, the ITZ is loose, and the aggregate distribution is uneven—suggesting higher porosity and poor paste wrapping. In contrast, Figure 12 (W/C 0.3, sand ratio 50%) shows a darker surface tone, more uniform particle distribution, and greater structural compactness, indicating better gradation and improved concrete density.

4.2. Microscopic Failure Analysis

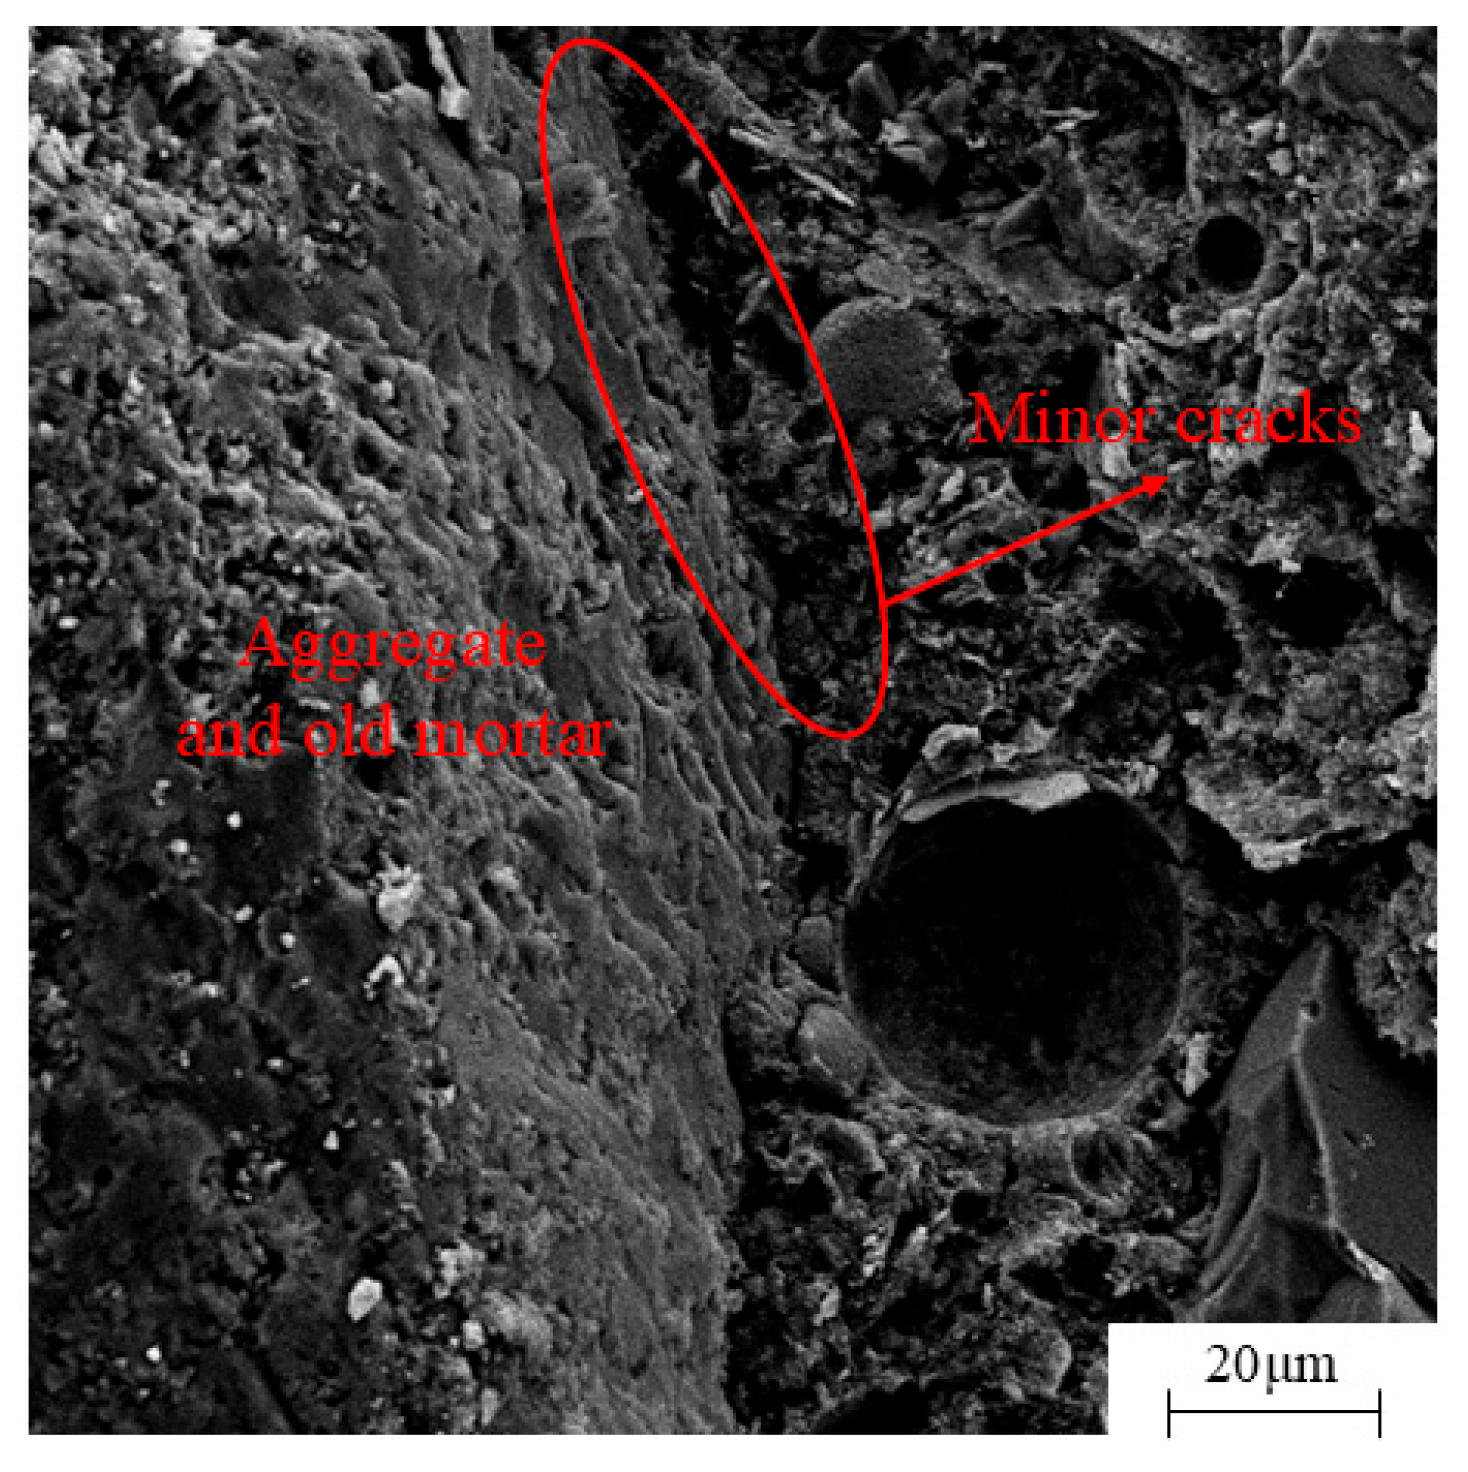
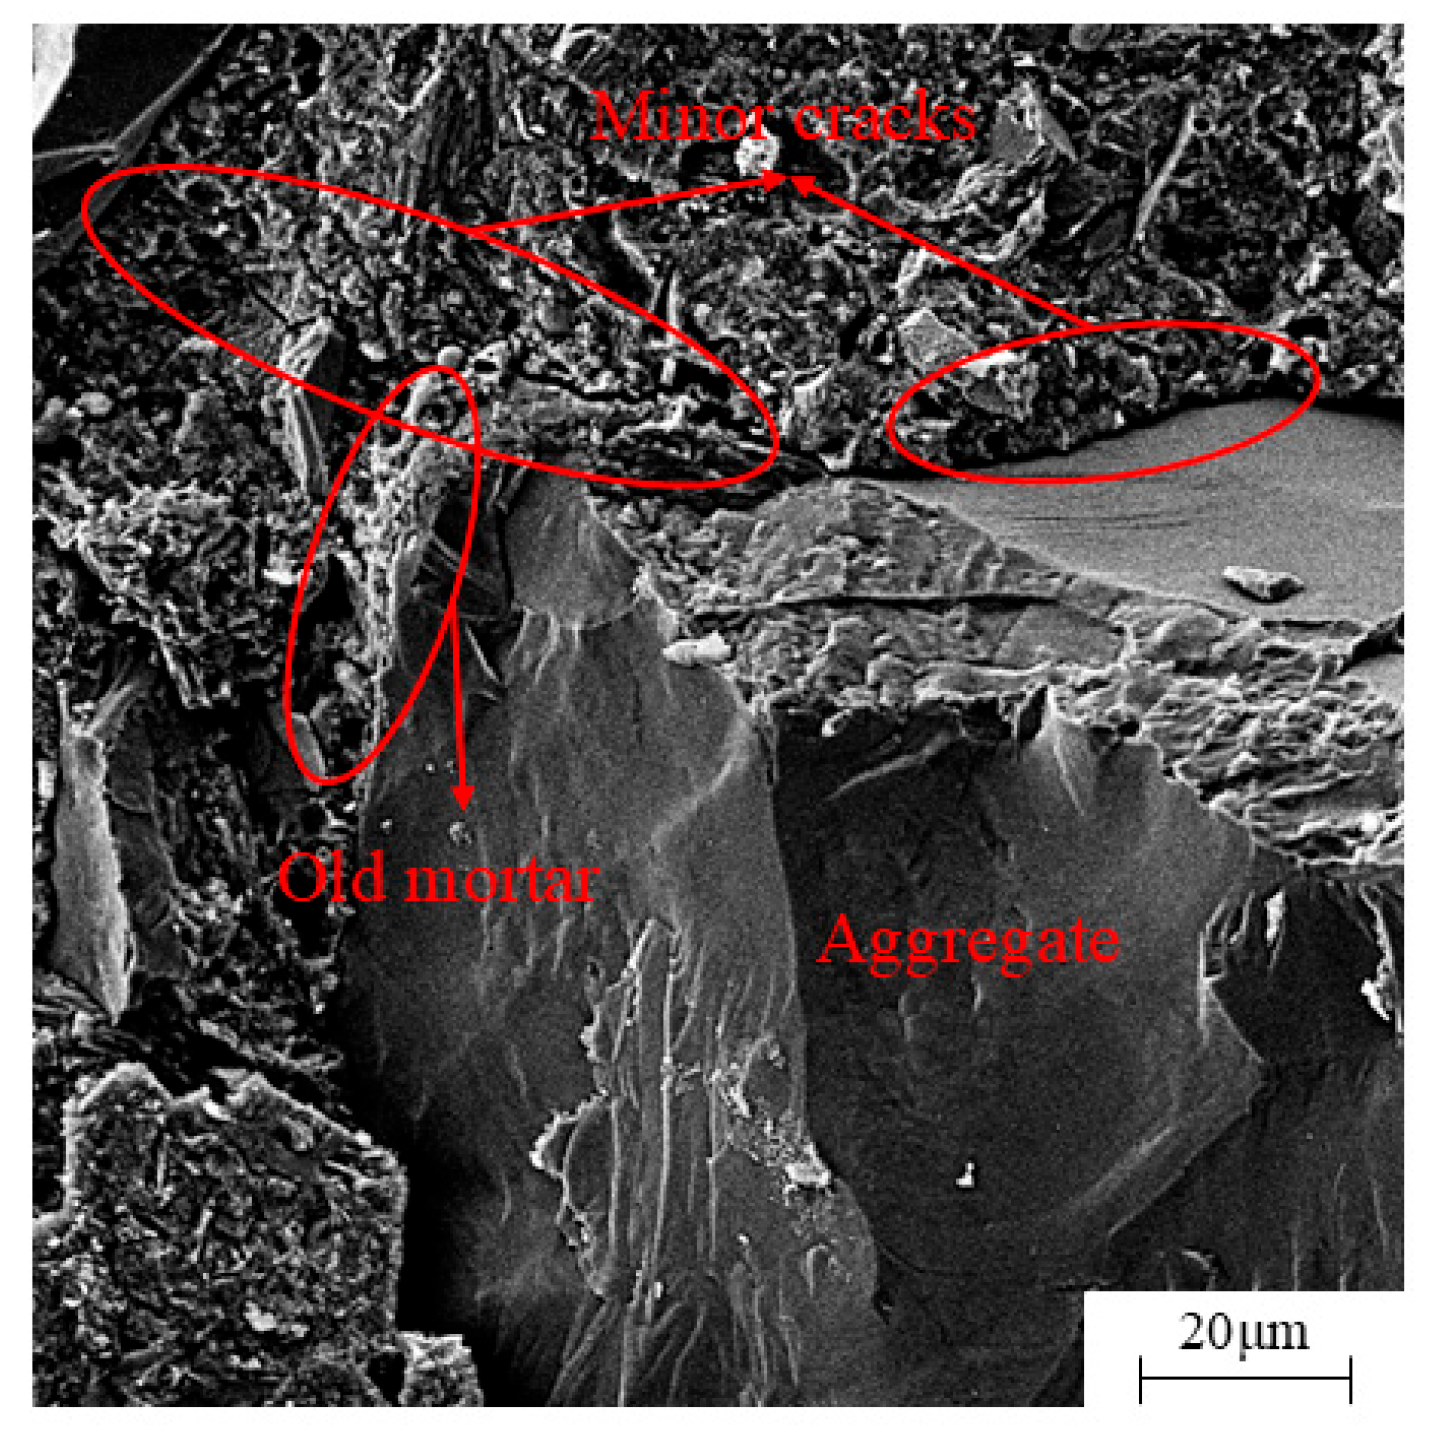
During the failure process of FRAC, different aggregate saturation degrees were found to have a significant impact on the microscopic failure characteristics. In this study, SEM was used to observe the microstructures of specimens corresponding to the worst and best performing mix combinations. The results are shown in Figure 13 and Figure 14.
In Figure 13 (SRCA 90%, SRFA 100%), obvious interfacial debonding is observed around the recycled aggregates. The aggregate on the right shows partial residual old mortar adhering to the surface after separation, indicating poor bonding at the interface. Moreover, a large number of pores are visible in the left region, suggesting low ITZ quality and high porosity. This phenomenon can be attributed to excessively high aggregate saturation, which increases the local W/C in the ITZ and reduces the degree of hydration. As a result, the generation of C–S–H gel is insufficient, weakening the interfacial bond strength.
In contrast, Figure 14 (SRCA 70%, SRFA 25%) shows fracture characteristics originating from the body of the aggregate. The smooth fracture surface at the bottom indicates that the intrinsic strength of the aggregate was fully mobilized. Fine cracks are observed along the ITZ between the old mortar and new paste in the upper area, but no significant interfacial debonding occurs, reflecting strong interfacial bonding. This is attributed to an appropriate aggregate saturation degree, which allows for a more controlled water–cement ratio in the ITZ, limiting microcrack propagation and resulting in a denser and stronger interfacial structure.
Comparative analysis reveals that excessive RCA and RFA saturation increases the W/C in the ITZ, thereby reducing the density of hydration products and weakening the bonding capacity of the interface. In addition, excess free water released during hardening leads to higher porosity within the cement paste, forming a loose gel matrix and ultimately reducing the overall concrete strength. In contrast, an appropriate RCA and RFA saturation degree promotes internal curing within the ITZ, facilitating sufficient formation of C–S–H gel and enhancing interfacial bond strength. Moderate water release also reduces porosity in the cement matrix, improves paste compactness, and enables full utilization of aggregate strength.

4.3. Macro–Micro Integrated Analysis

The integration of macro- and micro-scale observations enables a deeper understanding of the failure mechanisms in FRAC under different saturation conditions. At the macroscopic level, specimens with high aggregate saturation (SRCA 90%, SRFA 100%) exhibit predominantly interfacial failures and reduced strength, as observed in Figure 10. Corresponding SEM images (Figure 12) reveal weak ITZs, interfacial debonding, and high porosity, confirming that excessive saturation leads to elevated local W/C, reduced cement hydration, and poor matrix compactness.
In contrast, the optimal mix (SRCA 70%, SRFA 25%) demonstrates improved compressive and tensile strength (as discussed in Section 3.1), with macroscopic fracture patterns dominated by aggregate rupture (Figure 11). This aligns with the denser ITZ and more cohesive microstructure observed in Figure 13. The appropriate saturation levels help balance internal curing and water demand, improving hydration conditions and structural integrity.
These findings confirm that recycled aggregate saturation not only affects water distribution during mixing but also governs the development of the ITZ and the overall mechanical performance. Excess moisture may form water films that weaken bonding, while insufficient moisture may hinder hydration. Therefore, a moderate saturation level is essential for achieving a dense, well-bonded microstructure that supports improved macroscopic strength.

5. Mechanical Property Prediction Model

5.1. Correlation Coefficient Analysis

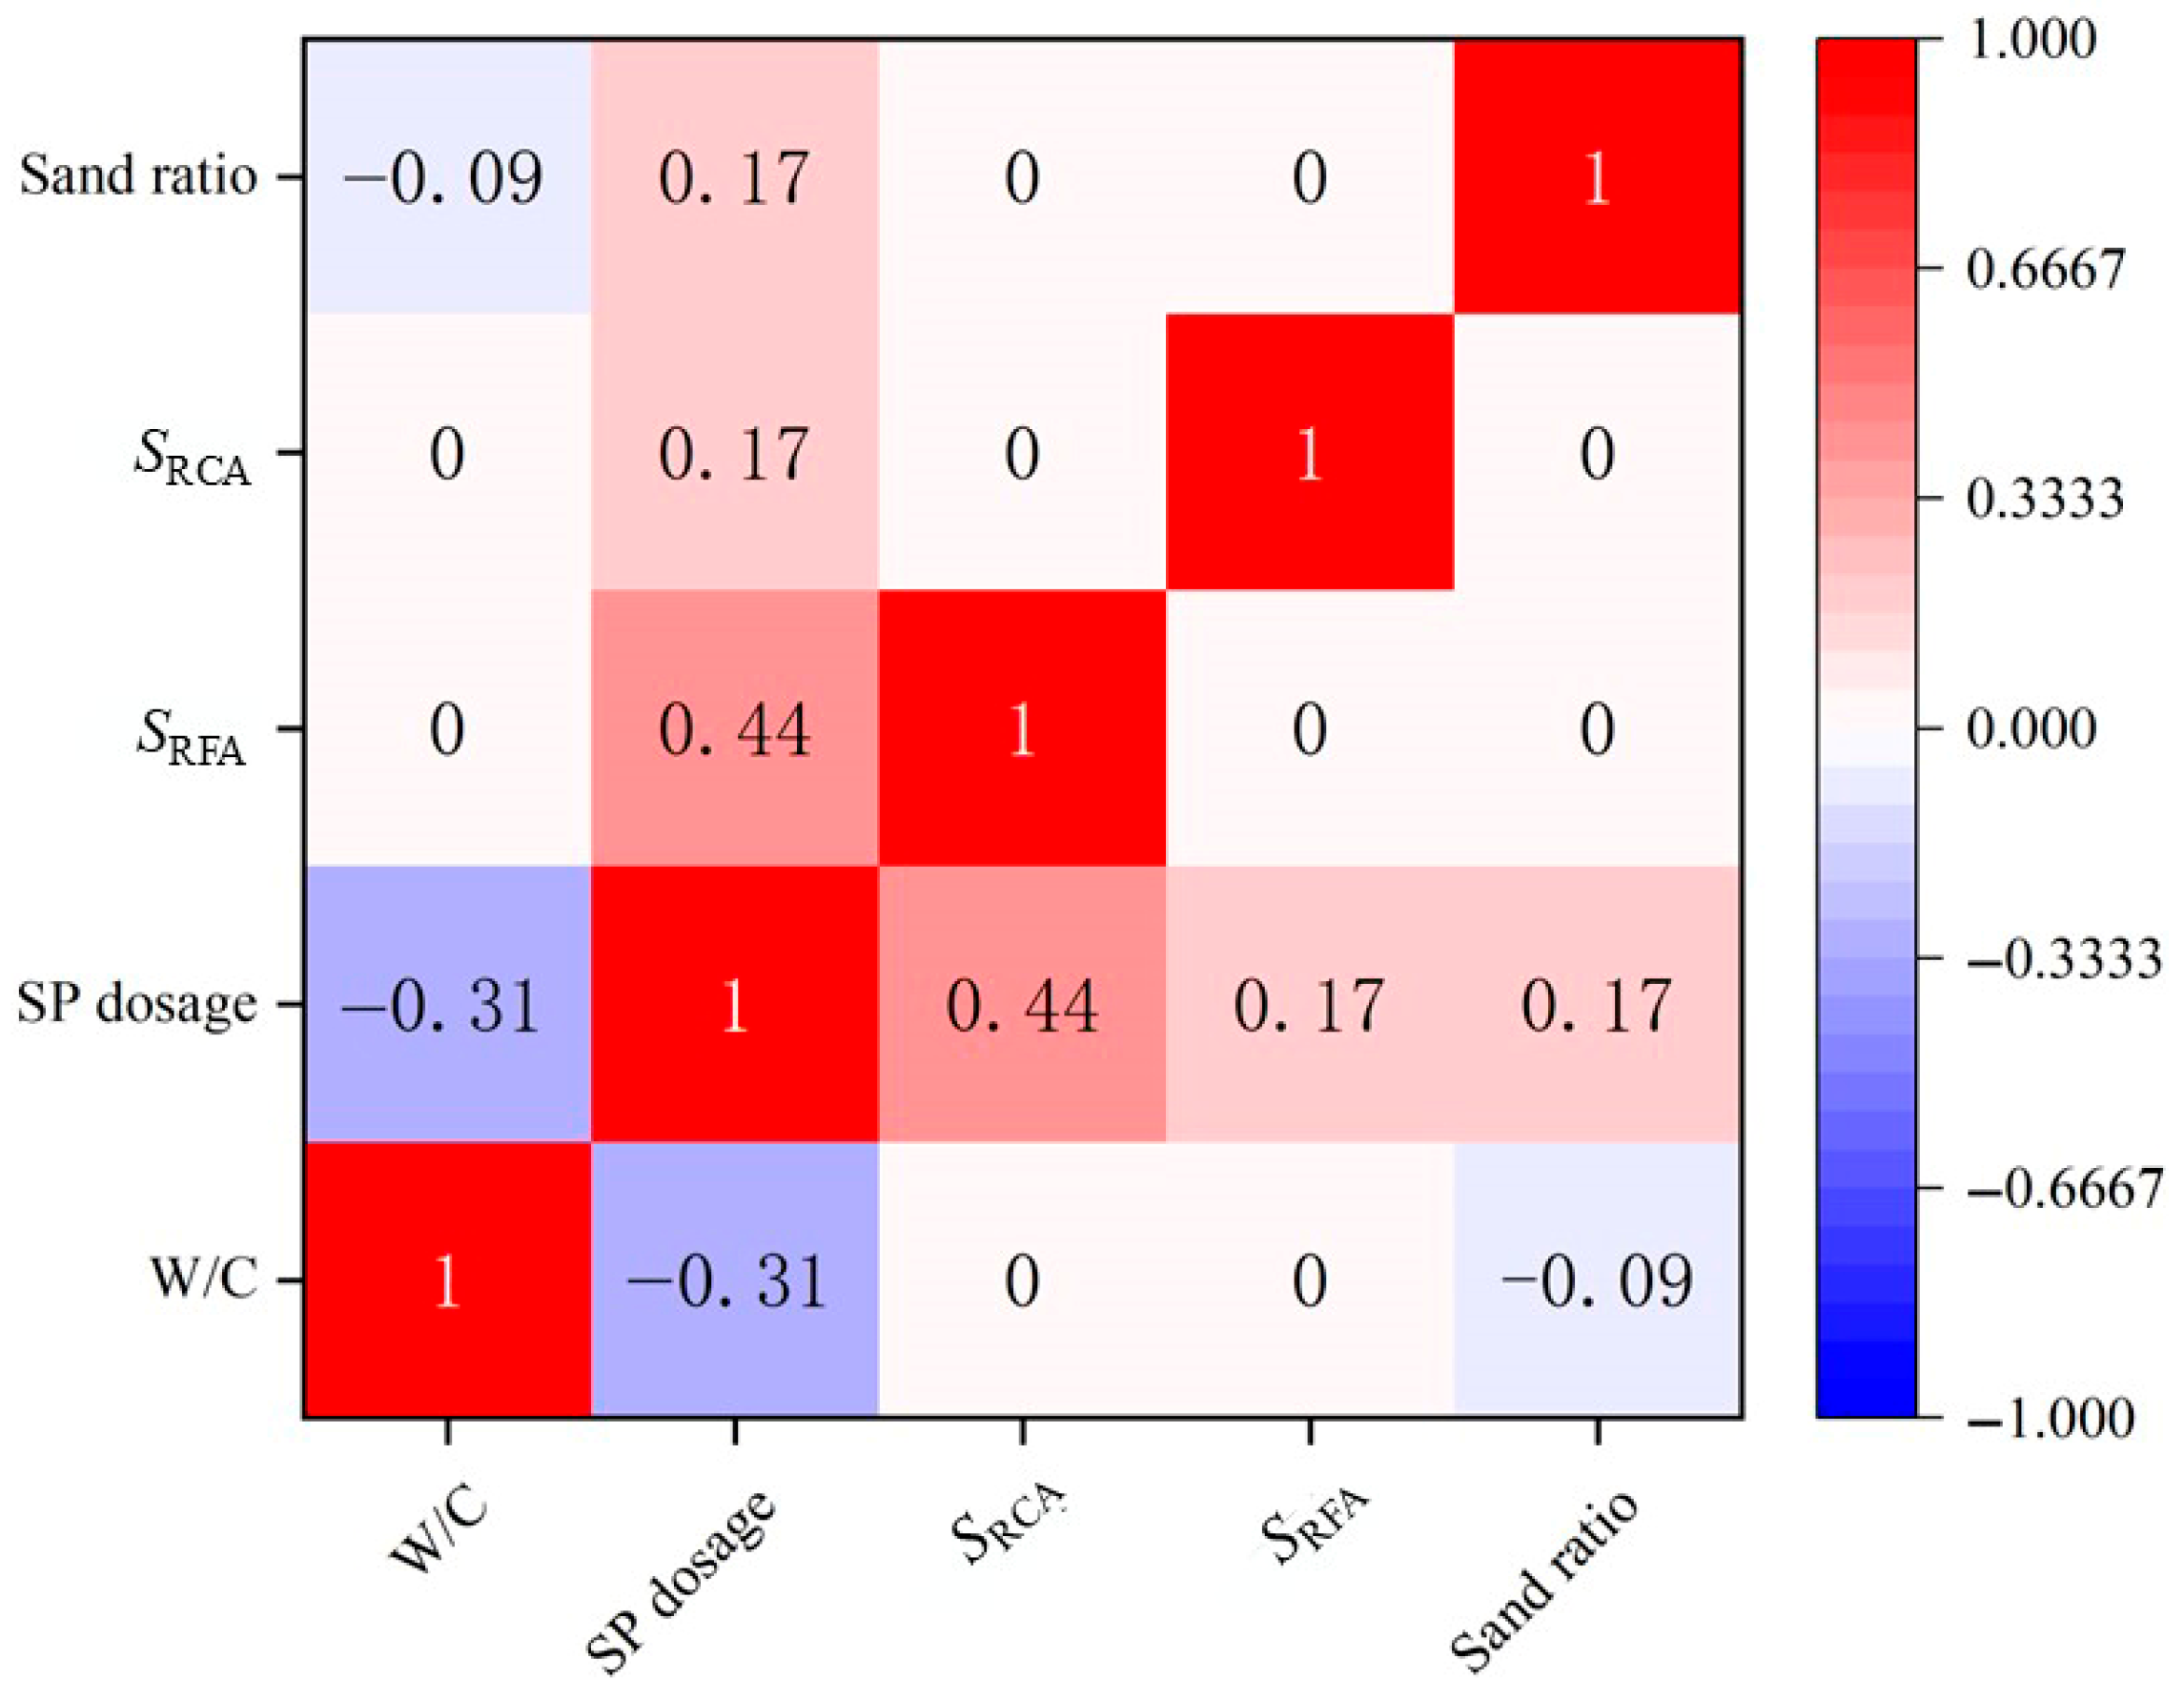
In a multivariable orthogonal experiment, there may be relationships between the variables. The correlation coefficient is a statistical method used to study the presence and strength of relationships between variables. The relationship between variables can be categorized into three types: positive correlation, negative correlation, and zero correlation. The correlation coefficient typically ranges from −1 to 1. A positive value indicates a positive correlation between the variables, with the correlation becoming stronger as it approaches 1. A negative value indicates a negative correlation, with the correlation becoming stronger as it approaches −1. A correlation coefficient of 0 indicates no relationship, and the closer it is to 0, the weaker the relationship.
To analyze whether there is a relationship between the variables and the strength of such relationships, this study utilized SPSS software for correlation coefficient analysis. The Spearman rank correlation coefficient method was employed to compute the correlation coefficient matrix, and a heatmap of the correlation coefficients was created. As shown in Figure 15, the correlation coefficients between the variables were displayed. The results show that, in this experiment, there is essentially no relationship between the variables. Only the SP dosage and SRCA exhibit a non-significant positive correlation, and the SP dosage and W/C show a non-significant negative correlation. This suggests that the interaction effects of these factors on the compressive and tensile strength of FRAC can be ignored.
Therefore, it can be concluded that there is a high degree of independence between the W/C, SP dosage, SRCA, SRFA, and sand ratio. These factors do not exhibit significant interaction effects. Hence, when analyzing the compressive and tensile strengths of FRAC, the influence of these factors should not be overlooked.

5.2. Multiple Linear Regression Analysis

Based on the previously presented experimental data, it is evident that certain factors exhibit a significant linear relationship with the compressive strength and tensile strength of FRAC. Additionally, correlation analysis reveals that there are no significant interaction effects between the experimental factors, allowing for the exclusion of second-order and higher-order interaction effects. Therefore, this study employs SPSS software for multiple linear regression analysis to construct prediction models for the 28-day compressive strength and tensile strength of FRAC, as follows:
Assuming the multiple linear regression equation is in the following form:
Y j = β 0 + β 1 x 1 + β 2 x 2 + β 3 x 3 + β 4 x 4 + β 5 x 5
where:
  • β i ( i = 0, 1, 2, 3, 4, 5)—Regression coefficients;
  • x i —Independent variable ( x 1 is W/C, x 2 is SP dosage, x 3 is SRCA, x 4 is SRFA, x 5 is sand ratio);
  • Y j —Dependent variable.
Y 1 = 112 . 455 127 . 877 x 1 + 3 . 615 x 2 0.075 x 3 0.159 x 4 0.198 x 5
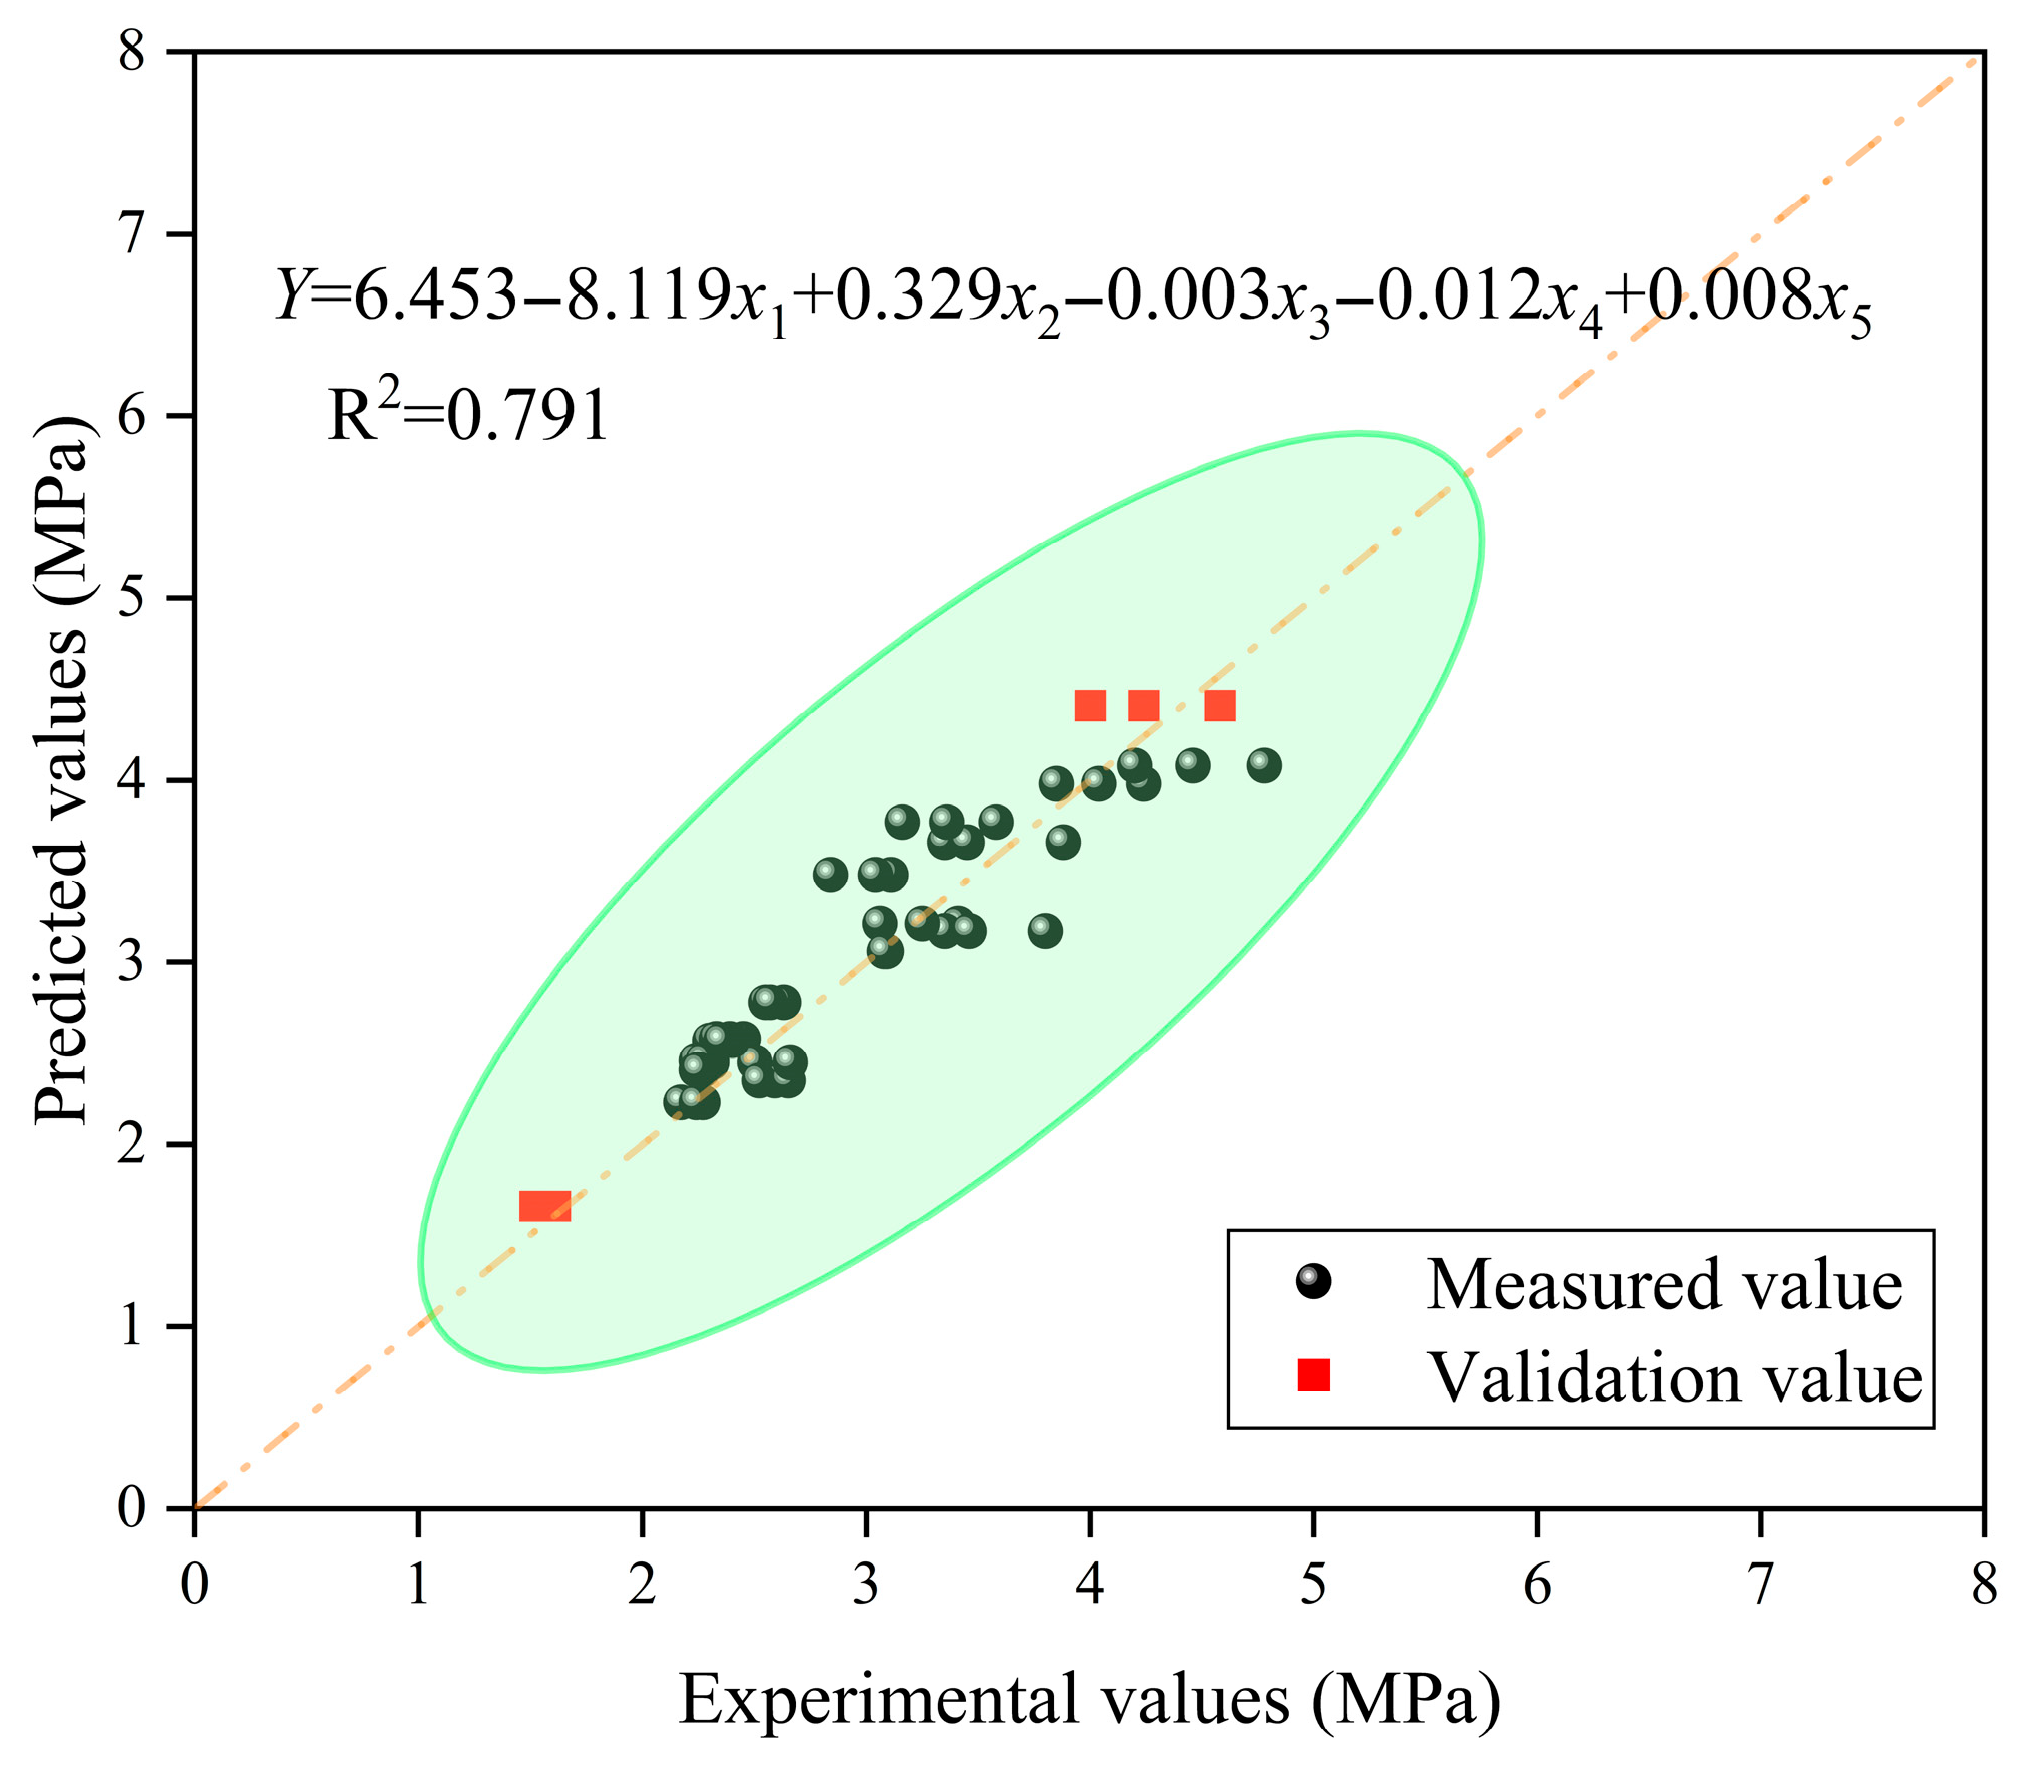
Y 2 = 6 . 463 8 . 119 x 1 + 0 . 329 x 2 0.003 x 3 0.012 x 4 + 0 . 008 x 5
where:
  • Y 1 is 28-day compressive strength;
  • Y 2 is 28-day splitting tensile strength.
The coefficient of determination, R2, is primarily used to evaluate the explanatory power of the regression model on the dependent variable. Its value ranges from 0 to 1, with higher values indicating better model fit. Generally, R2 > 0.75 indicates a high model fit and a good level of explanatory power, while R2 < 0.50 suggests that the fitted model may not be appropriate for linear regression analysis. This could indicate the omission of important independent variables or that there is no linear relationship between the independent and dependent variables.
The value of R2 tends to increase with the addition of more independent variables, which can lead to an overestimated value of R2. Therefore, it is important to adjust for the degrees of freedom to avoid artificially inflating the R2 value when adding more variables. Typically, an adjusted R2 value of 0.5 is considered the threshold. If the adjusted R2 is less than 0.5, a correlation analysis should be conducted for both included and excluded independent variables. On the other hand, if the adjusted R2 is greater than 0.5, it suggests that the model’s independent variables can accurately explain the changes in the dependent variable. Additionally, if there is a significant discrepancy between R2 and the adjusted R2 (e.g., a difference exceeding 10%), it indicates that the selected independent variables are not adequately capturing the variation in the dependent variable.
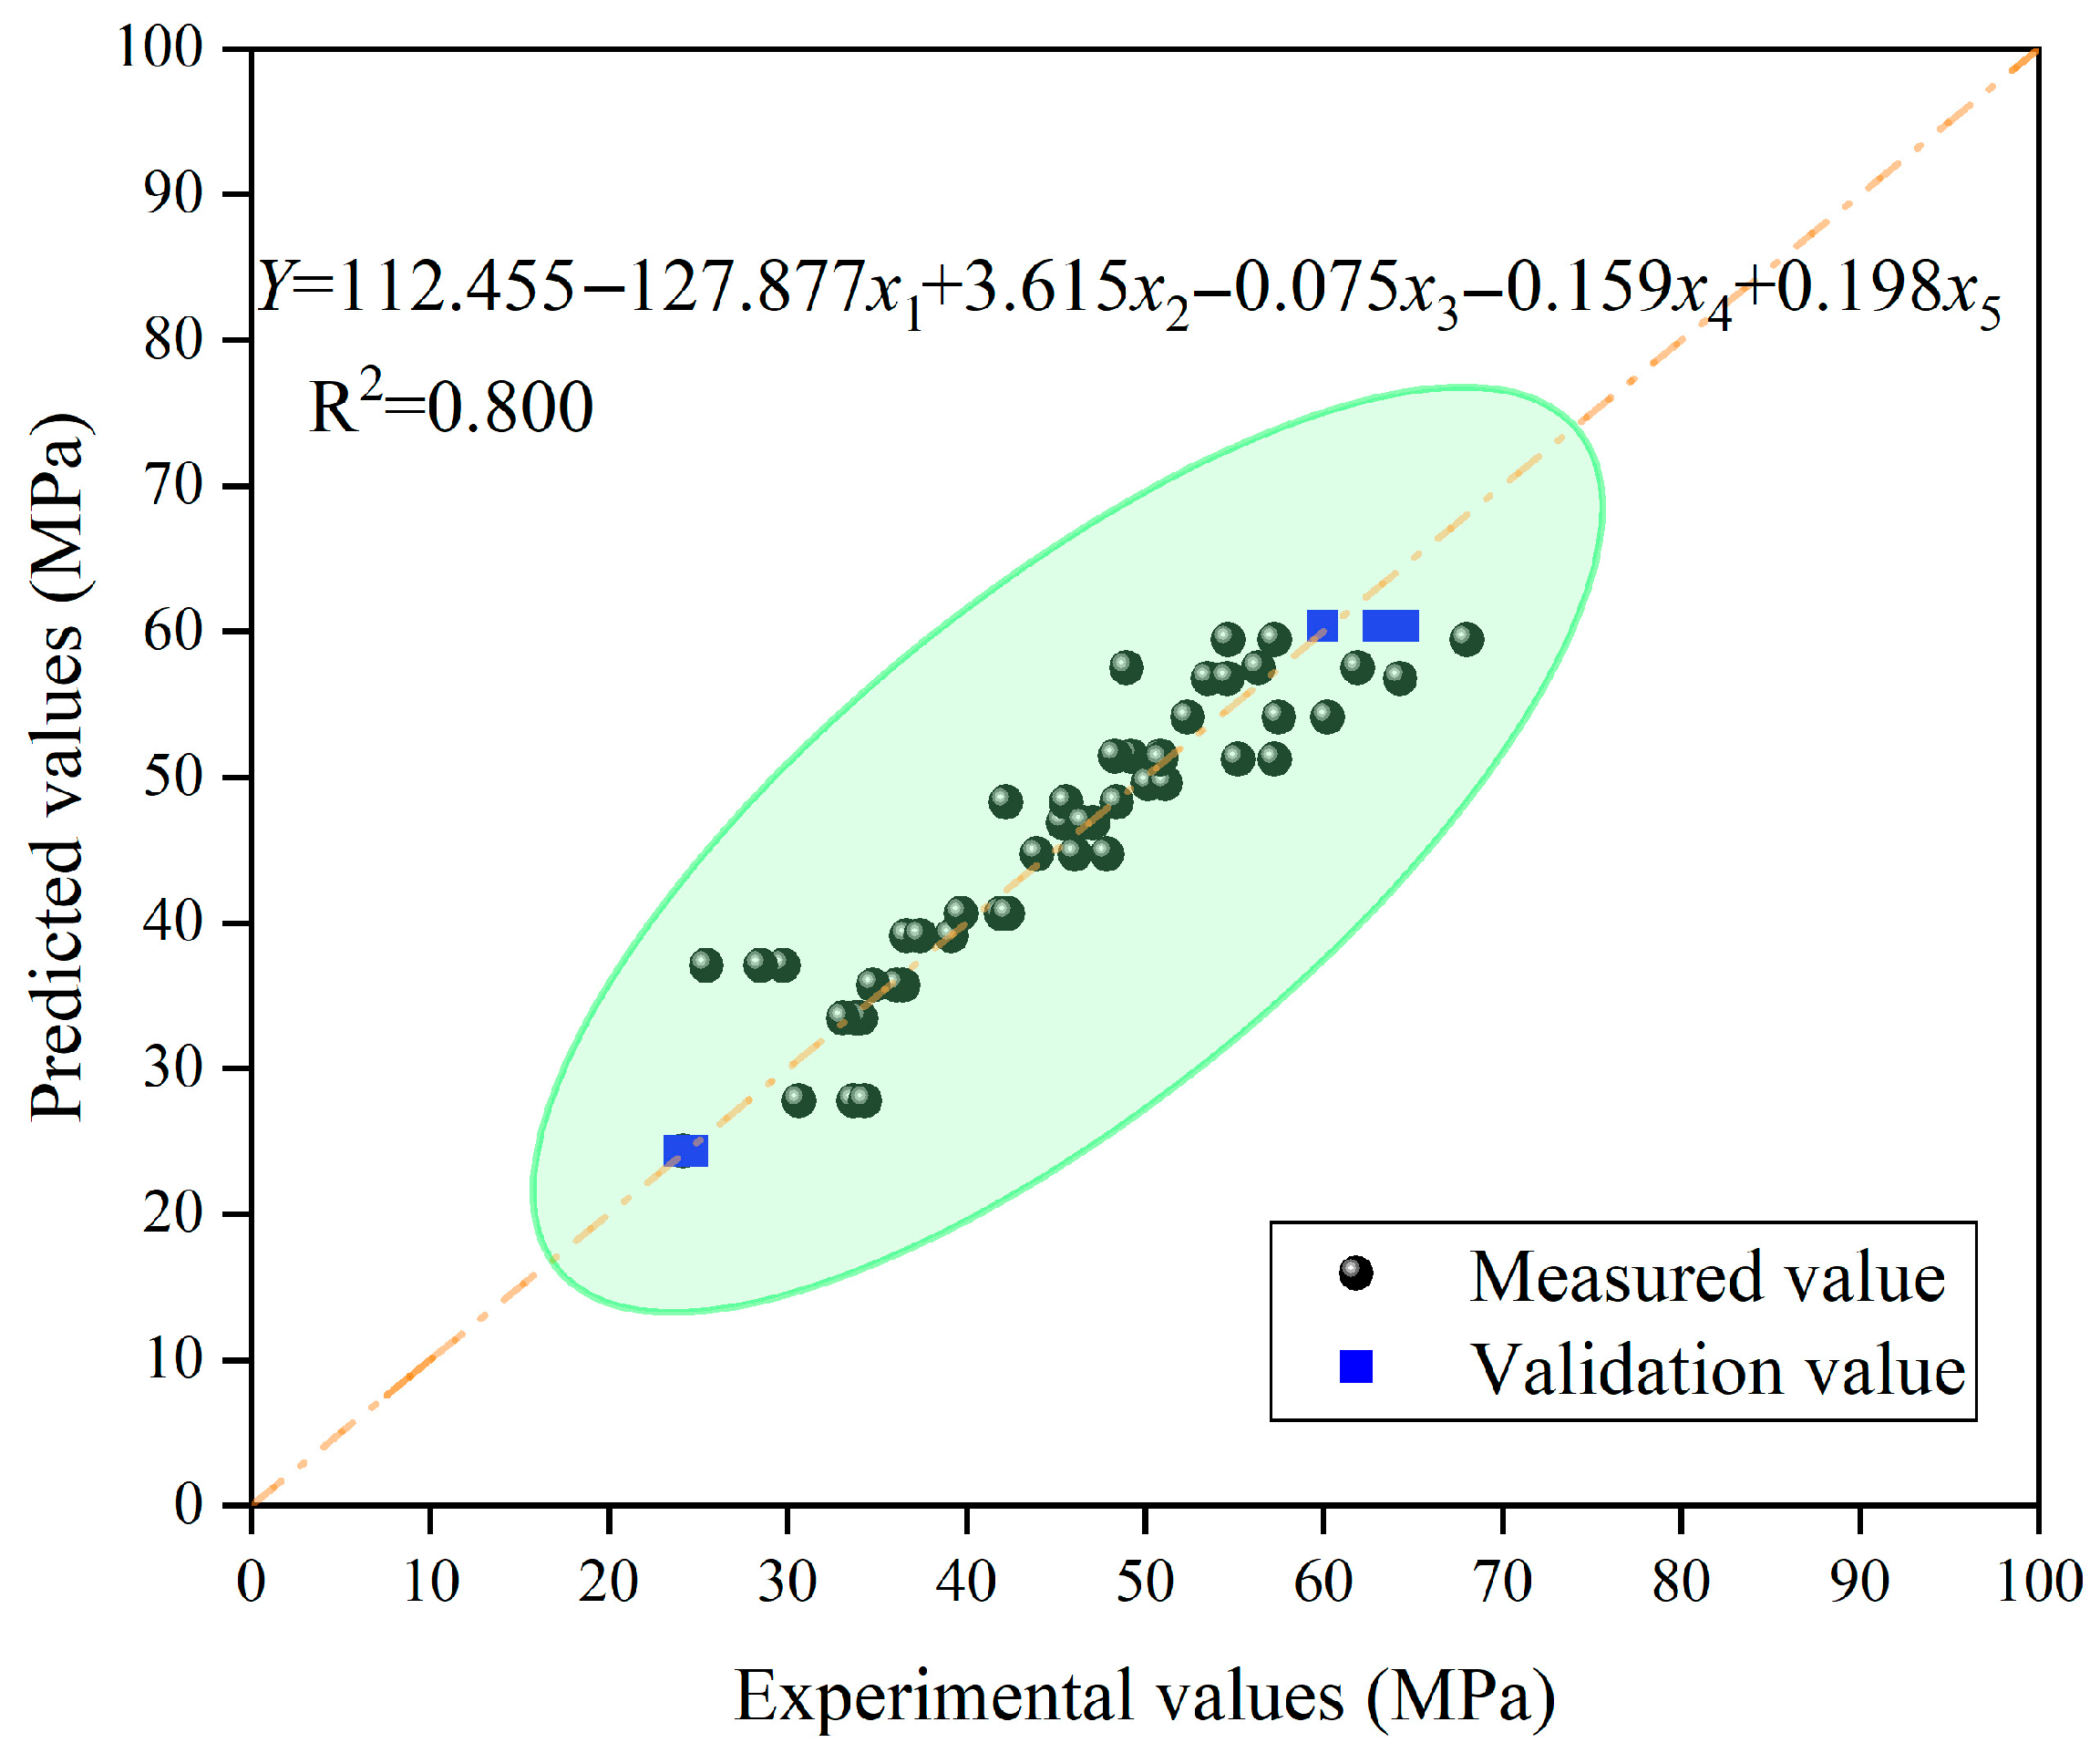
The regression analysis results of the 28-day compressive strength and tensile strength prediction model for FRAC are as follows: The coefficient of determination R2 for Y1 is 0.800, and the adjusted R2 is 0.777; the coefficient of determination R2 for Y2 is 0.791, and the adjusted R2 is 0.766. These results indicate that the multiple linear regression model constructed in this study provides a high degree of fit for the 28-day compressive and tensile strengths of FRAC, with strong explanatory power. Moreover, the independent variables considered in the model are effective in explaining the variations in the dependent variables.
The input variables corresponding to the experimental conditions were substituted into the regression equations to verify the model’s accuracy. The predicted values, measured values and validation values of both the best and worst-performing combinations, as well as the orthogonal test groups, are compared in Figure 16 and Figure 17. As shown, the predicted values of both 28-day compressive strength and splitting tensile strength are closely aligned with the experimental results, indicating a strong correlation.
These findings demonstrate that the regression models can effectively explain the 28-day mechanical behavior of fully recycled aggregate concrete (FRAC). The high degree of consistency between predicted and measured values confirms the model’s accuracy and reliability, providing a valuable reference for mix design and performance prediction in engineering applications.

6. Conclusions

(1)
The variables—W/C, SP dosage, SRCA, SRFA, and sand ratio—demonstrated a high degree of independence, with no significant interaction effects observed among them. This indicates that each factor plays a distinct and non-negligible role in determining the compressive and tensile strengths of FRAC. When optimal mechanical performance is achieved, the RCA and RFA saturation degrees should be controlled at 70% and 25%, respectively. Notably, reducing the SRFA from 100% to 25% led to a 28.8% increase in compressive strength and a 34.6% increase in tensile strength. The influence of RFA saturation on FRAC’s mechanical properties ranks second only to the W/C.
(2)
At excessive saturation levels—RCA at 90% and RFA at 100%—the ITZ significantly deteriorates, with increased porosity and reduced interfacial bonding. Over-saturation results in the release of excessive free water during the hardening process, promoting pore formation within the cement paste and leading to a weakened, porous gel matrix. Concurrently, a high water–cement ratio reduces the production of C–S–H gel, further impairing ITZ quality and leading to a substantial decline in mechanical performance. In contrast, appropriate saturation degrees promote the formation of a denser ITZ, enhance interfacial bonding, suppress microcrack propagation, and ultimately improve both compressive and tensile strengths.
(3)
In this study, a multiple linear regression model incorporating the saturation degrees of recycled aggregates was developed. The model demonstrated strong explanatory power and high fitting accuracy for predicting 28-day compressive and tensile strengths of FRAC. For compressive strengths ranging from 25 to 70 MPa, the regression model yielded a coefficient of determination R2 = 0.800; for tensile strengths between 2 and 5 MPa, the model achieved an R2 = 0.791. These results confirm the model’s reliability and its potential utility in practical mix design optimization for sustainable concrete applications.
Future research should focus on the durability performance of FRAC under extreme environmental conditions, such as high temperatures and freeze–thaw cycles, to further assess its applicability in real-world scenarios.

Author Contributions

X.T.: Conceptualization, Writing—review and editing, Writing—original draft, Supervision. Y.X.: Investigation, Writing—review and editing, Formal analysis, Visualization. X.W.: Writing—review and editing, Writing—original draft, Supervision, Resources. Y.W.: Investigation, Writing—review and editing, Visualization, Data curation. L.L.: Investigation, Writing–review and editing. Y.S.: Visualization, Data curation. W.C.: Investigation, Resources. B.Z.: Data curation, Resources. All authors have read and agreed to the published version of the manuscript.

Funding

This work was supported by the Natural Science Foundation of Hunan Province, China (2024JJ7170 and 2025JJ70394), the Research Foundation of Education Bureau of Hunan Province, China (25A0538 2 and 23A0559), the Research Foundation of Graduate Research Innovation of Hunan Province, China (CX20240099 and CX20240984), the Research Foundation of Science and Technology Bureau of Yiyang City, China ([2023]102).

Data Availability Statement

Data will be made available on request.

Conflicts of Interest

The authors declare no conflicts of interest.

References

  1. Communist Party of China. Report to the 20th National Congress of the Communist Party of China; People’s Publishing House: Beijing, China, 2022. [Google Scholar]
  2. Xiao, J.; Li, J.; Sun, Z.-P.; Hao, X.-M. Study on compressive strength of recycled aggregate concrete. J. Tongji Univ. (Nat. Sci.) 2004, 32, 1558–1561. (In Chinese) [Google Scholar]
  3. Dong, L.; Fu, Y.; He, M.; Huang, W. Recycling coarse aggregates from concrete using high voltage pulses. Constr. Build. Mater. 2025, 458, 139669. [Google Scholar] [CrossRef]
  4. Xiao, J.; Ma, X.; Liu, Q.; Zhang, H.; Duan, Z. Evolvement and research progress of concept for full recycled concrete. J. Archit. Civ. Eng. 2021, 38, 1–15. (In Chinese) [Google Scholar]
  5. Wu, E.; Ma, X.; Fang, C.; Li, N.; Jia, L.; Jiang, P.; Wang, W. Strength performance and microscopic mechanism of cement mortar incorporating fine recycled concrete aggregate and natural sand. J. Build. Eng. 2025, 100, 111767. [Google Scholar] [CrossRef]
  6. Thomas, C.; Setien, J.; Polanco, J.A.; Alaejos, P.; Sánchez de Juan, M. Durability of recycled aggregate concrete. Constr. Build. Mater. 2013, 40, 1054–1065. [Google Scholar] [CrossRef]
  7. Zhu, Y.; Kou, S.; Poon, C.; Dai, J.; Li, Q. Influence of silane-based water repellenton the durability properties of recycled aggregate concrete. Cem. Concr. Compos. 2013, 35, 32–38. [Google Scholar] [CrossRef]
  8. Bravo, M.; de Brito, J.; Pontes, J.; Evangelista, L. Mechanical performance of concrete made with aggregates from construction and demolition waste recycling plants. J. Clean. Prod. 2015, 99, 59–74. [Google Scholar] [CrossRef]
  9. Kou, S.; Poon, C.; Agrela, F. Comparisons of natural and recycled aggregate concretes prepared with the addition of different mineral admixtures. Cem. Concr. Compos. 2011, 33, 788–795. [Google Scholar] [CrossRef]
  10. Bao, J.; Li, S.; Zhang, P.; Ding, X.; Xue, S.; Cui, Y.; Zhao, T. Influence of the incorporation of recycled coarse aggregate on water absorption and chloride penetration into concrete. Constr. Build. Mater. 2020, 239, 117845. [Google Scholar] [CrossRef]
  11. Li, N.; Han, R.; Lu, X. Bibliometric analysis of research trends on solid waste reuse and recycling during 1992–2016. Resour. Conserv. Recycl. 2018, 130, 109–117. [Google Scholar] [CrossRef]
  12. Duan, Z.; Poon, C.S.; Xiao, J. Using artificial neural networks to assess the applicability of recycled aggregate classification by different specifications. Mater. Struct. 2017, 50, 107. [Google Scholar] [CrossRef]
  13. Zhang, X.; Kuang, C.; Fang, Z.; Liu, X.; Wang, G.; Lai, S. Orthogonal experimental study on strength of steel fiber reinforced fly ash recycled concrete. J. Build. Mater. 2014, 17, 677–684+694. (In Chinese) [Google Scholar]
  14. Chen, Z.; Xu, J.; Zheng, H.; Su, Y.; Xue, J.; Li, J. Basic mechanical properties test and stress-strain constitutive relations of recycled coarse aggregate concrete. J. Build. Mater. 2013, 16, 24–32. (In Chinese) [Google Scholar]
  15. Li, J.; Xiao, J.; Sun, Z. Properties of recycled coarse aggregate and its influence on recycled concrete. J. Build. Mater. 2004, 4, 390–395. (In Chinese) [Google Scholar]
  16. Mefteh, H.; Kebaïli, O.; Oucief, H.; Berredjem, L.; Arabi, N. Influence of moisture conditioning of recycled aggregates on the properties of fresh and hardened concrete. J. Clean. Prod. 2013, 54, 282–288. [Google Scholar] [CrossRef]
  17. Zhang, X.; Fang, Z.; Deng, S.; Cheng, K.; Qin, Y. Additional water use influencing strength and fluidity of recycled concrete. J. Cent. South Univ. Technol. 2008, 15, 221–224. (In Chinese) [Google Scholar] [CrossRef]
  18. Wang, J.; Che, Z.; Zhang, K.; Fan, Y.; Niu, D.; Guan, X. Performance of recycled aggregate concrete with supplementary cementitious materials (fly ash, GBFS, silica fume, and metakaolin): Mechanical properties, pore structure, and water absorption. Constr. Build. Mater. 2023, 368, 130455. [Google Scholar] [CrossRef]
  19. Wang, G.; Qi, S.; Li, J.; Wang, K. Experimental investigation on mechanical properties of recycled aggregate concrete. Concrete 2020, 3, 168–171+176. (In Chinese) [Google Scholar]
  20. Brand, A.S.; Roesler, J. Interfacial transition zone of cement composites with recycled concrete aggregate of different moisture states. Adv. Civ. Eng. Mater. 2018, 7, 87–102. [Google Scholar] [CrossRef]
  21. Li, B.; Chen, P.; Yin, S.; Yi, H. Effect of Additional Water Amount on the Workability and Mechanical Properties of Concrete with Recycled Fine Aggregates. Mater. Rep. 2024, 38, 102–108. (In Chinese) [Google Scholar]
  22. Le, T.; Le Saout, G.; Garcia-Diaz, E.; Betrancourt, D.; Rémond, S. Hardened behavior of mortar based on recycled aggregate: Influence of saturation state at macro-and microscopic scales. Constr. Build. Mater. 2017, 141, 479–490. [Google Scholar] [CrossRef]
  23. Zhao, Y.; Zeng, W.; Zhang, H. Properties of recycled aggregate concrete with different water control methods. Constr. Build. Mater. 2017, 152, 539–546. [Google Scholar] [CrossRef]
  24. Guerzou, T.; Mebrouki, A.; Castro-Gomes, J. Study of concretes properties based on pre-saturated recycled aggregates. J. Mater. Eng. Struct. 2018, 5, 279–288. [Google Scholar]
  25. GB/T 14685-2022; Pebble and Crushed Stone for Construction. Standards Press of China: Beijing, China, 2022. (In Chinese)
  26. GB/T 50081-2019; Standard for Physical and Mechanical Performance Testing Methods of Concrete. China Architecture & Building Press: Beijing, China, 2019. (In Chinese)
Figure 1. Size distribution curves of aggregates.
Buildings 16 00509 g001
Figure 2. Change curve of water saturation of recycled aggregate in 24 h.
Buildings 16 00509 g002
Figure 3. Experimental process. (a) Test piece molding. (b) Compressive strength test. (c) Splitting tensile strength test.
Buildings 16 00509 g003
Figure 4. Effect of SRCA on mechanical properties of FRAC.
Buildings 16 00509 g004
Figure 5. Effect of SRFA on mechanical properties of FRAC.
Buildings 16 00509 g005
Figure 6. Effect of W/C on mechanical properties of FRAC.
Buildings 16 00509 g006
Figure 7. Effect of SP dosage on mechanical properties of FRAC.
Buildings 16 00509 g007
Figure 8. Effect of sand ratio on mechanical properties of FRAC.
Buildings 16 00509 g008
Figure 9. Compressive strength range analysis.
Buildings 16 00509 g009
Figure 10. Tensile strength range analysis.
Buildings 16 00509 g010
Figure 11. The microstructural failure of best combination specimen.
Buildings 16 00509 g011
Figure 12. The microstructural failure of worst combination specimen.
Buildings 16 00509 g012
Figure 13. The microscopic failure of best combination specimen.
Buildings 16 00509 g013
Figure 14. The microscopic failure of worst combination specimen.
Buildings 16 00509 g014
Figure 15. Thermal matrix of correlation coefficients.
Buildings 16 00509 g015
Figure 16. Comparison of compressive strength prediction results.
Buildings 16 00509 g016
Figure 17. Comparison of tensile strength prediction results.
Buildings 16 00509 g017
Table 1. Chemical compositions in cement.
ComponentsCaOSiO2Fe2O3Al2O3MgOSO3Others
P·C 42.569.37%14.38%5.56%3.51%2.62%2.25%2.31%
Table 2. Pre-treatment of Recycled Aggregates.
1234
SRCA30%50%70%90%
RCA Pre-treatment——Soaked for 5 minSoaked for 10 minSoaked for 6 h
SRFA25%50%75%100%
RFA Pre-treatmentDried for 5 minDried for 3 min——Soaked for 12 h
Table 3. Factor levels.
Factor LevelsW/C (A)SP Dosage (B)SRCA (C)SRFA (D)Sand Ratio (E)
10.450.0%30%25%20%
20.400.5%50%50%30%
30.351.0%70%75%40%
40.301.5%90%100%50%
Table 4. Orthogonal experiments.
CombinatorialWater/
(kg)
Cement/
(kg)
RCA/(kg)RFA/(kg)SP/(g)RCA Pre-Wetted Water/(kg)RFA Pre-Wetted Water/(kg)
1A1B1C1D1E11703781360.7340.20.00.00.0
2A1B2C2D2E21703781190.6510.31.97.115.3
3A1B3C3D3E31703781020.5680.33.812.240.8
4A1B4C4D4E4170378850.4850.45.715.376.5
5A2B1C2D3E4170425817.9817.90.04.949.1
6A2B2C1D4E3170425981.5654.42.10.058.9
7A2B3C4D1E21704251145.1490.84.320.60.0
8A2B4C3D2E11704251308.7327.26.415.79.8
9A3B1C3D4E21704861069.1458.20.012.841.2
10A3B2C4D3E11704861221.9305.52.422.018.3
11A3B3C1D2E4170486763.7763.74.90.022.9
12A3B4C2D1E3170486916.4610.97.35.50.0
13A4B1C4D2E3170567786.6524.40.014.215.7
14A4B2C3D1E4170567655.5655.52.87.90.0
15A4B3C2D4E11705671048.8262.25.76.323.6
16A4B4C1D3E2170567917.7393.38.50.023.6
Table 5. Range analysis.
TargetsRangeABCDE
Compressive strengthk137.5943.1647.0951.1649.9
k239.9242.3946.5148.0646.12
k349.4847.5645.7543.9641.71
k455.9249.7943.5539.7245.17
R18.337.43.5411.448.19
Tensile strengthk12.372.562.893.542.9
k22.732.93.052.982.84
k33.173.233.162.722.97
k43.63.22.762.633.16
R1.230.670.40.910.32
Table 6. Variance analysis.
TargetsSourceSSDFMSFFαpSignificance
Compressive strengthA2614.4993871.50076.227F0.01(3,32) = 4.459
F0.05(3,32) = 2.901
1.1547 × 10⁻¹⁴**
B451.8873150.62913.1750.000009**
C86.358328.7862.5180.076——
D890.2903296.76325.9571.0548 × 10−8**
E408.1023136.03411.8980.000021**
error365.8543211.433————————
Tensile strengthA10.17233.391136.26F0.01(3,32) = 4.459
F0.05(3,32) = 2.901
2.6545 × 10⁻¹⁸**
B3.46231.15446.3829.3534 × 10−12**
C1.10830.36914.8390.000005**
D6.03132.01080.7905.1076 × 10−15**
E0.66230.2218.8640.000202**
error0.796320.025————————
Note. ** p < 0.01.
Disclaimer/Publisher’s Note: The statements, opinions and data contained in all publications are solely those of the individual author(s) and contributor(s) and not of MDPI and/or the editor(s). MDPI and/or the editor(s) disclaim responsibility for any injury to people or property resulting from any ideas, methods, instructions or products referred to in the content.