


Abstract
Rural revitalization advocates differentiated governance of urban and rural landscape features, yet existing color research remains concentrated on cities, with few rural samples and no quantitative framework tailored to Hui-style rural streets. To this end, taking the Hui-style rural area of Wuyuan, Jiangxi Province, as the study object, this study proposes the SVCP-R framework, an integrated streetscape visual–color–perception framework for rural areas. Based on Baidu Street View imagery and using models such as SegFormer-B5 and ViT-B/16, the framework calibrates perception scores with a local questionnaire and a linearly weighted calibration method, and then analyzes the patterns of rural color perception. The results show that Wuyuan is dominated by mountains and water as its main visual features, its streets exhibit a warm-yellow Hui-style color tone, and its beauty and boredom scores are high; The proportion of buildings is positively correlated with vitality scores and negatively correlated with aesthetic scores; and vegetation and color indicators significantly influence the rural visual experience. This study extends the applicability of the color-perception framework to the rural-street scale, providing a color-control reference for similar rural areas and helping to avoid the homogenization of rural streetscape features.
1. Introduction
The Strategic Plan for Rural Revitalization (2018–2022) emphasizes that rural construction should inherit and protect traditional villages and dwellings while highlighting regional characteristics. Against this backdrop, cities have established systems for color planning, façade control, and region-wide governance; however, dedicated color-control policies for rural streets remain weak and difficult to implement, and many traditional villages lack scientific color guidance during renewal, tourism development, and infrastructure upgrading [1]. There is a mismatch between rural landscape protection policies and the practical color control of rural areas, and rural street color therefore requires scientific planning and dedicated governance.
As the core setting of daily activity and an important space for maintaining local emotional identity [2], rural street color directly shapes residents’ visual experience and emotional cognition [3,4]. On the dimension of a single color attribute, color can affect perception and induce emotional responses [5]. In terms of hue, von Goethe [6] argued that different hues evoke differentiated emotional tendencies: warm hues tend to evoke vitality and aspiration, whereas cool hues may induce anxiety. For lightness and saturation, Valdez and Mehrabian [7] found consistent positive effects on pleasure, and Wilms and Oberfeld [8] confirmed that higher saturation or brightness is more likely to induce pleasantness and arousal. Color combinations also trigger perception [9]: Ou and Luo [10] noted that color harmony reflects aesthetic compatibility among colors, and more harmonious combinations yield higher perceived pleasure. Hu et al. [11] further showed, in street scenes, that pairings of low-saturation and vivid colors can increase spatial attractiveness, whereas pairings with dark tones weaken charm. In addition, color preference is influenced by individual experience. Palmer and Schloss’s [12] ecological valence theory holds that color preference stems from the affective evaluation of objects associated with colors: people prefer blue-related hues associated with clear skies and clean water, and dislike colors linked to negative objects.
Existing street color studies have focused mainly on cities [13]. Because rural residents are often older than urban populations, their sensitivity to brightness, saturation, and color harmony may differ substantially from that of younger urban groups [14,15,16,17,18]. More importantly, existing research on perceived color environments has three major limitations. First, the perspective is narrow: many rural color studies examine only the color of residential façades and ignore the composite street color system formed by road pavements, farmland vegetation, vernacular structures, and other visual elements, thereby failing to represent the overall color landscape of rural streets [19]. Second, methods remain conventional and fixed: subjective evaluation and qualitative description dominate, while objective data support and large-scale quantitative analysis are insufficient to reveal the intrinsic relationship between physical color attributes and human perception [20,21]. Third, urban-rural differences in color landscape characteristics are insufficiently considered: urban streets have high building density, a large share of artificial surfaces, and strong visual color impact, whereas rural areas have a high natural base, gentler spatial scale, and a more restrained color tone [22,23].
To assess the correlation between rural street color environments and residents’ emotional perceptions, this study puts forward a quantitative research framework termed SVCP-R, the integrated Street Vision–Color–Perception framework for rural areas Figure 1. Using deep learning methods such as SegFormer and Vision Transformer, the framework extracts and analyzes visual elements and color information from Baidu Street View images. An integrated framework oriented to rural scenarios is constructed to couple the color features of rural street settings with residents’ emotional perception data and explore their correlations.
Figure 1.
Technical roadmap of the SVCP-R framework.
2. Literature Review
2.1. Rural Landscape Features and Rural Street Color Governance
Rural landscape is the external expression of the long-term interaction among regional culture, production and lifestyles, and the natural environment [24,25], and color is its most recognizable visual dimension. Since the implementation of the rural revitalization strategy, rural construction in China has shifted from infrastructure provision toward landscape quality improvement [26]. In this transition, the status of color has risen rapidly: on the one hand, color is the most intuitive carrier of landscape differentiation, and regional colors such as Huizhou white walls and dark tiles or southern Fujian red-brick houses have become core symbols of village identity and are therefore linked to cultural landscape composition and heritage conservation [27]. On the other hand, renewal without guidance has produced a homogeneous “concrete and color-steel tile” appearance in many villages; landscape convergence has been documented empirically [28], and uncontrolled color contrast and combinations have become prominent governance problems.
Research on rural street color governance has been proposed and gradually expanded. Seokhyun [29] used cultural climate as the basis for village color positioning and proposed a rural landscape color planning method, providing a complete paradigm from environmental analysis to planning schemes. With the advance of “beautiful countryside” practices, the governance object expanded from single villages to demonstration areas. Cen et al. [30] analyzed the village color landscape characteristics of beautiful Chinese villages based on 3D real-scene models, revealing color composition patterns at the administrative-village scale and pushing color governance from engineering practice toward data-based identification. Traditional village color has also been incorporated into heritage conservation as an important component of cultural landscape, extending governance logic from “landscape renovation” to “color conservation” [27]. Meanwhile, village micro-renewal and micro-renovation practices based on residents’ perceptions and preferences have begun to emerge, expanding governance actors from top-down planning to multi-party collaboration [28].
Nevertheless, current color governance remains largely in the upstream “identification-planning” stage. Therefore, quantitative methods at the street scale are a prerequisite for precise governance and motivate the quantitative framework introduced in this paper.
2.2. Quantitative Methods for Rural Color
Rural color quantification has evolved from subjective description and color-card comparison toward digital automatic extraction [29,30]. Early studies relied mainly on field color-card comparison and manual recording to extract dominant and auxiliary façade colors of traditional villages and summarize village color tones. Seokhyun [29] proposed a rural landscape color planning method from the perspective of cultural climate, using color-environment analysis to determine village color positioning. Such methods depend on researchers’ subjective judgment, and color cards are constrained by printing and illumination conditions, making them unsuitable for large-scale repeatable measurement. Chen and Gu [30] advanced subjective color judgment toward objective measurement by using the Natural Color System and Likert scales from the perspective of traditional Chinese colors.
After digital image processing was introduced, color-space conversion and automatic clustering became the mainstream path: rural building and street images are collected; RGB pixels are transformed into perceptually uniform spaces such as CIELAB, HSV, or the Natural Color System (NCS); and color features are extracted. Dong and Kang [31] used K-means to quantitatively compare the geographic colors of architectural heritage in traditional villages in southeastern Hubei; Yang et al. [32] used NCS codes of field samples in Qingmuchuan Village, southern Shaanxi, to quantify differences in hue and lightness between natural and built environments and propose color-control strategies; Li and Yang [33] constructed a digital color model based on extracted dominant and auxiliary landscape colors to quantify the landscape color of Yueling Village and establish a digital representation and control workflow; and Kong et al. [34] introduced a random forest model to construct a regional color model for traditional villages in the Minjiang River basin, enabling automatic identification and classification of regional village colors.
A complete chain of “color-space conversion–clustering extraction–indicator calculation–planning application” has thus been formed, but the quantification object remains dominated by building façades. The composite street color system composed of vegetation, pavement, water, and other elements is neglected; empirical samples are limited to one or a few villages; and measurement areas depend on manual delineation and site selection, making it difficult to support repeatable and comparable spatial measurement at the county scale.
2.3. Application of Deep Learning in Rural Spatial Color Research
Rural research has long been constrained by high data-collection costs, insufficient quantitative tools, and incomplete coverage of multiple visual elements; deep learning provides a feasible solution [35,36,37,38]. Street view imagery (SVI) sources such as Google Street View and Baidu Street View provide standardized, geocoded, large-scale visual samples in rural areas, support macro-pattern analysis and long-term change tracking, and expand the spatiotemporal scope of rural research [39,40]. Qi [41] used semantic segmentation to identify roadside green space, farmland density, and building enclosure and established a preference model, revealing the influence of structural characteristics on visual experience.
Technically, semantic segmentation models such as SegFormer [42,43], DeepLabV3+ [44], and Mask2Former [45] can accurately separate highly mixed rural elements—including vegetation, buildings, sky, ground, water, and crops—solving the inability of traditional global color extraction to distinguish natural from artificial colors. Zhai et al. [21,46] used PSPNet to segment building façades from Baidu Street View images and compare façade colors across street types; Zhang and Fukuda [47] used a Cityscapes-pretrained PSPNet to segment street façades and construct a city-scale façade color measurement method; and Ki and Lee [48] calculated street-level green view indices based on deep semantic segmentation to analyze the effect of green space on walking behavior. Combined with K-means and DBSCAN clustering, these models can quantify the color characteristics of each element separately and construct a multidimensional indicator system reflecting the rural composite color system.
The emergence of multimodal pretrained models such as CLIP and ViT-B has shifted color research from pixel-level statistics toward semantic-level perception prediction [49,50]. For perception prediction, crowdsourced datasets such as Place Pulse 2.0, combined with deep learning, enable large-scale prediction from visual features to human settlement perception: Gong et al. [51] fine-tuned VGG16 on Place Pulse-pretrained weights to predict rural landscape aesthetics, tradition, and belonging; Zhu et al. [52] built a pairwise-comparison PAIR-CNN using Places2-pretrained ResNet50 and aggregated scores with TrueSkill for large-scale rural perception prediction; and Ma et al. [53] used ResNet-50 to predict street aesthetic quality end-to-end. Deep-learning methods have also been used for village identification in remote sensing; Li et al. [54] detected villages from high-resolution remote sensing imagery using unsupervised deep feature learning.
Overall, deep learning has moved color research from “pixel statistics” toward “semantic-level perception”; however, challenges remain in rural scenes with high vegetation, low density, complex mountains, and insufficient street view coverage. Existing models are difficult to adapt directly to rural scenes and require localized validation and improvement for rural environmental characteristics.
3. Methods and Materials
3.1. Study Area
The empirical area is the non-central urban area of Wuyuan County, Shangrao, Jiangxi Province. The actual study boundary is the county road-network area within the non-central urban area of Wuyuan County where street-view observation is available. Specifically, the road network was clipped according to imagery accessible through the Baidu Maps panorama API, yielding 981 candidate road segments totaling 991.58 km as the sampling frame.
Wuyuan County is located at the junction of Jiangxi, Zhejiang, and Anhui provinces (29°01′–29°34′ N, 117°22′–118°12′ E), with a total area of approximately 2967.78 km2 (Figure 2). The terrain is dominated by low and medium mountains and hills, sloping from northeast to southwest, with a forest coverage of 82.6% and a typical Jiangnan hilly landscape pattern. Wuyuan villages are iconic heritage of Huizhou culture, with distinctive symbolic value and artistic quality [1]. Local buildings are dominated by pink walls, dark tiles, bluestone, and raw wood, producing a high degree of integration among architecture, streets, and natural color [19]. Historical and cultural resources also make rural color landscape an important factor influencing tourist experience and the dissemination of regional culture [55]. Compared with central urban areas, Wuyuan’s non-central urban area has higher exposure of vegetation and mountains, lower continuous building frontage, clearer road-hierarchy differences, and more uneven street-view coverage.
Figure 2.
Location of the case area: Wuyuan County (non-central urban area), Shangrao, Jiangxi, China.
Therefore, studying the color environment perception of Huizhou-style rural streets is significant. On the one hand, it can fill the gap in quantitative research on traditional rural landscape color and perception and provide a scientific basis for Huizhou-style rural color conservation and sustainable cultural-tourism development [56]. On the other hand, it can test the transferability of street color-environment perception models from high-density urban to low-density rural environments and examine the applicability and generalization of machine-learning methods in low-density, high-naturalness, and atypical urban environments.
3.2. Data Collection and Preprocessing
3.2.1. Street View Image Data
Street view images were obtained through the Baidu Maps Panorama Static Image API (http://api.map.baidu.com/panorama (accessed on 29 April 2026)) to analyze the quantitative relationship between human perception and street color characteristics.
Human perception of distant objects declines with distance; when distance is too large, shape, spatial layout, and depth cues become blurred. A fixed design interval of 60 m was therefore used to generate candidate points along the road network. Based on the clipped county road network (981 segments; 991.58 km), candidate sampling points were generated at this interval. After deduplication and spatial validation, 5049 valid coordinate points were retained. The median nearest-neighbor distance was 51.3 m, P95 was 56.8 m, P99 was 57.1 m, and the maximum was 754.8 m. Only two points exceeded 60 m (63.3 m and 754.8 m), meaning that 99.96% of sampling points had nearest-neighbor distances no greater than 60 m. Table 1 summarizes the nearest-neighbor distance distribution. Table 2 presents the information of points that are beyond 60 meters. Table 3 shows that, after removing these two points, the maximum change across all 84 correlation coefficients was 0.0021 (only the five largest changes are listed), indicating that the two points had a negligible influence on correlations. The sampling points covered approximately 270.12 km of the county core road network, or 27.2% of the total road network. (Table 3 lists only the five largest changes; the full analysis contained 84 pairs, with maximum |Δr| = 0.0021.)
Table 1.
Nearest-neighbor distance distribution of the point set.
Table 2.
Points exceeding 60 m.
Table 3.
Correlation sensitivity after removing out-of-range points.
Street view coverage differed markedly by road class (Table 4): provincial roads reached 88.2%, county roads 45.0%, urban roads 40.9%, township roads 16.5%, and low-level roads only 1.6–11.7%. The uncovered portions were concentrated in township and low-level roads, indicating uneven distribution across road types.
Table 4.
Road network coverage by NETCLASS.
Given that street view coverage was 27.2%, this study does not infer representativeness for all rural streets. Instead, it defines the sampling scope, reports coverage by road class, and clarifies the representative boundary and potential coverage bias. Conclusions apply only to roads with available street-view observations; buffer coverage and platform image availability are treated as two separate limiting factors.
Street view images were mainly collected in March 2014, supplemented by images from July and September 2014 to maintain consistent seasonal vegetation characteristics. At each sampling point, images were collected in four directions (east, south, west, and north), with all four directions available and a uniform resolution of 800 × 800 pixels (Figure 3). The original number of sampling sequences was 5509; after deduplication and spatial validation, 5049 valid coordinate points remained.
Figure 3.
Collection workflow of Baidu Street View images (BSVI).
To assess whether merging images from different months altered the main associations, image-level mean comparisons and point-level grouped correlation comparisons were conducted. Among 22,036 images from March, July, and September, March accounted for 90.6%. The mean vegetation ratios in July and March were 0.384 and 0.250, and the model beauty scores were 6.41 and 5.52, respectively (Table 5). Month differences were evaluated by indicator level and by association direction.
Table 5.
Grouped indicator means by month.
Among the tested associations in the March group (n = 4555) and non-March group (n = 494), all five association directions were consistent, although some strengths differed (Table 6).
Table 6.
Correlation comparison by month subset.
Therefore, we consider that merging months had little influence on the directions of the five tested associations: the directions remained consistent after grouping, and the main directional judgments did not change by month group. Because indicator means still differed by month, conclusions are interpreted under 2014 image conditions; this comparison is not used to infer the magnitude of seasonal change at the same location.
3.2.2. Data Preprocessing
First, sampling points were spatially overlaid with the boundaries of 153 administrative units in Wuyuan County (EPSG:4326). Three points outside the boundary were removed, leaving 5046 valid points within the boundary. Second, road-network proximity was verified for the retained points. The median distance from sampling points to the nearest road was only 0.02 m (P95 = 0.05 m; maximum = 0.07 m), confirming the high coincidence between street-view coordinates and vector road centerlines. Finally, 22,040 JPG street view images were successfully obtained and parsed, with a parsing failure rate of 0%, ensuring dataset integrity and high availability.
4. Research Process
The study first applied SegFormer-B5 for pixel-level semantic segmentation of street view images in the study area and classified seven landscape elements. Based on the segmentation masks, sky pixels were removed and color data were extracted for each street view image and rural façade to analyze rural color characteristics. The model pretrained on the Place Pulse 2.0 dataset was then transferred to Wuyuan street view imagery to output six-dimensional human settlement perception scores in batches (Figure 4). Finally, Pearson correlation analysis combined with Spearman tests was used to systematically examine the intrinsic relationships among street visual elements, color parameters, and perception scores.
Figure 4.
Prediction procedure of street view image perception scores.
4.1. Semantic Segmentation
Image semantic segmentation is a key method for parsing street view visual elements and evaluating human settlements [57]. Traditional SegNet models are limited by convolutional structures and cannot fuse multi-scale information from near to far, resulting in low recognition accuracy for rural streets with complex mountain-water hierarchy. This study therefore used the SegFormer-B5 model pretrained on ADE20K [58], which relies on a hierarchical Transformer and lightweight decoder and captures both near-ground structures and distant mountains and water without positional encoding. It has fewer parameters, adapts to rural images of various resolutions, and provides high batch-parsing stability [42]. The fine-grained ADE20K labels were retained, and the original 150 pixel-level classes were integrated into seven target categories—sky, road, building, vegetation, mountain, water, and other—through probability-weighted aggregation, thereby improving mountain recognition absent in SegNet and preserving rural natural landscape pixel information.
The ADE20K fine-grained labeling system was retained, and the original 150 pixel-level classes were mapped into seven target categories: sky, road, building, vegetation, mountain, water, and other. The complete mapping is summarized in Table 7. The mapping was designed according to semantic similarity and visual relevance to rural street scenes: for example, ADE20K categories such as “tree,” “grass,” “plant,” and “field” were aggregated as “vegetation,” whereas “building,” “house,” “tower,” and “skyscraper” were assigned to “building.” Categories not belonging to the six target categories, such as “person,” “car,” “chair,” and “table,” were assigned to “other.” This aggregation scheme compensates for SegNet’s lack of mountain recognition while preserving pixel-level information of rural natural landscapes.
Table 7.
Mapping from ADE20K to seven target categories.
In the probability-weighted aggregation workflow, SegFormer-B5 outputs an original logit map of shape (150, H, W) for each input image, where each channel corresponds to an ADE20K class. Softmax is first applied along the class dimension to obtain a probability map P of dimension 150 × H × W. For each of the seven target categories, the probabilities of all ADE20K classes mapped to that category are summed, yielding an aggregated probability map of shape (7, H, W). The final segmentation mask is obtained by argmax over the seven aggregated channels at each pixel. Compared with hard assignment followed by rule-based merging, this probability-weighted method preserves uncertainty information and produces smoother boundaries at class junctions, which is particularly important for rural scenes with complex mountain-water layers.
4.2. Street Landscape Color Extraction
Semantic segmentation quantifies the proportion of landscape elements but has difficulty identifying fine color differences such as façade material color and landscape layering. We therefore introduced clustering to compensate for this limitation [59]. Mean-shift and hierarchical clustering were compared but showed insufficient stability and high computational cost. Thus, K-means was selected to extract dominant colors, which is suitable for massive street view data [60,61,62,63,64]. To remove color bias caused by illumination and sky background, images were white-balanced and contrast-enhanced, and semantic segmentation masks were used to remove sky pixels, ensuring that extracted colors matched street reality (Figure 5) [65].
Figure 5.
Schematic diagram of street façade extraction from street view images using deep learning. (a) Example BSVI panorama after color processing; (b) semantic segmentation result, with the red polygon indicating the rural street façade image region; (c) extracted rural street façade image; (d) extracted rural street façade colors.
To verify the necessity of removing sky pixels, color indicators with and without sky masking were compared. After sky removal, mean average luminance decreased by 38.6% and yellow-green axis increased by 70.1%; the cross-sample Spearman ρ of yellow-green axis was only 0.37, and the a* – b* correlation changed from positive to negative. These results indicate that, without sky removal, b_mean mainly reflects the proportion of blue sky rather than the yellow–blue color characteristics of the street scene itself. Therefore, before K-means clustering, sky pixels were removed using semantic segmentation masks, and the dominant color set vector (DCSV) features were extracted only from non-sky regions.
After image preprocessing, the number of clusters was set to K = 4. Through iterative K-means clustering, the DCSV of rural street scenes was extracted and the four core dominant colors with the highest proportions were selecyted to obtain the main color structure of rural streets (Figure 6). For example, Figure 6a shows four dominant colors c1, c2, c3, and c4 extracted from a rural façade scene at a sampling location, with DCSV weights of 0.42, 0.22, 0.21, and 0.15, respectively.
Figure 6.
DCSV extraction results for five BSVI panorama samples. (a) BSVI panorama and four dominant colors in the DCSV; (b) four dominant colors extracted from another sampling point; (c) four dominant colors at a third sampling point; (d) four dominant colors at a fourth sampling point; (e) four dominant colors at a fifth sampling point.
To determine K, experiments were conducted for K = 3–6 and stability was compared. For the same batch of sample images, using K = 4 as the reference, the rank correlation coefficients ρ of L*, a*, b*, harmony, and purity were all no lower than 0.9157 for K = 3, 4, 5, and 6, and no lower than 0.97 compared with K = 5/6; in high-vegetation scenes, L* remained about 17 units lower than in high-building scenes (Figure 7). Although color complexity increased with K, its spatial pattern remained stable. Considering the existing setting of the SVCP-R framework and the stability test in this study, K = 4 was finally selected.
Figure 7.
Rank correlations of metrics under different K values relative to K = 4 (n = 200).
To quantify color features and associate them with environmental perception data, the extracted RGB parameters were uniformly converted to the CIELAB color space and area-weighted according to the proportion of pixels in each color. The final core color indicators included color complexity, color harmony, average lightness, red–green axis mean, yellow–blue axis mean, color purity, and dominant-color center separation.
4.2.1. Color Complexity
Color complexity reflects the degree of pixel-level color difference in an image: greater color difference corresponds to higher complexity [66]. Previous studies often measured complexity by counting colors, but ignored the proportional distribution of colors in rural streets and lacked systematic evaluation.
This study introduced the Herfindahl–Hirschman Index (HHI) from economics [67,68]. Originally used to measure market concentration, HHI was used here to evaluate the concentration and diversity of rural street color distribution by summing the squared proportions of colors. Higher HHI indicates dominance by a few colors and lower complexity; lower HHI indicates a more even color distribution and higher complexity.
Compared with entropy or standard deviation, HHI is more intuitive and computationally convenient. The calculation formula for color complexity is as shown in Formula (1).
where denotes the color complexity of the -th rural streetscape image; is the pixel-area proportion of the -th dominant color in the -th image; is the total number of dominant colors. The color complexity of a streetscape image ranges within (0,1), with smaller values indicating simpler and larger values indicating more complex streetscape colors.
4.2.2. Color Harmony
Color harmony measures the visual coordination of rural streets and reflects the matching effect of different color elements [69]. Previous studies often evaluated harmony only by hue-wheel angle difference or color-number matching [22], without considering dominant-color area weights and structural color distribution. This study adopted a harmony model based on color-difference theory, using the mean color difference among dominant colors to reflect color distribution coordination. The model is simple and clear, and suitable for small-scale, highly localized analysis of rural streets, The formula for the harmonious color scheme of rural streets is shown as Formula (2).
where denotes the color harmony of the -th rural streetscape image; is the mean color difference among the dominant colors of the -th image (computed using the CIE76 color-difference formula to ensure consistency with human perception). In the formula, reflects the difference in color distribution: when the differences among dominant colors are extremely small, approaches 0 and approaches 1, indicating highly unified colors and high harmony; when the differences among dominant colors are extremely large, increases and decreases, reflecting obvious color conflict and reduced harmony. Therefore, the value range of this indicator is , where larger values indicate more harmonious and smaller values more chaotic rural street colors.The correlations of this indicator with model beauty and depressing scores were 0.24 and −0.29, respectively (both p < 0.001), serving as supplementary evidence for the association with model outputs. In addition, K-means first extracts dominant colors before calculating this indicator; the K sensitivity test supports the rank stability of the calculation result and does not bear the burden of aesthetic validity verification.
4.2.3. Mean Lightness and Chromaticity Axes
To quantify the overall light-and-shadow tone and color tendency of rural streets, this study selects the mean lightness and chromaticity axes in the CIELAB color space as evaluation indicators. Mean lightness reflects the light-and-shadow atmosphere and visual permeability of street space: when high, streets appear bright and open; when low, they may feel oppressive, gloomy, or excessively shaded by vegetation. It can therefore be used to evaluate the comfort of the light environment of rural streets.
The chromaticity axes reflect the average positions of colors on two orthogonal dimensions, characterizing the warm–cool tone of rural environments. The a axis (red–green axis) represents the bias of colors between red and green, with positive values leaning red and negative values leaning green; in rural scenes it can capture the greenness of vegetation or the warm tones of red bricks and timber components in traditional buildings. The b axis (yellow–blue axis) represents the bias of colors between yellow and blue, with positive values leaning yellow and negative values leaning blue; it is often used to measure the warm yellow tone of land and autumn leaves or the cool blue atmosphere of sky and water in rural environments.
This study uses the area-weighted method to compute the mean lightness and chromaticity coordinates of images. Compared with the arithmetic mean, area weighting can more accurately reflect the influence of dominant colors on the overall visual perception and reduce the bias caused by background noise colors or fine noise. The calculation formula is as shown in Formula (3).
where , , denote the area-weighted mean lightness and chromaticity coordinates of the -th rural streetscape image, respectively; is the pixel-area proportion weight of the -th dominant color in the -th image; , , are the lightness value and chromaticity components of the -th dominant color in the CIELAB color space, respectively. Through this computation, the comprehensive characteristics of rural streets in terms of light-dark contrast and color shift can be systematically evaluated.
4.2.4. Color Purity
Color purity measures the vividness and saturation of rural street landscape colors [70]. In the CIELAB color space, purity is quantified by the Euclidean distance (chromaticity radius) on the a–b chromaticity plane. When purity is high, colors are vivid and bright, commonly seen in traditional villages or rural landscapes with lush vegetation; when purity is low, colors are grayish and soft, mostly seen in overcast environments or scenes with monotonous building materials.
This study represents the color purity of the i-th image by the area-weighted mean of the chromaticity radius. This method weights by the proportion of each dominant color in the image, thereby obtaining the average saturation level of the overall colors. The calculation formula is as shown in Formula (4).
where denotes the area-weighted mean color purity of the -th rural streetscape image; is the pixel-area proportion weight of the -th dominant color in the -th image; and are the chromaticity components of the -th dominant color in the CIELAB color space, respectively. The square-root term is the chromaticity radius of the -th dominant color (chroma value ), with larger values indicating more vivid colors.
4.2.5. Dominant-Color Center Separation
Dominant-color center separation measures the dispersion of the dominant colors of rural streets in the CIELAB space [71]. When separation is high, the dominant colors contrast sharply and the visual layering is clear, commonly seen in traditional villages with diverse colors; when separation is low, the color tone tends to be unified or even monotonous, mostly seen in newly built rural blocks. This indicator is a normalized relative measure that eliminates the influence of the absolute color-difference dimension, facilitating horizontal comparison of streetscapes under different lighting and scene conditions.
This study computes the dominant-color center separation of the i-th image using the normalized form of weighted color difference. This method calculates the perceptual color difference between each pair of dominant colors while reflecting the visual contribution of each dominant color in the image through area weights, reducing the interference of small-area noise colors on the evaluation of the overall color structure. The calculation formula is as shown in Formula (5).
where denotes the normalized dominant-color center separation of the -th rural streetscape image; and are the pixel-area proportion weights of the -th and -th dominant colors, respectively; is the Euclidean distance (i.e., perceptual color difference) between the two dominant colors in the CIELAB color space.
4.3. Human Perception Score Prediction
4.3.1. Selection of the Deep Learning Model
Early environment-perception studies mostly relied on convolutional neural networks (CNNs) [72], such as ResNet [73] and VGG [74], which are good at extracting local image textures but, limited by their receptive fields, find it difficult to establish long-range semantic connections in scenes. Some studies also used support vector machines (SVMs), which generalize well and perform strongly in high-dimensional spaces and small samples [75], but they are computationally expensive for massive street view imagery and unstable under noise [76].
In recent years, ViT models with global self-attention have gained prominence because they capture the overall scene layout [77]. This study selects ViT-B/16 as the basic architecture for two reasons: it maintains high accuracy with a moderate number of parameters (about 86 million), balancing performance and computational efficiency at a 384 × 384 input resolution; and, compared with larger models, it is less prone to overfitting in small-sample or cross-domain transfer, making it more suitable for Chinese rural areas that differ culturally and geographically from the training data.
4.3.2. Overview of the Place Pulse 2.0 Dataset
Place Pulse 2.0, constructed by the MIT Media Lab [78], collects cross-cultural subjective judgments of street views through global crowdsourced A/B tests, covering six dimensions: safety, liveliness, affluence, beauty, boredom, and depression. Pairwise image comparisons output relative scores and provide a benchmark for mapping visual features to human settlement perception.
4.3.3. Model Construction and Training
Based on the above architecture, the model was pre-trained on the Place Pulse 2.0 dataset [72], accepts image inputs of 384 × 384 pixels, and outputs perception scores on six dimensions—safety, liveliness, affluence, beauty, boredom, and depression—each ranging from 0 to 10. To transform image-level predictions into macroscopic spatial analysis indicators, this study constructs a multi-level score aggregation mechanism. For each sampling sequence , among all the images it contains, on a specific dimension , the output scores are averaged, yielding the sequence-level perception score, The formula for calculating the perception score is shown in Formula (6).
Subsequently, considering that multiple sampling sequences may correspond to the same geographic location, if several sampling sequences share the same deduplicated coordinate point , the coordinate-level indicator is taken as their mean. The calculation formula is as shown in Formula (7).
where denotes, at coordinate point , the -th visual, color, or perception indicator; is the set of sampling sequences corresponding to coordinate point . This quantification process is illustrated in the street view panorama shown in (Figure 8), where the radar charts display the distribution patterns and numerical differences in each perception dimension across different scenes.
Figure 8.
Representative street view images for different perception dimensions. Radar charts on the left show six perception types; from 3 to 5 o’clock counterclockwise: (a) S-Safe; (b) L-Lively; (c) B-Beautiful; (d) W-Wealthy; (e) Bo-Boring.
The perception model was treated as a surrogate tool for environmental perception rather than a direct equivalent of local field subjective scores. Place Pulse 2.0 training material is dominated by European and American urban street views, which differ greatly from Chinese rural scenes; absolute scores may be biased. Therefore, individual scores are not interpreted alone. Instead, scores are aggregated to the sampling-coordinate level and analyzed using relative values and spatial differentiation.
4.3.4. Model Calibration
To examine the applicability of Place Pulse 2.0 in Huizhou-style rural street contexts, a local perception scoring experiment was conducted in May 2026. Sample images were taken from 30 street view sampling points used in the main analysis, with one image and one road segment per sampling point. Images were programmatically obtained from Baidu Maps street view services; the main images were captured in March 2014 and supplemented by images from July and September 2014 to maintain consistent seasonal vegetation characteristics. The 30 sampling points were selected by three criteria: (1) visual representativeness, reflecting typical Huizhou-style rural street characteristics such as white walls and dark tiles, horse-head walls, and traditional courtyard layouts; (2) typological diversity, covering main commercial streets, residential alleys, village entrance squares, ancestral-hall and festival roads, and balancing well-preserved historic blocks with contemporary new construction; and (3) data availability, requiring clear and continuous street view images with minimal occlusion and minimal interference from vehicles, pedestrians, and temporary structures.
In the scoring session, 200 independent participants were recruited, including local residents, cultural-tourism practitioners (homestay and agritainment operators, tour guides, scenic-area staff), and visiting tourists through local communities and village committees, cultural-tourism industry associations, scenic sites, and social media. After fully understanding the research purpose and signing informed consent, participants volunteered and remained anonymous throughout. This produced 6000 rating records (30 sampling points × 200 participants). The questionnaire composition, collection process, and specific content are included in the Appendix Section Respondent Composition, Data Collection Procedure, and Questionnaire Content to ensure data transparency.
To incorporate local human evaluations into the perceptual analysis of the SVCP-R framework, we aggregated ratings from 200 questionnaires for each of the 30 sampling sites to generate site-level human references across the six perceptual dimensions. The unit of analysis was the sampling site n = 30. The raw human mean rating r on the 1–5 scale was rescaled to a 0–10 scale via y = 2.5(r − 1) to match the scale of predictions x from the original model. This unified scale was adopted for all subsequent fusion and error calculations.
Spearman’s correlation was used to quantify the rank consistency between original model predictions and human references. Table 8 presents the results for all six dimensions. The six tests were treated as a single family of tests, with the Benjamini–Hochberg correction applied (FDR = 0.05). The sense of vitality yielded the strongest positive correlation ρ= 0.412, uncorrected p = 0.0237, corrected p = 0.1420. Correlation coefficients for the remaining five dimensions ranged from −0.159 to 0.149, all with corrected p = 0.8504. None of the six dimensions reached statistical significance after correction. This analysis characterizes rank correspondence across sites; the numerical consistency of ratings is assessed separately via the calibration analysis below.
Table 8.
Spearman correlations between original model predictions and local human mean ratings (n = 30).
Equation (8) fuses model predictions and local references using fixed weights:
where Score_local denotes the overall mean of the 30 site-level human ratings y for the same dimension, and α = 0.7 is a pre-specified empirical weight. This configuration takes model outputs as the dominant component while incorporating a 30% contribution from local references. Since Score_local is constant within each dimension, the fusion adjusts the level and magnitude of ratings while preserving the relative rank order among sites. Equation (8) is adopted for local reference adjustment of mapped scores, and its weight is not optimized on this sample.
To evaluate the performance of dimension-wise numerical calibration, ordinary least squares (OLS) models ŷ = ax + b were fitted separately. Table 9 reports the raw RMSE, in-sample OLS RMSE, and leave-one-site-out cross-validated RMSE. In each cross-validation fold, coefficients were estimated using 29 sites to predict the held-out site; RMSE was finally aggregated over all 30 held-out predictions. The leave-one-out RMSE of all six dimensions was lower than the raw RMSE, with relative reductions ranging from 14.88% to 48.06%. Specifically, the sense of security, aesthetic quality, and sense of oppression decreased from 3.720, 3.395, and 4.429 to 1.932, 2.110, and 2.611, respectively. These results support the numerical calibration performance of OLS under within-sample cross-validation for the local sample. The reported error reduction originates from OLS, whereas the fusion in Equation (8) is described separately.
Table 9.
OLS calibration results for the six perception dimensions.
This section evaluates the rank correspondence between model outputs and local evaluations, the implementation of local reference integration, and the outcomes of linear numerical calibration via held-out predictions, using six-dimensional correlation analysis, rank-preserving local reference fusion, and numerical calibration assessment, respectively.
4.4. Multi-Scale Aggregation and Road-Network Mapping
After completing image-level semantic segmentation and perception-feature extraction, the raw data still present a discrete point distribution. To better reveal the macroscopic spatial distribution patterns of the rural street color environment and remove the interference of local outliers on the overall trend, this study constructs a hierarchical spatial aggregation framework from the “sampling-point level” to the “administrative-unit level.” This process takes 22,040 raw street view images as atomic units and averages the image indicators of the four directions under the same collection sequence to reduce the chance bias of a single viewpoint; then, geographic locations are deduplicated and merged, and a spatial matching algorithm projects the discrete coordinate points onto the nearest vector road segments (with a 10-m matching tolerance), forming a road-level observation set. Finally, the dominant color distribution and perception mean within each administrative unit are statistically computed, realizing the mapping from microscopic observation to the macroscopic pattern.
To fill the data gaps on road segments not observed by the street view collection vehicle, this study introduces the K-nearest neighbor (KNN) smoothing algorithm to ensure the continuity of spatial analysis. For a road segment with direct observation points, its indicator value is defined as the mean of the set of all coordinate points matched to that segment, the specific formula used is shown in Formula (9).
where denotes the value of coordinate point on the -th dimension indicator. For road segments lacking direct observation data, based on the principle of spatial autocorrelation, its nearest observed roads or points are used for interpolation. The smoothed indicator value is calculated as Formula (10).
where denotes road segment ’s nearest observed-neighbor set; is the spatial distance between road segment and neighbor ; is the distance weight (the closer the distance, the larger the weight), and is a very small constant to prevent a zero denominator. Leave-one-out cross-validation showed that the RMSE fluctuates by less than 0.1% when k = 2–10. Under the established distance-weighted configuration, k = 1, 3, 5, 7, and 10 were systematically tested; the range of average RMSE across indicators was about 0.106% and average R2 was about 0.23 (Appendix A Table A1 and Table A2), indicating that error summaries were insensitive to the number of neighbors and that interpolation results were robust. After testing, k = 5 was selected to balance local feature retention and noise smoothing.
Observed and smoothed values have clear use boundaries: KNN-smoothed road-level data are used only for macro spatial pattern expression and visualization, not for any correlation or partial correlation analysis, and therefore do not increase effective statistical samples. All correlation tests are based on the aforementioned 5049 original observation units.
At the level of statistical inference, this study considered both spatial dependence and multiple comparisons. Moran’s I tests showed that the six perception dimensions ranged from 0.455 to 0.665 (p ≤ 0.001), indicating significant spatial autocorrelation of street view perception indicators; significance under the conventional independence assumption may therefore be overestimated. To separate the independent contributions of vegetation and buildings, partial correlation analysis was used: after controlling vegetation ratio, the partial correlation between building ratio and model beauty was −0.612; after controlling building ratio, the partial correlation between vegetation ratio and model beauty was 0.432 (Appendix A Table A3). It should be noted that these results are conditional associations in a non-spatial framework and have not corrected p-values for spatial dependence. For multiple comparisons, Benjamini–Hochberg FDR correction was applied to all 84 pairs formed by 14 variables and six perception dimensions. All 76 pairs with raw p < 0.05 remained q < 0.05 after correction, and the 10 pairs with the largest |r| also passed (Appendix A Table A4 and Table A5); thus correction did not change significance judgments at the 0.05 threshold.
5. Results
5.1. Data Coverage and Spatial Representativeness
This study successfully parsed 22,040 street view images, covering 5509 original sampling sequences and 5049 deduplicated coordinate points. In terms of spatial distribution, the median nearest-neighbor distance is 51.3 m (95th percentile 56.8 m), indicating that the sampling interval along the road network has a regularity of about 50–60 m. In addition, the extremely small distance between the sampling points and the road network (95th percentile only 0.05 m) confirms the high geometric consistency between the street view coordinates and the vector road data. Furthermore, the road coverage ratio is 27.2%.
5.2. Directional Sampling Results
This study collected four-directional street view images at all 5509 sampling points. Taking the spatial centroid of the study area as the origin, 16 directions were divided at equal intervals of 22.5°, and the mean emotional perception and color feature values in each direction were computed. Each sampling sequence collected street view images in the north, east, south, and west directions to reduce the visual-field bias caused by a single shooting orientation. Figure 9 consists of 12 small wind-rose diagrams, including 7 perception indicators and 5 color indicators; each subplot is normalized separately, and higher radius and color scale indicate a higher relative mean of the corresponding indicator in that direction.
Figure 9.
Spatial wind-rose distributions of the characteristic elements centered on the central area of Wuyuan County (true north is 0°, with 16 directions evenly spaced at 22.5°). (a) Perception wind-rose diagrams, (b) color wind-rose diagrams.
The results show that the high-value directions of different perception indicators are inconsistent: beauty, affluence, and comprehensive perception are highest in the southeast, while the peaks of liveliness, safety, boredom, and depression are located in the east-southeast, west, southwest, and east directions, respectively. The directional standard deviations of the seven perception indicators account for 6.1–15.9% of their means. Among the color features, complexity is the most stable, whereas the directional differences in the red–green axis and the yellow–blue axis are the most pronounced, both reaching higher values in the south-by-west direction. Overall, each indicator presents an independent directional gradient and is not dominated by the orientation of any particular road.
5.3. Semantic Composition of Streets
The main visual landscape elements in street environments include greenery, sky, buildings, and roads [79]. Based on this, this study analyzed the spatial distribution characteristics of the visual landscape elements of rural streets in Wuyuan County (Figure 10). The KNN-smoothed semantic segmentation results show that the average vegetation ratio of the study area is 0.27, one of the highest semantic elements; the mean sky ratio and road ratio are 0.24 and 0.24, respectively, and the three together constitute the visual main body of Wuyuan streetscapes. In sharp contrast, the mean building ratio is only 0.06, significantly lower than the common level of high-density urban streetscapes, indicating that this area presents a “vegetation–sky–road”-dominated visual structure rather than the typical “building–road” pattern of urban centers [80]. In addition, the mean mountain ratio is 0.12, confirming that mountains and hilly backgrounds are important components of non-central urban streetscapes; the water ratio, although low overall (mean 0.003), enriches the spatial layering as a potential landscape node. The low building proportion and the relatively high mountain proportion illustrate the open, natural landscape characteristics of non-central streets in Wuyuan County.
Figure 10.
Spatial distribution of visual landscape elements: (a) green landscape index; (b) sky landscape index; (c) building landscape index; (d) road landscape index; (e) mountain landscape index; (f) water landscape index.
5.4. Color Structure and Dominant Façade Hue Characteristics
This study quantified the color characteristics of Wuyuan’s rural streets based on the Lab color space and the HSV model. The results show that the mean street lightness is 33.44, leaning toward medium-to-low lightness; the mean color purity is 19.73; the color complexity after sky removal reaches 0.68, indicating that the streetscape is composed of multiple dominant colors with rich layering; and the mean harmony is 0.02, reflecting the coexistence of colors under the interweaving of natural and artificial elements.
Combined with the spatial distribution maps in Figure 11, the township-level color differentiation is significant. Qinghua, Sikou, Jiangwan, and Fuchun towns have higher lightness and color complexity, benefiting from the mature tourism landscape, the interlaced landscape structure of mountains, water, and farmland, and the light-colored Hui-style building base; whereas the western mountain and forest townships have high vegetation canopy closure and monotonous landscape elements, with lower overall lightness. Color harmony shows a north–south difference: the northern Dazhangshan Township, the northern part of Qinghua Town, and Zheyuan Township have unified traditional village features and good color order, with higher harmony, whereas the southern townships have cluttered residential façades and commercial signs and weaker color coordination. At the color-channel level, high red–green values are sporadically distributed in Fuchun, Qinghua, Sikou, and other towns, mainly influenced by red crops, red-brick buildings, and advertising facilities; high yellow–blue values are concentrated in waterside townships, where the blue of the water and the warm yellow base of the fields form a cold–warm contrast, whereas Dazhangshan Township and Jiangwan Town lack water systems and have a more monotonous overall street color tone.
Figure 11.
Spatial distribution of color features based on KNN smoothing: (a) color complexity; (b) color harmony; (c) lightness; (d) red–green; (e) yellow–blue.
Overall, the color structure exhibits a “dark-tone, high-complexity” pattern, which mainly results from the superimposition of the material composition of Hui-style buildings and the mountainous environment: dark roofs, timber components, and shadows reduce the lightness, and the gray-white walls show a neutral, slightly warm tone in the red–green and yellow–blue channels, forming a warm–cold contrast with the green of vegetation and the brown of earth and stone. The spatial differentiation of complexity and harmony, in turn, depends on township-level differences in tourism development, mountain–water systems, and the level of construction control.
Figure 12 shows the dominant façade hue classes of buildings based on geographic units. From the point-level view of Figure 12a, yellow (Y, 45.5%) and yellow-green (GY, 43.1%) occupy an absolute dominance. When the perspective is raised to the road level in Figure 12b, after KNN smoothing, the proportion of the yellow family (Y) further expands to 67.9%. This indicates that the warm-yellow tone is the most prominent visual symbol in continuous street interfaces, mainly due to the warm tones of timber widely used in Hui-style buildings and of weathered brick and stone, as well as the warm-toned coatings used in some modern renovations. At the administrative-unit level of Figure 12c, the geographic differentiation of colors is more obvious: some townships in the south show a higher proportion of green (G, 9.2%), indicating dense mountain-forest backgrounds or specific vegetation cover there, while most areas remain within the yellow to yellow-green dominant-tone range.
Figure 12.
Dominant hue distribution of building façades under different geographic units: (a) sampling-point level; (b) road level after KNN smoothing; (c) administrative-unit level.
5.5. Human Perception Scores and Spatial Clustering
Based on the street view semantic segmentation and color-feature quantification results, this study conducted a systematic assessment of the six-dimensional human perception quality in the five-source rural communities, and the visualization is shown in Figure 13. The statistical results show that the perception of rural streets in the study area presents obvious differentiation characteristics. Among the positive perception dimensions, the mean beauty score is 5.69 and the mean safety score is 4.52, indicating good overall aesthetic quality and pedestrian safety; however, the liveliness (3.16) and affluence (2.57) scores are low, reflecting the sparse commercial activity and low construction density of rural areas. Among the negative perception dimensions, the mean boredom score is as high as 5.95 and the mean depression score is 5.05, indicating that although the natural landscape of Wuyuan rural areas is beautiful, the road landscape elements are monotonous and the artificial supporting facilities are few, so that visual monotony and boring experiences are common.
Figure 13.
KNN-smoothed spatial distribution of human perception: (a) safety; (b) liveliness; (c) beauty; (d) affluence; (e) boredom; (f) depression.
The global spatial autocorrelation results show that the Moran’s I indices of the six perception indicators are all significantly positive at the 0.001 level, indicating that rural street perception quality has significant spatial clustering characteristics rather than a random distribution. Among them, beauty has the strongest clustering (0.665), with high values distributed continuously, forming an advantageous aesthetic perception mainly relying on continuous mountain-forest vegetation, open views, and low-density rural features. Combined with the KNN spatial interpolation results: high safety values are concentrated in town roads with regular road networks and unobstructed sightlines; high liveliness and affluence values are sporadically clustered in town centers and traffic nodes, reflecting the limitations of rural economic and activity spaces; high boredom values are widely distributed on mountain-forest and farmland roads far from settlements, where the natural base is good but the landscape layering is monotonous; and high depression values mostly appear in old village roads that are narrow, densely built, and poorly lit.
Overall, Wuyuan rural streets form a typical spatial perception pattern of high beauty, high boredom, and low liveliness, with clear spatial differentiation and significant clustering of the perception dimensions.
5.6. Correlation Analysis Among Visual Elements, Color Features, and Human Emotional Perception
This study further computed the Pearson correlation coefficients between the six-dimensional perception scores and the visual elements and color features. The correlation heatmap shown in Figure 14 intuitively reveals the linear association patterns among the variables, in which dark red represents a strong positive correlation, dark blue represents a strong negative correlation, and the shade of the color directly reflects the strength of the correlation. To ensure the robustness of the results, all subsequent analyses were supplemented by Spearman’s rank correlation coefficients for verification, and the conclusions of the two are highly consistent, confirming that the following findings are not random.
Figure 14.
Pearson correlation analysis among human affective perception, visual elements, and colors.
Among all correlations, green view ratio showed a very strong positive correlation with beauty (Pearson r = 0.66) and a significant negative correlation with depression (r = −0.53). This suggests that a “nature as healing” mechanism may be applicable in rural environments: rich vegetation cover is associated with improved landscape beauty and may also be associated with relief of depressive feelings. In addition, vegetation showed a moderate positive correlation with affluence (r = 0.38), indicating that good greening is associated with environmental cleanliness and beauty.
By contrast, built-environment elements show a complex duality in perception formation. Building ratio has the strongest negative correlation with beauty in the full matrix (r = −0.75), indicating that in a landscape based on mountains, water, and fields in Wuyuan, excessively high building density seriously damages the integrity of natural landscape and leads to a sharp decline in beauty. However, building ratio is significantly positively correlated with liveliness (r = 0.53), suggesting that in non-central rural areas, continuous street interfaces and buildings are often associated with concentrated social activities and commercial services. Sky view ratio is positively correlated with depression (r = 0.40) and negatively correlated with beauty (r = −0.23). In the context of Wuyuan, this can be interpreted as follows: an excessively high sky proportion may indicate lack of vegetation shelter or an open but barren area, which easily produces an empty and lonely feeling; moderate tree canopy may be associated with more enclosed and safer under-forest spaces, suggesting a possible association with psychological comfort.
The influence of color dimensions on perception shows subtle nonlinear characteristics. Lightness is moderately negatively correlated with beauty (r = −0.47): after sky background removal, high lightness corresponds to large light-colored hard pavement or exposed road surfaces, which may appear abrupt and lack texture in rural environments, thereby reducing beauty; moderate lightness usually corresponds to rich vegetation layers and light-shadow variation. Color harmony is positively correlated with beauty (r = 0.24) and negatively correlated with depression (r = −0.29), indicating that coordinated color landscape is associated with improved rural landscape quality. In addition, the red–green channel value is negatively correlated with beauty (r = −0.35), possibly related to withered non-flowering vegetation or messy artificial color interference.
Within perception dimensions, indicators also show significant relationships. Beauty is strongly negatively correlated with boredom (r = −0.38), indicating that road sections with high aesthetic value usually contain rich visual information and are less likely to induce monotony. Safety and liveliness do not show a strong positive correlation (r ≈ 0.00), reflecting the particularity of rural roads: some extremely safe and quiet country paths are often deserted and lack vitality, whereas some lively market road sections may have fluctuating safety scores due to mixed crowds. In addition, depression is significantly negatively correlated with beauty (r = −0.18) but positively correlated with boredom (r = 0.23), further confirming that low landscape quality or lack of visual experience may make people feel bored.
6. Discussion
6.1. A New Method for Measuring Rural Street Color Environment Based on the SVCP-R Framework
This paper explores how rural street color environments influence visual perception and thereby affect street space quality and vernacular landscape conservation. For many years, rural landscape research has emphasized visual elements, but traditional manual color measurement is poorly suited to rural scenes with high vegetation and complex mountains. To address this gap, this study proposes the SVCP-R framework, integrating SegFormer-B5, ViT-B/16, and K-means to extract multidimensional street color indicators from county-scale Baidu Street View images. Combined with six-dimensional perception scores output by the model, the framework analyzes associations between color and subjective perception under the interweaving of rural natural and artificial landscapes.
The main contributions are threefold. First, for rural environments characterized by high vegetation cover, complex mountain-water layers, and low building density, the framework introduces a sky-pixel removal strategy to eliminate color interference, supplements mountain semantic recognition, and reduces significant bias when transferring city-pretrained models directly to rural scenes. Second, by introducing a local questionnaire calibration mechanism, the framework locally corrects Place Pulse 2.0 perception predictions and reduces systematic bias caused by urban-rural cultural-context differences. Third, it constructs a complete analytical chain from pixel-level semantic segmentation to administrative-unit-level perception aggregation, providing a reproducible and comparable workflow for rural color-perception research. In this paper, the SVCP-R framework is not built from entirely new algorithms; rather, it is a systematic integration and rural adaptability verification of existing methods such as SegFormer, K-means, and ViT.
6.2. Targeted Strategies for Improving the Landscape of Wuyuan Rural Streets
According to the spatial differentiation of color and perception in Wuyuan, strategies should follow the principles of “natural base first, differentiated zoning control, adaptation to vegetation seasonal rhythms, and dynamic balance between complexity and harmony,” with targeted measures by regional characteristics.
For mature tourism areas such as Jiangwan Town, Xitou Township, Qinghua Town, and Sikou Town, where continuous white walls and dark tiles, open street-road networks, and complete tourism facilities produce high beauty, liveliness, and safety, but where flat farmland roads far from settlements are visually monotonous and deep mountain branch roads are shaded and depressing, a conservation-first strategy is appropriate. The diversified color base interlaced by ancient buildings, farmland, streams, and forests should be maintained; native seasonal vegetation such as red maple and oil tea should be planted in sections along farmland trunk roads to break the homogeneity of long-distance roads. At the same time, overly dense forests along valley alleys should be moderately thinned to widen visual corridors, and shop signs should be unified in low-saturation Huizhou colors, with street furniture in natural wood and gray neutral colors, so that vitality and traditional harmony can be balanced.
For mountain ancient-village areas concentrated in Dazhangshan Township, Tuochuan Township, and Duanxin Township, where native forests and traditional Huizhou villages are highly integrated and the aesthetic base is optimal, but market towns are small, commerce is scarce, and valley roads have high depression and boredom, the premise should be to adhere to the traditional “white walls and dark tiles” base and prohibit large-scale colorful façade renovation. Only small agricultural service points and local cultural-creative stalls should be added at village entrances to moderately activate street vitality. Valley roads should rely mainly on native vegetation, supplemented by linear flower belts and viewing platforms to weaken the depression caused by mountains, avoiding hard landscaping.
For urban-rural transition zones such as Zhongyun Town, Xucun Town, Taibai Town, Zhenzhushan Township, and Zhentou Town, where main roads near town governments have acceptable liveliness, affluence, and safety, but self-built façades are messy and peripheral suburbs and forest roads are monotonous, priority should be given to unified rectification of façade colors along market-town streets, with recommended gray-white and natural-wood color spectra. Continuous local green buffers should be created at urban-rural junctions to isolate messy hard colors; segmented hedges and fruit-tree landscaping should replace continuous blank walls on suburban roads. Waterfront towns should strictly protect the native blue water landscape and build waterfront slow-traffic walkways, while non-waterfront road sections should be planted with native colorful-leaf shrubs and small water-storage landscapes to relieve monotony and insufficient vitality using blue elements.
In addition, color-specific problems require regulation. Road sections with high red–green channel values (western Fuchun Town, eastern Qinghua Town, Sikou Town, and eastern Zheyuan Township) should preserve seasonal red farmland landscapes as visual nodes while strictly controlling artificial red hard facilities. Waterfront areas with high yellow–blue channel values should focus on maintaining cold–warm color balance. Forested low-value areas should use evergreen bases as the main tone, with warm-toned plants only at small nodes, avoiding large-scale introduction of red landscape vegetation.
For Wuyuan specifically, color indicators and perception clustering should be used to identify the advantages and disadvantages of each town, and corresponding strategies should be applied: conservation-oriented improvement in mature tourism areas, regulatory conservation in mountain ancient-village areas, and rectification-oriented renewal in urban-rural transition zones. When extended to other regions, the specific color scheme should not be copied; instead, the methodological core—quantitatively identifying problems and defining control intensity by zoning—should be extracted, combined with local materials, vegetation, and folklore to recalibrate the basic color spectrum, and a county-scale dynamic monitoring database of street color and perception should be established to guide color governance.
The linear associations among visual elements, color features, and perception scores revealed by Pearson correlation analysis are evidence-based findings reflecting statistical association patterns rather than strict causal relationships. The existing data cannot fully prove that changing specific landscape elements or colors necessarily changes perception. Planning strategy suggestions based on these association patterns are speculative recommendations whose applicability must be judged comprehensively in combination with local cultural traditions, natural base, and built-environment characteristics. If the conclusions are extended to other rural areas, localized verification and calibration are still required.
6.3. Limitations and Future Research
Using street view big data and deep learning, this study analyzed associations among rural street landscape elements, color features, and human settlement perception in Wuyuan. However, due to data and methodological constraints, several limitations should be noted when interpreting the results.
First, Baidu Street View images were collected in 2014, more than ten years ago. Since then, Wuyuan has undergone rural renewal (e.g., the 2017 three-year beautiful countryside construction action), cultural-tourism development, and infrastructure upgrading; façades, pavements, and vegetation of some streets have changed. The conclusions should therefore be understood as color-perception rules based on 2014 landscape characteristics rather than direct descriptions of the current 2026 landscape. The quantitative impact of landscape change over the past decade (e.g., renovation rate of white walls on typical residential roads and proportion of new tourism facilities) can be evaluated in future work by supplementing recent images and combining field surveys.
Due to limited annotation resources and computing conditions, this study did not evaluate segmentation accuracy based on manually annotated local images, nor did it conduct a horizontal comparison between SegFormer and SegNet under a unified benchmark. Therefore, the adoption of SegFormer in this paper is mainly based on previous studies [43,66] and its architectural adaptability to complex rural scenes, rather than on empirical model comparison in this paper.
Second, perception scores came from the generic Place Pulse 2.0 model, whose training data are mainly global crowdsourced evaluations and lack regional calibration for Huizhou-style villages. Wuyuan has a unique architectural texture and color aesthetic system, and direct application of generic models may produce cultural transfer bias. The local calibration experiment in this paper used 30 evaluation points × 200 evaluators; the calibration coefficient α = 0.7 was fixed and not tuned separately by perception dimension, and both calibration coefficient and evaluation results were calculated from local ratings of the same 30 sampling points. The improvement magnitude reflects within-sample fitting. Future work should expand the sample size (no fewer than 2000 samples per dimension) and divide independent calibration and validation sets to test the extrapolation ability of the calibration strategy. OLS calibration was evaluated using leave-one-site-out cross-validation across the 30 local sampling sites; its transferability across sites may be further tested with data from independent locations. The model-derived perceptual scores in this study are proxy estimates of perception based on street-view images. The human ratings from the 30 sampling sites serve only as references from local respondents in this study, and neither set of results equates to direct subjective assessments of the entire space by local residents.
In addition, street view data covered 27.2% of roads, and KNN-interpolated spatial distribution maps reflect macro patterns rather than measured values for every road segment.
Finally, Pearson correlation only measures linear relationships and cannot reveal causal paths or nonlinear interactions (e.g., whether the perceptual effect of vegetation area has a threshold effect); shooting season and illumination conditions may also systematically bias color indicator extraction.
Future research can proceed along two paths. On the one hand, priority should be given to constructing standardized fine-grained manual annotation datasets and systematically reproducing and comparing mainstream models such as SegFormer and SegNet under unified experimental environments and evaluation metrics, so as to provide more complete empirical support for this field. On the other hand, recent street view images should be used to update samples, local perception annotation should be expanded, calibration and validation mechanisms should be improved, and panel data or quasi-experimental designs should be introduced to test the causal direction between elements and perception.
7. Conclusions
Color is a fundamental element of rural visual experience, and the color combinations of rural streets produce differentiated psychological feelings. Previous rural landscape research has rarely combined region-wide street view big data to quantitatively analyze the intrinsic association among color, landscape elements, and human settlement perception. To address the shortcoming that existing methods are difficult to adapt to rural scenes with high vegetation and mountainous terrain, this study constructs the SVCP-R analysis framework and completes the entire quantitative measurement workflow using the non-central urban streets of Wuyuan County, Jiangxi, as the empirical object. The study first extracts imagery based on Baidu Street View, completes multidimensional color indicator computation with SegFormer and K-means, then outputs six types of perception scores through a fine-tuned ViT-B/16 model, and finally uses Pearson correlation analysis to clarify the patterns by which color features act on subjective perception.
The results show that core indicators such as color complexity, color harmony, lightness, and hue channels are highly correlated with the visual perception of rural residents. The green and blue tones brought by mountain forests and water are significantly positively correlated with positive perceptions such as beauty and safety; Warm yellow tones dominated by Huizhou-style vernacular dwellings are associated with higher vitality scores, yet extensive light-coloured facades increase overall brightness and correlate with boredom ratings. In terms of landscape elements, road segments with a high green view ratio feature rich colour hierarchies and are linked to lower levels of oppression and boredom. The building proportion is positively correlated with vitality scores and negatively correlated with aesthetic scores. Observed by township, tourism areas such as Qinghua, Sikou, and Jiangwan have higher color harmony and complexity and a better overall visual experience; the mountain-forest road sections of Dazhangshan and Tuochuan townships have an excellent natural base but a single business format, and street liveliness scores are generally low. The mountain-and-water interlaced areas in the north-central part of the county have richer color layering, and their comprehensive perception is better than that of the purely township areas in the south.
This study used the SVCP-R framework to quantitatively analyze associations between county-scale rural street color characteristics and human settlement visual perception. Balancing the proportion of natural and artificial colors and enhancing the color harmony of streetscapes may be correlated with alleviating negative perceptions such as dullness and oppression, which offers implications for improving the quality of rural street spaces. These findings offer a new quantitative idea for Huizhou-style rural landscape control and refined street color planning. Future research can further explore the dynamic influence of seasonal vegetation changes on rural color perception, examine spatial experience differences under multi-sensory synergy such as sound and smell [81], and propose differentiated street landscape optimization plans according to current color differentiation among towns.
Author Contributions
Conceptualization, L.Z. and Y.S.; methodology, L.Z. and C.P.; software, L.Z. and C.P.; validation, L.Z. and C.P.; formal analysis, L.Z. and Y.S.; investigation, L.Z.; resources, L.Z. and J.P.; data curation, Y.S.; writing—original draft preparation, L.Z.; writing—review and editing, L.Z.; visualization, L.Z. and C.P.; supervision, J.P.; project administration, L.Z. and J.P.; funding acquisition, L.Z. All authors have read and agreed to the published version of the manuscript.
Funding
This research received no external funding.
Institutional Review Board Statement
The study was conducted in accordance with the Declaration of Helsinki, and the protocol was approved by the Academic Integrity and Research Ethics Committee of China University of Geosciences (The approval document contains no code) on 11 May 2026.
Informed Consent Statement
Informed consent was obtained from all participants involved in the study before they viewed the questionnaire and signed the consent form.
Data Availability Statement
The data presented in this study are available on request from the corresponding author.
Conflicts of Interest
The authors declare no conflicts of interest.
Abbreviations
The following abbreviations are used in this manuscript:
| SVCP-R | Streetscape visual-color-perception framework for rural areas |
| BSVI | Baidu street view images |
| DCSV | Dominant color set vector |
Appendix A
Respondent Composition, Data Collection Procedure, and Questionnaire Content
Valid participants were aged 20–45 years (mean = 32.5, standard deviation = 7.5); 57.5% were male and 42.5% female; 71.0% had bachelor’s degrees or above; and 67.5% came from Jiangxi Province and neighboring provinces. The survey was administered through an online questionnaire platform. Each participant browsed all 30 images in random order and rated six dimensions—safety, liveliness, aesthetic attractiveness, affluence, boredom, and oppression—on a 5-point Likert scale (1 = very low, 5 = very high). Boredom and oppression were negative dimensions, with higher scores indicating stronger negative perception. Before formal scoring, participants read standardized instructions with dimension examples and completed two practice images not included in the analysis to confirm understanding. A single response took approximately 15–20 min.
Table A1.
KNN supplementary experiment: RMSE of each indicator.
Table A2.
KNN supplementary experiment: R2 of each indicator.
Table A3.
Partial correlation recheck.
Figure A1.
Wuyuan Rural Streetscape Perception Rating Questionnaire (Q1–Q30).
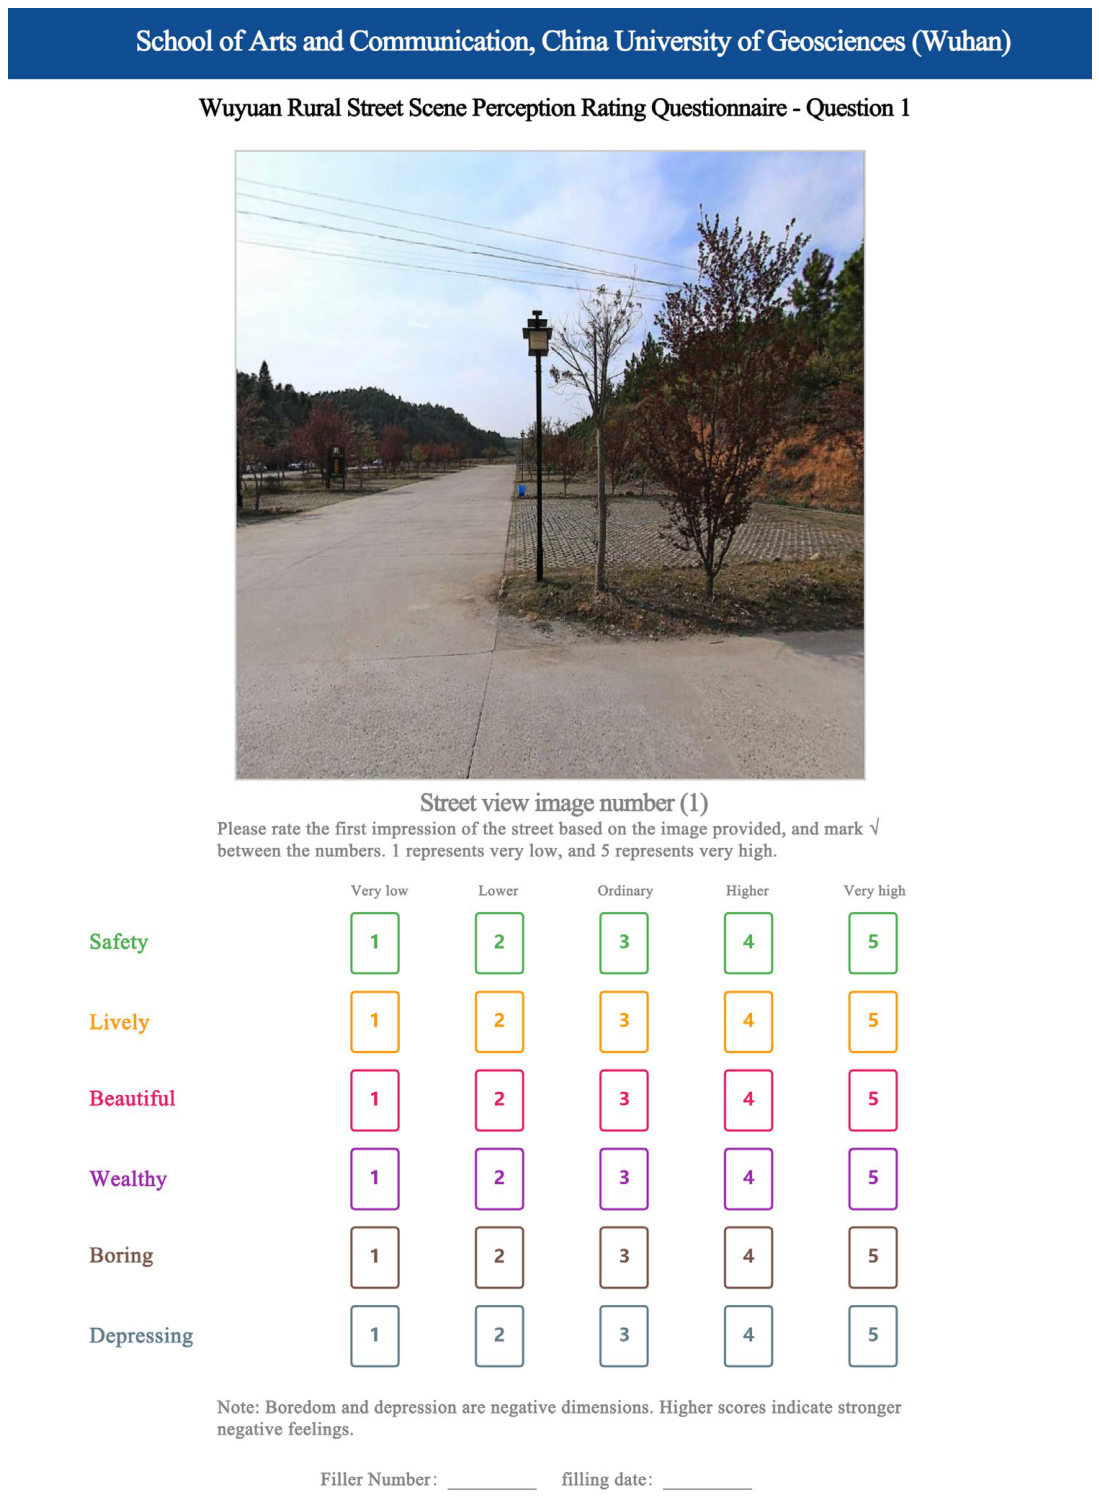
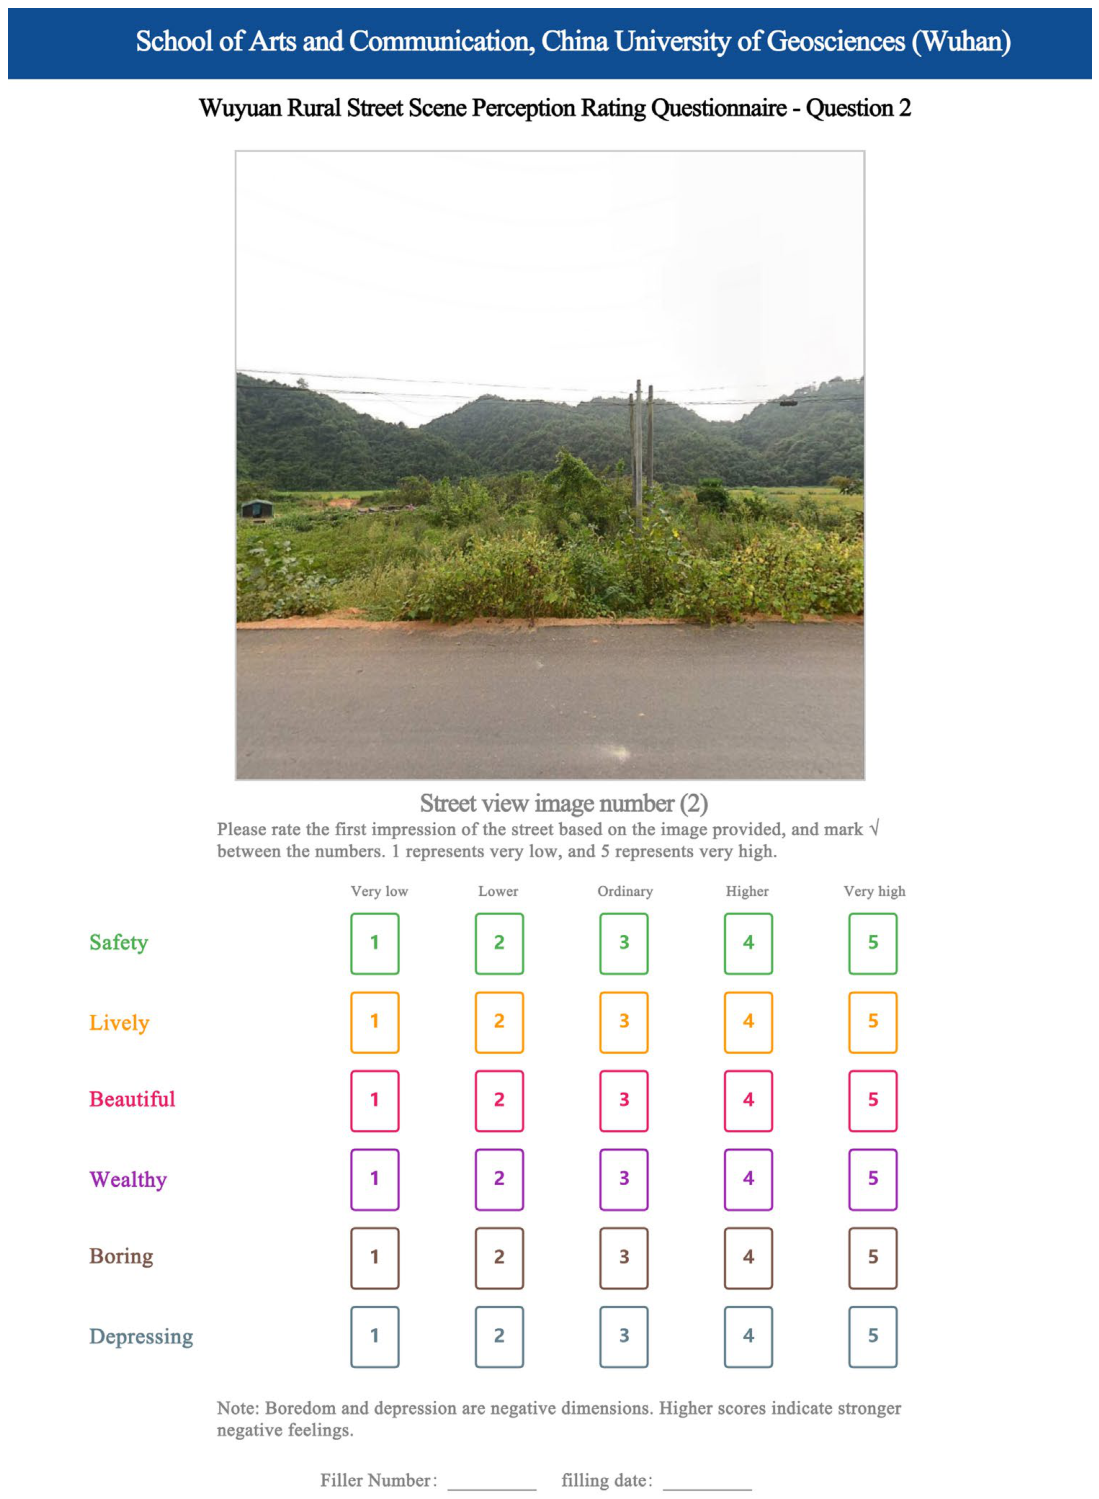
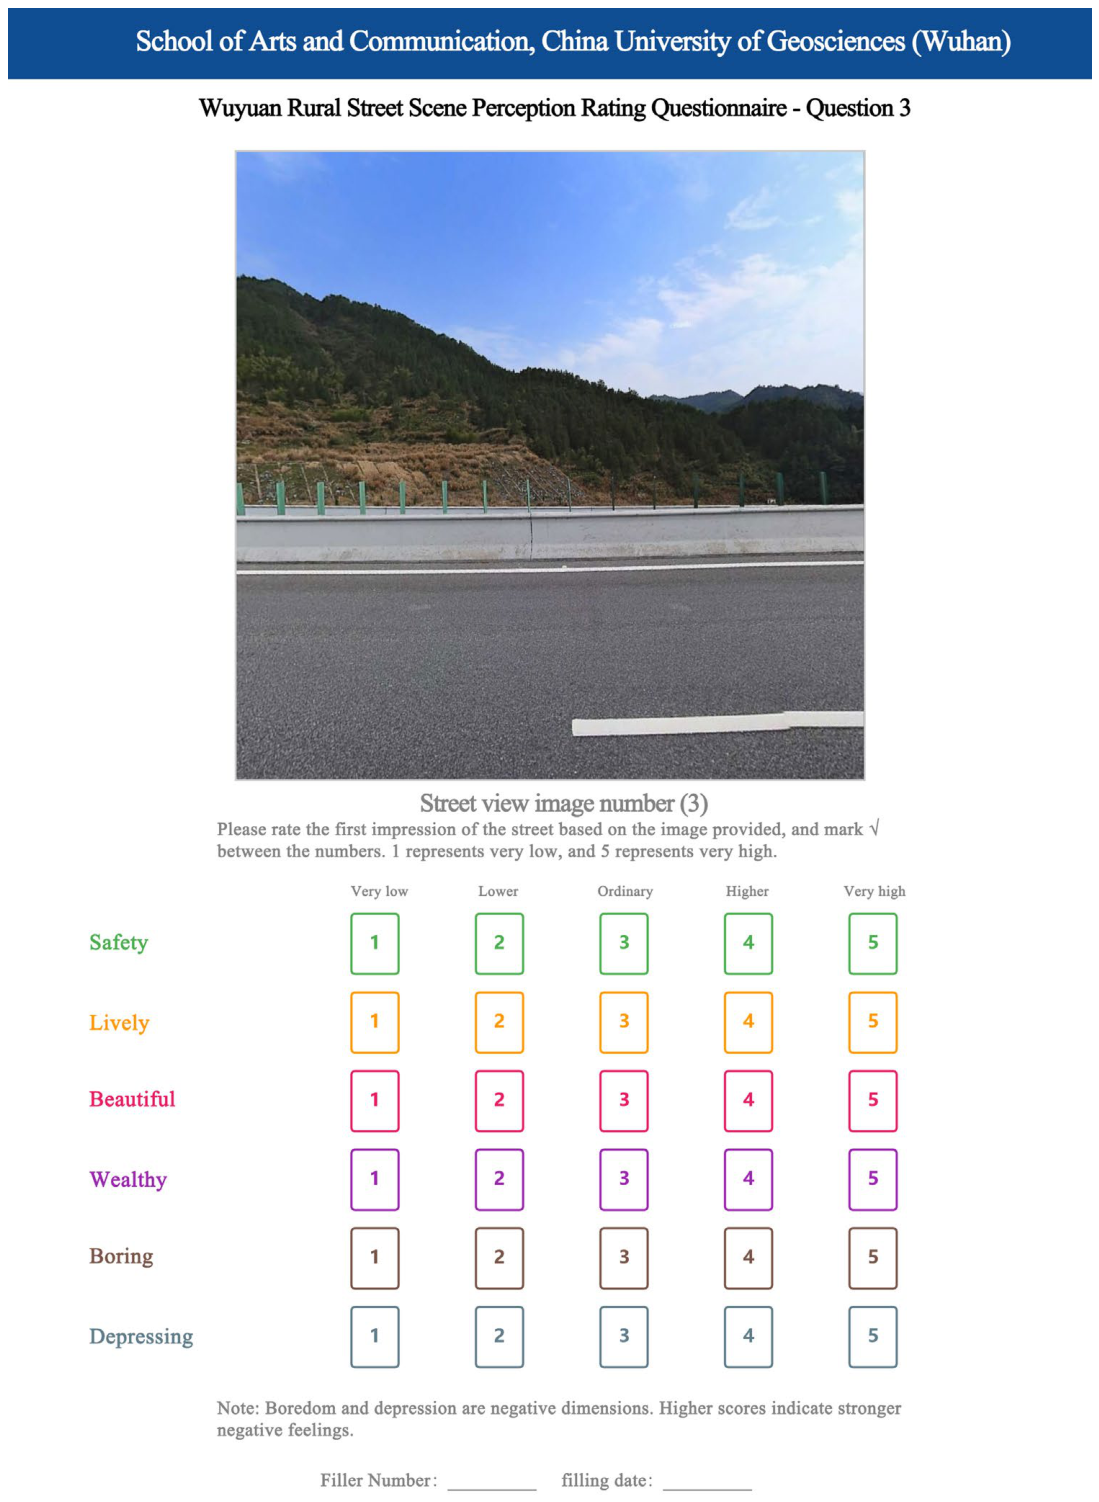
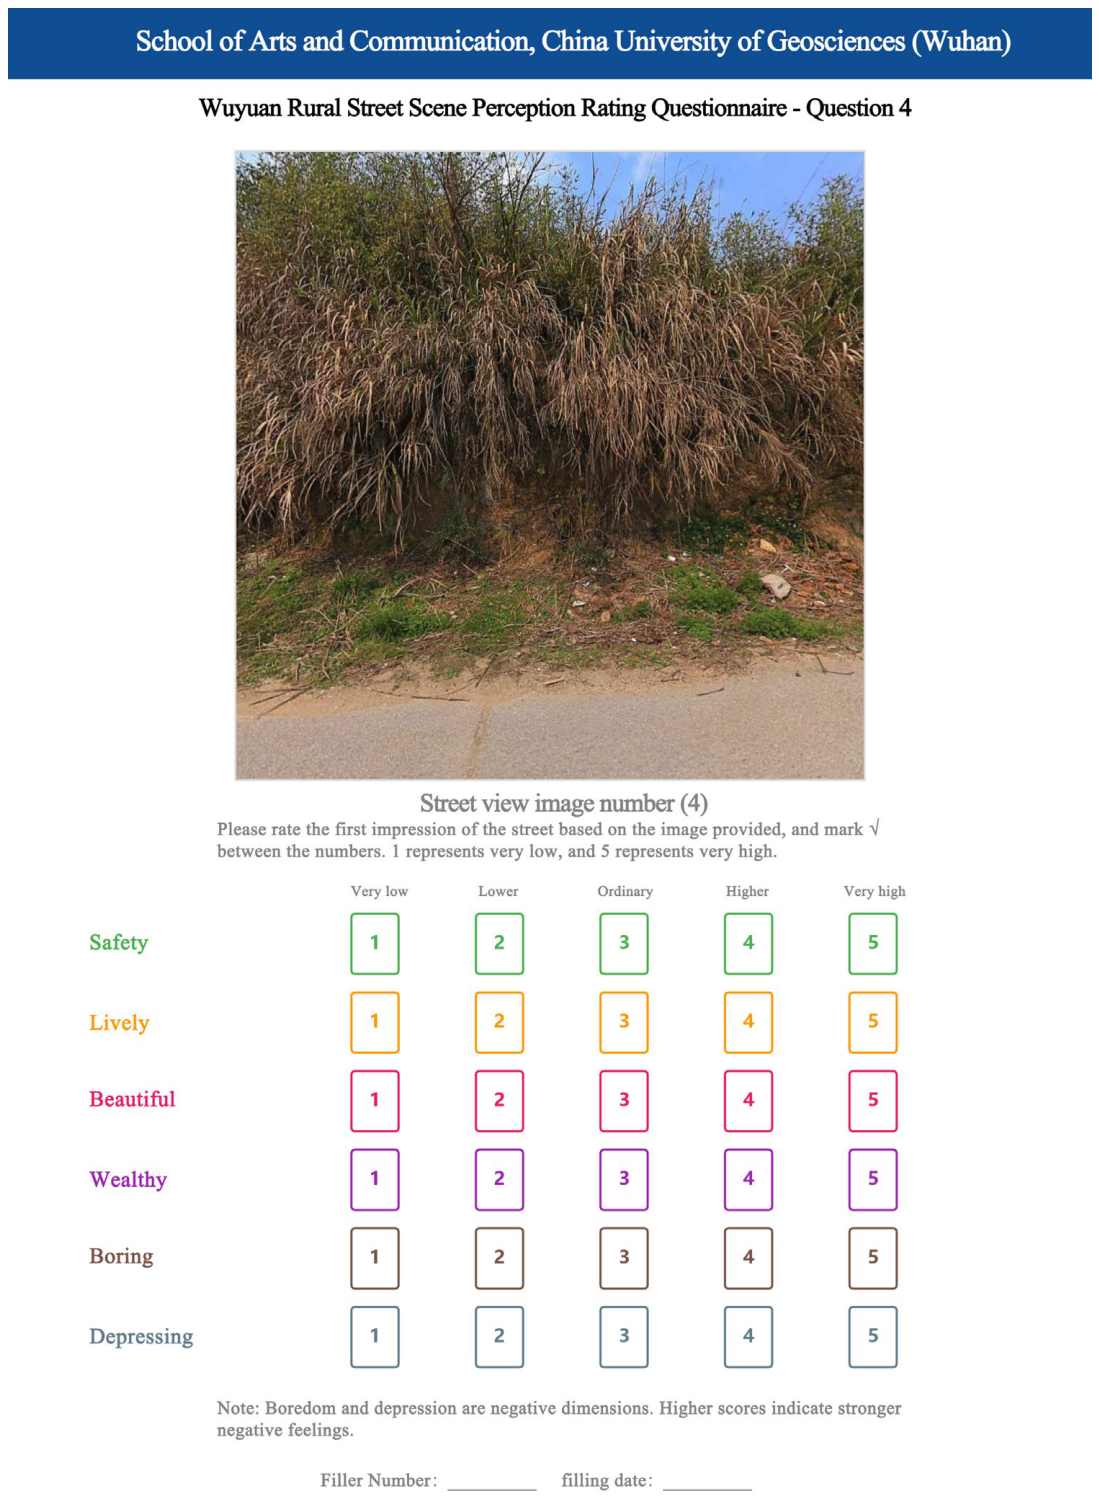
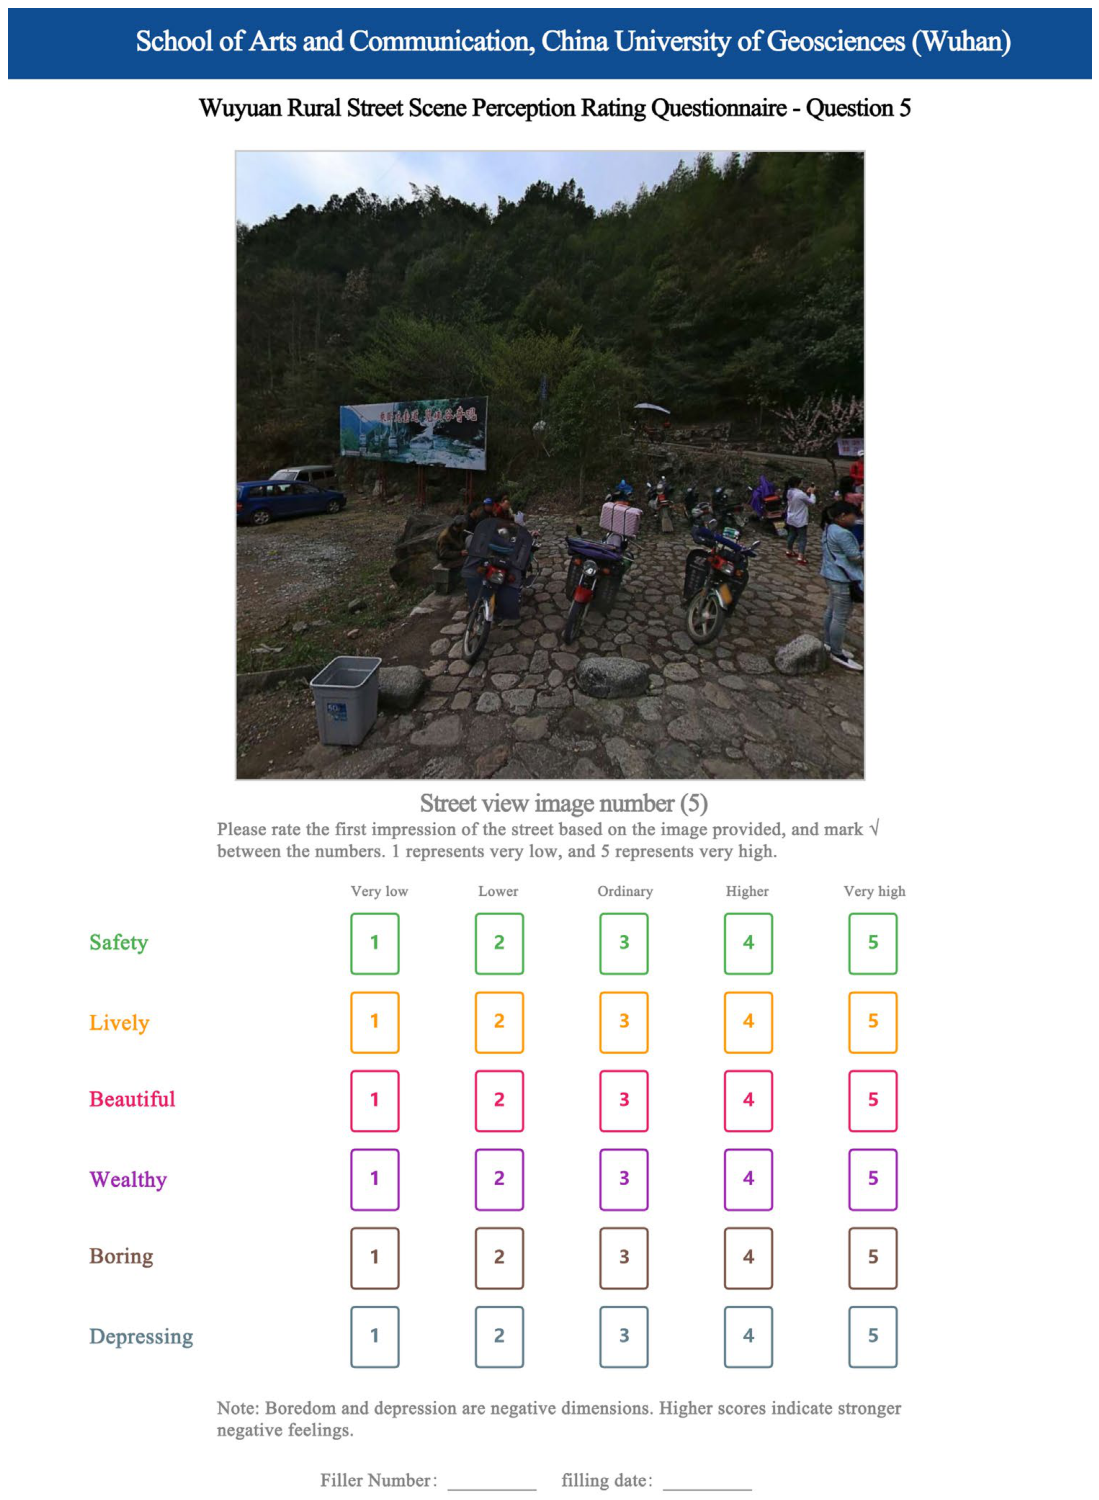
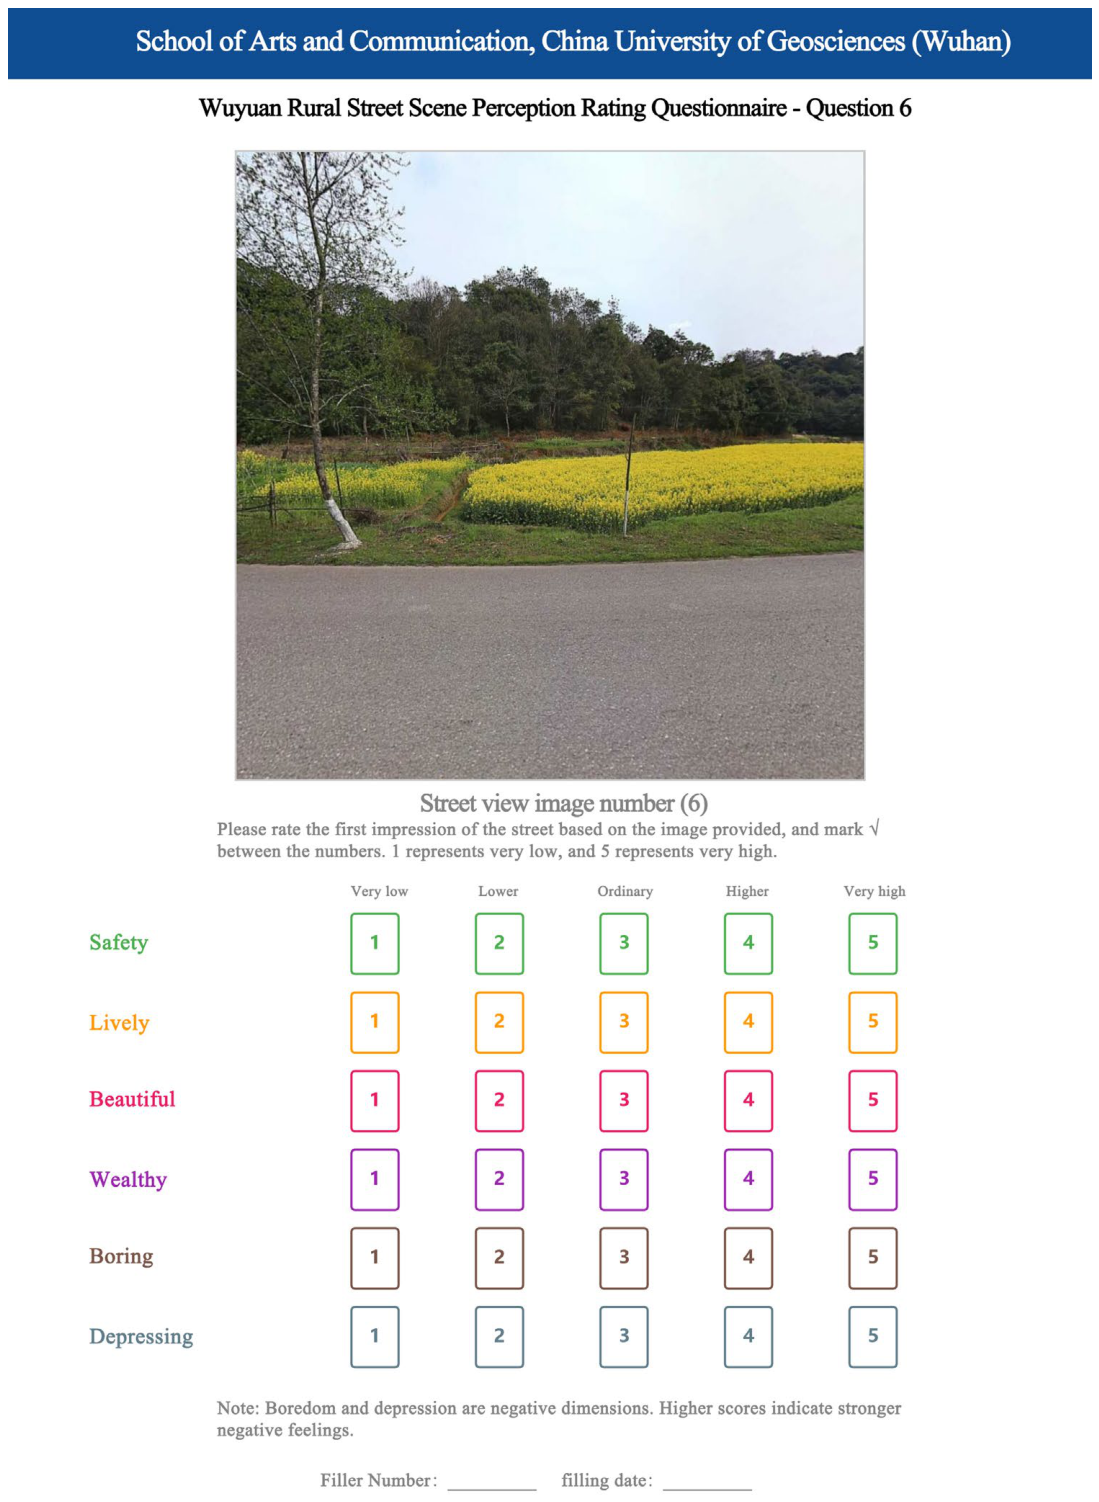
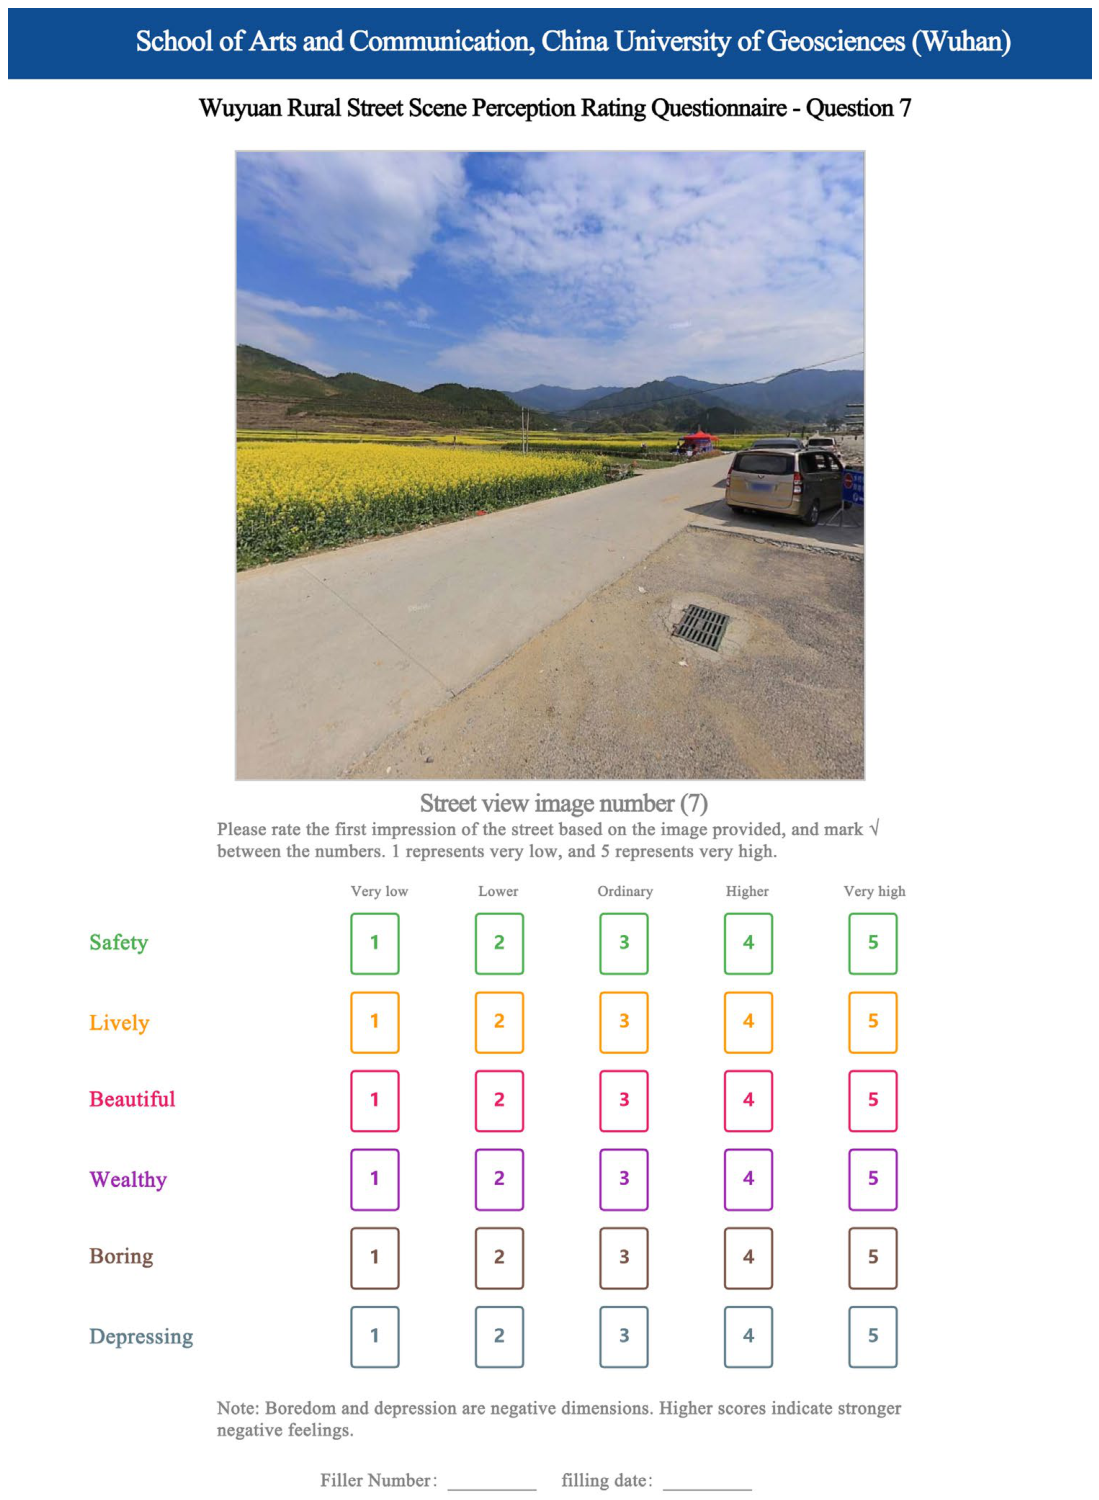
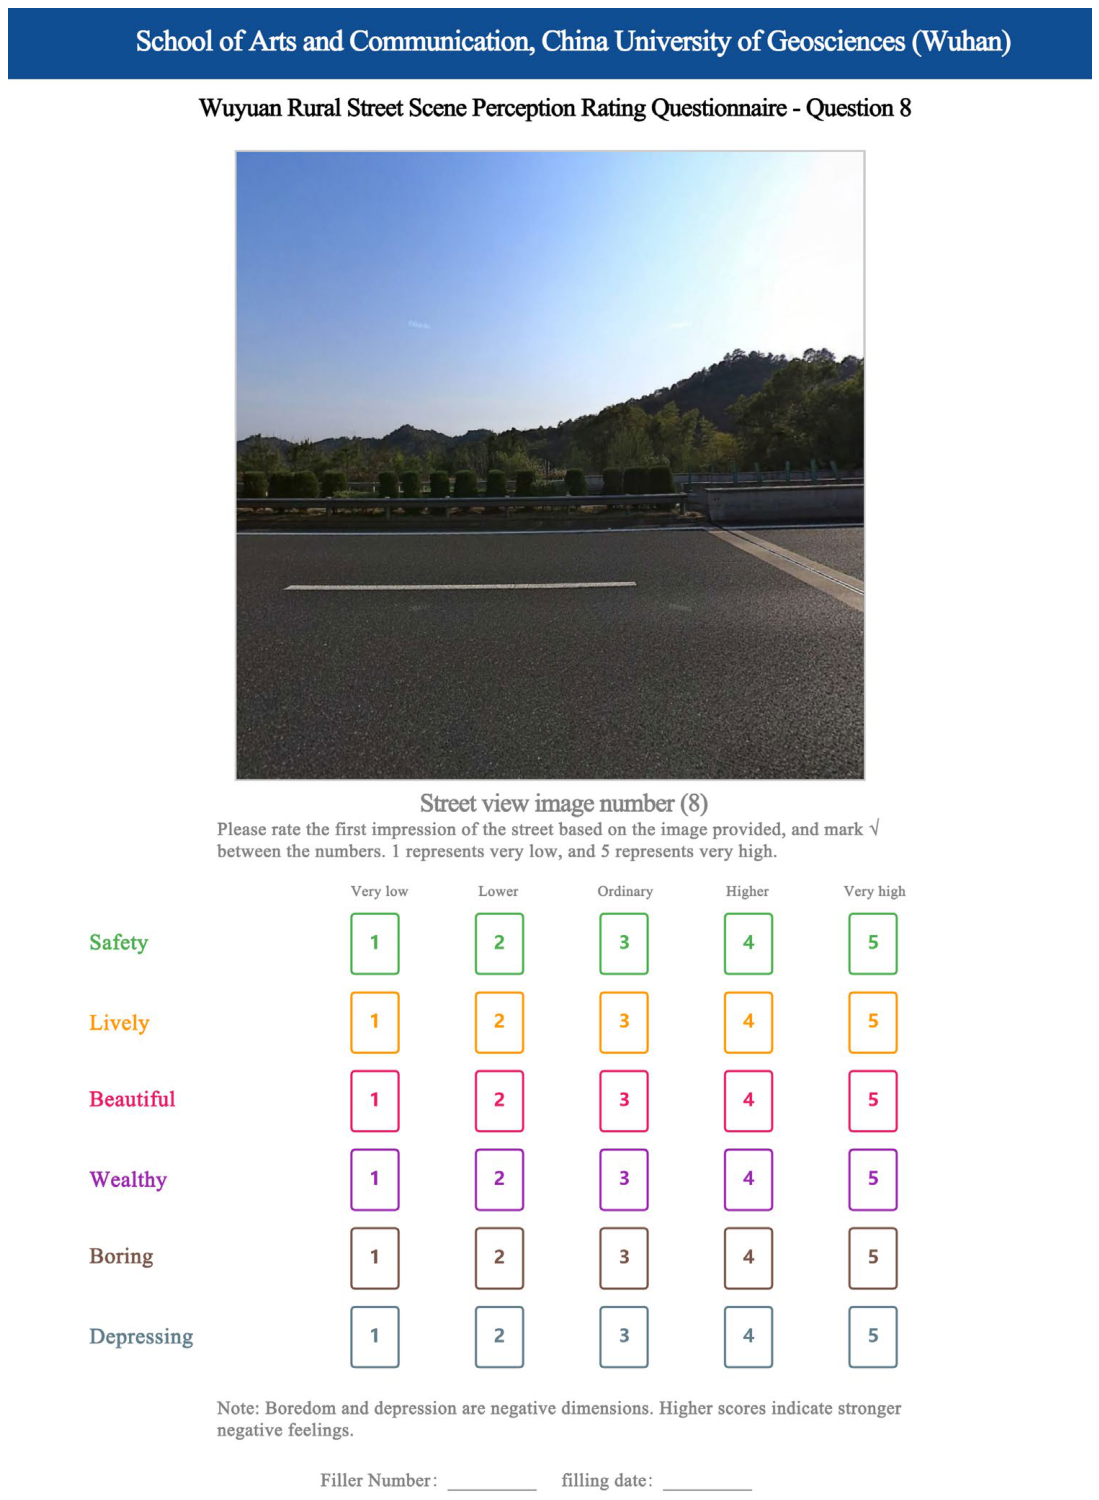
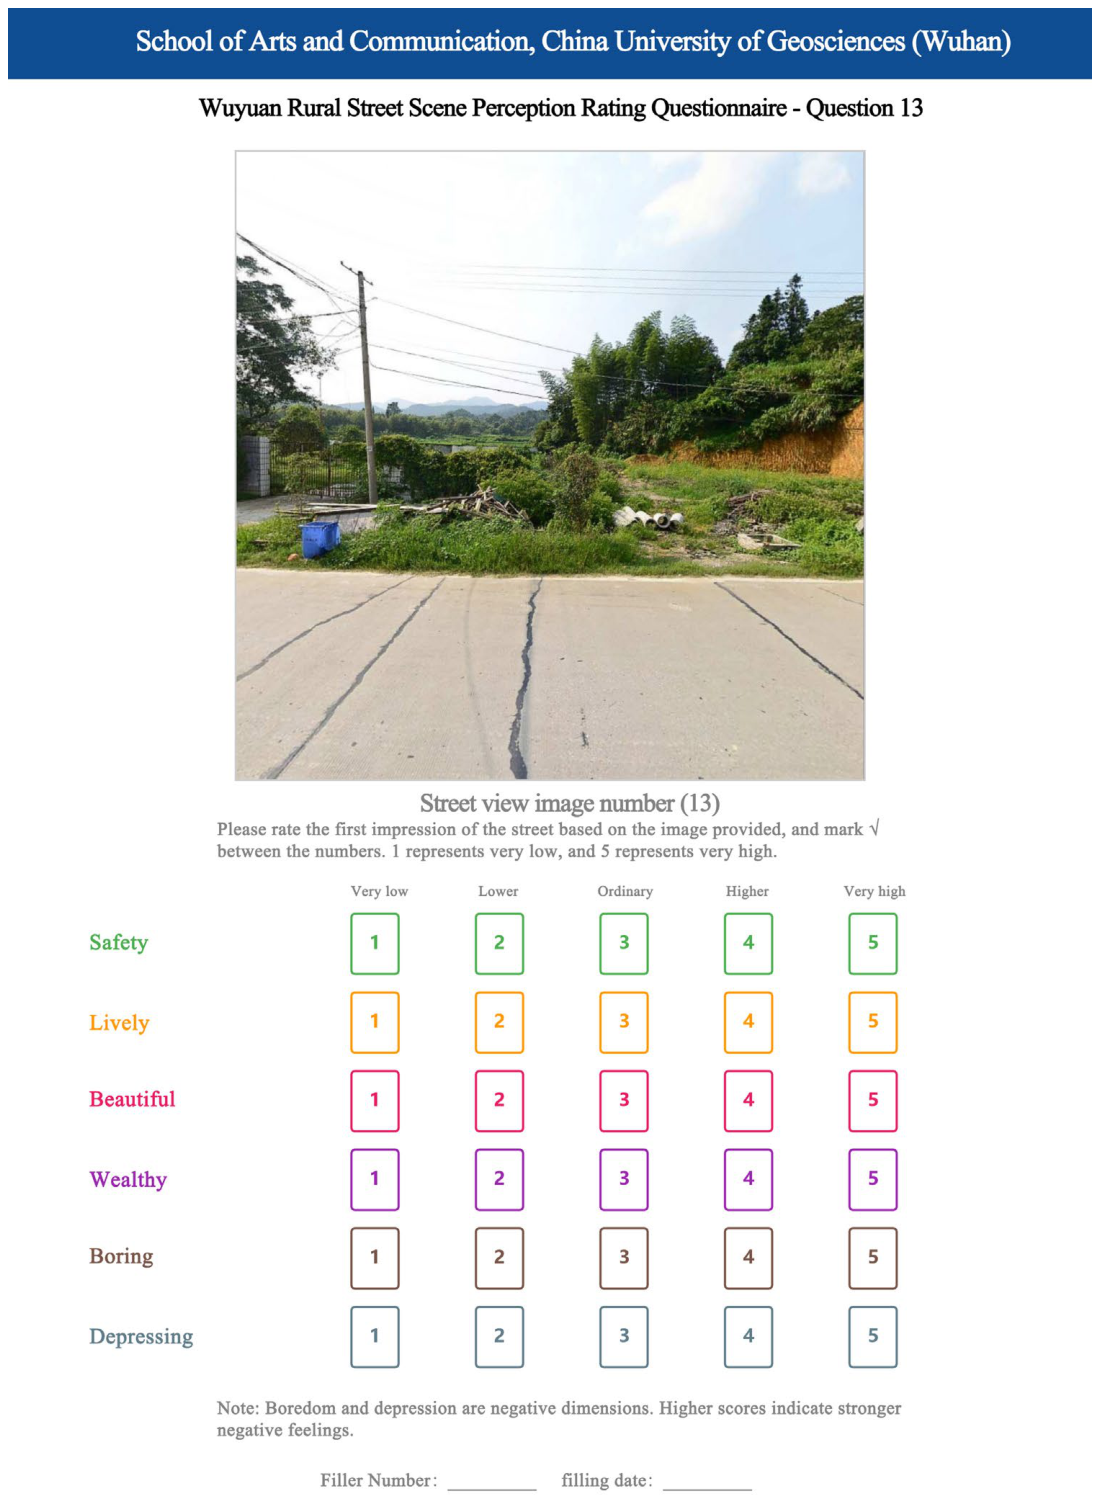
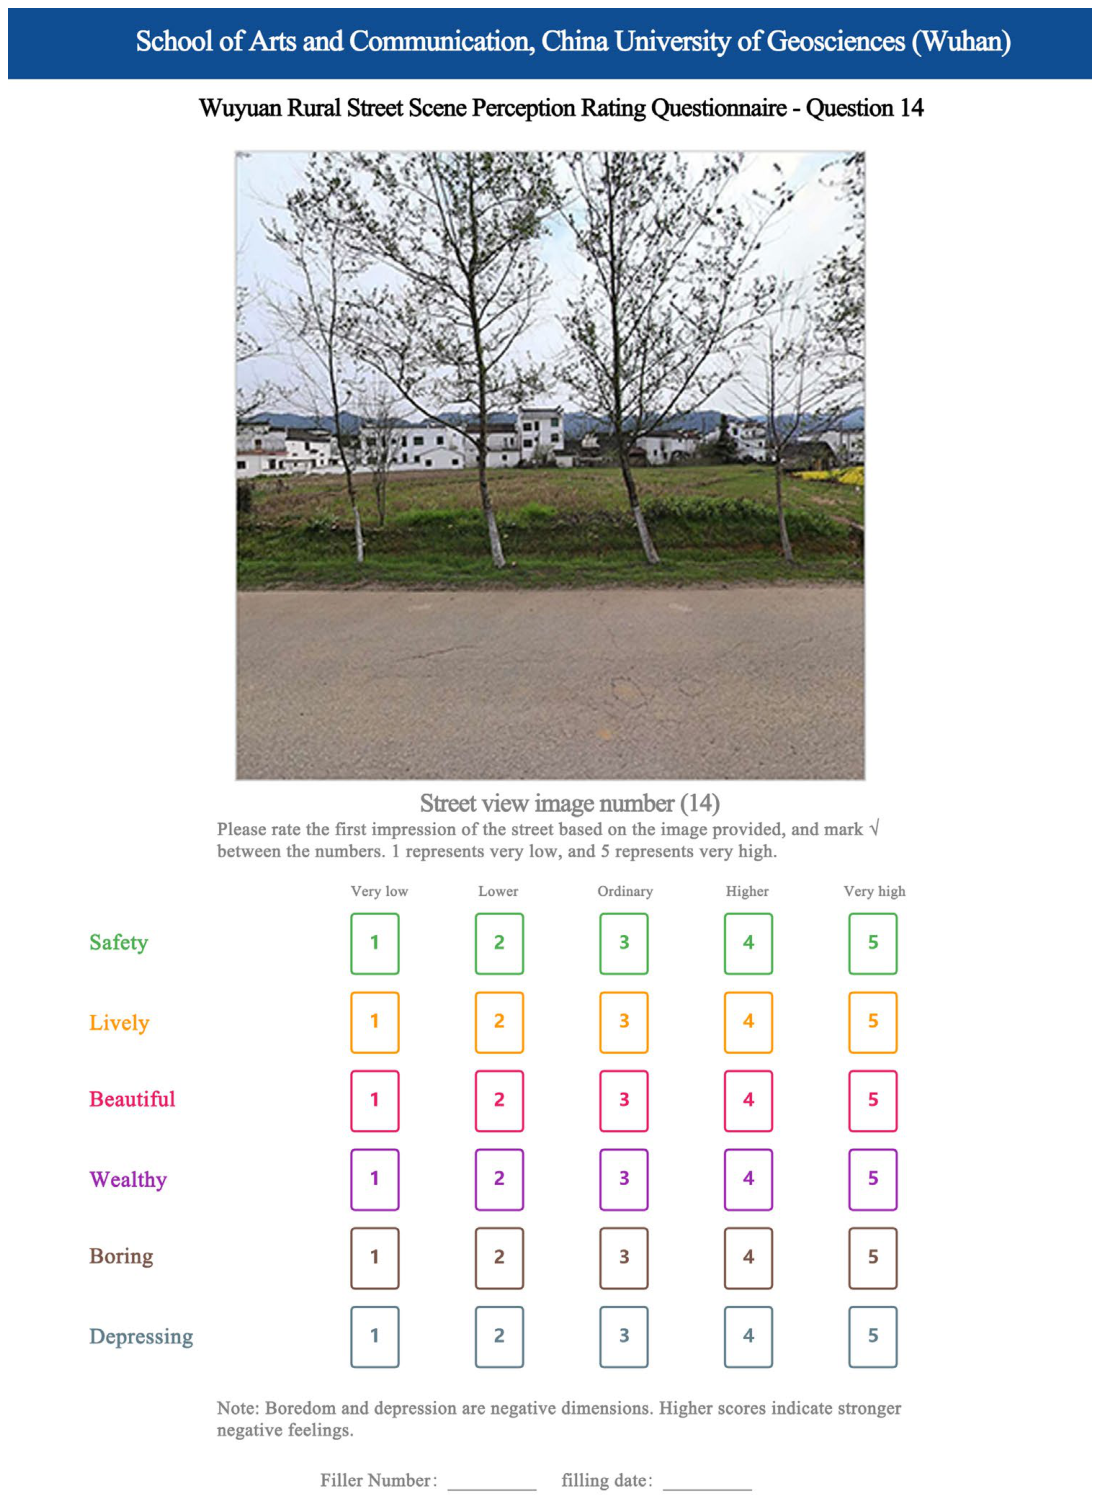
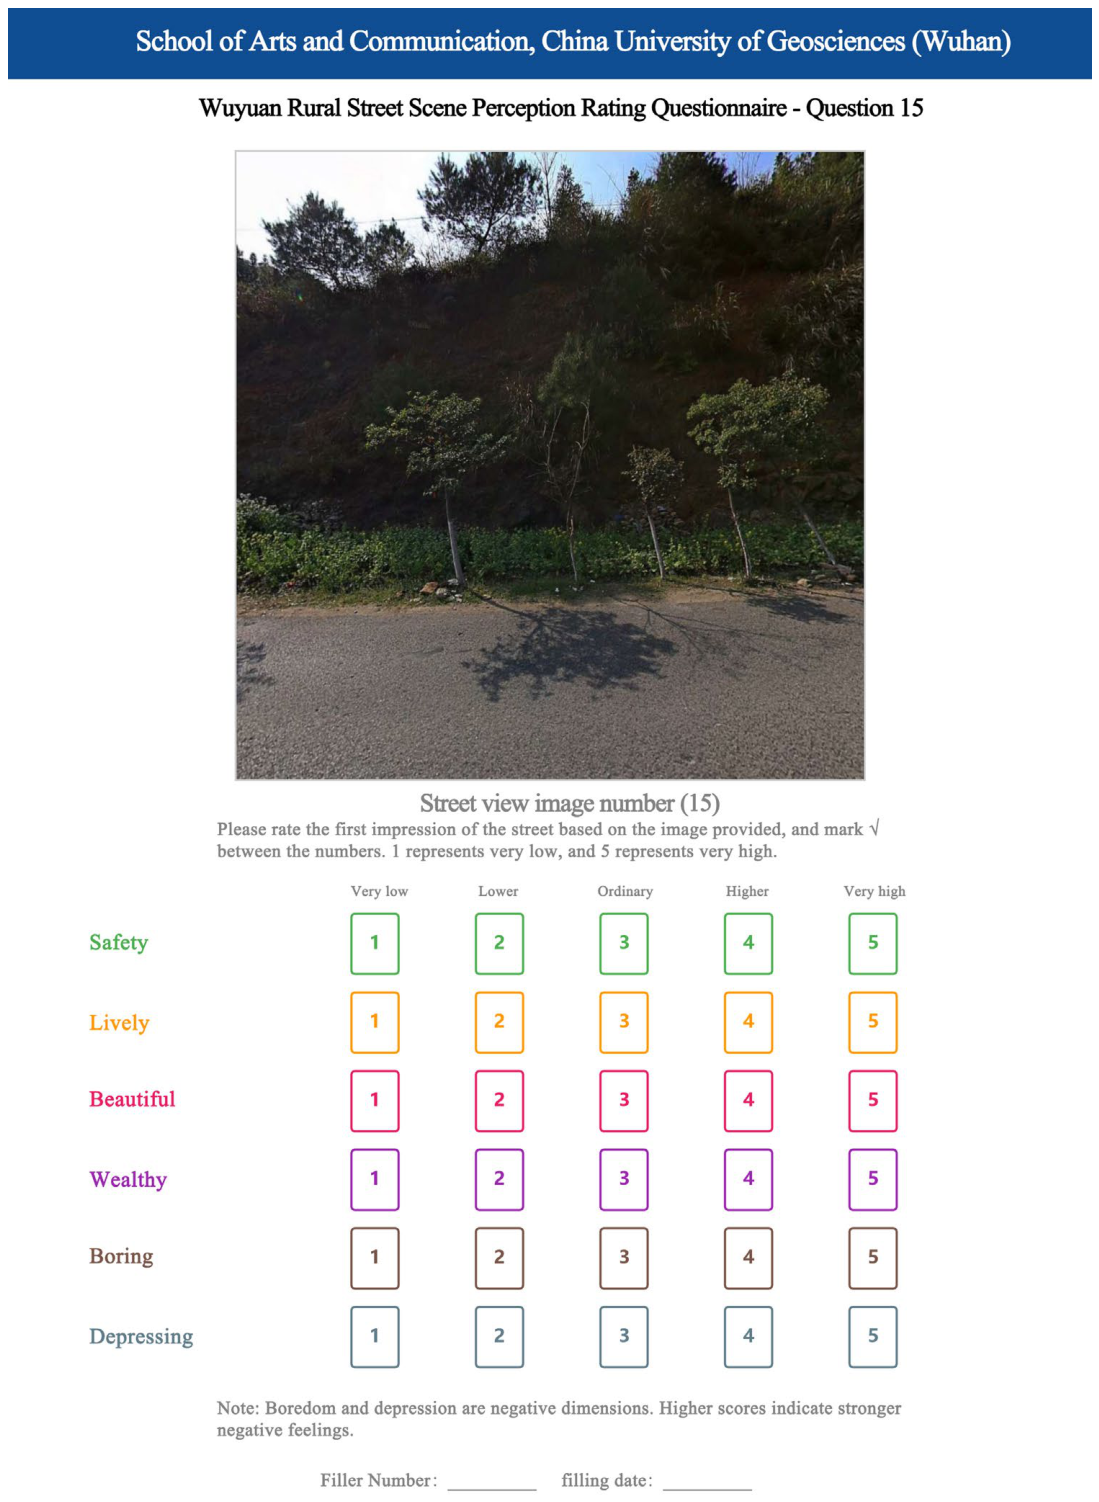
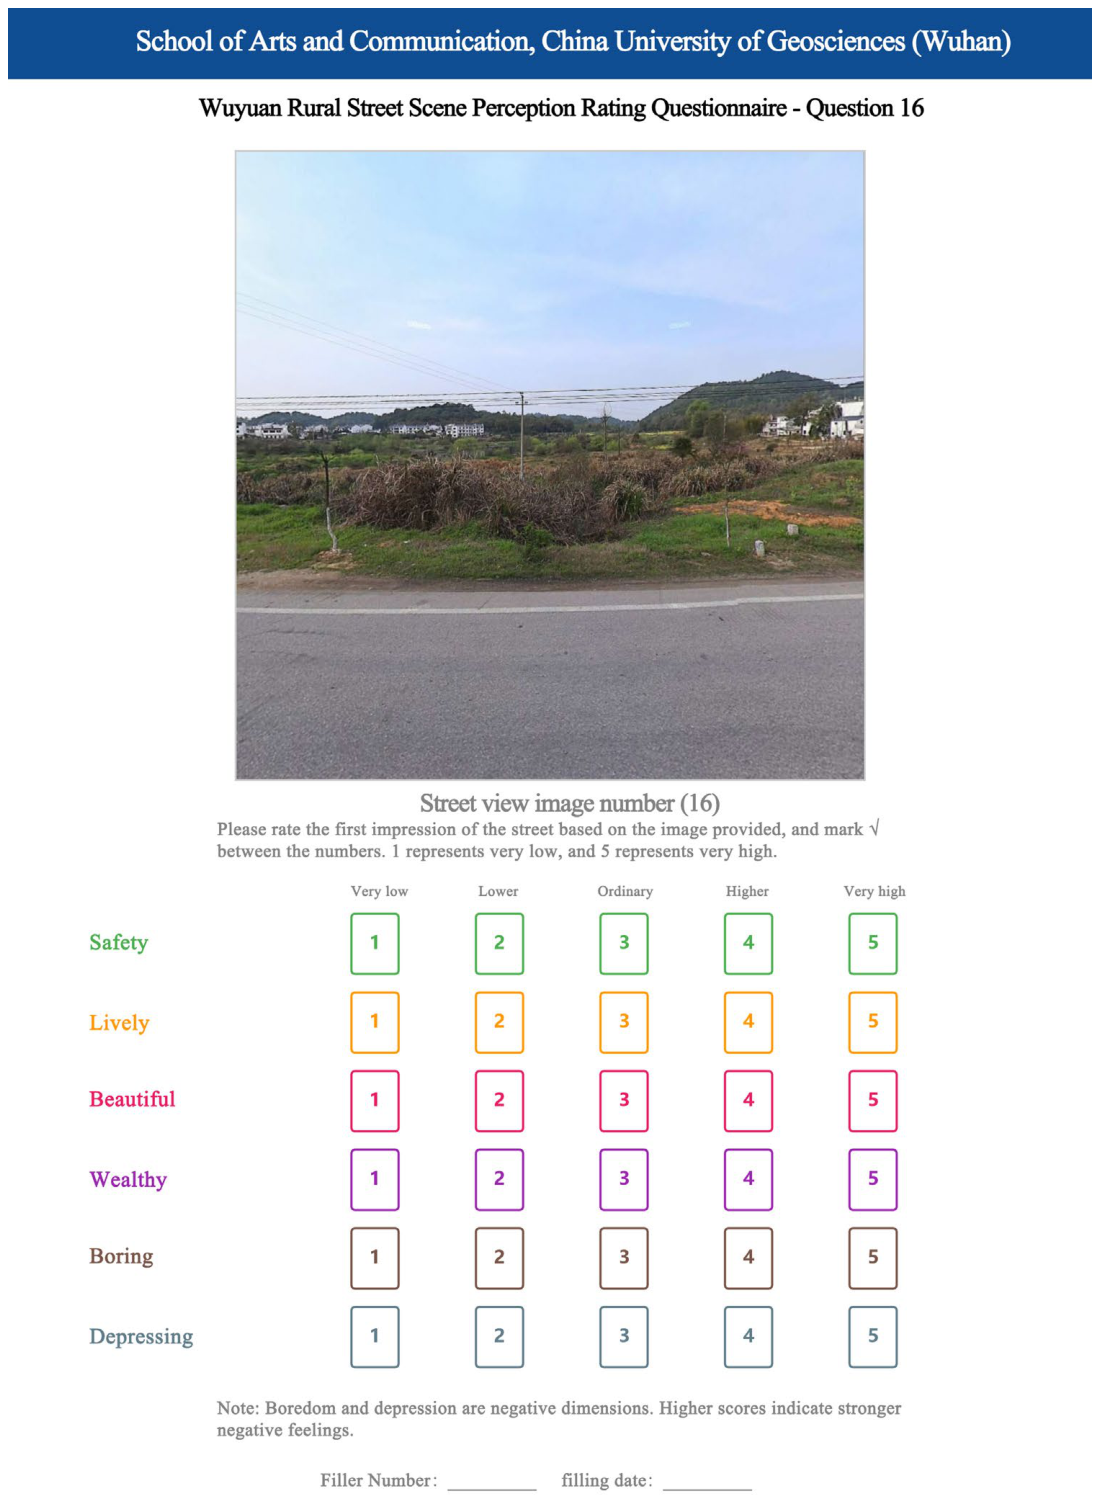
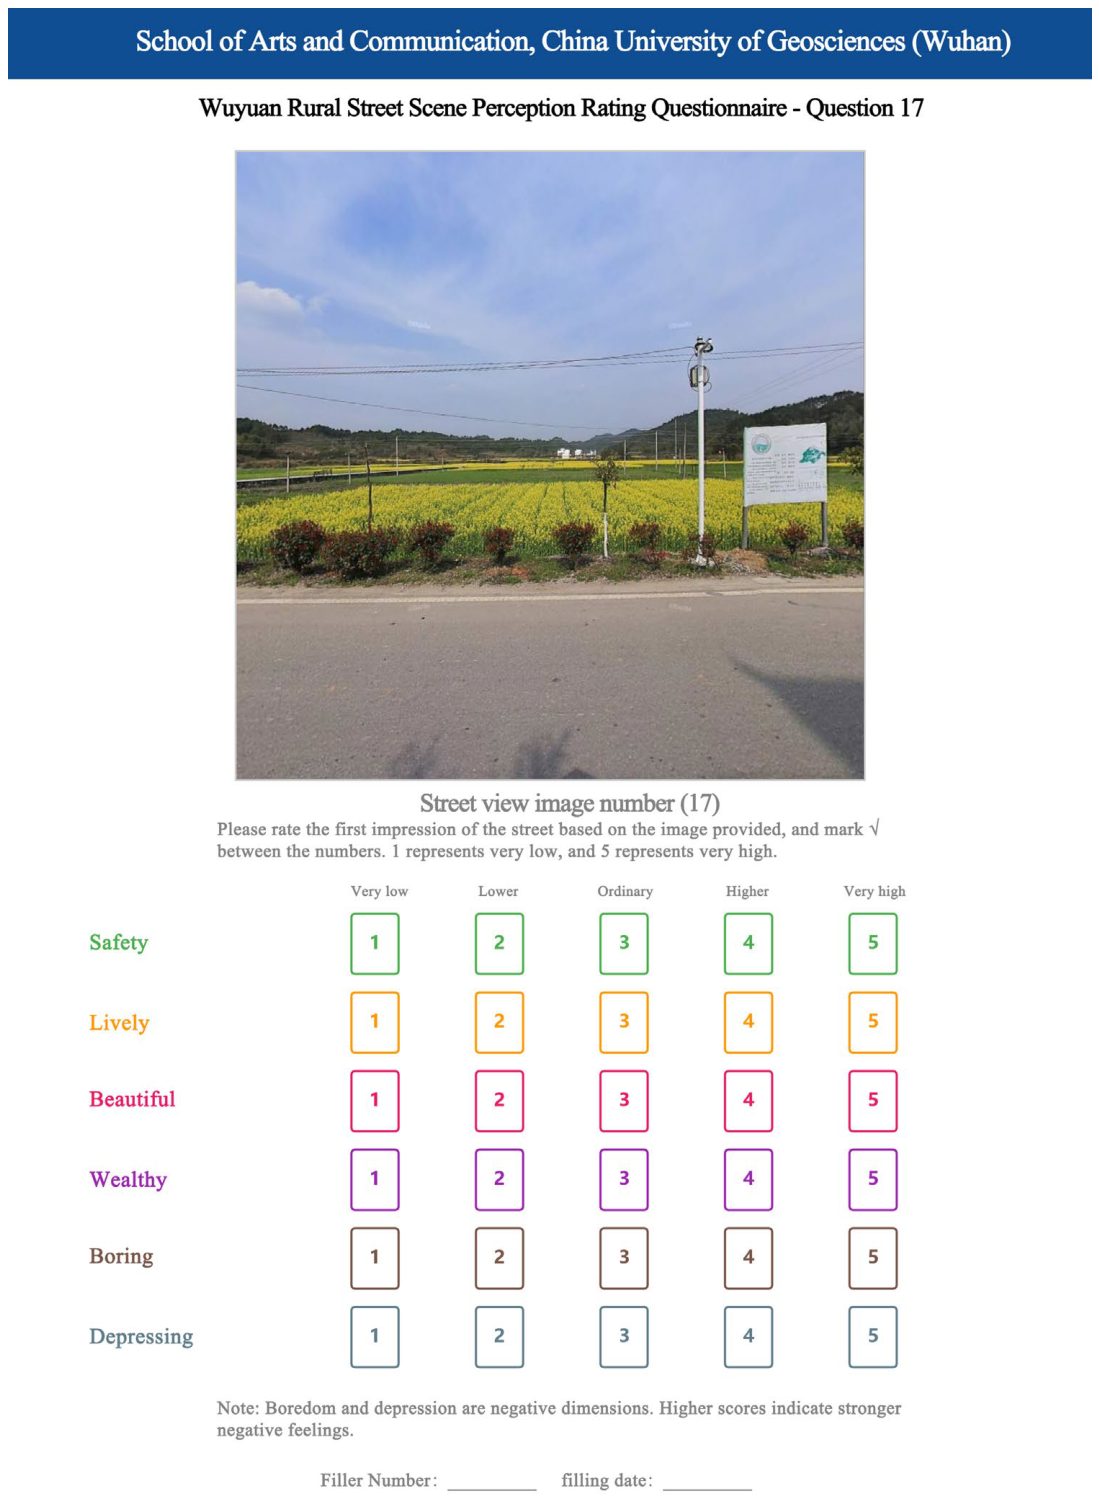
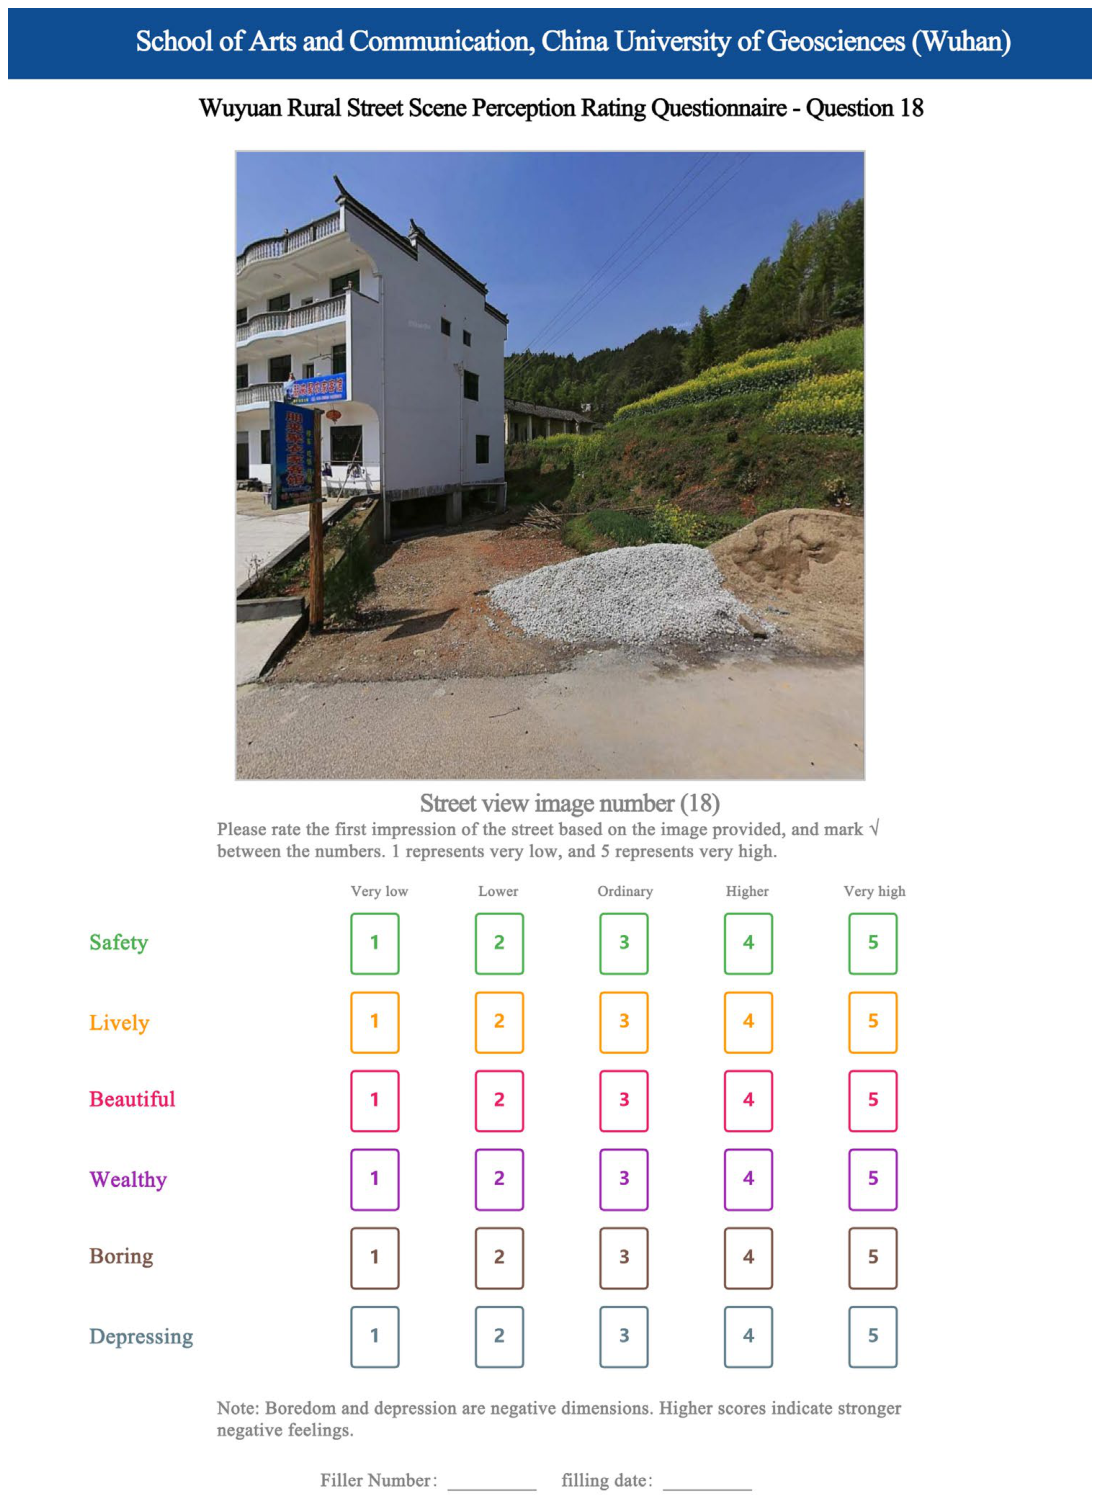
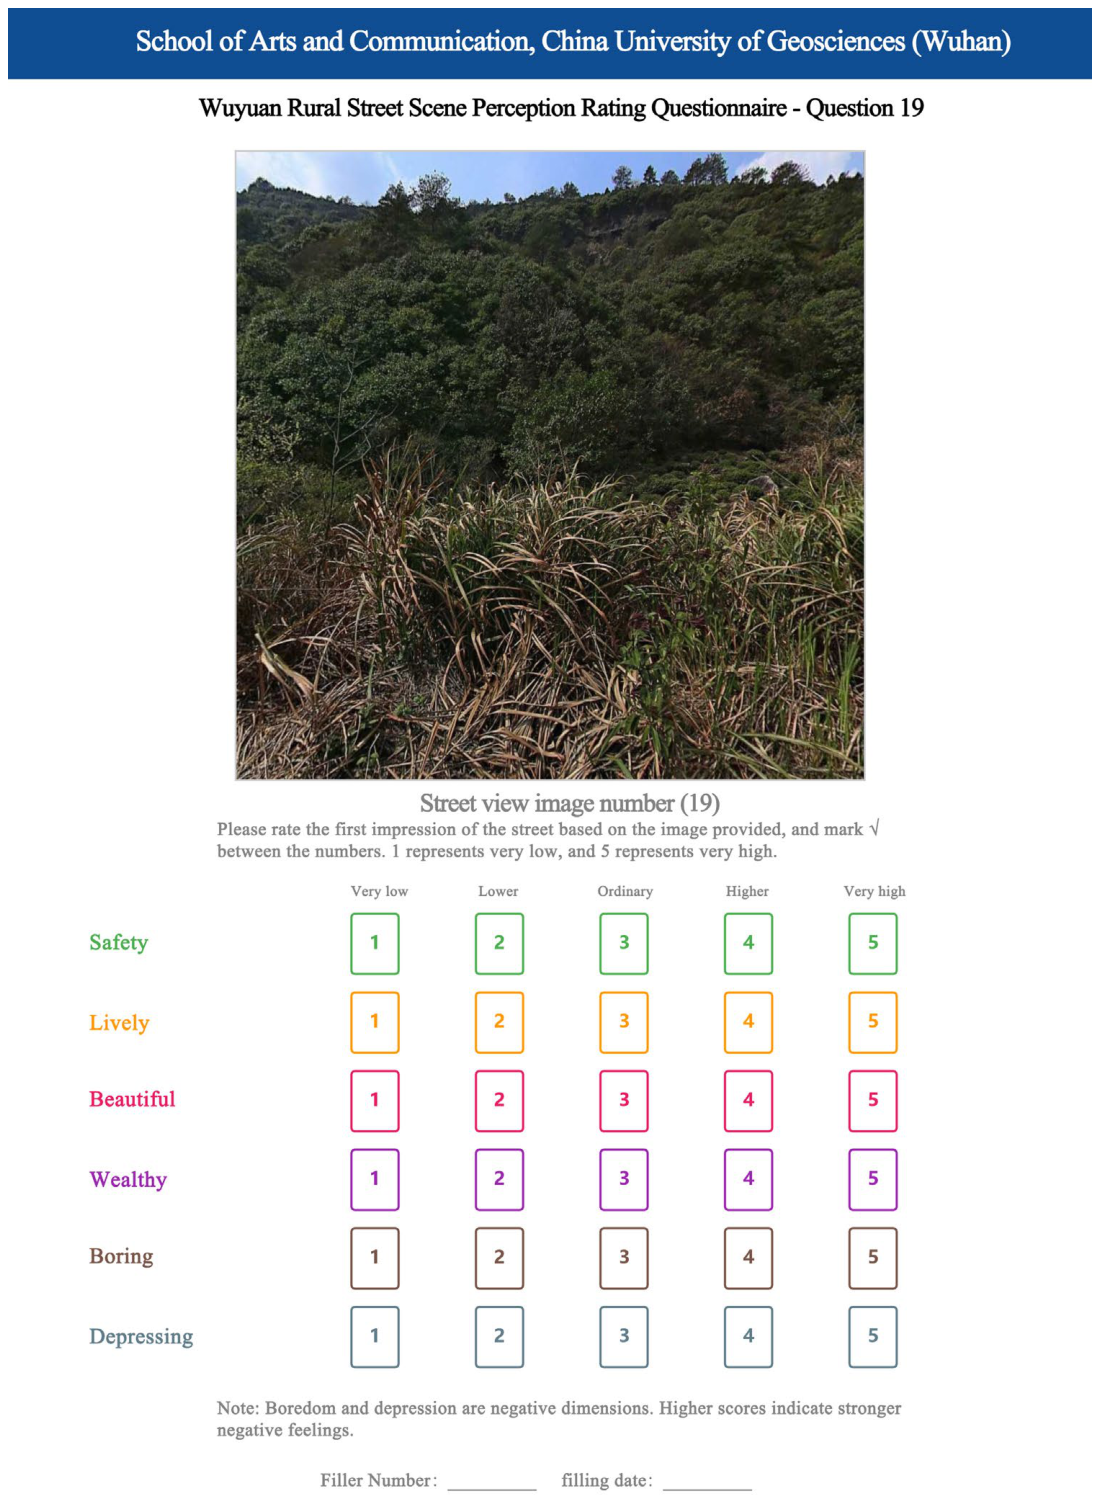
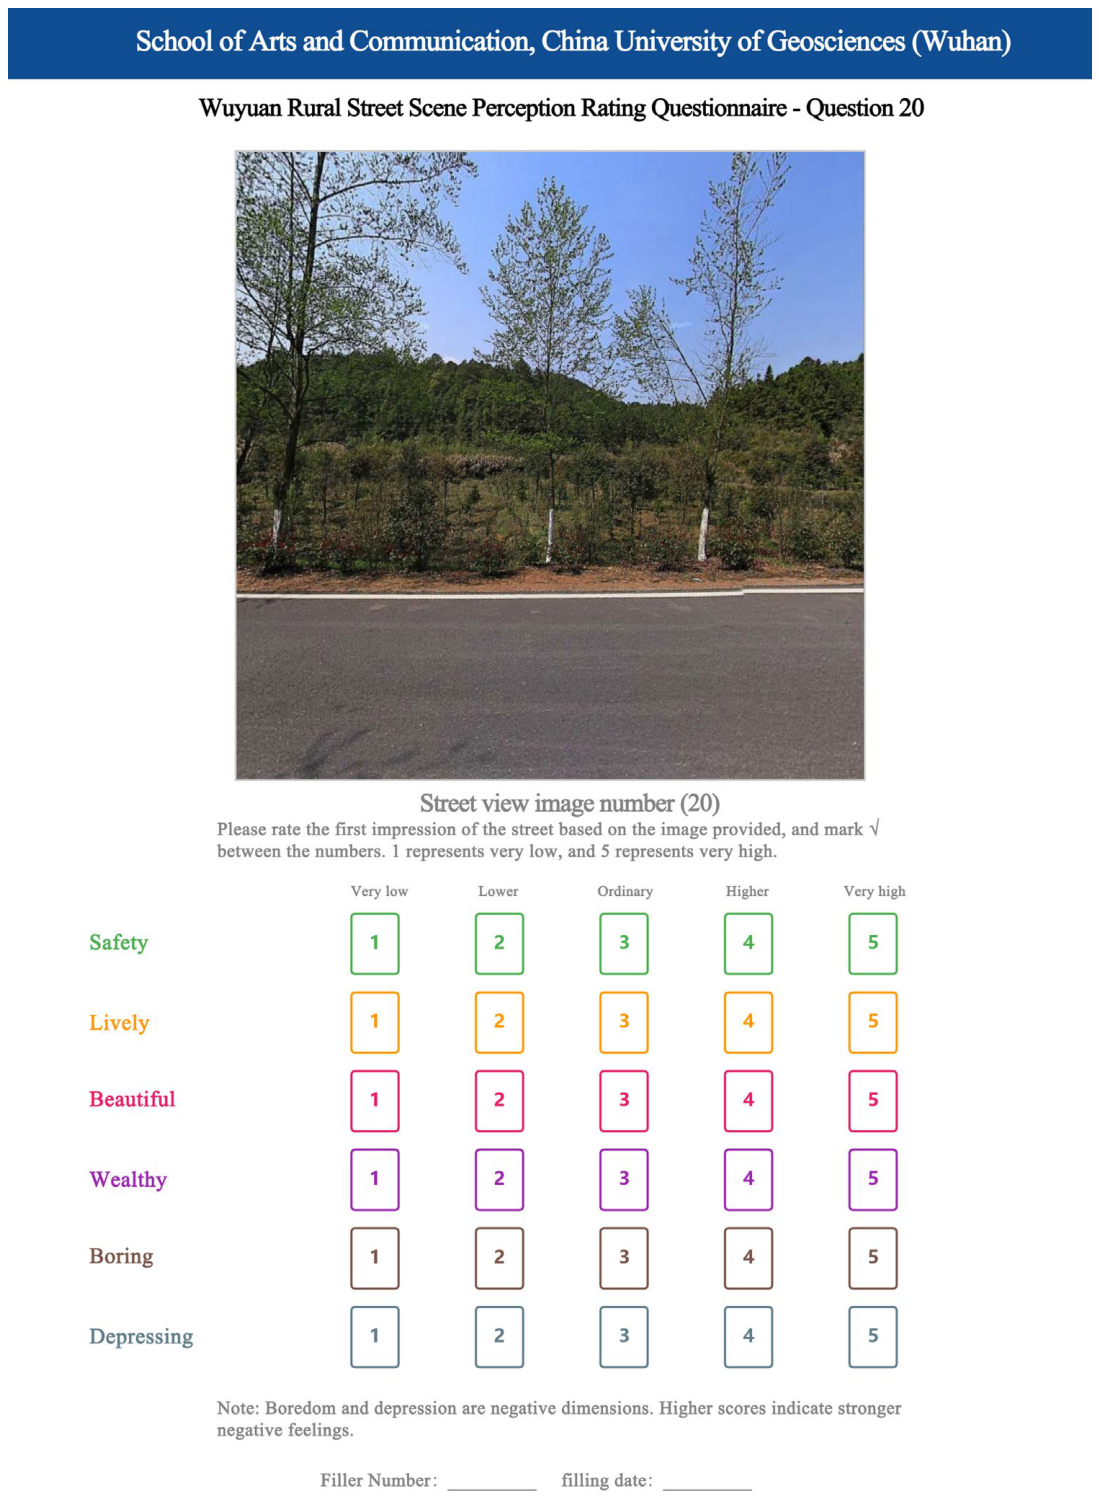
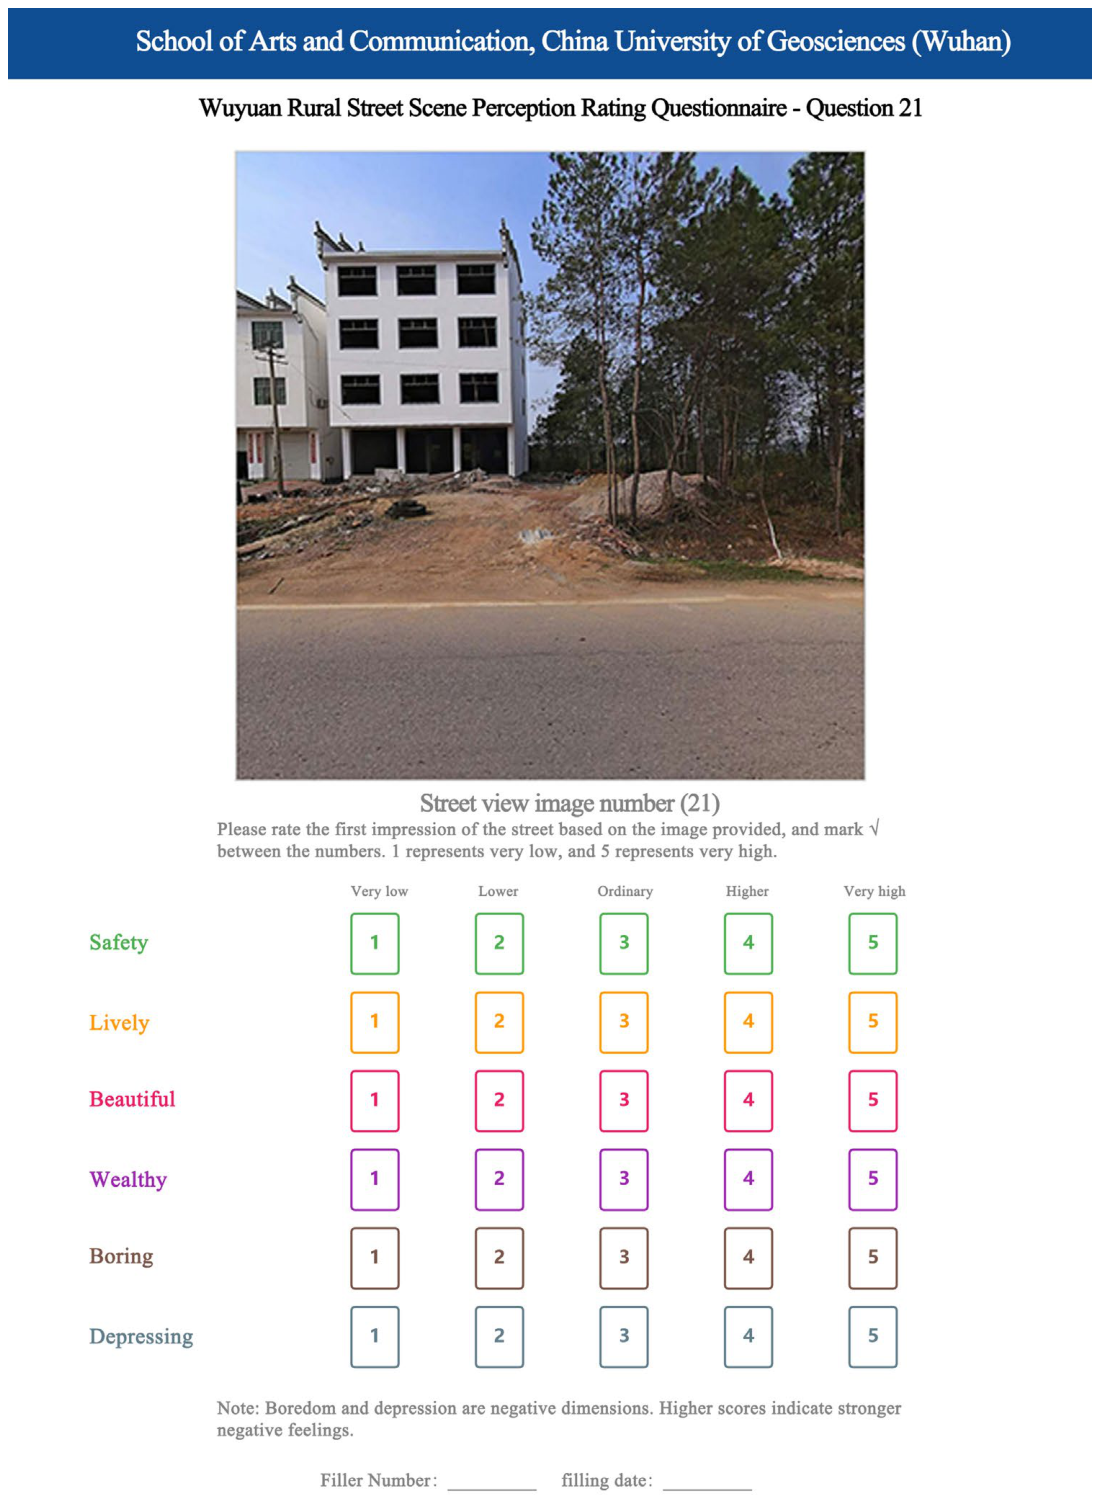
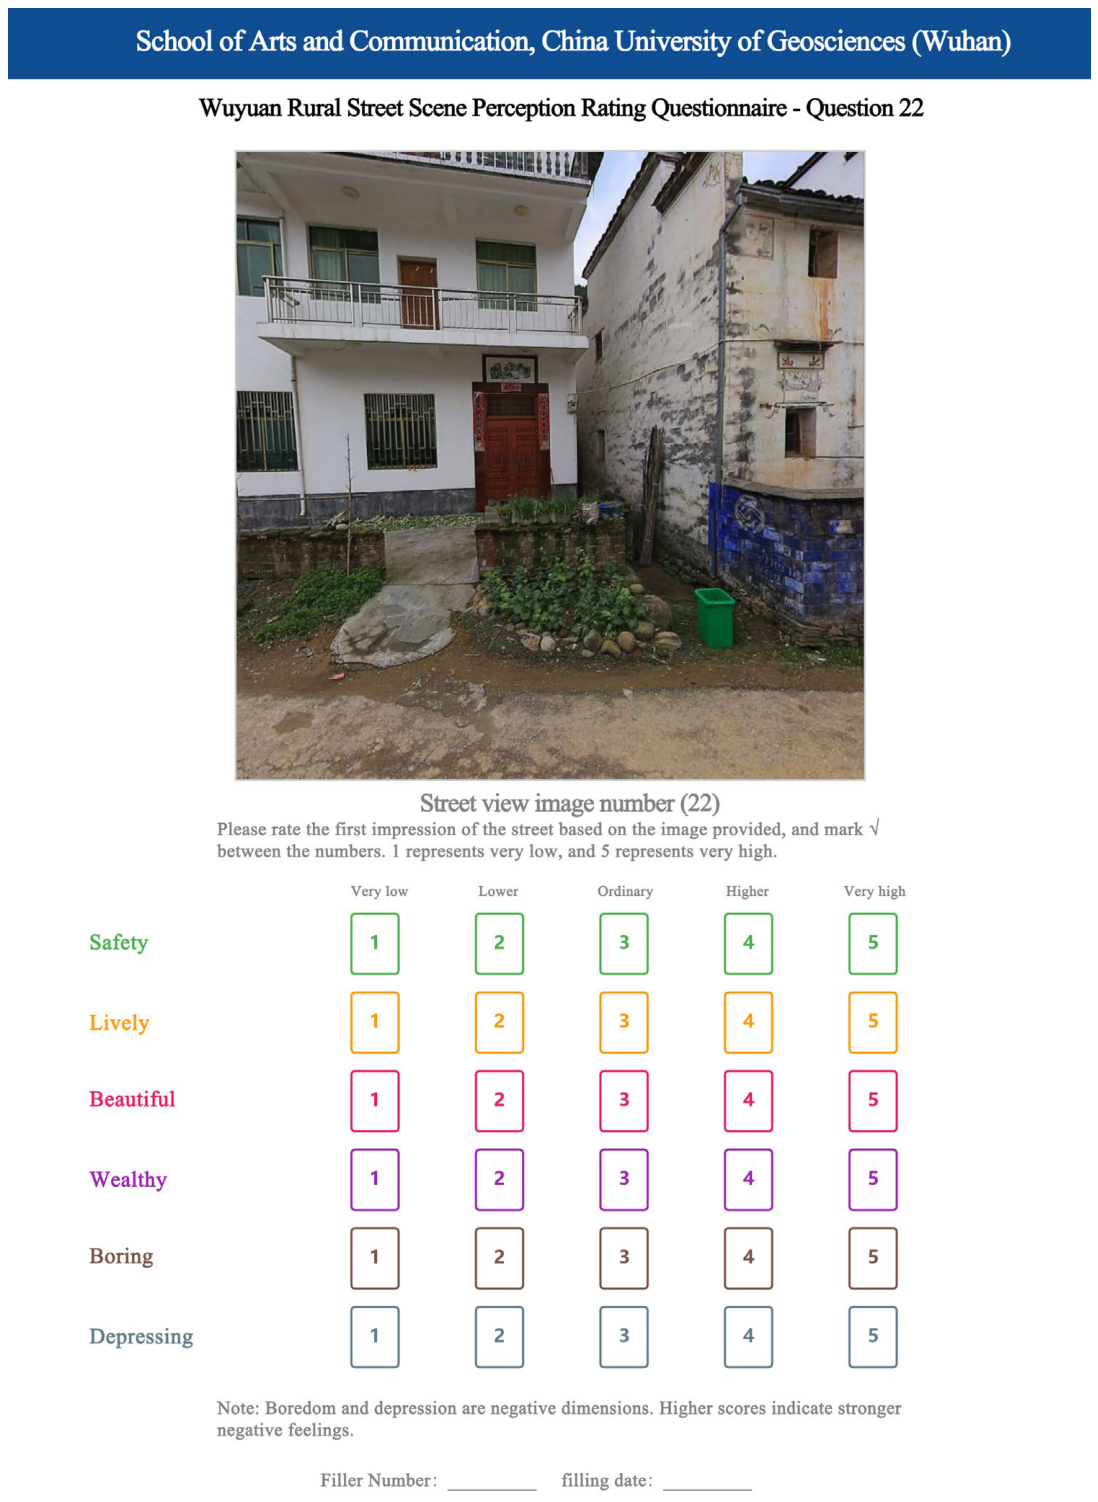
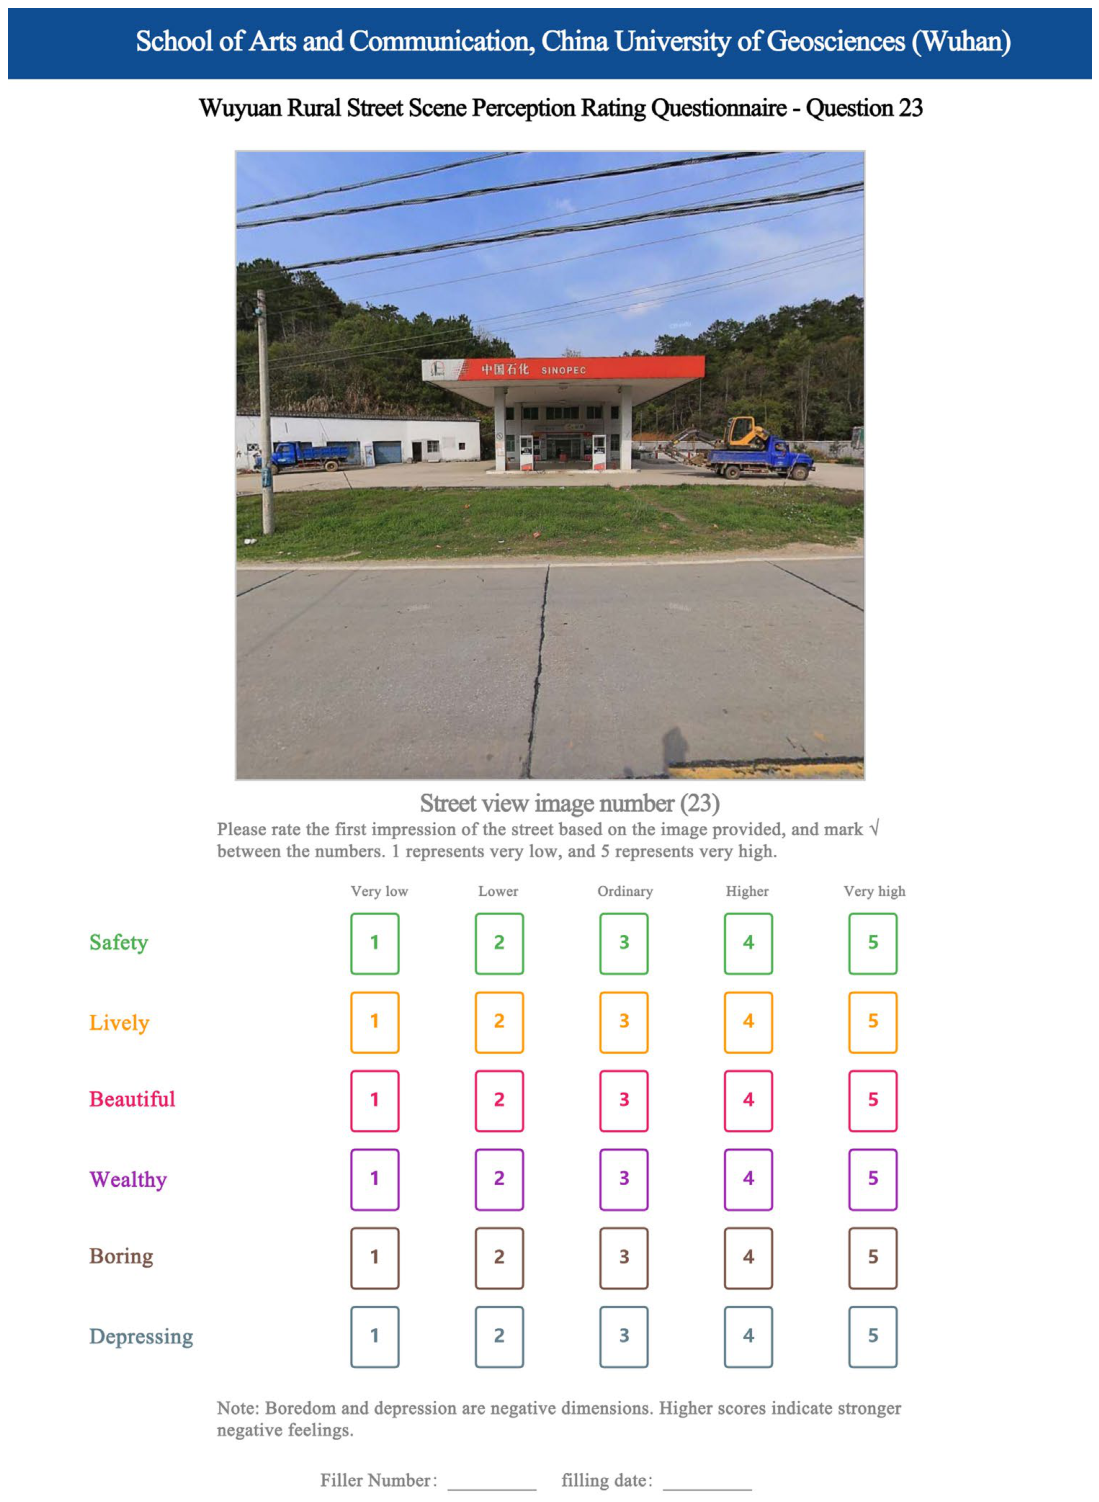
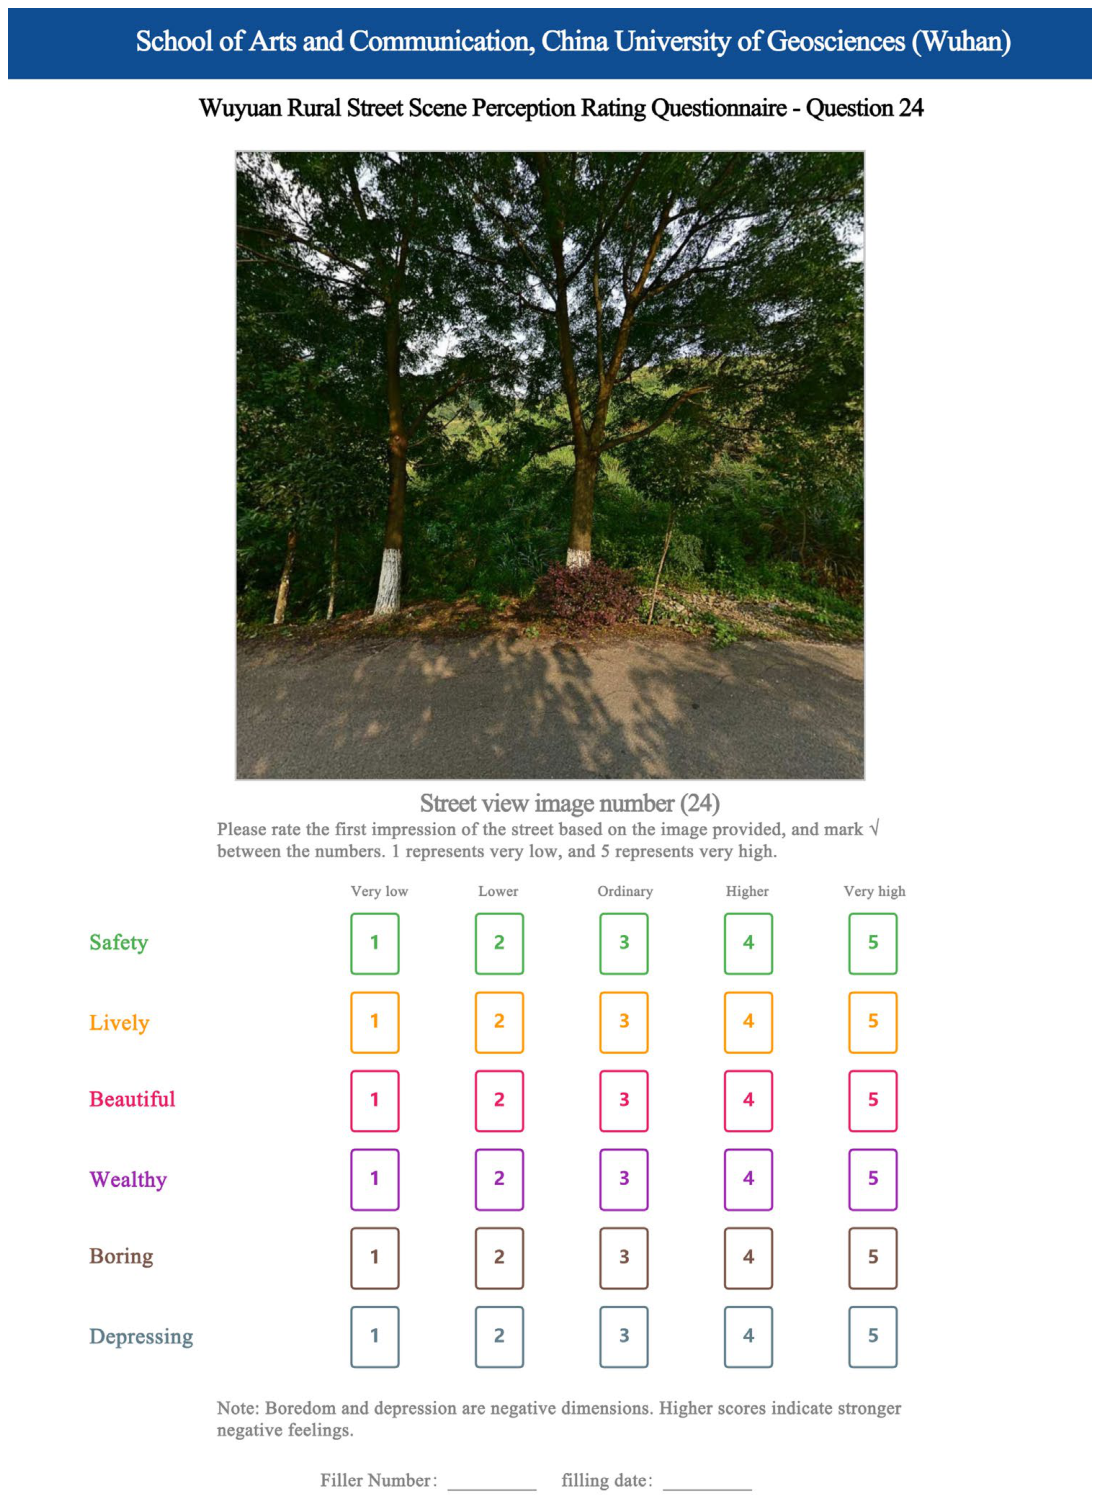
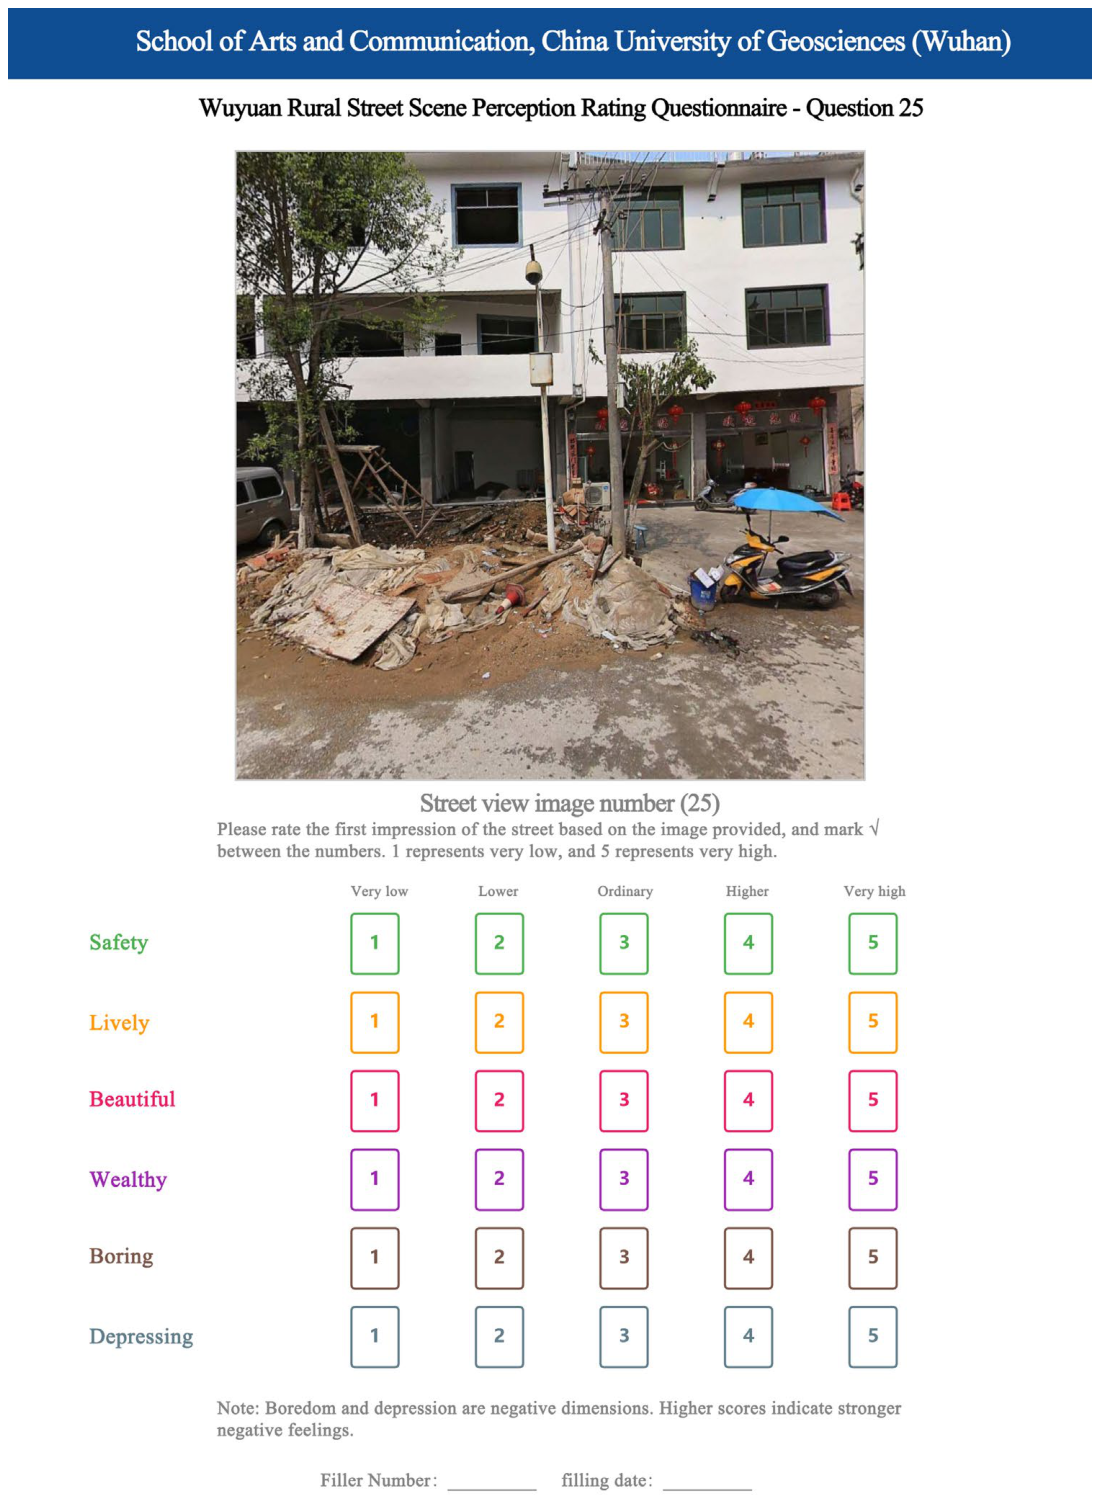
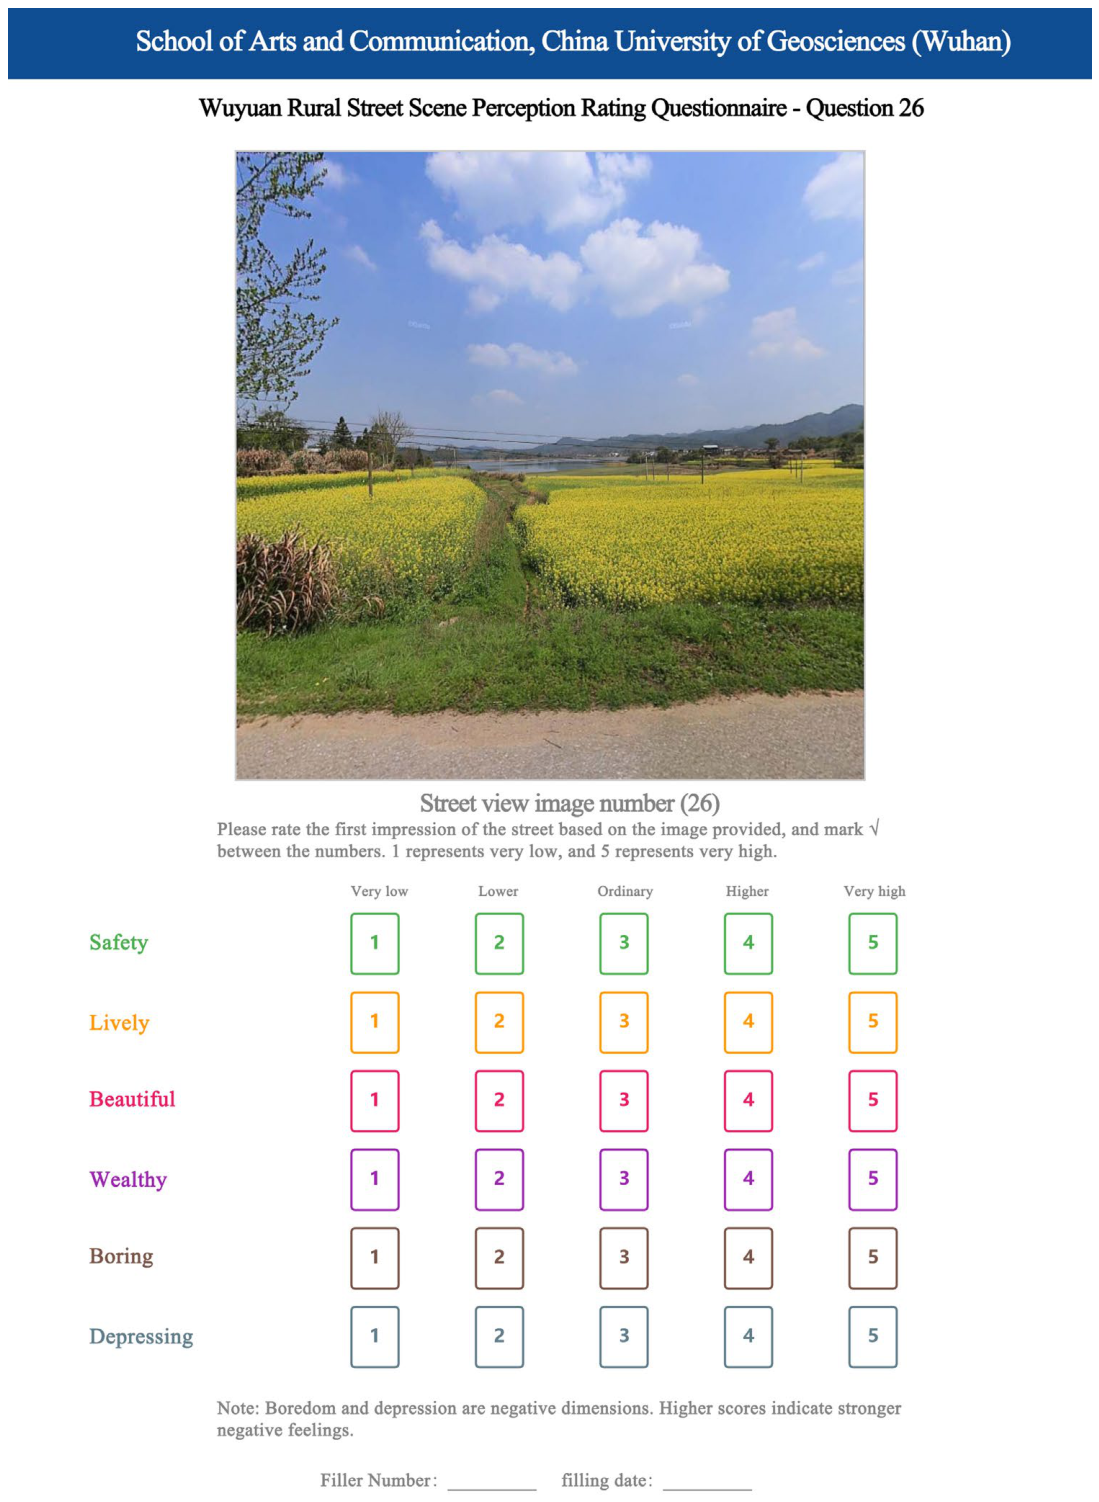
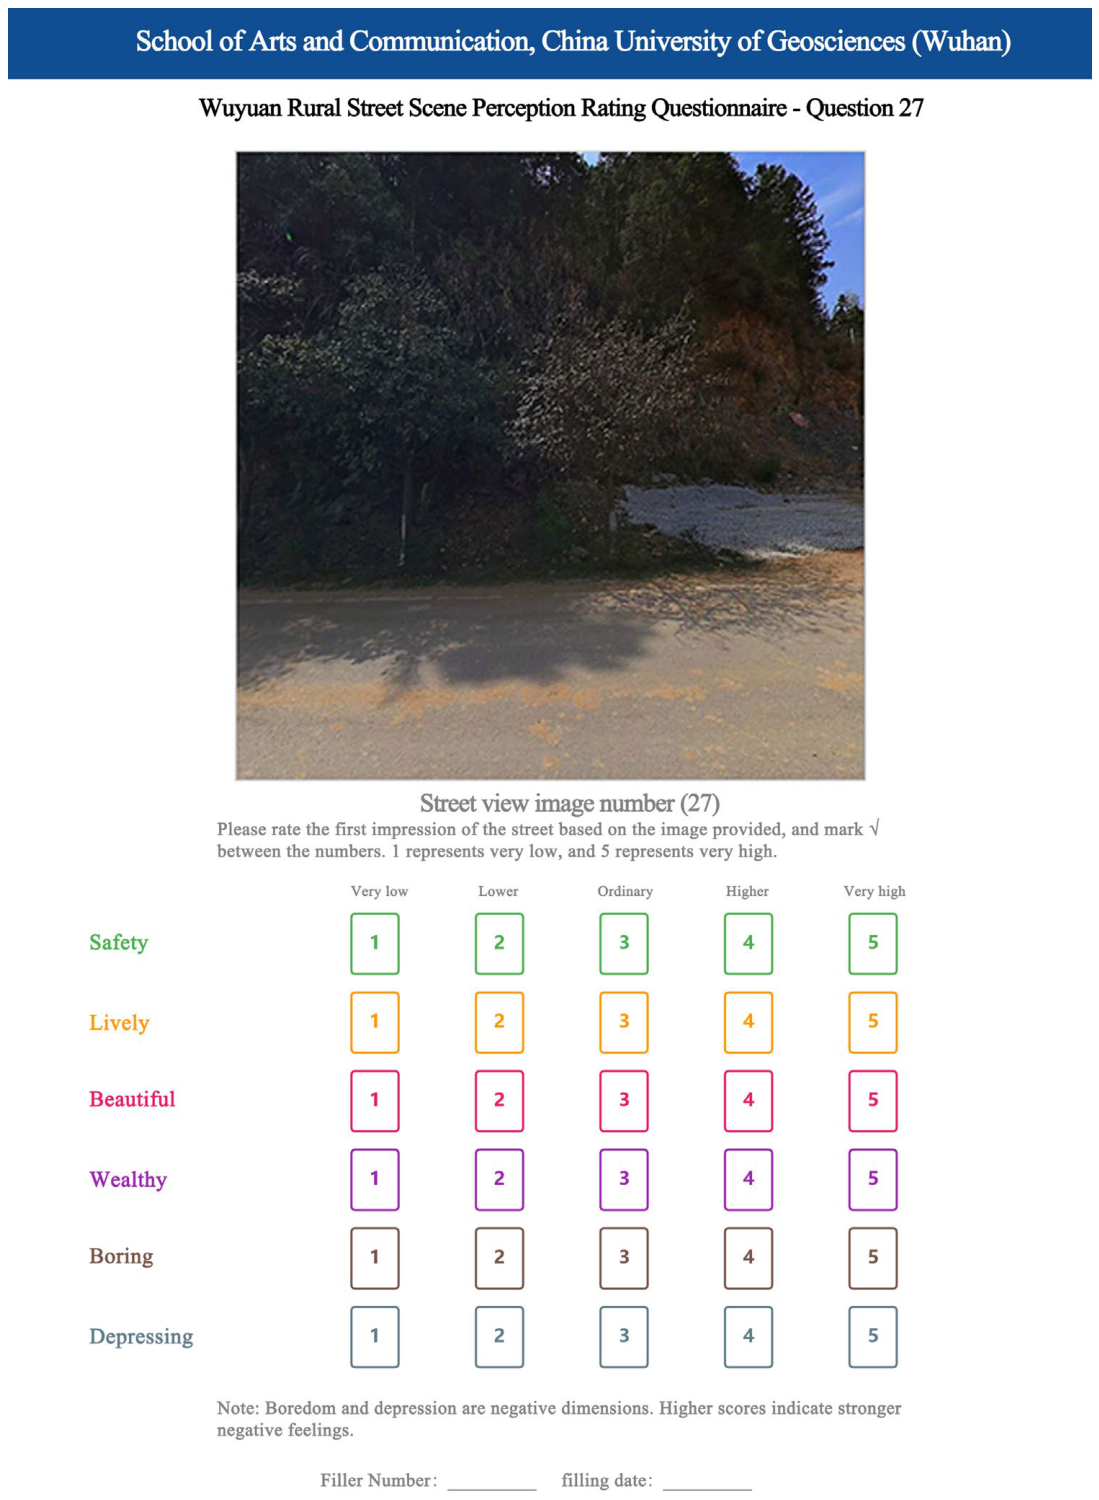
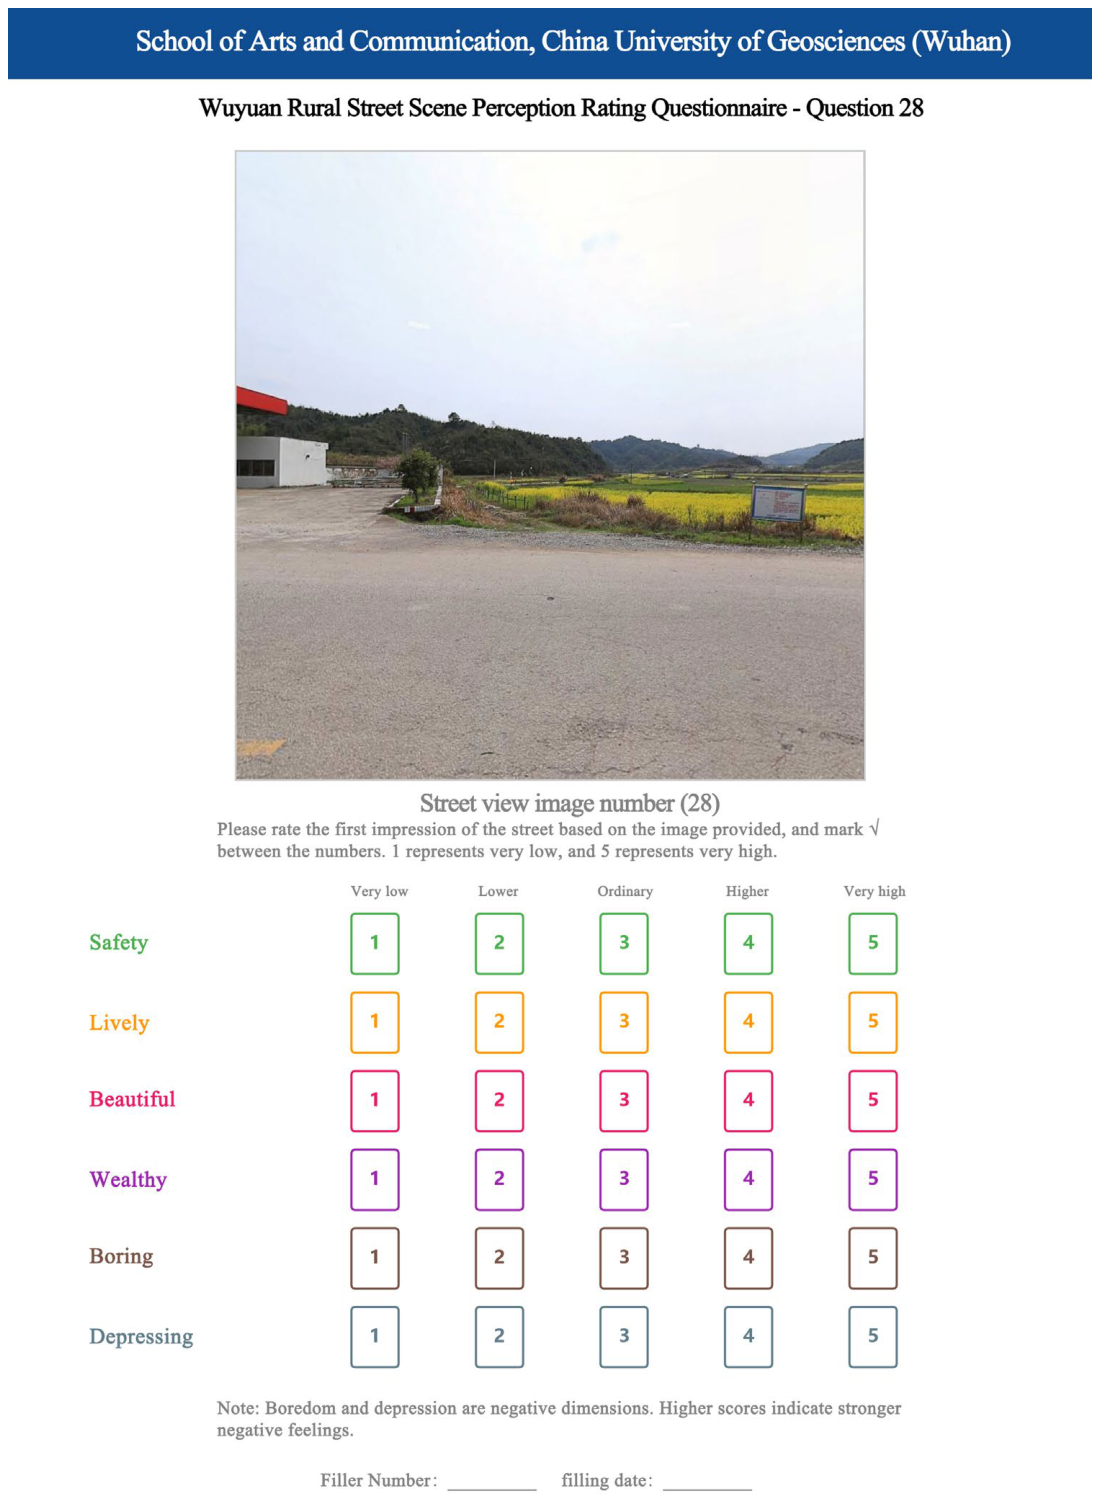
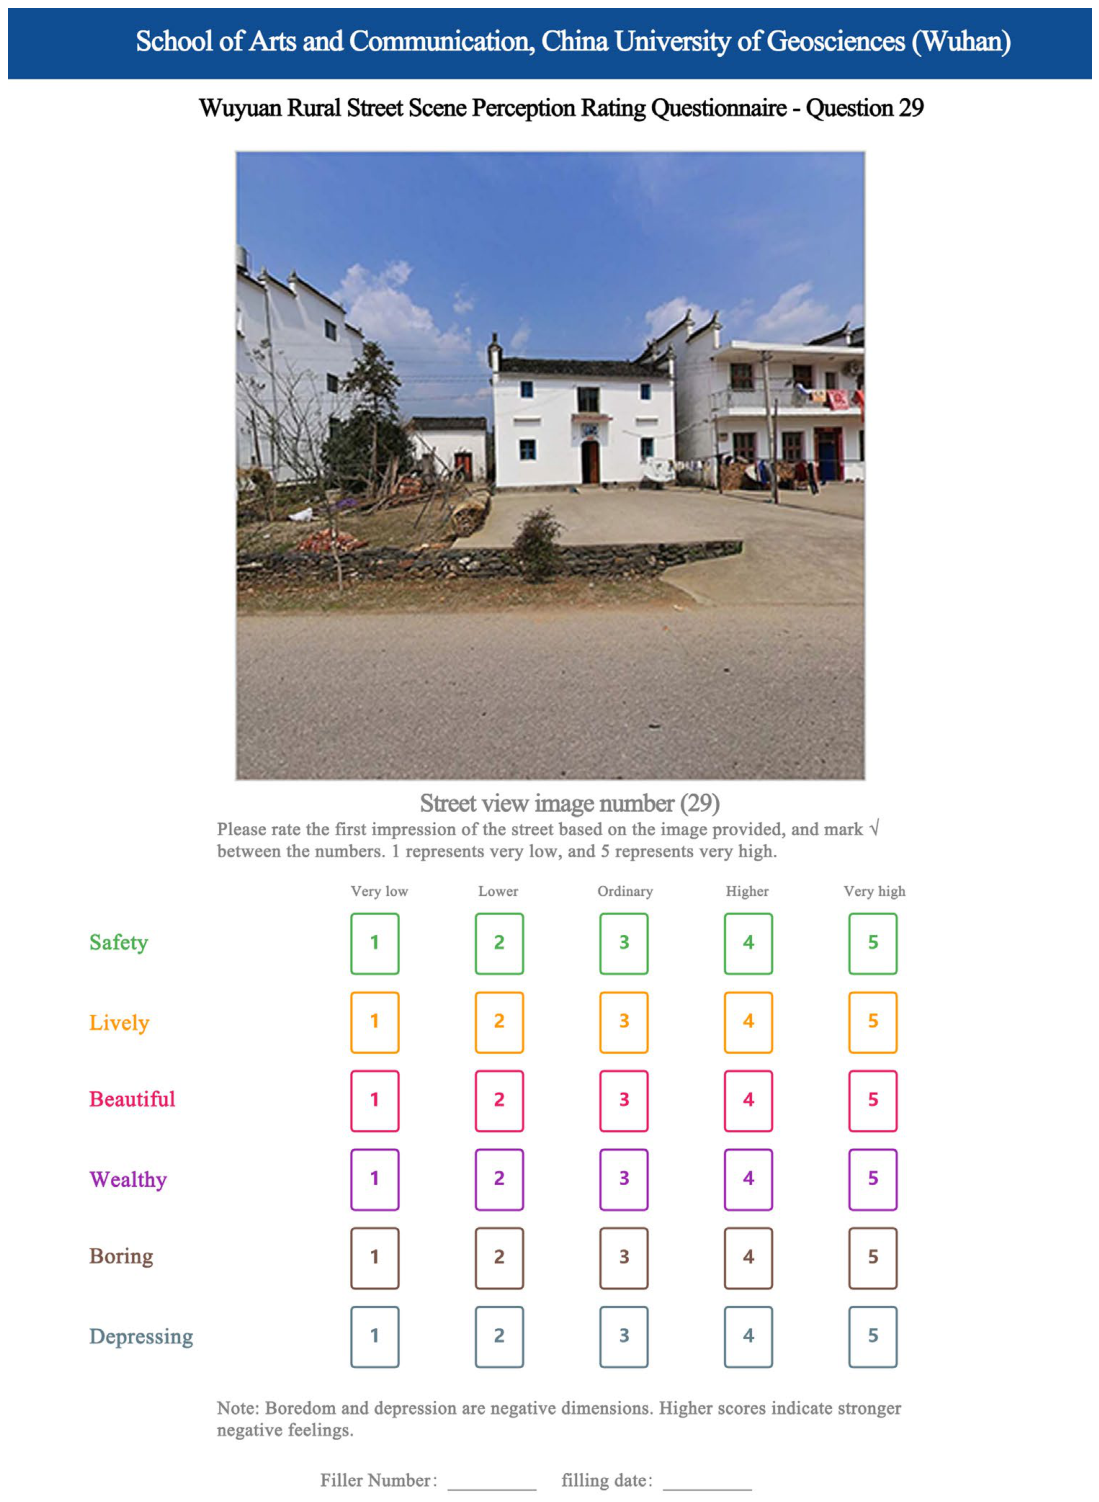
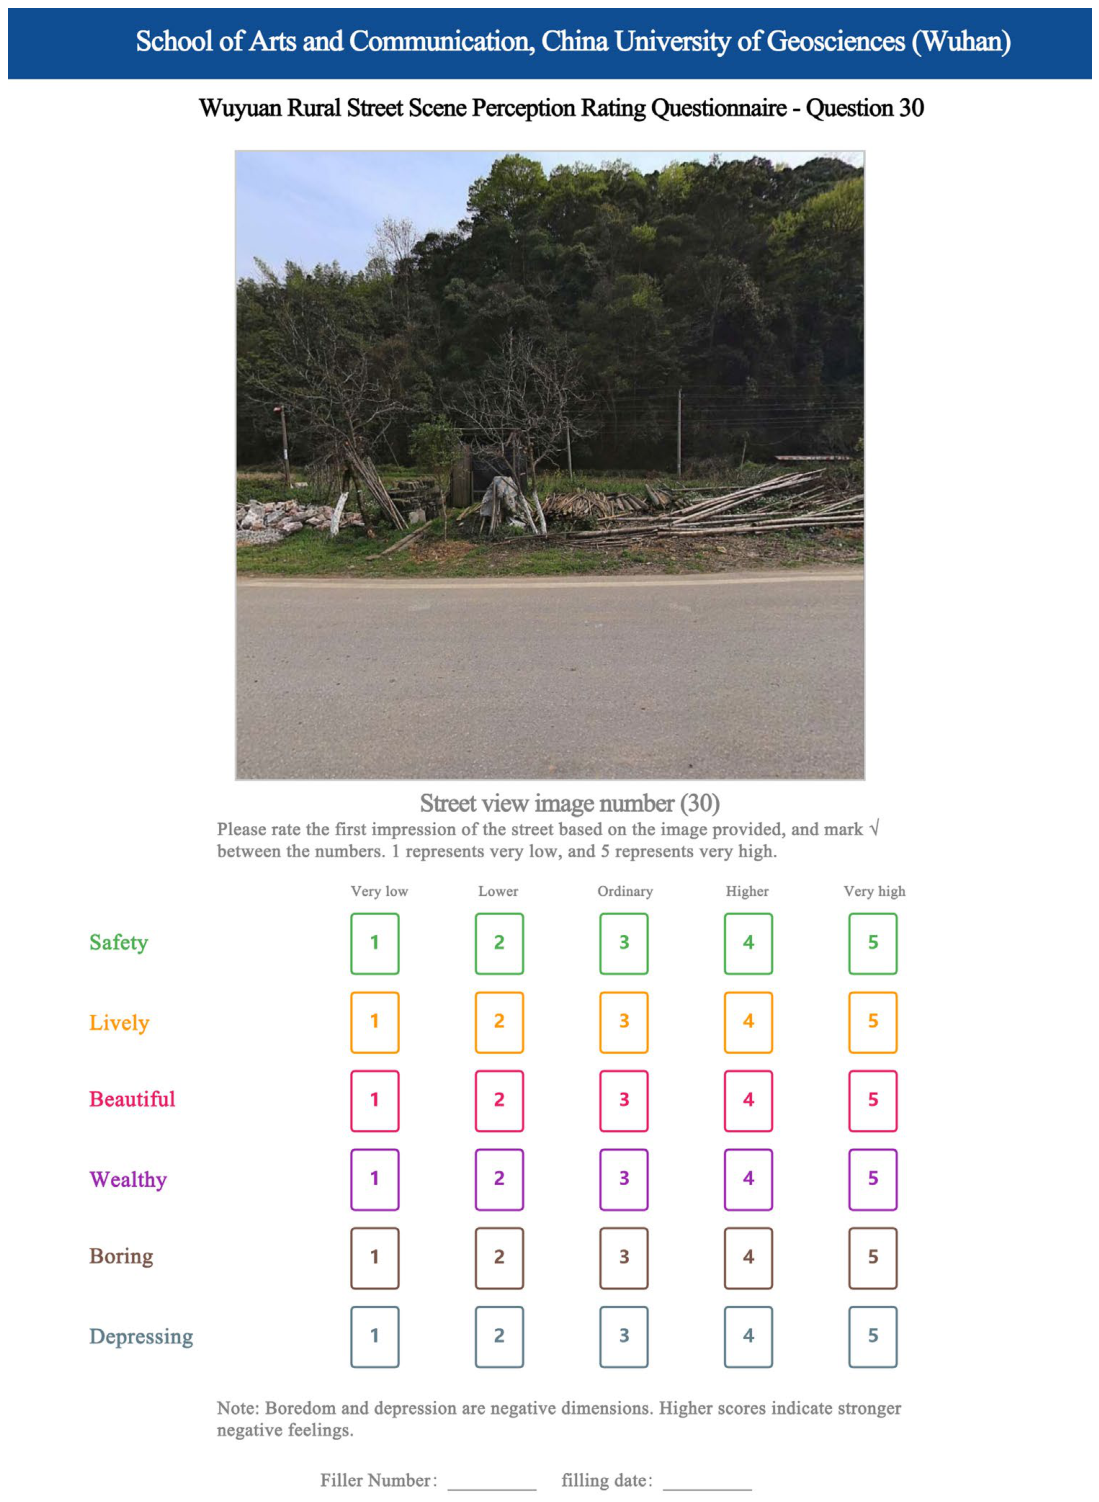
Table A4.
BH-FDR multiple comparison correction.
Figure A2.
Rural street-view images of Wuyuan (Q001–Q030).
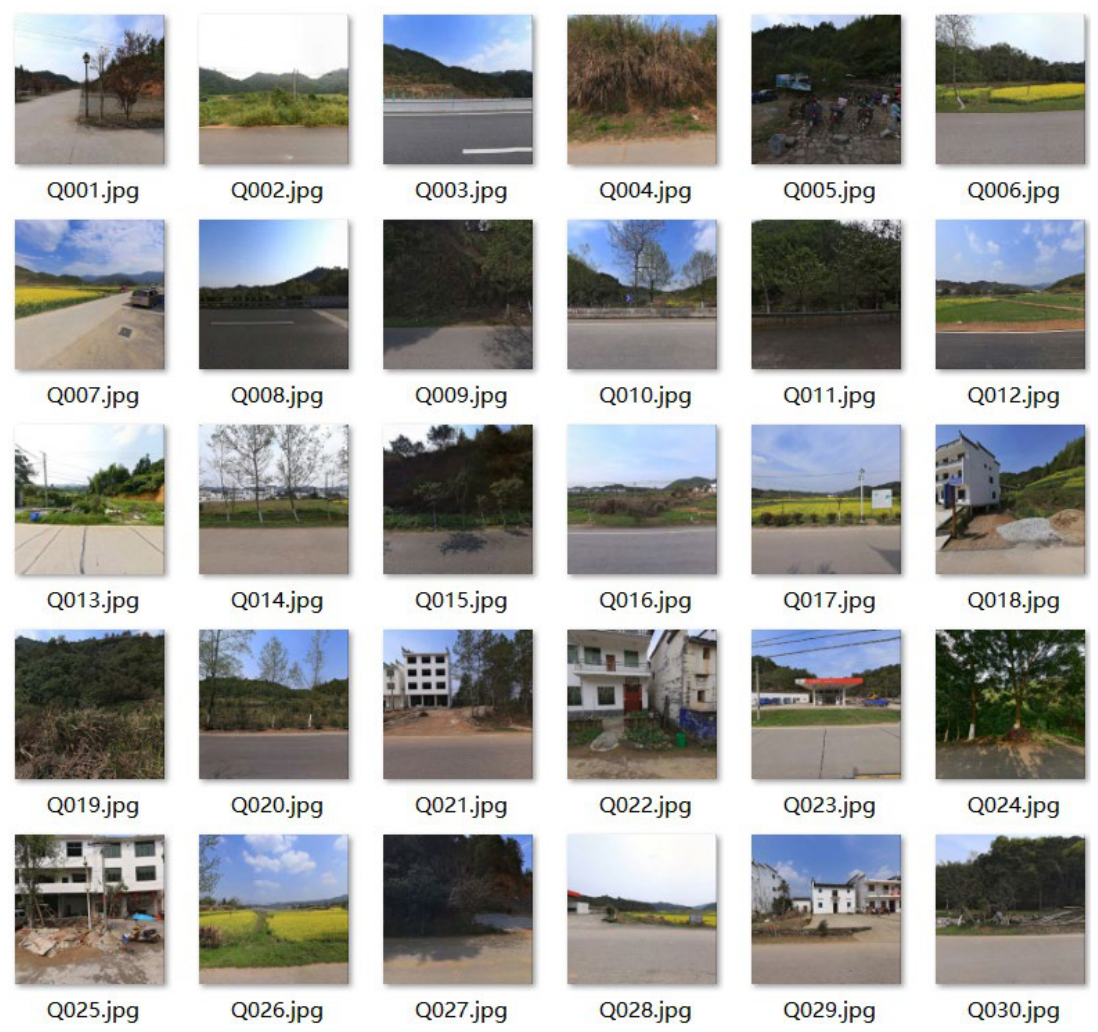
Table A5.
Top 10 correlations by |r|.
References
- Liu, Y.S.; Hu, P.J.; Yang, X.H.; Wang, Z.Y. Compilation concept, technical path, and implementation guarantee of rural landscape features special planning in the new era. Planners 2024, 11, 40–46. (In Chinese) [Google Scholar]
- Wang, R.; Liu, Y.; Lu, Y.; Zhang, J.; Liu, P.; Yao, Y.; Grekousis, G. Perceptions of built environment and health outcomes for older Chinese in Beijing: A big data approach with street view images and deep learning technique. Comput. Environ. Urban Syst. 2019, 78, 101386. [Google Scholar] [CrossRef] [Scilit]
- Kuper, R. Effects of flowering, foliation, and autumn colors on preference and restorative potential for designed digital landscape models. Environ. Behav. 2020, 52, 544–576. [Google Scholar] [CrossRef] [Scilit]
- Wei, Y.Y.; Zhang, Y. A study of the emotional impact of interior lighting color in rural bed and breakfast space design. Buildings 2023, 13, 2537. [Google Scholar] [CrossRef] [Scilit]
- Elliot, A.J.; Maier, M.A. Color psychology: Effects of perceiving color. Annu. Rev. Psychol. 2014, 65, 95–120. [Google Scholar] [CrossRef] [Scilit]
- Von Goethe, J.W. Theory of Colours; MIT Press: Cambridge, MA, USA, 1970. [Google Scholar]
- Valdez, P.; Mehrabian, A. Effects of color on emotions. J. Exp. Psychol. Gen. 1994, 123, 394–409. [Google Scholar] [CrossRef]
- Wilms, L.; Oberfeld, D. Color and emotion: Effects of hue, saturation, and brightness. Psychol. Res. 2018, 82, 896–914. [Google Scholar] [CrossRef] [Scilit]
- Solli, M.; Lenz, R. Color emotions for multi-coloured images. Color Res. Appl. 2011, 36, 210–221. [Google Scholar] [CrossRef] [Scilit]
- Ou, L.C.; Luo, M.R. A colour harmony model for two-colour combinations. Color Res. Appl. 2006, 31, 191–204. [Google Scholar] [CrossRef] [Scilit]
- Hu, K.; Xu, Z.; Wang, X.; Wang, Y.; Li, H.; Zhang, Y. Research on street color environment perception based on CEP-KASS framework. Buildings 2023, 13, 2649. [Google Scholar] [CrossRef] [Scilit]
- Palmer, S.E.; Schloss, K.B. An ecological valence theory of human color preference. Proc. Natl. Acad. Sci. USA 2010, 107, 8877–8882. [Google Scholar] [CrossRef] [Scilit]
- Lu, X.; Wang, Y.B.; Huang, S.; Cheng, L.; Zhang, Y.Y. A quantitative extraction method of urban color characteristics: Based on the comparison of 20 Chinese cities. City Plan. Rev. 2024, 48, 73–82. (In Chinese) [Google Scholar]
- Almeida, M.; Loupa-Ramos, I.; Menezes, H.; Carvalho-Ribeiro, S.; Guiomar, N.; Pinto-Correia, T. Urban population looking for rural landscapes: Different appreciation patterns identified in southern Europe. Land Use Policy 2016, 53, 44–55. [Google Scholar] [CrossRef] [Scilit]
- Howley, P. Landscape aesthetics: Public preferences toward rural landscapes. Ecol. Econ. 2011, 72, 161–169. [Google Scholar] [CrossRef] [Scilit]
- Howley, P.; Donoghue, C.O.; Hynes, S. Exploring public preferences for traditional farming landscapes. Landsc. Urban Plan. 2012, 104, 66–74. [Google Scholar] [CrossRef] [Scilit]
- Nahuelhual, L.; Laterra, P.; Jiménez, D.; Báez, A.; Echeverría, C.; Fuentes, R. Do people prefer natural landscapes? An empirical study in Chile. Bosque 2018, 39, 205–216. [Google Scholar] [CrossRef] [Scilit]
- Qian, Y.; Liu, X.; Liu, P.; Jia, S.; Ding, Y.; Zhu, C.; He, J. Exercise Training Improves Metabolic and Circulatory Function in COPD Patients with NAFLD: Evidence from Clinical and Molecular Profiling. Front. Med. 2025, 12, 1660072. [Google Scholar] [CrossRef] [Scilit]
- Cheng, G.; Li, Z.; Xia, S.T.; Gao, X. A study on the color of Huizhou traditional villages from the regional perspective. Archtectural J. 2023, S1, 142–149. (In Chinese) [Google Scholar]
- Rozelle, S.; Taylor, J.E.; DeBrauw, A. Migration, remittances, and agricultural productivity in China. Am. Econ. Rev. 1999, 89, 287–291. [Google Scholar] [CrossRef] [Scilit]
- Fei, H.T.; Malinowski, B. Peasant Life in China; Read Books Ltd.: Redditch, UK, 1939. [Google Scholar] [CrossRef] [Scilit]
- Zhai, Y.; Gong, R. Building façade color distribution, color harmony and diversity in relation to street functions: Using street view images and deep learning. ISPRS Int. J. Geo-Inf. 2023, 12, 224. [Google Scholar] [CrossRef] [Scilit]
- Huang, Y.; Li, Z.; Wu, X.; Liang, Y.; Li, X. Mapping the stage-specific interactions in rural human settlements: A pathway to understanding rural objective well-being. Appl. Geogr. 2025, 182, 103713. [Google Scholar] [CrossRef] [Scilit]
- Antrop, M. Why landscapes of the past are important for the future. Landsc. Urban Plan. 2005, 70, 21–34. [Google Scholar] [CrossRef] [Scilit]
- Santoro, A. Why traditional rural landscapes are still important to our future. Landsc. Ecol. 2024, 39, 135. [Google Scholar] [CrossRef] [Scilit]
- Wu, B.; Liu, L.H. Social capital for rural revitalization in China: A critical evaluation on the government’s new coun-tryside programme in Chengdu. Land Use Policy 2020, 91, 104268. [Google Scholar] [CrossRef] [Scilit]
- Li, K. Traditional rural heritage conservation in China: Policies and theories. In A Morphological Interpretation of a Northern Chinese Traditional Village; Springer: Singapore, 2024; pp. 39–114. [Google Scholar] [CrossRef] [Scilit]
- Xi, X.S.; Xu, H.Y.; Zhao, Q.; Zhao, G. Making rural micro-regeneration strategies based on resident perceptions and pref-erences for traditional village conservation and development: The case of Huangshan Village, China. Land 2021, 10, 718. [Google Scholar] [CrossRef] [Scilit]
- Seokhyun, L. Landscape color planning of rural village with cultural climate—Focus on GumCheon Village. J. Korea Soc. Color Stud. 2011, 25, 17–28. [Google Scholar] [CrossRef] [Scilit]
- Chen, Y.S.; Gu, F. Quantitative analysis of traditional Chinese color. BioResources 2023, 18, 4954–4963. [Google Scholar] [CrossRef] [Scilit]
- Dong, L.; Kang, M.Q. Quantitative comparison of geographical color of traditional village architectural heritage based on K-means color clustering—A case study of southeastern Hubei Province, China. Buildings 2025, 15, 748. [Google Scholar] [CrossRef] [Scilit]
- Yang, J.R.; Liu, Y.; Liang, X.Y. Quantifying natural and built-cultural color relationships for architectural color control in a traditional mountain village: A case study of Qingmuchuan, China. Buildings 2026, 16, 2648. [Google Scholar] [CrossRef] [Scilit]
- Li, N.W.; Yang, C.C. Research on landscape color protection and renewal of Yueling Village based on digital color model analysis. In Proceedings of the 2022 3rd International Conference on Intelligent Design (ICID); IEEE: Piscataway, NJ, USA, 2022; pp. 99–104. [Google Scholar] [CrossRef] [Scilit]
- Kong, D.Y.; Fei, X.H.; Lu, Z.X.; Lin, X.; Cai, M.; Chen, Z. Regional color study of traditional village based on random forest model: Taking the Minjiang River Basin as an example. Buildings 2025, 15, 524. [Google Scholar] [CrossRef] [Scilit]
- Seresinhe, C.I.; Preis, T.; Moat, H.S. Using deep learning to quantify the beauty of outdoor places. R. Soc. Open Sci. 2017, 4, 170170. [Google Scholar] [CrossRef] [Scilit]
- Law, S.; Seresinhe, C.I.; Shen, Y. Street-Frontage-Net: Urban image classification using deep convolutional neural net-works. Int. J. Geogr. Inf. Sci. 2020, 34, 681–707. [Google Scholar] [CrossRef] [Scilit]
- Wang, X.; Song, Y.; Yang, H.; Yao, J.; Wang, H.; Liu, Z. Koopman neural operator-based surrogate modelling for high-frequency dynamics of high-speed rail pantographs. Mech. Syst. Signal Process. 2026, 258, 114780. [Google Scholar] [CrossRef] [Scilit]
- Wang, Y.; Xu, Z.; Tian, Z.; Liu, W.; Yang, J.; Huang, Q. Progress in the Flocculation and Sedimentation Mechanisms and Jet Mixing Transportation of Heavy Components in Crude Oil Storage Tanks. J. Pipeline Sci. Eng. 2026, 6, 100511. [Google Scholar] [CrossRef] [Scilit]
- Hargreaves, P.K.; Watmouch, G.R. Satellite remote sensing for rural development. Int. J. Appl. Earth Obs. Geoinf. 2021, 103, 102466. [Google Scholar] [CrossRef] [Scilit]
- Biljecki, F.; Ito, K. Street view imagery in urban analytics and GIS. Landsc. Urban Plan. 2021, 215, 104217. [Google Scholar] [CrossRef] [Scilit]
- Qi, J. Estimating aesthetic services of road landscapes through predicting people’s attention: A computer vision approach. J. Environ. Manag. 2025, 349, 124584. [Google Scholar] [CrossRef] [Scilit]
- Xie, E.; Wang, W.; Yu, Z.; Anandkumar, A.; Alvarez, J.M.; Luo, P. SegFormer: Simple and efficient design for semantic segmentation with transformers. arXiv 2021, arXiv:2105.15203. [Google Scholar] [CrossRef] [Scilit]
- Liao, S. SegFormer-based segmentation approach for landscape planning and overhead remote sensing image analysis. Sci. Rep. 2026, 16, 54946. [Google Scholar] [CrossRef] [Scilit]
- Chen, L.C.; Zhu, Y.; Papandreou, G.; Schroff, F.; Adam, H. Encoder-decoder with atrous separable convolution for semantic image segmentation. In Computer Vision—ECCV 2018; Ferrari, V., Hebert, M., Sminchisescu, C., Eds.; Springer: Cham, Switzerland, 2018; pp. 833–851. [Google Scholar] [CrossRef] [Scilit]
- Cheng, B.; Misra, I.; Schwing, A.G.; Kirillov, A.; Girdhar, R. Masked-attention mask transformer for universal image segmentation. In Proceedings of the IEEE/CVF Conference on Computer Vision and Pattern Recognition (CVPR); IEEE: Piscataway, NJ, USA, 2022; pp. 1280–1289. [Google Scholar] [CrossRef] [Scilit]
- Wang, J.; Deng, J.; Rashwan, T.L.; Liu, D.; Ren, S.; Qu, G.; Wang, C. Coal spontaneous combustion temperature prediction under variable oxygen atmospheres using chameleon swarm algorithm-optimized long short-term memory. Energy 2026, 363, 142304. [Google Scholar] [CrossRef] [Scilit]
- Zhang, J.; Fukuda, T. Development of a city-scale approach for façade color measurement with building functional classification using deep learning and street view images. ISPRS Int. J. Geo-Inf. 2021, 10, 551. [Google Scholar] [CrossRef] [Scilit]
- Ki, D.; Lee, S. Analyzing the effects of green view index of neighborhood streets on walking time using Google Street View and deep learning. Landsc. Urban Plan. 2021, 205, 103920. [Google Scholar] [CrossRef] [Scilit]
- Ji, L.; Xiao, S.; Feng, J.; Gao, W.; Zhang, H. Multimodal large model pretraining optimization. Neurocomputing 2025, 619, 129138. [Google Scholar] [CrossRef] [Scilit]
- Zhou, X.; Li, Z.; Liu, X.; Wang, Y.; Liang, N.; Zhong, Z. Physics-informed neural network (PINN) for predicting the temperature field in high geothermal tunnels. Tunn. Undergr. Space Technol. 2026, 169, 107265. [Google Scholar] [CrossRef] [Scilit]
- Gong, S.; Zhang, L.; Zhang, J.; Duan, Y. Rural local landscape perception evaluation: Integrating street view images and machine learning. ISPRS Int. J. Geo-Inf. 2025, 14, 251. [Google Scholar] [CrossRef] [Scilit]
- Zhu, K.K.; Gu, Y.; Zhang, Y.T.; Song, Y.; Guo, Z.; Yan, X.; Yao, Y.; Guan, Q.; Li, X. From street view imagery to the countryside: Large-scale perception of rural China using deep learning. Ann. Am. Assoc. Geogr. 2025, 115, 1720–1741. [Google Scholar] [CrossRef] [Scilit]
- Ma, H.R.; Li, J.; Ye, X.Y. Deep learning meets urban design: Assessing streetscape aesthetic and design quality through AI and cluster analysis. Cities 2025, 162, 105939. [Google Scholar] [CrossRef] [Scilit]
- Li, Y.S.; Huang, X.; Liu, H. Unsupervised deep feature learning for urban village detection from high-resolution remote sensing images. Photogramm. Eng. Remote Sens. 2017, 83, 567–579. [Google Scholar] [CrossRef] [Scilit]
- Chen, Z.; Man, Z.; Rao, S.; Zhao, J.; Wang, S.; Zhang, R.; Teng, F.; Tang, A. Rigid crosslinker-assisted nondestructive direct photolithograph for patterned QLED displays. Light Sci. Appl. 2025, 14, 251. [Google Scholar] [CrossRef] [Scilit]
- Tu, L. The Heritage Value and Conservation Mechanism of Traditional Villages in Southern Anhui; Southeast University Press: Nanjing, China, 2019. (In Chinese) [Google Scholar]
- Wang, D.C.; Ding, N.; Li, Y.J.; Miao, J.J. Quantitative analysis of architectural color characteristics of Huizhou streets and lanes based on visual perception: A case study of Hongcun Village. Ind. Constr. 2025, 55, 73–81. (In Chinese) [Google Scholar] [CrossRef] [Scilit]
- Mo, Y.J.; Wu, Y.; Yang, X.; Liu, F.; Liao, Y. Review the state-of-the-art technologies of semantic segmentation based on deep learning. Neurocomputing 2022, 493, 626–646. [Google Scholar] [CrossRef] [Scilit]
- Zhou, B.; Zhao, H. Scene parsing through ADE20K dataset. In Proceedings of the IEEE Conference on Computer Vision and Pattern Recognition (CVPR); IEEE: Piscataway, NJ, USA, 2017; pp. 633–641. [Google Scholar] [CrossRef] [Scilit]
- Chen, N.; Wang, L.; Xu, T.; Wang, M. Perception of urban street visual color environment based on CEP-KASS framework. Landsc. Urban Plan. 2025, 259, 105359. [Google Scholar] [CrossRef] [Scilit]
- Lin, M.; Li, G.; Xu, S.; Hao, Y.; Zhang, S. Decoupling foreground and background with Siamese ViT networks for weakly-supervised semantic segmentation. Neurocomputing 2024, 610, 128540. [Google Scholar] [CrossRef] [Scilit]
- Long, Y.; Liu, L. How green are the streets? An analysis for central areas of Chinese cities using Tencent Street View. PLoS ONE 2017, 12, e0171110. [Google Scholar] [CrossRef] [Scilit]
- Fukunaga, K.; Hostetler, L. The estimation of the gradient of a density function, with applications in pattern recognition. IEEE Trans. Inf. Theory 1975, 21, 32–40. [Google Scholar] [CrossRef] [Scilit]
- MacQueen, J. Some methods for classification and multivariate analysis. In Proceedings of the Fifth Berkeley Symposium on Mathematical Statistics and Probability; University of California Press: Berkeley, CA, USA, 1967; pp. 281–297. [Google Scholar]
- Sinaga, K.P.; Yang, M.S. Unsupervised K-means clustering. IEEE Access 2020, 8, 80716–80727. [Google Scholar] [CrossRef] [Scilit]
- Shin, D.; He, S.; Lee, G.M.; Whinston, A.B.; Cetintas, S.; Lee, K.-C. Enhancing social media analysis with visual data analytics: A deep learning approach. MIS Q. 2020, 44, 1459–1492. [Google Scholar] [CrossRef] [Scilit]
- Haughton, D.M.A.; Mukerjee, S. The economic measurement and determinants of diversity. Soc. Indic. Res. 1995, 36, 201–225. [Google Scholar] [CrossRef] [Scilit]
- Zhou, X.; Li, Z.; Liu, X.; Wang, Y.; Du, L. Calculation model for the thermal conductivity of concrete considering microstructural characteristics. Case Stud. Therm. Eng. 2026, 79, 107789. [Google Scholar] [CrossRef] [Scilit]
- Li, C.; Liu, P.; Zhao, M.; Zhang, Y.; Bao, H.; Yang, M.; Chen, Y.; Zhong, G. Regulation mechanism of dielectric constant on ion transport behavior in vinylidene fluoride-based solid composite electrolytes. Electrochim. Acta 2026, 573, 149499. [Google Scholar] [CrossRef] [Scilit]
- Xue, X.; Tian, Z.; Yang, Y.; Wang, J.; Cao, S.-J. Sustaining the local color of a global city. Nat. Cities 2025, 2, 400–412. [Google Scholar] [CrossRef] [Scilit]
- Kynash, Y.; Semeniv, M. New approach to dominant and prominent color extraction in images with a wide range of hues. Technologies 2025, 13, 230. [Google Scholar] [CrossRef] [Scilit]
- Dubey, A.; Naik, N.; Parik, D.; Raskar, R.; Hidalgo, C.A. Deep learning driven urban perception analysis. arXiv 2016, arXiv:1608.01769. [Google Scholar] [CrossRef] [Scilit]
- He, K.; Zhang, X.; Ren, S.; Sun, J. Deep residual learning for image recognition. In Proceedings of the IEEE Conference on Computer Vision and Pattern Recognition (CVPR); IEEE: Piscataway, NJ, USA, 2016; pp. 770–778. [Google Scholar] [CrossRef] [Scilit]
- Li, F.; Zhang, L.H.; Tang, F.; Liu, J.; Hu, Y.; Kong, Y. How environmental perception and place governance shape equity in urban street greening: An empirical study of Chicago. Forests 2026, 17, 119. [Google Scholar] [CrossRef] [Scilit]
- Fazilov, S.; Yusupov, O.; Khandamov, Y.; Eshonqulov, E.; Khamidov, J.; Abdieva, K. Remote sensing scene classification via multi-feature fusion based on discriminative multiple canonical correlation analysis. AI 2026, 7, 5. [Google Scholar] [CrossRef] [Scilit]
- Ovu, I.O.; Igbokwe, J.I.; Ejikeme, J.O.; Adeboboye, A.J. Comparative analysis of machine learning techniques in identification and mapping of urban road network with remotely sensed imagery in parts of Benin City, Nigeria. J. Spat. Inf. Sci. 2025, 2, 148–168. [Google Scholar] [CrossRef]
- Xu, X.J.; Ma, J. Can we trust our eyes? Interpreting the misperception of road safety from street view images and deep learning. Accid. Anal. Prev. 2024, 197, 107455. [Google Scholar] [CrossRef] [Scilit]
- Zhang, F.; Zhou, B. Measuring human perceptions of a large-scale urban region using machine learning. Landsc. Urban Plan. 2018, 180, 148–160. [Google Scholar] [CrossRef] [Scilit]
- Liu, X.; Fang, L.; Zhou, X.; Xu, Q.; Cheng, K. Mechanical Response Characteristics and Influencing Factors Analysis of Non-Parallel Complex Subway Station-Tunnel Groups Close Proximity Construction. Tunn. Undergr. Space Technol. 2026, 171, 107472. [Google Scholar] [CrossRef] [Scilit]
- Van Den Bosch, M.; Ode Sang, Å. Urban natural environments as nature-based solutions for improved public health—A systematic review of reviews. Environ. Res. 2017, 158, 373–384. [Google Scholar] [CrossRef] [Scilit]
- Guo, J.; Chen, C.; Dong, X.; Li, X.; Zhao, Q.; Zhang, M.; Yang, C. Multi-functional liquid metal/carbon nanotubes/bacterial cellulose flexible composite film suitable for electromagnetic shielding, intelligent wearable sensors and Joule heater materials. Colloids Surf. A 2026, 752, 141829. [Google Scholar] [CrossRef] [Scilit]
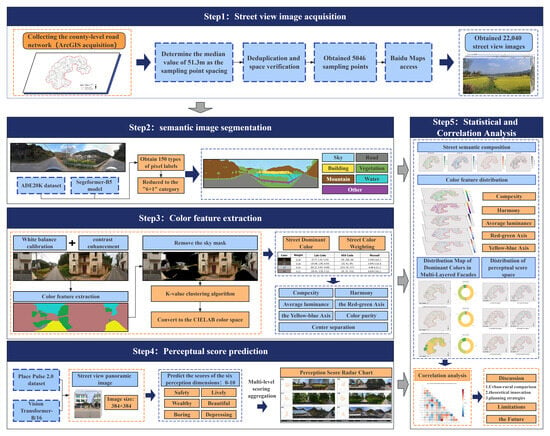
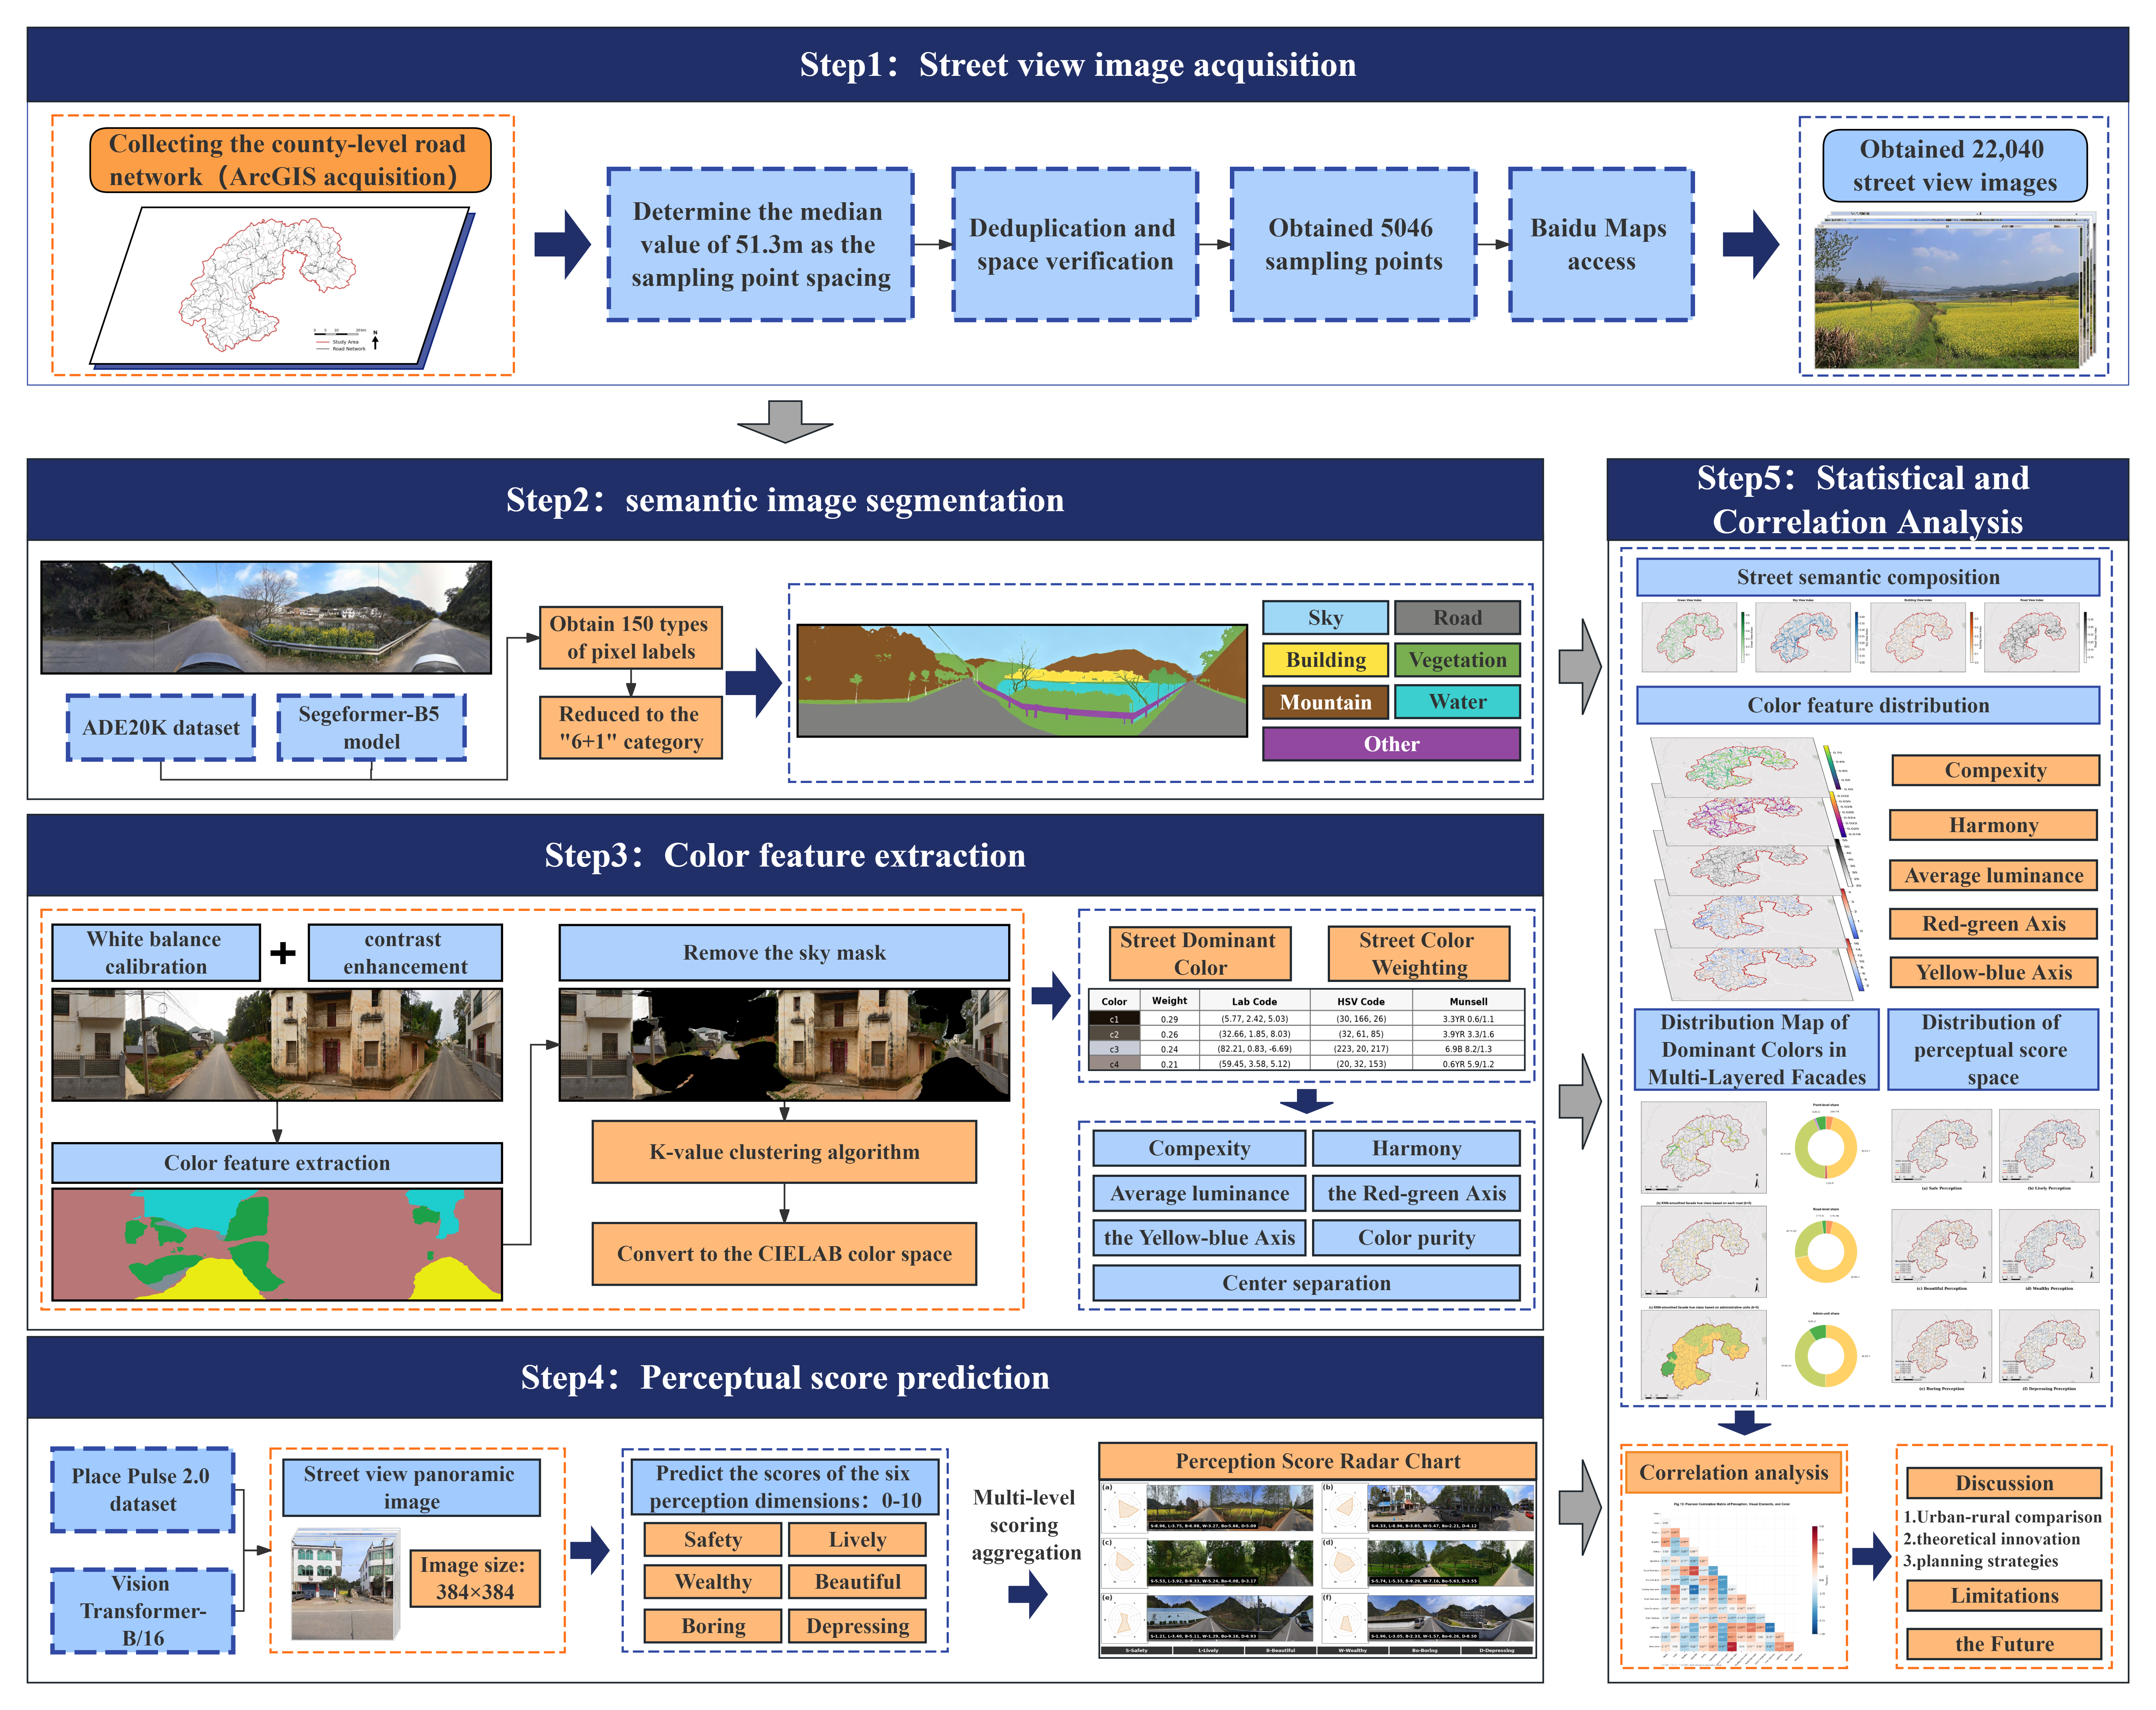
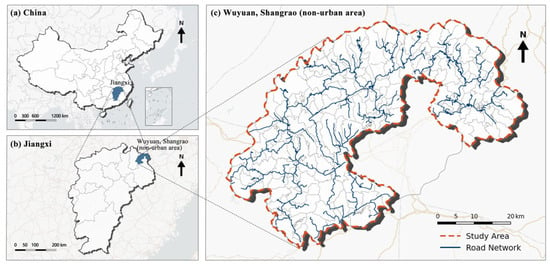
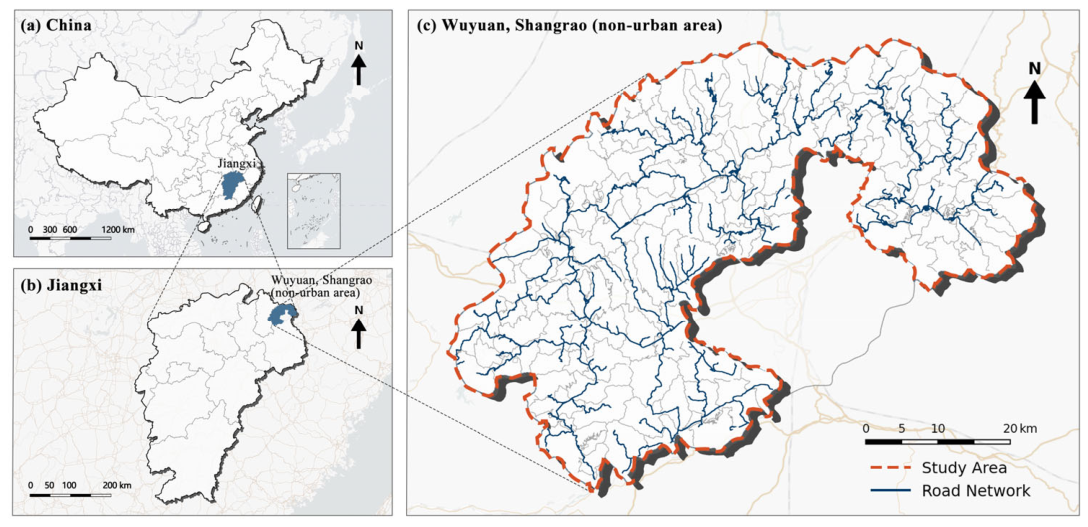
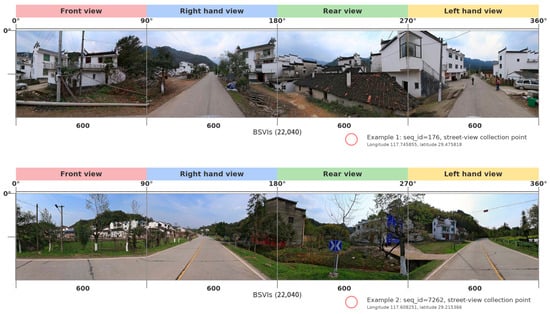
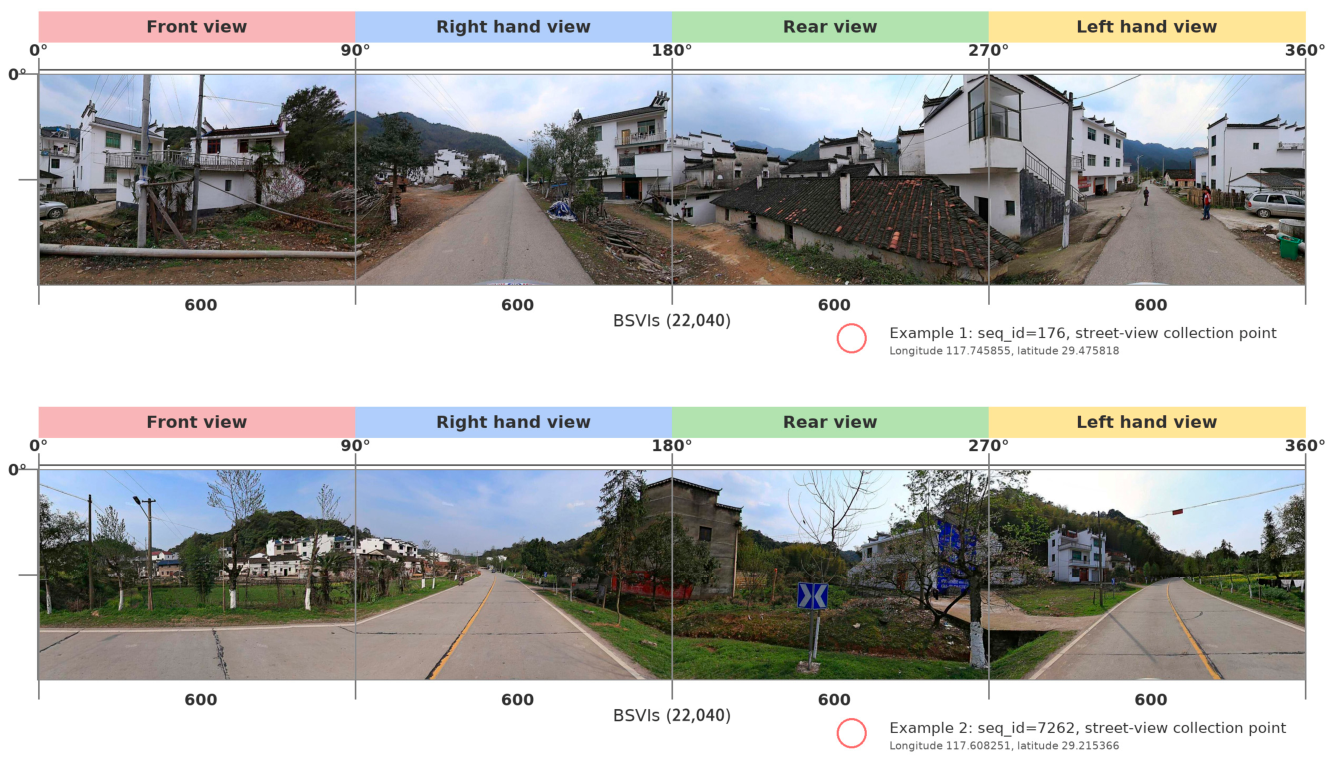
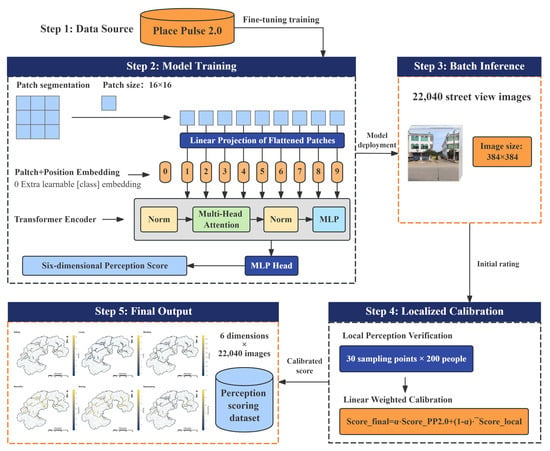
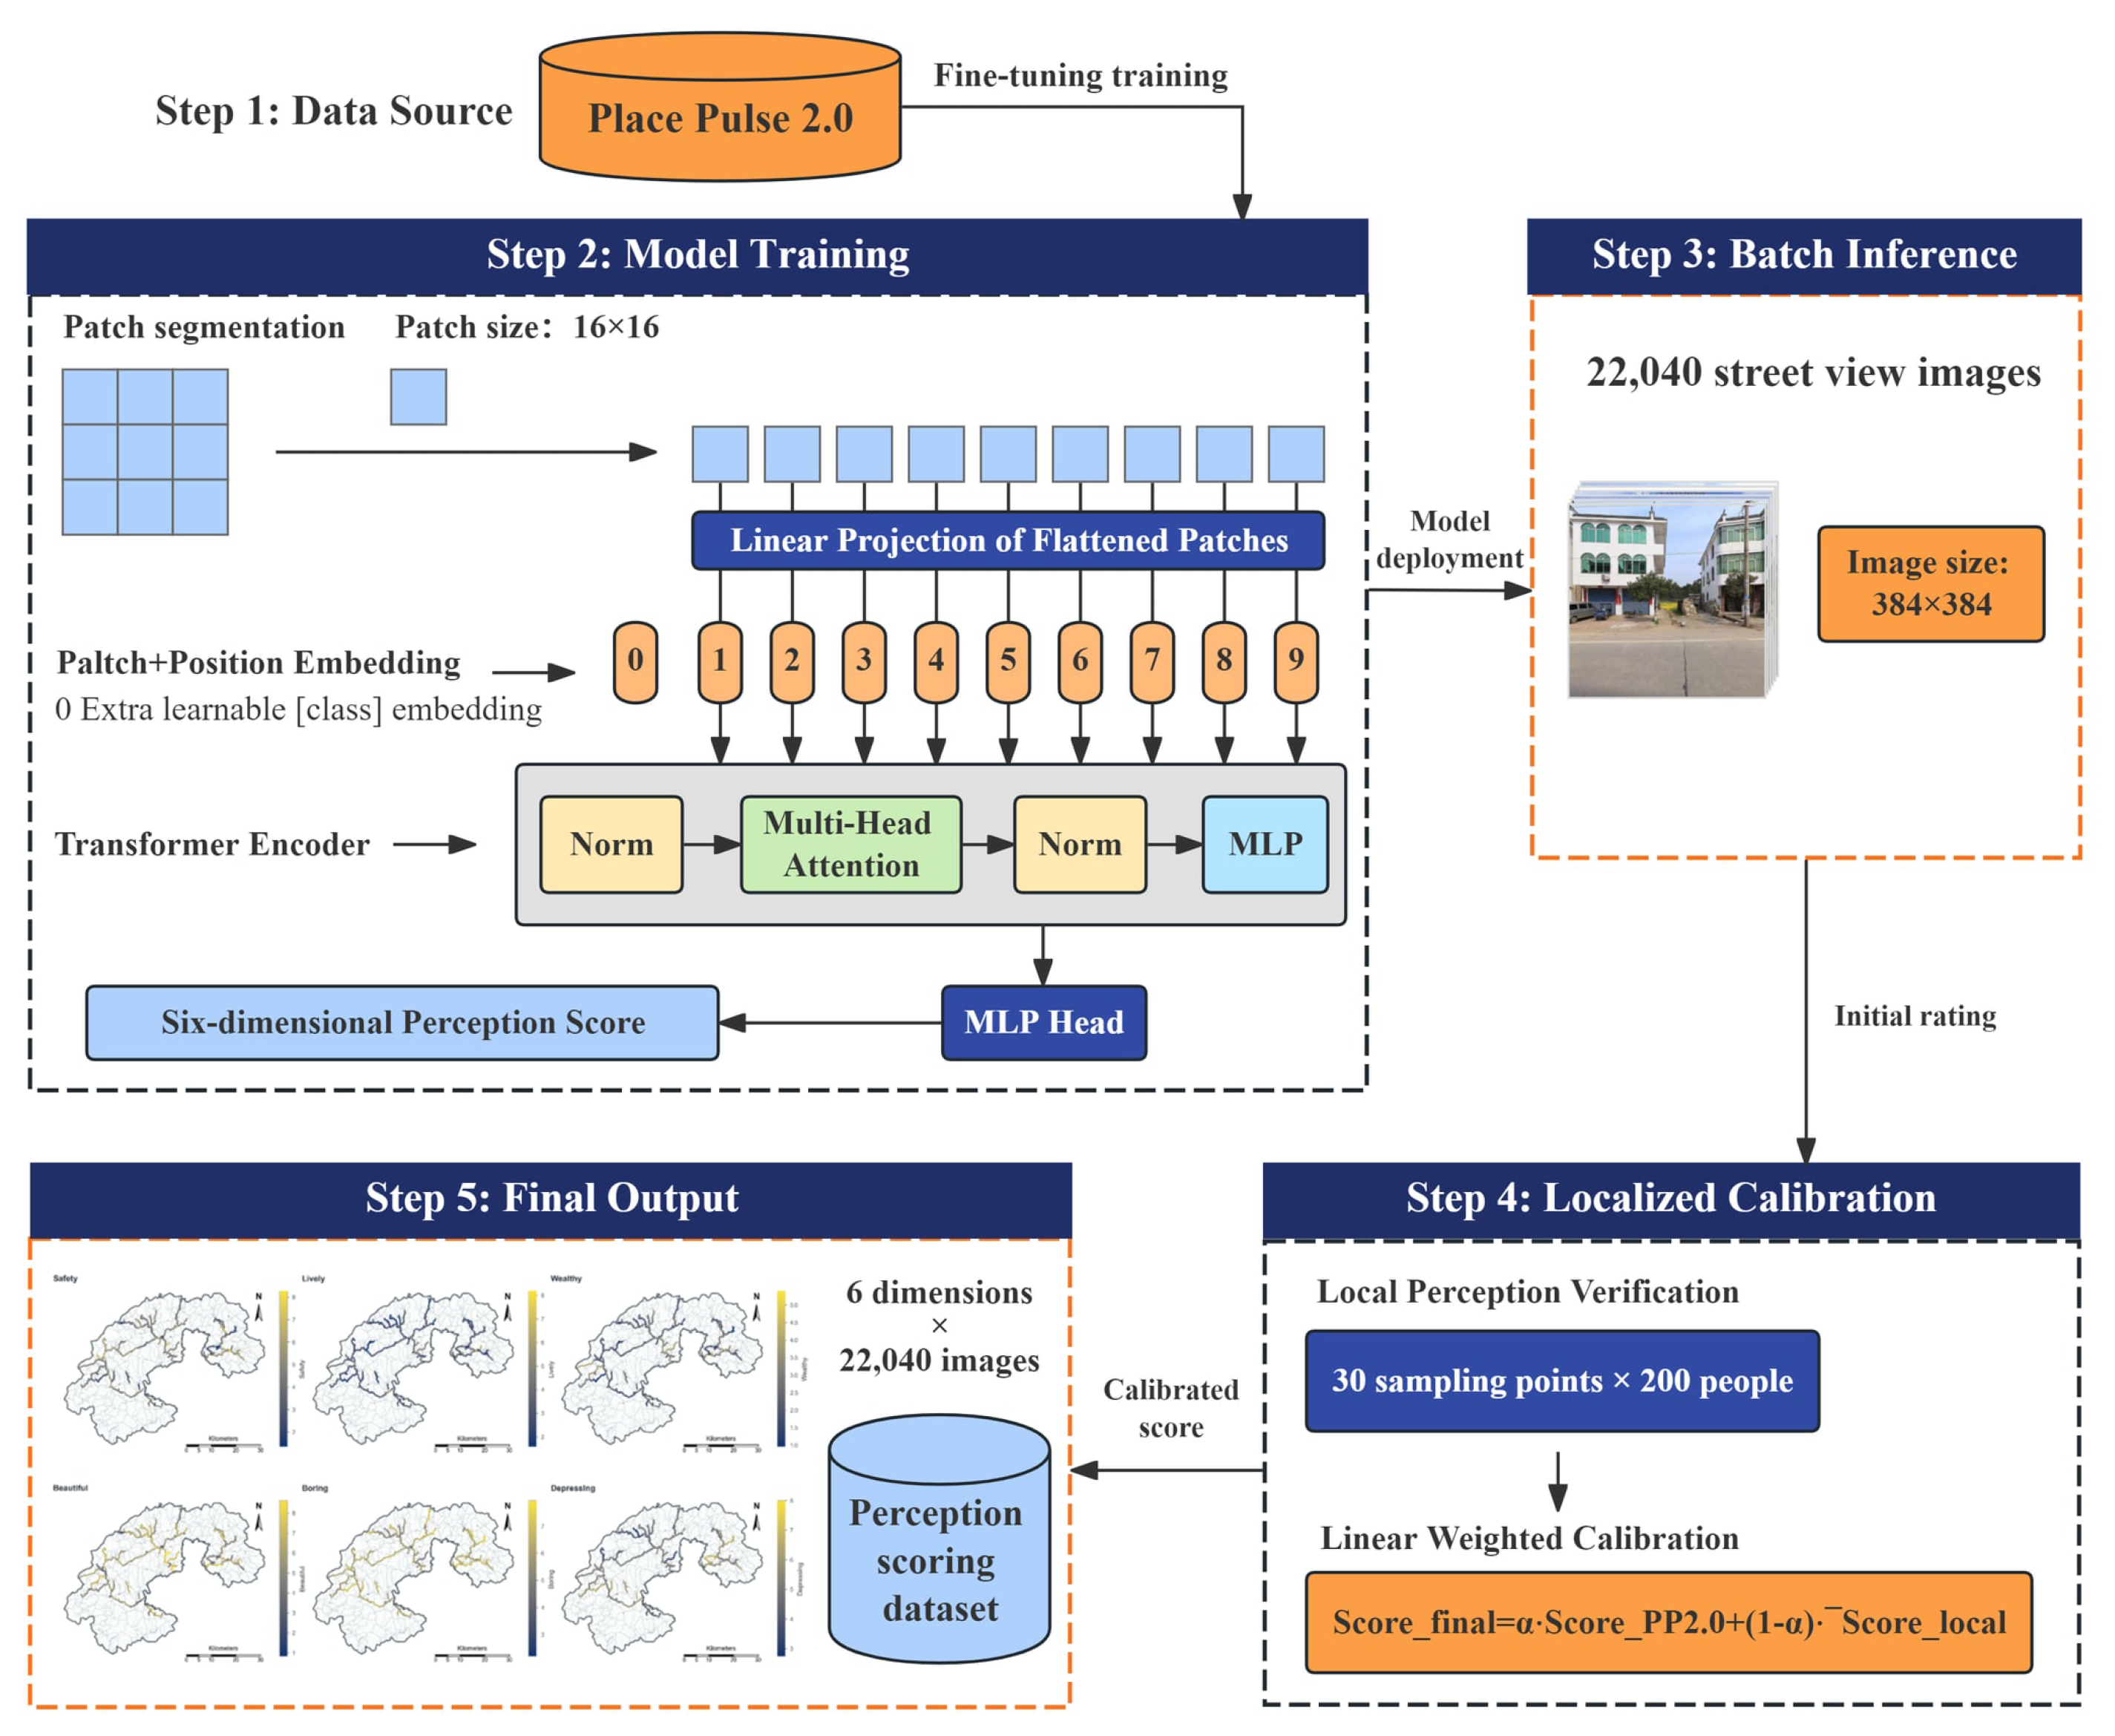
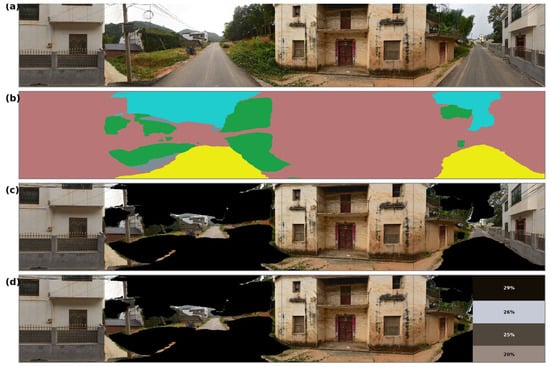
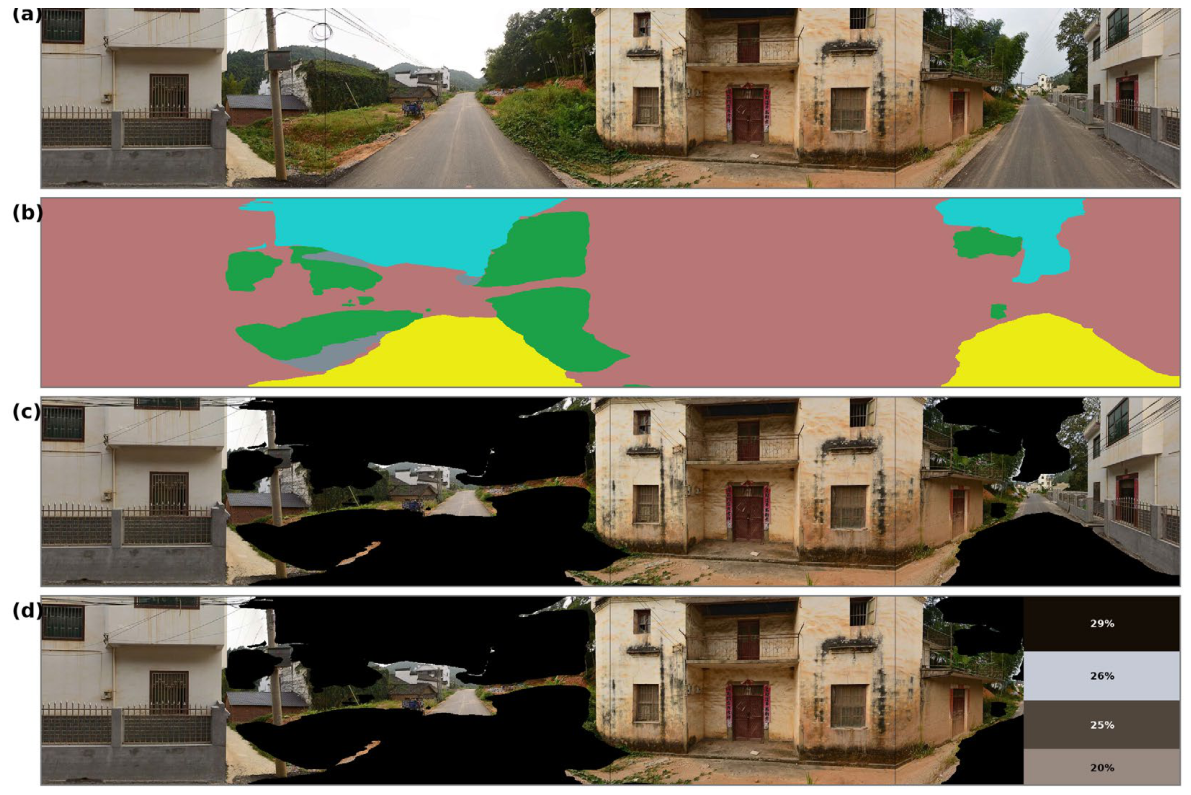
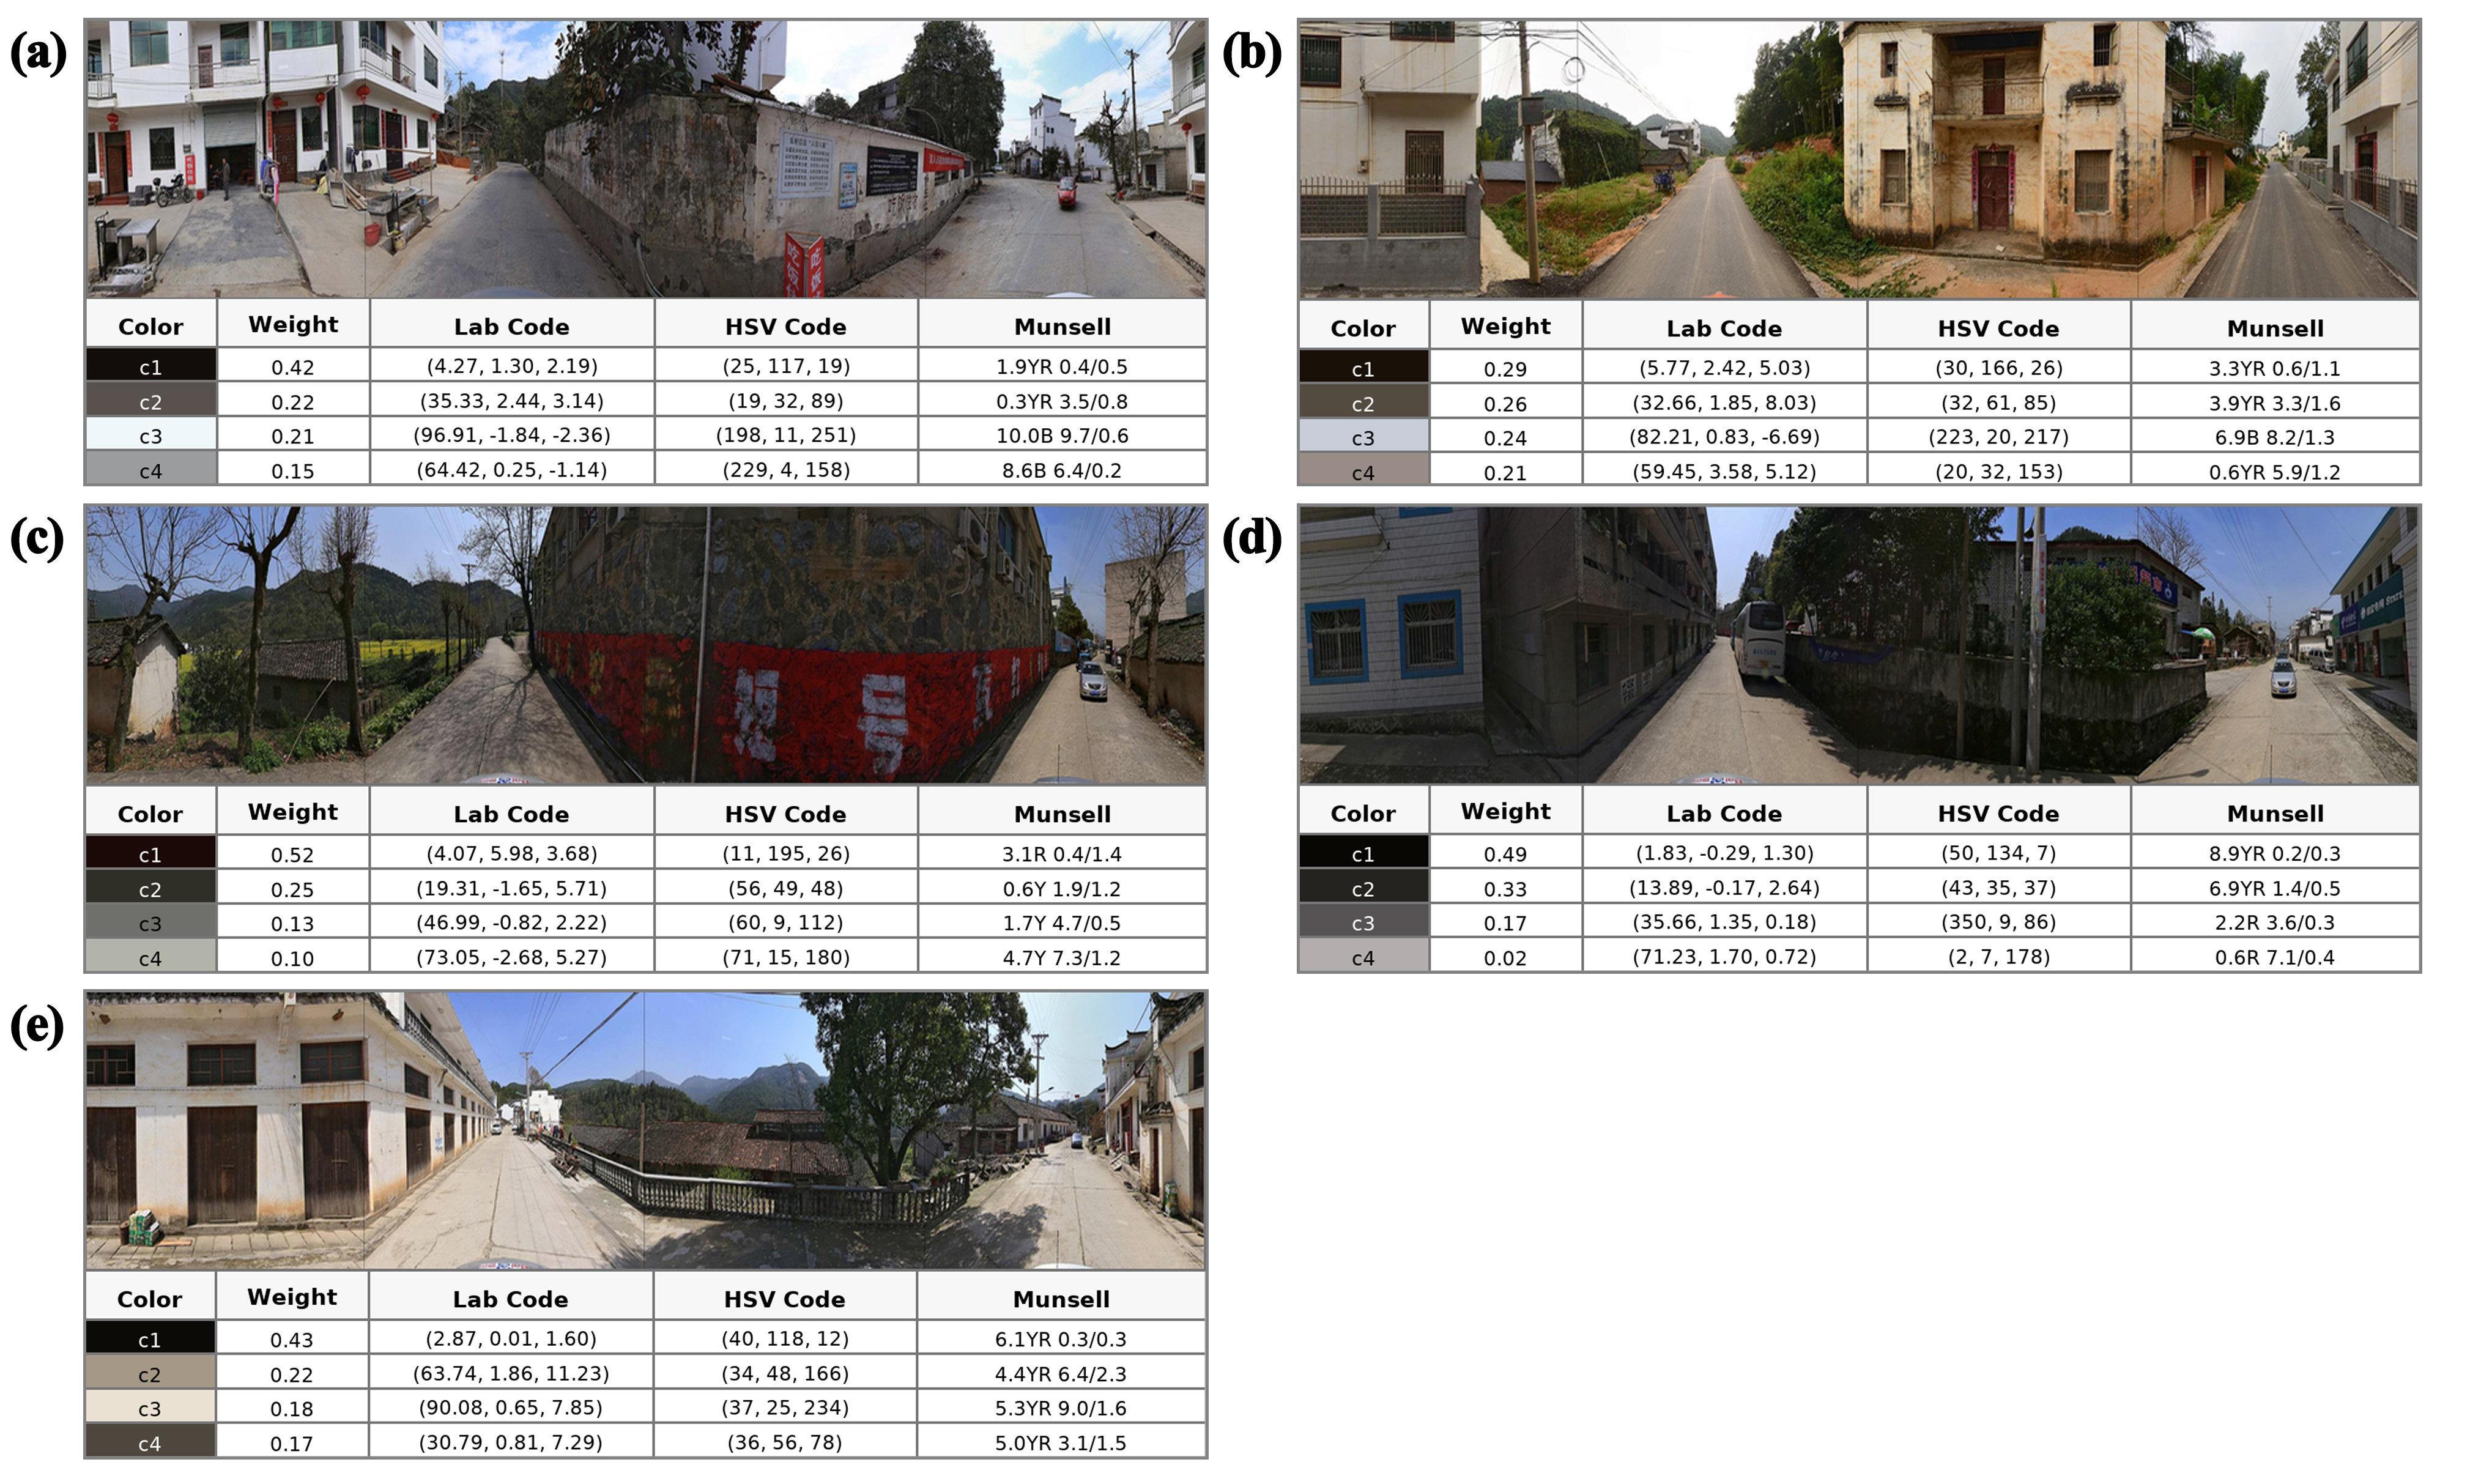
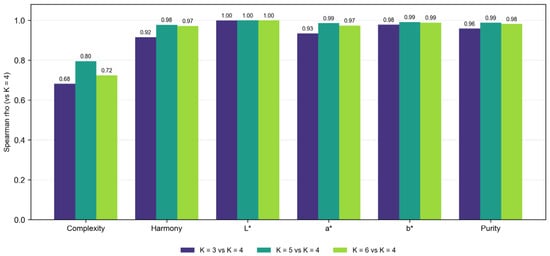
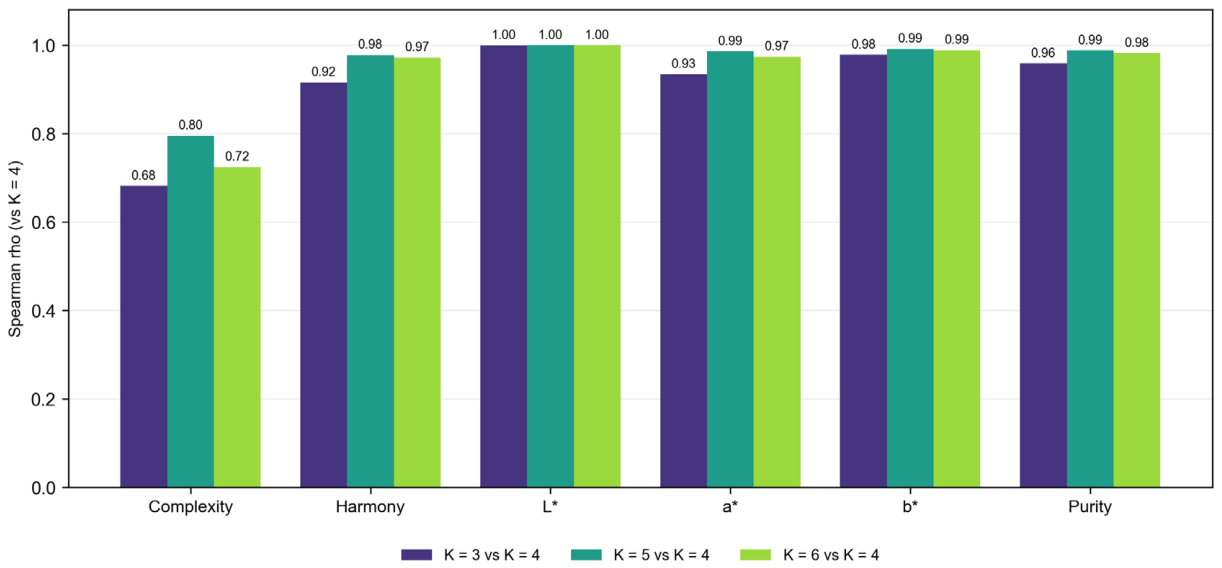
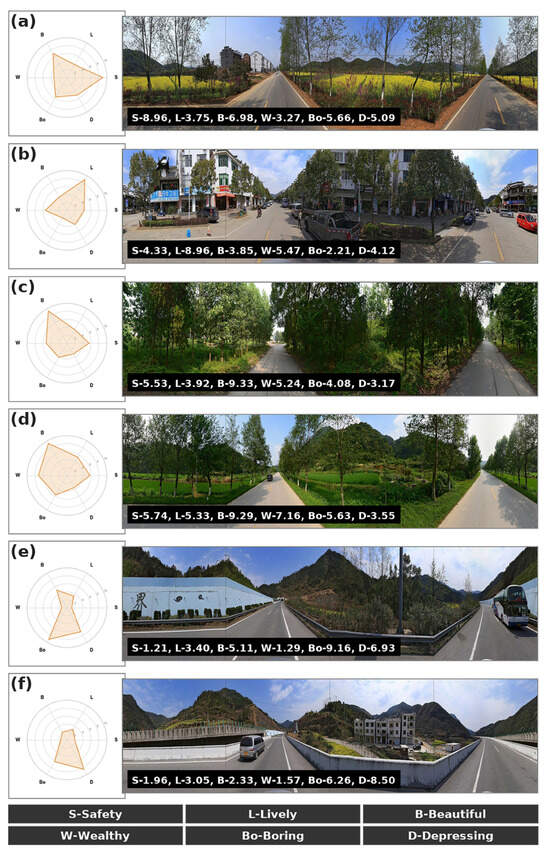
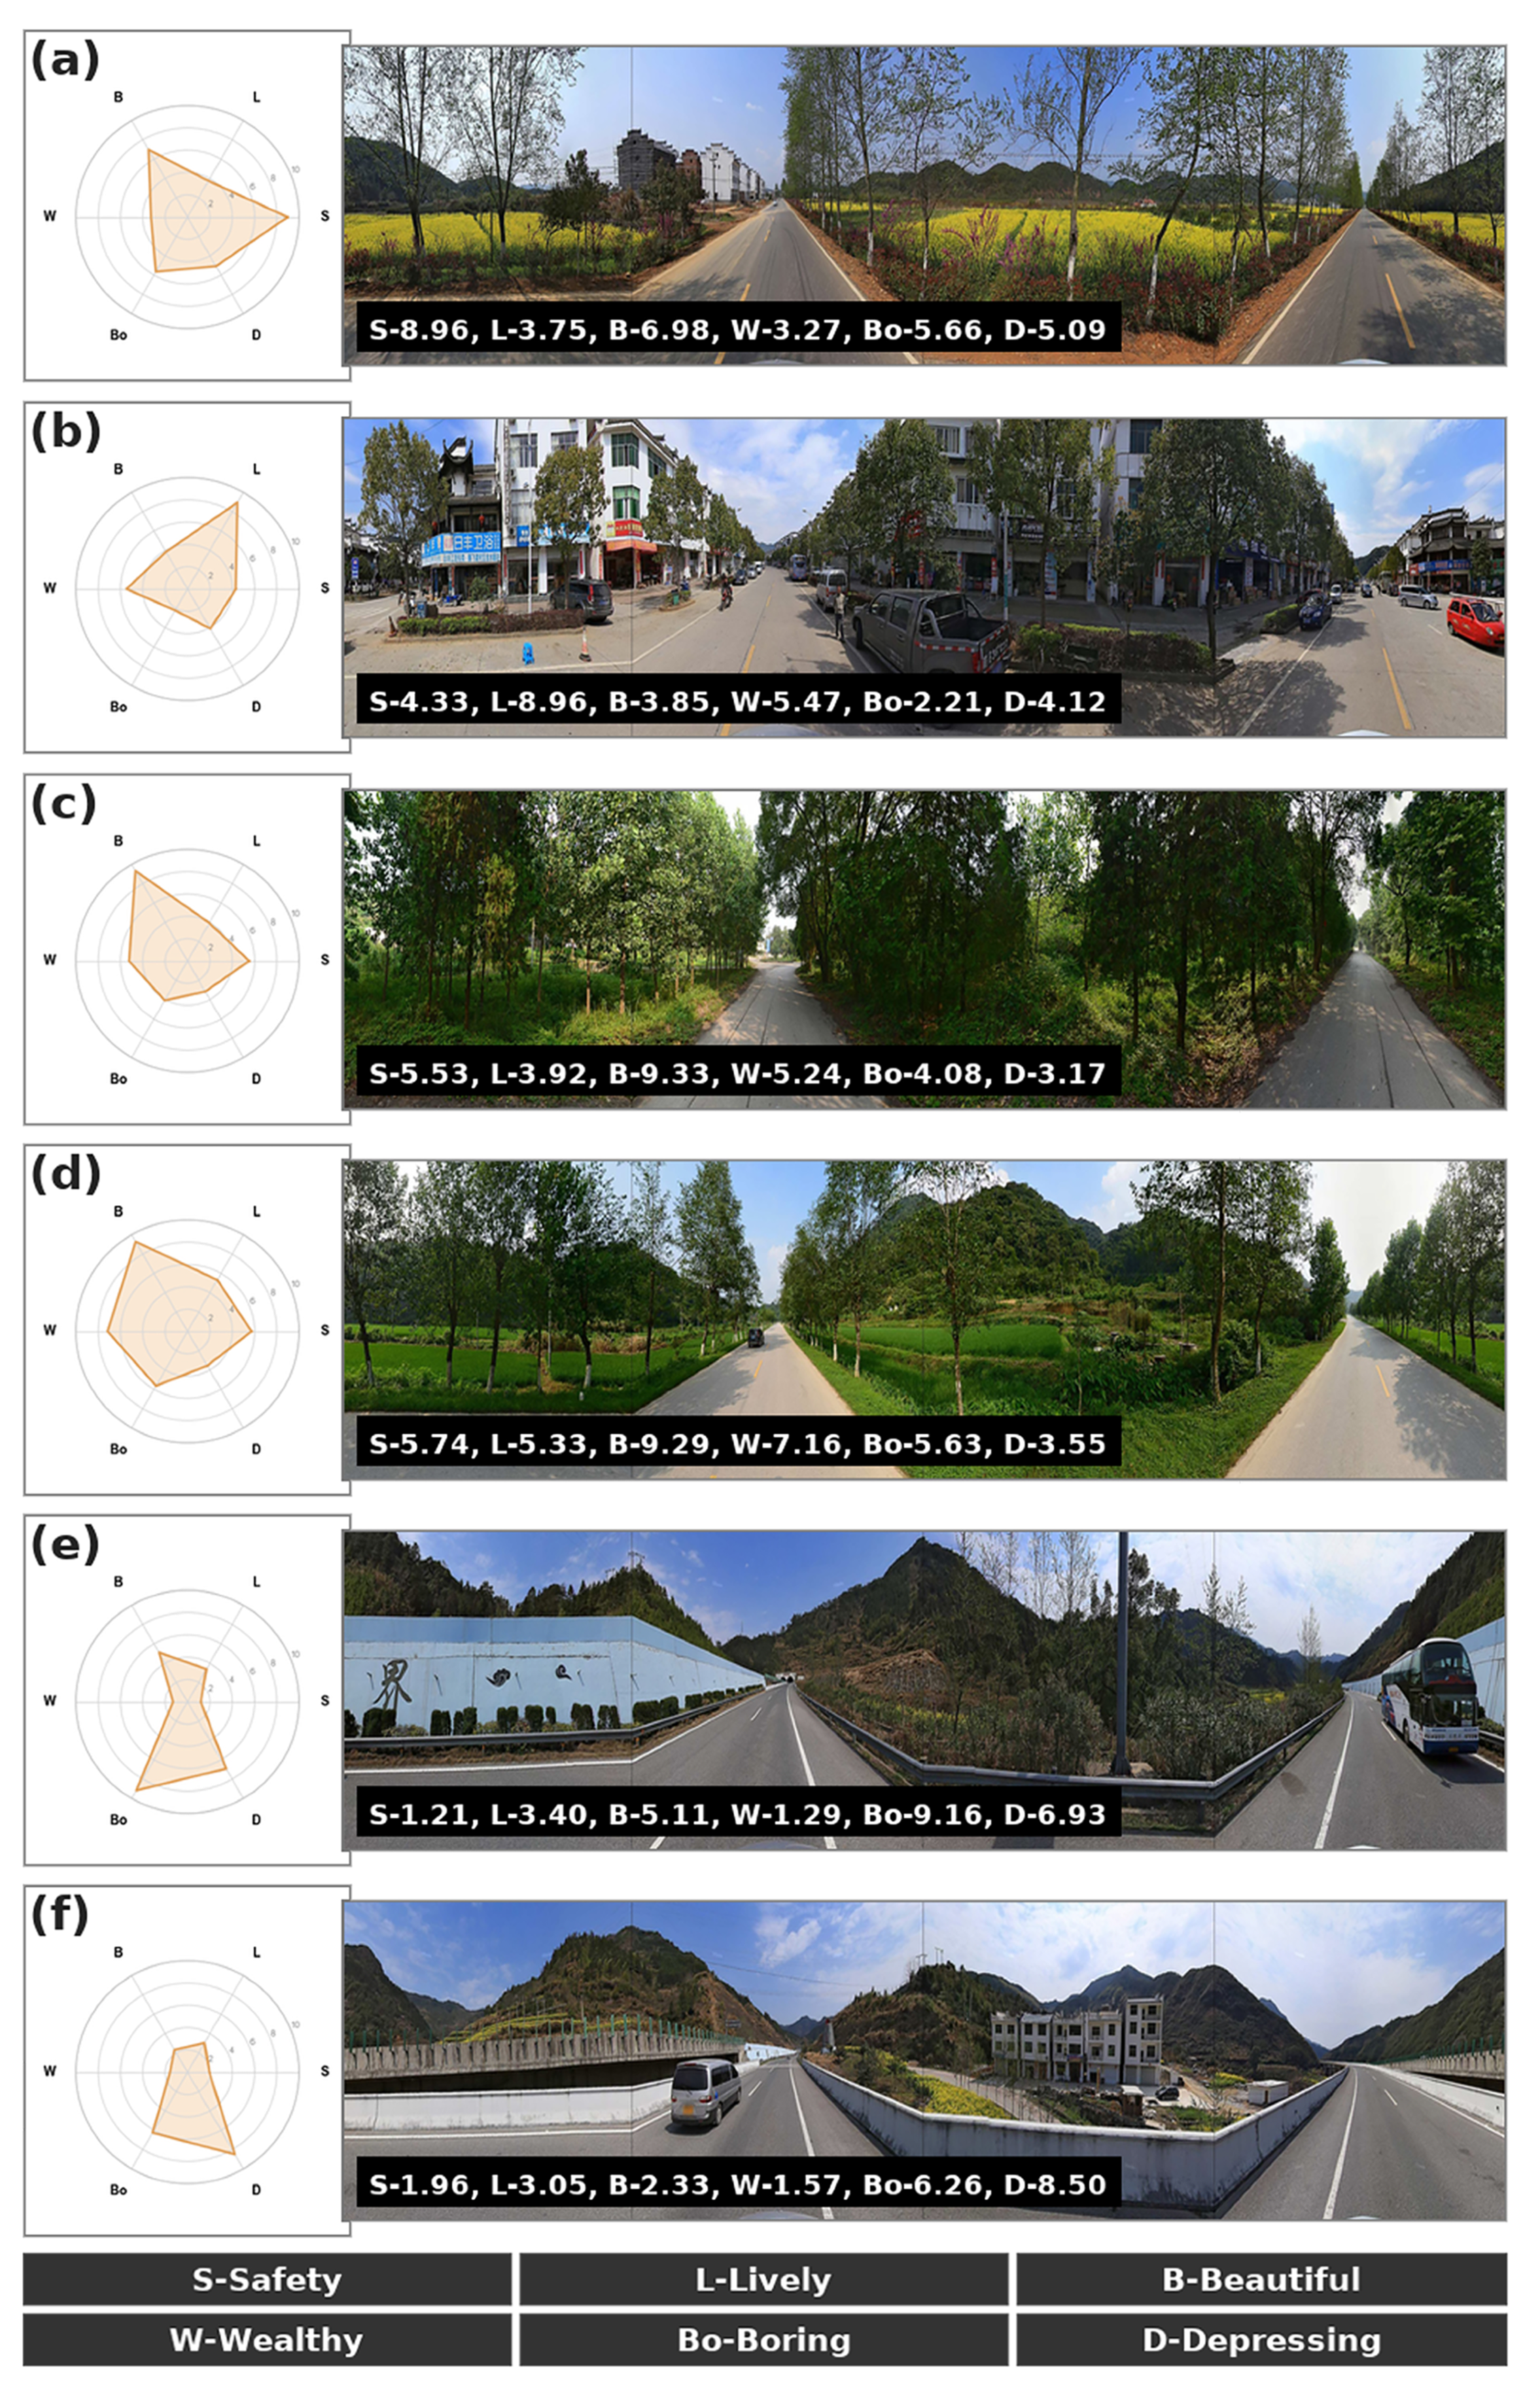
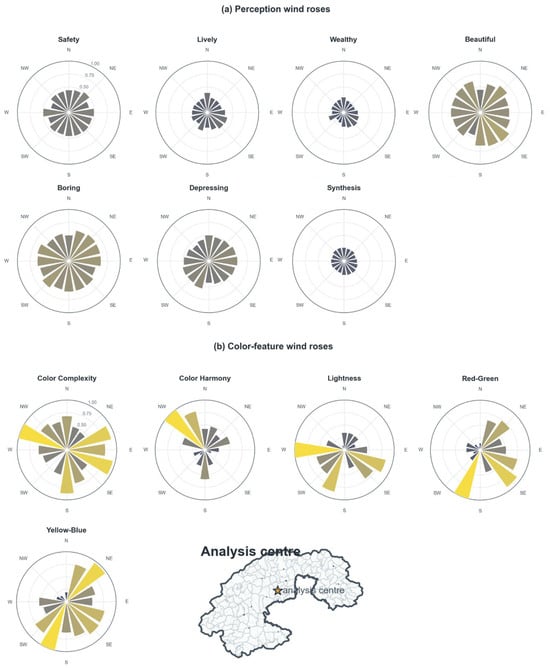
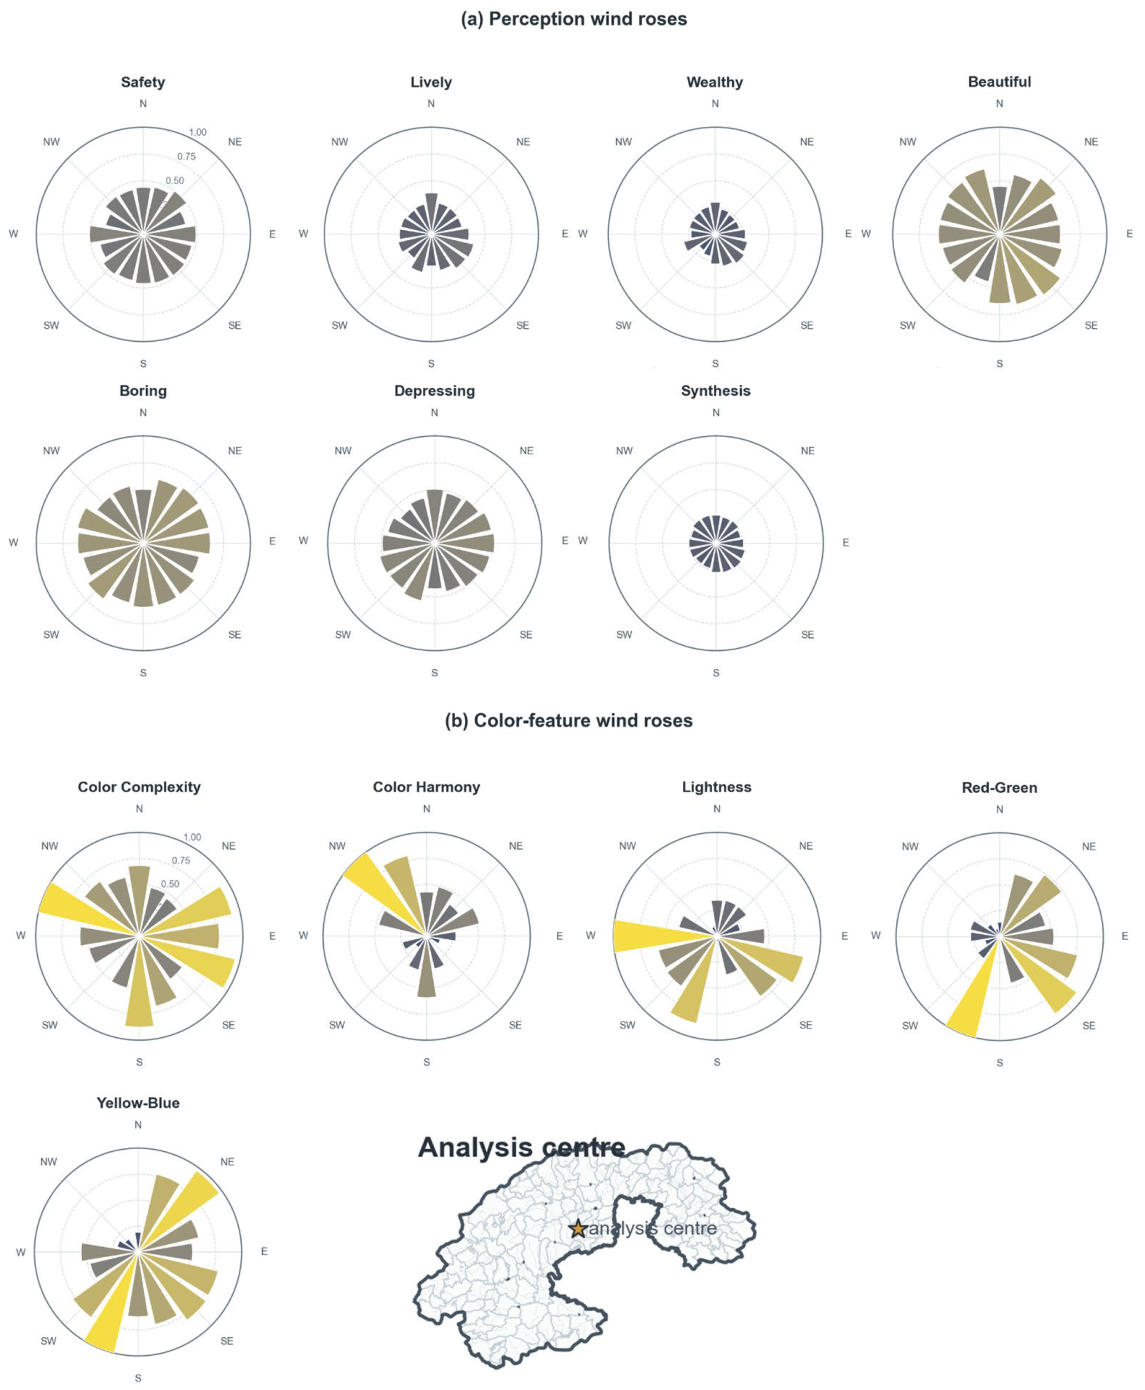
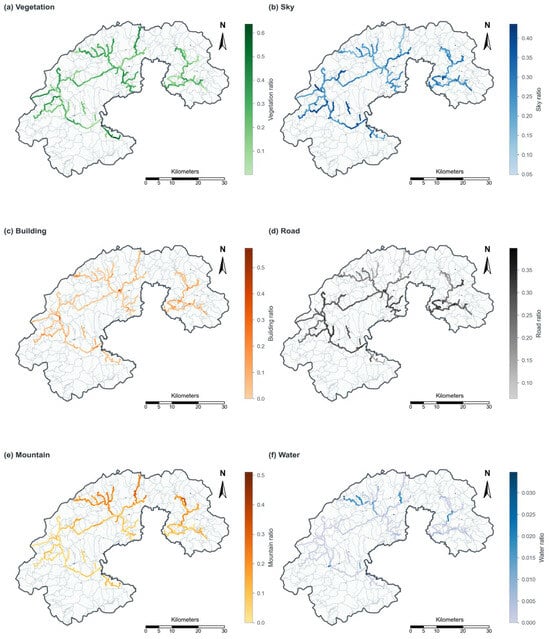
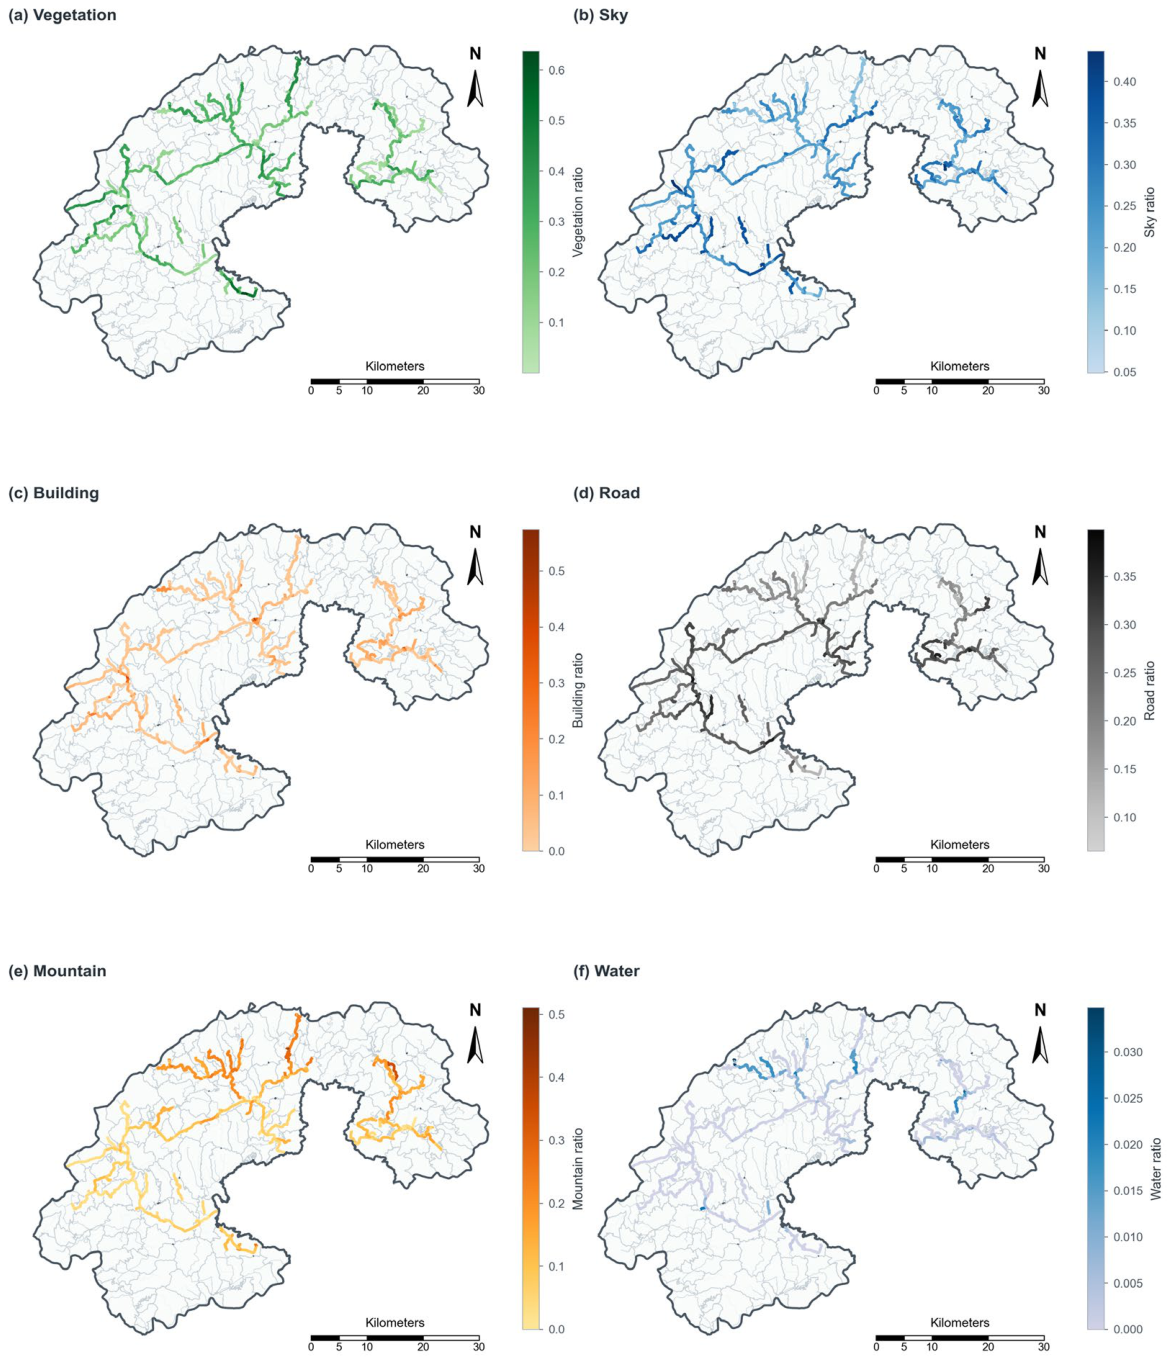
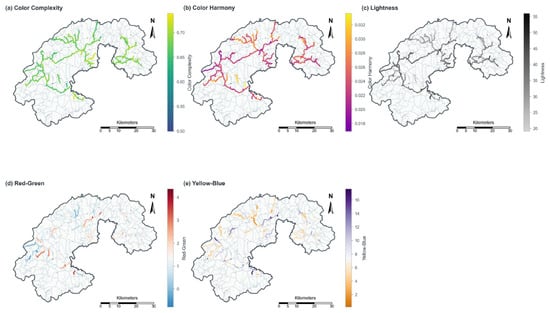
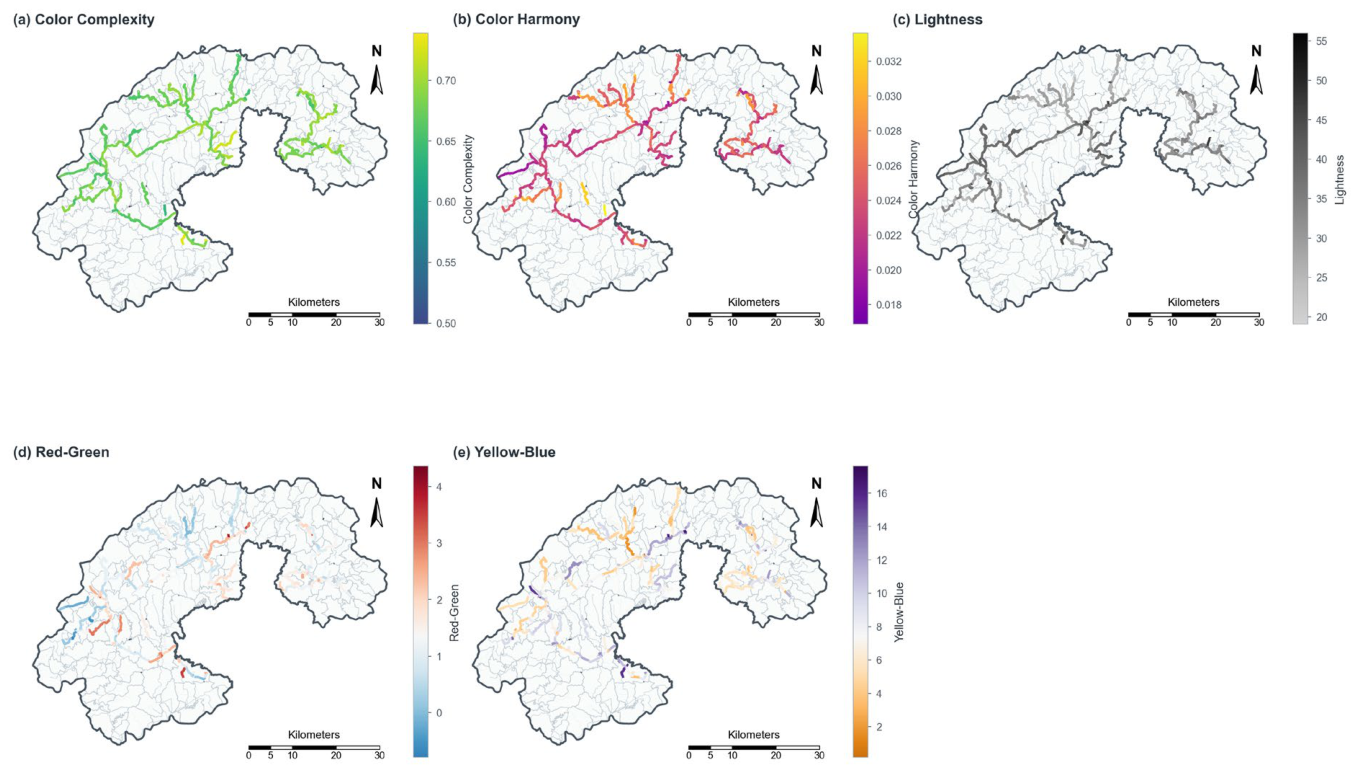
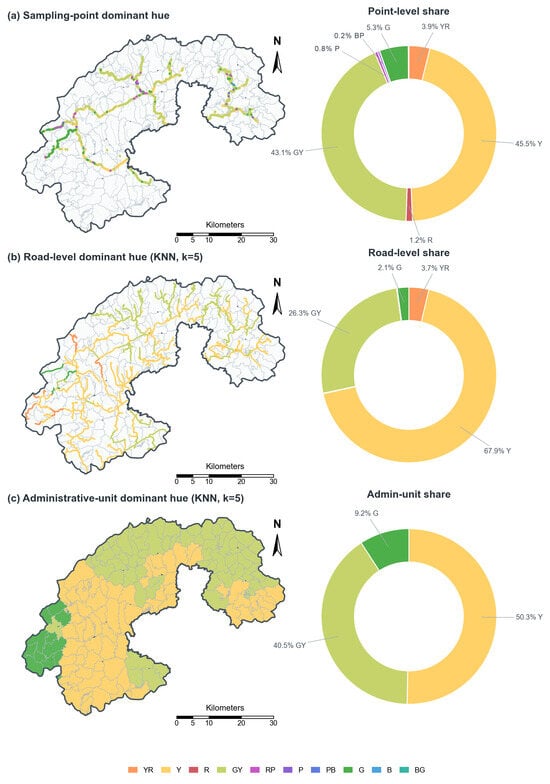
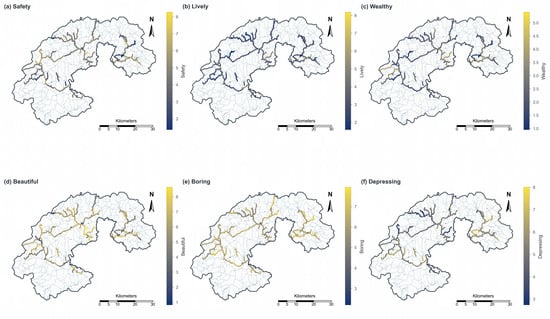
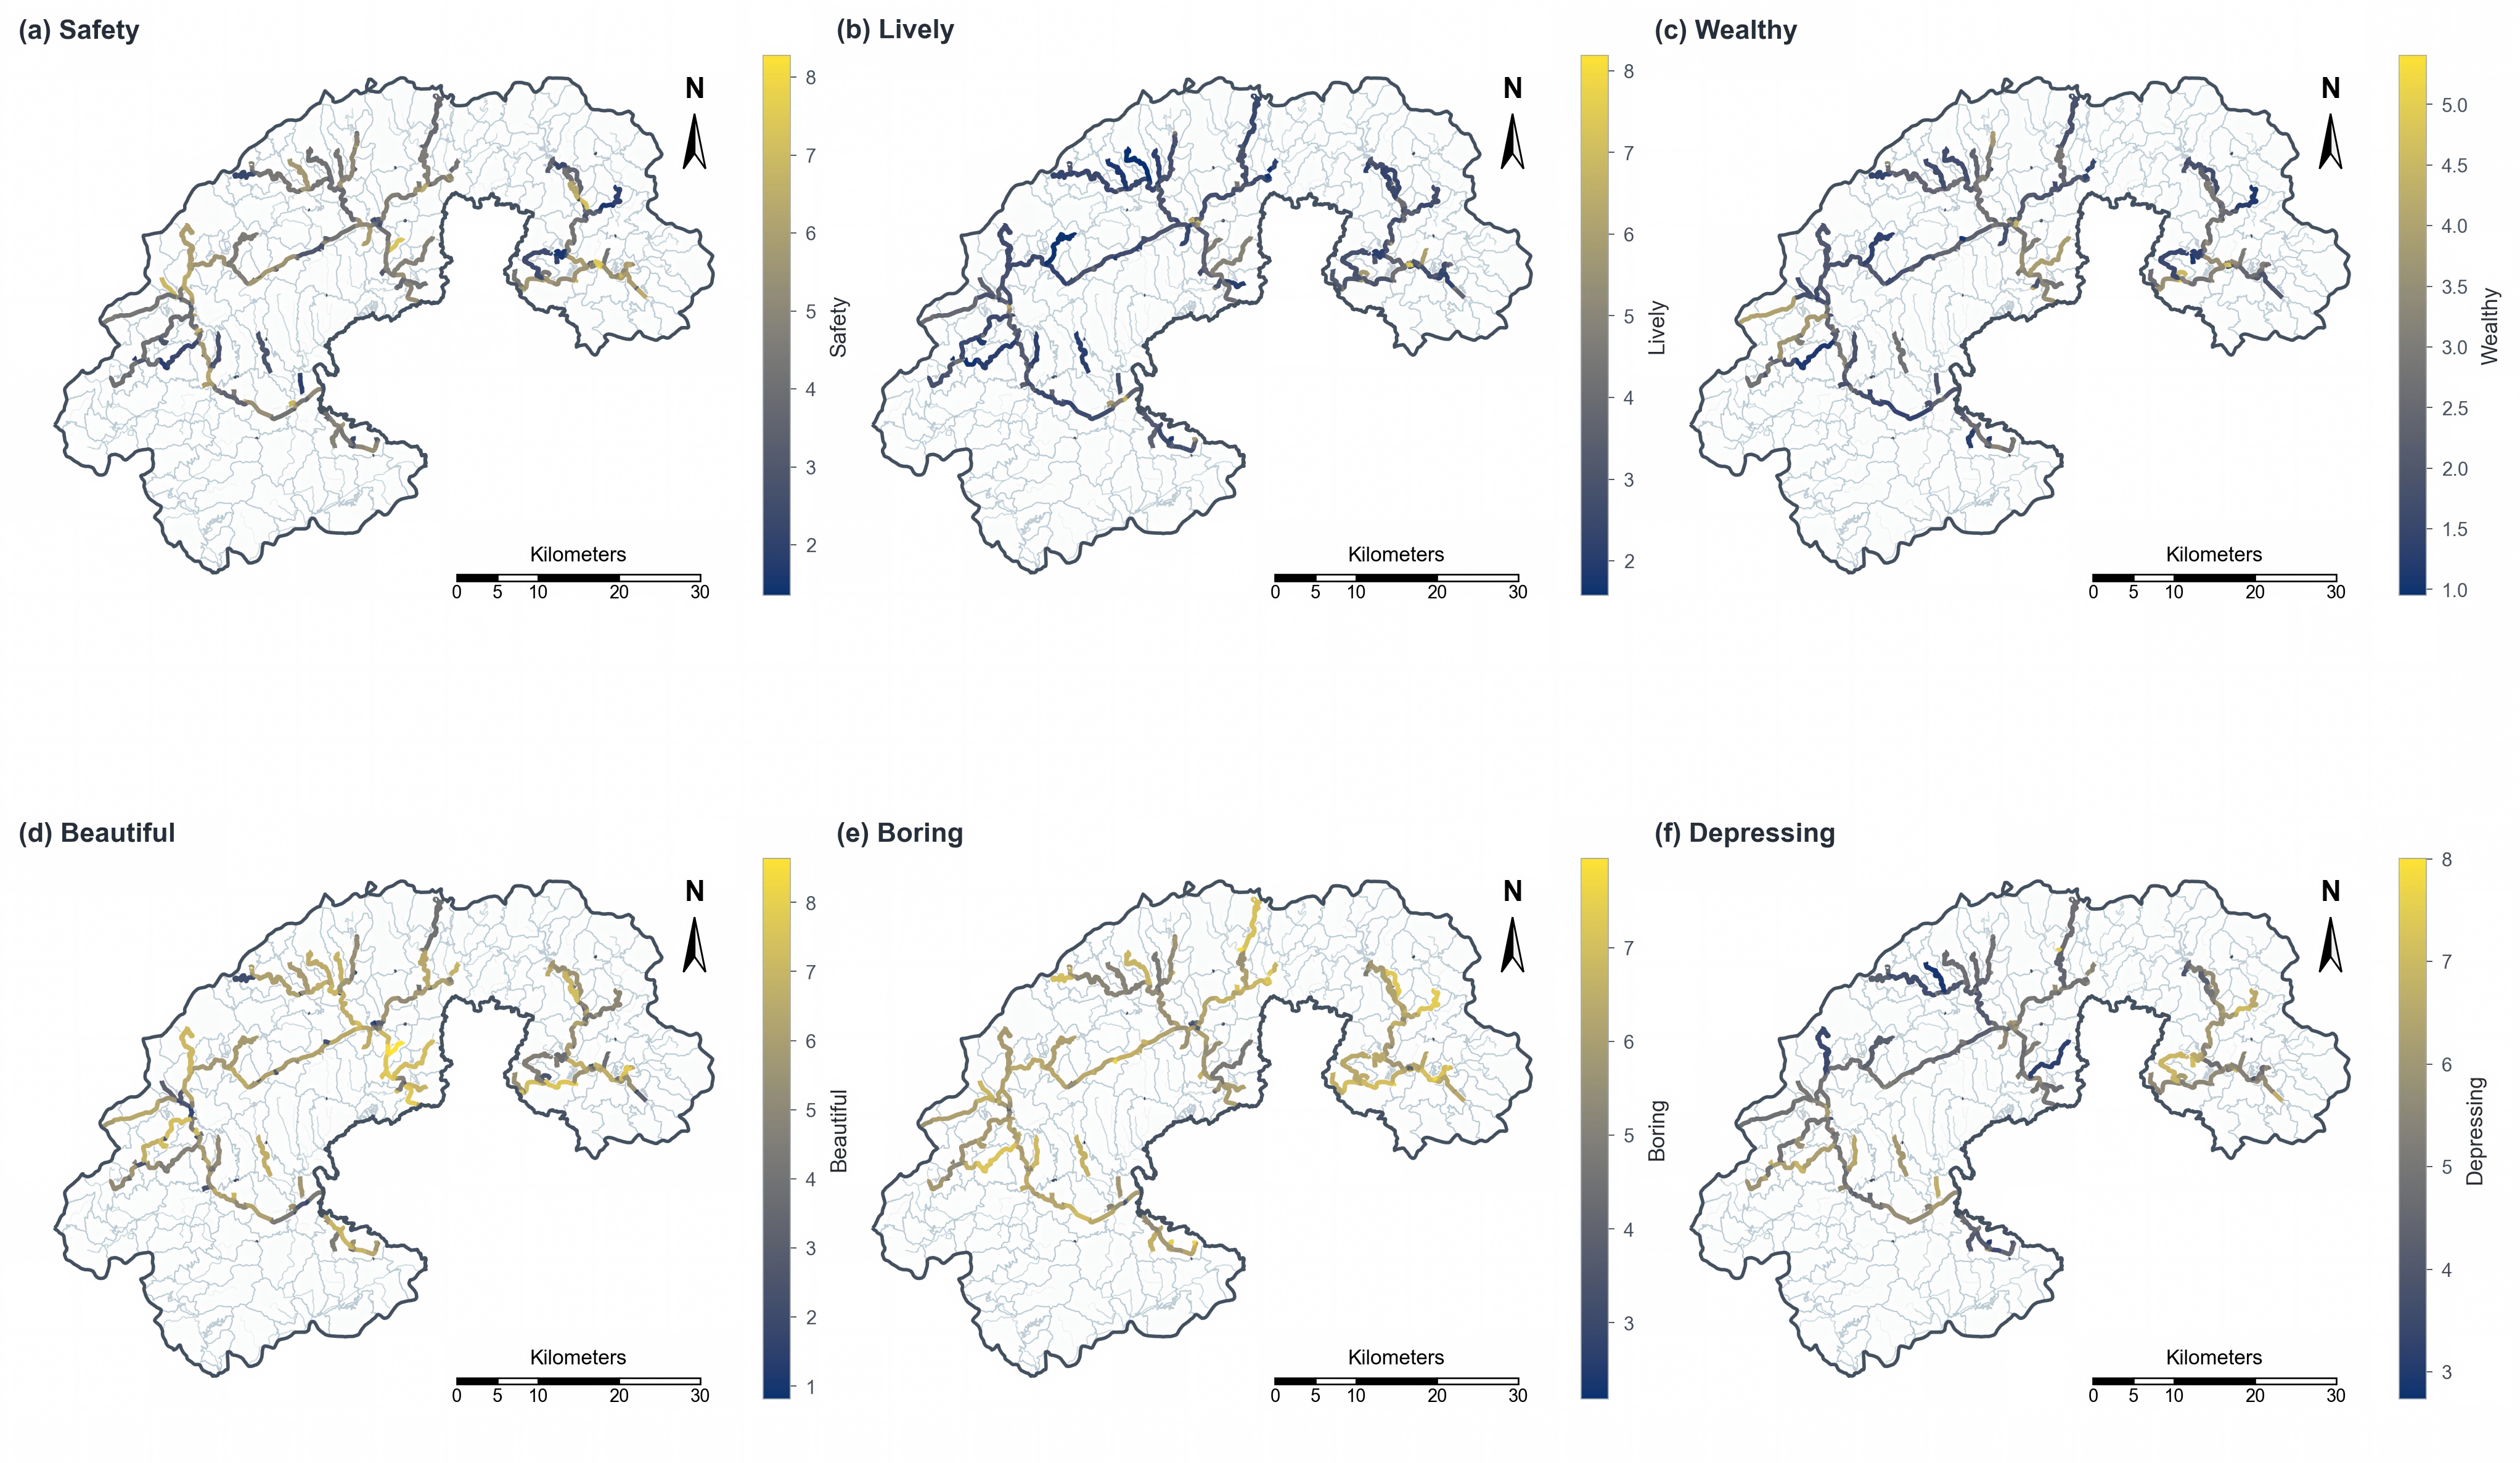
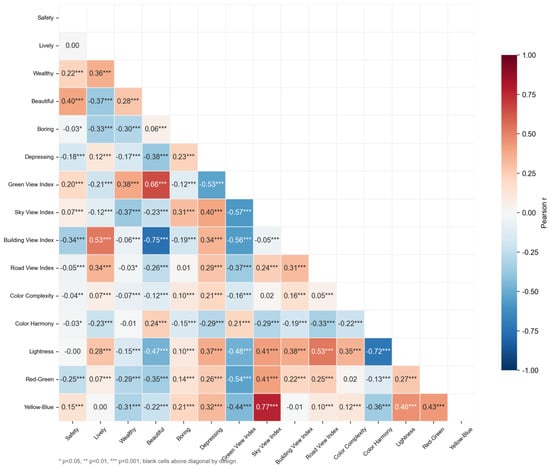

Disclaimer/Publisher’s Note: The statements, opinions and data contained in all publications are solely those of the individual author(s) and contributor(s) and not of MDPI and/or the editor(s). MDPI and/or the editor(s) disclaim responsibility for any injury to people or property resulting from any ideas, methods, instructions or products referred to in the content. |
© 2026 by the authors. Licensee MDPI, Basel, Switzerland. This article is an open access article distributed under the terms and conditions of the Creative Commons Attribution (CC BY) license.