


Abstract
The technological process map, a construction-specific form of the ASME flow process chart, records the works of a construction site in their technological sequence together with the transports, inspections, delays and storages that schedules omit. Although valued in teaching, it is rarely drawn in practice because it is slow to produce. This paper examines whether a general-purpose large language model can generate the map from tender documents that describe the product and its requirements rather than the construction process as a sequence, and whether the project documentation, the bill of quantities, or both are the input that determines the result. For ten road construction tenders of one public client, the same model generated a map three times, zero-shot, from each of these three inputs. An independent LLM agent matched the ninety maps step-by-step, and the differences between inputs were judged against the variation between repeated generations from the same input. Maps built from the bill of quantities were about 40% larger than maps built from the documentation alone, while adding the documentation to the bill changed the map only slightly more than two repeated generations from the same input differed. All measures are structural: they do not show whether the larger bill-based maps are more correct or merely longer, which is the subject of the expert validation that follows. Within these limits, and for one model and one client’s documents, the results identify the bill of quantities as the input to start from and provide the material for that validation.
1. Introduction
1.1. The Technological Process Map and Why It Is Rarely Used
Every construction schedule rests on a prior decision about technology and the logistics of conducting works on a construction site: which works have to be finished before others can start, where each material comes from and where excavated or dismantled material is taken to, which operations compete for the same construction machine and/or workers, and at which points the work must be inspected before it may continue. In the construction-technology tradition of Croatia and the wider region, this process logic is represented by a process map locally called “tehnološka karta” (construction process map), a technological process map of the works on a site. The map shows the works in their technological, spatial and logical sequence. The main flow of operations is the spine of the map, with side branches that bring materials from plants, warehouses and deposits (whether on-site or off-site) and return surplus or dismantled material back to them; inspection steps with a loop back to the preceding operation when the result fails; and storage and delay points between operations. Time is deliberately absent, as the sequence is carried by the links and not by dates or durations.
The notation is a construction-specific form of the flow process chart introduced in industrial engineering by Gilbreth and Gilbreth [1] and standardised by the ASME [2], with five categories of symbols: operation, transport, inspection, delay and storage. The related categories reappear in work study applied to construction [3], in the CYCLONE simulation language [4], in the flow view of lean construction theory [5], and in value stream mapping [6,7]. What the construction process map adds is the visibility of the steps that do not add value such as transport, waiting and storage. These are drawn with the same prominence as the operations that transform the material, so that their number and position can be counted, questioned and reduced. This also separates the map from the two documents planners use far more often. A work breakdown structure states what has to be built, not in which order, and does not contain transports, inspections, delays or storage. A schedule, on the other hand, adds durations, dates and resources to a list of activities, but its logic is usually reduced to finish-to-start links between value-adding activities, while the movement of material and the waiting between crews stays outside the model. The construction process map sits between the two: it takes the work packages from the scope and establishes the technological flow that the schedule then places in time.
Despite its didactic value, the map has remained mainly a teaching instrument. In Croatian practice it is drawn in courses on construction technology and organisation and occasionally in productivity studies. Contractors do not model them during tendering or in the preconstruction phases, nor do they keep it as a regular project document. The same content is distributed across method statements, inspection and test plans, site logistics plans and the schedule itself. The international literature confirms the Croatian experience, with the symbolic flow process chart appearing in construction education and in work-study research, not as a routine deliverable, and, within the searches described in Section 1.2, no peer-reviewed construction study was found in which it was the principal method. Process modelling in construction is dominated by BPMN, but the models are authored manually by an analyst in a modelling tool, from interviews and workshops [8,9] or by experts developing information delivery standards [10], rather than derived automatically from project documents, and the only automated route to an as-is model, process mining, needs event logs of adequate quality that contractors rarely have [11].
The reasons are practical rather than conceptual. Drawing the map is slow and expert-dependent: its author has to translate a description of the product (drawings, technical specifications, bill of quantities) into a technological and logistical sequence, including the transports, storage points and inspections that the documents state only item-by-item or not at all. There is no software support comparable to scheduling tools, no notation standardised outside the classroom and, if speaking with regard to international context, no established English term. The map is not a contractual deliverable, so under schedule pressure planners move from the bill of quantities straight to the bar chart, carrying the technological logic in their heads. The barrier to implementation would seem to be the cost of making the maps and not the lack of their value. If a usable first iteration of the map could be generated automatically from documentation that already exists for every construction contract, it would cost minutes instead of days and could be used wherever an explicit model of the technological flow helps: first in teaching, as it is even currently used as a draft that students create and discuss; then in practice, as a basis for method statements, machinery selection and the discrete-event simulation and estimation that need a structured process as input [7,12,13]; and finally in lean analysis, as the as-is model from which transports, delays and storage are counted and redesigned. Large language models (LLMs) have made such generation plausible in other fields. For AI-assisted planning the map has a further role: LLM scheduling studies go from a scope description straight to a schedule, and the errors they report (Section 1.2) are errors of technological logic that a schedule produced in one step does not expose, while a flow process chart makes that logic explicit, under rules strict enough to be checked, before a plan is derived from it. Whether LLMs can reconstruct the technology of construction works from documents that describe the product rather than the process, in the notation of the technological process map, is the question that this paper examines.
1.2. Related Work
Three streams of literature relate to this question, and they have so far developed largely separately. The first is process modelling with LLMs in business process management (BPM). Since 2023, LLMs have been shown to generate imperative and declarative process models from textual descriptions at a level comparable to specialised tools [14,15,16], and a benchmark of sixteen models reports model quality between 0.72 and 0.93 [17]. Among nine textual representations, Mermaid has been found the most suitable for LLM process modelling [18], confirming earlier evidence that GPT-4 produced more correct models with Mermaid than with Graphviz and that users preferred Mermaid, although over 70% of the Mermaid outputs contained syntax errors or extraneous content [15]. The input has since then moved from short curated descriptions to real documents: multimodal process documentation [19], heterogeneous enterprise content [20], the internal procedures of a construction-sector manufacturer [21], regulatory texts [22], procedural texts of infrastructure operators in Chinese [23] and medical guidelines [24]. The fidelity of generated models has been assessed by round-trip transformation [25], and their reliability by the variability of repeated generations [26]. None of this work concerns the technology of construction, and its inputs narrate or regulate a process, whereas construction documentation describes a product.
The second stream is process modelling in construction without LLMs. BPMN models of construction and of permitting processes [8,9,27], activity cycle diagrams and discrete-event simulation of road and asphalt operations [12,13,28], and value stream maps of road and bridge works [6,7,29] all produce models of construction flows, some in as-is and to-be versions, but manually, by modellers working from observation, interviews, archives and regulations. A line of pre-LLM natural language processing comes closest to our input: rule-based extraction of construction procedures from specifications achieved 97% precision and 93% recall [30]; a classification of bill-of-quantities items of national roads into work codes achieved accuracy of over 91% [31] and digitalisation of scope requirements from highway contracts [32]. Each automates one step with its own rules, ontology or labelled data; however, none produce a process model.
The third stream, LLMs in construction, is growing quickly but has not yet reached flow process modelling. Reviews of 142 studies [33], of LLMs in the AEC sector [34] and of generative AI in lean construction [35], together with a Delphi study that identified 76 potential generative AI applications across construction phases [36], report applications in safety, contracts, cost estimation, design and scheduling, but again, none report a generated process map, with the closest work being scheduling. Prieto et al. [37] showed that ChatGPT generates a tabular schedule with dependencies from a short typed description of a partition wall, without any documents; the outputs omitted steps and missed details such as curing time [34], which is precisely the kind of delay a construction process map makes explicit. Later work augments and generates WBS and schedule data with task dependencies from synthetic WBS data [38], automates the planning phase with agents and retrieval over regulations [39], and extracts planning logic from documents and drawings [40]; a Croatian study found that chatbots perform planning tasks reliably only in the hands of an experienced user [41]. LLMs do read real contract documents, but do so to produce submittal registers [42] or contractual delay provisions [43]. Additional previous work used LLMs on Croatian tender documentation to identify project risks [44] and construction site documentation to support work standardisation [45]. The only identified research specific to the topic was the previous exploratory study by the authors of this paper in which we asked an earlier model, by zero-shot prompting, to list the works of a road project and their general order [46]. That study established that the task is feasible, while the present study asks which input is sufficient, how reproducible the result is and where the model departs from the documents.
To our knowledge, and within the searches described below, no published study has evaluated how a general-purpose LLM converts real construction tender documentation into technological process maps (flow process charts) of construction works. This statement is based on searches of Scopus, Web of Science Core Collection, ScienceDirect, Google Scholar, ASCE Library, IEEE Xplore, ACM Digital Library, Taylor & Francis Online, Wiley Online Library, Lens.org, arXiv and Hrčak, complemented by forward citation tracking of key studies in OpenAlex (12 October 2026). Unlike schedules and WBS/CPM structures, a flow process chart explicitly represents transport, inspection, delay and storage steps; these non-value-adding steps are what make lean analysis possible.
1.3. Aim, Research Questions and Contributions
The aim of this paper is to establish, within one model and at one point in time, how the construction process map that a general-purpose LLM generates depends on which part of the tender documentation it is given. For each of ten road construction and reconstruction tenders of one public client, Hrvatske ceste (Croatian Roads), published in the Croatian electronic public procurement system (EOJN RH) in 2025–2026 under the same General Technical Conditions, the same model (Claude Opus 5.5, Anthropic, San Francisco, CA, USA) generated a map three times from each of three inputs: the project documentation only (A), the bill of quantities only (B) and both documents together (C). Both documents describe the required product, its quantities and requirements; neither presents the construction process as a sequence, although the bill of quantities can name transports, depots and tests item-by-item. The model received only the five step types of the ASME flow process chart and the output format, not the rules by which the technological process map is taught, and every generation ran in a fresh, isolated context. The ninety maps were matched step-by-step by an independent LLM agent into union maps, from which structural measures were computed: size and composition, agreement between input variants, stability between repetitions of the same input, compliance with the rules of the map, and traceability of each step to the passage or item it cites. The expectation stated before the runs was that the combined input would produce the most complete map; the question was whether the three inputs differ at all, and by more than repeated runs of the same input do.
The study addresses four research questions:
- RQ1. Does the input—the project documentation, the bill of quantities or both—change the size, composition and content of the generated map, and is that change larger than the difference between repeated generations from the same input?
- RQ2. How reproducible is a zero-shot map: which steps and which predecessor relations recur when the same input is generated again?
- RQ3. Does the model reconstruct the conventions of the technological process map that it was not given, such as a drawn source or destination for every transported material and a single technological start, and does this depend on the input?
- RQ4. To what extent are the generated steps anchored in the documents, and which parts of the map—which step types—does the model supply from general knowledge?
The contributions are, to our knowledge, the first evaluation of LLM-generated technological process maps of construction works from real tender documentation; a within-subject ablation of the input source with three repetitions per input, in which the variation between repetitions is the reference for the effect of the input; a comparison procedure in which an independent LLM agent matches equivalent steps across maps, with the reproducibility of the matching itself measured; automatic checks of the structural rules and a step-level record of the sources the model cites, which separates what the model attributes to the documents from what it marks as supplied by itself; and the union maps and validation sheets for the expert assessment of correctness in the next phase, published with the prompts, protocol, maps and scripts as Supplementary Material.
2. Materials and Methods
2.1. Research Design
Our previous study [46] used zero-shot prompting with a different LLM (GPT-5.5) to determine whether an LLM can read project documentation and tell the user which works are to be carried out and in what general order. A replication with an example-augmented condition was initially planned as a first step of the current research, but a pilot run showed that a zero-shot map from the current model is of a different order of quality than the earlier results, so that any comparison across models and dates would have confounded the method with the model. The design was therefore changed, before any production run, to a controlled comparison within one model and one point in time.
The study is a within-subject ablation of the input source. For each of ten road construction tenders, the same LLM generated a technological process map three times from each of three inputs: (A) the project documentation only, (B) the bill of quantities only, and (C) both documents together. Every generation ran in a fresh, isolated model context, so that no map could influence another. The nine maps per tender were then compared by an independent LLM agent that matched equivalent steps across maps and produced, for each tender, a union map in which every step is marked by the variants that contain it. From these unions we computed structural measures of size, composition, agreement between variants, stability between repetitions of the same input, compliance with the rules of the notation and traceability of steps to the documents. Three repetitions were included so that the difference between variants could be judged against the difference between repeated runs of the same input, which is the noise floor of a stochastic generator. The unit of analysis is the tender (n = 10); variants and repetitions are within-tender factors.
All measures reported here are structural, that is, computed from the maps themselves without a human judgement of correctness. Agreement between maps is not a measure of their correctness: three maps may agree on a wrong step, and a step present in only one map may be the one that is right. The correctness of the generated steps is assessed in the next phase of the research by independent domain experts, using the union maps and step-level validation sheets produced here. That following phase is described in Section 2.6 only to the extent needed to understand the outputs. The expectation stated before the runs was that variant C would be the most complete; the question addressed here is whether, and by how much, the three inputs lead to structurally different maps, and whether that difference exceeds the variation between repetitions. Figure 1 summarises the workflow.
Figure 1.
Workflow of the study. Ten tenders of one client supply two documents each; both are converted to text once. The boxes correspond to Section 2.2, Section 2.3, Section 2.4, Section 2.5, Section 2.6 and Section 2.7; the dashed box is the expert validation of the next phase, which is not reported here.
2.2. Case Selection and Documents
Road projects were chosen because of their relatively small number of individual work types, which allows a relatively simple abstraction, and because road works are dominated by the transport of soil, aggregate and asphalt between plants, depots and work areas, so that the side branches of the map, which a schedule does not represent, carry a large part of the cost. To standardise the sample, only projects of one public client were used: Hrvatske ceste d.o.o. (Croatian Roads), the state-owned company responsible for state roads in Croatia, whose General Technical Conditions (Opći tehnički uvjeti, OTU) [47] and standardised structure of bills of quantities apply to all of its projects. The current OTU came into force on 1 January 2025, so the sample was restricted to procurement procedures published after that date, to minimise the influence of external variables.
Procedures were identified in the Croatian electronic public procurement notice board (EOJN RH) on 12 October 2026 (filters used: contracting authority Hrvatske ceste, works, published from 1 January 2025). Of 55 procedures for the construction and reconstruction of roads, junctions and bridges, the estimated values without VAT were strongly right-skewed (median EUR 1.40 million, IQR 0.68–3.75 million, eight outliers above 8.35 million), and procedures around the median were almost exclusively junctions and roundabouts. Two criteria were therefore applied: the subject had to be a road section rather than a junction or a bridge, and the estimated value had to be large enough for a substantial scope of works but below the outliers. Fifteen procedures met both criteria (EUR 2.05–7.64 million).
The final sample of ten tenders (Table 1) was fixed before any production run. Two of the fifteen were excluded for technical reasons: in one, the extracted documentation text exceeded 1.6 million characters, beyond what one model call could read in full; in another, the main technical text was available only as scanned images. Out of the remaining thirteen, the ten with highest estimated procurement values were chosen for the research. For each tender two documents were used. The project documentation is the textual part of the design documentation published with the tender—the technical description and the technical specifications (technical conditions) of the works, with the reports published alongside them; drawings, tender instructions, forms, the draft contract and correspondence were not used. The bill of quantities is the client’s priced-items workbook published without prices. Both documents describe the required product, its quantities and requirements; neither presents the construction process as a sequence. The documents were used as published: neither their technical accuracy nor the consistency between the project documentation and the bill of quantities (for example, whether every work described in one has a counterpart of the same scope in the other) was verified, so minor discrepancies between the two documents may have contributed to the differences between the input variants.
Table 1.
The ten tenders in the sample (canonical identifiers P01–P10 used throughout the paper). Text sizes refer to the extracted inputs (Section 2.4); BoQ items are priced items as listed by the extraction described in Section 2.6.
2.3. Notation and Rules of the Technological Process Map
The ASME flow process chart [2] was used to model the construction process. The chart records every step of a process as exactly one of five types: operation (a step that changes the material or the structure), transport (movement of material, equipment or an element), inspection (a check whose outcome decides whether the process continues or a step is repeated), delay (waiting imposed by the process, such as curing) and storage (material held in a plant, warehouse, depot or stockpile). Time is not represented; the sequence is carried only by the links between steps. Figure 2 shows the symbols of the five types and a fragment of a map: the main flow of works on the structure runs vertically, the delivery of a material joins it as a side branch that starts at the material’s source, and an inspection returns to the operation that has to be repeated when the result is not acceptable. The only information given to the LLM about the notation was this definition of the five step types and the output format described in Section 2.5. The rules by which the technological process map is taught and assessed are as follows: one main flow of works on the structure with deliveries and removals as side branches; every material brought to the site has a source drawn as a storage (concrete plant, asphalt plant, depot, yard) and every excavated material a destination; works that share a machine do not run in parallel; and the flow has a single technological start. These are conventions of the notation as it is taught, not requirements of construction technology: a direct cut-to-fill haul or several parallel work fronts can be technologically sound and still depart from them, so compliance with them measures adherence to the convention, not the correctness of the process. The rule on shared machines could not be checked, because the output format does not assign machines or crews to steps. The conventions were deliberately not given to the model. The return link of every inspection to the step that is repeated when the result is not acceptable was, by contrast, part of the required output format, so its presence tests adherence to the format rather than reconstruction of a convention. Whether the model reconstructs the withheld conventions from the documents and its own knowledge of road construction is one of the things the structural measures test (Section 2.7).
Figure 2.
Notation of the technological process map: (a) the five step types and their symbols; (b) fragment of a map for an asphalt wearing course, with the main flow, the side branch delivering material from its source and the return link of the inspection.
Two representations of each map were required so that the maps could be processed automatically and rendered: a hierarchical text, with one line per step giving its identifier, type, label in Croatian, the source in the documents that requires it, its immediate predecessors and, for inspections, the step to which the process returns on failure; and a Mermaid flowchart with one node per step, the five types distinguished by node shape, and one edge per predecessor relation. The Mermaid diagrams used standard flowchart node shapes (circle for operations, parallelogram for transports, rectangle for inspections, flag for delays and inverted trapezoid for storages), so they differ in appearance from the hand-drawn notation of Figure 2 while encoding the same five types. Mermaid was chosen because it has been found to be the most suitable textual representation for LLM process modelling [18] and, compared with Graphviz, to yield more correct models [15].
2.4. Input Preparation
All inputs were converted to plain text once, before any generation, and the same text files were used in every variant and repetition (verified by file hashes). The project documentation was extracted from the published PDF files with pdftotext -layout (Poppler). Because the files mix text pages with large-format drawings, a page filter kept only pages of A4 size or smaller (≤900 × 640 pt in either orientation) containing at least 200 non-space characters; drawing sheets and empty or scanned pages were dropped, runs of spaces and blank lines were collapsed, and each page was prefixed with a header naming the file and page number. The resulting documentation text ranged from 45 to 705 thousand characters per tender (Table 1). The bills of quantities were published as write-protected Excel 97–2003 workbooks; they were opened in memory with the standard sheet-protection key and extracted with xlrd, keeping the visible sheets (preamble, equivalence statement where present, and the printed bill) in workbook order as tab-separated lines. BoQ text ranged from 84 to 323 thousand characters per tender. No optical character recognition was applied.
Drawings were deliberately not used. The study compares the source of the input, and the bill of quantities is text; giving the documentation variant images would have confounded the content of the document with the model’s ability to read images, and would have added a second source of run-to-run variation to the noise reference. The technological process map records the sequence of works, transports, inspections, delays and storages without time or quantities, which the technical description, the technical conditions and the bill of quantities describe in text; drawings mainly carry geometry and position, although site layout, access and staging shown in them can also influence the sequence and logistics of the works. Practically, the drawings are large-format sheets whose text extraction yields only disconnected dimensions and labels, whose rasterisation at a resolution at which dimensions remain legible exceeds the image limits of the model, and whose number per contract exceeds what one call reading the whole contract can accept; some exist only as scans. Text inputs could be hashed, held identical across variants and repetitions, and published. The consequence for variant A—that site layout and access information present only in drawings were unavailable to the model—is reported as a limitation (Section 4.6), and multimodal input is the stated next step.
The three input variants were named only by the sentence that introduced the attachment in the prompt (Supplementary Material S1): variant A received the documentation text with the statement that no bill of quantities was provided; variant B received the BoQ text with the statement that no other documentation was provided; and variant C received both files, the BoQ first. Nothing else differed between variants.
2.5. Model and Execution Protocol
All maps were generated with Claude Opus 5.5 (Anthropic; model identifier claude-opus-5-5) at the “high” reasoning-effort setting, through the Claude desktop application, on 15 and 16 October 2026. The generation was zero-shot: the prompt contained the task, the definition of the five ASME step types, the required output format and a set of rules (use only the attached documents and general knowledge; do not search the web; do not ask questions; every operation must correspond to work required by the documents; and the text and the diagram must contain the same steps). No example map, no rules of the technological process map and no project-specific guidance were given. The prompt was fixed after a pilot on one tender and used verbatim in all 90 runs; only the one sentence naming the attached input differed between variants.
To make the runs independent of one another and of the authors’ working context, the generation was executed by an orchestrating agent following a written protocol (Supplementary Material S1). For each run the orchestrator launched a fresh general-purpose subagent whose entire context consisted of a short operating wrapper (which files to read, where to write the answer, no web, no memory), the verbatim prompt and the input file(s). The subagent read the inputs in full, wrote its answer to a file and terminated; nothing produced by one run was ever shown to another. Runs were ordered by a recorded random seed and executed three to four at a time. Memory and conversation history were disabled on the account for the whole execution; the execution harness exposed to every subagent only the account identifier and the list of installed protocols, identically in all runs. Each output began with an isolation probe in which the subagent listed everything it knew beyond the prompt and the inputs; no probe reported access to memory, previous conversations or other runs’ outputs. Because a probe is a self-report, isolation rests on the procedure (a fresh subagent per run, with memory and history disabled) rather than on the probe.
Each run produced four parts: the isolation probe; the hierarchical text of the map; the Mermaid diagram; and a list of assumptions, in English, stating what the documents did not specify and the model decided from general knowledge. The orchestrator checked that the file was complete, rendered the Mermaid code (Mermaid 11 in headless Chromium) as a syntax check and as PNG and SVG images, and logged for every run the date, time, model, inputs, outputs, render outcome and probe result. No run needed to be repeated for an incomplete output, and all 90 diagrams rendered without syntax errors. Two deviations from the protocol are reported: many subagents wrote short helper scripts to number the steps or to check that the text and diagram listed the same steps, although the content of the maps was in all cases produced by the model; subagents running in parallel shared a scratch directory, so that two runs saw other runs’ file names and one reported its scratch files overwritten by a parallel run; and the affected outputs were checked for content of other tenders (place names, road numbers and overlap of step labels), though none was found, and from the sixth batch onwards the directory was emptied before each batch.
2.6. Comparison Procedure
Maps generated independently use different identifiers, wording and granularity for the same work, so they cannot be compared by string matching. Equivalent steps were therefore matched by an LLM agent of the same model, in a fresh context and under the same wrapper, with a prompt (Supplementary Material S1) that instructed it to compare and never to judge: two steps match when they denote the same work, movement, check, wait or storage of the same material or element at the same place in the process, even if worded differently; steps of different type never match, and a step matches at most one step in each other map. The agent produced, for each comparison, a union table with one row per distinct step across the three maps, the matched identifier in each map (or none) and a short description of the difference; an edge table listing every distinct predecessor relation with its presence in each map; a union diagram labelled with memberships; counts by type and membership; and a list of at most twenty uncertain matches.
The procedure was applied in two ways. For the between-variant comparison, the first repetition of A, B and C of each tender was matched (ten unions), the origin of each map being named to the agent by its input. This matching was run twice with two independent agents, and the agreement between the two matchings (the share of identifier triples in the first union that occur identically in the second) was recorded as a measure of the reproducibility of the comparison step; rows on which the two agents disagreed were flagged. The accuracy of the matching was, in addition, checked manually by the two authors on a sample of earthworks steps (Section 3.7); this is a check of the comparison procedure, not of the maps. For the within-variant comparison, the three repetitions of each variant were matched with the same prompt (thirty unions), the origins being described to the agent only as repetitions of the same input. A further agent listed the priced items of each bill of quantities from the extracted text, to allow the coverage of items by the maps to be computed. Finally, from the between-variant union, the item list and the SOURCE fields of the three maps, a validation sheet was generated for each tender: one row per union step with its type, label, membership in A, B and C, the described difference and a flag for uncertain matching, with empty columns for an expert’s verdict; and a second section listing the BoQ items that none of the three maps cites. These sheets, the union diagrams and the source maps form the material of the expert validation planned as the next phase; no expert judgement was used here. The 60 comparison runs (10 item lists, 20 between-variant and 30 within-variant unions) ran on 16 October 2026 with the same model and setting, in a new session with memory disabled.
2.7. Measures
All measures were computed by scripts from the hierarchical text of the 90 maps and from the union tables (Supplementary Material S2). Size and composition: For every map, the number of steps and of predecessor relations (edges), the number and share of steps of each type and edges per step, averaged over the three repetitions of a tender and variant before analysis. Agreement between variants: From the between-variant union of each tender, the number of steps present in all three maps, in exactly two and in one; the Jaccard index of each pair of variants (steps matched in both maps divided by steps in either), overall, by step type and for edges; and the type composition of the steps present in only one variant. Because the union is built on one-to-one semantic matching, steps that one map draws as one operation and another as two count as different; such granularity differences depress the agreement measures, whereas matching errors may inflate them. Stability between repetitions: From the within-variant unions, the Jaccard index of each pair of repetitions (r1–r2, r1–r3, r2–r3), averaged per tender and variant, overall, by type and for edges, and the stricter share of union steps present in all three repetitions. Signal against noise: For each pair of variants X, Y and each tender, the difference between the between-variant Jaccard index of X and Y and the mean within-variant Jaccard index of X and of Y; a negative difference means that changing the input changed the map more than re-running the same input did. Structural rules: Eight checks per map derived from the ASME definition and the teaching rules (Section 2.3)—every inspection has a return link (required by the output format); the return link points to an operation; every transport is connected to a storage step as source or sink (a storage is an immediate predecessor or successor of the transport); no transport lacks a predecessor; exactly one step other than storages has no predecessor; no isolated step; no directed cycle other than through return links; and the text and the Mermaid diagram contain the same steps and edges—plus uniqueness of identifiers and absence of dangling references. For transports not connected to a storage, the share running directly between two operations was also recorded. Traceability: The SOURCE field of each step was classified as inferred (marked as inferred by the model, which thereby stated that the documents do not mention the step), BoQ item (in variants B and C, a number that is a priced item of that tender’s bill, including item ranges) or document (any other reference: a section of the technical conditions, or a drawing or annex named in the text); for variants B and C the coverage of the bill was computed as the share of priced items cited by at least one step. In variant A, which received no bill of quantities, numeric references are section numbers of the technical conditions and were counted as document references. The SOURCE field is the model’s own attribution: it makes each step traceable to the passage or item the model cites, but it is not an independent verification that the cited information is correct or that it supports the step; the classification checks only that a cited item number exists in the bill, not what the item says. Process cues in the inputs: Occurrences of words for transport (prijevoz, dovoz, odvoz, transport), loading (utovar), depots and storage (deponij, skladište), testing and control (ispitivanje, kontrola) and curing (njega) per 100,000 characters of each input text.
2.8. Statistical Analysis and Data Availability
The tender was the unit of analysis (n = 10) and all comparisons were paired within tenders. Differences between the three variants in map-level measures were tested with the Friedman test, with Kendall’s W as effect size, followed by pairwise exact Wilcoxon signed-rank tests with Holm correction within each measure; the effect size r = |z|/√n is reported for every pairwise test. The signal-against-noise differences were tested with the Wilcoxon signed-rank test against zero for each pair of variants, separately for steps and for edges, with Holm correction within each family. Coverage of the bill of quantities was compared between variants B and C only. Descriptive results are reported as medians with ranges or interquartile ranges (IQRs) over tenders, except the between-variant overlaps (Section 3.3), which are means. With ten tenders only large effects can reach significance, and effects at the margin are reported as such; the analysis is exploratory and no correction across the whole set of measures was applied. Analyses were performed in Python 3 (pandas, SciPy).
The following are provided as Supplementary Material: the generation, comparison and item-list prompts verbatim and the execution protocol (S1); the analysis scripts and intermediate tables (S2); the 90 generated maps in text and Mermaid form with their rendered diagrams, the union tables and diagrams, the within-variant unions and the run logs (S3); and the extracted input texts (S4), subject to the public availability of the source documents on EOJN RH under the references in Table 1. Two limitations of the execution should be kept in mind when reproducing the study: the model was accessed through a consumer application rather than a versioned API, so the model identifier and the run dates define the model version, and the semantic matching on which all agreement measures rest was performed by an LLM agent, whose reproducibility was measured and whose accuracy was checked manually on a sample of earthworks steps (Section 3.7).
3. Results
3.1. Generated Maps: Size and Composition
All 90 runs returned a complete map in the required format. The 90 maps contain 21,949 steps and 29,501 predecessor relations (edges); in every map the step table and the Mermaid diagram listed the same steps and edges. Table 2 summarises map size and type composition per variant, with each tender first averaged over its three repetitions and the ten tenders then summarised by the median and IQR; Figure 3 shows the same data by step type.
Table 2.
Size and composition of the generated maps per input variant. Medians (IQR) over the ten tenders after averaging the three repetitions of each tender. Friedman test across A/B/C with Kendall’s W; post hoc exact Wilcoxon tests with Holm correction (only comparisons with adjusted p < 0.05 are listed).
Figure 3.
Number of steps per map by step type and input variant: median over the ten tenders (bars; each tender averaged over its three repetitions) with the interquartile range (whiskers).
Maps generated from the bill of quantities alone (B) or together with the project documentation (C) were about 40% larger than maps generated from the project documentation alone (A): median 283 and 279 steps per map against 198 (Friedman χ2(2) = 15.8, p < 0.001, Kendall’s W = 0.79). The difference held in all ten tenders for both B and C (exact Wilcoxon, Holm-adjusted p = 0.006, r = 0.89), while B and C did not differ (paired median difference 10 steps, p = 0.19). Edge counts followed the same pattern (medians 283, 357 and 380; W = 0.84), and the number of edges per step stayed between 1.3 and 1.4 in all variants (p = 0.20): the additional material from the bill of quantities was added as additional steps in the same kind of graph rather than as denser branching. Map size varied considerably between tenders (A 145–250, B 196–324, C 179–307 steps per map), in line with the range of tender sizes in Table 1.
The additional steps were distributed over all five step types. Relative to A, B contained in median 45% more operations, 60% more transports, 60% more delays, 18% more inspections and 28% more storages; the increase was significant for all types except storages (Table 2). The type composition of the maps consequently hardly changed with the input: operations made up 59–60% of the steps, transports 14–16%, inspections 13–16%, delays 5–6% and storages 4–5% in all three variants. The only compositional difference was a somewhat higher share of inspections in A (median 15.5% vs. 13.3% in B and 13.4% in C; Friedman p = 0.045, W = 0.31), which did not survive the post hoc correction (A vs. B, Holm-adjusted p = 0.059).
3.2. Stability Between Repetitions of the Same Input
The three repetitions of each tender × variant were matched by the comparison agent in the same way as the variants, which gives the level of variation that the generation itself introduces when the input is held fixed (Table 3, Figure 4). Two repetitions of the same input shared, after semantic matching, about three quarters of their steps: the mean Jaccard overlap of the step sets of the repetition pairs was 0.71 for A, 0.75 for B and 0.75 for C (medians over tenders), and 60–65% of the steps that appeared in any of the three repetitions appeared in all three. Agreement on the predecessor relations was much lower: the Jaccard overlap of the edge sets was 0.31–0.35, and only 16–20% of the distinct edges were present in all three repetitions. The set of steps is thus considerably more reproducible than their sequence; part of this difference is mechanical, since an edge can only match when both of its end steps match, and a difference in granularity at one point of the flow changes several predecessor relations around it.
Table 3.
Stability between the three repetitions of the same input. Medians (IQR) over the ten tenders; the Jaccard values are means over the three repetition pairs of a tender. Friedman test across A/B/C (Kendall’s W); no post hoc comparison reached adjusted p < 0.05.
Figure 4.
Stability between the three repetitions of the same input, by step type and variant: mean Jaccard overlap of the step sets of the repetition pairs (r1–r2, r1–r3, r2–r3), averaged over the ten tenders.
Variant A was the least stable of the three in six of the ten tenders, but the differences between variants were small and not significant (Friedman p = 0.15 for steps, p = 0.74 for edges; A vs. C, Holm-adjusted p = 0.059, r = 0.73). Stability differed more between step types than between variants (Figure 4): operations were the most reproducible (mean pairwise Jaccard 0.77–0.83), and inspections and delays intermediate (0.65–0.73), while storages (0.56–0.58) and transports (0.58–0.67) varied most between repetitions. These within-variant values serve as the noise reference for the between-variant comparison in Section 3.4.
3.3. Agreement Between Input Variants
The between-variant comparison matched the first repetition (r1) of A, B and C of each tender into one union map (ten unions, 226–439 distinct steps each). Table 4 gives the Jaccard overlap of the step sets for the three pairs of variants, overall, by step type and for the edges, with the within-variant overlap of Section 3.2 as reference; Figure 5 shows the same values.
The maps generated from the bill of quantities alone and from both documents were close to each other: the B–C overlap was 0.71 (mean over tenders; range 0.63–0.80), slightly below the 0.74 that two repetitions of the same input reach on average. The maps generated from the project documentation alone were far from both: A–C 0.46 (0.41–0.58) and A–B 0.39 (0.36–0.51). The ordering B–C > A–C > A–B held in every one of the ten tenders (exact Wilcoxon, p = 0.002 for both comparisons, r = 0.89): the combined input C produced, in terms of its step set, essentially the B map with a limited admixture of A. For the edges the overlaps were 0.29 (B–C), 0.16 (A–C) and 0.11 (A–B). Computed from the second, independent matching run (Section 3.7), the mean overlaps were the same to two decimals: 0.39, 0.46 and 0.71 for steps and 0.11, 0.16 and 0.29 for edges. By step type, B and C agreed most on operations (0.78), transports (0.65) and delays (0.64) and less on inspections (0.58) and storages (0.55). The contribution of the project documentation within C is visible where A–C exceeds A–B: the gap was largest for inspections (0.54 vs. 0.40) and delays (0.43 vs. 0.31), small for operations (0.51 vs. 0.44) and transports (0.35 vs. 0.32) and negligible for storages (0.26 vs. 0.23). Inspections are thus the one type of step for which the documentation visibly added content that the combined variant retained.
Table 5 breaks the ten union maps down by membership. Of the 3618 distinct steps, 1247 (34.5%) were present in all three maps, 1291 (35.7%) in exactly two and 1080 (29.9%) in one map only; among the latter, 431 steps appeared only in A, 422 only in B and 227 only in C, so the combined variant contributed the fewest steps that neither single-source map contained. The core common to all three maps consisted predominantly of operations (66%), whereas the steps unique to a single variant were only 42–49% operations and contained proportionally more transports, inspections, delays and storages; the share of steps present in all three maps was 40% for operations but only 25% for transports and 16% for storages. The three variants thus agreed mainly on what work is performed and diverged on how material is brought in and stored and on where it is inspected. Of the 8075 distinct edges, 520 (6.4%) were present in all three maps, 1820 (22.5%) in two and 5735 (71.0%) in one.
Table 4.
Jaccard overlap of the step sets of the r1 maps for each pair of input variants, by step type and for the edges: mean over the ten tenders (range). The last column gives the mean within-variant overlap of repetition pairs (A, B and C pooled) as the noise reference.
Figure 5.
Jaccard overlap between the r1 maps of each pair of input variants, by step type (dots; mean over the ten tenders), against the mean within-variant overlap of repetition pairs (grey bars).
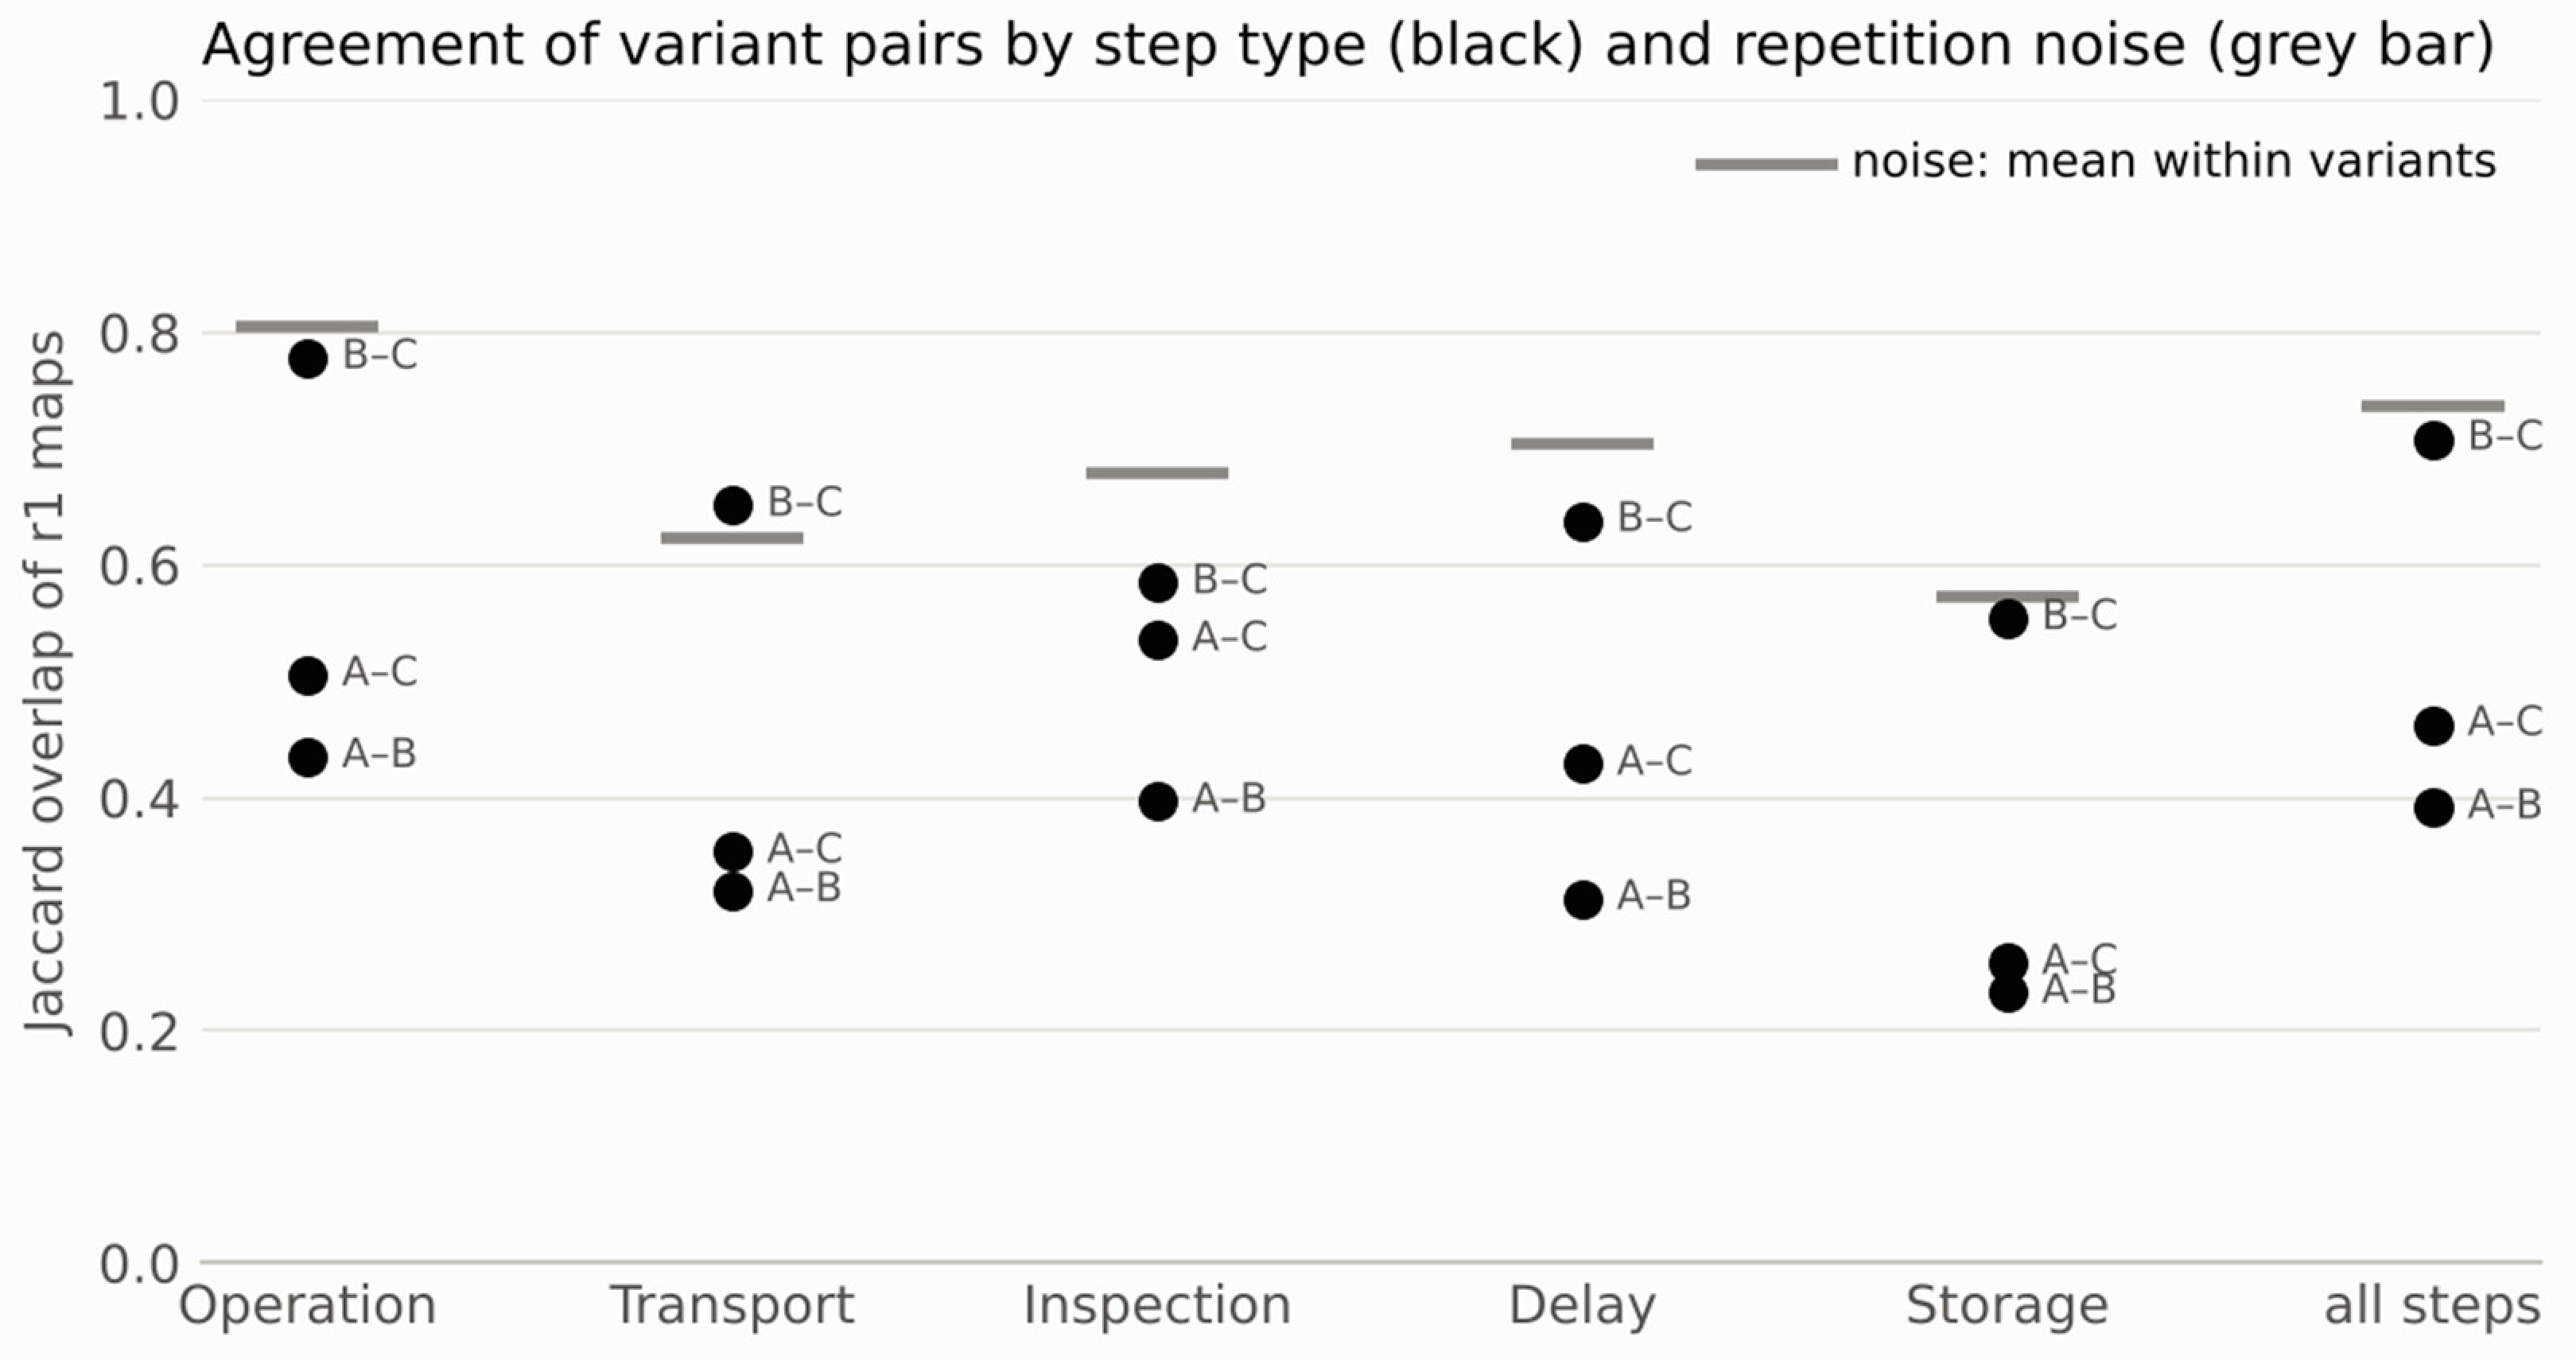
Table 5.
Membership of the 3618 distinct steps of the ten between-variant union maps (r1 of A, B and C), by step type: steps present in all three maps, in exactly two, and in a single map (by variant). Percentages are of the union steps of that type.
3.4. Difference Between Variants Against the Noise of Repetition
Because two generations from the same input already differ, the agreement between two variants is informative only relative to that baseline. For each tender and pair of variants, the between-variant Jaccard overlap (Section 3.3) was compared with the mean within-variant overlap of the two variants involved (Section 3.2); a negative difference means that changing the input changed the map by more than repeating the generation did. Table 6 reports the paired differences and Figure 6 shows them tender-by-tender.
Table 6.
Between-variant overlap of the r1 maps against the within-variant overlap of repetitions (noise), per pair of variants, for steps and for edges. Medians over the ten tenders (Table 4 gives the means of the same between-variant overlaps); the difference is between-variant minus noise, computed per tender; exact Wilcoxon test of the paired differences against zero, Holm-corrected within steps and within edges.
Figure 6.
Between-variant Jaccard overlap of the r1 maps (black) against the mean within-variant overlap of repetitions of the two variants involved (grey), per tender, for steps (top row) and edges (bottom row); the median paired difference is given in each panel title.
Replacing the project documentation by the bill of quantities, or adding the bill to it, moved the maps far outside the band of repetition noise: the A–B and A–C step overlaps were 0.34 and 0.28 below the within-variant reference (medians), negative in all ten tenders (Holm-adjusted p = 0.006, r = 0.89), and the edge overlaps 0.23 and 0.18 below it, again in all ten tenders. Adding the project documentation to the bill of quantities had a much smaller structural effect: the B–C step overlap was only 0.05 below the reference (range −0.10 to +0.02), negative in eight of the ten tenders (adjusted p = 0.020, r = 0.73), and the edge overlap 0.04 below it (nine of ten tenders, adjusted p = 0.006, r = 0.85). The effect of the documentation on top of the bill of quantities was thus small but consistent in direction and statistically detectable, about one sixth of the effect of the bill of quantities itself. Recomputed from the second matching run, the median differences were practically unchanged (steps: A–B −0.35, A–C −0.28, B–C −0.05; edges: −0.23, −0.18, −0.04), with the same signs per tender and the same Holm-adjusted p-values. Because the within-variant matchings described the three maps to the agent as repetitions of the same input, whereas the between-variant matchings named their inputs, part of the small B–C deficit may stem from this difference in framing rather than from the input; the A–B and A–C deficits are far too large to be explained in this way.
3.5. Compliance with the Structural Rules
Table 7 summarises the automatic checks of the structural rules (Section 2.3 and Section 2.7) over the 90 maps. The formal requirements of the notation were met without exception: every inspection step in every map had a return link for the failed outcome, identifiers were unique, no step was isolated and no reference pointed to a non-existent step, and the step table and the Mermaid diagram described the same steps and edges in all 90 maps. The return link led to an operation in 94% (A), 99% (B) and 97% (C) of the inspections.
Table 7.
Compliance with the structural rules of the technological process map, per input variant (30 maps each). Where a rule can be partly met within a map, the share of conforming elements is given as the median over tenders (range).
The two rules that encode the substantive conventions of the map were the ones broken, and one of them depended on the input. The rule that every transport is connected to a storage was satisfied for 76% of the transports in A (median over tenders; range 58–96%) but only for 47% in B (24–78%) and 50% in C (38–74%); the difference was significant (Friedman p = 0.002, W = 0.61; A vs. B adjusted p = 0.008, r = 0.85; A vs. C adjusted p = 0.006, r = 0.89) and B and C did not differ (p = 0.32). In the maps generated from the bill of quantities, transports typically originated directly from a “supply and installation” item, with the material brought in but no storage drawn as its source. Of the transports not connected to a storage, 32% (A), 34% (B) and 41% (C) (medians over tenders) ran directly between two operations, as in a cut-to-fill haul; such moves can be technologically sound but depart from the convention that routes material through a drawn plant or depot. The share of transports without any predecessor was small in all variants (medians 4–8%, p = 0.83). The rule of a single non-storage starting step was met by 17, 14 and 18 of the 30 maps of A, B and C; the median map had exactly one such start, but individual maps opened with up to 10 (A), 20 (B) or 21 (C) parallel entry points, usually one per independent work section or structure (p = 0.36). A cycle outside the inspection return links appeared in seven of the 90 maps (A 2, B 4, C 1): in three cases a corrective operation after a failed inspection was linked back into the flow by an ordinary predecessor relation instead of the return link, a notation error without consequence for the sequence; in four cases (P03 B, P05 C, P10 B twice) the cycle was a genuine circular dependency running through the site stockpile, where excavated material was stored before and used after steps that themselves depended on it.
3.6. Traceability of Steps to the Documents
Every step carries a SOURCE field in which the model had to cite the passage or item it derived the step from, or mark the step as inferred from general knowledge (Figure 7). These citations make the maps traceable, but they are not in themselves evidence that the cited information is correct or that it supports the step (Section 2.7). In the maps generated from the project documentation alone, 79% of the steps cited the documentation (median over tenders; range 67–96%), including about 5% that cited a section number of the technical conditions coinciding with a priced-item number of the bill—since variant A received no bill, these are counted as document references—and 21% (4–33%) were marked as inferred by the model. In the maps generated from the bill of quantities, 93% of the steps cited an item and 2.4% were inferred, while 3.7% cited the preamble of the bill or a section of the General Technical Conditions or a standard named in it; in the maps generated from both documents, 89% cited an item, 8% a passage of the documentation, and 2.6% were inferred. Each share is a median taken separately over the tenders, so the three shares of a variant do not sum exactly to 100%; Figure 7 gives the means. The share of inferred steps was thus about eight times higher in A than in B and C (Friedman p < 0.001, W = 0.75; A vs. B and A vs. C adjusted p = 0.006, r = 0.89; B vs. C p = 0.92), while the share of steps citing the documentation differed between all three variants (W = 1.00; B < C < A, all adjusted p = 0.006).
Figure 7.
What the SOURCE field of the steps cites, per input variant: share of steps citing a passage of the project documentation (a section, or a drawing or annex named in the text), a bill-of-quantities item (variants B and C; numeric references in A, which received no bill, are section numbers of the technical conditions and are counted as documentation), or marked by the model as inferred from general knowledge; mean over the 30 maps of each variant. Labels are rounded to whole percentages so that each bar sums to 100%.
The inferred steps were concentrated in the step types that the documents do not describe explicitly. In A, 73% of the delays, 48% of the storages, 35% of the inspections and 32% of the transports were marked as inferred, against 7% of the operations; in B and C the inferred share was 16–19% for delays, 10–11% for storages and below 6% for all other types. The additional steps that the bill of quantities brought (Section 3.1) were therefore almost entirely item-anchored, and the lower stability of transports and storages (Section 3.2) coincides with the types that most often had to be supplied from general knowledge. Conversely, the bill of quantities was almost completely covered by the maps built from it: in B and C the share of priced items cited by at least one step had a median of 100% (IQR 94–100%) and reached at least 97% in seven of the ten tenders, with no difference between B and C (p = 0.84). The lowest coverage occurred in P01, P06 and P10, three of the four largest bills of quantities: in their r1 maps, 107 of 568, 70 of 685 and 26 of 384 priced items were cited by none of the three variants (79%, 90% and 93% coverage); in the remaining seven tenders every priced item was cited by at least one of the three r1 maps. The uncited items are listed in the validation sheets for the expert phase. The two inputs also differed in how often they name process content: per 100,000 characters, the bills of quantities contained, at the median, 204 words for transport (documentation: two), 41 for loading (zero), 33 for depots and storage (three), 153 for testing and control (13) and nine for curing (three).
3.7. Reproducibility of the Step Matching
All agreement measures rest on the semantic matching of steps by the comparison agent. Its reproducibility was measured by running the between-variant comparison of each tender twice with independent agents and counting the rows of the first union whose triple of matched identifiers (A, B, C) appeared identically in the second. The two runs produced unions of nearly the same size (at most three rows apart in any tender) and agreed on 3515 of the 3618 rows (97.2%; per tender 95.3–100%). Restricted to the rows present in at least two maps, where a match actually had to be found, agreement was 97.4% (2473 of 2538). By step type it was highest for storages (99.5%) and transports (98.9%) and lowest for operations (96.7%), inspections (96.5%) and delays (96.4%), the types with the largest numbers of similarly worded candidates. The 103 rows on which the two runs disagreed are flagged in the validation sheets. Because the two runs differ in so few rows, the agreement measures computed from them are practically identical: the median between-variant overlaps and their differences from the noise reference changed by at most 0.01 (Section 3.3 and Section 3.4).
To check whether the matches are correct and not only reproducible, the two authors independently reviewed a sample of 250 union rows restricted to earthworks (excavation, embankments, subgrade and formation, with the transports, inspections and stockpiles attached to them), which are the principal works of the road contracts studied and the part of the maps with the most similarly worded steps. The rows were drawn by stratified systematic sampling from all ten tenders: 160 of the 400 earthworks rows of the between-variant unions and 90 of the 1142 earthworks rows of the within-variant unions, with matched rows and single-map rows sampled separately. The reviewers saw the three maps of each comparison as map 1, 2 and 3 in random order, without the variant, the repetition or the SOURCE fields, and applied the matching rule of the comparison prompt (Supplementary Material S1). For each of the 170 matched rows they judged whether the matched steps denote the same work (correct match), the same work at a different level of detail or at a slightly different point of the sequence (partial match), or different works (false match); for each of the 80 single-map rows they judged whether another map of the comparison contained the same step, with the five most similar steps of the same type listed as candidates.
The two reviewers judged 72% and 70% of the matches correct, 25% and 28% partial and 2.4% and 1.8% false, and found no missed match among the 80 single-map rows; they agreed on 95% of the matched rows (Cohen’s κ = 0.87) and on 96% of all rows (κ = 0.94). Partial matches were about twice as frequent in the between-variant unions (30–34%) as in the within-variant unions (17–18%), where no match was judged false. Applied to all earthworks rows with sampling weights, the false matches would lower the between-variant overlaps by at most 0.05 and leave the within-variant overlaps unchanged; the B–C deficit relative to repetition noise in earthworks would move from −0.08 to between −0.08 and −0.10, and the A–B and A–C deficits would grow. Counting partial matches as non-matches as well lowers all overlaps by 0.14–0.28 but enlarges rather than removes the differences from noise (A–B from −0.34 to −0.40 or −0.41, A–C from −0.23 to −0.34 or −0.35, B–C from −0.08 to −0.09 or −0.10). The matching is therefore accurate at the level of the work performed. What it absorbs are differences in granularity, which are more frequent between inputs than between repetitions, so the reported agreement between variants is, if anything, generous rather than strict; the reviewed rows and both reviewers’ verdicts are provided in Supplementary Material S2. The check concerns the comparison procedure only: it shows that the agent matched steps that denote the same work, not that these steps or their technological sequence are correct, which remains the subject of the expert validation (Section 4.3).
4. Discussion
4.1. Principal Findings
The study asked which part of the tender documentation determines the technological process map that a general-purpose LLM generates zero-shot, and whether the effect of the input is larger than the variation between repeated generations from the same input. The expectation stated before the runs was that the combined input would produce the most complete map. The results support a different and more specific picture: the bill of quantities is the determining input, and the project documentation changes the map only at the margin once the bill is present.
With respect to RQ1, the input changed the map, but asymmetrically. Maps generated from the bill of quantities, alone or with the documentation, were about 40% larger than maps generated from the documentation alone, in every tender, without a change in type composition; the two bill-based variants shared 71% of their steps, only slightly less than two repetitions of the same input (74%), whereas the documentation-only maps shared only 39–46% of their steps with either. Against the noise of repetition, the step from documentation to bill of quantities was 0.28–0.34 in Jaccard terms and present in all ten tenders, while the step from the bill alone to both documents was 0.05, small but consistent in direction: variant C was variant B with a limited admixture of A, not a synthesis of the two. With respect to RQ2, a zero-shot map is reproducible in its inventory of steps (three quarters shared between repetitions) and much less so in its sequence (a third of the predecessor relations). With respect to RQ3, the model reproduced the formal requirements of the notation without exception but did not reconstruct the two withheld conventions, a drawn storage for every transported material and a single technological start, and the first depended strongly on the input. With respect to RQ4, the bill-based maps were almost entirely anchored in the bill, a fifth of the steps in the documentation-only maps were marked as inferred, and in all variants the inferred steps were concentrated in delays, storages, transports and inspections—the categories that distinguish a flow process chart from a list of works.
4.2. What Each Document Contributes
The dominance of the bill of quantities is explained by the form of the two documents rather than by their content. A bill of quantities is an enumerated, numbered and complete list of the works to be paid for; every item names a work on a material or element and nothing in it is optional. The project documentation of a road contract is largely normative and descriptive: the General Technical Conditions apply to all works of their kind whether or not they occur in the tender, the technical description states what the result should be, and the drawings, which carry much of the specific information, were not part of the input (Section 2.4). From the bill, the model can read off which works occur and in what quantity; from the documentation, it has to infer which of the works it describes are actually required. The near-complete coverage of priced items shows that the model treated the bill as a checklist, and the instruction that every operation must correspond to work required by the documents rewarded exactly this item-by-item anchoring; since the additional steps changed neither the type proportions nor the edges per step, each item unfolded into the same small pattern of a transport, an operation and, where applicable, an inspection or a delay. The bill of quantities is also where much of the process content of a tender is written: its items name transports, loading, depots and tests far more often than the documentation does (Section 3.6), which is consistent with the larger number of transports and inspections in the bill-based maps.
The bill also imposed a convention of its own on the map. Croatian bills of quantities bundle the supply of a material with its installation in a single item (“dobava i ugradnja”, procure and install); the model translated such items into a transport followed by an operation, with the material arriving from outside the map rather than from a drawn plant, depot or stockpile. The lower share of storage-connected transports in B and C therefore reflects a mismatch between the structure of the input and a rule of the notation the model had not been given: the bill knows where the material goes but not where it comes from, and the model followed the bill. In the documentation-only maps the same transports were more often drawn from a storage, because plants, deposits and access routes are mentioned in the technical description.
The exclusion of drawings bears directly on this comparison. Drawings of a road contract carry the layout of the site, the position of cuts, fills, culverts and structures, access roads, construction phases and traffic arrangements, and sometimes the location of depots—the content from which material sources, haul routes and the order of work sections are derived. Their absence most likely disadvantaged variant A precisely in the logistic side branches and in the sequencing of work sections, and part of the gap between A and B may therefore be a gap in extractable text rather than in content. It is less likely to account for the main finding: the steps that made the bill-based maps larger were almost all anchored in individual priced items (Section 3.6), that is, in a complete list of the works to be paid for, which drawings do not provide either; and drawings were absent from variant C as well. The conclusion that the bill of quantities determines the map therefore holds for text input, which is the comparison made here; whether multimodal input narrows the gap between the documentation and the bill of quantities is a question for the next phase (Section 4.6).
The project documentation did not add steps in bulk, but it added a particular kind of step. The one type for which the combined variant moved visibly towards the documentation-only variant was the inspection (A–C 0.54 against A–B 0.40), and inspections were also the type with a higher share in A. This is where the technical conditions carry information the bill lacks: acceptance criteria, tests, tolerances and the points at which work may not proceed before it is checked. The second contribution of the documentation, the drawing of material sources and destinations, was retained far less in the combined variant: once the bill was present, the model organised the map around its items and drew storages at the rate of the bill-only maps. Reading both documents together therefore did not produce the union of what each provides; it produced the bill’s map with the documentation’s inspections.
Neither document provides the rest of what a flow process chart is for in explicit form. In the documentation-only maps, 73% of the delays, 48% of the storages and about a third of the transports and inspections were marked as inferred by the model; in the bill-based maps these shares fell to 16–19% of the delays and 10–11% of the storages, because the model attached most such steps to an item. Curing times, stockpiles of excavated material, the waiting of a paver for the next truck: these non-value-adding steps are what distinguish the map from a schedule; where the documents state them at all, they do so item-by-item, and where the model reports supplying them from its own general knowledge, the SOURCE field makes this visible step-by-step. Conversely, a cited item or passage shows where a step should be checked, not that the step is right. The same categories were also the least stable between repetitions: what is anchored in a document is reproduced, what is supplied from knowledge varies from run to run. The four genuine circular dependencies found in the structural checks, all running through the site stockpile of excavated material, illustrate the limit of this knowledge, and they mark the parts of the map that an expert must examine first.
4.3. Reading the Measures: Repetition Noise and the Limits of Agreement
A single generated map is one draw from a stochastic generator. Two generations from identical input, in identical conditions, differed in a quarter of their steps and two thirds of their predecessor relations. Any comparison between prompts, inputs or models that rests on one generation per condition therefore confounds the condition with the generator; most LLM studies in construction report single generations or single interactive sessions [39,41], and the BPM literature has only recently begun to measure variability across repeated generations [24,26]. Three repetitions give three pairwise comparisons per condition as a within-condition reference, and they were sufficient to separate a large effect (documentation against bill of quantities) from one about six times smaller (bill alone against both documents). The gap between the reproducibility of steps and of edges is not peculiar to this notation: round-trip evaluations of LLM-generated BPMN models find temporal and logical ordering the hardest property to preserve [25], and transcriptions of process diagrams read node labels far better than connections [48,49]. For an expert reviewing a generated map, the predecessor relations, not the list of steps, are where the attention should go. In operational terms, a generated map can be relied on more as an inventory of the works, transports, inspections and storages that a contract implies than as their technological order: with only a third of the predecessor relations recurring between two runs, the sequence of a single map cannot serve as the logic of a schedule, a method statement or a site logistics plan without being checked by a planner. Part of the low agreement on edges is mechanical (Section 3.2), but even allowing for it, identifying the activities and sequencing them reliably are different capabilities, and only the first is supported by these results. A step that recurs in all three repetitions is, by construction, the model’s stable reading of the documents, so a consensus map built from repeated generations would be a more defensible draft than any single run—whether the stable core is also the correct core is a question for the expert phase.
That question cannot be answered by the measures reported here. High agreement between B and C may mean that both variants are right, or that both are wrong in the same way, because both are anchored in the same bill and generated by the same model with the same priors; a reproducible error is still an error, and the “supply and installation” pattern of Section 4.2 is a candidate for one. Low agreement between A and B may mean that one map misses works, that the other invents transports, or that both are right at different granularity. A larger map is not a more complete one, and a map with fewer inferred steps is not a more correct one. This is why the study was designed to end in validation sheets rather than in a verdict: the union maps give, for each of the 3618 distinct steps, which variants contain it and what differs between them, and the expert phase will record for each step whether it belongs in the map and, where the variants disagree on sequence, which of them is right, so that precision per variant and per step type can be computed, together with recall relative to the reviewed union; since the union contains only generated steps, the experts will also be able to add steps and relations that every map omitted. Whether B and C differ in correctness will need its own measure of run-to-run variation, since the structural noise measured here does not transfer to correctness; the SOURCE record tells the experts where the model reported relying on its own knowledge; the rows on which the two matching runs disagreed (about 3%) are flagged in the sheets so that the experts can resolve rather than inherit it.
4.4. Relation to Previous Work
The closest line of work, process modelling with LLMs in BPM, starts from texts that narrate a process [14,16,23,24], so that the model formalises an order the text already states; the input here states no order at all, and the process has to be reconstructed from domain knowledge. The reconstruction proved possible and, for the part anchored in the documents, reproducible, but at a price: a fifth of the steps in the documentation-only maps, and most of their delays, were marked by the model as having no source in the input, and the fidelity scores of BPM benchmarks [17] do not transfer, because there is no text the process could be faithful to. The suitability of Mermaid for LLM process modelling [15,18] was confirmed at a size of 150–330 nodes, well beyond the models used in those studies.
Among LLM applications in construction, the nearest precedents generate schedules or dependency structures from short typed descriptions, interactive interviews or synthetic data [37,38,39]. The errors reported there, omitted steps and missing curing time [34,37], are precisely the step types that the flow process chart draws explicitly; the present maps contained delays in every tender, but three quarters of them, in the documentation-only variant, were marked by the model as inferred rather than read, which suggests that such steps come from the model’s knowledge rather than from the documents. The pre-LLM extraction of procedures from specifications [30] and the classification of road bill items into work types [31] each automated one step of the chain with hand-written rules or labelled data; the LLM performed the chain end-to-end, zero-shot, in a low-resource language, at the cost of the variability documented in Section 3.2. Relative to the authors’ earlier exploratory step [46], which established that the task could be attempted at all, the present results replace the question “can it be done” with three answerable ones: which input is sufficient, how much of a single result is reproducible, and where the model departs from the documents.
4.5. Implications for Practice, Teaching and the Notation
For anyone who wants a generated draft of the technological process map, the practical conclusion is to start from the bill of quantities. It yields, structurally, the same map as the full tender at a fraction of the input length, it anchors almost every step in a numbered item that a reviewer can check, and it is the one document that exists in a uniform, machine-readable form for every public-works tender of this client (other clients may use a different or less uniform format, but their bills of quantities can also be expected to be machine-readable). The project documentation is not redundant, but its marginal value is specific: it supplies the inspections and, when read alone, the material logistics. A pipeline that generated the backbone of the map from the bill of quantities and then asked the model to add inspection points and material sources from the technical conditions would follow the division of labour the data suggest, in two passes that can be checked separately. Such a map is a draft and has not yet been tested to be used in practice. None of the measures reported here shows that the maps are technically correct, and a larger bill-based map may be more complete or merely longer, so any use in construction sequencing, site logistics or method statements requires review by a planner, beginning with the predecessor relations and with the steps the model marked as inferred. The recommendation also rests on ten road tenders of one client, whose bills of quantities are detailed, standardised and itemised down to transports and tests, and on one model accessed at one point in time. For clients with shorter or more aggregated bills, for building works with more trades and fewer repetitive items, for contracts without a detailed bill, or for other models, the balance between the two documents may differ and should be tested before the recommendation is transferred.
The next question is whether stating the conventions of the map would change the maps substantially. The results suggest that the two conventions the model did not reconstruct may simply have been unstated rather than beyond it: the model obeyed every rule it was given, including the format of the return link, and departed only from the ones it was not told. Both conventions are formal enough to be stated in a prompt and checked automatically, so a rule-informed prompt can be expected to raise compliance with them, most of all in the bill-based maps, where about half of the transports had no drawn source or destination (Section 3.5). Two effects are less predictable. Drawing a storage for every material source and joining the work sections to a single start would lengthen the maps and change many of their predecessor relations, which may lower rather than raise the agreement between repetitions; and compliance with the conventions says nothing about whether the sequence is technologically correct. Stating the rules is therefore the obvious next experiment, and the structural checks developed here provide the measure of its effect on form, but its benefit for practice has to be judged on the expert-validated correctness of the maps, not on rule compliance alone.
For teaching, the errors the generated maps contain (such as a material brought in from nowhere, a corrective operation relinked by an ordinary arrow, a stockpile that is both source and destination of the same material…) are the characteristic errors of a student drawing the map for the first time, and a map of two to three hundred steps generated in minutes, in which the student has to find and correct them against the documents, is a more realistic exercise than a textbook case. For the notation itself, the ASME symbol set and the hierarchical text format were sufficient for complete and internally consistent maps of 150–330 nodes, but maps of that size are not readable as single diagrams, and any practical use will need the hierarchical presentation by work phases, with the main flow separated from the side branches of material supply and disposal, that the teaching convention prescribes.
4.6. Limitations and Future Work
The sample is ten tenders of one public client, all road works under the same General Technical Conditions; the paired design and the consistent sign of the main effects in every tender make the within-sample conclusions robust, but say nothing about other types of works, project sizes and complexities, other clients’ document conventions, other procurement systems or other languages, and the dominance of the bill of quantities may be specific to a procurement culture in which the bill is detailed and the technical description short. Only one model was used, at one point in time. The results may not transfer to other LLMs, and even the same model may behave differently later, since it was accessed through a consumer application rather than a versioned API, where a model can be updated without a change in its name, so the absolute values, in particular the noise level, should not be assumed to transfer. The inputs were text: drawings, tables and laboratory reports were not available to the model as images, so the documentation-only variant was disadvantaged relative to a human reader, and part of the gap between A and B may be a gap in extractable text rather than in content. The documents were not checked for accuracy or for consistency with each other (Section 2.2), so part of the difference between variants may reflect discrepancies between the documentation and the bill of quantities rather than the behaviour of the model. The generation was deliberately zero-shot and without the rules of the map, so rule compliance measures what the model reconstructs unaided, not what it could achieve when instructed. The agreement measures depend on one-to-one semantic matching by an LLM agent of the same model, reproducible (97%) and, in a manual check of earthworks steps, accurate at the level of the work performed (about 2% false and no missed matches; Section 3.7), which supports the reliability of the comparison but not the correctness of the generated steps; granularity differences can depress the overlaps, when one map draws as two steps what another draws as one, or inflate them, when steps of different scope are matched as one (a quarter of the checked matches were partial), and the within-variant and between-variant matchings described the origin of the maps differently (repetitions of one input versus named inputs), which may account for part of the small B–C deficit. The stability estimates rest on three repetitions. All measures are structural; none is a measure of correctness.
The immediate next phase is the expert validation for which this study produced the material: independent domain experts will judge, step-by-step on the union maps and validation sheets, whether each step belongs in the map and which variant has the sequence right, with inter-rater agreement reported, so that precision per variant and per step type, and recall relative to the reviewed union supplemented by the steps the experts add, can show whether the structural picture—bill of quantities as backbone, documentation as a source of inspections—holds for correctness as well. Three extensions follow directly from the results: a rule-informed generation, in which the conventions of the map are stated in the prompt or supplied through a validated reference map; generation from several repetitions aggregated into a consensus map; and multimodal input in which the drawings and tables are given to the model as images. Beyond the as-is map, validated maps are the starting point for the lean to-be redesign which is not in the scope of this paper, for downstream planning (the skeleton of a method statement or the logic of a schedule) and for construction-technology teaching. The design itself—a within-subject ablation of the input with repetition noise as the reference and an independent agent for matching—is not specific to road works or to Croatian documents and can be applied to other types of works, clients and models.
5. Conclusions
This paper examined whether a general-purpose large language model can reconstruct the technological process map of road construction works, in the notation of the ASME flow process chart, from tender documents that describe only the product, and which part of those documents determines the result. On ten tenders of one public client, the same model generated ninety maps zero-shot, three times from each of three inputs: the project documentation, the bill of quantities, and both. An independent LLM agent matched the maps step-by-step, and the differences between inputs were judged against the variation between repeated generations from the same input. Four conclusions follow.
First, the input that determines the generated map is the bill of quantities. Maps generated from it, alone or with the documentation, were about 40% larger than maps generated from the documentation alone, in every tender, and the two bill-based variants were nearly as similar to each other as two repetitions of the same input. Adding the project documentation to the bill changed the map by a small but consistent amount, slightly more than repetition alone, whereas replacing or supplementing the documentation with the bill changed it by about six times that amount; the combined input yielded, in structural terms, the bill’s map with a limited admixture of the documentation, mainly in the inspections. Second, a zero-shot map is reproducible in its inventory of steps and far less so in its sequence: two generations from the same input shared about three quarters of their steps but only a third of their predecessor relations, so any evaluation that rests on a single generation per condition confounds the condition with the generator. Third, the model satisfied every formal requirement of the notation and the format it was given, but did not reconstruct the two conventions of the technological process map that were withheld from it, a drawn storage for every transported material and a single technological start; the rules the model was not told are the rules it broke. Fourth, the steps that distinguish a flow process chart from a list of works—delays, storages and a large part of the transports and inspections—are where the model most often reported supplying content from general knowledge: most of the delays and half of the storages in the documentation-only maps, and a minority of them in the bill-based maps, which attach most such steps to an item; the step-level record of the sources the model cites makes this visible and marks where expert review must begin.
To the best of our knowledge, this is the first evaluation of LLM-generated technological process maps of construction works from real tender documentation. Its contribution is methodological as much as empirical: a within-subject ablation of the input with repetition noise as the reference, an independent agent for semantic matching whose own reproducibility was measured, automatic checks of the structural rules of the map, and a step-level record of the sources the model cites, which makes each step traceable but does not by itself verify it. None of these measures is a measure of correctness: they do not show whether the larger bill-based maps are more correct or merely longer, nor whether any of the maps is fit for construction planning without expert review. The claims of this paper are therefore limited to the structure of what the model produces and to one model, one type of works and one client’s documents. For adoption into practice, and for tenders with detailed bills of quantities such as those studied, the results point to the bill of quantities as the input to start from and to the project documentation as the source of inspection points and material logistics, with the inferred steps as the first object of review. The next phase is the expert validation for which this study produced the material, followed by rule-informed generation, consensus maps from repeated runs, multimodal input and, on validated as-is maps, the lean to-be redesign. Whether the technological logic that every construction plan presupposes can be obtained from a language model in minutes and then checked is, after this study, no longer a question of whether a structured map can be generated, but of whether it is correct and fit for use in planning, and that question now has the material it needs.
Supplementary Materials
The following supporting information can be downloaded at: https://www.mdpi.com/article/10.3390/buildings16224570/s1, S1: generation, comparison and item-list prompts (verbatim) and the execution protocol; S2: analysis scripts and intermediate tables; S3: the 90 generated maps (hierarchical text, Mermaid, rendered diagrams), union tables and diagrams, within-variant unions and run logs; S4: extracted input texts.
Author Contributions
Conceptualization, M.M.; methodology, M.M.; software, M.M. and K.V.; validation, K.V.; formal analysis, M.M.; investigation, M.M. and K.V.; resources, M.M.; data curation, K.V.; writing—original draft preparation, M.M.; writing—review and editing, K.V.; visualisation, K.V. All authors have read and agreed to the published version of the manuscript.
Funding
This research received no external funding.
Data Availability Statement
The generated maps, union tables, run logs, analysis scripts and extracted input texts are provided as Supplementary Materials S1–S4. The source tender documents are public procurement documents available from EOJN RH under the references in Table 1.
Acknowledgments
The large language model evaluated in this study (Claude Opus 5.5, Anthropic) was the object of the research; its use for generating and comparing the process maps is described in Section 2.5 and Section 2.6. In addition, during the preparation of this manuscript the authors used Claude Opus 5.5 (Anthropic; Claude desktop application, October 2026) to write and debug the Python scripts for data extraction, statistical analysis and figures, to draft and language-edit parts of the text, and to check the manuscript for internal consistency. All analysis scripts were run and their outputs checked by the authors, and all AI-assisted text was reviewed and edited by the authors, who take full responsibility for the content of this publication.
Conflicts of Interest
The authors declare no conflicts of interest.
Abbreviations
The following abbreviations are used in this manuscript:
| LLM | Large language model |
| BoQ | Bill of quantities |
| ASME | American Society of Mechanical Engineers (flow process chart symbols) |
| OTU | Opći tehnički uvjeti (General Technical Conditions of Hrvatske ceste) |
| EOJN RH | Electronic Public Procurement Classifieds of the Republic of Croatia |
| BPM | Business process management |
| BPMN | Business Process Model and Notation |
| WBS | Work breakdown structure |
| IQR | Interquartile range |
References
- Gilbreth, F.B.; Gilbreth, L.M. Process Charts: First Steps in Finding the One Best Way to Do Work. In Proceedings of the Annual Meeting of the American Society of Mechanical Engineers, New York, NY, USA, 5–9 December 1921; American Society of Mechanical Engineers: New York, NY, USA, 1921. [Google Scholar]
- American Society of Mechanical Engineers. A.S.M.E. Standard Operation and Flow Process Charts; American Society of Mechanical Engineers: New York, NY, USA, 1947. [Google Scholar]
- Kuprenas, J.A.; Fakhouri, A.S. A Crew Balance Case Study—Improving Construction Productivity; Construction Management Association of America; 2001; Available online: https://www.cmaanet.org/sites/default/files/2018-04/crew_balance_study.pdf (accessed on 18 October 2026).
- Halpin, D.W. CYCLONE—Method for Modeling Job Site Processes. J. Constr. Div. 1977, 103, 489–499. [Google Scholar] [CrossRef] [Scilit]
- Koskela, L. An Exploration towards a Production Theory and Its Application to Construction; VTT Publications 408; VTT Technical Research Centre of Finland: Espoo, Finland, 2000. [Google Scholar]
- Gaio, J.; Cachadinha, N. Suitability and Benefits of Implementing Lean Production on Road Works. In Proceedings of the 19th Annual Conference of the International Group for Lean Construction (IGLC 19), Lima, Peru, July 2011; Available online: https://www.iglc.net/papers/details/1138 (accessed on 18 October 2026).
- Aziz, Z.; Qasim, R.M.; Wajdi, S. Improving productivity of road surfacing operations using value stream mapping and discrete event simulation. Constr. Innov. 2017, 17, 294–323. [Google Scholar] [CrossRef] [Scilit]
- Dave, B. Business process management—A construction case study. Constr. Innov. 2017, 17, 50–67. [Google Scholar] [CrossRef] [Scilit]
- Fauth, J.; Soibelman, L. Conceptual Framework for Building Permit Process Modeling: Lessons Learned from a Comparison between Germany and the United States regarding the As-Is Building Permit Processes. Buildings 2022, 12, 638. [Google Scholar] [CrossRef] [Scilit]
- Park, Y.H.; Cho, C.Y.; Lee, G. Identifying a Subset of BPMN for IDM Development. In Proceedings of the CIB W78-W102 2011: International Conference, Sophia Antipolis, France, 26–28 October 2011; Available online: https://itc.scix.net/paper/w78-2011-Paper-30 (accessed on 18 October 2026).
- Kropp, T.; Bombeck, A.; Lennerts, K. An Approach to Data Driven Process Discovery in the Cost Estimation Process of a Construction Company. In Proceedings of the 38th International Symposium on Automation and Robotics in Construction (ISARC), Dubai, United Arab Emirates, 2–4 November 2021; pp. 893–900. [Google Scholar] [CrossRef] [Scilit] [PubMed]
- Hassan, M.M.; Gruber, S. Application of discrete-event simulation to study the paving operation of asphalt concrete. Constr. Innov. 2008, 8, 7–22. [Google Scholar] [CrossRef] [Scilit]
- Galić, M.; Thronicke, R.; Schreck, B.M.; Feine, I.; Bargstädt, H.-J. Process Modeling and Scenario Simulation in Construction Using Enterprise Dynamics Simulation Software. Electron. J. Fac. Civ. Eng. Osijek-e-GFOS 2015, 6, 22–29. [Google Scholar] [CrossRef] [Scilit]
- Grohs, M.; Abb, L.; Elsayed, N.; Rehse, J.-R. Large Language Models Can Accomplish Business Process Management Tasks. In Business Process Management Workshops: BPM 2023 International Workshops, Utrecht, The Netherlands, 11–15 September 2023, Revised Selected Papers; Lecture Notes in Business Information Processing; De Weerdt, J., Pufahl, L., Eds.; Springer: Cham, Switzerland, 2023; Volume 492, pp. 453–465. [Google Scholar] [CrossRef] [Scilit]
- Klievtsova, N.; Benzin, J.-V.; Kampik, T.; Mangler, J.; Rinderle-Ma, S. Conversational Process Modeling: Can Generative AI Empower Domain Experts in Creating and Redesigning Process Models? arXiv 2024, arXiv:2304.11065. [Google Scholar]
- Kourani, H.; Berti, A.; Schuster, D.; van der Aalst, W.M.P. Process Modeling with Large Language Models. In Enterprise, Business-Process and Information Systems Modeling: 25th International Conference, BPMDS 2024, and 29th International Conference, EMMSAD 2024, Limassol, Cyprus, 3–4 June 2024, Proceedings; Lecture Notes in Business Information Processing; van der Aa, H., Bork, D., Schmidt, R., Sturm, A., Eds.; Springer: Cham, Switzerland, 2024; Volume 511, pp. 229–244. [Google Scholar] [CrossRef] [Scilit]
- Kourani, H.; Berti, A.; Schuster, D.; van der Aalst, W.M.P. Evaluating large language models on business process modeling: Framework, benchmark, and self-improvement analysis. Softw. Syst. Model. 2026, 25, 1151–1186. [Google Scholar] [CrossRef] [Scilit]
- Brissard, A.; Cuppens, F.; Zouaq, A. What is the Best Process Model Representation? A Comparative Analysis for Process Modeling with Large Language Models. arXiv 2025, arXiv:2507.11356. [Google Scholar]
- Voelter, M.; Hadian, R.; Kampik, T.; Breitmayer, M.; Reichert, M. Leveraging Generative AI for Extracting Process Models from Multimodal Documents. arXiv 2024, arXiv:2406.04959. [Google Scholar]
- Franzoi, S.; Delwaulle, M.; Dyong, J.; Schaffner, J.; Burger, M.; vom Brocke, J. Using Large Language Models to Generate Process Knowledge from Enterprise Content. In Business Process Management Workshops: BPM 2024 International Workshops, Krakow, Poland, 1–6 September 2024, Revised Selected Papers; Lecture Notes in Business Information Processing;Revised Selected Papers; Gdowska, K., Gómez-López, M.T., Rehse, J.-R., Eds.; Springer: Cham, Switzerland, 2025; Volume 534, pp. 247–258. [Google Scholar] [CrossRef] [Scilit]
- Ziche, C.; Apruzzese, G. LLM4PM: A Case Study on Using Large Language Models for Process Modeling in Enterprise Organizations. In Business Process Management: Blockchain, Robotic Process Automation, Central and Eastern European, Educators and Industry Forum: BPM 2024 Blockchain, RPA, CEE, Educators and Industry Forum, Krakow, Poland, 1–6 September 2024, Proceedings; Lecture Notes in Business Information Processing; Di Ciccio, C., Fdhila, W., Agostinelli, S., Amyot, D., Leopold, H., Krčál, M., Malinova Mandelburger, M., Polančič, G., Tomičić-Pupek, K., Gdowska, K., et al., Eds.; Springer: Cham, Switzerland, 2024; Volume 527, pp. 472–483. [Google Scholar] [CrossRef] [Scilit]
- Sai, C.; Rinderle-Ma, S. Agentic Generation of Process Models from Regulatory Texts. In Cooperative Information Systems: 31st International Conference, CoopIS 2025, Marbella, Spain, 20–22 October 2025, Proceedings; Lecture Notes in Computer Science; Cappiello, C., Hartig, O., Sellami, M., Ouni, A., Eds.; Springer: Cham, Switzerland, 2025; Volume 15535, pp. 370–387. [Google Scholar] [CrossRef] [Scilit]
- Li, S.; Liu, Z.; Liu, X.; Chen, G.; Zhang, Y.; Ling, H.; Huang, X. Structured Extraction and BPMN Generation From Chinese Procedural Texts via Hybrid Attention-Based Domain Language Models. IEEE Access 2025, 13, 166241–166253. [Google Scholar] [CrossRef] [Scilit]
- Menaka Sekar, P.K.; Matei, I.; Zhenirovskyy, M.; Wong, H.Y.; Kohmura, S.; Hotta, S.; Inomata, A. Automatic Generation of Executable BPMN Models from Medical Guidelines. arXiv 2026, arXiv:2604.07817. [Google Scholar]
- Hörner, L.F.; Möller, M.; Reichert, M. Assessing Semantic Fidelity of LLM-Generated BPMN 2.0 Process Models via Round-Trip Transformation. In Conceptual Modeling; Lecture Notes in Computer Science; Bernasconi, A., Indulska, M., Ram, S., Evermann, J., Parsons, J., Eds.; Springer: Cham, Switzerland, 2026; Volume 17081, pp. 439–449. [Google Scholar] [CrossRef] [Scilit]
- Matei, I.; Menaka Sekar, P.K.; Zhenirovskyy, M.; Wong, H.Y.; Kohmura, S.; Hotta, S.; Inomata, A. Ambiguity Detection and Elimination in Automated Executable Process Modeling. arXiv 2026, arXiv:2604.10884. [Google Scholar]
- Gardini, A.; Bragadin, M.A.; Naticchia, B.; Carbonari, A.; Corneli, A. BPMN 2.0 Modelling for the Management of the Inspection of Execution Processes in Construction. In Proceedings of the Creative Construction e-Conference 2020, Online, 28 June–1 July 2020; pp. 37–41. [Google Scholar] [CrossRef] [Scilit]
- Labban, R.; AbouRizk, S.; Haddad, Z.; Elsersy, A. A Discrete Event Simulation Model of Asphalt Paving Operations. In Proceedings of the 2013 Winter Simulation Conference, Washington, DC, USA, 8–11 December 2013; pp. 3215–3224. [Google Scholar] [CrossRef] [Scilit]
- Simonsson, P.; Björnfot, A.; Erikshammar, J.; Olofsson, T. ‘Learning to See’ the Effects of Improved Workflow in Civil Engineering Projects. Lean Constr. J. 2012, 35–48. [Google Scholar] [CrossRef]
- Ren, R.; Zhang, J. Semantic Rule-Based Construction Procedural Information Extraction to Guide Jobsite Sensing and Monitoring. J. Comput. Civ. Eng. 2021, 35, 04021026. [Google Scholar] [CrossRef] [Scilit]
- Lee, G.; Lee, G.; Chi, S.; Oh, S. Automatic Classification of Construction Work Codes in Bill of Quantities of National Roadway Based on Text Analysis. J. Constr. Eng. Manag. 2023, 149, 04022163. [Google Scholar] [CrossRef] [Scilit]
- Hassan, F.U.; Le, T.; Le, C. Automated Approach for Digitalizing Scope of Work Requirements to Support Contract Management. J. Constr. Eng. Manag. 2023, 149, 04023005. [Google Scholar] [CrossRef] [Scilit]
- Gao, Y.; Yiu, T.W.; Shen, X.; Tam, V.W.Y. Large language models in smart construction: A systematic review of implementation strategies, applications and future directions. Eng. Constr. Archit. Manag. 2026, 33, 159–181. [Google Scholar] [CrossRef] [Scilit]
- Kampelopoulos, D.; Tsanousa, A.; Vrochidis, S.; Kompatsiaris, I. A review of LLMs and their applications in the architecture, engineering and construction industry. Artif. Intell. Rev. 2025, 58, 250. [Google Scholar] [CrossRef] [Scilit]
- Ganji Rad, M.H.; Ilbeigi, M. Generative AI in Lean Construction: A Scoping Review. In Proceedings of the 33rd Annual Conference of the International Group for Lean Construction (IGLC33), Osaka and Kyoto, Japan, 2–8 June 2025; pp. 953–964. [Google Scholar] [CrossRef] [Scilit] [PubMed]
- Taiwo, R.; Bello, I.T.; Abdulai, S.F.; Yussif, A.-M.; Salami, B.A.; Saka, A.; Ben Seghier, M.E.A.; Zayed, T. Generative artificial intelligence in construction: A Delphi approach, framework, and case study. Alex. Eng. J. 2025, 116, 672–698. [Google Scholar] [CrossRef] [Scilit]
- Prieto, S.A.; Mengiste, E.T.; García de Soto, B. Investigating the Use of ChatGPT for the Scheduling of Construction Projects. Buildings 2023, 13, 857. [Google Scholar] [CrossRef] [Scilit]
- Singh, A.K.; Hsieh, S.-H. Multi-LLM-based augmentation and synthetic data generation of construction schedules and task descriptions with SLM-as-a-judge assessment. Adv. Eng. Inform. 2026, 69, 103825. [Google Scholar] [CrossRef] [Scilit]
- Korba, B.; Pawluk, K. Automation of the Planning Phase of a Construction Project Using AI Agents. Technologies 2026, 14, 351. [Google Scholar] [CrossRef] [Scilit]
- Amarkhil, Q.; Hegab, M.; Alroomi, A. AI-Driven Semantic Framework for Automated Construction Planning and Scheduling with BIM and Digital Twin Integration. Eng. Proc. 2025, 112, 3. [Google Scholar] [CrossRef] [Scilit]
- Kobašević, E.; Galić, M. Project Planning in Construction 4.0: AI-Driven Chatbots for Project Planning Challenges. Slovak J. Civ. Eng. 2026, 34, 36–45. [Google Scholar] [CrossRef] [Scilit]
- Kalasapudi, V.S.; Seelam, A.; Ganupa, S.; Tofferi, C. The overlooked frontier of AI in construction: Conversational, document-native automation for administrative workflows. Front. Built Environ. 2026, 11, 1713342. [Google Scholar] [CrossRef] [Scilit]
- Manda, G.; Vilventhan, A. Integration of a Natural Language Processing and Project Scheduling Tool for Contractual Delay Risk Identification in a Highway Construction Project Using LLMs. J. Leg. Aff. Dispute Resolut. Eng. Constr. 2026, 18, 04526026. [Google Scholar] [CrossRef] [Scilit]
- Vilibić, K.; Sigmund, Z.; Završki, I. Intelligent Risk Identification in Construction Projects: A Case Study of an AI-Based Framework. Buildings 2026, 16, 409. [Google Scholar] [CrossRef] [Scilit]
- Sigmund, Z.; Vilibić, K.; Završki, I.; Mihić, M. Monitoring Progress and Standardization of Work Using Artificial Intelligence—Evolution of NORMENG Project. Buildings 2025, 15, 3844. [Google Scholar] [CrossRef] [Scilit]
- Vilibić, K.; Mihić, M. Intelligent Construction Process Modeling with LLMs: Case of Road Construction in Croatia. In Proceedings of the 17th Organization, Technology and Management International Conference (OTMC 2026), Petrčane, Croatia, 30 September–3 October 2026; Vukomanović, M., Sigmund, Z., Vlahov, D.R., Eds.; Hrvatska udruga za organizaciju građenja: Zagreb, Croatia, 2026; pp. 329–340. [Google Scholar]
- Hrvatske ceste d.o.o. Opći tehnički uvjeti za radove na cestama [General Technical Conditions for Road Works]; Hrvatske ceste: Zagreb, Croatia, 2024; Available online: https://hrvatske-ceste.hr/hr/stranice/tehnicka-dokumentacija/dokumenti/89-opci-tehnicki-uvjeti-za-radove-na-cestama-2024 (accessed on 19 October 2026).
- Deka, P.; Devereux, B. Structured Extraction from Business Process Diagrams Using Vision-Language Models. In Proceedings of the 41st ACM/SIGAPP Symposium on Applied Computing (SAC ’26), Thessaloniki, Greece, 23–27 March 2026; pp. 934–943. [Google Scholar] [CrossRef] [Scilit]
- Gil de Avalle, G.; Maruster, L.; Sloot, E.; Emmanouilidis, C. FlowExtract: Procedural Knowledge Extraction from Maintenance Flowcharts. arXiv 2026, arXiv:2604.06770. [Google Scholar]
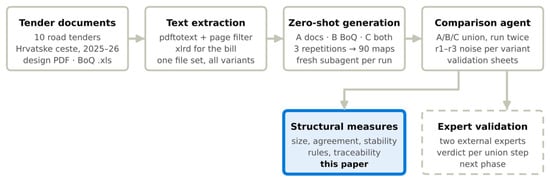
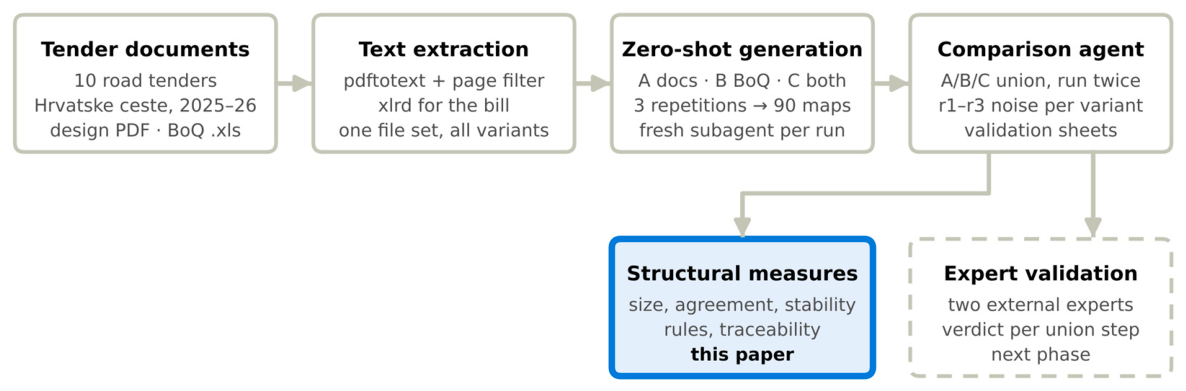
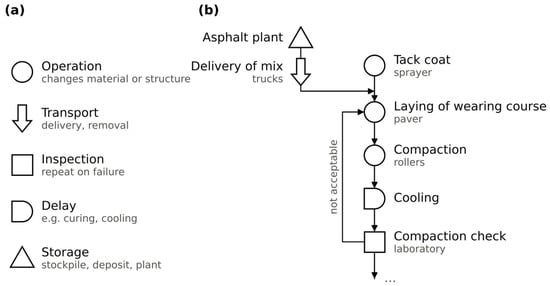
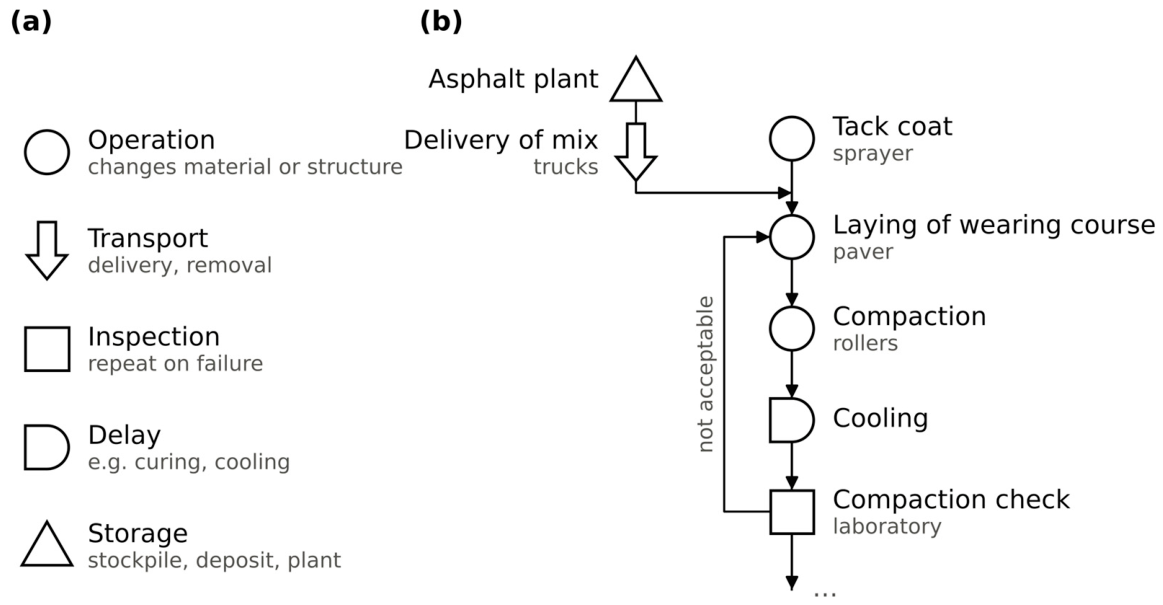
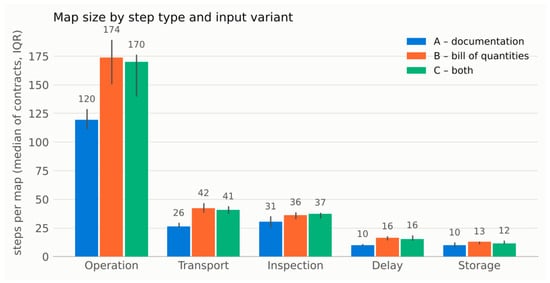
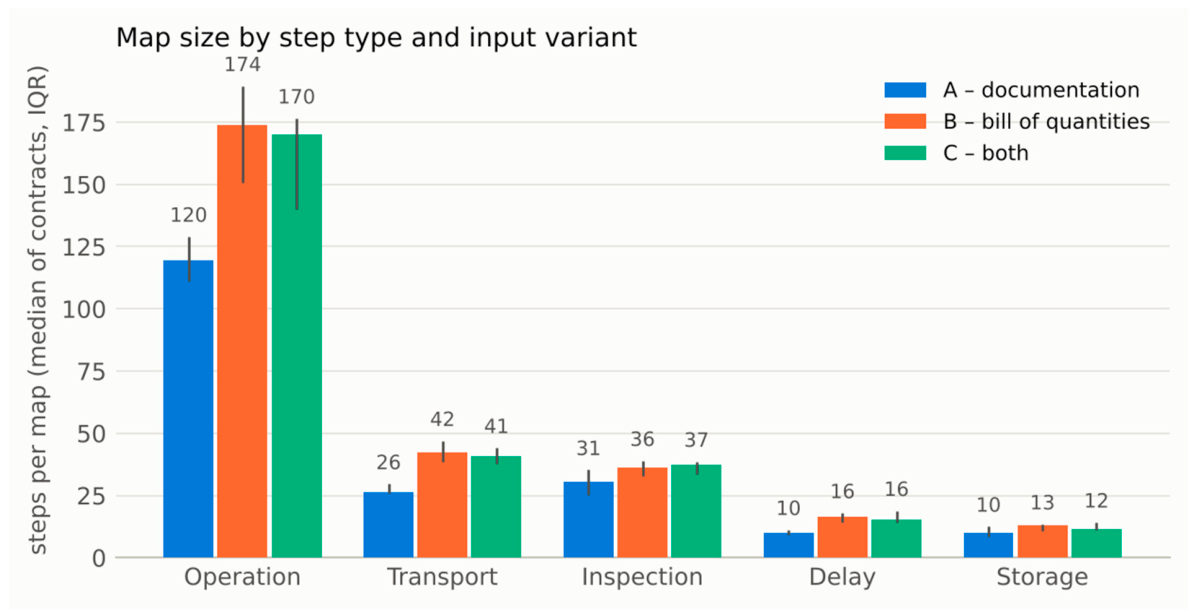
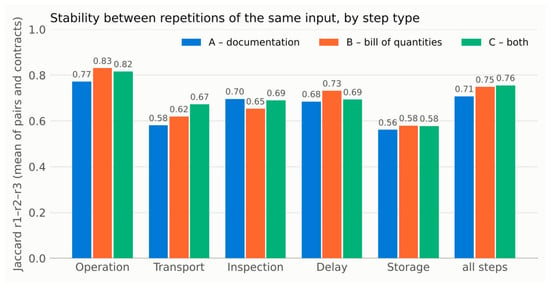
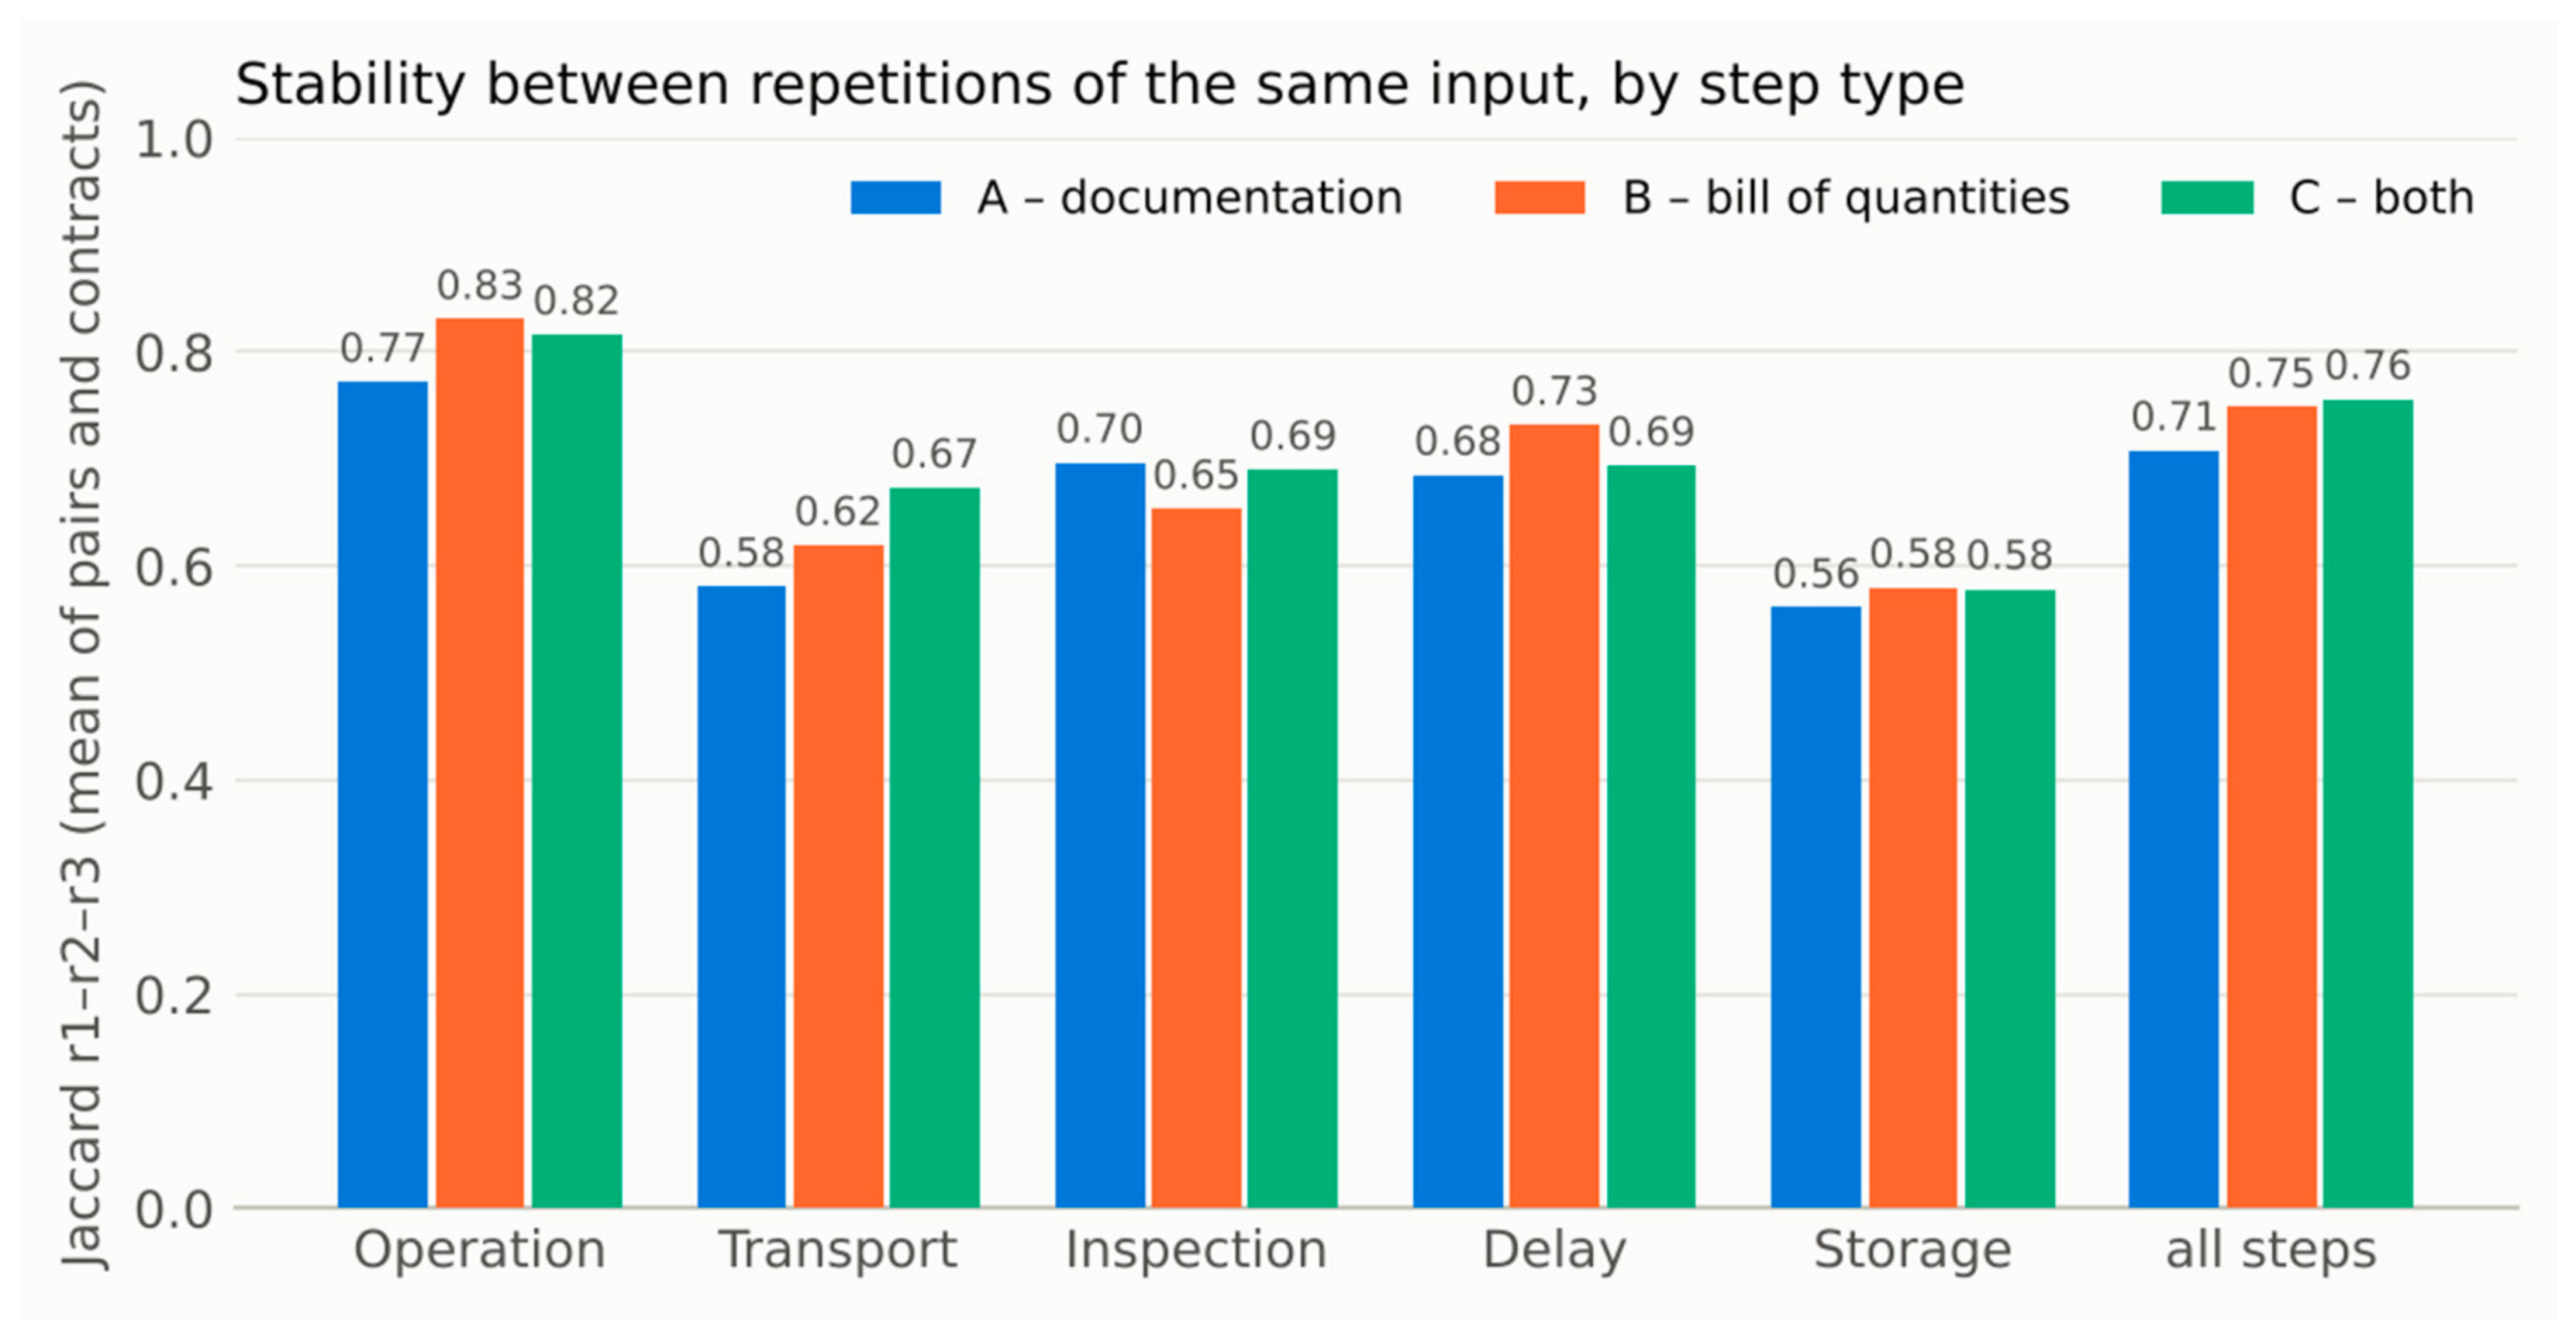
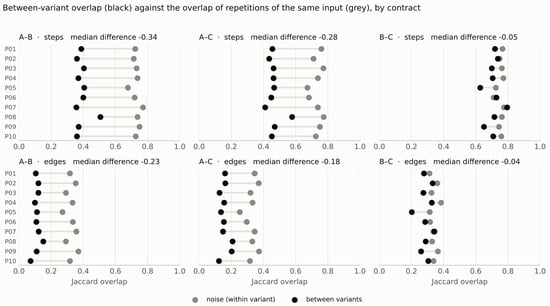
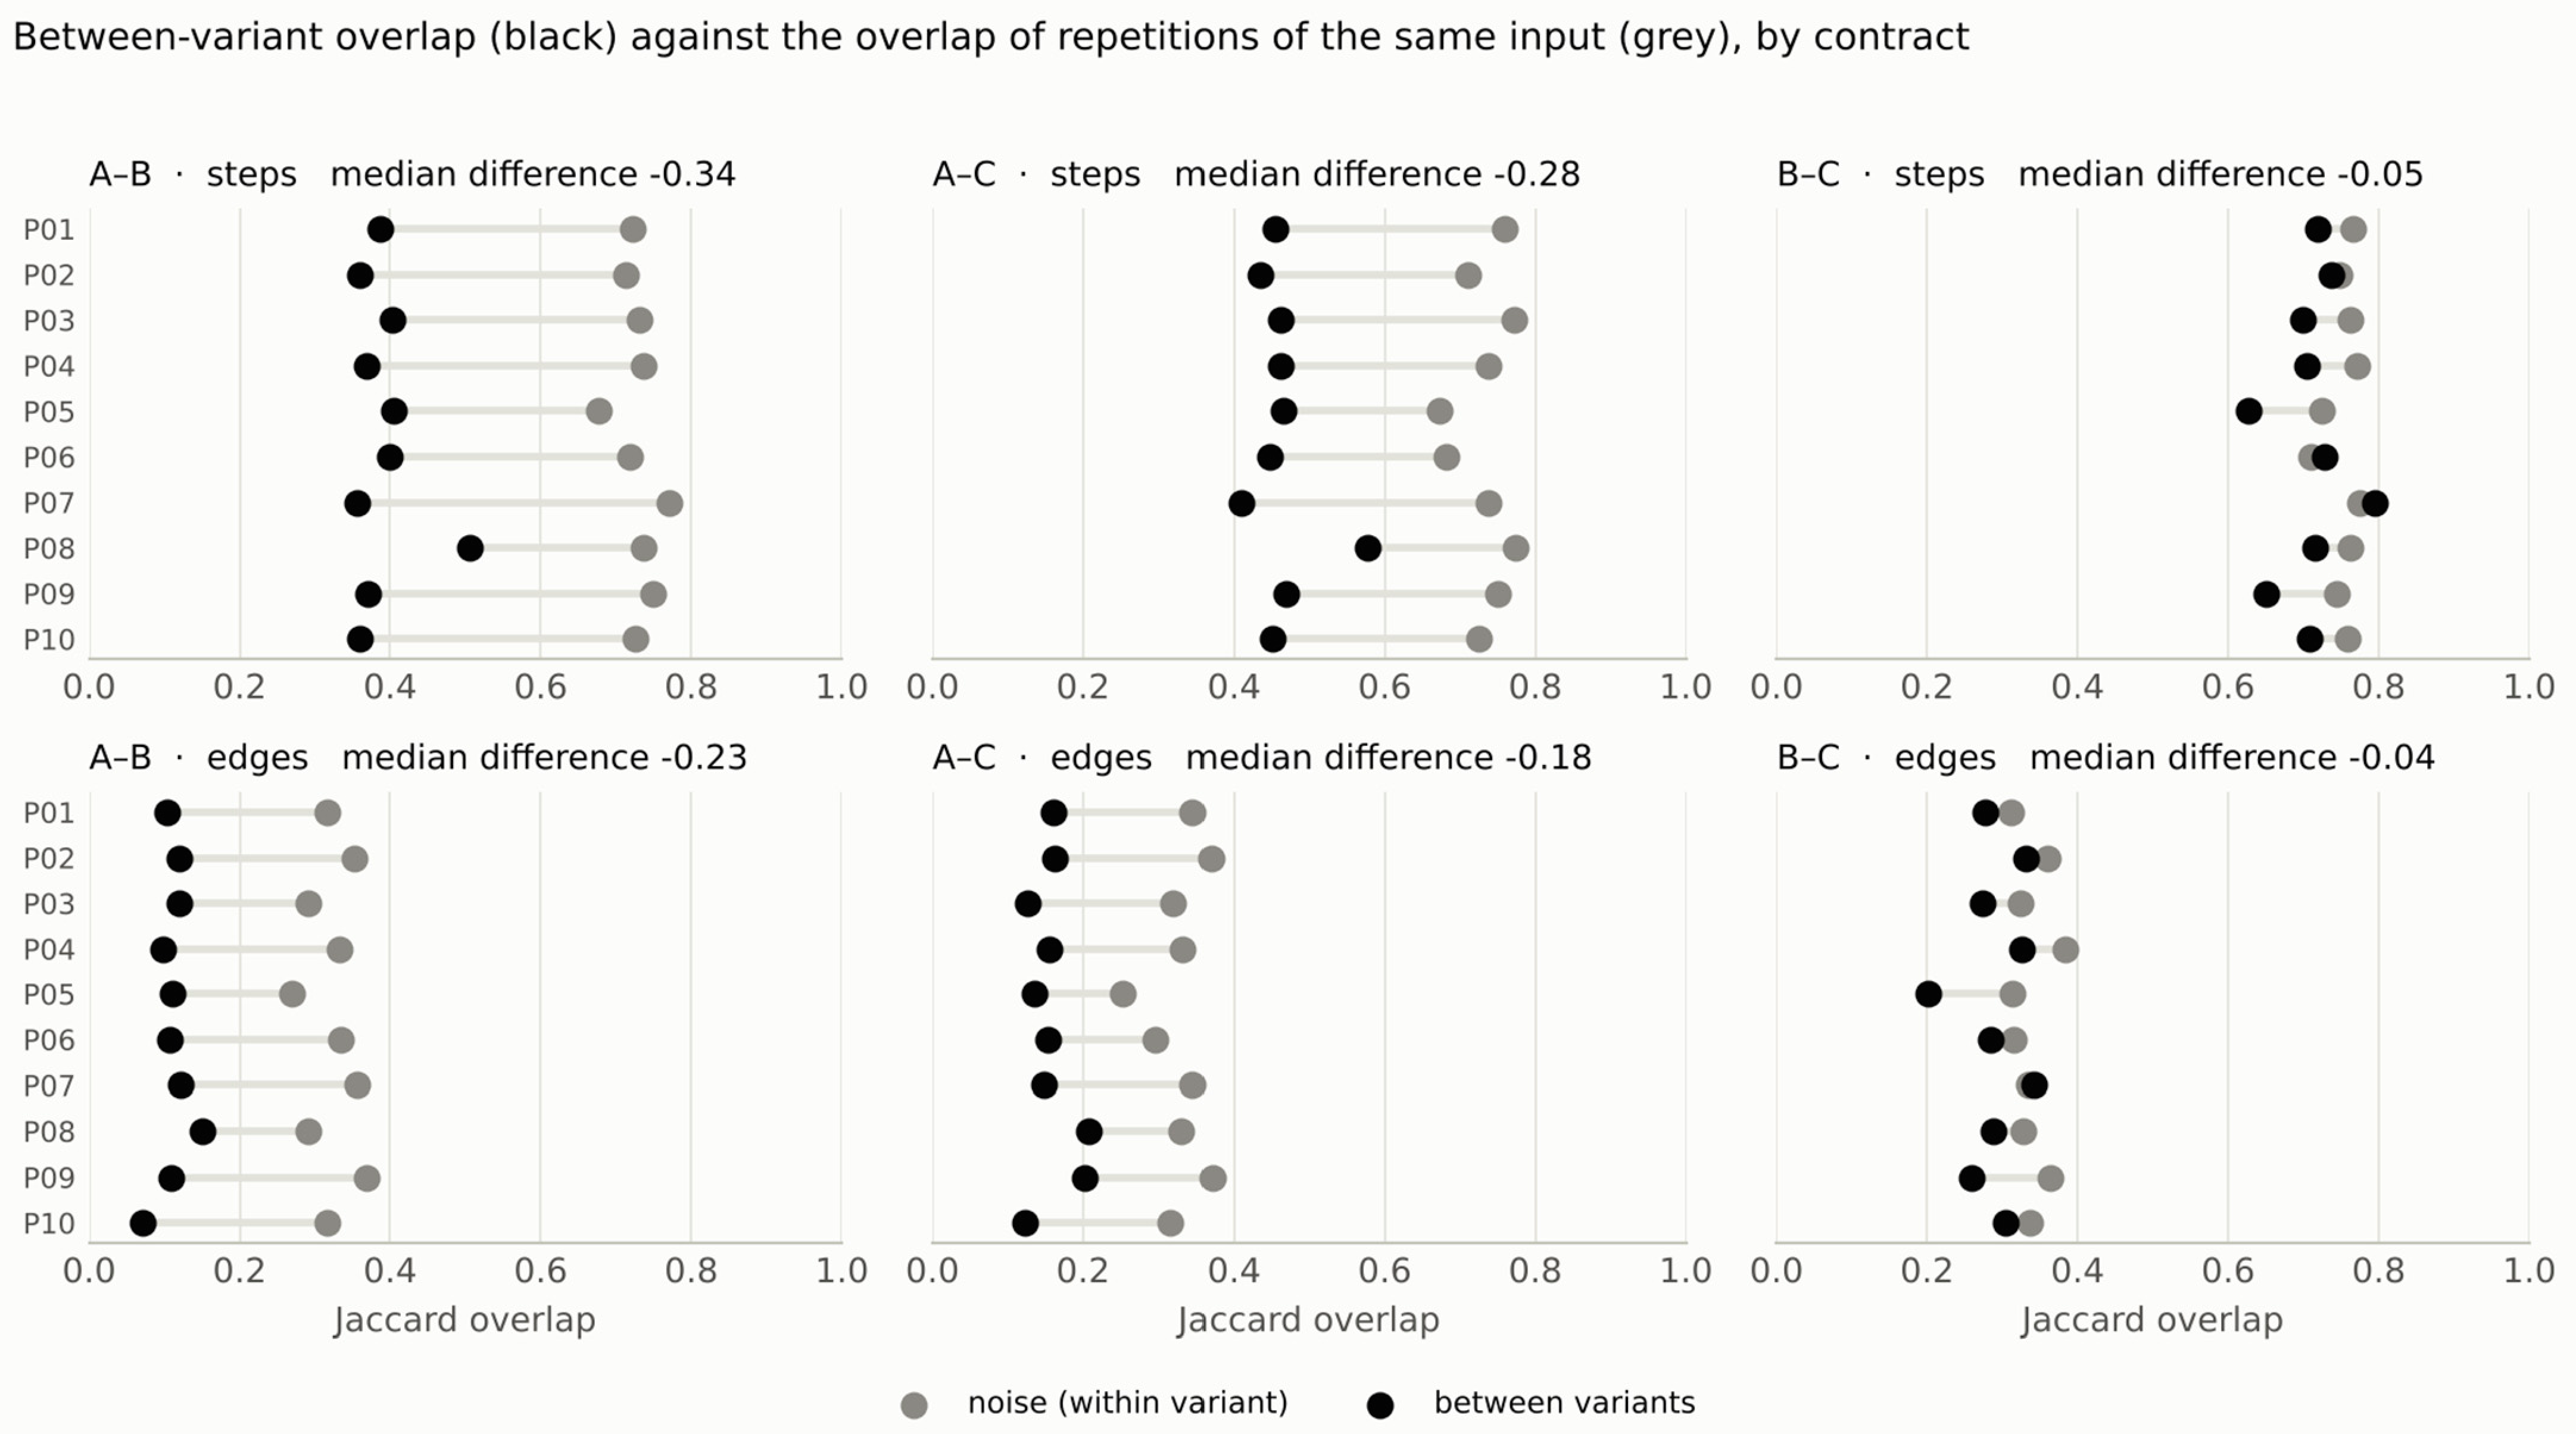
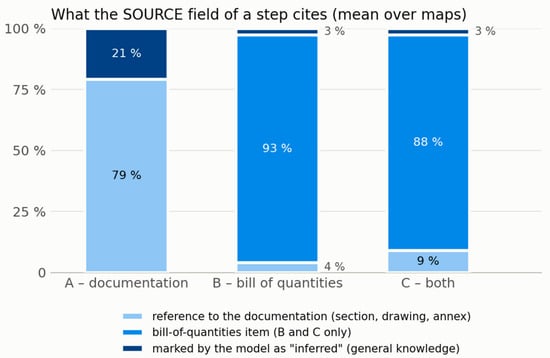
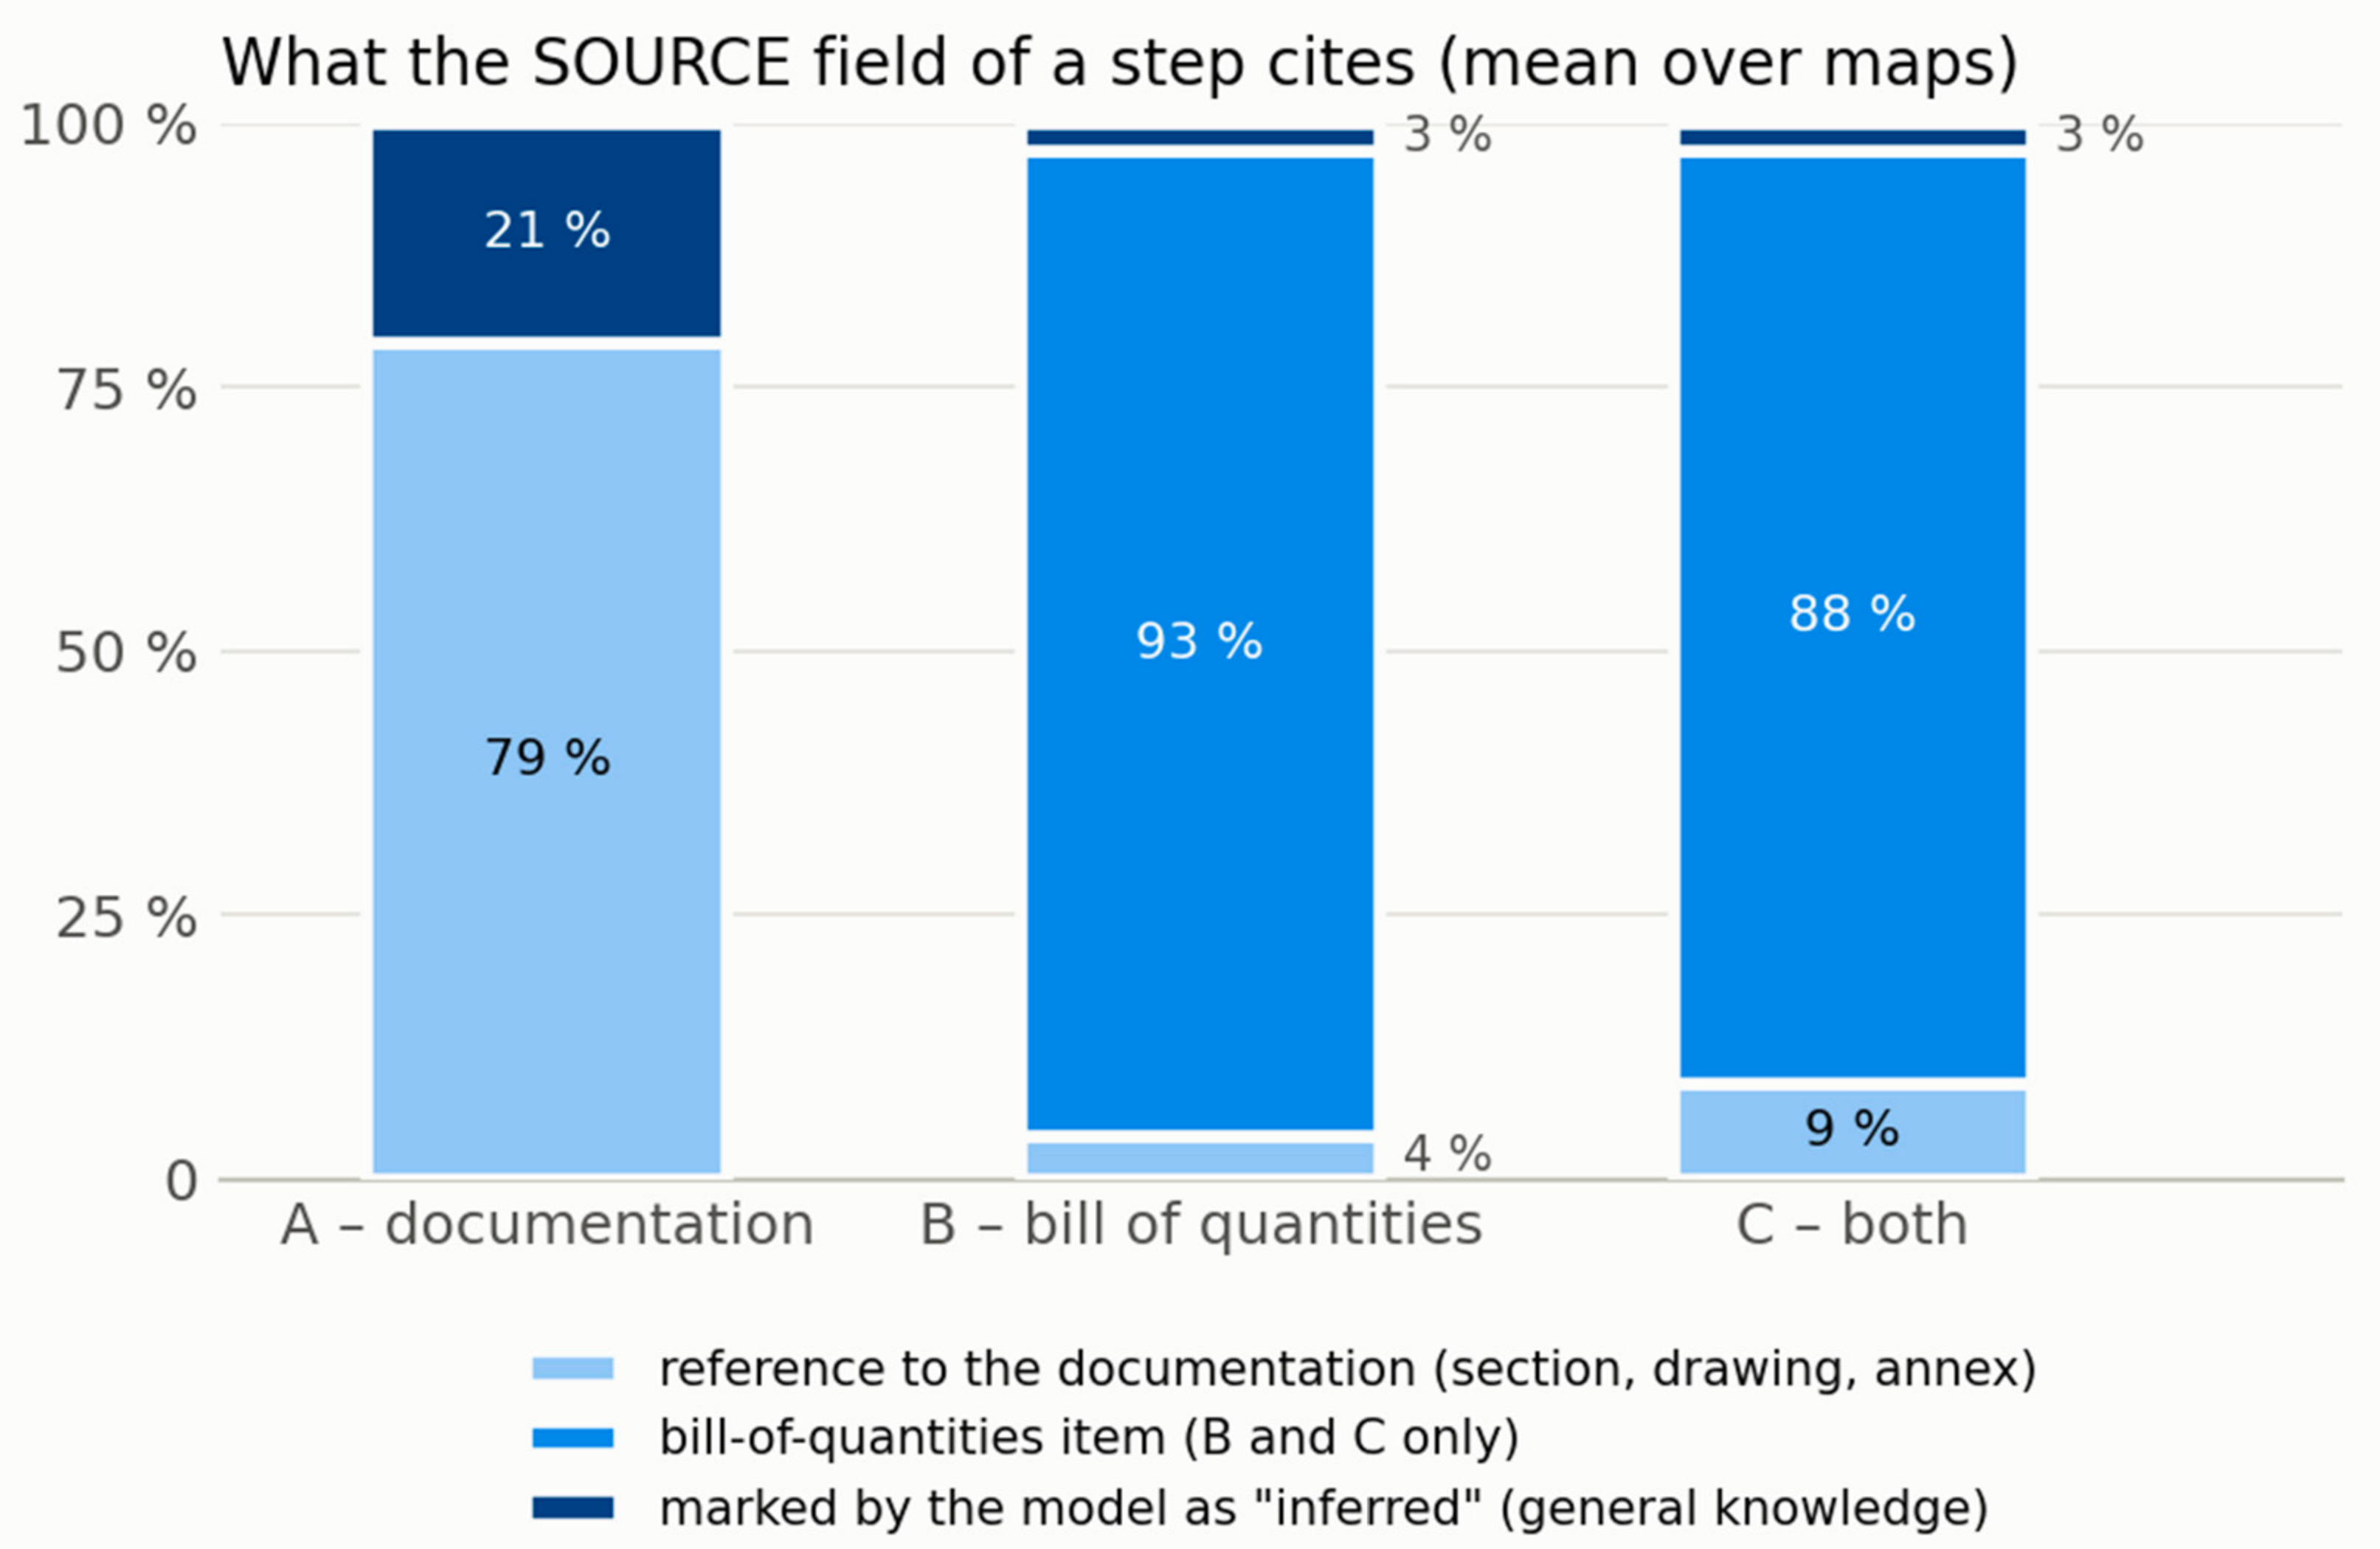

Disclaimer/Publisher’s Note: The statements, opinions and data contained in all publications are solely those of the individual author(s) and contributor(s) and not of MDPI and/or the editor(s). MDPI and/or the editor(s) disclaim responsibility for any injury to people or property resulting from any ideas, methods, instructions or products referred to in the content. |
© 2026 by the authors. Licensee MDPI, Basel, Switzerland. This article is an open access article distributed under the terms and conditions of the Creative Commons Attribution (CC BY) license.