


Abstract
Basalt-fiber-reinforced concrete (BFRC) has attracted increasing attention owing to its potential to enhance concrete performance under different loading conditions. Because of the complex interactions among mixture constituents and fiber characteristics, predicting its mechanical properties can be challenging. Therefore, this study develops six individual machine learning (ML) models and a hybrid ML model based on weighted voting techniques using the six developed learners to predict both the compressive strength (CS) and tensile strength (TS) of BFRC. The individual ML models include K-nearest neighbors (KNN), random forest (RF), extra trees regressor (ETR), extreme gradient boosting (XGBoost), Light GBM (LightGBM), and gradient boosting machine (GBM). The hyperparameter optimization is performed using both particle swarm optimization (PSO) and grey wolf optimizer (GWO). Additionally, a superior hybrid ML model based on the six learners is constructed to improve the prediction accuracy of CS and TS of BFRC. Two datasets with the same mixtures containing 227 samples each were compiled from literature using eight input features: cement (C), coarse aggregate-to-fine aggregate ratio (CAG/FAG), silica fume/cement (SF/C), fly ash/cement (FA/C), water/cement ratio (W/C), superplasticizer/cement (SP/C), basalt fiber length-to-diameter ratio (F_LD), and fiber content (F_%). Analysis reveals that SF/C has the greatest influence on CS predictions, followed by W/C, CAG/FAG, F_%, and C, while TS predictions are mostly influenced by CAG/FAG, W/C, F_LD, and F_%. Finally, a graphical user interface (GUI) is developed for predicting BFRC strengths using the base learners and the hybrid model.
1. Introduction
Concrete is one of the most widely used construction materials because of its availability, versatility, and ability to provide high compressive strength. Nevertheless, conventional concrete exhibits relatively low tensile strength, limited ductility, and susceptibility to cracking, which can adversely affect its structural performance and durability. Consequently, fiber reinforcement has been increasingly investigated as an approach to enhance the mechanical properties of cement-based composites. Among the different types of reinforcing fibers, basalt fiber (BF) has attracted considerable attention as it is produced from naturally occurring basalt rock and possesses high tensile strength, good chemical and fire resistance, and satisfactory resistance to impact and environmental degradation [1,2]. Basalt fibers are manufactured by melting and drawing basalt rock [3] and are generally considered an inorganic, non-metallic reinforcement material. Their favorable mechanical and durability characteristics have encouraged their use in concrete and other cementitious composites [1,4].
The inclusion of basalt fibers into concrete can modify cracking failure mechanisms of the cementitious matrix and consequently influence its compressive, tensile, and flexural properties. Experimental investigations have demonstrated that the addition of BF can improve the flexural and tensile performance of concrete where the magnitude of improvement depends strongly on fiber dosage, fiber length, fiber diameter, and the characteristics of the concrete matrix [4,5]. Wang et al. [4] reported that fiber length and volume fraction significantly affect the material properties and crack resistance of BFRC. Similarly, Meyyappan and Carmichael [6] observed improvements in compressive and splitting tensile strength with increasing basalt-fiber content up to an optimum level, after which the strength improvement diminished. Jalasutram et al. [7] also demonstrated that basalt fibers can improve the mechanical properties of concrete. These observations indicate that the effect of BF is not simply proportional to its dosage; instead, the mechanical response results from complex interactions among fiber characteristics, mixture proportions, and matrix properties.
The nonlinear nature of these interactions makes the accurate prediction of BFRC strength particularly challenging. In conventional empirical approaches, the relationships between mixture constituents and mechanical properties are commonly established through experimental programs involving repeated specimen preparation and testing. Although experimental investigations remain essential for understanding material behavior, they may require considerable time, labor, and financial resources, particularly when numerous mixture variables and fiber configurations are investigated [5,8]. Changing one mixture constituent can simultaneously alter several mechanisms governing strength development. Consequently, developing efficient predictive techniques capable of learning complex relationships from experimental data has become increasingly important.
Machine learning (ML) provides an attractive data-driven alternative for modeling such complex relationships. Unlike traditional regression formulations that generally require predefined mathematical relationships between independent and dependent variables, ML algorithms can learn nonlinear patterns directly from experimental datasets. ML has therefore been increasingly employed for predicting concrete strength and optimizing mixture characteristics. Previous studies have demonstrated the applicability of gradient-boosting algorithms, decision trees, random forests, artificial neural networks, support vector machines, and other ensemble techniques for concrete-strength prediction [9,10,11,12]. Li et al. [9] established a random forest model for predicting the CS of BFRC, while Li et al. [10] subsequently investigated a kernel extreme learning machine combined with a genetic algorithm. These studies demonstrated the potential of data-driven methods to capture the complex relationship between BFRC constituents and CS.
The application of machine learning (ML) for predicting the mechanical properties of cementitious materials, such as geopolymers and fiber-reinforced concrete, has been growing rapidly in recent years. A study by Zeng et al. [13] on predicting the strength of coal gangue-based geopolymers showed that XGBoost exhibited strong predictive accuracy with R2 of 0.882 for CS and 0.776 for flexural strength and pointed out the significance of dataset extension and generalization tests. The application of ML to BFRC has expanded considerably in recent years. Almohammed and Thakur [14] investigated soft-computing approaches for predicting the compressive strength of BFRC and subsequently considered concrete containing basalt and polypropylene fibers using artificial neural networks, random forests, and random trees [15]. Their studies further demonstrated the applicability of ML for BFRC strength prediction. More recently, multi-output ML has been applied to simultaneously predict the compressive, flexural, and splitting tensile strengths of BFRC. A study by Najmoddin et al. [16] evaluated AdaBoost, Random Forest, LightGBM, Gradient Boosting, XGBoost, and KNN within a multi-output framework and incorporated SHAP and partial dependence plots to investigate the influence of input variables. These developments demonstrate a transition from conventional single-property prediction toward more comprehensive data-driven modeling of the mechanical behavior of BFRC.
Optimization algorithms can further enhance the predictive capability of ML models by identifying suitable hyperparameter combinations and improving model generalization. Hybrid approaches combining ML algorithms with optimization techniques have been successfully applied to concrete-strength prediction. Golafshani et al. [11] demonstrated the potential of particle swarm optimization in conjunction with predictive modeling for concrete strength. More recently, hybrid ML approaches have been specifically developed for BFRC. A study by Irfan Ullah et al. [17] combined support vector regression with firefly, grey wolf, and particle swarm optimization algorithms for predicting compressive and tensile strengths of BFRC, demonstrating the potential of optimization-assisted ML for accurately modeling BFRC properties. A study by Kazemi et al. [18] developed a hybrid ensemble framework based on gradient boosting, random forest, and adaptive boosting for sustainable fiber-reinforced concrete and reported that the resulting model could capture nonlinear relationships between mixture parameters, fiber characteristics, and mechanical strength. Such studies indicate that optimization and ensemble learning can provide a promising pathway for improving prediction accuracy while reducing dependence on extensive trial-and-error experimentation.
Despite the demonstrated predictive capabilities of ML, a major limitation is the interpretability of complex models. Many high-performing ML algorithms work as black-box models, making accurate predictions but not clearly explaining how particular input variables contribute to the prediction [19]. This limitation is particularly important in civil and structural engineering, where engineering decisions should be supported by physically meaningful relationships rather than prediction accuracy alone. SHAP plots can quantify the impact of individual input parameters on model predictions. Such techniques can assist in identifying dominant mixture parameters, understanding nonlinear trends, and comparing ML-derived relationships with established concrete-material behavior.
Kulasooriya et al. [20] demonstrated the usefulness of applying both SHAP and LIME to tree-based models for BFRC and emphasized that explanations can vary according to the selected ML algorithm. The authors reported that different algorithms could produce different feature-importance magnitudes and rankings even when their predictive accuracies were comparable. Wickramasuriya et al. [21] applied SHAP-based explanations to BFRC strength prediction and identified important mixture and fiber-related variables governing compressive, tensile, and flexural strengths. These findings emphasize that predictive accuracy and model interpretability should be considered together when developing data-driven models for BFRC.
Recent research has continued to extend this field toward more sophisticated predictive and optimization frameworks. In a study by Zhu et al. [22], machine learning-based approaches were applied not only to BFRC strength prediction but also to constitutive modeling of BFRC, including optimization using particle swarm optimization [23]. Study by Abbas and Alharbi [24] developed hybrid ML models for both CS and TS predictions of BFRC, with the results demonstrating the ability of optimized models to capture nonlinear relationships among water-to-cement ratio, aggregate characteristics, and fiber parameters. Furthermore, a study by Vairagade [25] proposed an integrated predictive and design-optimization framework for BFRC under harsh environmental conditions, highlighting the continuing movement toward ML-based prediction and optimization of both mechanical and durability-related performance. These recent developments indicate that ML is evolving from a tool for simple strength prediction toward a broader framework for prediction, interpretation, and performance-oriented material design.
Nevertheless, several research challenges remain. Existing BFRC studies have frequently focused on a single mechanical property or a limited number of predictive algorithms. In addition, the performance of individual ML algorithms can be sensitive to hyperparameter selection, dataset characteristics, and the nonlinear interactions among concrete constituents and fiber parameters. Although explainable ML has improved the interpretation of BFRC prediction models, relatively limited attention has been given to integrating robust ensemble prediction, systematic optimization, multiple strength targets, and comprehensive interpretation within a unified framework. Moreover, the continuing expansion of BFRC datasets provides an opportunity to develop models that can simultaneously exploit the complementary predictive characteristics of several learning algorithms rather than relying on a single learner.
Therefore, further development of reliable and interpretable ML frameworks for BFRC is warranted. Such frameworks can provide an efficient means of estimating mechanical properties while reducing the dependence on extensive experimental trial-and-error procedures. They can also provide quantitative information regarding the relative importance and nonlinear influence of mixture constituents and fiber characteristics, thereby supporting the development of more efficient BFRC mixtures. Accordingly, the application of advanced ML, optimization, and ensemble learning, represents a promising direction for improving the prediction, interpretation, and practical design of basalt-fiber-reinforced concrete. Table 1 shows an overview of previous studies focused on predicting the mechanical properties of concrete utilizing ML.
Table 1.
Review of previous research with ML models.
This research develops a hybrid ML model based on six individual optimized ML models for prediction of the CS and TS of BFRC. The base learners are ETR, XGBoost, LightGBM, GBM, KNN, and RF. Hyperparameter optimization is employed, utilizing both GWO and PSO. The developed hybrid ML model is based on weighted voting techniques. SHAP plots based on the developed hybrid model are generated to evaluate the impact of each input parameter on the output. Then, a GUI is developed to provide predictions for the CS and TS of BFRC.
2. Methodology
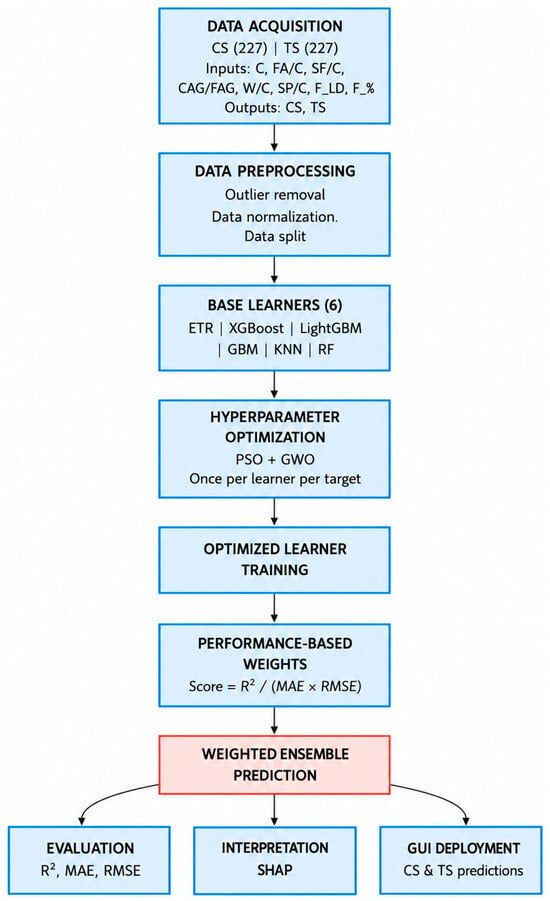
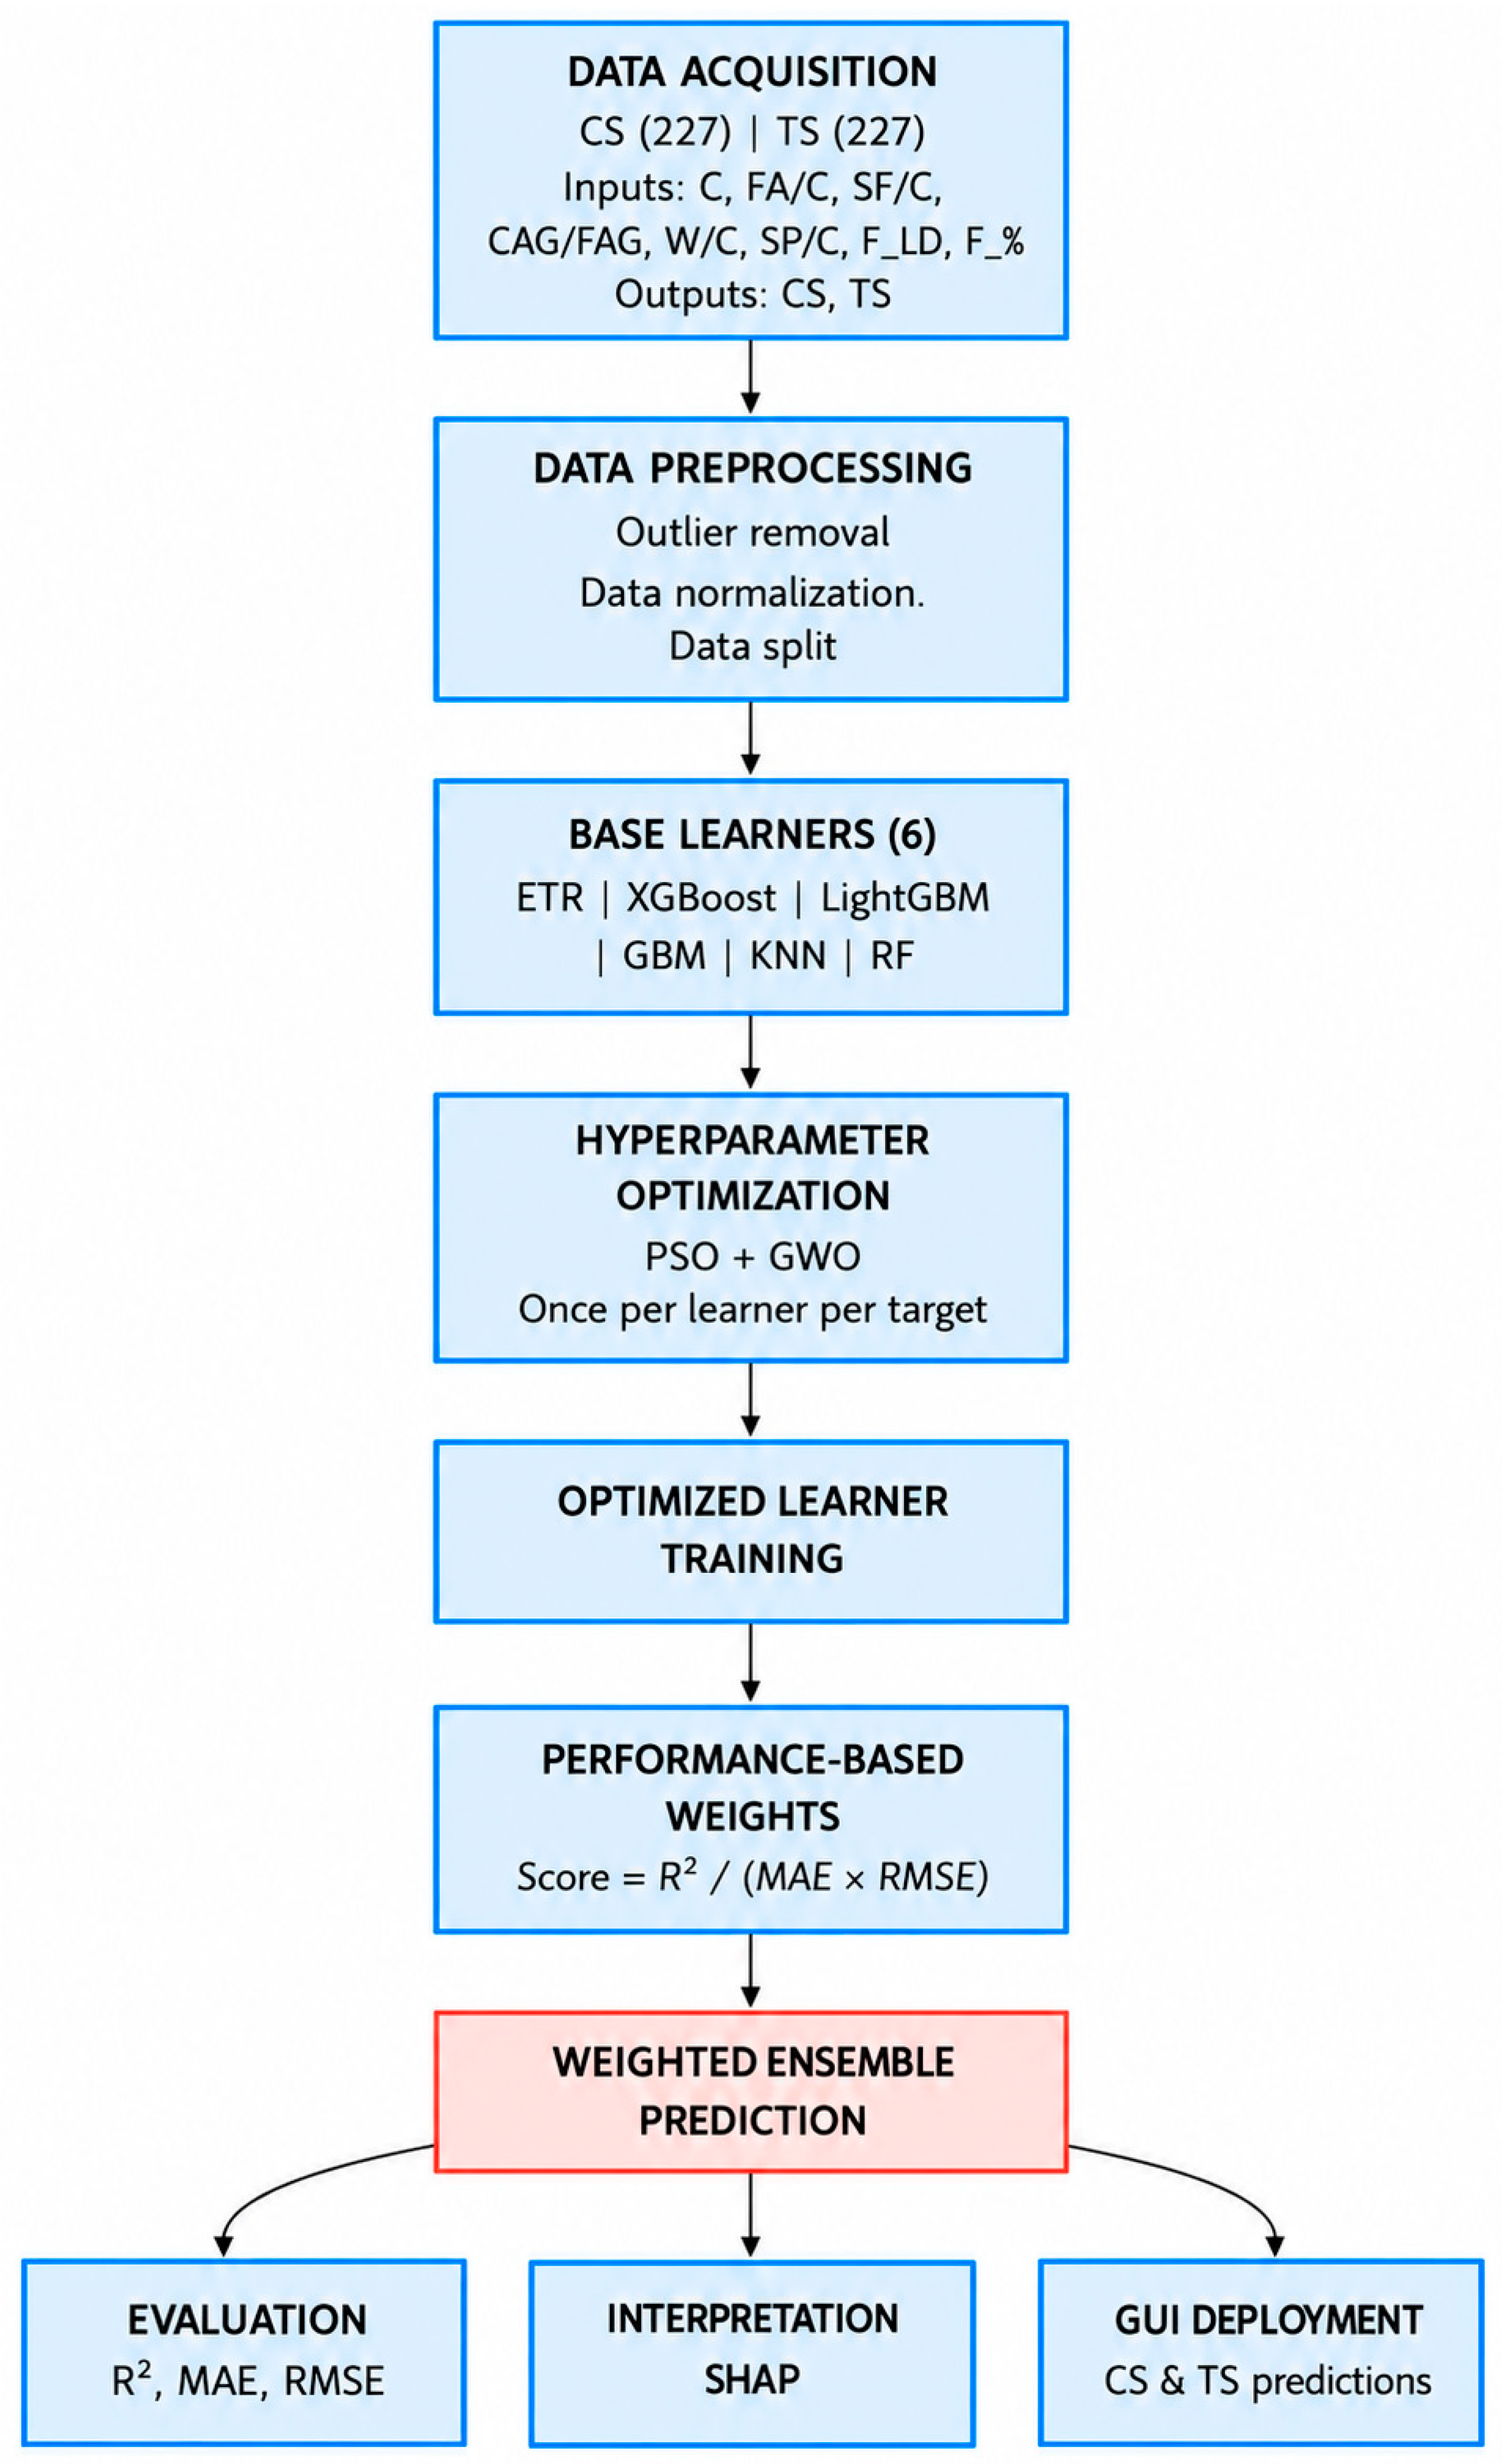
This study develops a hybrid machine learning framework for predicting the compressive strength and tensile strength of BFRC. The framework integrates six optimized base learners with a performance-based weighted ensemble strategy, complemented by explainable (SHAP) analysis and a graphical user interface (GUI) for practical deployment. The methodology used is presented in Figure 1.
Figure 1.
Detailed methodology.
2.1. Dataset and Preprocessing
2.1.1. Dataset Description
Two parallel datasets were compiled from Minghui et al.’s [28] experimental study for CS and TS prediction of BFRC, each comprising 227 samples. The two datasets, therefore, represent paired measurements on the same set of mixture designs. The input variables are cement (C), coarse aggregate-to-fine aggregate ratio (CAG/FAG), fly ash/cement (FA/C), silica fume/cement (SF/C), water/cement ratio (W/C), superplasticizer/cement (SP/C), basalt fiber length-to-diameter ratio (D_LD), and fiber content (F_%). The outputs are the compressive strength (CS) and tensile strength (TS).
Table 2 shows the descriptive statistics for the CS and TS datasets used in the analysis. It includes eight input variables and two output variables. The ranges and dispersion levels of the input variables are diverse. The values for cement (C) are between 217 and 543 with an average of 405.3, a standard deviation (SD) of 67.97, and a moderate negative skewness of −0.995. The fly ash/cement (FA/C) varies from 0 to 0.67 and has a mean of 0.131 and SD of 0.15, showing positive skewness (0.643) and negative kurtosis (−0.876). The values of silica fume/cement (SF/C) are between 0 and 0.43, with a relatively low mean of 0.036 compared to a SD of 0.07. The high positive skewness (2.356) and kurtosis (5.622) indicate a strong asymmetric distribution with a clustering of observations at the lower end, with relatively high values occurring less often. The coarse aggregate to fine aggregate ratio (CAG/FAG) varies from 0.67 to 2.52, with a mean value of 1.558 and SD of 0.39. The low skewness (0.141) and kurtosis (−0.162) indicate that the distribution is almost symmetric. The water/cement ratio (W/C) ranges from 0.31 to 0.64 with a mean of 0.444 and SD of 0.06. Its positive skewness (0.466) and negative kurtosis (−0.287) suggest a somewhat right-skewed distribution. The superplasticizer/cement (SP/C) varies from 0 to 0.02 with a mean value of 0.008 and SD of 0.005. It has moderate negative skewness (−0.704) and negative kurtosis (−0.947). The basalt fiber length-to-diameter ratio (F_LD) is between 345 and 2000, with a mean of 1066 and SD of 378. Its very slight positive skewness (0.186) and negative kurtosis (−0.24) imply a rough symmetric distribution. Fiber content (F_%) varies between 0 and 0.5, with a mean of 0.116 and SD of 0.09, while positive skewness (1.197) and kurtosis (1.995) indicate a right-skewed distribution. The two output variables have the following ranges: the compressive strength (CS) has a range of 25.44 to 69.9 with a mean of 49.2, SD of 11.5, skewness of 0.051, and negative kurtosis of −0.702, showing a relatively flatter distribution than the normal distribution. The tensile strength (TS) has a range of 2.2 to 9.8, with a mean of 4.5 and SD of 1.83. The positive skewness (1.231) and kurtosis (0.886) indicate a moderate right-skewed distribution.
Table 2.
Statistical details of the database.
2.1.2. Data Pre-Processing
Data cleaning: Removal of outliers utilizes the IQR method. The outlier check for the two responses is shown in Table 3. The CS response does not have outliers with fences 16.998–83.138, suggesting that there are no extreme CS values using this criterion. On the other hand, there are 12 (5.3%) outliers for the TS response, all on the high side (>8.84) since the lower fence is negative (−0.2) for a positive-bounded variable.
Table 3.
Outliers details for the two responses.
Feature scaling: Standardization (Z-score normalization) is applied to all input variables to ensure uniform contribution during distance-based learning and optimization.
Train–test split: Data are partitioned into training and testing subsets of 75% and 25%, respectively, utilizing random sampling.
2.1.3. Correlation Analysis
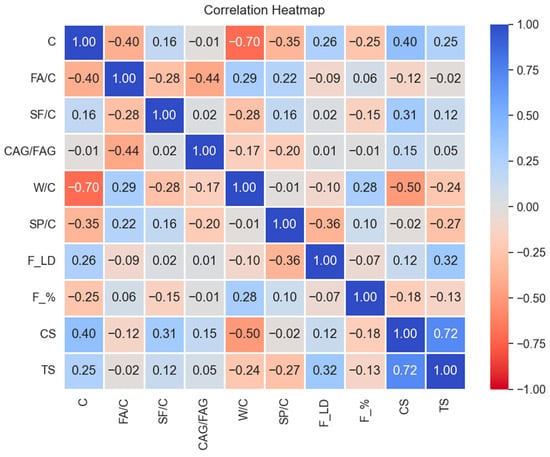
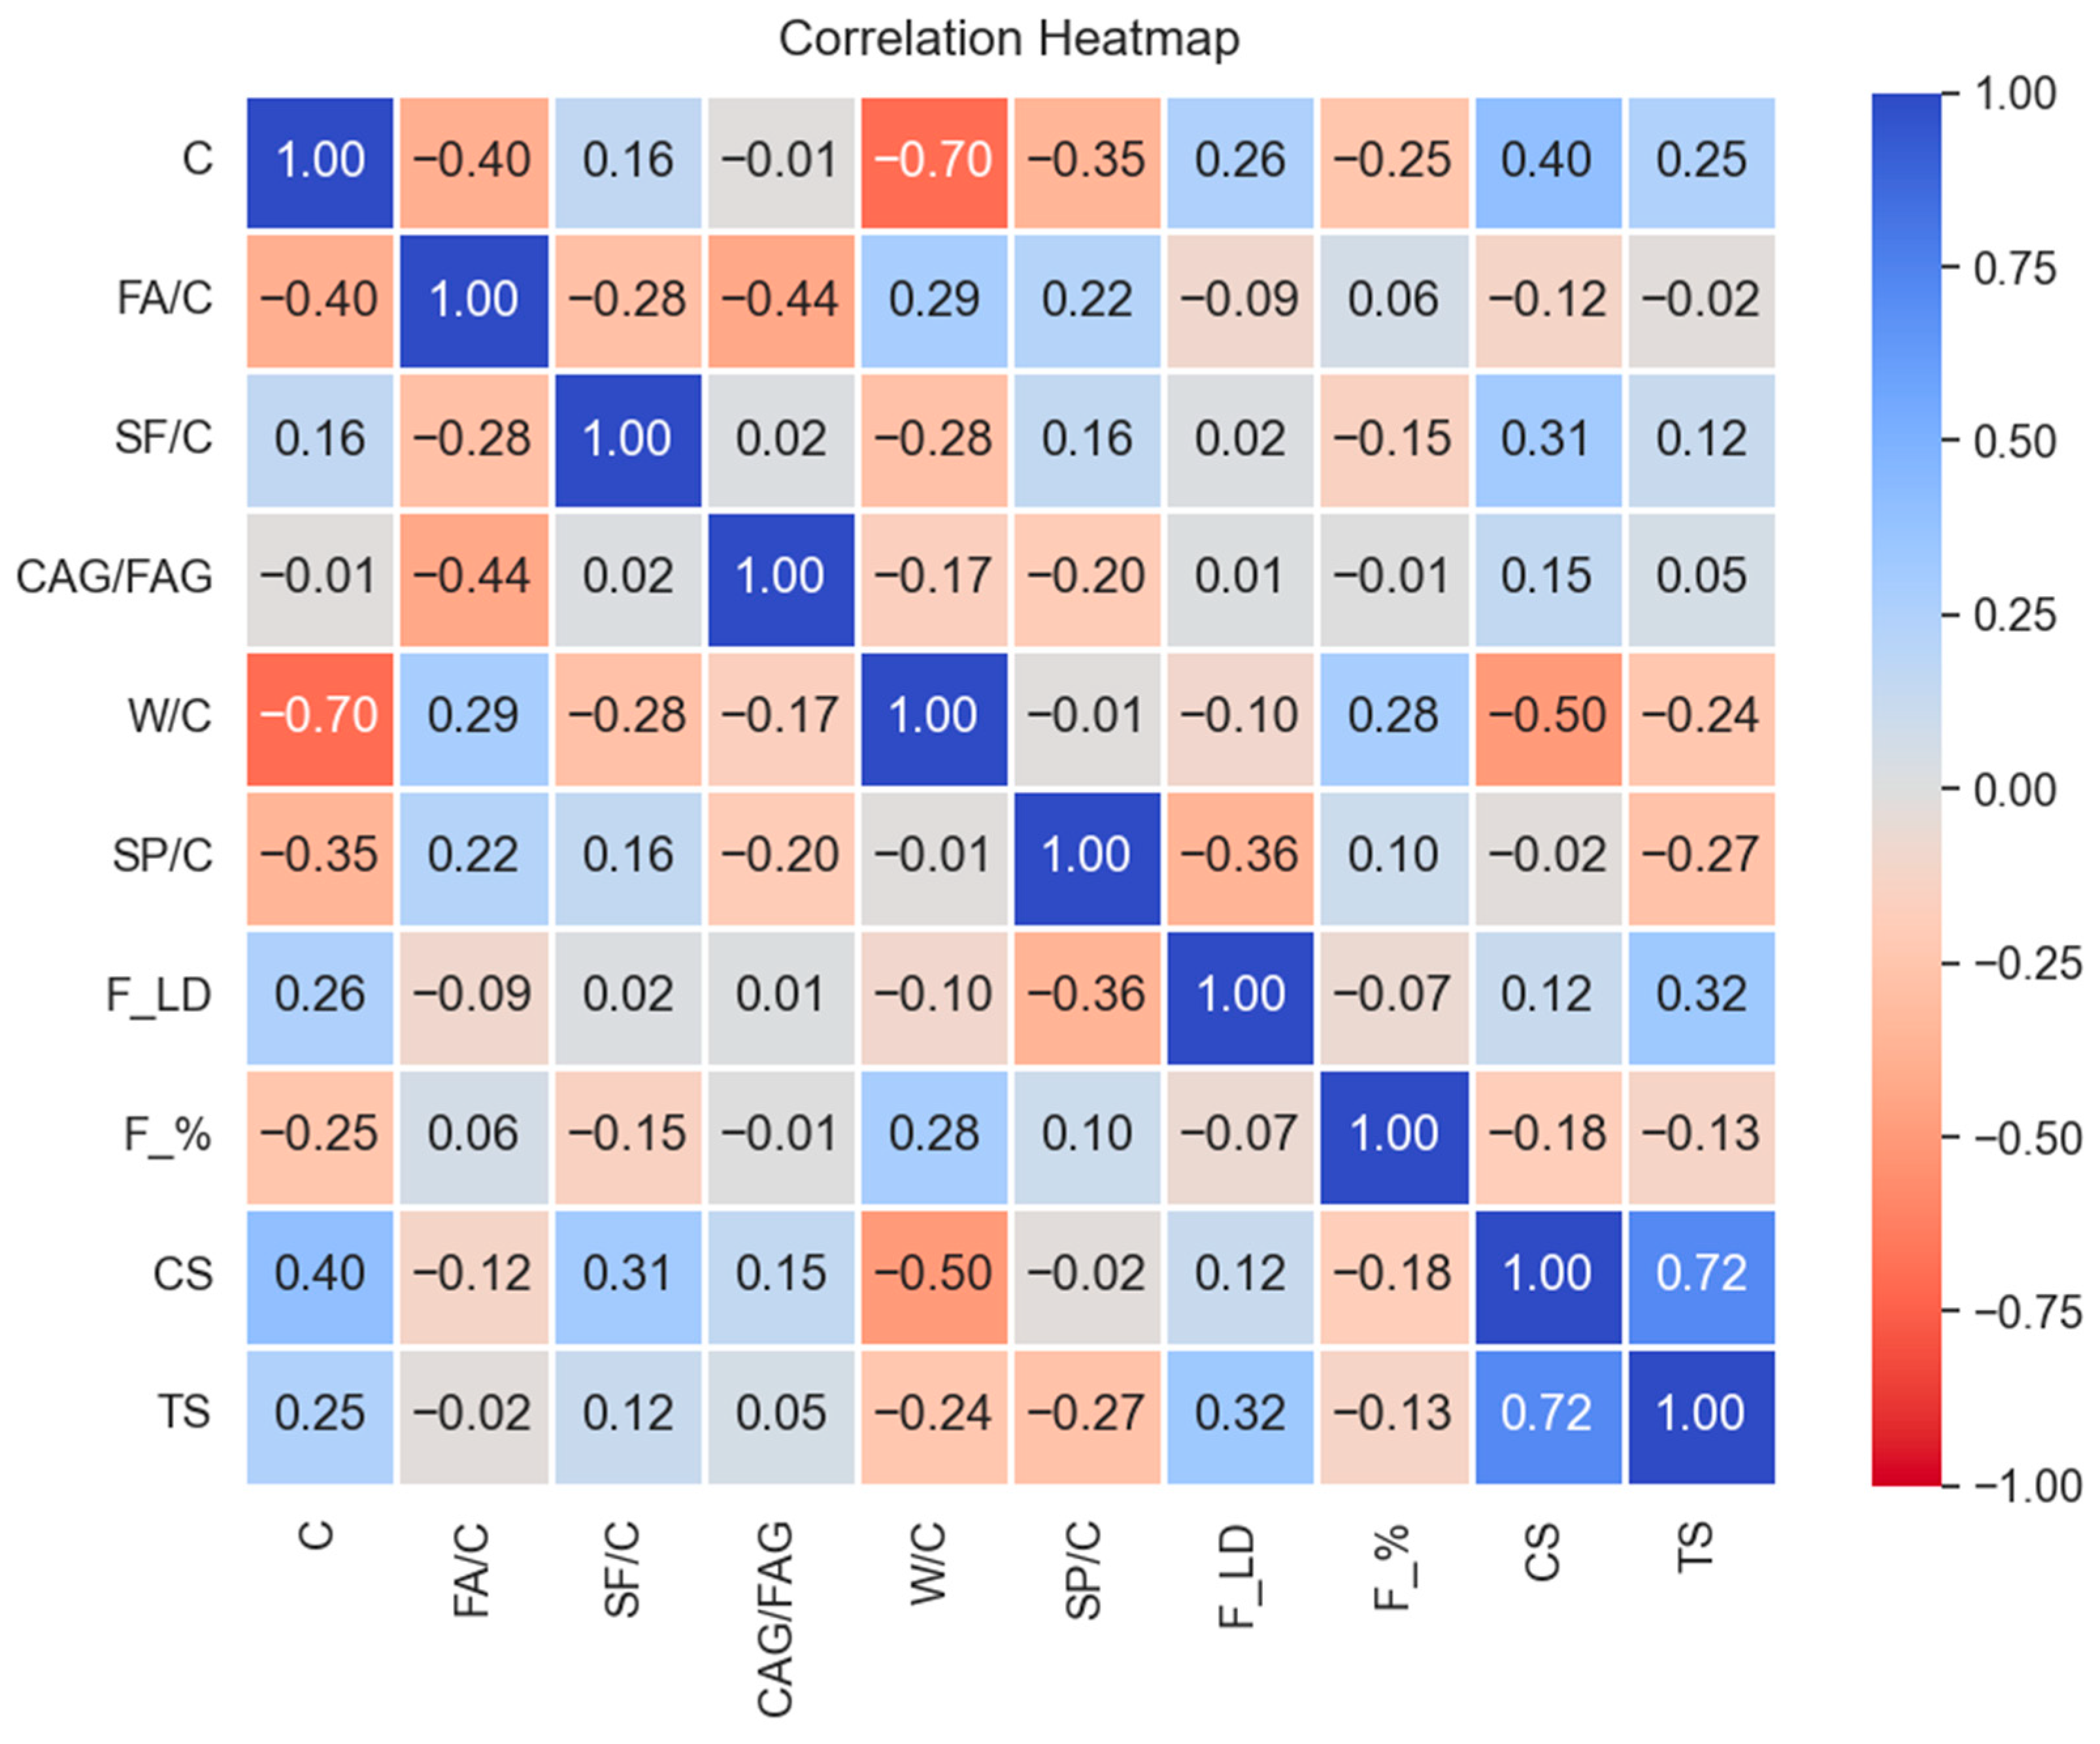
A Pearson correlation matrix is employed to assess the relationship among input variables and output variables. Figure 2 displays the Pearson correlation matrix of the mixture contents and both compressive strength (CS) and tensile strength (TS). For compressive strength, the highest positive correlation with CS is cement content (C) (r = 0.4) followed by SF/C (r = 0.31), which means that the increase in these variables relates to higher compressive strength. CAG/FAG, likewise, correlates positively but relatively weak-to-moderate with CS (r = 0.15). F_LD has mild positive correlation (r = 0.12). In contrast, F_% shows a negative correlation with CS (r = −0.18), showing that the higher fiber content is directly correlated with a decrease in the compressive strength for the dataset studied. W/C has highest negative correlation (r = −0.5), while FA/C has a very modest negative association with CS (r = −0.12). For tensile strength, the highest positive correlation with TS is F_LD (r = 0.32) followed by cement content (C) (r = 0.25). SF/C has mild positive correlation (r = 0.12). TS is strongly negatively correlated with W/C (r = −0.24) and SP/C (r = −0.27). In contrast, TS had weak correlation with CAG/FAG (r = 0.05) and FA/C and (r = −0.02). The correlations between input variables also show several interesting relationships, such as a negative correlation between FA/C and CAG/FAG (r = −0.44) and SP/C and F_LD (r = −0.36) for the CS dataset.
Figure 2.
Heatmap of Pearson correlation matrix for CS and TS datasets.
2.1.4. Variance Inflation Factors (VIF)
Table 4 displays the values of variance inflation factors (VIFs) used to test for possible multicollinearity among the variables in the prediction data set. The VIF results indicate relatively low to moderate multicollinearity among the predictors in both datasets. The largest VIF is associated with cement content (C; 3.52), followed by the water-to-cement ratio (W/C; 2.91). All VIF values are lower than the widely used threshold of 5. Therefore, the results suggest that there is no considerable multicollinearity among the examined variables.
Table 4.
Variance inflation factors (VIFs).
2.2. Proposed ML Model
Six diverse base learners, random forest, extra tree regressor, extreme gradient boosting, gradient boosting machine, light gradient-boosting machine, and k-nearest neighbors, in addition to a hybrid model, were selected to capture complementary patterns in the data.
2.2.1. Extra Trees Regressor (ETR)
ETR is an extension of the RF technique by Geurts et al. [29]. Both techniques use the bootstrap aggregation technique and fit several decision tree models for regression. The main difference between ETR and RF is that ETR (1) randomly chooses the split points during partitioning of node and (2) uses all the training data to lessen the bias. The ETR method also has two important parameters for controlling the sample size to divide nodes and managing the random selection of features. These two parameters make the model more robust by avoiding overfitting and enhancing the predicted accuracy [30]. The present work employed hyperparameter optimization for ETR.
2.2.2. Extreme Gradient Boosting (XGBoost)
Chen et al. [31] proposed the XGBoost method. The approach adds a regularization term to the traditional gradient-boosted trees, which controls the model’s complexity to avoid the overfitting risk. XGBoost is also optimized for huge datasets, simultaneous calculations, decision tree pruning, and missing value processing. It is utilized since it has demonstrated superior performance in a variety of industries. Consider a regression issue. The objective function includes an optimization of the XGBoost model’s complexity.
2.2.3. Gradient Boosting Machine (GBM)
The GBM algorithm is comparable to the RF algorithm in its working mechanism. However, the GBR model is based on an ensemble of base learners, which can provide better predictions in some types of classification or regression tree problems [32]. It can be interpreted as a numerical approach of optimization [33] to build an additive model by minimizing the loss function at each step.
2.2.4. Light GBM
LightGBM is an extension of gradient boosting DT. It is a supervised learning technique based on decision tree learners that fits gradients. Decision tree regression is a machine learning technique that predicts a continuous output value based on one or more input features. It also uses a serial training technique to integrate the predictions of the “weak” base learner into a “strong” one [34]. Boosting is a stage-wise, optimized strategy that combines multiple regression tree models linearly. Gradient boosting is a boosting method that fits the current iteration’s residuals by adjusting the current label to minimize the difference between the actual and predicted values by changing the target. It is meant to reduce training errors and losses throughout the process.
2.2.5. K-Nearest Neighbors (KNN)
KNN is a very effective ML method that is renowned for its capability to solve regression issues and categorize large datasets [16]. For regression issues, the nearest observations average value is used to predict a simultaneous target variable [35]. However, KNN cannot function accurately if the data has numerous variables, making it difficult to define the distance between observations. This renders KNN effective computation-wise in the training stage but slow to operate in prediction.
2.2.6. Random Forest
The RF regressor is an ensemble regressor that makes predictions based on a group of regression trees [36]. The DTs are formed via bagging, which is the process of randomly choosing a chunk of training data and replacing it. This approach has the possibility of selecting some samples multiple times [37]. The trees are trained using 2/3 of the data points, which are in-bag samples. The other 1/3 is utilized for internal cross-validation to assess the RF model’s performance. RF is suitable for regression applications since it is very robust with large feature sets. Furthermore, it may consider interactions between predictors as well as the availability of high-quality and free implementations.
2.2.7. Hybrid ML Model
The hybrid model used in this study was performance-based weighted ensemble. Each base learner’s contribution to the final ensemble was weighted based on prediction performance. Three metrics were used: coefficient of determination (R2), mean absolute error (MAE), and root mean squared error (RMSE). Higher values of R2 and lower values of MAE and RMSE indicate better results.
The weights are computed using training data set. The score formula used for each learner is shown in Equation (1). The weights are calculated using Equation (2). The predictions from the hybrid model are calculated using Equation (3).
where is the number of base learners.
2.3. Hyperparameter Optimization
2.3.1. Grey Wolf Optimizer
The gray wolf optimizer (GWO) is a sophisticated program that models natural gray wolf leadership structures and hunting mechanics. Because of its balance of exploration and exploitation in the search space, this approach has shown satisfactory results in hyperparameter optimization of ML models. To use GWO for hyperparameter optimization, first define the search space. Then, GWO generates a random population of gray wolves, each representing a distinct set of hyperparameters, trains the ML model using each gray wolf’s hyperparameters, and assesses its performance using a preset metric [38]. The GWO then adjusts the wolves’ placements depending on the fitness ratings [39].
2.3.2. Particle Swarm Optimization
PSO is a common method for optimizing the hyperparameters in machine learning due to its simplicity [39]. A swarm in PSO consists of multiple particles, each of which represents a possible solution in the hyperparameter search space. The PSO method begins by forming a swarm of particles. Each particle has a position, which indicates a set of hyperparameters, and a velocity, which specifies the distance and direction the particle will travel in the next iteration [38]. The particle’s best location is Pbest, but the best position for all particles in the swarm is believed to be Gbest. The main principle behind PSO is to update each particle’s velocity and position [40]. This is influenced by the particles’ and swarm’s optimal experiences. PSO uses inertia weight to balance exploration and exploitation.
Hyperparameter tuning was accomplished using both PSO and GWO. PSO enables quick global exploration while GWO improves exploitation via hierarchical leadership-based search. After hyperparameter tuning using both techniques, the algorithm selects the optimum technique for each model based on its ability to achieve the lowest RMSE. Table 5 shows algorithm-specific search spaces for the six base learners. The estimators range from 100 to 700. The max_depth ranges between 3 and 20. The tree-structure controls such as minimum samples per split and leaf and maximum features. ETR and RF also consider both bootstrap settings. For the boosting algorithms, the learning-rate range is 0.01–0.30 and the subsampling range is 0.60–1.00. XGBoost, GPM, and LightGBM also tune column subsampling and regularization. XGBoost includes minimum-child-weight and gamma. LightGBM additionally searches 10–100 leaves and 5–50 minimum child samples. KNN uses 2–30 neighbors, uniform or distance weighting, p values from 1 to 2, and leaf sizes of 10–80. These ranges allow each learner to be tuned according to its structure, balancing model flexibility and regularization within the defined search limits.
Table 5.
Hyperparameter ranges.
2.4. Performance Evaluators
Equations (1)–(3) provide the expressions for calculating the most frequent performance metrics. Each ML model performance is evaluated. The coefficient of determination (R2) is an important measure in regression analysis. It is more informative to calculate the prediction error than to evaluate the explanatory power of the model as given by Equation (4). The mean absolute error (MAE) is defined by Equation (5) as the average of the absolute disparities between the predicted and measured values. The root mean squared error (RMSE) given by Equation (6) is the square root of the average of the squared differences; hence, it pays more weight to significant errors.
2.5. Model Interpretability
SHapley Additive exPlanations (SHAP) were used to the highest-performing ensemble to quantify feature contributions. SHAP summary plots show the global feature importance ranking and the direction and amount of each feature’s effect.
The SHAP values for the final weighted ensemble were calculated by applying separately to each tree-based learner and then combining the resulting SHAP values using the corresponding ensemble weights. The weighted SHAP values were computed using Equation (7).
where is the SHAP value for feature j from tree-based learner m, is its ensemble weight, and T includes the base learners.
2.6. GUI Development
A graphical user interface (GUI) was designed to allow practical implementation. The GUI reads eight input variables as user inputs and outputs anticipated CS and TS values in real time.
3. Results and Discussions
3.1. Hyperparameter Used Values
The results of hyperparameter optimization in Table 6 and Table 7 show that the best configuration of each ML method is highly reliant on the predicted strength property. The optimized models based on tree algorithms generally used very large tree depths for CS, especially RF (depth = 18), ETR (depth = 16), and LightGBM (depth = 14), whereas for TS models, RF (depth = 17), ETR (depth = 14), XGBoost (depth = 11), LightGBM (depth = 9), and GBM (depth = 6). This discrepancy indicates that the optimization technique found different complexity levels for the model for the two strength attributes. The number of estimators varied widely between techniques reflecting the relationship between ensemble size, tree complexity, learning rate, and regularization. For example, the CS XGBoost model used 700 estimators with depth 6, while the TS model used 155 estimators with depth 11. Similarly, the CS RF configuration included 546 estimators with a maximum depth of 18, whereas TS used 331 estimators with a depth of 17. The optimization process did not only enhance the complexity of the model but rather searched for a balance between model capacity and generalization error. The optimized XGBoost and LightGBM setups also feature subsampling and regularization options to control model complexity. The CS XGBoost model had a learning rate of nearly 0.3, subsample ratio of 0.9437, and L2 regularization of around 4, whereas the TS configuration had a learning rate of 0.2374, subsample ratio of about 0.7837, and L2 regularization of 5. Conversely, the KNN models employed extremely tiny neighborhood sizes of 3 and 2 for the CS and TS, respectively. In conclusion, the differences in optimized setups show that it is better to tune the hyperparameters for CS and TS separately than to use a common configuration. The search procedure with PSO and GWO was able to locate algorithm-specific combinations of ensemble size, tree depth, learning rate, sampling, neighborhood size, and regularization to minimize the cross-validation RMSE.
Table 6.
Hyperparameter used values for CS models.
Table 7.
Hyperparameter used values for TS models.
3.2. Final Model Weights
Table 8 shows the final weights used to develop the weighted voting model. For CS, GBM has the largest weight (0.226), followed by ETR (0.175), LightGBM (0.156), RF (0.152), KNN (0.146), and XGBoost (0.145). For TS, ETR receives the largest weight (0.229), followed by RF (0.178), GBM (0.175), LightGBM (0.174), XGBoost (0.126), and KNN (0.117). The different distributions indicate that the model assigns different relative contributions for CS and TS. GBM contributes most strongly to the CS ensemble according to its weight, whereas ETR contributes most strongly to the TS ensemble.
Table 8.
Weights for individual learners.
3.3. Performance Evaluation of ML Models
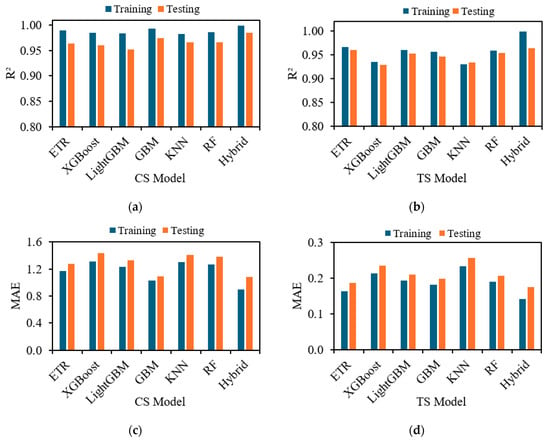
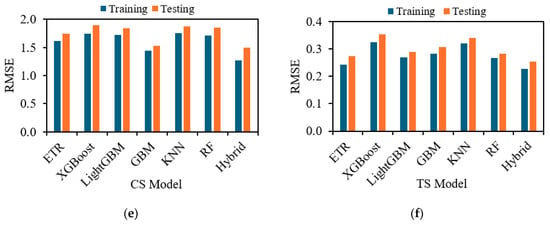
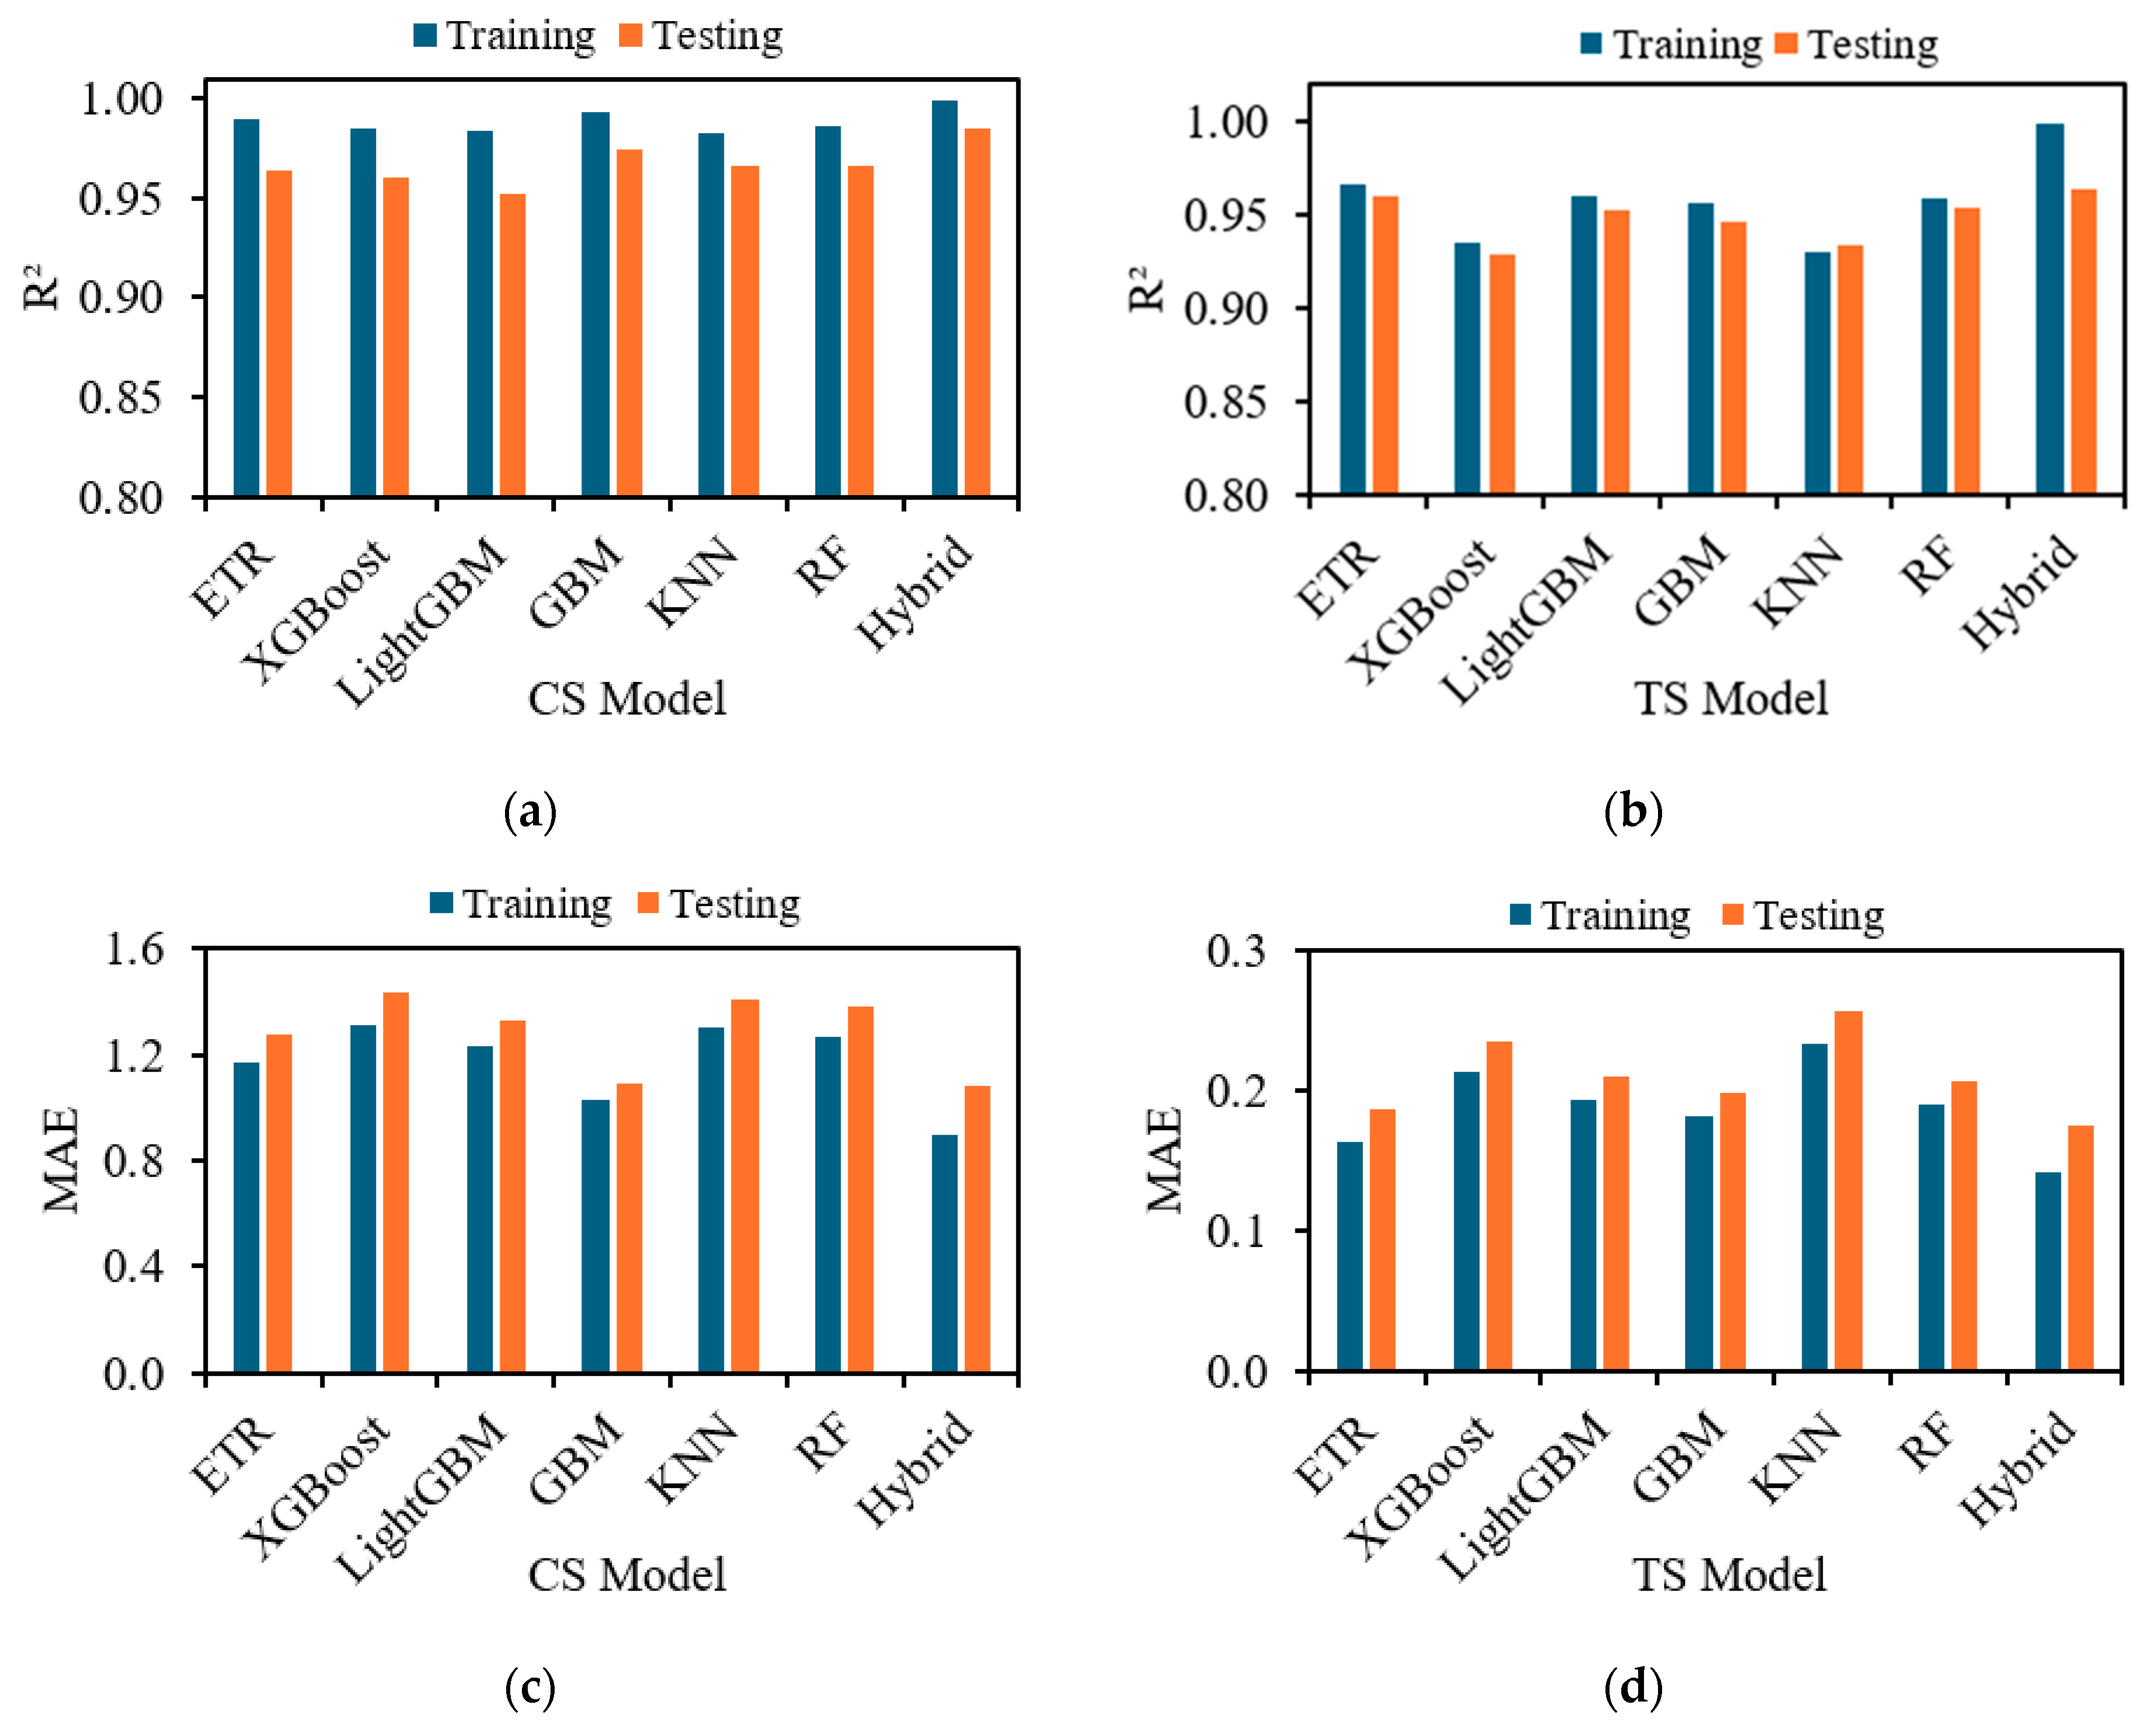
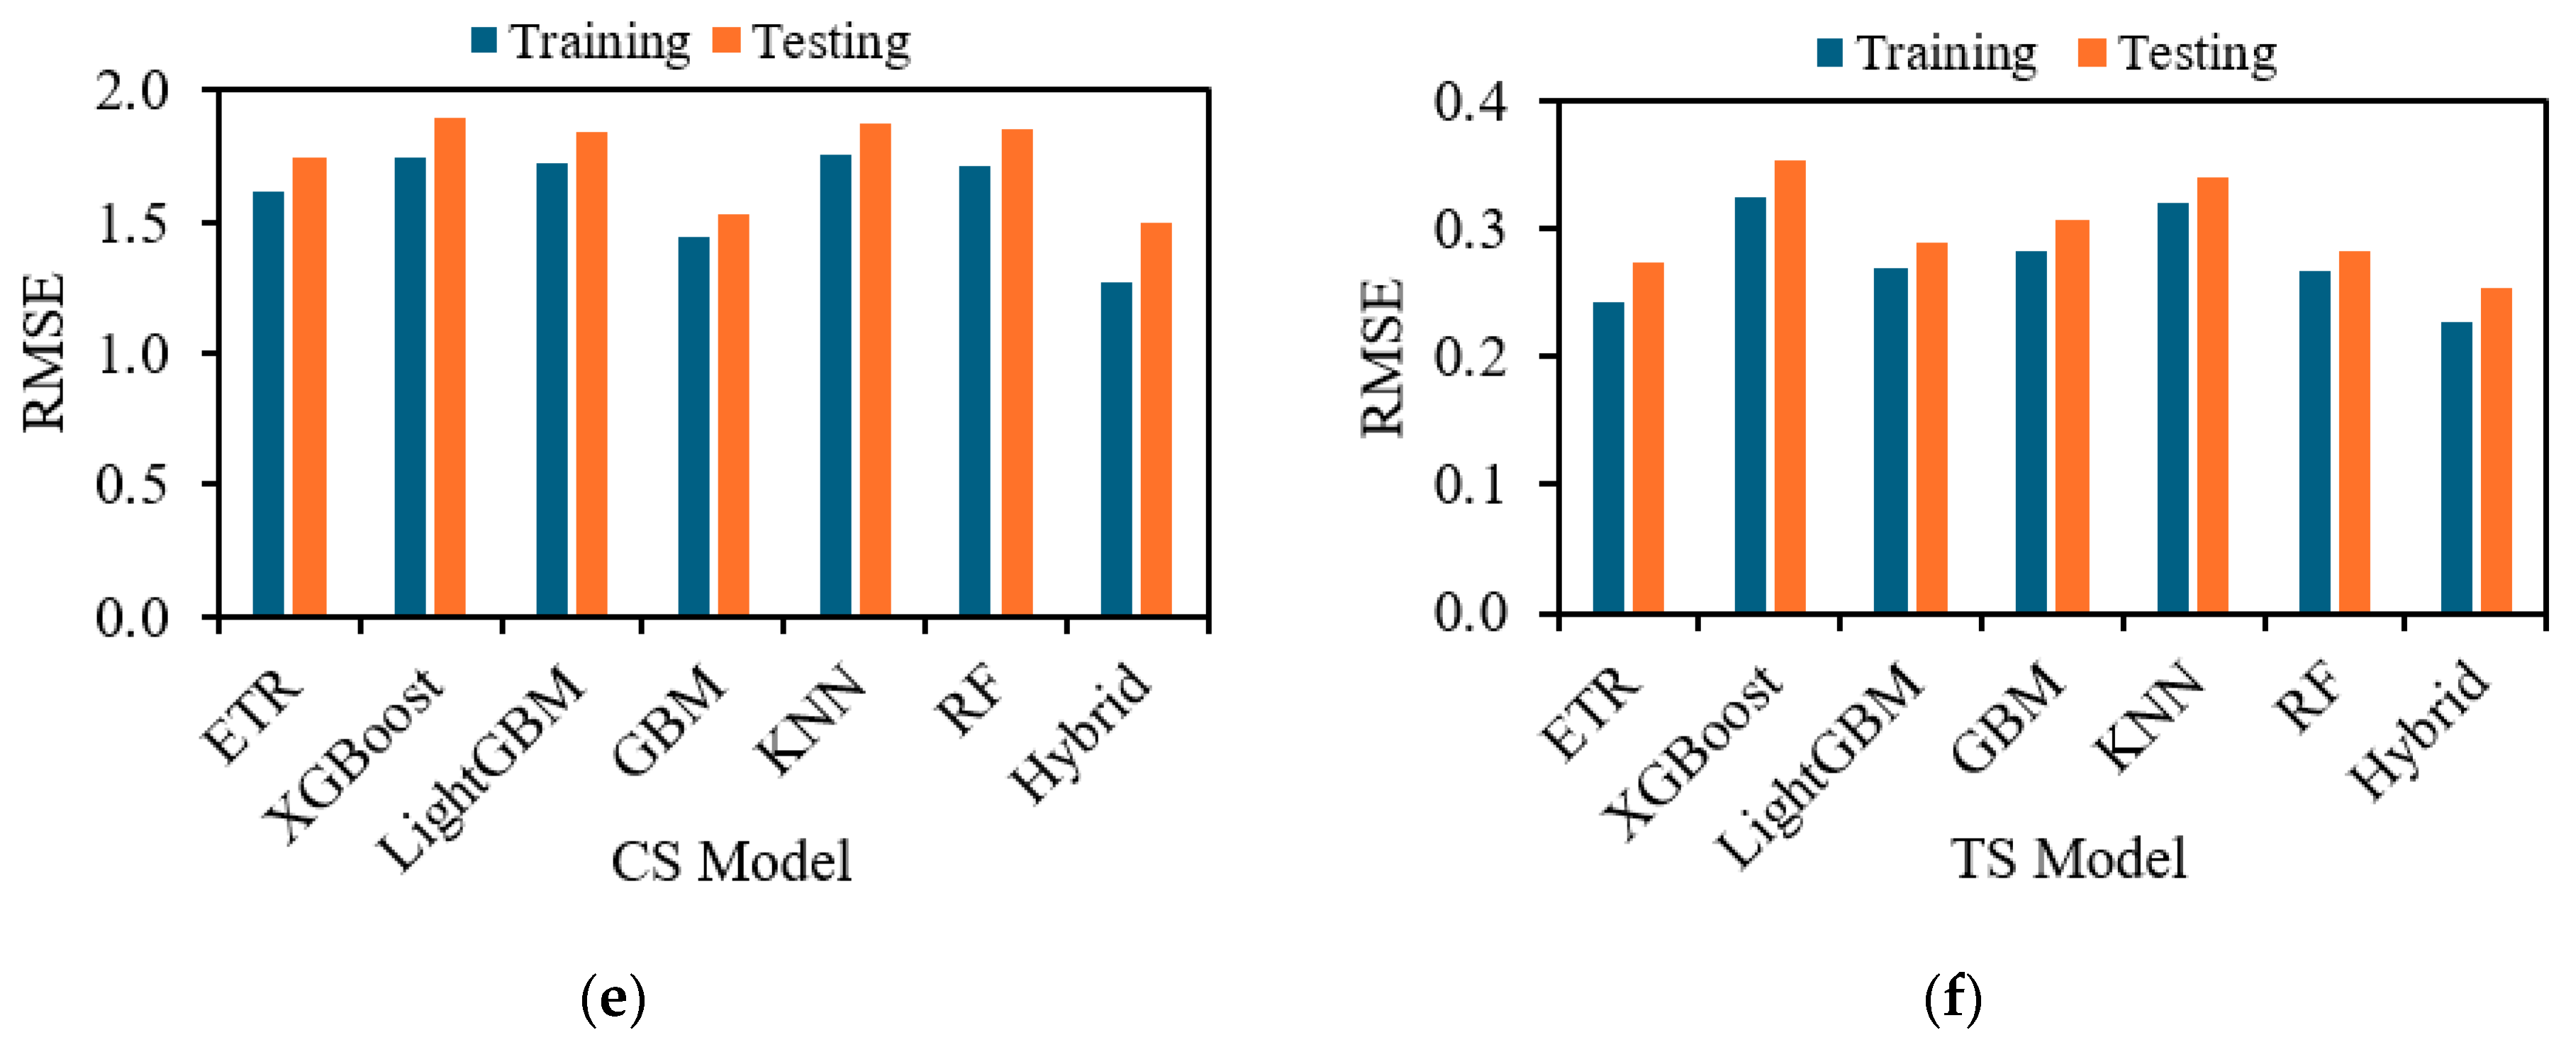
Figure 3 shows the statistical metrics for the developed models. Results for the compressive strength (CS) shown in Figure 3a,c,e indicate that the predictive performance of all six individual learners as well as the constructed hybrid model was found to be strong. The R2 ranges from 0.9518 for LightGBM to 0.9843 for the hybrid model. GBM provides the best R2 (0.9739) value among the individual learners and the lowest MAE (1.094) and RMSE (1.524). RF also shows excellent performance with R2 = 0.9663, MAE = 1.381, and RMSE = 1.847. XGBoost, KNN, and LightGBM yield somewhat greater values of error. KNN produces MAE = 1.412 and RMSE = 1.874, while XGBoost provides RMSE = 1.891. The hybrid model has R2 = 0. 9843, MAE = 1.087, and RMSE = 1.495. It yields the highest R2 and the lowest RMSE and MAE when compared with the six learners. The hybrid approach produces consistently accurate CS predictions through the combination of the predictive knowledge of individual learners. Similarly, high predicted accuracy for TS is observed in Figure 3b,d,f, with R2 values ranging from 0.9285 for XGBoost to 0.9632 for the hybrid model. The ETR model has the highest R2 (0.9593) of all six individual models, with MAE = 0.186 and RMSE = 0.274. RF and LightGBM RF also have well performance with R2 values of 0.954 and 0.952, respectively. The hybrid model has the greatest R2 0.9632 with the lowest MAE (0.175) and the lowest RMSE (0.253) amongst all the models assessed. These results, compared with the individual learners, show that hybrid architecture may combine the complementary predictive performance of the six base learners, reducing the absolute and squared prediction errors for TS. The improved performance of the hybrid model for TS, and its competitive performance for CS, illustrates the potential of the ensemble architecture for simultaneously modeling the two strength-related responses.
Figure 3.
Statistical metrics of CS and TS of BFRC using base learners and hybrid ML models: (a) R2 for CS, (b) R2 for TS, (c) MAE for CS, (d) MAE for TS, (e) RMSE for CS, and (f) RMSE for TS.
The CS models demonstrated strong generalizability with testing R2 values ranging from 0.9518 to 0.9843. The hybrid model achieved the highest testing R2 (0.9843) and the smallest training-to-testing difference ΔR2 = 0.0151, indicating excellent predictive performance and a relatively small generalization gap. Among the individual learners, KNN exhibited the smallest gap (0.0173), followed by GBM (0.0194) and RF (0.0196). Although all models showed some reduction in testing performance, their consistently high testing R2 values suggest that they generalize well to the evaluated unseen data.
The TS models also exhibited strong generalizability with testing R2 values between 0.9285 and 0.9632. RF showed the smallest positive generalization gap RF (ΔR2 = 0.005), followed by ETR (0.0064) and, very closely, by XGBoost (0.0065). The hybrid model achieved the highest testing R2 (0.9632), but its larger gap of 0.0348 indicates a greater difference between training and testing performance (less than 4%). KNN had a negative ΔR2 of −0.0037. Overall, the results indicate satisfactory generalization, with ETR and RF showing consistent performance between datasets.
3.4. Cross Validation
The cross-validation procedure is employed using the training dataset, while the independent testing dataset is retained for final assessment. Table 9 shows the mean and standard deviation (SD) of R2, MAE, and RMSE for the six base learners under internal out-of-fold cross-validation on the training dataset. For CS, ETR has the greatest mean R2 (0.9235) and the lowest mean MAE (1.897) with a mean RMSE of 2.842. GBM performs comparably with a mean R2 of 0.9213 and a mean RMSE of 2.876. KNN obtains the lowest average R2 (0.9004) and highest average errors (MAE = 2.196 and RMSE = 3.218). The minimum and maximum standard deviations of R2 are 0.03 and 0.045, corresponding to RF and KNN, respectively. The minimum and maximum standard deviations of MAE are 0.26 and 0.48 for GBM and KNN, respectively. The standard deviations of RMSE are 0.332 and 0.561 for RF and KNN, respectively. For TS, the mean R2 is highest for RF (0.9085), followed by GBM (0.9037). GBM has the lowest mean MAE (0.288), with the mean RMSE (0.464) being close to RF (0.463). KNN has the lowest mean R2 (0.8746) and greatest mean errors (MAE = 0.368 and RMSE = 0.610).
Table 9.
Cross validation statistics.
3.5. Scatter Plots for the Developed Models
Figure 4 exhibits the scatter plots for the six individual learners and the hybrid model for the compressive strength (CS) with ±10% error lines. It can be shown that for all seven models the observations are mostly clustered around the ideal predicted trend, indicating that the predicted and measured compressive-strength values are in a good agreement. The percentages of observations exceeding the ±10% error limits are 3.5%, 1.8%, 5.3%, 1.8%, 3.5%, and 1.8% for ETR, XGBoost, LightGBM, GBM, KNN, and RF, respectively, while no observations from the hybrid model exceed the limits. The small scatter of points about the primary prediction relationship and the restricted number of observations exceeding the ±10% error limits indicate that the produced learners provide consistent CS predictions. The hybrid model also presents a satisfactory agreement between the actual and predicted values, demonstrating that the combined ensemble retains the high predictive capability of each individual learner while minimizing the prediction deviations for many observations.
Figure 4.
Scatter plots for CS models: (a) ETR, (b) XGBoost, (c) LightGBM, (d) GBM, (e) KNN, (f) RF, and (g) hybrid.
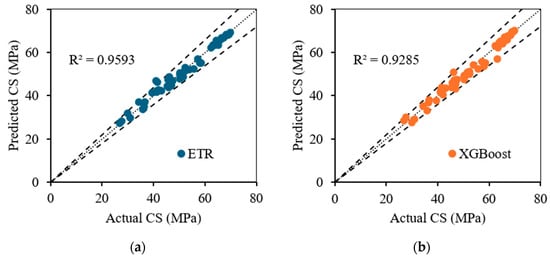
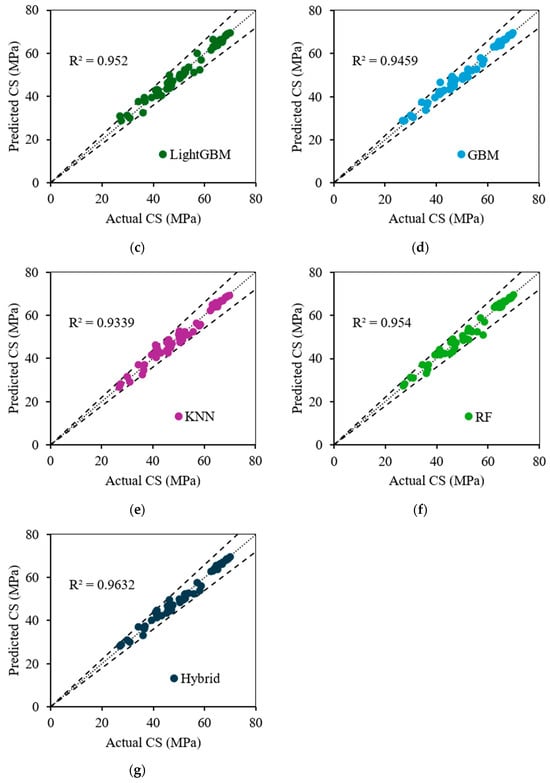
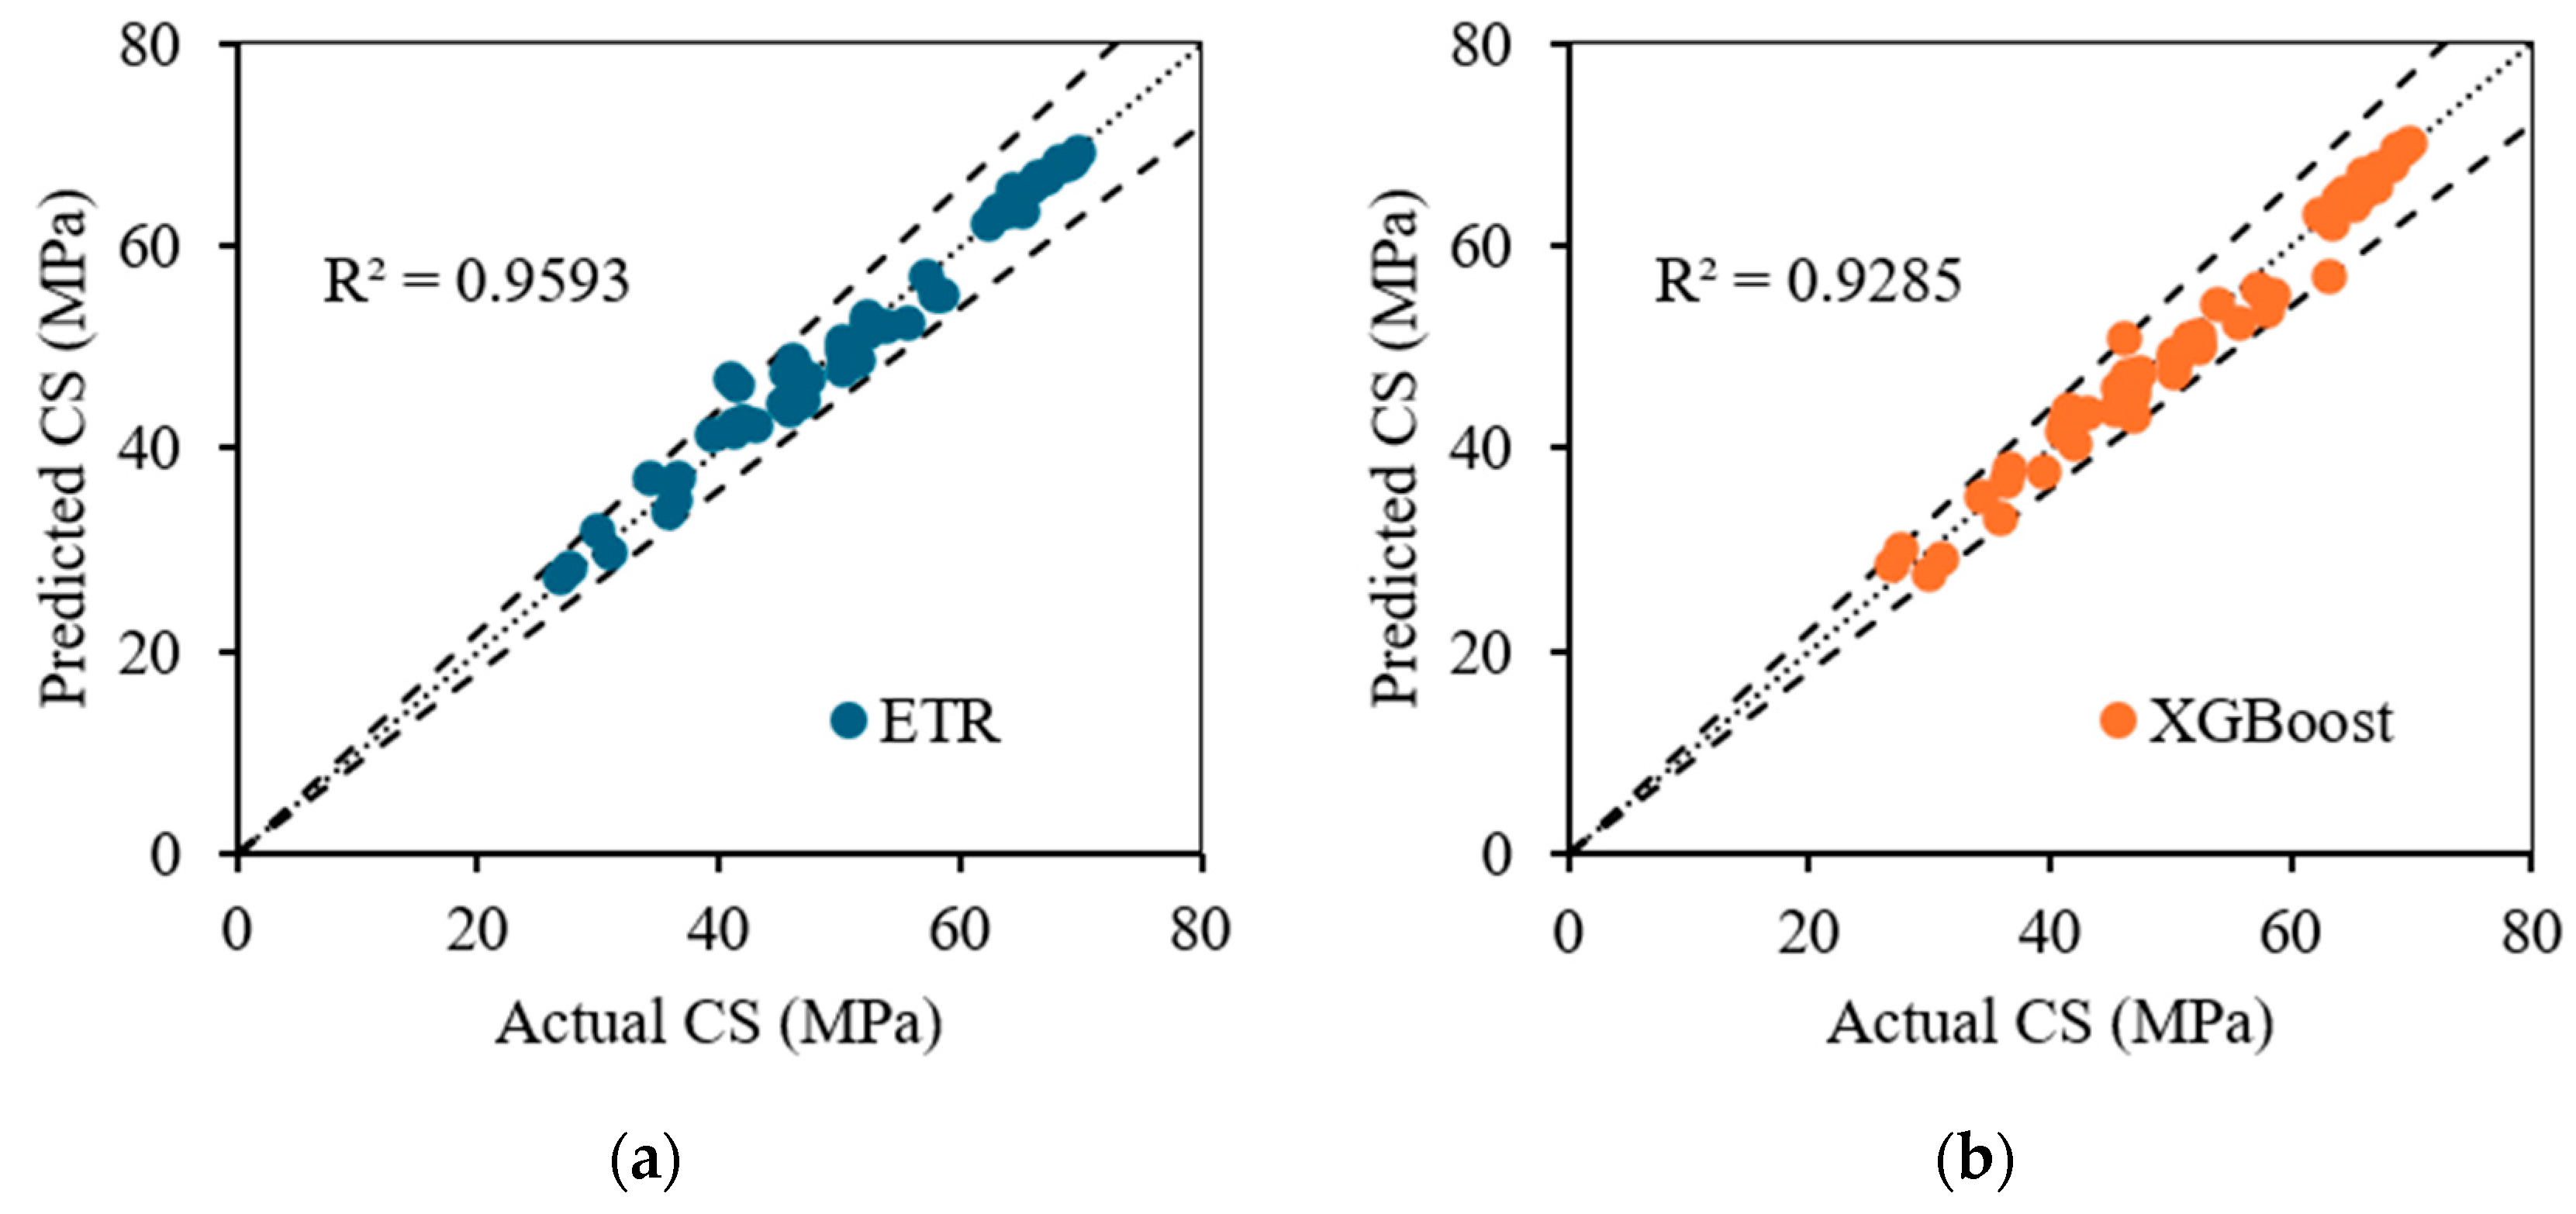
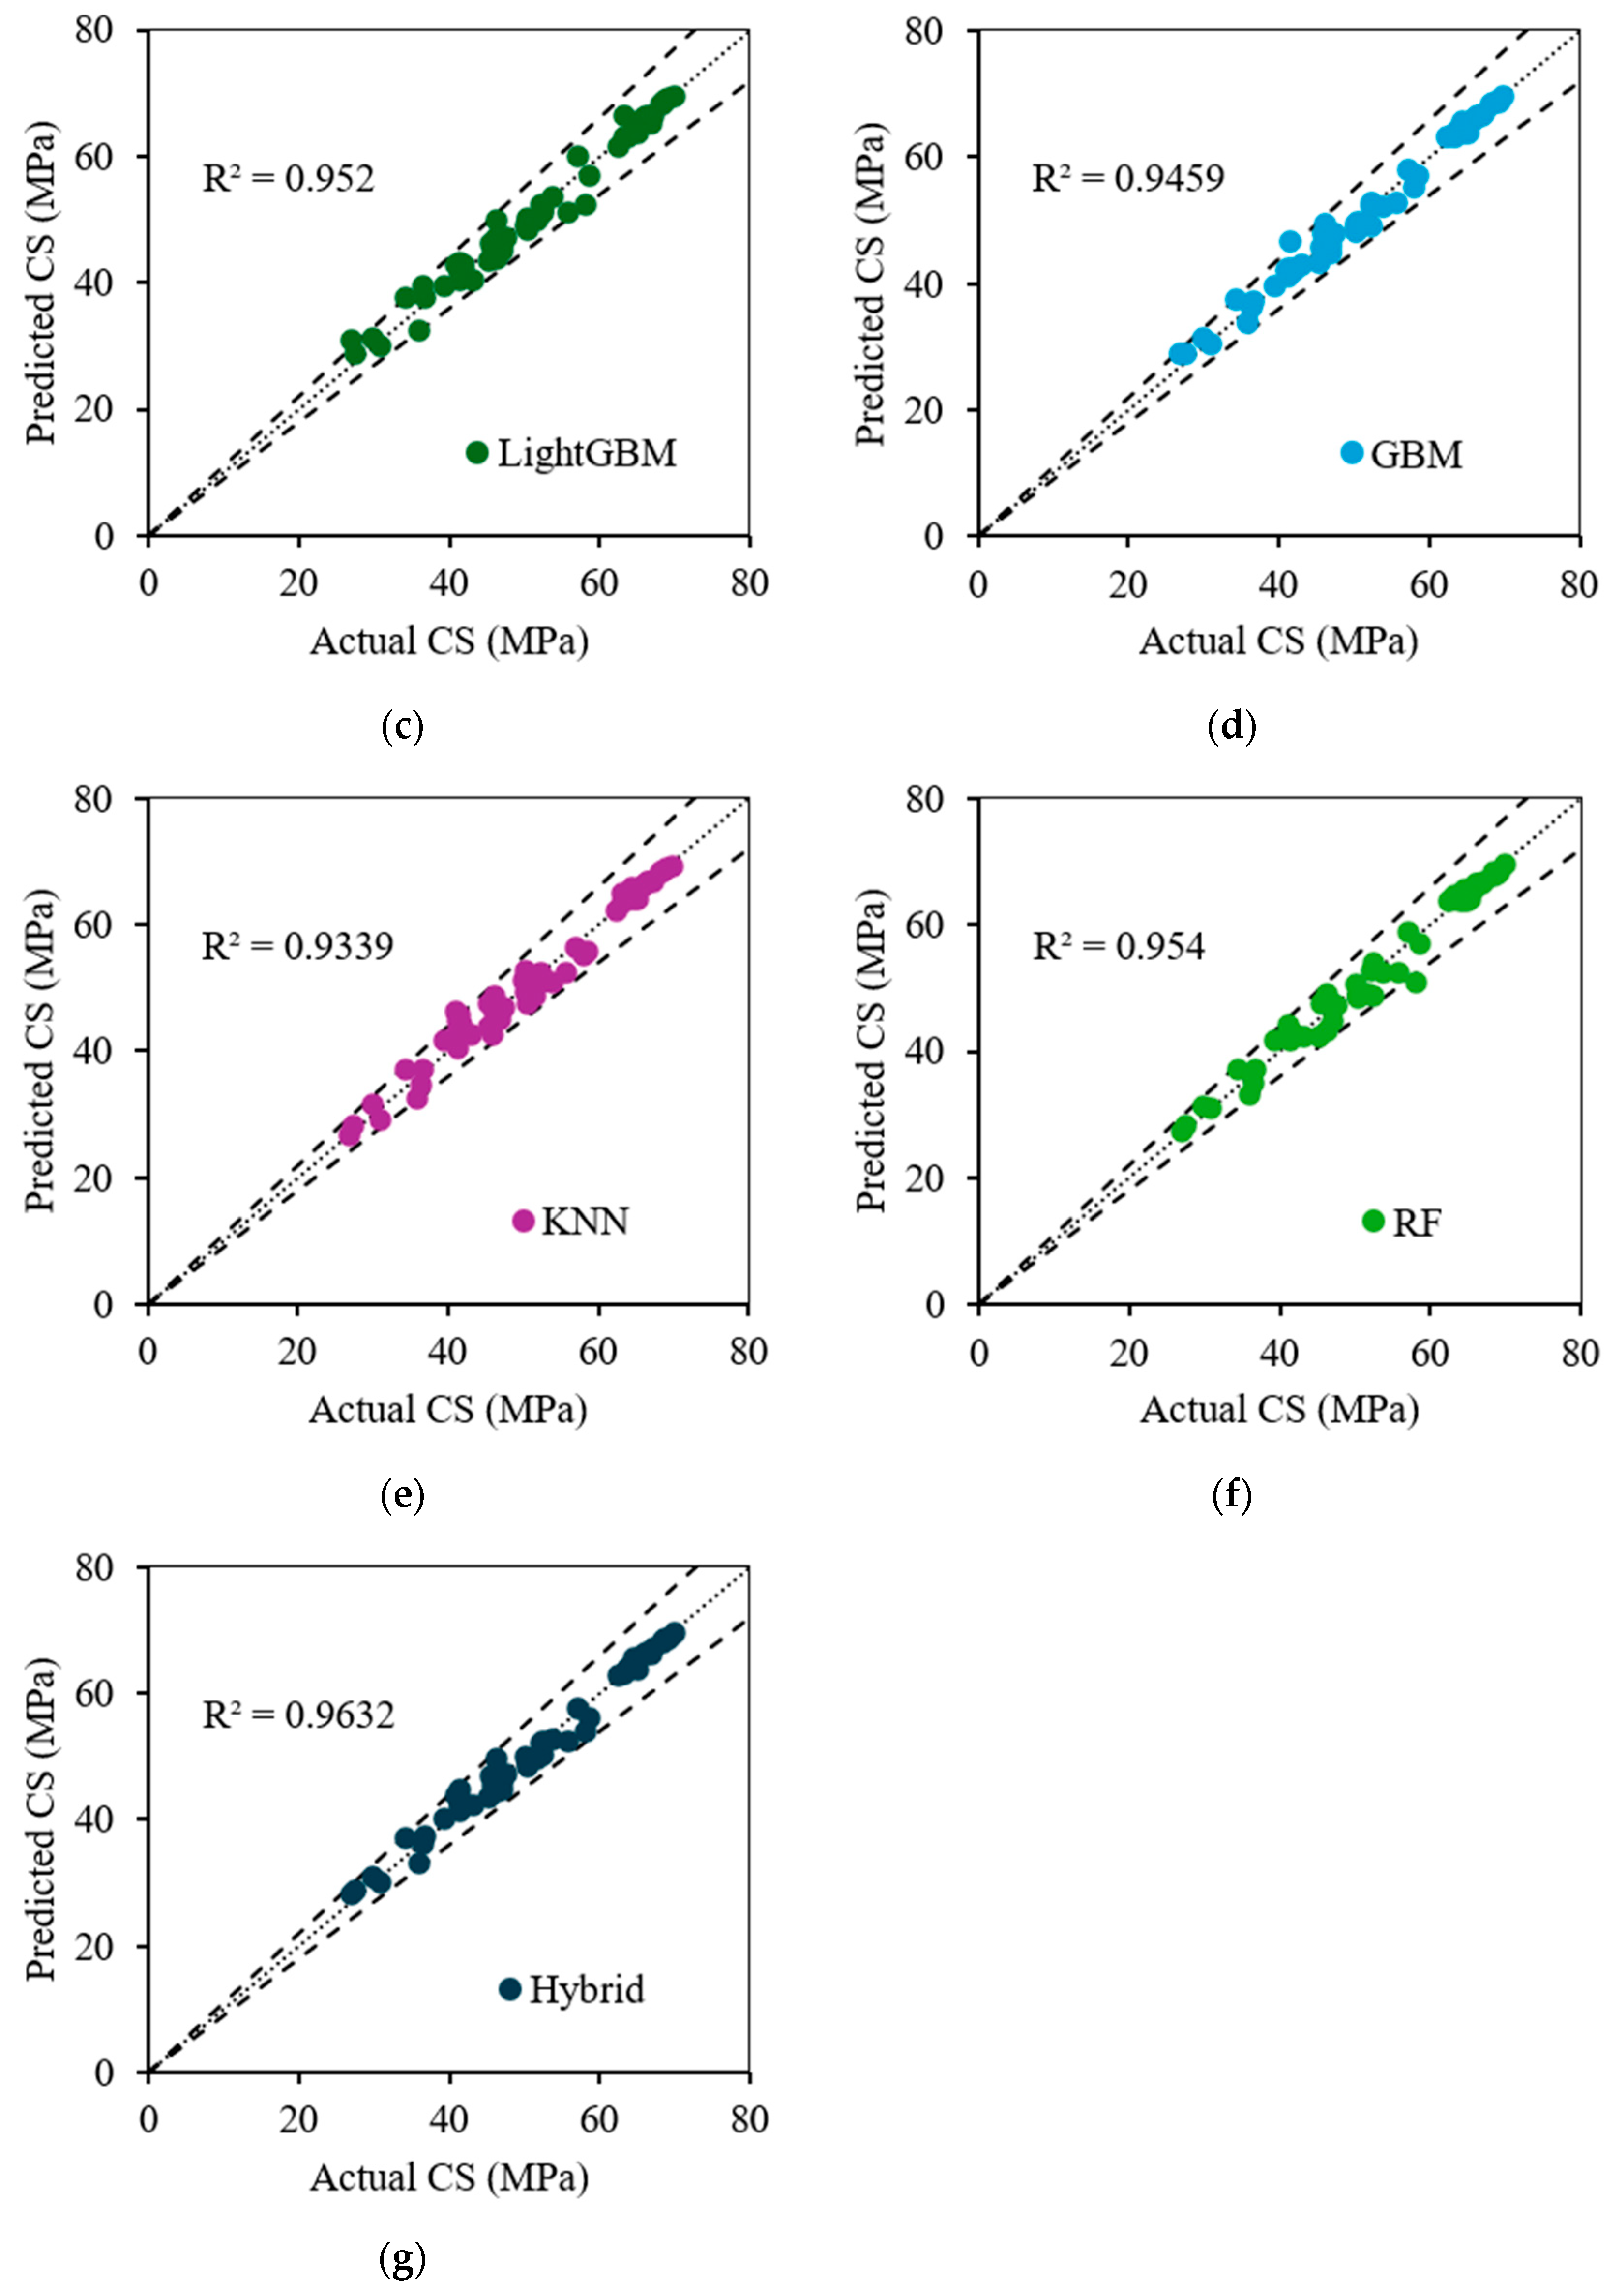
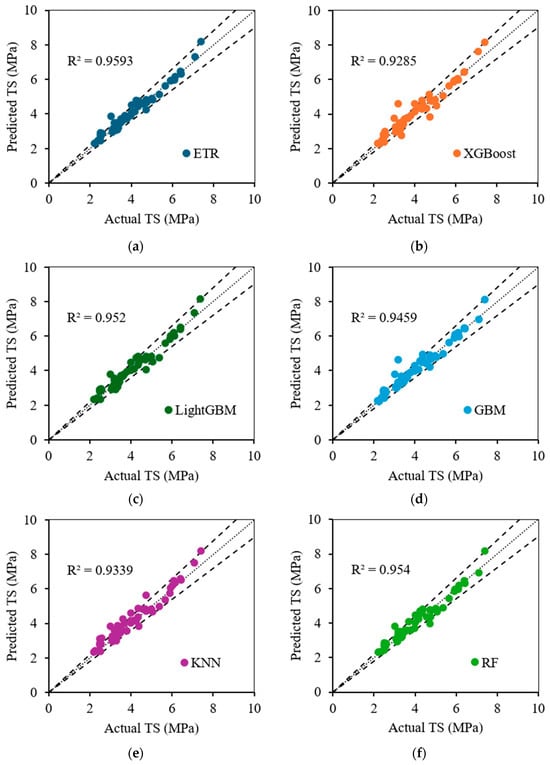
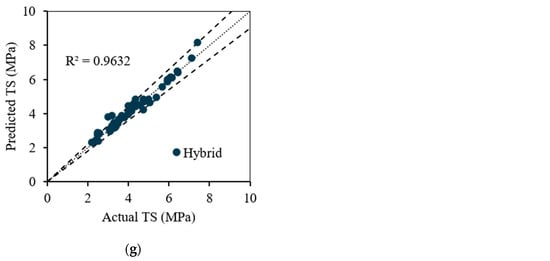
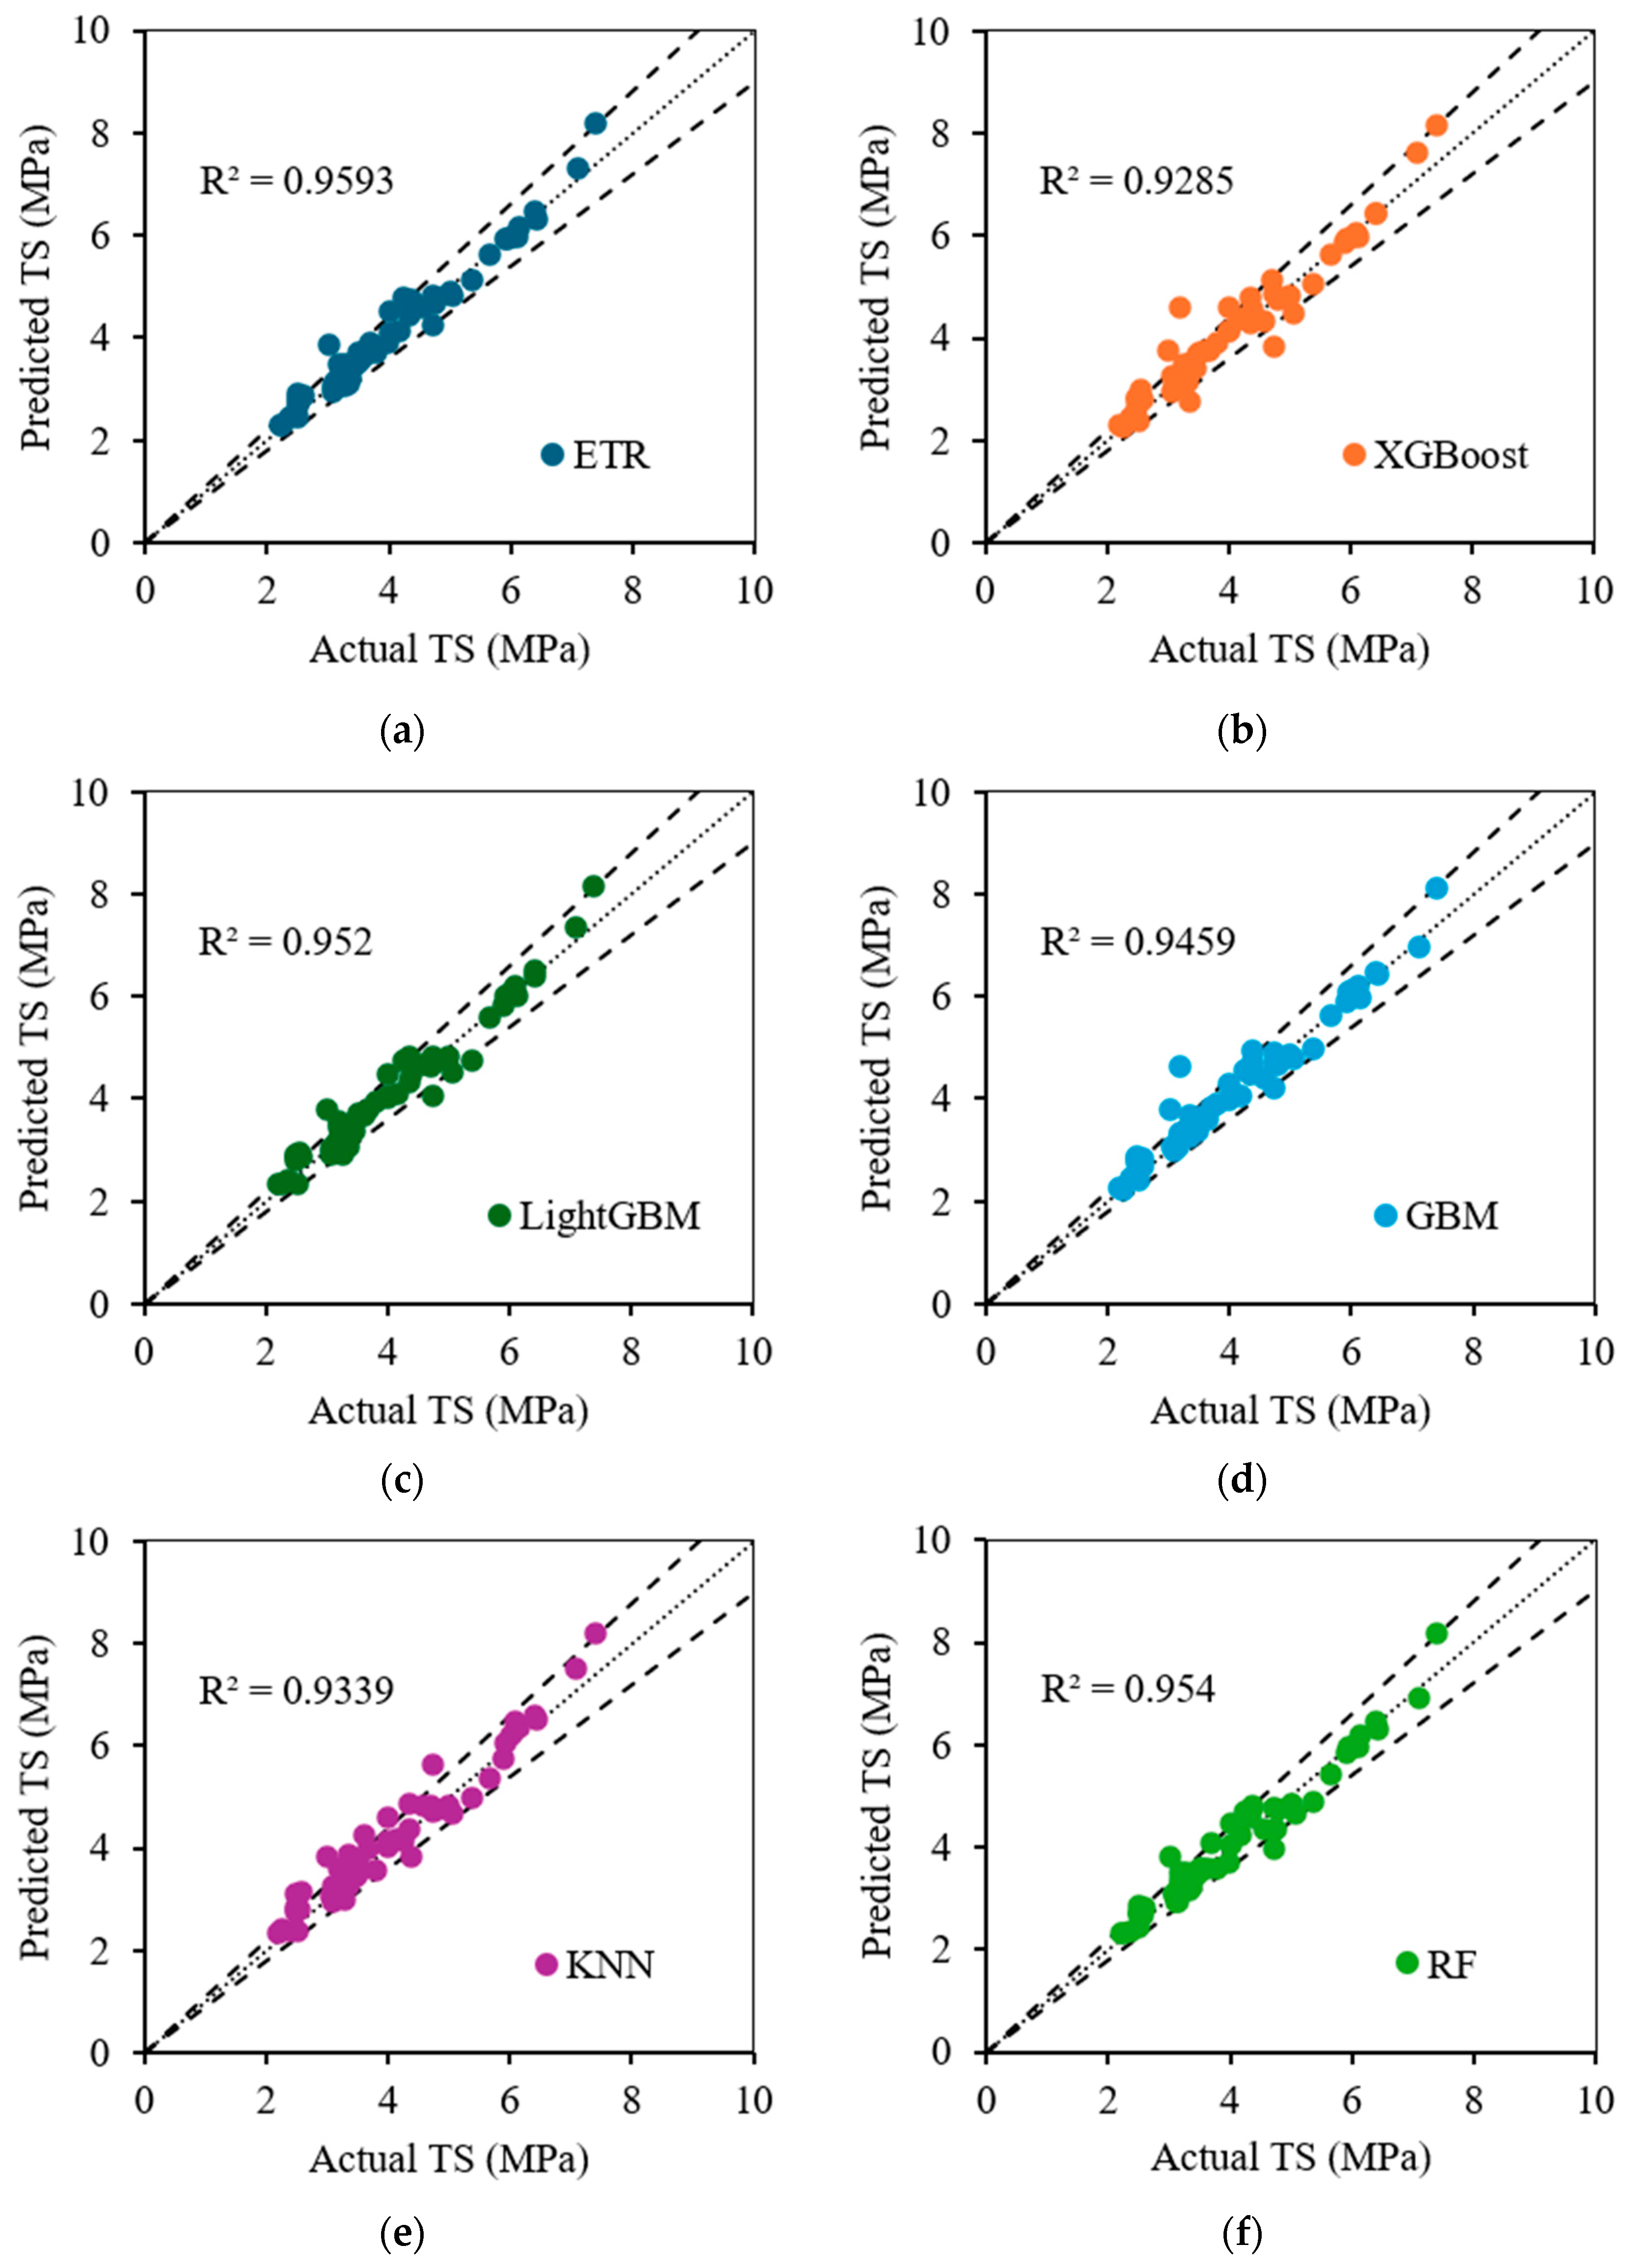
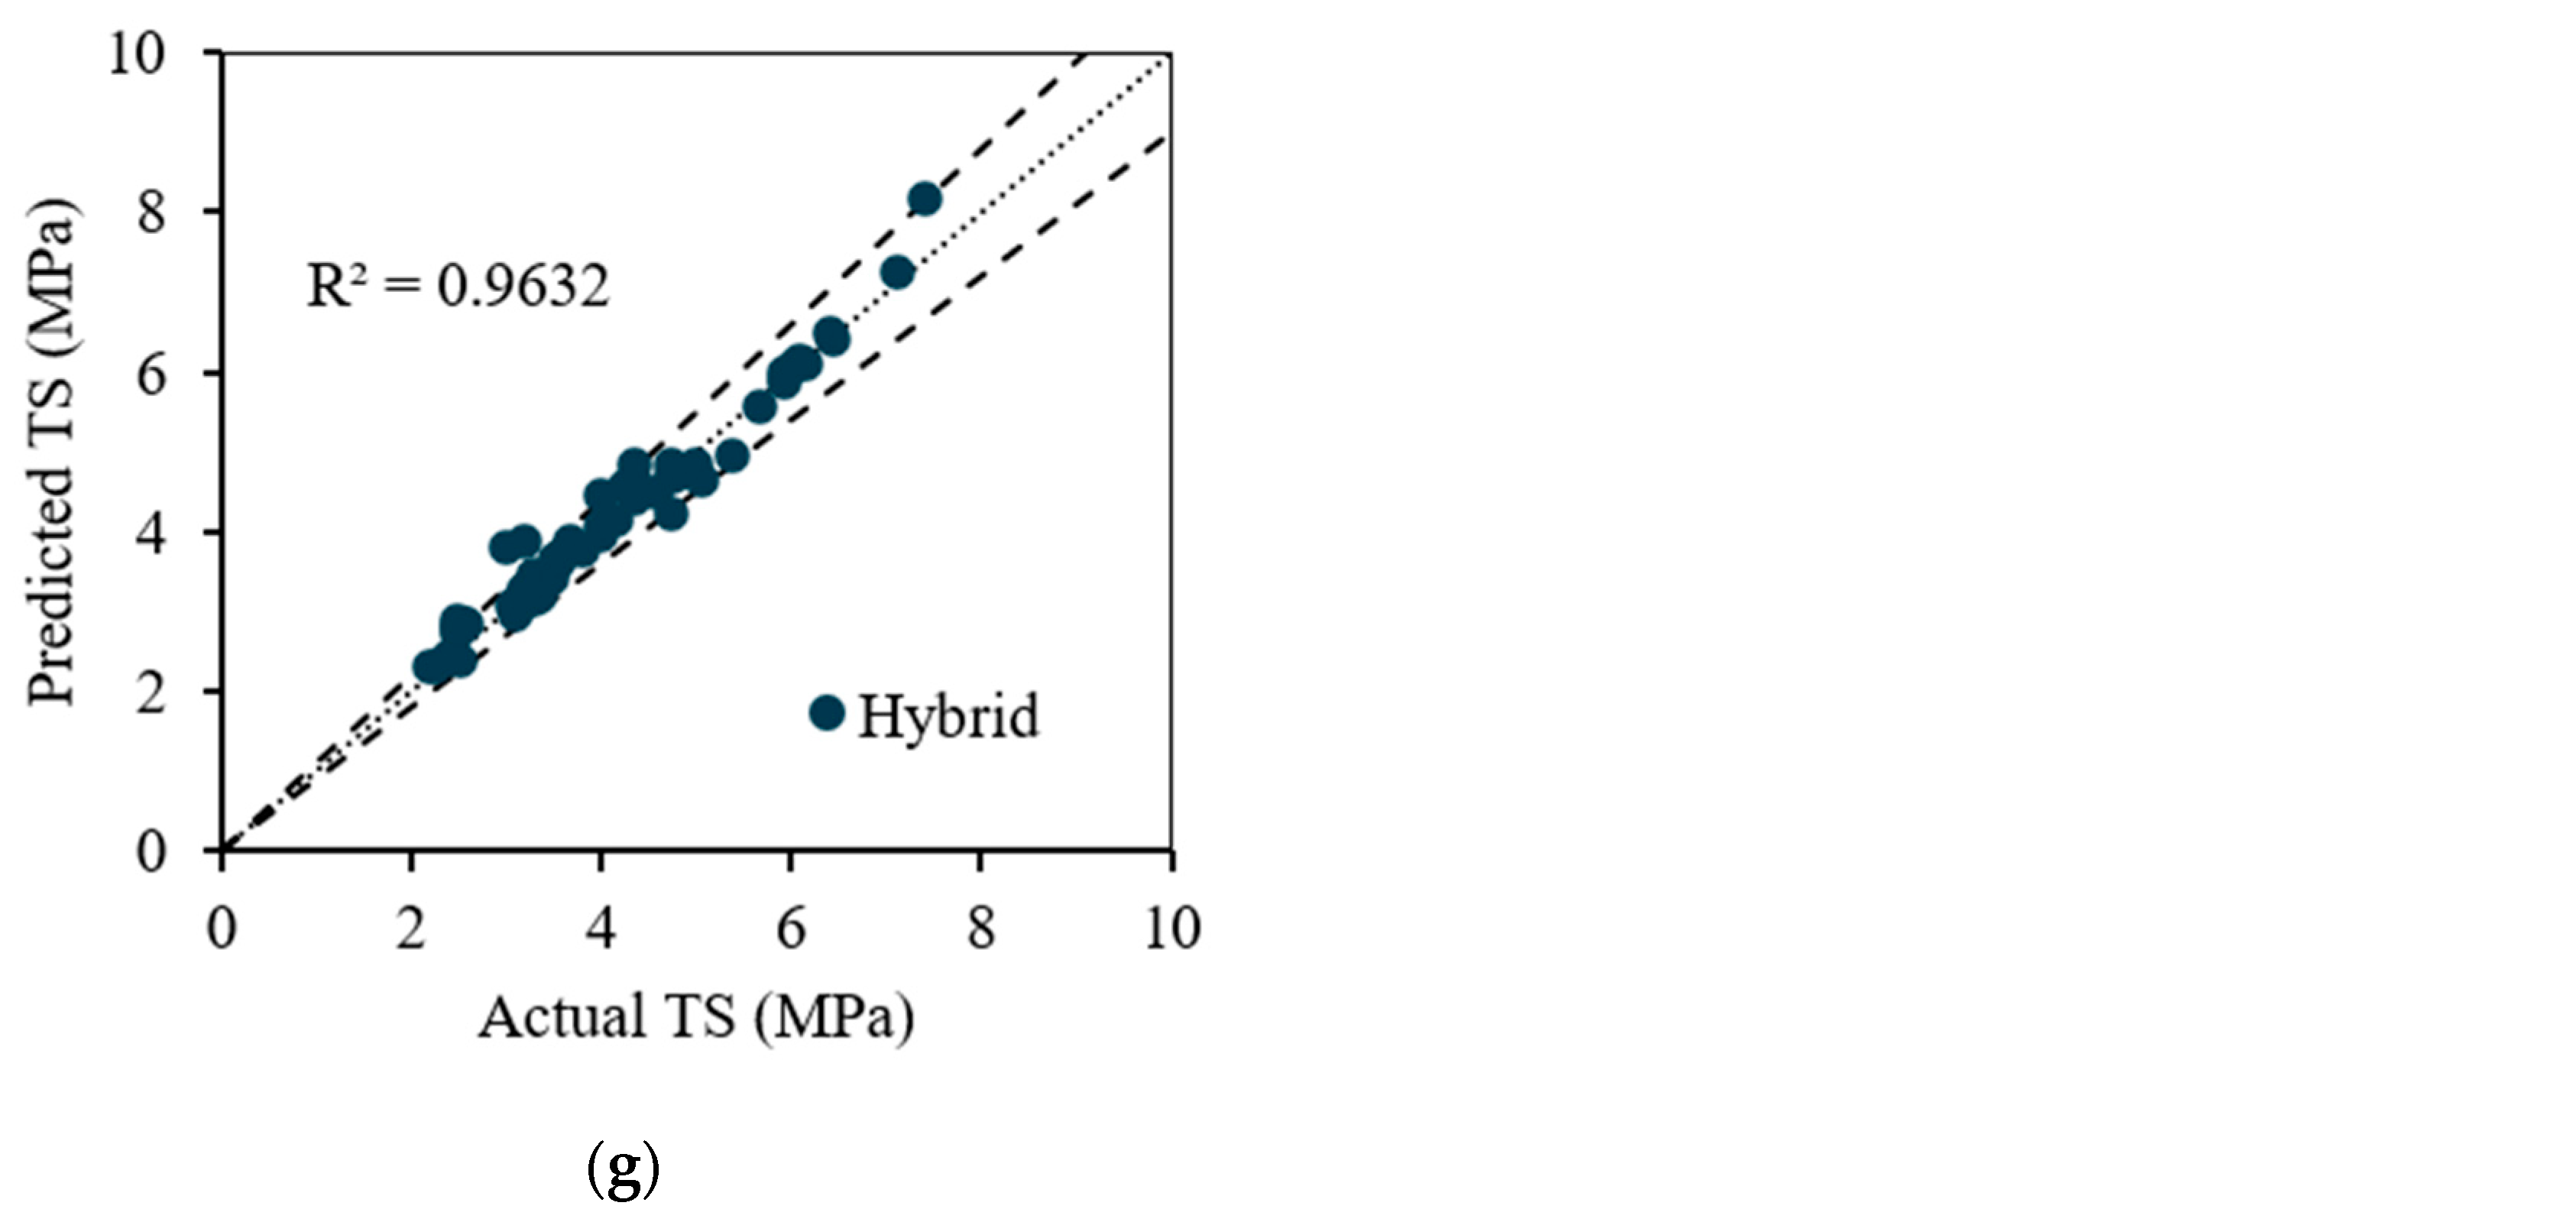
For the tensile strength (TS), the scatter plots of ETR, XGBoost, LightGBM, GBM, KNN, RF, and the hybrid model are displayed in Figure 5, and the prediction deviations were assessed using also the ±10% error bounds. The percentages of observations exceeding the ±10% error limits are 11.1%, 16.7%, 22.2%, 11.1%, 20.4%,11.1%, and 9.3% for ETR, XGBoost, LightGBM, GBM, KNN, RF, and hybrid, respectively. The displayed observations are mostly scattered about the ideal prediction relationship, which shows a good agreement between the measured and predicted TS values, especially for the hybrid model.
Figure 5.
Scatter plots for TS models: (a) ETR, (b) XGBoost, (c) LightGBM, (d) GBM, (e) KNN, (f) RF, and (g) hybrid.
3.6. Prediction Errors for the Developed Models
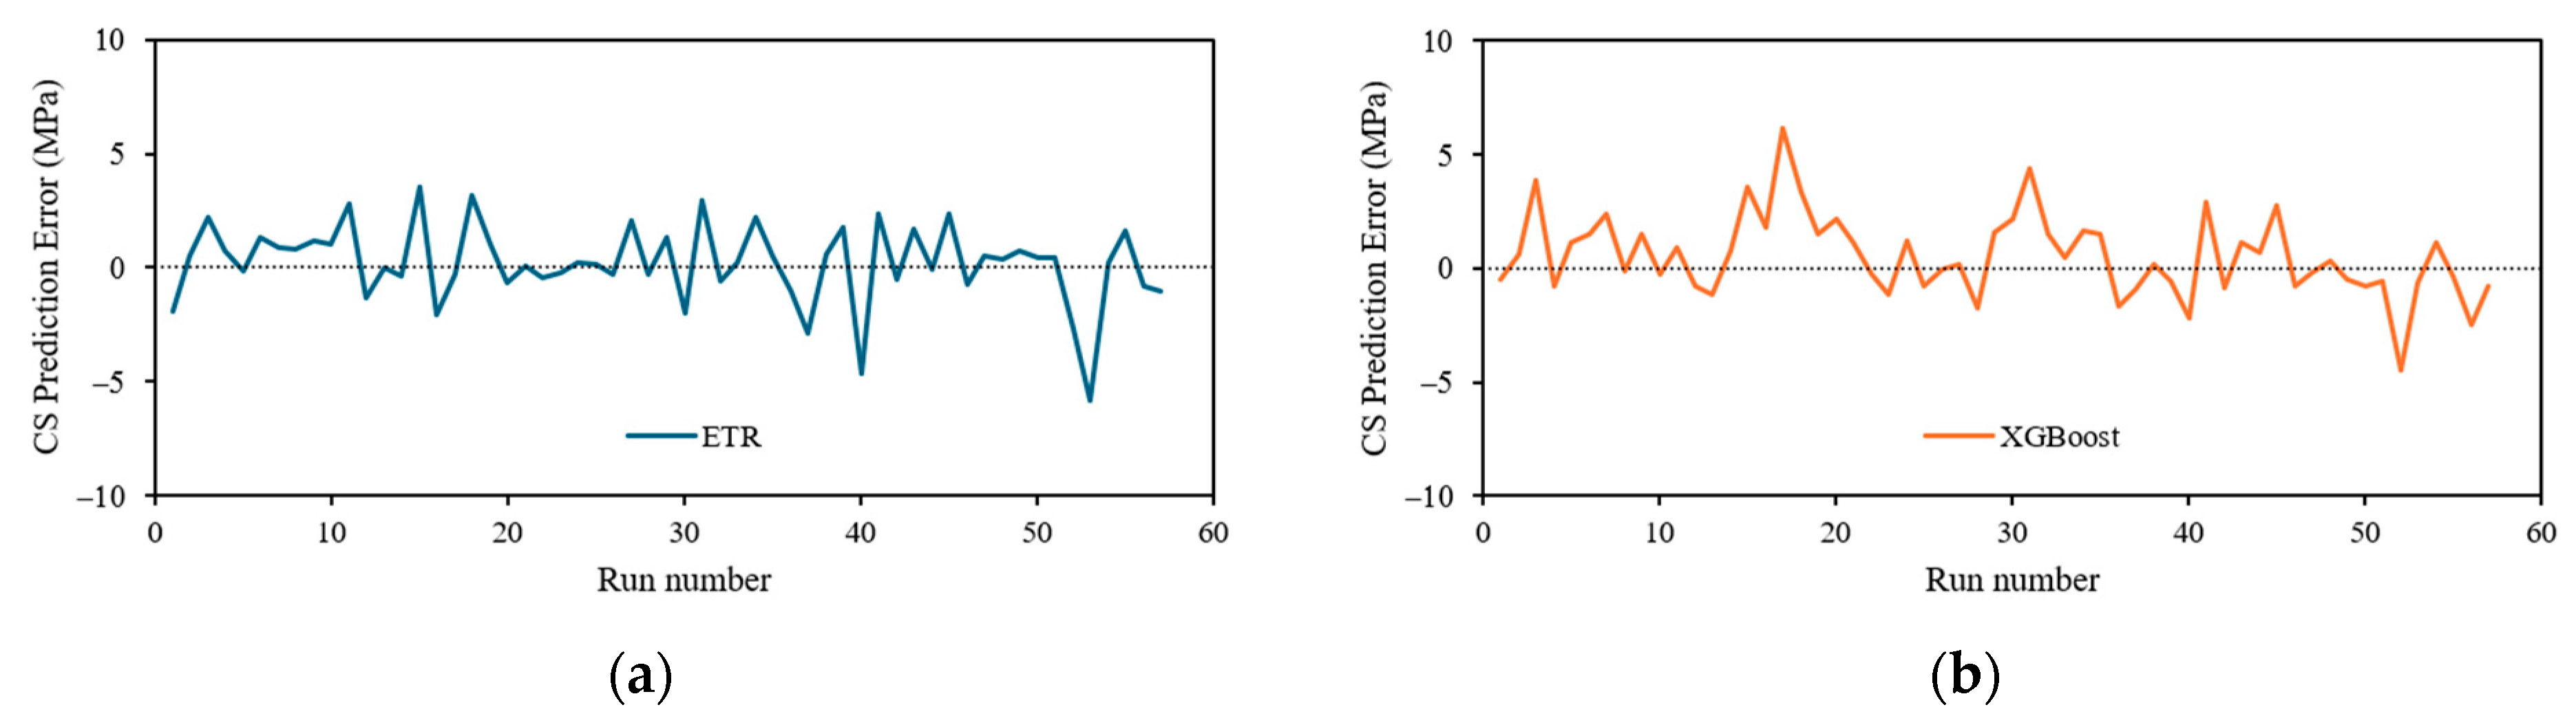
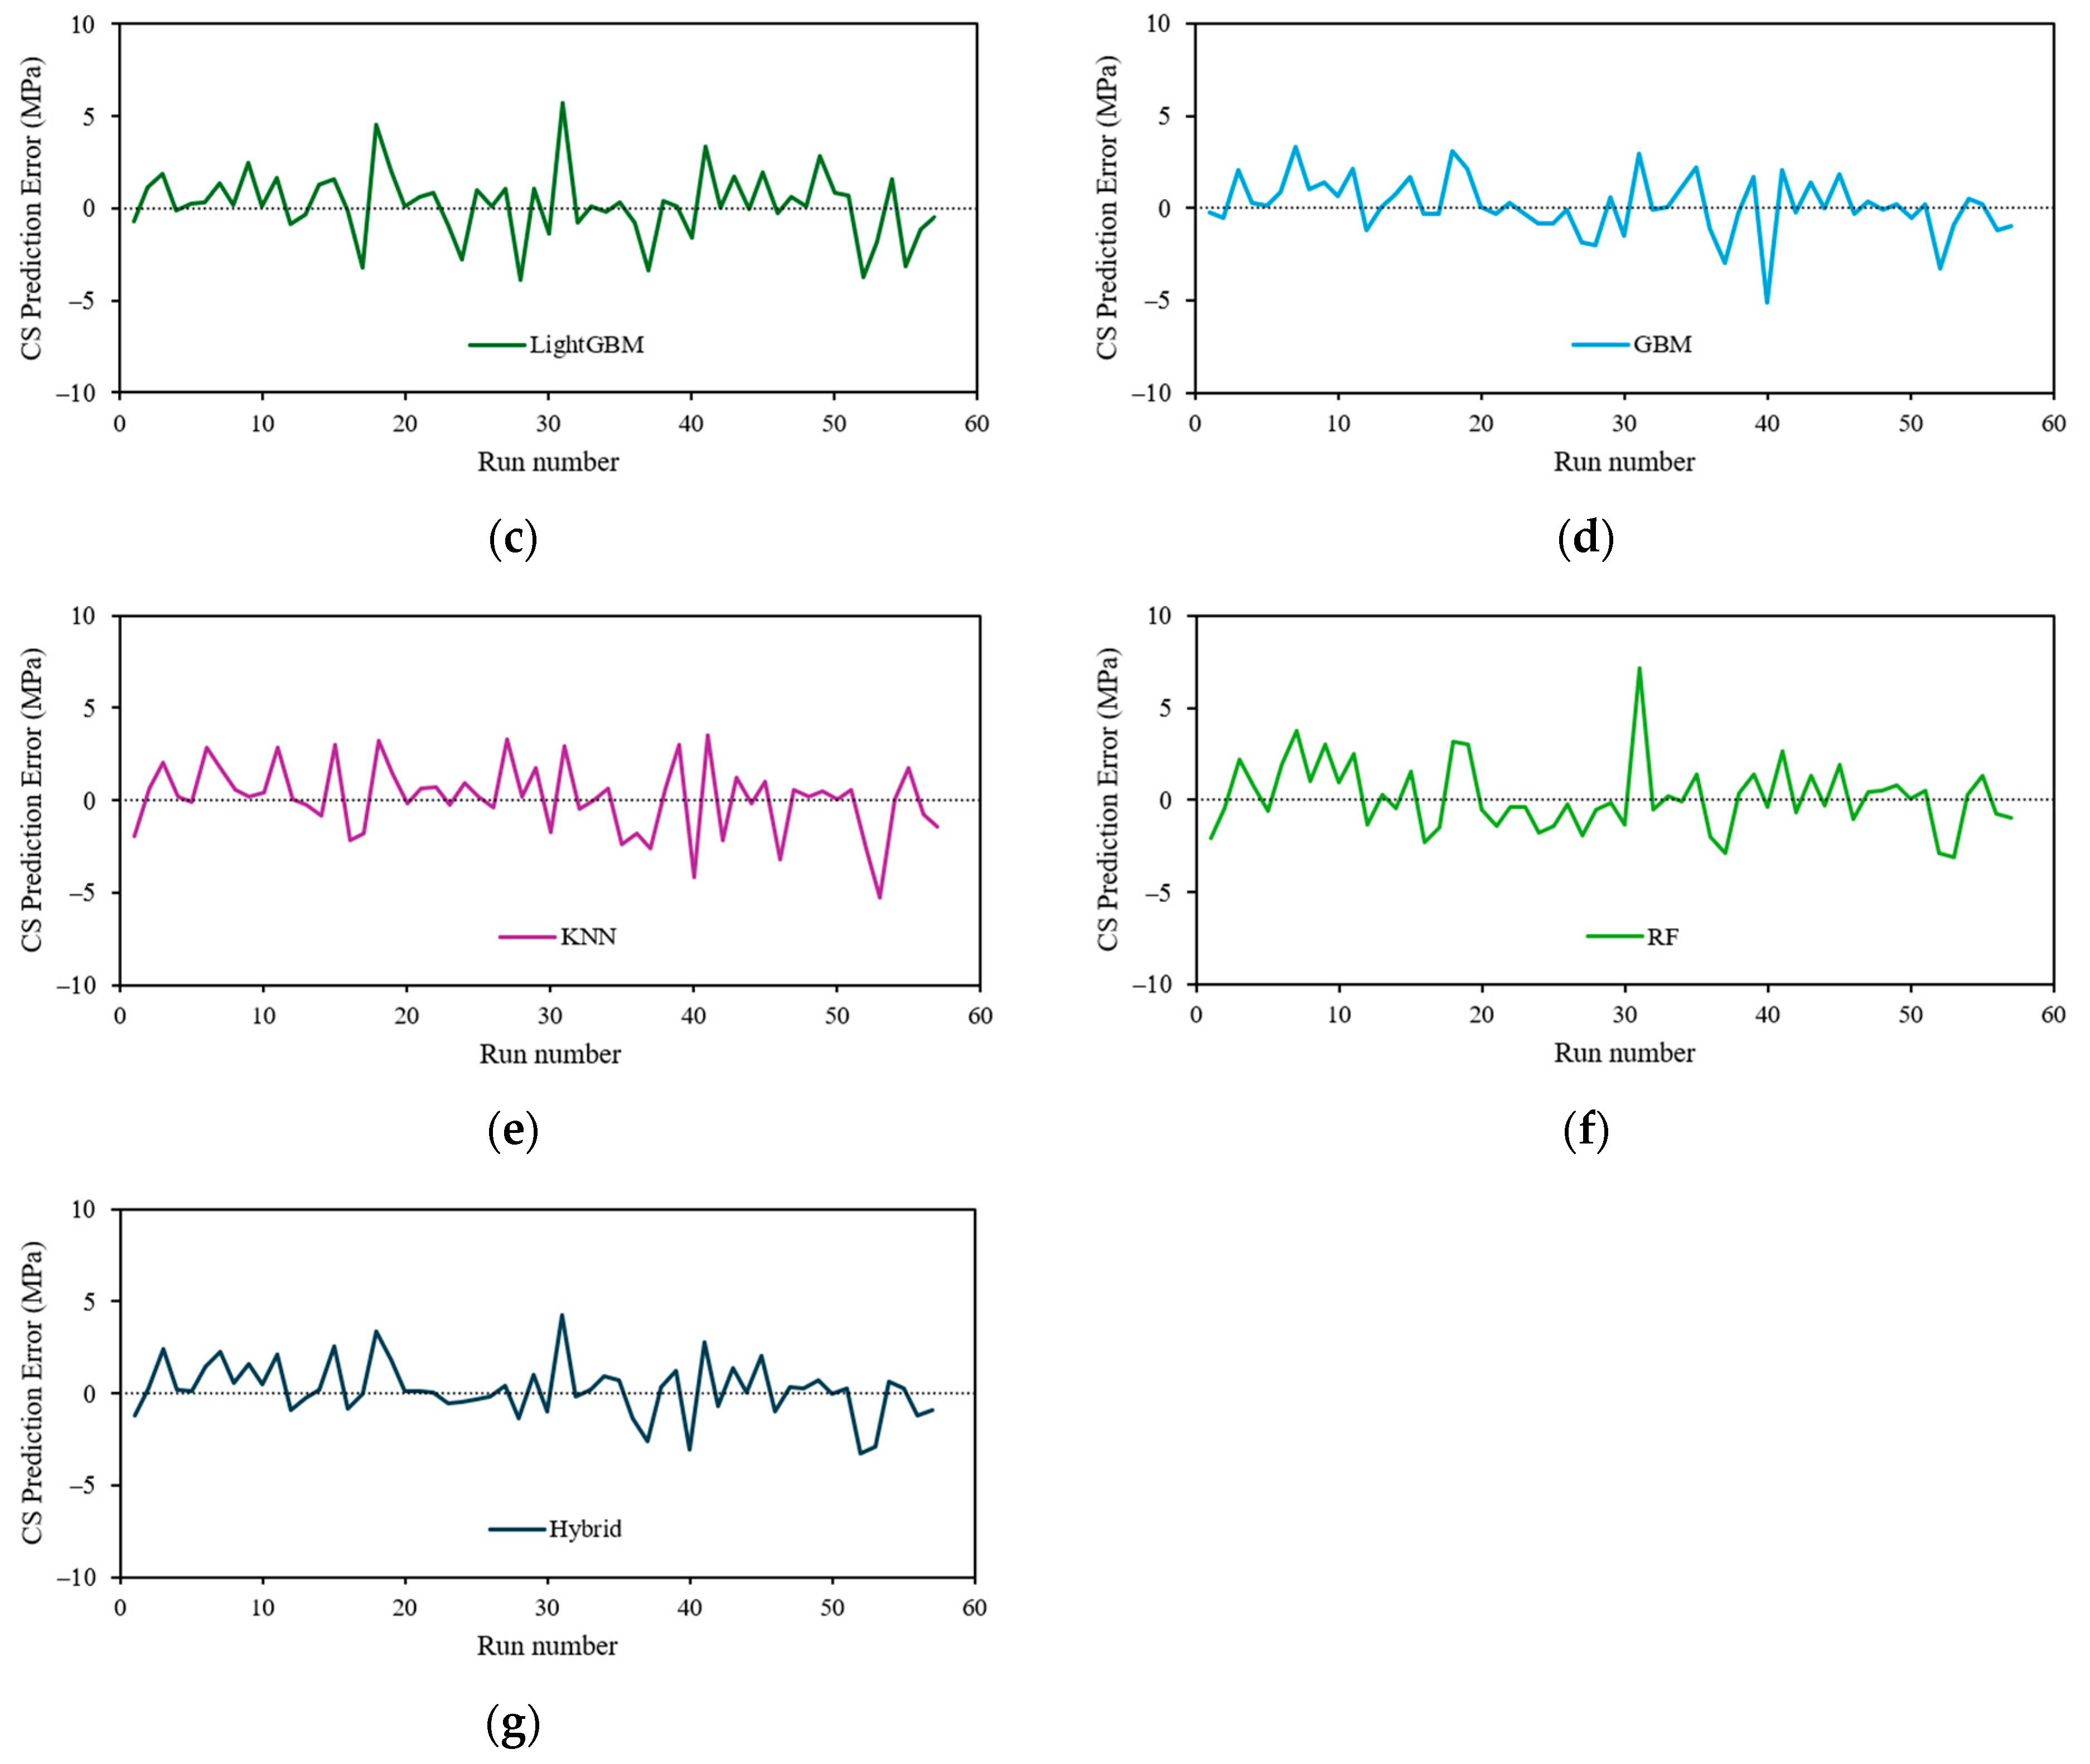
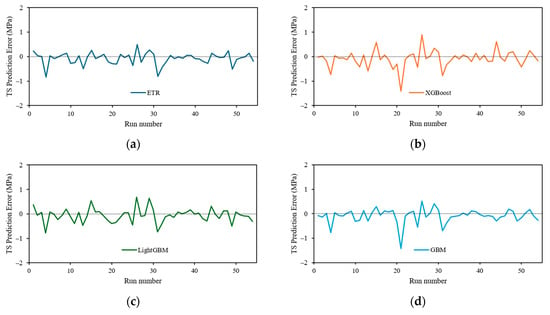
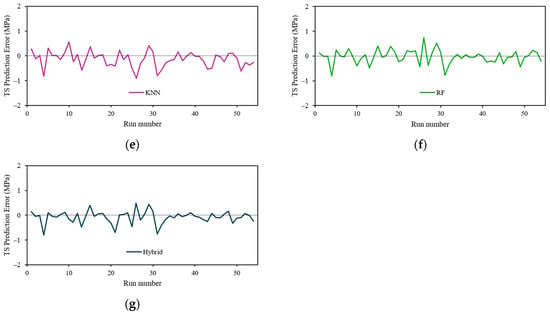
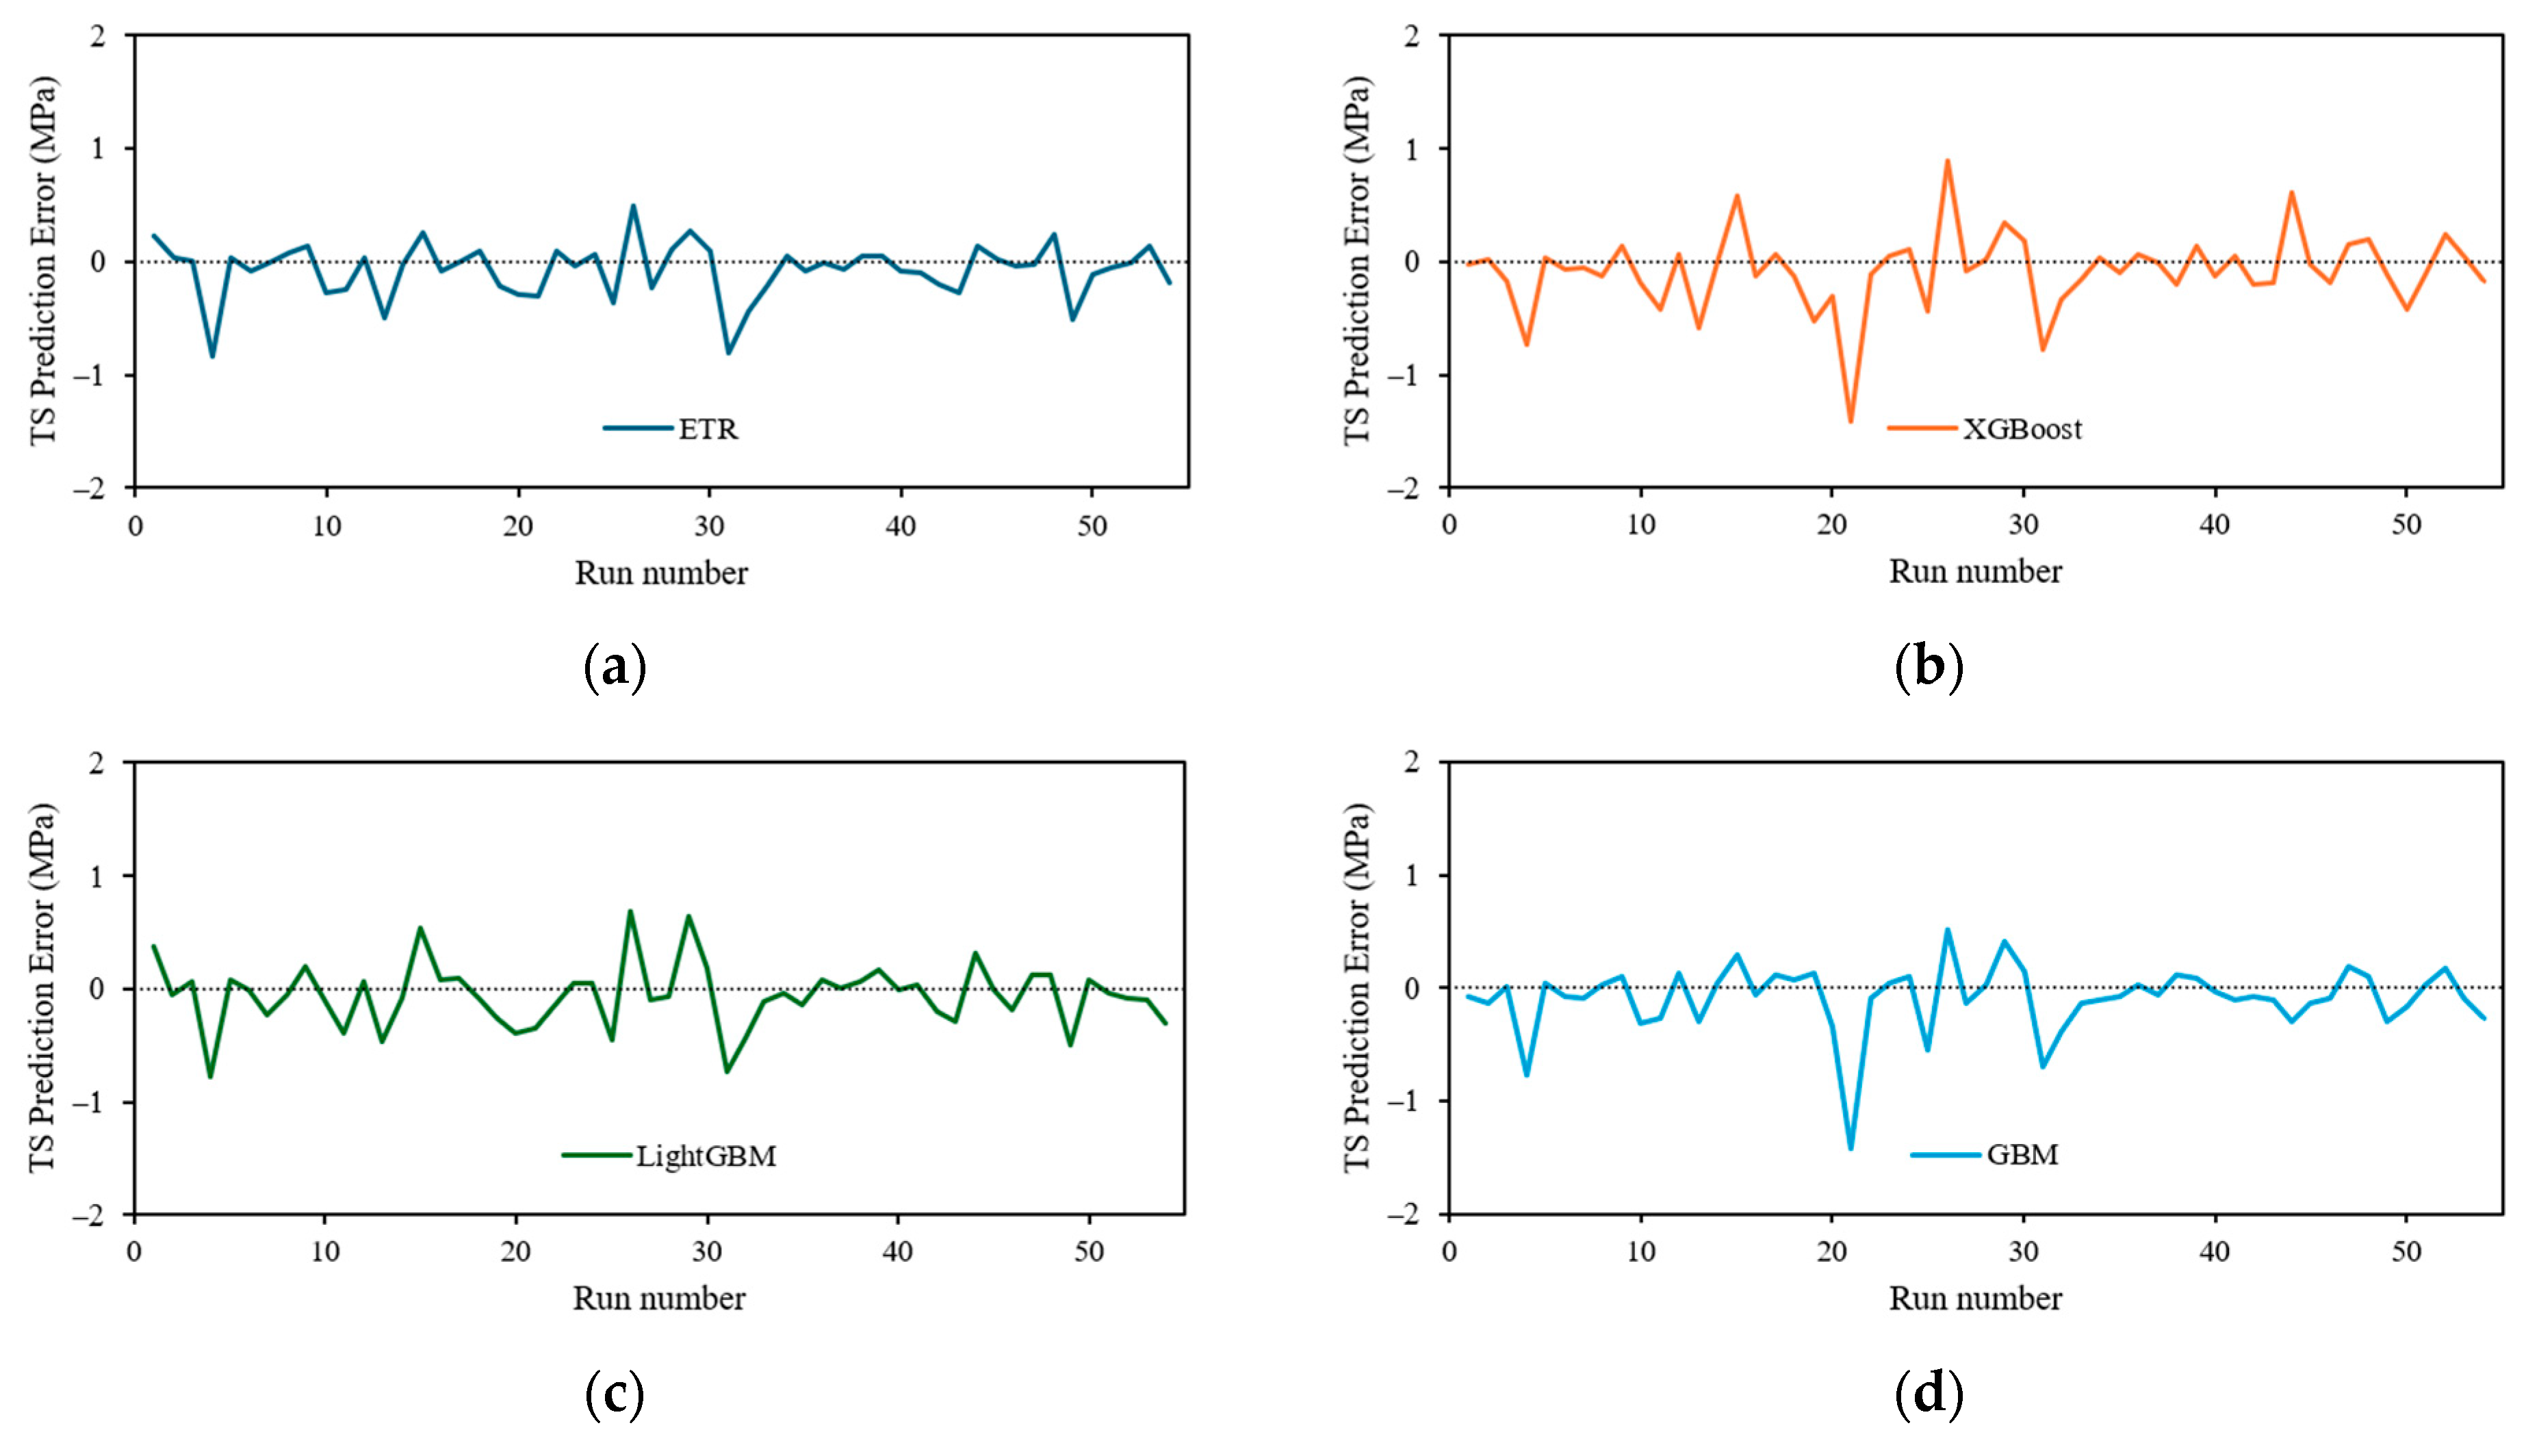
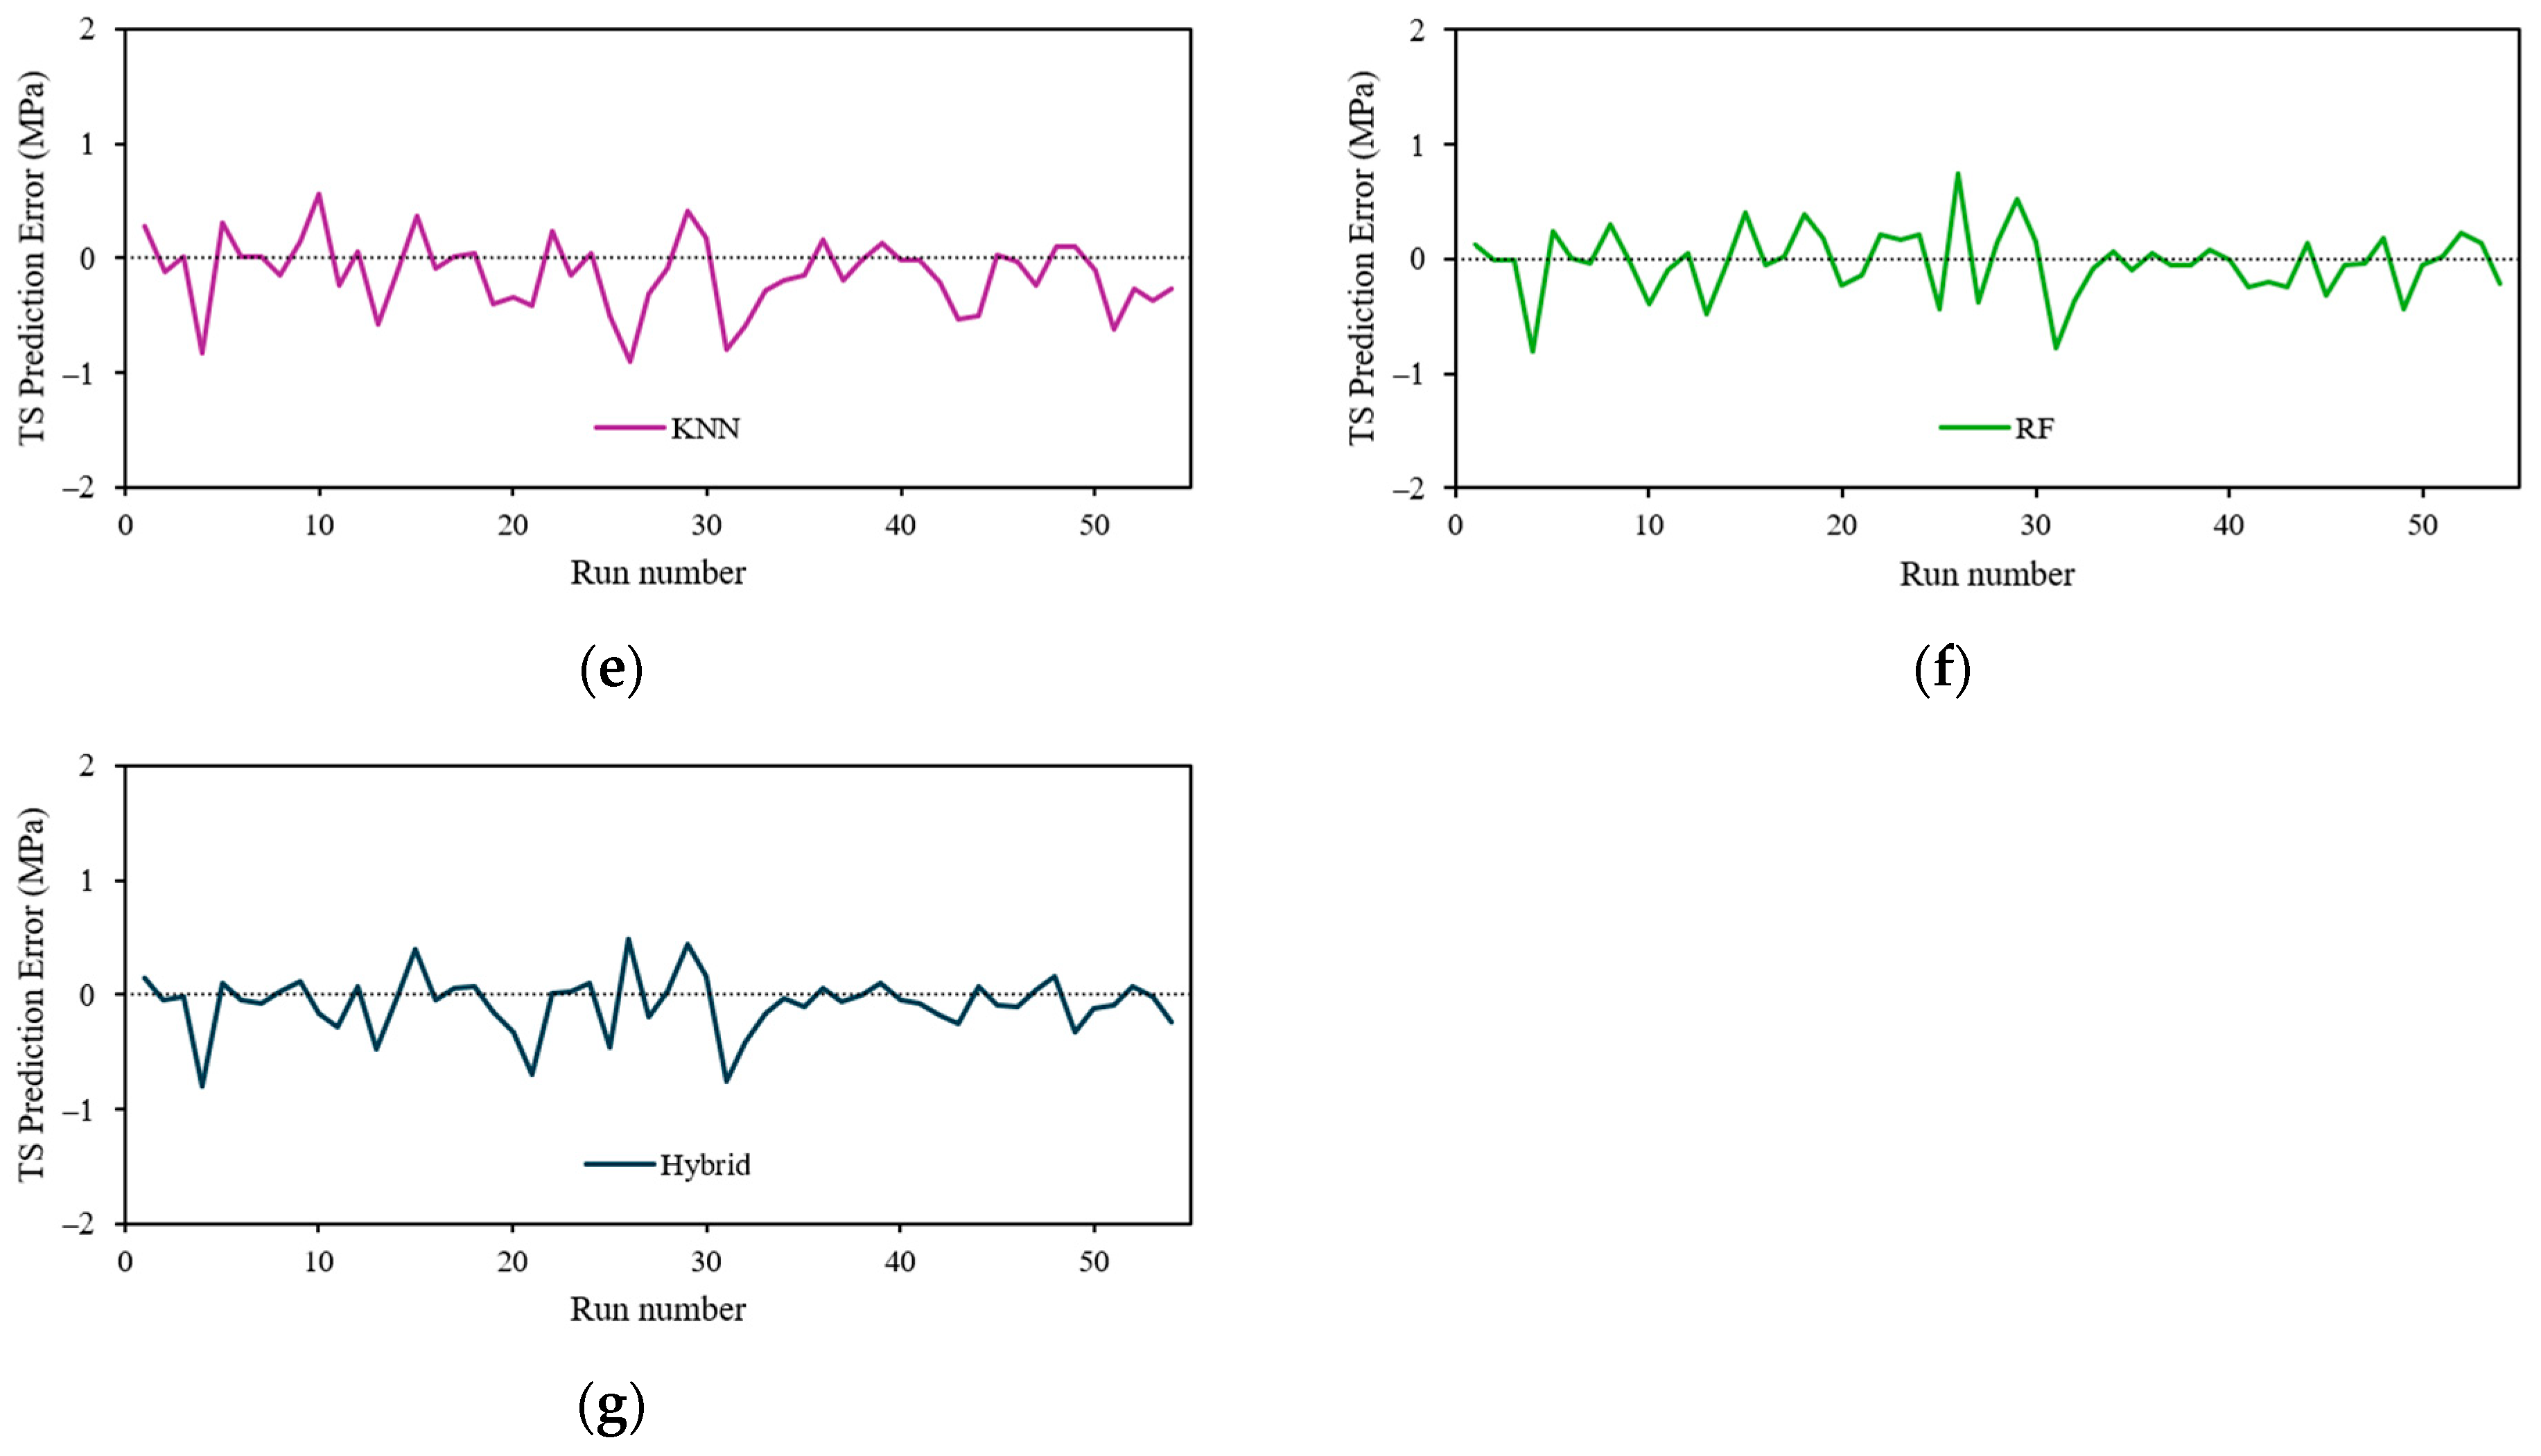
Figure 6 and Figure 7 display prediction errors for CS and TS, respectively. For compressive strength (CS), the results of prediction errors show that all six individual learners along with the hybrid model tend to produce errors around zero. This means there is no strong systematic over or under prediction for the evaluated observations. The errors, in general, are relatively small; however, some data and models exhibit larger deviations. The hybrid model has a tighter error distribution, although there are still some large deviations. The error values include several relatively large positive and negative deviations. For example, XGBoost exhibits an error of approximately 6.19 in run 17 and RF records an error of nearly 7.14 in run 31. Negative errors of substantial magnitude also occur in some runs. The data are in line with the statistical evaluation where the hybrid model obtained the highest R2, lowest MAE, and low RMSE.
Figure 6.
Prediction error in CS: (a) ETR, (b) XGBoost, (c) LightGBM, (d) GBM, (e) KNN, (f) RF, and (g) hybrid.
Figure 7.
Prediction error in TS: (a) ETR, (b) XGBoost, (c) LightGBM, (d) GBM, (e) KNN, (f) RF, and (g) hybrid.
For TS, Figure 7 shows notable deviations, including values around −1.408 for XGBoost and −1.42 for GBM in run 21 and approximately −0.90 for KNN in run 26. The hybrid model also shows relatively minimal errors for most of the observations, with maximum positive and negative deviations of nearly 0.486 and −0.792, respectively. This rather narrow distribution is more consistent with the lower-error and higher-explanatory-performance values of the hybrid model than those of the individual learners. The errors are tightly grouped around zero, which provides graphical evidence of satisfactory agreement between the measured and predicted TS values. The presence of errors on both sides of zero implies that the model does not have severe directional prediction bias.
3.7. Global Explanations
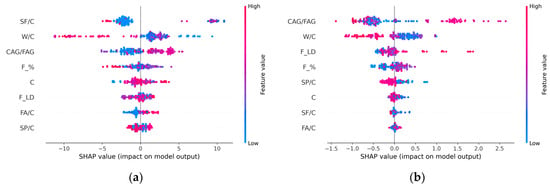
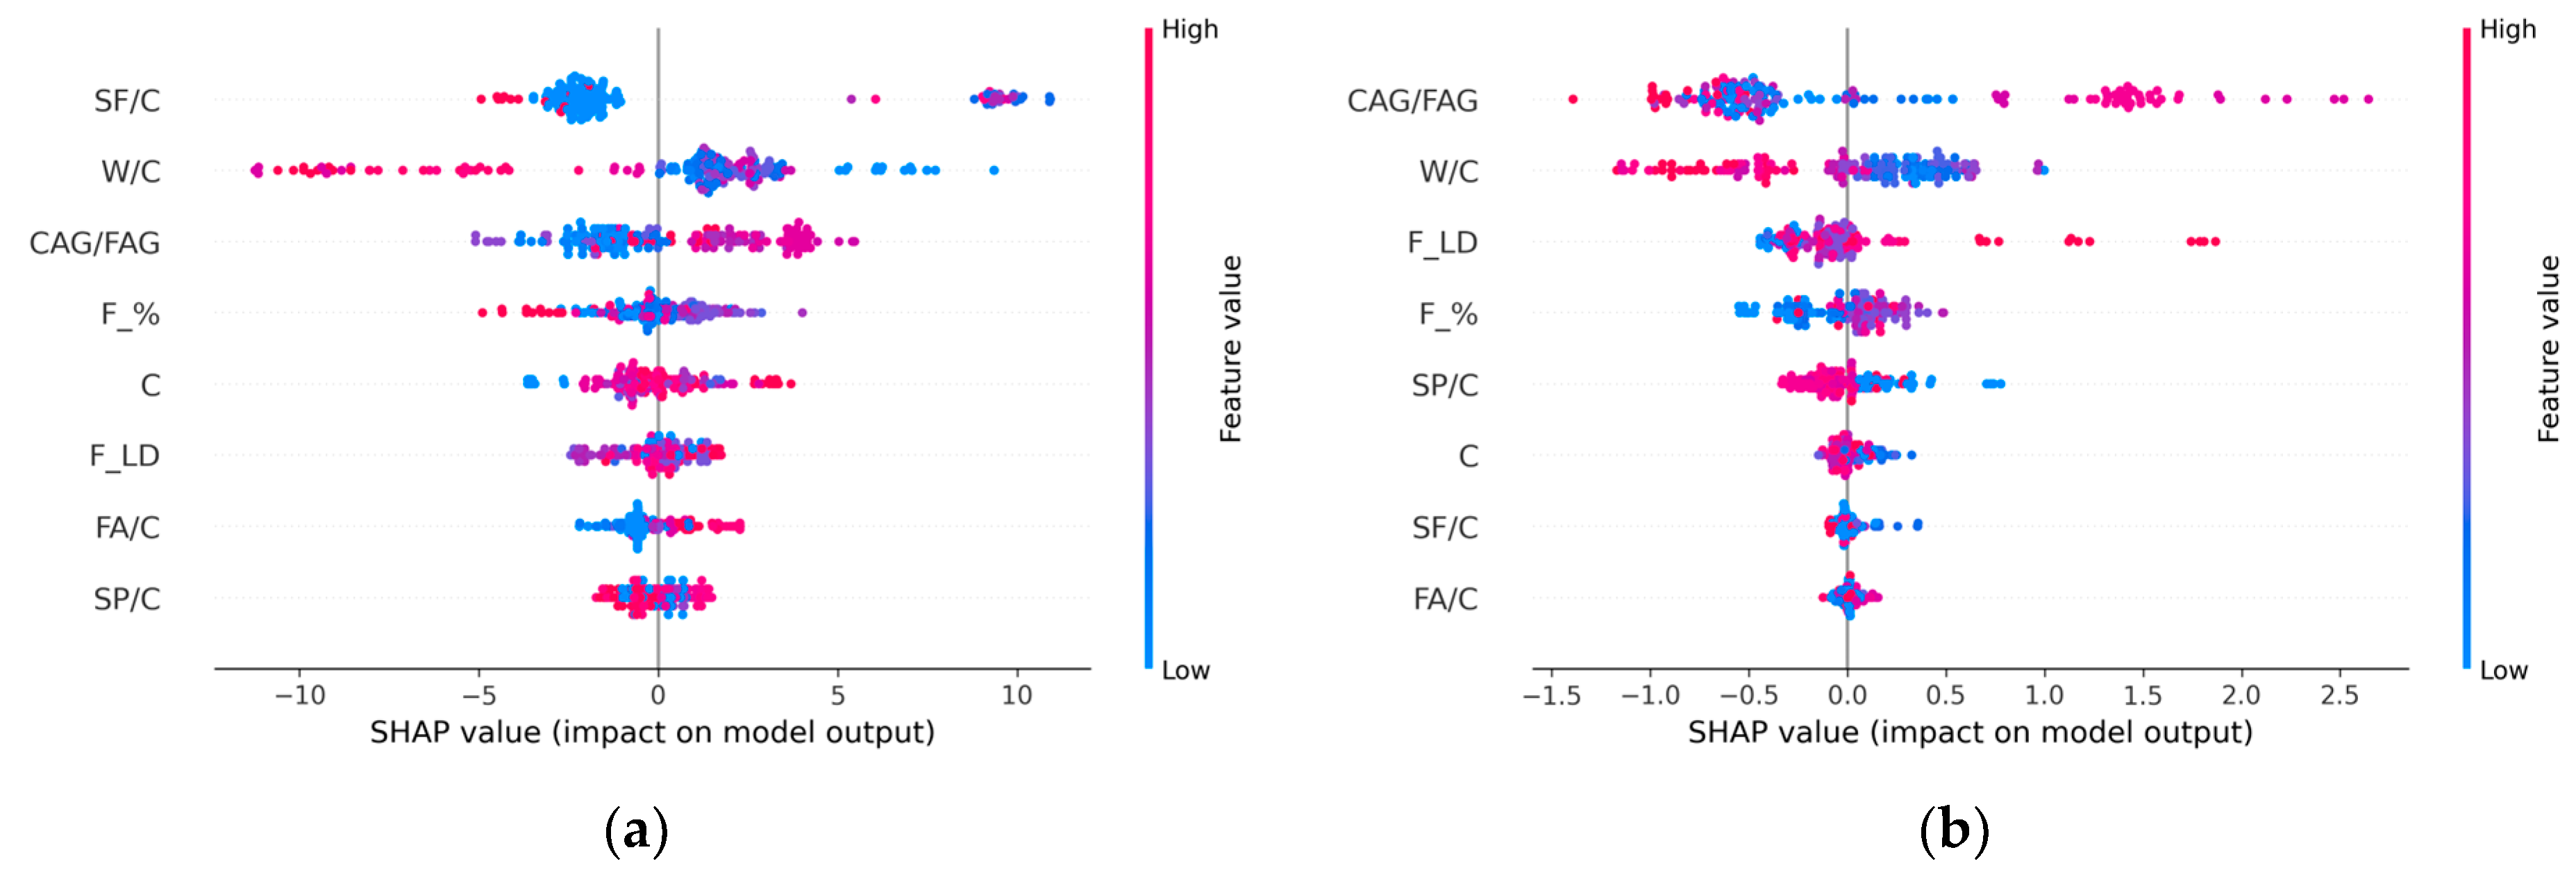
The SHAP summary plots for the generated compressive-strength (CS) and tensile-strength (TS) models are shown in Figure 8. SHAP values are a measure of how much each input variable contributed to the model output. For the CS model (Figure 8a), the silica fume to cement ratio (SF/C) and water to cement ratio (W/C) are the main influencing elements. A high W/C ratio (red dots) has a substantial detrimental effect on CS. Higher fiber content (F_%) decreases CS, likely due to fiber balling or larger air voids at higher doses. Higher values of CAG/FAG and C positively affect the strength.
Figure 8.
SHAP plots for the hybrid model: (a) CS and (b) TS.
For the TS model (Figure 8b), the CAG/FAG ratio was found to be the most important property, with large values considerably increasing the tensile strength. Interestingly, the fiber percentage (F_%) impact is reversed compared to the CS model. In TS, larger F_% provides positive SHAP values, confirming the mechanical expectation that basalt fibers bridge micro-cracks well and enhance tensile capacity. The total range of SHAP values for TS (about −1.5 to +2.5) is much narrower than that for CS (approximately −12 to +12). This suggests that the characteristics have a more confined, but still important, effect on the variance of tensile strength. The plots demonstrate that the hybrid model can successfully describe the complex divergent physical mechanisms driving the compressive and tensile behaviors of basalt-fiber-reinforced concrete.
3.8. Comparison Between Models from Literature and the Present Study
The performance of the hybrid model developed in the present work for predicting the CS and TS of BFRC is assessed through comparisons with the best-performing separate CS and TS models reported by Kulasooriya et al. [20] and Abbas and Alharbi [24]. As shown in Table 10, the proposed hybrid model for CS prediction achieved R2 = 0.9843, RMSE = 1.495, and MAE = 1.087, which was better than the LightGBM (LGB) model of Kulasooriya et al. [20] (R2 = 0.918, RMSE = 3.209, and MAE = 2.4) and weighted-voting model of Abbas and Alharbi [24] (R2 = 0.9299, RMSE = 3.081, and MAE = 2.066). Results show that the proposed hybrid model has a better fit to the experimental data and minimizes prediction errors for CS. The hybrid model produced the lowest RMSE (0.253) and MAE (0.175) for TS prediction, which outperformed the decision tree (DT) model of Kulasooriya et al. [20] (RMSE = 0.424 and MAE = 0.300) and the gradient boosting (GB) model of Abbas and Alharbi [24] (RMSE = 0.311 and MAE = 0.204). However, its R2 value of 0.9632 was lower than that of the GB model (0.9726). Overall, the results show that the developed hybrid technique provides a promising predictive performance for both strength attributes, especially in reducing the prediction errors.
Table 10.
Comparison with previous models.
3.9. User Friendly Web-Based Application
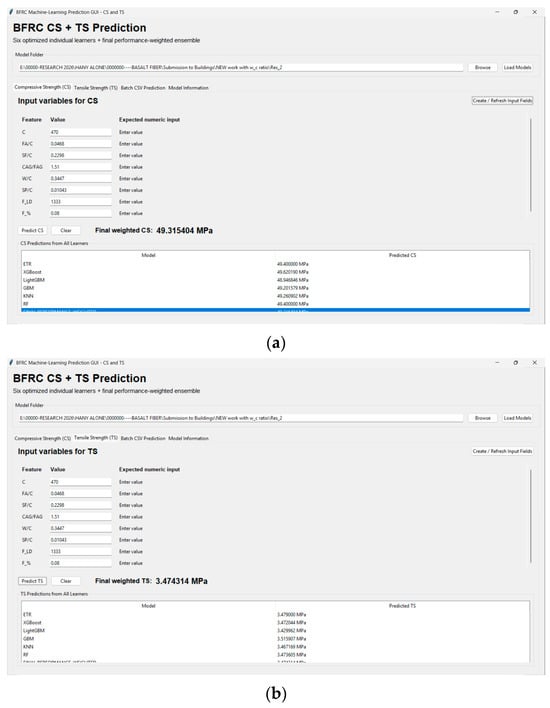
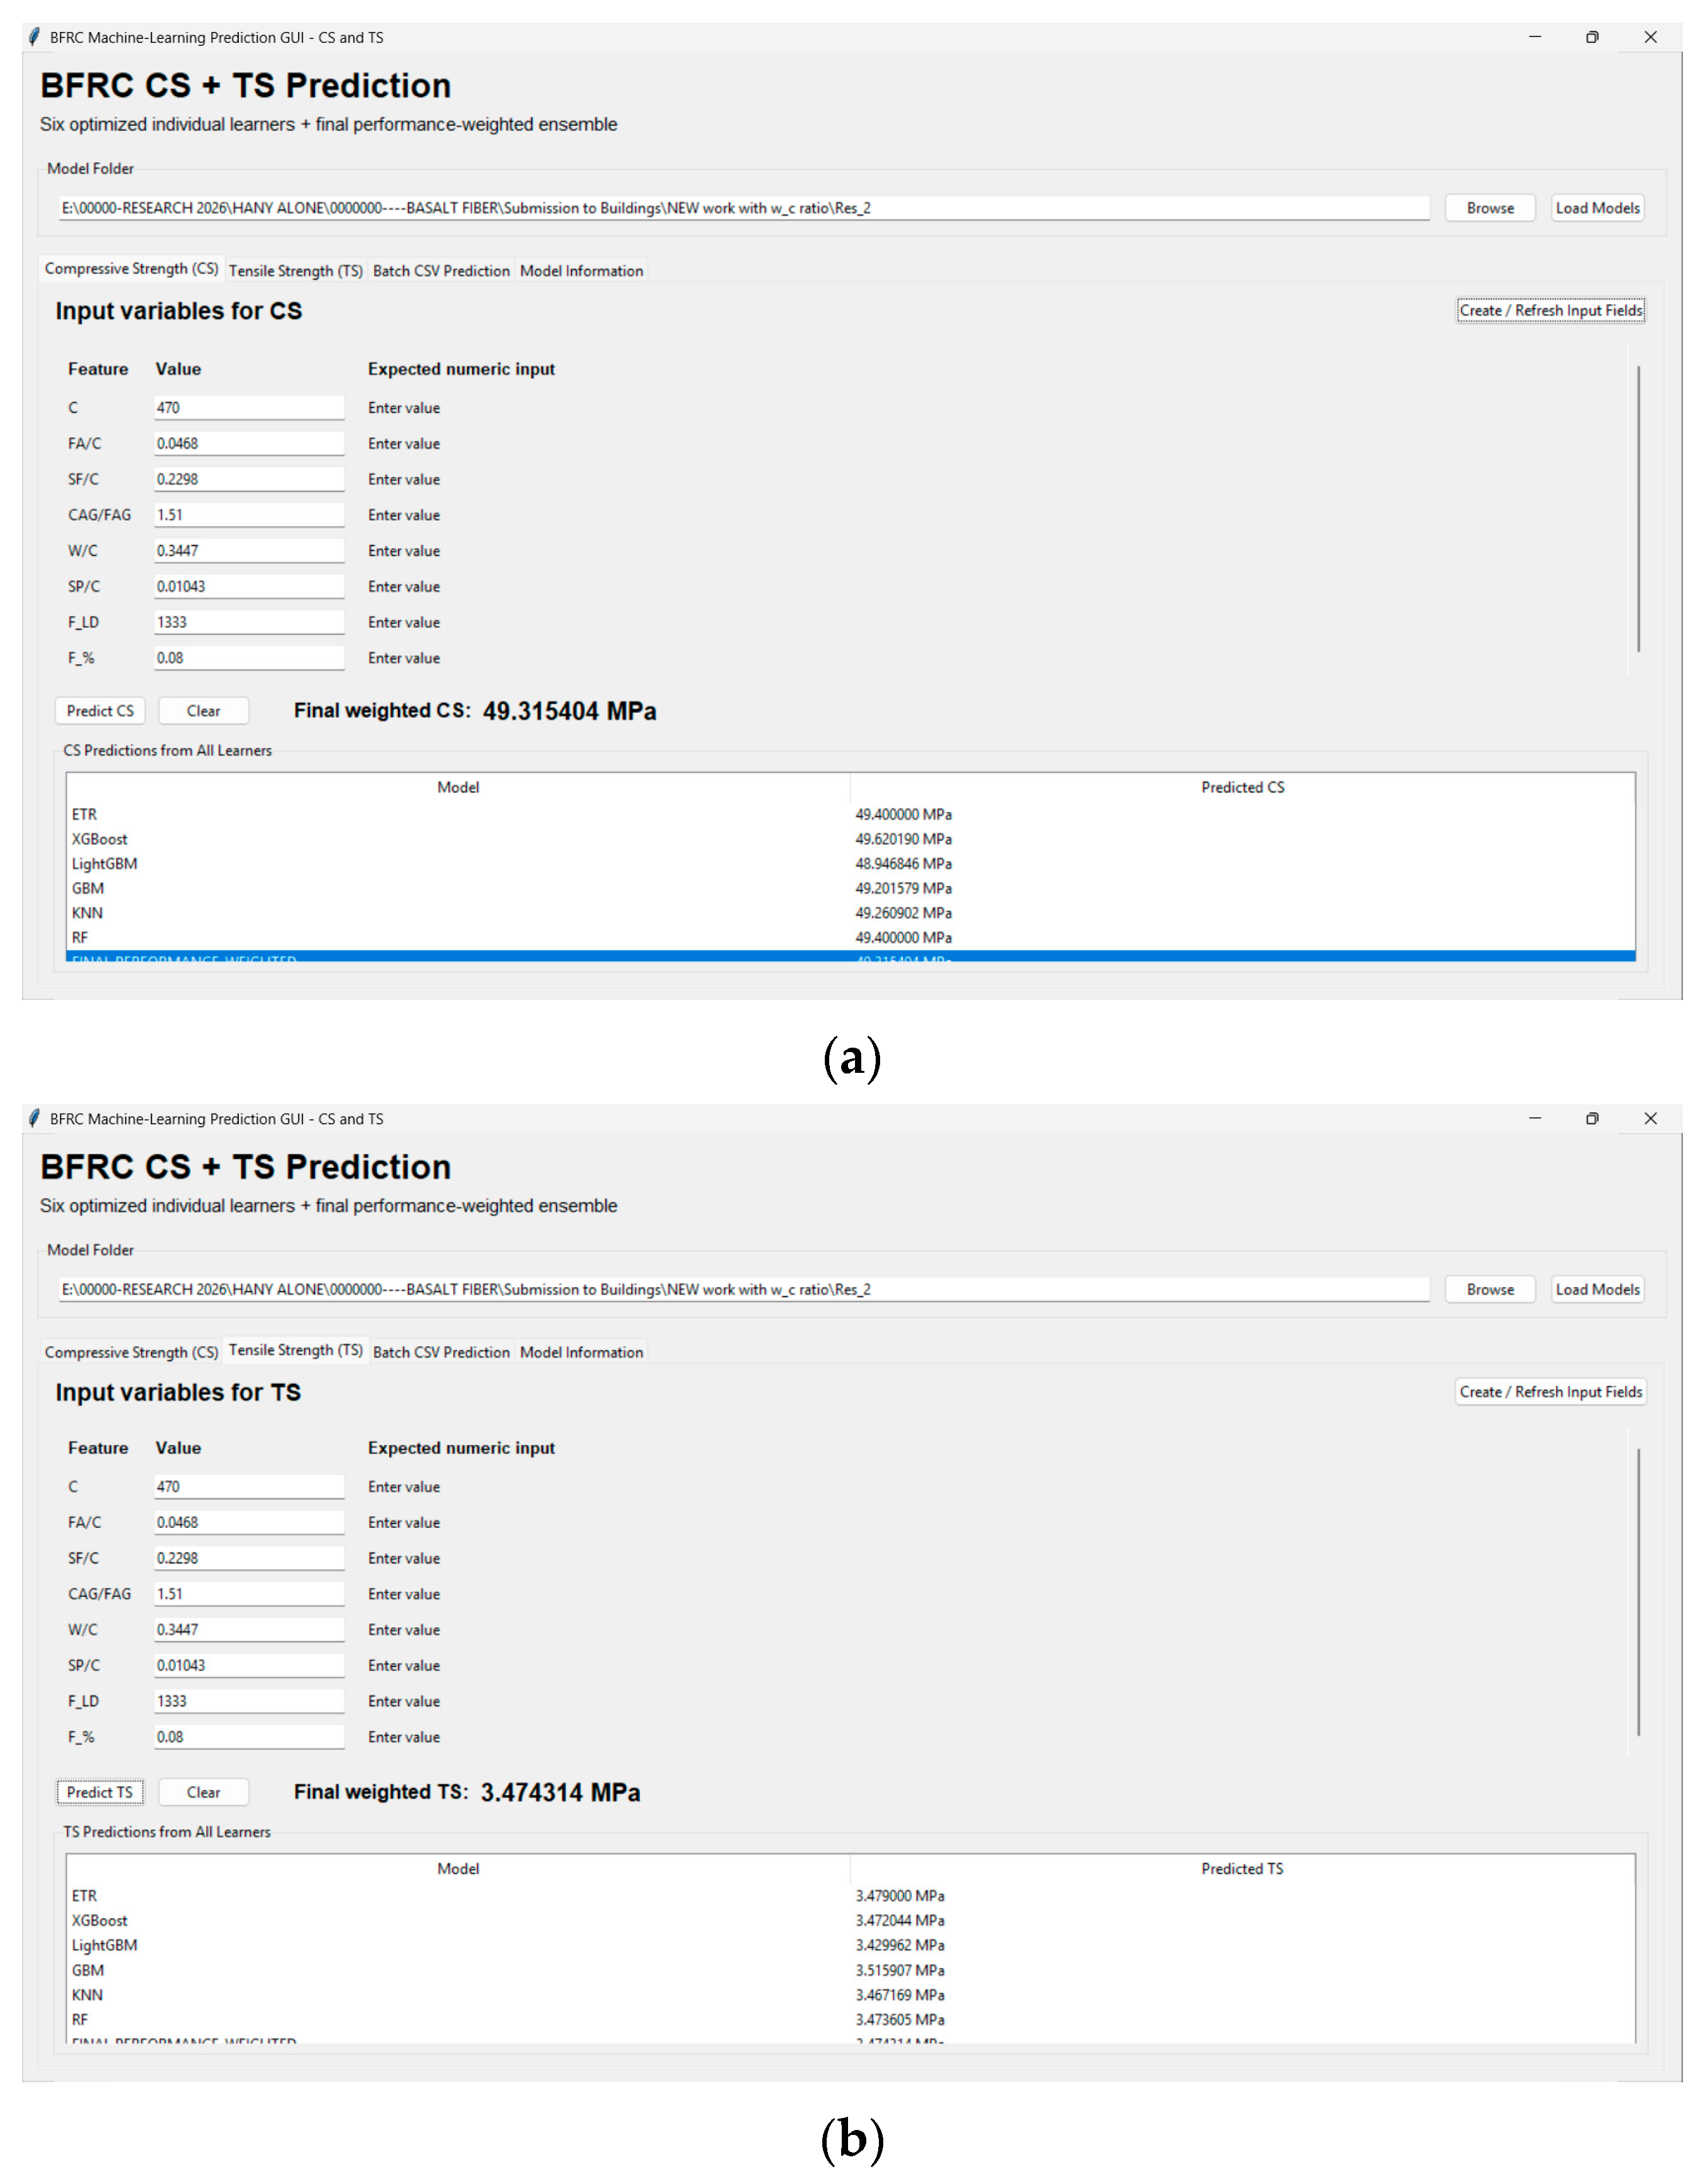
To enable the practical use of the proposed machine learning architecture, a graphical user interface (GUI) for the prediction of the CS and TS of BFRC was established (Figure 9). The interface includes individual learners and the hybrid model, with different tabs for CS and TS prediction. The user can select the directory where the trained models are located. Then, the required model files and the corresponding input forms are automatically generated. After entering the input parameters, the GUI displays the predictions from each of the individual learners and the final performance-weighted ensemble prediction model. This structure allows users to directly compare the answers of multiple algorithms while keeping the ensemble prediction as the integrated output of the built framework. The GUI offers a convenient way to utilize the developed models for new BFRC combinations. For a given material and mixture-design parameter combination, the individual learner predictions can be analyzed to assess their consistency, and the final weighted prediction offers a consolidated estimate based on the previously calculated model contributions. The GUI converts the computational approach created into an easy-to-use prediction tool to enable the preliminary evaluation of the BFRC mixture performance and promote practical use of the suggested machine learning framework. However, the predictions should be understood in the domain represented by the training dataset, and experimental validation is still required when applying the models to significantly different materials or mixture compositions.
Figure 9.
Proposed GUI using base learners and hybrid ML models for estimating compressive and tensile strengths of BFRC: (a) CS; (b) TS.
4. Conclusions
This study used six individual learners (ETR, XGBoost, LightGBM, GBM, KNN, and RF) and the hybrid models for predicting the CS and TS of BFRC. The conclusions are summarized as follows:
- The hybrid model for predicting CS outperforms the six individual models, with a maximum R2 of 0.9843, minimum MAE of 1.087, and minimum RMSE of 1.495.
- The hybrid model for predicting TS exhibits the highest R2 of 0.9632, alongside the lowest MAE of 0.175 and the lowest RMSE of 0.253, compared to all individual prediction models.
- The scatter plots of all seven models for CS prediction are predominantly concentrated toward the optimal projected trend, suggesting a strong correlation between the expected and actual CS values. The hybrid model illustrated that the collective ensemble preserves the robust predictive power of each singular learner while reducing prediction discrepancy for numerous instances.
- The scatter plots for TS prediction models indicate that predictions are predominantly scattered about the optimal prediction, reflecting a strong correlation between the actual and predicted TS. The limited spread of observations indicates that the models yield reliable forecasts for the examined TS range.
- The CS hybrid model has a more compact error distribution; however, there are a few considerable aberrations. The TS hybrid model demonstrates comparatively low error rates.
- The SHAP analysis reveals that SF/C is the predominant factor affecting CS predictions, succeeded by W/C, CAG/FAG, F_%, and C. The analysis also indicates that CAG/FAG, W/C, F_LD, and F_% are the most influential variables for predicting TS.
- The developed CS hybrid model has a better fit to the experimental data and minimizes prediction errors for CS compared to DT and GB models from literature. The developed TS hybrid model provides the minimum prediction errors while its R2 value is surpassed only by that of the GB model.
- The constructed GUI, which is based on the six individual learners and the hybrid models, can be used for predicting CS and TS of BFRC within the range of input variables used in this study.
5. Limitation and Future Work
The compiled dataset does not include cement activity beyond strength class, or aggregate quality beyond type and maximum size, because these parameters are reported inconsistently throughout the source papers. Cement content alone is thus an imperfect proxy for binder quality, and some of the residual scatters in the models are due to unrecorded variation in cement reactivity and aggregate properties. This is a limitation of the literature-compiled datasets, not the modeling approach, and it encourages future basalt-fiber-reinforced concrete investigations to provide standard test protocols and material specifications.
Supplementary Materials
The following supporting information can be downloaded at: https://www.mdpi.com/article/10.3390/buildings16224564/s1, Table S1: Dataset.
Author Contributions
Conceptualization, H.A.D.; methodology, A.M.A. and H.A.D.; software, H.A.D.; project administration, A.M.A.; validation, A.M.A.; formal analysis, H.A.D.; investigation, A.M.A. and H.A.D.; resources, A.M.A.; data curation, H.A.D.; writing—original draft preparation, H.A.D.; writing—review and editing, A.M.A.; visualization, H.A.D.; supervision, A.M.A.; funding acquisition, A.M.A. All authors have read and agreed to the published version of the manuscript.
Funding
This research received no external funding.
Data Availability Statement
The original contributions presented in this study are included in the article/Supplementary Materials. Further inquiries can be directed to the corresponding author.
Acknowledgments
The researchers would like to thank the Deanship of Graduate Studies and Scientific Research at Qassim University for financial support (QU-APC-2026). Also, during the preparation of this work, the authors used ChatGPT (OpenAI GPT-5.5 Instant) to refine language, improve readability, and enhance formatting consistency. After using this tool, the authors thoroughly reviewed and edited the content as needed and take full responsibility for the content of the publication.
Conflicts of Interest
The authors declare no conflicts of interest.
Nomenclature
| BF | basalt fiber |
| BFRC | basalt-fiber-reinforced concrete |
| CS | compressive strength |
| C | cement |
| CAG/FAG | coarse aggregate-to-fine aggregate ratio |
| SF | silica fume |
| FA | fly ash |
| W | water content |
| SP | superplasticizer |
| F_LD | basalt fiber length-to-diameter ratio |
| F_% | fiber content |
| TS | tensile strength |
| FS | flexural strength |
| ML | machine learning |
| ETR | extra trees regressor |
| KNN | K-nearest neighbors |
| RF | random forest |
| XGBoost | extreme gradient boosting |
| LightGBM | Light GBM |
| GBM | gradient boosting machine |
| PSO | particle swarm optimization |
| GWO | grey wolf optimizer |
| SVR | support vector regression |
| DT | decision tree |
| GB | gradient boosting tree |
| VIF | variance inflation factor |
| GUI | graphical user interface |
| SHAP | SHapley Additive exPlanations |
| RMSE | root mean squared error |
| r | Pearson correlation |
| R2 | coefficient of determination |
| MAE | mean absolute error |
| SD | standard deviation |
References
- Sim, J.; Park, C.; Moon, D.Y. Characteristics of Basalt Fiber as a Strengthening Material for Concrete Structures. Compos. B Eng. 2005, 36, 504–512. [Google Scholar] [CrossRef] [Scilit]
- Jamshaid, H.; Mishra, R. A Green Material from Rock: Basalt Fiber—A Review. J. Text. Inst. 2016, 107, 923–937. [Google Scholar] [CrossRef] [Scilit]
- Militký, J.; Mishra, R.; Jamshaid, H. Basalt Fibers. In Handbook of Properties of Textile and Technical Fibres; Elsevier: Amsterdam, The Netherlands, 2018; pp. 805–840. [Google Scholar]
- Wang, X.; He, J.; Mosallam, A.S.; Li, C.; Xin, H. The Effects of Fiber Length and Volume on Material Properties and Crack Resistance of Basalt Fiber Reinforced Concrete (BFRC). Adv. Mater. Sci. Eng. 2019, 2019, 1–17. [Google Scholar] [CrossRef] [Scilit]
- Yang, L.; Xie, H.; Fang, S.; Huang, C.; Yang, A.; Chao, Y.J. Experimental Study on Mechanical Properties and Damage Mechanism of Basalt Fiber Reinforced Concrete under Uniaxial Compression. Structures 2021, 31, 330–340. [Google Scholar] [CrossRef] [Scilit]
- Meyyappan, P.L.; Jemimah Carmichael, M. Studies on Strength Properties of Basalt Fibre Reinforced Concrete. Mater. Today Proc. 2021, 43, 2105–2108. [Google Scholar] [CrossRef] [Scilit]
- Jalasutram, S.; Sahoo, D.R.; Matsagar, V. Experimental Investigation of the Mechanical Properties of Basalt Fiber-reinforced Concrete. Struct. Concr. 2017, 18, 292–302. [Google Scholar] [CrossRef] [Scilit]
- Ekanayake, I.U.; Meddage, D.P.P.; Rathnayake, U. A Novel Approach to Explain the Black-Box Nature of Machine Learning in Compressive Strength Predictions of Concrete Using Shapley Additive Explanations (SHAP). Case Stud. Constr. Mater. 2022, 16, e01059. [Google Scholar] [CrossRef] [Scilit]
- Li, H.; Lin, J.; Lei, X.; Wei, T. Compressive Strength Prediction of Basalt Fiber Reinforced Concrete via Random Forest Algorithm. Mater. Today Commun. 2022, 30, 103117. [Google Scholar] [CrossRef] [Scilit]
- Li, H.; Lin, J.; Zhao, D.; Shi, G.; Wu, H.; Wei, T.; Li, D.; Zhang, J. A BFRC Compressive Strength Prediction Method via Kernel Extreme Learning Machine-Genetic Algorithm. Constr. Build. Mater. 2022, 344, 128076. [Google Scholar] [CrossRef] [Scilit]
- Golafshani, E.M.; Behnood, A.; Arashpour, M. Predicting the Compressive Strength of Eco-Friendly and Normal Concretes Using Hybridized Fuzzy Inference System and Particle Swarm Optimization Algorithm. Artif. Intell. Rev. 2023, 56, 7965–7984. [Google Scholar] [CrossRef] [Scilit]
- Asteris, P.G.; Skentou, A.D.; Bardhan, A.; Samui, P.; Pilakoutas, K. Predicting Concrete Compressive Strength Using Hybrid Ensembling of Surrogate Machine Learning Models. Cem. Concr. Res. 2021, 145, 106449. [Google Scholar] [CrossRef] [Scilit]
- Zeng, Y.; Chen, Y.; Liu, Y.; Wu, T.; Zhao, Y.; Jin, D.; Xu, F. Prediction of Compressive and Flexural Strength of Coal Gangue-Based Geopolymer Using Machine Learning Method. Mater. Today Commun. 2025, 44, 112076. [Google Scholar] [CrossRef] [Scilit]
- Almohammed, F.; Thakur, M.S. Prediction of Compressive Strength of BFRC Using Soft Computing Techniques. Soft Comput. 2024, 28, 1391–1408. [Google Scholar] [CrossRef] [Scilit]
- Almohammed, F.; Thakur, M.S. Forecasting Compressive Strength of Concrete with Basalt and Polypropylene Fiber by Using ANN, RF and RT Models. Asian J. Civ. Eng. 2024, 25, 1671–1690. [Google Scholar] [CrossRef] [Scilit]
- Najmoddin, A.; Etemadfard, H.; Hosseini. S, A.; Ghalehnovi, M. Multi-Output Machine Learning for Predicting the Mechanical Properties of BFRC. Case Stud. Constr. Mater. 2024, 20, e02818. [Google Scholar] [CrossRef] [Scilit]
- Ullah, I.; Javed, M.F.; Alabduljabbar, H.; Ullah, H. Estimating the Compressive and Tensile Strength of Basalt Fibre Reinforced Concrete Using Advanced Hybrid Machine Learning Models. Structures 2025, 71, 108138. [Google Scholar] [CrossRef] [Scilit]
- Kazemi, F.; Özyüksel Çiftçioğlu, A.; Shafighfard, T.; Asgarkhani, N.; Jankowski, R. RAGN-R: A Multi-Subject Ensemble Machine-Learning Method for Estimating Mechanical Properties of Advanced Structural Materials. Comput. Struct. 2025, 308, 107657. [Google Scholar] [CrossRef] [Scilit]
- R., S.M.; K., N. An Explainable AI-Based Recommendation System for E-Commerce Platforms. Int. J. Innov. Sci. Res. Technol. 2026, 11, 1527. [Google Scholar] [CrossRef] [Scilit]
- Kulasooriya, W.K.V.J.B.; Ranasinghe, R.S.S.; Perera, U.S.; Thisovithan, P.; Ekanayake, I.U.; Meddage, D.P.P. Modeling Strength Characteristics of Basalt Fiber Reinforced Concrete Using Multiple Explainable Machine Learning with a Graphical User Interface. Sci. Rep. 2023, 13, 13138. [Google Scholar] [CrossRef] [Scilit] [PubMed]
- Wickramasuriya, B.Y.; Alahakoon, Y.; Krishantha, B.R.G.A.; Alawatugoda, J.; Ekanayake, I.U. Prediction of the Strength Characteristics of Basalt Fibre Reinforced Concrete Using Explainable Machine Learning Models. Discov. Appl. Sci. 2025, 7, 890. [Google Scholar] [CrossRef] [Scilit]
- Zhu, M.; Lin, J.; Cao, G.; Zhang, J.; Zhang, X.; Zhou, J.; Gao, Y. Prediction of Constitutive Model for Basalt Fiber Reinforced Concrete Based on PSO-KNN. Heliyon 2024, 10, e32240. [Google Scholar] [CrossRef] [Scilit] [PubMed]
- Kumar, A.; Arora, H.C.; Kapoor, N.R.; Mohammed, M.A.; Kumar, K.; Majumdar, A.; Thinnukool, O. Compressive Strength Prediction of Lightweight Concrete: Machine Learning Models. Sustainability 2022, 14, 2404. [Google Scholar] [CrossRef] [Scilit]
- Abbas, Y.M.; Alharbi, Y.R. Hybrid Machine Learning Modeling of Strength in Sustainable Basalt Fiber-Reinforced Concrete. Mater. Today Commun. 2025, 46, 112554. [Google Scholar] [CrossRef] [Scilit]
- Vairagade, V.S. Predictive Modeling and Design Optimization of Concrete Properties Reinforced with Basalt Fiber under Harsh Environment. J. Mater. Sci. Mater. Eng. 2026; in press. [CrossRef] [Scilit]
- Cakiroglu, C.; Aydın, Y.; Bekdaş, G.; Geem, Z.W. Interpretable Predictive Modelling of Basalt Fiber Reinforced Concrete Splitting Tensile Strength Using Ensemble Machine Learning Methods and SHAP Approach. Materials 2023, 16, 4578. [Google Scholar] [CrossRef] [Scilit] [PubMed]
- Wu, Y.; Zhou, Y. Hybrid Machine Learning Model and Shapley Additive Explanations for Compressive Strength of Sustainable Concrete. Constr. Build. Mater. 2022, 330, 127298. [Google Scholar] [CrossRef] [Scilit]
- Minghui, W. Mechanical Properties Dataset of BFRC for Strength Prediction with Machine Learning; Mendeley Data: London, UK, 2022; Volume V1. [Google Scholar] [CrossRef]
- Geurts, P.; Ernst, D.; Wehenkel, L. Extremely Randomized Trees. Mach. Learn. 2006, 63, 3–42. [Google Scholar] [CrossRef] [Scilit]
- Hameed, M.M.; AlOmar, M.K.; Khaleel, F.; Al-Ansari, N. An Extra Tree Regression Model for Discharge Coefficient Prediction: Novel, Practical Applications in the Hydraulic Sector and Future Research Directions. Math. Probl. Eng. 2021, 2021, 1–19. [Google Scholar] [CrossRef] [Scilit]
- Chen, T.; Guestrin, C. XGBoost. In Proceedings of the 22nd ACM SIGKDD International Conference on Knowledge Discovery and Data Mining; ACM: New York, NY, USA, 2016; pp. 785–794. [Google Scholar]
- Ikeagwuani, C.C. Estimation of Modified Expansive Soil CBR with Multivariate Adaptive Regression Splines, Random Forest and Gradient Boosting Machine. Innov. Infrastruct. Solut. 2021, 6, 199. [Google Scholar] [CrossRef] [Scilit]
- Jabeur, S.B.; Gharib, C.; Mefteh-Wali, S.; Arfi, W. Ben CatBoost Model and Artificial Intelligence Techniques for Corporate Failure Prediction. Technol. Forecast. Soc. Change 2021, 166, 120658. [Google Scholar] [CrossRef] [Scilit]
- Ni, C.; Huang, H.; Cui, P.; Ke, Q.; Tan, S.; Ooi, K.T.; Liu, Z. Light Gradient Boosting Machine (LightGBM) to Forecasting Data and Assisting the Defrosting Strategy Design of Refrigerators. Int. J. Refrig. 2024, 160, 182–196. [Google Scholar] [CrossRef] [Scilit]
- Cakiroglu, C.; Shahjalal, M.; Islam, K.; Mahmood, S.M.F.; Billah, A.H.M.M.; Nehdi, M.L. Explainable Ensemble Learning Data-Driven Modeling of Mechanical Properties of Fiber-Reinforced Rubberized Recycled Aggregate Concrete. J. Build. Eng. 2023, 76, 107279. [Google Scholar] [CrossRef] [Scilit]
- Breiman, L. Random Forests. Mach. Learn. 2001, 45, 5–32. [Google Scholar] [CrossRef] [Scilit]
- Belgiu, M.; Drăguţ, L. Random Forest in Remote Sensing: A Review of Applications and Future Directions. ISPRS J. Photogramm. Remote Sens. 2016, 114, 24–31. [Google Scholar] [CrossRef] [Scilit]
- Saleh, M.A.; Kazemi, F.; Abdelgader, H.S.; Isleem, H.F. Optimization-Based Multitarget Stacked Machine-Learning Model for Estimating Mechanical Properties of Conventional and Fiber-Reinforced Preplaced Aggregate Concrete. Arch. Civ. Mech. Eng. 2025, 25, 185. [Google Scholar] [CrossRef] [Scilit]
- Çiftçioğlu, A.; Kazemi, F.; Shafighfard, T. Grey Wolf Optimizer Integrated within Boosting Algorithm: Application in Mechanical Properties Prediction of Ultra High-Performance Concrete Including Carbon Nanotubes. Appl. Mater. Today 2025, 42, 102601. [Google Scholar] [CrossRef] [Scilit]
- Kazemi, F.; Asgarkhani, N.; Jankowski, R. Optimization-Based Stacked Machine-Learning Method for Seismic Probability and Risk Assessment of Reinforced Concrete Shear Walls. Expert Syst. Appl. 2024, 255, 124897. [Google Scholar] [CrossRef] [Scilit]

Disclaimer/Publisher’s Note: The statements, opinions and data contained in all publications are solely those of the individual author(s) and contributor(s) and not of MDPI and/or the editor(s). MDPI and/or the editor(s) disclaim responsibility for any injury to people or property resulting from any ideas, methods, instructions or products referred to in the content. |
© 2026 by the authors. Licensee MDPI, Basel, Switzerland. This article is an open access article distributed under the terms and conditions of the Creative Commons Attribution (CC BY) license.