


Abstract
Large language models (LLMs) can draft construction risk assessments from work names, but their coverage of fatal-accident mechanisms is uncertain. We evaluated 2097 hazards generated by GPT-5.6 Sol and Claude Fable 5 from work-category, work, and unit-work names alone. The reference was 1687 hazard factors for 113 unit works from the Korea Occupational Safety and Health Agency’s fatality-derived table (2016–2021). Two LLM judges scored hazard coverage and control adequacy. Two external experts independently rated 198 sampled items (judge–expert quadratic-weighted κ = 0.65–0.84). At the boundary between no and partial coverage, unweighted κ was only 0.37–0.71. Across the four service–judge combinations, 66.9–77.2% of the reference hazard factors were at least partially covered, but only 25.5–29.0% were fully covered. Full coverage is the primary and more reliable result, and it changed little under alternative matching rules. Shared omissions involved equipment states, work stages, and worker positions. Key preventive measures accompanied 95–97% of fully covered reference–draft pairs but 52–75% of partially covered pairs, depending on the judge; part of this association is built into the rubric. Of 5542 legal citations, 4689 cited the Rules on Occupational Safety and Health Standards; 99.6% of these named an existing article, and formal number–title agreement was 94.6% (GPT-5.6 Sol) and 95.9% (Claude Fable 5). All estimates describe one generation per service under the tested conditions and should not be generalized to the models’ overall performance. Such drafts require review focused on specific accident conditions and controls.
1. Introduction
In the Korean regulatory procedure, risk assessment is the process by which an employer identifies the hazards in a workplace, estimates and evaluates the associated risks, and establishes and implements risk-reduction measures [1]. In the terminology of international standards, this last step belongs to risk management rather than to risk assessment; this paper uses the term in its Korean regulatory sense, in which the resulting document also records the controls. In the Republic of Korea, Article 36 of the Occupational Safety and Health Act requires risk assessment, and the Serious Accidents Punishment Act imposes a duty to secure safety and health [2,3]. The 2023 revision of the risk assessment guideline placed further emphasis on hazard identification and the development of controls [1]. According to the Ministry of Employment and Labor’s 2024 industrial accident statistics, 328 workers died in construction accidents, accounting for 39.7% of the 827 accident fatalities across all industries [4]. If risk assessment is to prevent construction fatalities, it must identify the work conditions that can lead to an accident and set out measures that can prevent them. A risk assessment document can support these judgments and actions only if it states the specific conditions under which accidents occur alongside the controls.
Under the Serious Accidents Punishment Act, the risk assessment document is also evidence of which risks a workplace recognized and what it did about them [3]. The 2023 revision of the guideline allowed small enterprises to carry out risk assessment in simplified forms [1], but a workplace with no dedicated safety manager rarely has anyone able to develop hazard and control descriptions for each unit work from scratch. In this study, “work names” refers collectively to the names of the work category, work, and unit work; a unit work is the most specific level of this hierarchy. For such a workplace, typing a work name into the chat window of a general-purpose large language model (LLM) immediately yields a draft that resembles a completed document in its format, content, and legal citations. The problem is that the user has no easy way to tell whether that document contains the specific accident conditions that lead to fatalities. A document that looks complete may lead a reviewer to skip further review—the complacency and automation bias observed when people work with automated aids in other domains [5,6]—and any accident condition it misses may remain unaddressed at the worksite. Before such drafts are used at all, it is therefore necessary to know how many of the actual conditions and controls associated with fatal accidents they fail to capture. LLMs have been applied to safety question answering, hazard recognition in images, classification of risk statements, and project risk identification [7,8,9,10,11]. Both the analysis of real site photographs and hazard identification by people working with generative artificial intelligence (AI) support have also been evaluated [12,13]. Performance on such tasks, however, does not tell us whether a generated risk assessment document adequately addresses the conditions and controls of actual fatal accidents.
For example, “fall during roof work” and “fall after stepping on and breaking a skylight” describe the same accident type, but they differ in the conditions that cause the accident and in the specificity of the required controls. In this paper, the combination of an accident type with a causal agent (for example, a fall from a roof) is called the hazard category, and the specific condition under which that accident occurs (for example, stepping on a fragile skylight) is called the accident mechanism; a draft that states only the former names the hazard category without describing the mechanism and, in that sense, misses the specific hazard. The Core Hazard Factors for Construction Fatalities (SIF) Evaluation Table (authors’ translation; hereafter, the SIF table) of the Korea Occupational Safety and Health Agency (KOSHA) compiles, work by work, hazard factors and controls derived from actual fatal accidents and can serve as a reference for judging such differences [14]. SIF stands for Serious Injury and Fatality. Reviewing the legal basis given in a draft also requires checking that the cited article number exists and that the title attached to it corresponds to the actual title of the article.
In this study, a “risk assessment draft” is the list of hazards and controls that an LLM writes from work-name-based input, before a site officer reviews and supplements it. The purpose of the study is to identify the fatal-accident scenarios that such drafts miss and to determine what additional checks users need to perform. The contribution is threefold. First, we present an evaluation procedure that compares generated documents against actual fatal-accident data used as the reference, instead of an expert-written answer key, and validates the judgments of LLM judges against external expert ratings. Second, we quantify the extent to which drafts generated from work names alone reflect the mechanisms of fatal accidents and identify the types of accident scenarios that both services (GPT-5.6 Sol and Claude Fable 5) miss. Third, we check 4689 article-level legal citations against a designated version of the regulation to identify errors in the linkage between article numbers and titles. The research questions are as follows.
- RQ1 (hazard coverage). How specifically do LLM-drafted risk assessments written from work names reflect the accident conditions given in the SIF table, and how does the level of coverage vary by work category, accident type, and causal agent?
- RQ2 (control adequacy). When a hazard factor from the SIF table is covered in an LLM-drafted risk assessment, do the controls for that hazard include the key preventive measures needed to prevent the accident?
- RQ3 (legal citation). Do the article numbers of the Rules on Occupational Safety and Health Standards (hereafter “the Rules”) cited in LLM-drafted risk assessments exist in the version in force chosen as the reference, and do the cited titles match the actual titles of those articles?
2. Background and Related Work
2.1. Hazard Identification and the Use of Accident and Site Information
Identifying hazards without omission is a central task of risk assessment. Construction method statements have been found to capture only a portion of the hazards actually present [15], and energy-based mnemonics and safety meetings have been studied as ways to improve hazard recognition [16]. Accident records have been used to classify accident types [17], predict fatal accidents [18], and extract and manage safety knowledge [19]; the broader body of construction safety management research has been reviewed by Zhou et al. [20].
Natural language processing systems have been proposed for extracting work and environmental conditions and injury outcomes from the unstructured narratives of accident reports [21]. Text-mining studies have automatically classified accident narratives [22] and extracted safety risk factors from accident reports [23]. These methods are used to organize information on hazards and accident conditions identified from accident records.
Studies that use this extracted information include case retrieval combining the semantic relations of accident terms with information extraction [24], an ontology-based knowledge base linking construction risks, their causes, and control measures [25], and the prediction of site risk levels from inspection records [26]. When a generated draft is reviewed, it is still necessary to confirm that the accident conditions and controls in the linked material are actually reflected in the draft.
Studies that represent risk through relations between work and space have checked construction models and schedules against safety rules in building information modeling (BIM) [27], identified fall hazards and the required protective systems by work stage with 4D BIM [28,29], and linked building elements, work processes, and safety knowledge in BIM to support job hazard analysis [30]; the ontology used there is a structured representation of concepts and their relations. Hazard identification from relationships among objects in images [31], the derivation of safety risk drivers from accident data for use with BIM [32], and the analysis of worker–equipment proximity over time [33] have also been proposed. A Safety Risk Library that links hazardous situations to controls has been deployed on real projects and evaluated by practitioners [34]. These approaches show how risk can be managed through relations and context rather than through the names of equipment or accident types alone.
2.2. Large Language Models in Construction Safety
LLM research in construction safety has addressed a range of tasks: answering safety professional certification questions [7], recognizing hazards in online and real construction-site images [8], classifying risk statements [9], and deriving project risk factors [10,11].
Studies of GPT-based LLM tools for safety training, accident analysis, and guideline drafting have shown that such models can generate responses for these tasks, while also pointing to limitations in deep reasoning and in their ability to respond to dynamic site contexts [35]. Broader reviews of GPT models in construction report the same pattern of opportunities and limitations [36], and ChatGPT has been examined as an aid to hazard recognition and safety training [37]. A multimodal model analyzing real construction site photographs likewise showed inconsistent hazard classification and limited inference of accident causes and context [12]. In a hazard identification task performed by people with generative AI support, performance against an expert reference list was higher than with conventional methods [13].
Retrieval-augmented generation (RAG) retrieves relevant material and uses it in language generation [38]. Cheng et al. proposed a hazard reasoning structure combining a safety knowledge graph with RAG for recognizing work behavior and protective equipment, and evaluated the reasoning assuming that the scene had been correctly perceived [39]. The present study evaluates, for work-name-based input with no added images or retrieved material, how specifically the generated hazards address the conditions of the reference accidents and the controls they require.
2.3. Linking Legal Citations to Safety Regulations
When an LLM generates citations without retrieving or verifying external sources, it can present sources that do not exist or are inaccurate, a form of hallucination that has been documented across language generation tasks [40]. Such legal hallucinations have been reported for general-purpose LLMs on US case-law queries [41] and for legal research tools [42]. Reviewing a legal basis therefore requires separating the formal verification of the article number and title from the judgment of whether the article’s content applies to the work in question.
In construction, requirements have been extracted from regulatory documents with natural language processing for automated compliance checking [43]; in construction safety, studies have extracted relations between entities in regulations to structure safety requirements [44] and recommended regulatory articles matching hazard descriptions [45].
Lee and Ham linked the Korean occupational safety and health rules with BIM object relations, combining rule-based safety design guidance with LLM-based semantic search [46]; the LLM module supports the linkage between regulations and objects but does not automatically determine quantitative compliance.
2.4. Using LLMs as Judges
LLM-as-a-judge is the use of an LLM to score responses against a defined rubric. Agreement with human evaluation has been reported for general conversation [47], but the possibility that a judge may favor responses generated by the same model has also been pointed out [48]. Applying the method to the comparison of construction hazards requires clear criteria for matching accident scenarios and verification of the degree to which the model’s judgments agree with expert judgment.
3. Materials and Methods
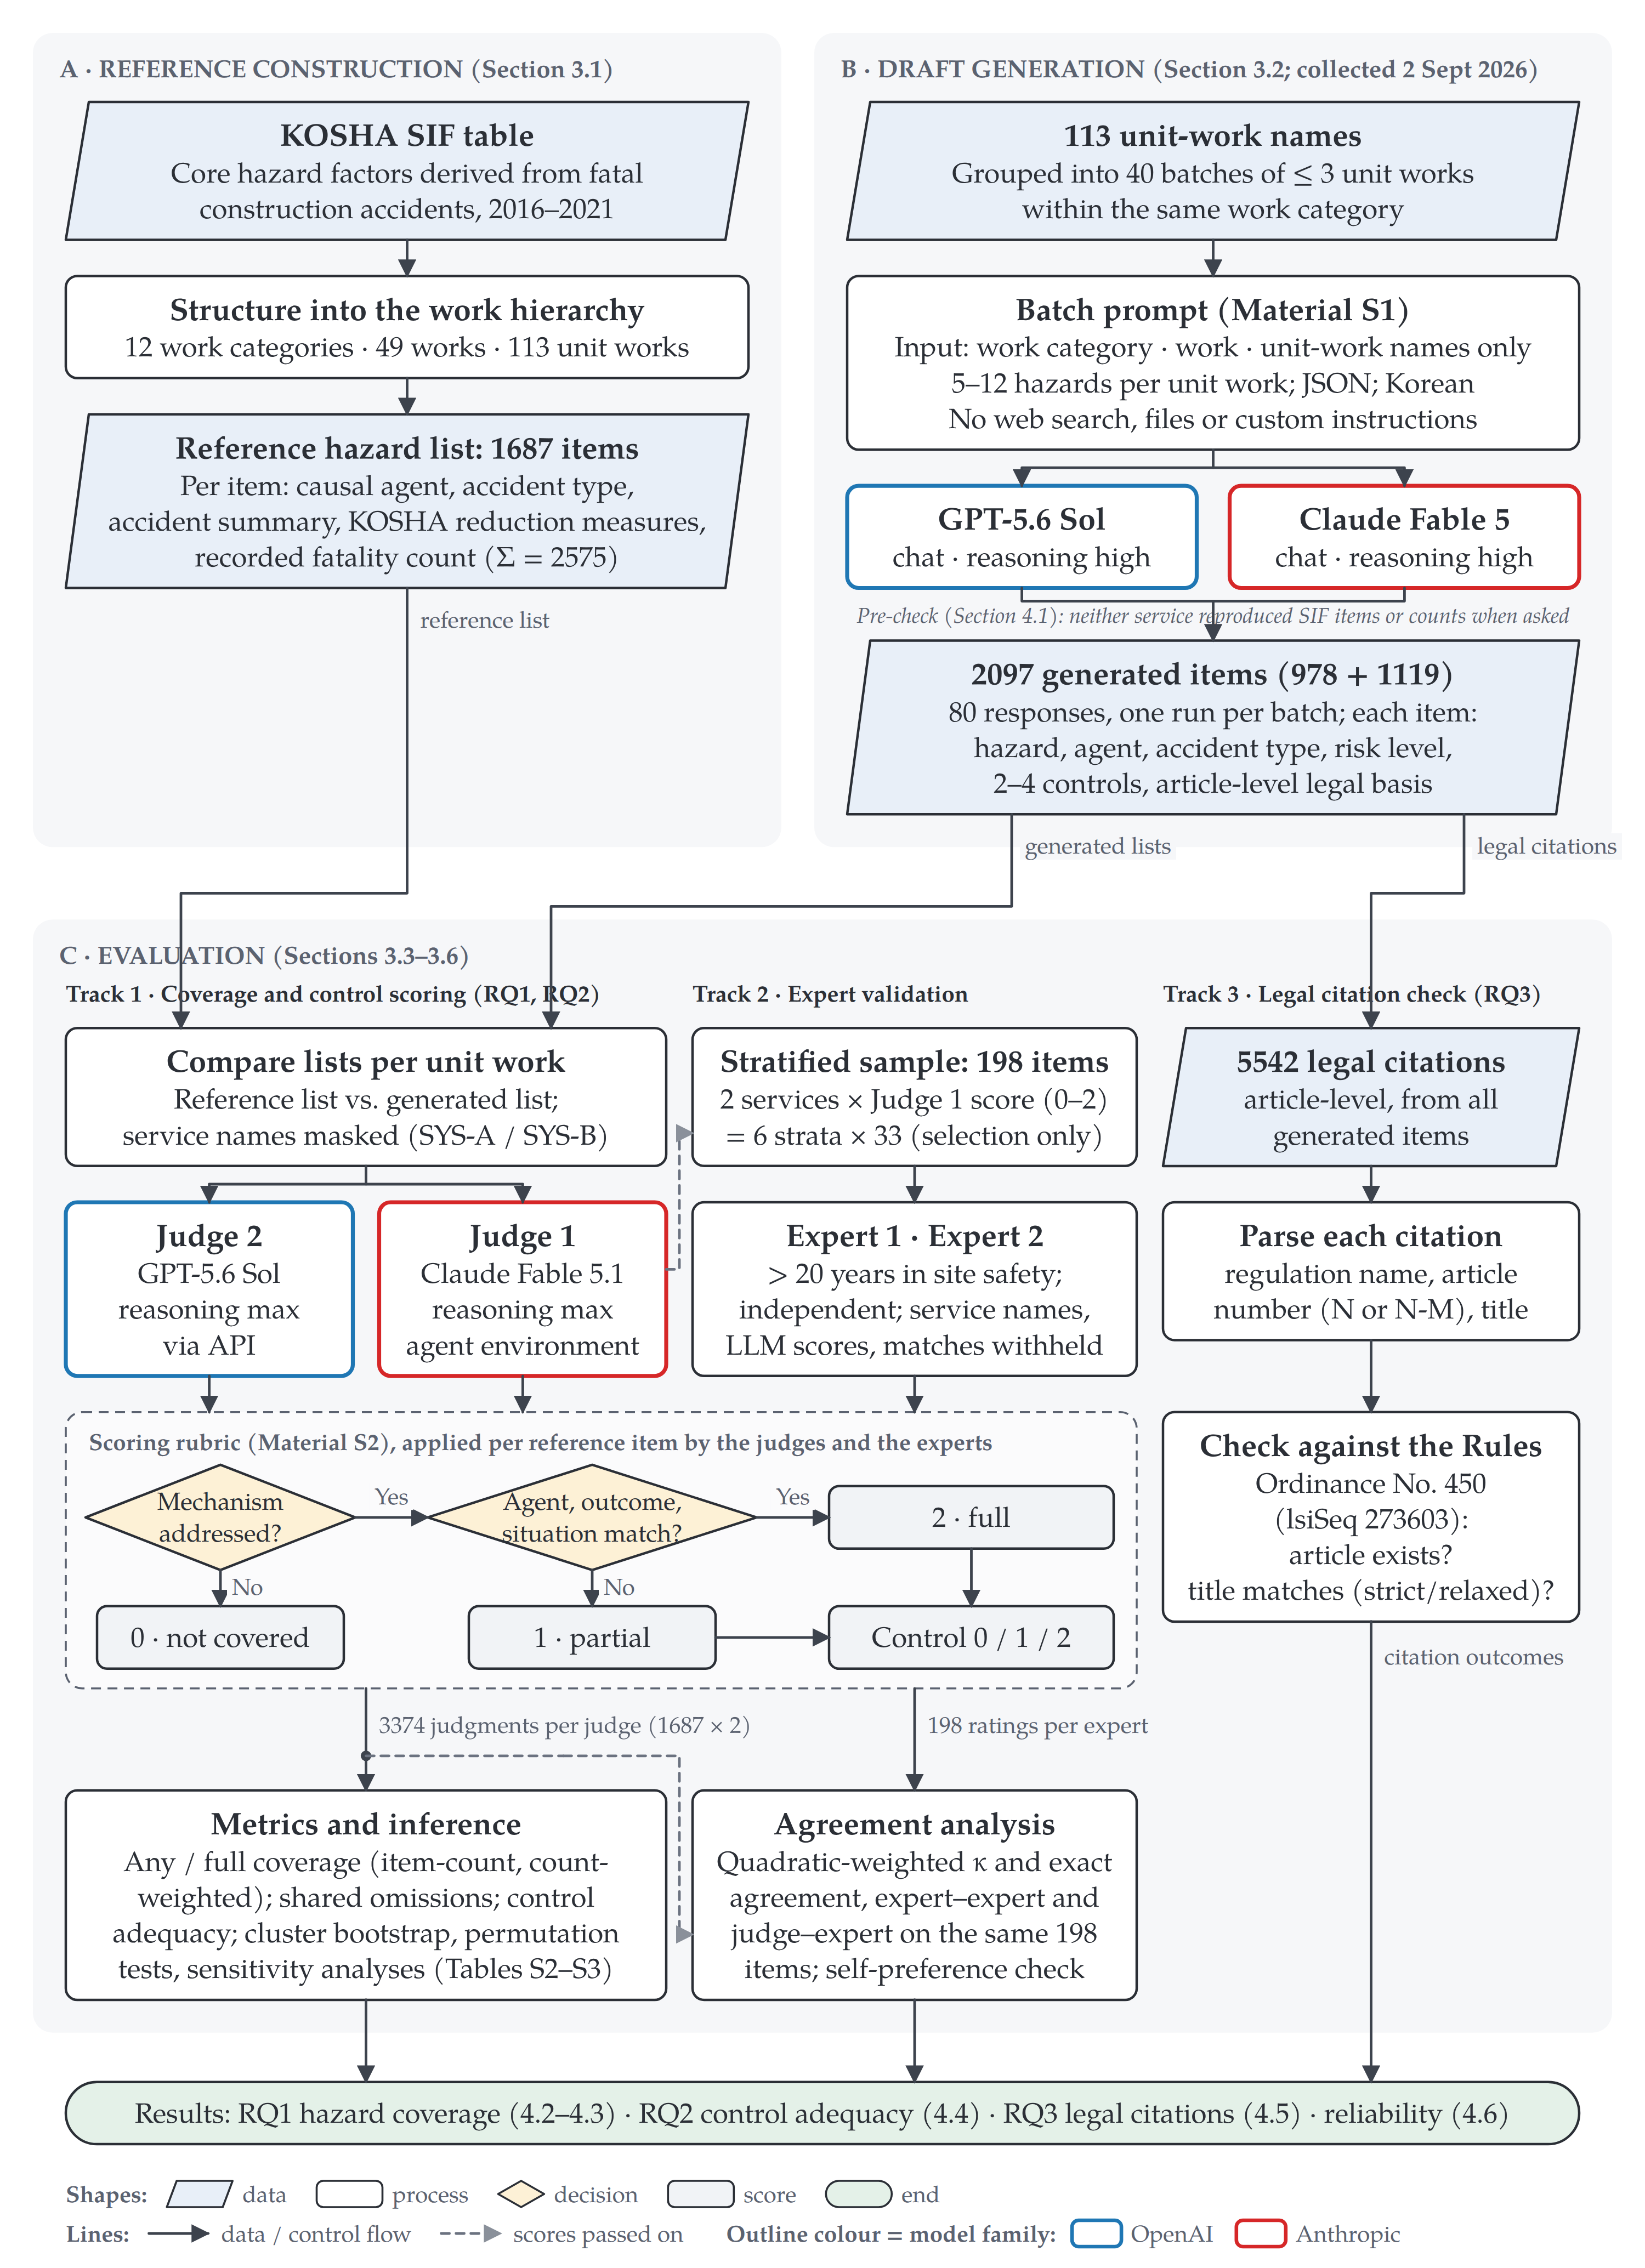
The overall procedure is shown in Figure 1, and the roles of the generation services, the LLM judges, and the experts are summarized in Table 1. The list compiled from the SIF table is called the “reference hazard list,” and the list of hazards and controls written by a generation service is called the “generated hazard list”; their individual entries are “reference hazard factors” and “generated items”. Because each judge compares the reference and generated lists for the same unit work and evaluates the outputs of both generation services, coverage is computed for four service–judge combinations.
Table 1.
Roles of the generation services and the raters.
3.1. Fatality-Derived Reference Data
We structured KOSHA’s SIF table [14] into 1687 reference hazard factors across 12 work categories, 49 works, and 113 unit works; category, work, and unit work form a hierarchy from the broader to more specific levels. Each reference hazard factor records the causal agent (the equipment, object, or structure involved in the accident), the accident type (the kind of accident, such as a fall or being caught in or between), a summary of the accident, the recommended controls, and a recorded fatal-accident count. The count is the figure in the column headed “number of fatal accidents” in the transcribed source table and sums to 2575 over the 1687 rows. It is the number of fatal-accident records that KOSHA attributed to the row, not a number of victims, and the source does not state whether an accident that involved several hazard factors, or that was relevant to several unit works, was recorded under more than one row. The count-weighted results in this paper therefore weight each reference hazard factor by its table record; they are not estimates of the number of fatalities covered (Section 3.5).
There were 58 causal agents (the source used 63 label strings, five of which were spelling variants of other labels and were unified) and 20 accident-type categories. For the analysis of coverage by accident type, the 20 categories were consolidated into eight (Supplementary Table S1). Falls accounted for a recorded count of 1526, representing 59.3% of the total. Rows with repeated content were kept as separate rows, as in the source: four pairs of rows are identical in unit work, accident type, causal agent, and narrative, and 184 rows (75 groups) repeat a narrative that also appears under another unit work, presumably because the source lists an accident scenario under every unit work in which it occurred. Whether such rows refer to the same events cannot be determined from the table, so their effect was examined by exclusion (Section 4.2; Supplementary Table S3).
Figure 1.
Study procedure. The reference data are taken from the KOSHA SIF table [14]. KOSHA, Korea Occupational Safety and Health Agency; SIF, Serious Injury and Fatality; SYS-A and SYS-B, masked labels of the two generation services.
3.2. Generation Services and Generation of the Risk Assessment Drafts
Outputs were collected on 2 September 2026 from the public chat interfaces of GPT-5.6 Sol (OpenAI; reasoning level high; hereafter, GPT) and Claude Fable 5 (Anthropic; reasoning level high; hereafter, Claude). The two services were selected because they are general-purpose public chat services that practitioners can use without any development work, because they were the top models each developer offered in its chat service at the time of collection, and because reasoning level, web search, and custom instructions could be controlled under identical conditions. They also belong to the same two model families as the two LLM judges in Section 3.3, which allows self-preference [48] to be assessed symmetrically. The scenario assumed that the user was a practitioner at a small enterprise drafting a risk assessment in a chat window. The 113 unit works were grouped, within the same work category, into 40 batches of up to three unit works each, and each batch served as the unit of the request. The same batch prompt was given to both services, and one response per batch was collected in a new conversation. Web browsing was disabled, and no custom instructions, memory, or file uploads were used.
Before the full set of batches was generated, each model was asked in a new conversation whether it knew the SIF table. If it indicated that it did, it was asked to reproduce the items for two unit works (1.1.2 excavation; 4.8.2 exterior panel installation) and the total number of fatalities for one of them. In this memorization probe, both models described the existence and general structure of the table but could not reproduce the requested items or figures (Section 4.1). The result shows only that verbatim reproduction of the reference hazard factors is unlikely; it does not rule out exposure to the material during pretraining (Section 5.5).
The prompt (Supplementary Material S1) asked the model, from the perspective of a site safety manager, to write 5–12 hazards per unit work in Korean. Each item was to include a hazard description in situation–cause–consequence form, the causal agent, the accident type, a risk level, two to four controls, and an article-level legal basis. The accident type was to be chosen from 16 given types, and the response was specified in JavaScript Object Notation (JSON) format. The prompt instructed the model to give priority to risks that could lead to death or other serious accidents, and the input for each unit work was limited to the names of the work category, work, and unit work. The content of the SIF data, specific accident cases, examples of specific hazards, and site or equipment conditions were not provided. All 80 batch responses were converted into analysis data; one response was processed after a minor syntax error had been corrected.
3.3. Evaluation of Hazard Coverage and Control Adequacy
Each reference hazard factor was compared with the generated list for the same unit work: if a matching item existed, the single best match was selected; otherwise, the item was judged not to be covered (score 0). Comparing one reference hazard factor with the list of one generation service constitutes one “evaluation”, and a reference hazard factor actually linked to a generated item constitutes a “matched pair”. “Coverage” means that the accident scenario of the reference hazard factor is included in the generated document, and its level was rated on an ordinal 0/1/2 scale.
A score of 2 (full coverage) was given when the causal agent or an equivalent class of equipment or object, the accident outcome, and the work situation all corresponded, so that the generated item adequately described the accident mechanism of the reference hazard factor. A score of 1 (partial coverage) was given when the accident type and the causal agent or mechanism matched but the key triggering condition was missing, or when the situation and outcome matched but the causal agent differed. For example, a match between “fall during roof work” and “fall after stepping on a roof skylight” was scored 1. A score of 0 was given when no generated item addressed the accident mechanism; an expression that shares only the name of the accident type, such as “risk of falling”, was not accepted as coverage. Scores of 1 and 2 together are referred to below as “any coverage”. Full coverage is judged for each reference hazard factor individually.
Because the judge selects the best match for each reference hazard factor separately, one generated item can be the matched item of several reference hazard factors. This is unavoidable with the present reference list: 53.1% of its rows belong to groups of two or more rows that share the same unit work, accident type, and causal agent (1069 such mechanism classes in total), and 184 rows repeat a narrative that also appears under another unit work (Section 3.1). A generated item was scored 2 for more than one reference hazard factor only when it described the mechanism of each of them; a generic sentence that shares only the accident type and the causal agent with several rows received at most a score of 1 for each of them. Different accident mechanisms were therefore not merged into one match by the rubric, but the number of reference rows that a single generated item may cover was not limited. The sensitivity of the coverage estimates to this rule—restricting multiple matches to rows with the same accident type or causal agent, capping the number of rows per generated item, or allowing one row per item—is reported in Section 4.2 and Supplementary Table S5.
For matched pairs with a coverage score of 1 or more, the controls of the generated item were compared with the KOSHA-recommended measures of the reference hazard factor. Key preventive measures are those that are important for preventing the accident pathway. A control score of 2 was given when such measures were included, regardless of wording; a score of 1 when only general or administrative measures, such as training, personal protective equipment, and caution, or only secondary measures, were present; and a score of 0 when there were no controls or the controls were unrelated to the hazard. The main criteria are given in Supplementary Material S2. The evaluation covers the single generated item matched to each reference hazard factor.
Two LLM judges from different model families evaluated the same reference and generated hazard lists independently. Judge 1 was Claude Fable 5.1 (Anthropic; reasoning level max), run in the Claude Cowork agent environment, where it read each task file and saved its judgments as JSON; Judge 2 was GPT-5.6 Sol (OpenAI; gpt-5.6-sol, reasoning level max), called through the application programming interface (API) with one request per unit work containing both generated lists. Service names were masked as SYS-A/SYS-B for each unit work and restored after judging, and the task files contained no information mapping the labels to services.
Each judge recorded the coverage score, the matched item, and the control score for 226 lists (113 unit works × 2 generation services). Each judge made 1687 × 2 = 3374 judgments, and the total of 6748 judgments corresponds to the same 1687 reference hazard factors, each of which was judged for two services by two judges.
Judge 1’s scoring and the expert validation (Section 3.4) were carried out first, and the descriptive breakdowns by work category, accident type, and causal agent (Section 4.2 and Section 4.3) are reported for Judge 1, with the causal-agent breakdown for Judge 2 given in Supplementary Table S7. This order of execution is not a claim that Judge 1 is the more valid judge: for control scores, Judge 1 agreed less with the experts than Judge 2 did (Section 4.6), so control adequacy is reported for both judges throughout (Section 4.2 and Section 4.4), and the abstract and conclusions give the range across judges. Judge 2 was added as a cross-family judge to determine whether the scoring depends on a particular model family; it scored the same 226 lists independently under the same rubric and blinding, and its agreement with the experts was computed on the same 198 items. Because each judge shares a model family with one of the generation services, the effect of self-preference [48] on the between-service comparison was assessed by contrasting the between-service differences in the two judges (Section 4.2) and their score deviations from the experts (Section 4.6). This check is not fully symmetric, because Judge 2 is the same model as one generation service, whereas Judge 1 is a later version of the other.
3.4. Expert Validation of the Scoring
Two external construction safety professionals who were not involved in the study design or writing each rated the same 198 items independently. Both had more than 20 years of site safety management experience. Six strata were formed by combining the two generation services with Judge 1’s coverage scores of 0, 1, and 2, and 33 items were drawn at random from each stratum. The stratum sizes for scores 0/1/2 were 551/653/483 for GPT and 559/639/489 for Claude.
The experts were given the same rubric, with generation service names, LLM scores, and LLM-selected matches withheld. For each of the 198 sampled items, they reviewed the SIF reference hazard factor and the complete generated hazard list for the corresponding unit work, including the hazard description and controls for every generated item. Each expert independently selected the best-matching generated item, if any, and assessed coverage and, where applicable, control adequacy. The information provided was identical across all sampling strata.
The two examples used in the instructions to the experts were also part of the 198-item sample. As a post hoc sensitivity analysis, agreement was recomputed on the 196 items remaining after those examples were excluded.
Agreement between raters was assessed by exact agreement (the proportion of identical scores) and by Cohen’s κ, which corrects for chance agreement. For the ordinal 0/1/2 scores, we used quadratic-weighted κ [49], which penalizes larger score differences more heavily; unweighted κ was computed for full coverage (“2” versus “0 or 1”) and for any coverage (“1 or 2” versus “0”). To assess the effect of drawing equal numbers from each stratum, we also computed a sample-weighted κ that reflects the original stratum sizes. On the items where the two experts agreed, we also computed the proportion of each judge’s scores that matched the experts’ consensus.
Judge 1’s coverage scores were used only to stratify the selection of the 198 items for expert review; they were not provided to the experts or used to guide their matching or scoring. The same independently rated sample was subsequently used to assess both LLM judges’ agreement with the experts; the sample is therefore balanced with respect to Judge 1’s scores but not necessarily with respect to Judge 2’s, which is one reason why the two judges’ agreement with the experts is not directly comparable.
The comparison of control adequacy that includes the experts used the 109 items that all four raters judged as at least partially covered. In the full data, the control adequacy of the two LLM judges was compared on the 2171 evaluations that both judges scored as at least partially covered.
3.5. Metrics and Statistical Analysis
Hazard coverage is the proportion of reference hazard factors that meet a criterion. It was computed for any coverage and for full coverage, each on an item-count basis (denominator 1687 items) and on a count-weighted basis (denominator 2575, the sum of recorded counts). For each criterion, the overall proportion was calculated by pooling the reference hazard factors of all unit works. In addition, the proportion of the reference hazard factors with any coverage that were fully covered (full coverage given any coverage) was computed; because its denominator contains only matched factors, it does not depend on the number of items that a draft contains. Because agreement between raters was lower at the boundary between no coverage and partial coverage than at the boundary of full coverage (Section 4.6), full coverage is treated as the primary coverage metric, and any coverage as a secondary metric whose level depends on the rater’s threshold. Reference hazard factors scored 0 for both services by a given judge are defined as “shared omissions”, and complementarity is defined as the count-weighted proportion of reference hazard factors covered at least partially by either service.
Control adequacy is the proportion of matched pairs with any coverage that received a control score of 2. Because one generated item can match several reference hazard factors, the denominator is the number of matched pairs rather than the number of generated items. The matched-item ratio is the proportion of all generated items matched to at least one reference hazard factor; since valid hazards may exist outside the reference data, it was not interpreted as precision.
Confidence intervals for coverage were obtained with a bootstrap that treated the 113 unit works as clusters, thereby accounting for the relatedness of items within a unit work. In each of 2000 replications, 113 unit works were drawn with replacement, and the scores of both services were resampled together. The 2.5th and 97.5th percentiles of the replicated values were taken as the 95% confidence intervals for each service’s coverage and for the difference (Claude—GPT). These intervals reflect variation in the composition of unit works, with the outputs and scores held fixed; they do not include variation across repeated generations. The significance of between-service differences was assessed with a two-sided permutation test that swapped the two services’ results within each cluster as a whole; because up to three unit works share one generated response, the test was also run with the 40 generation batches as clusters. The p-values were interpreted as exploratory, without correction for multiple comparisons, and the computational settings and results are given in Supplementary Material S4.
The robustness of the results was checked by sensitivity analyses that excluded, in turn, the unit work with the largest recorded count, the reference hazard factors with repeated content, and the rows whose narrative repeats that of a row with a larger recorded count under another unit work (Section 4.2; Supplementary Table S3); varied the handling of multiple matches (Supplementary Table S5); and compared the unit works in which the number of reference rows did not exceed the number of generated items with the remaining unit works (Supplementary Table S6). Statistical analyses were carried out in Python 3.14.8, pandas 3.0.6, NumPy 2.5.3, and SciPy 1.18.1.
3.6. Verification of Legal Citations
From each generated legal basis, we extracted the name of the regulation, the article number (Article N or Article N-M), and the title in parentheses, and compared the citations of the Rules with the articles of the version held by the Korean Law Information Center (serial number 273603) [50]. The reference date was 3 September 2026, and the designated version in force was Ministry of Employment and Labor Ordinance No. 450 (partially amended on 1 September 2025 and in force from 2 March 2026). We first checked whether the article number existed in that version and then compared the title attached to it. The designated version of the Rules contains several hundred articles (numbered up to Article 673), so the existence of a cited article number indicates only that the number was not invented, not that the appropriate article was cited. The 853 citations of the Occupational Safety and Health Act and of other instruments (15.4% of all citations) were not checked, so all agreement rates refer to citations of the Rules, and both denominators are reported in Section 4.5.
After spaces, symbols, and all characters other than Korean characters, Latin letters, and digits had been removed, a title was judged to match under the strict criterion when the entire strings were identical. Under the relaxed criterion, a match was also accepted when both cleaned titles were non-empty and one string was contained contiguously in the other. The article number–title agreement rate is the proportion of citations for which the article exists and the title matches. Both rates use all of the service’s citations of the Rules as the denominator, and citations of non-existent articles were counted as mismatches.
Among citations of existing articles whose titles did not match even under the relaxed criterion, we also computed the proportion that carried the title of a different article of the Rules. To assess false positives of the relaxed criterion, every citation accepted only under the relaxed criterion was inspected individually; to assess false negatives, every citation of an existing article whose title did not match under the relaxed criterion was classified as (i) the exact title of another article of the Rules, (ii) a minor wording difference from the official title (similarity ratio of the cleaned strings of at least 0.8), or (iii) a title that matches no article of the designated version among the articles cited (Supplementary Table S8). This analysis was based on a string comparison and establishes formal agreement between article numbers and titles; it did not evaluate citations of other regulations, the applicability of an article’s content to the site, the use of earlier versions in force, or the causes of the generation errors.
4. Results
4.1. Formal Completeness of the Generated Drafts
Both services produced drafts with the required form and items for every unit work. After a minor JSON syntax error in one batch response had been corrected, both services yielded analyzable lists for all 113 unit works (Table 2). GPT-5.6 Sol generated 978 hazards (a mean of 8.65 per unit work), and Claude Fable 5 generated 1119 (9.90). Every item included a specified accident type, three to four controls, and at least one article-level legal citation. Hazard sentences were longer for GPT-5.6 Sol.
Table 2.
Characteristics of the generated risk assessment drafts.
In the SIF memorization probe, both services acknowledged the existence of the table and described its general structure but did not reproduce the requested items or figures. Thus, the formal features of the drafts–including their structure, item counts, and inclusion of legal citations–did not distinguish the two services or indicate whether the generated content adequately covered the reference hazards.
4.2. Coverage of Fatal-Accident Hazard Factors: The Gap Between Category and Mechanism
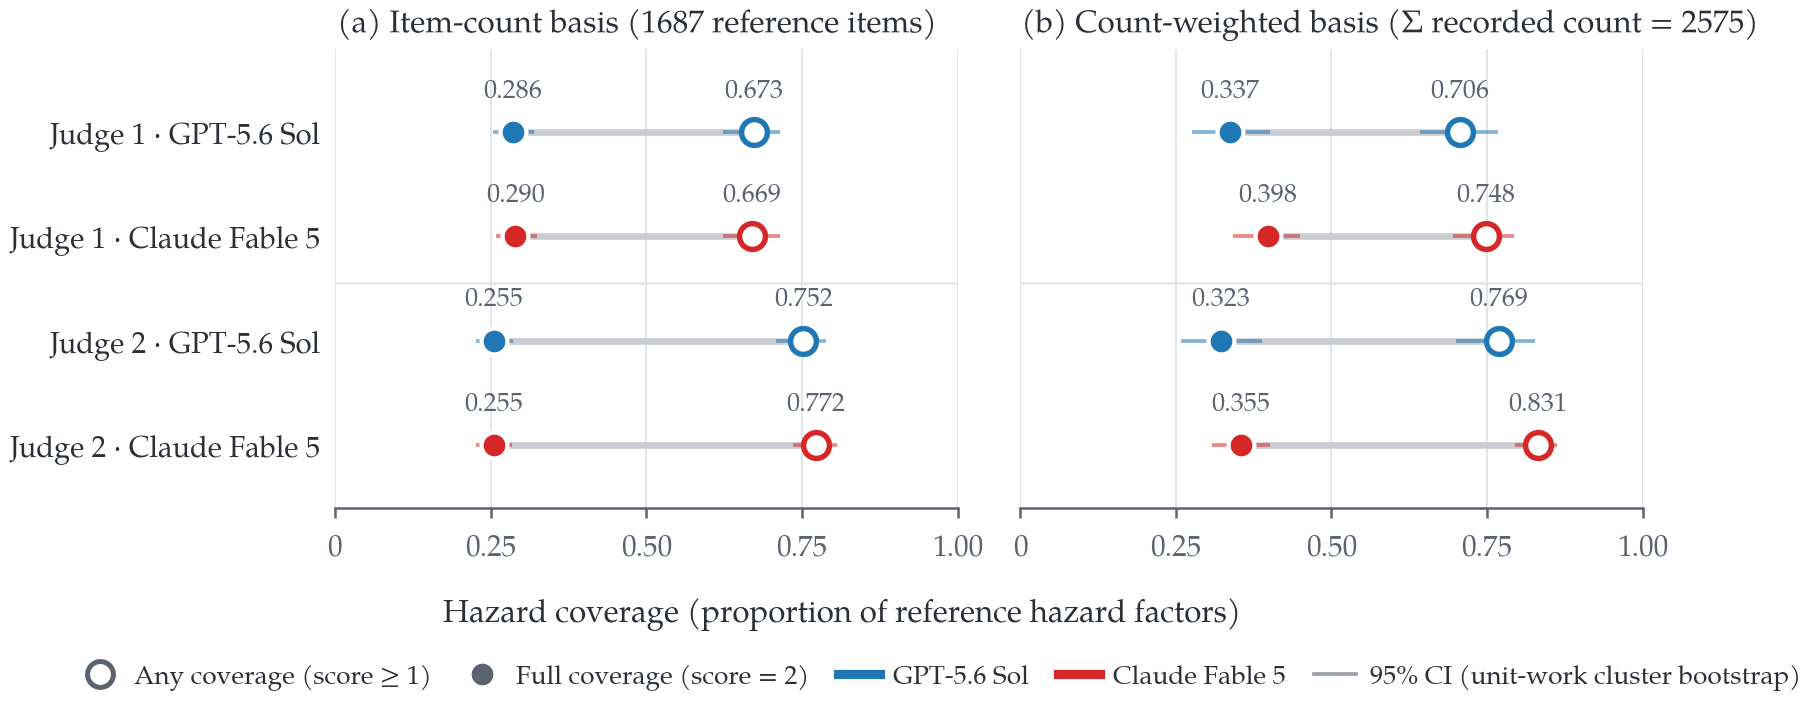
Across the four service–judge combinations, any coverage was 66.9–77.2% and full coverage 25.5–29.0% (Table 3; Figure 2); on a count-weighted basis, the figures were 70.6–83.1% and 32.3–39.8%. Among the reference hazard factors with any coverage, 42.5–43.4% (Judge 1) and 33.0–34.0% (Judge 2) were fully covered on the item-count basis (Table 3); this conditional proportion does not depend on the number of items in a draft. The large difference in coverage was observed not between services or between judges but between these two levels of coverage. The between-service comparisons here and below describe the single generation obtained from each service under the tested conditions (Section 3.2) and should not be generalized to the models’ overall performance. On the item-count basis, Judge 2 rated any coverage higher than Judge 1 did but full coverage lower. Square brackets in the table give 95% confidence intervals from the unit-work cluster bootstrap, and the between-service differences were computed from unrounded values.
Table 3.
Hazard coverage and control adequacy.
Figure 2.
Hazard coverage of the fatality-derived reference hazard factors by coverage level, generation service, and judge (data from Table 3). Open markers show any coverage (score ≥ 1), filled markers show full coverage (score = 2), and thin bars show 95% confidence intervals from the unit-work cluster bootstrap. (a) Item-count basis; (b) count-weighted basis. CI, confidence interval.
The post hoc test of Judge 2’s count-weighted any-coverage difference gave p = 0.0448 with unit-work clusters and p = 0.0620 with batch clusters. Full coverage did not differ significantly at either clustering level. The post hoc cluster tests were not corrected for multiple comparisons and were interpreted as exploratory; the full test results and the batch-cluster bootstrap intervals are given in Supplementary Table S2.
In the sensitivity analysis, excluding unit work 4.8.2, which has the largest sum of recorded counts, left every between-service difference in weighted coverage within three percentage points. Excluding the reference hazard factors with repeated content, or the 109 rows whose narrative repeats that of a row with a larger recorded count under another unit work, changed the coverage figures by at most 1.1 percentage points (Supplementary Table S3).
Figure 2 displays the same four service–judge combinations as dumbbells. In every row, the distance between the open marker (any coverage) and the filled marker (full coverage) is several times larger than any difference between rows, and the bootstrap intervals of the two coverage levels do not overlap for any combination, whereas the intervals of the two services overlap in every row.
Because one generated item may be the matched item of several reference hazard factors, the coverage estimates were recomputed under alternative matching rules (Supplementary Table S5). Only 31.5–36.3% of the generated items were matched to any reference hazard factor; a matched item covered a median of two rows (mean 3.2–3.6; maximum 46–50), and the 51–53% of matched items that covered two or more rows accounted for 85–87% of the matched pairs and 71–75% of the fully covered pairs. Of the 87–97 generated items per combination that fully covered two or more rows, 64–76% covered rows of a single accident type. Counting a mechanism class (unit work × accident type × causal agent; 1069 classes) as covered when at least one of its rows was covered gave any coverage of 63.8–74.6% and full coverage of 29.7–30.7%, close to the row-level figures. Allowing multiple matches only among rows with the same accident type lowered any coverage to 57.8–67.0% and full coverage to 23.1–26.6%; the stricter variants—multiple matches only within the same accident type and causal agent, at most three or two rows per generated item, and one row per generated item—lowered both levels further (any coverage 19.1–43.6%, full coverage 12.2–23.1%), the one-to-one variant giving a lower bound of 19.1–23.1% for any coverage and 12.2–13.8% for full coverage. Under every variant, full coverage remained well below any coverage, the two services remained close to each other, and the proportion of covered pairs with adequate controls stayed between 70.6% and 85.2%.
The number of reference rows per unit work (median 7; interquartile range 2–19; maximum 130) exceeded the number of generated items in 50 (GPT-5.6 Sol) and 45 (Claude Fable 5) of the 113 unit works. In the remaining 63 and 68 unit works, where the item limit could not have been binding, coverage was essentially the same as elsewhere: under Judge 1, any coverage was 0.679 [0.601–0.750] and 0.688 [0.622–0.750] and full coverage 0.321 [0.241–0.403] and 0.301 [0.231–0.370] for GPT-5.6 Sol and Claude Fable 5, against 0.673 and 0.665 (any) and 0.281 and 0.288 (full) in the unit works with more reference rows than generated items (Supplementary Table S6; Judge 2 showed the same pattern). In the unit works with few reference rows, 6.6–7.6 of the 8.5–9.4 generated items matched no reference hazard factor, so unused rather than exhausted item budget was the rule, and the Spearman correlation between the number of reference rows and the unit-work full-coverage rate was +0.05 to +0.06.
By work category, count-weighted any coverage was high for steel work and common work but lowest for bridge work, which has a recorded count of 11 (Figure 3). Finishing work, with the largest recorded count of 752, also showed the largest between-service difference, with full coverage of 0.18 for GPT-5.6 Sol and 0.40 for Claude Fable 5; the difference arose in exterior panel work and painting using suspended scaffolds. These differences describe single generations under the tested conditions (Section 5.3). In Figure 3, light bars show any coverage and dark bars show full coverage, with the sum of recorded counts in parentheses; Figure 4 shows any coverage on the left and full coverage on the right, with the dotted line marking 0.5.
By accident type, count-weighted full coverage (Judge 1) was highest for collapse, at 0.71 for both services, and lowest for caught-in/between, at 0.20 for both (Figure 4). For falls, which account for 59.3% of the total recorded count, any coverage was 0.72 for GPT-5.6 Sol and 0.78 for Claude Fable 5, but full coverage was 0.30 and 0.40.
Figure 3.
Count-weighted hazard coverage by work category (Judge 1). Light bars show any coverage and dark bars show full coverage; the sum of recorded counts is given in parentheses. MEP, mechanical, electrical, and plumbing; RC, reinforced concrete.
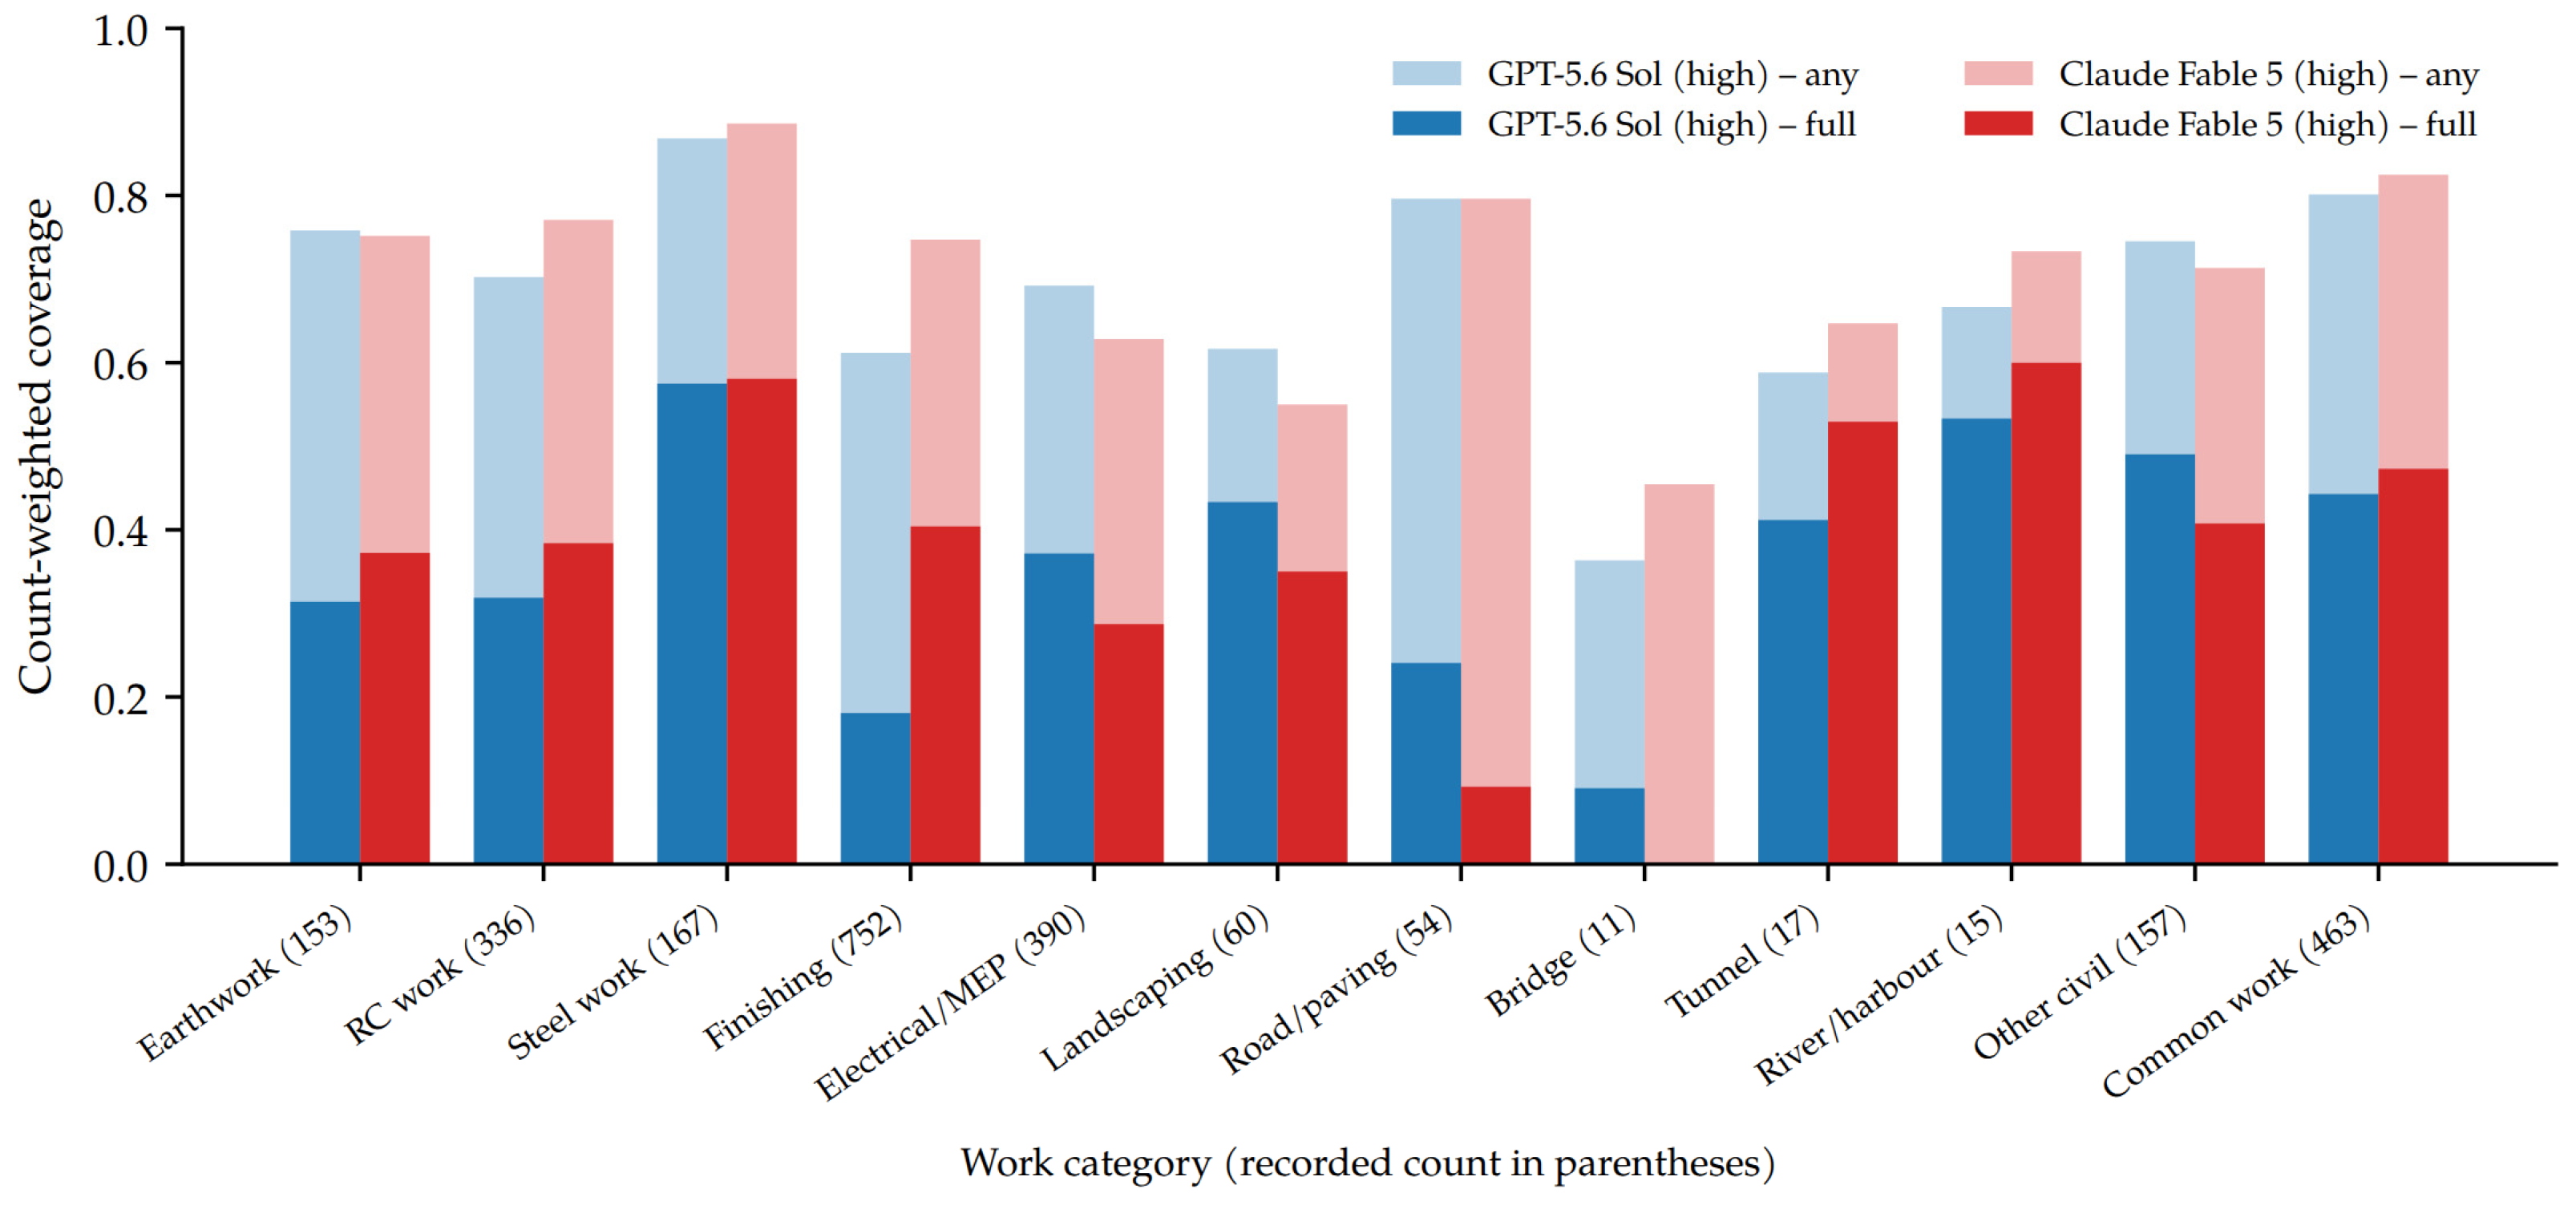
Figure 4.
Count-weighted hazard coverage by accident type (Judge 1). The left panel shows any coverage (score ≥ 1) and the right panel shows full coverage (score = 2); the dotted line marks 0.5.
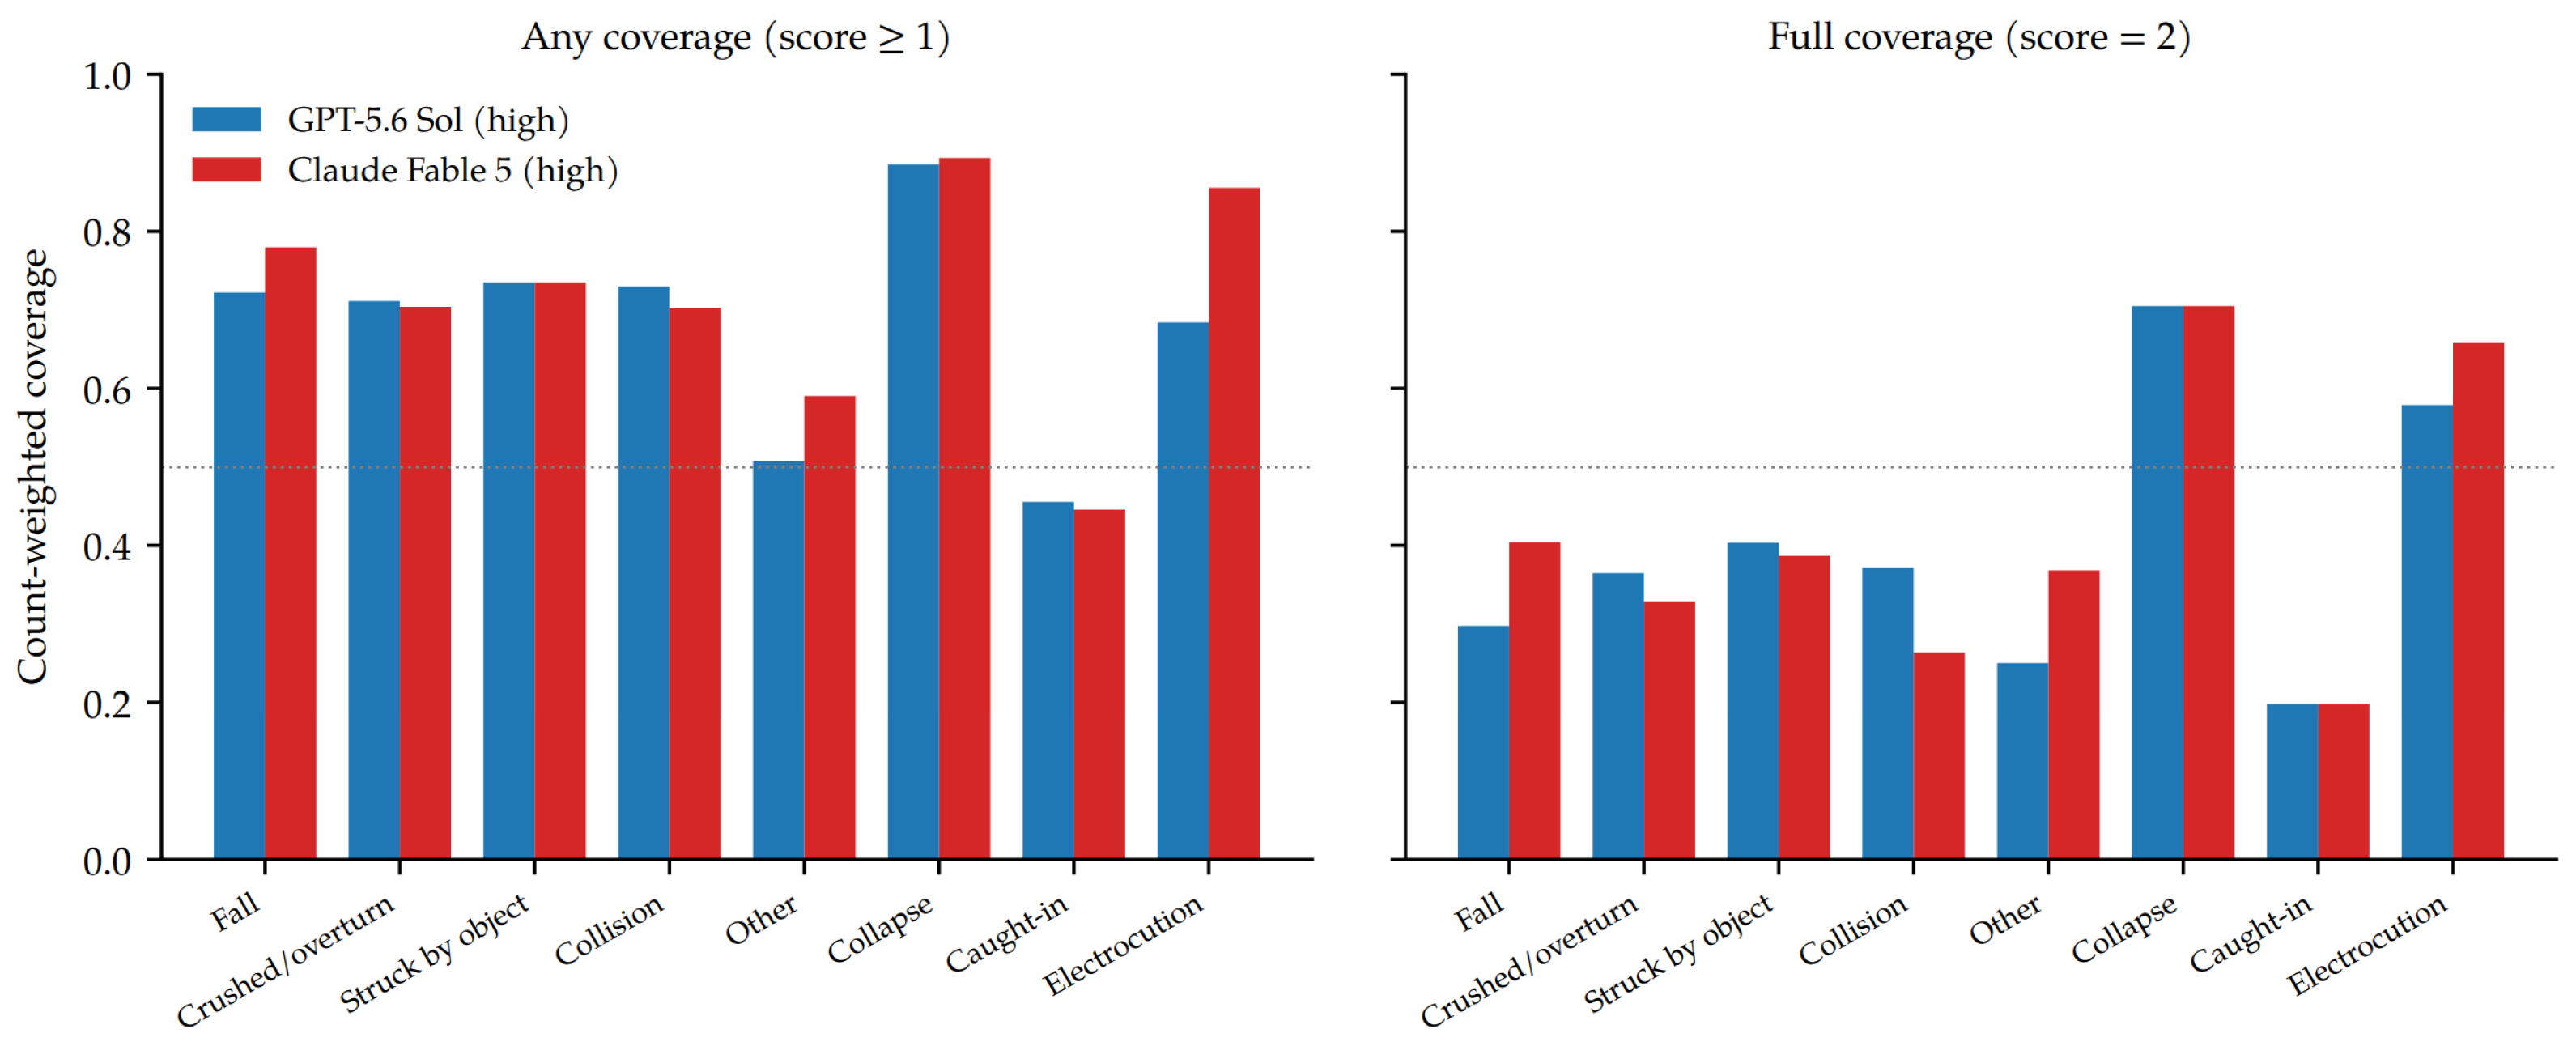
Table 4 shows count-weighted coverage and control adequacy for the 20 causal agents with the largest sums of recorded counts (Judge 1; Judge 2 in Supplementary Table S7). Coverage uses the agent’s total recorded count as the denominator, and control adequacy uses the number of matched pairs with any coverage, which is given in parentheses; values that rest on few pairs, such as those for roof skylights (3 and 4 pairs), should be read with caution. Full coverage for suspended scaffolds differed widely, at 0.01 for GPT-5.6 Sol (1 of 16 matched pairs fully covered) and 0.81 for Claude Fable 5 (20 of 23). This contrast, like the other between-service differences, describes single generations under the tested conditions.
Table 4.
Hazard coverage and control adequacy by causal agent (Judge 1; number of matched pairs with any coverage in parentheses).
Count-weighted full coverage for mobile elevating work platforms (MEWPs) was 0.16 for GPT-5.6 Sol and 0.13 for Claude Fable 5, and was 0.25 for mobile cranes for both services. Full coverage was also low for trucks and mechanical equipment.
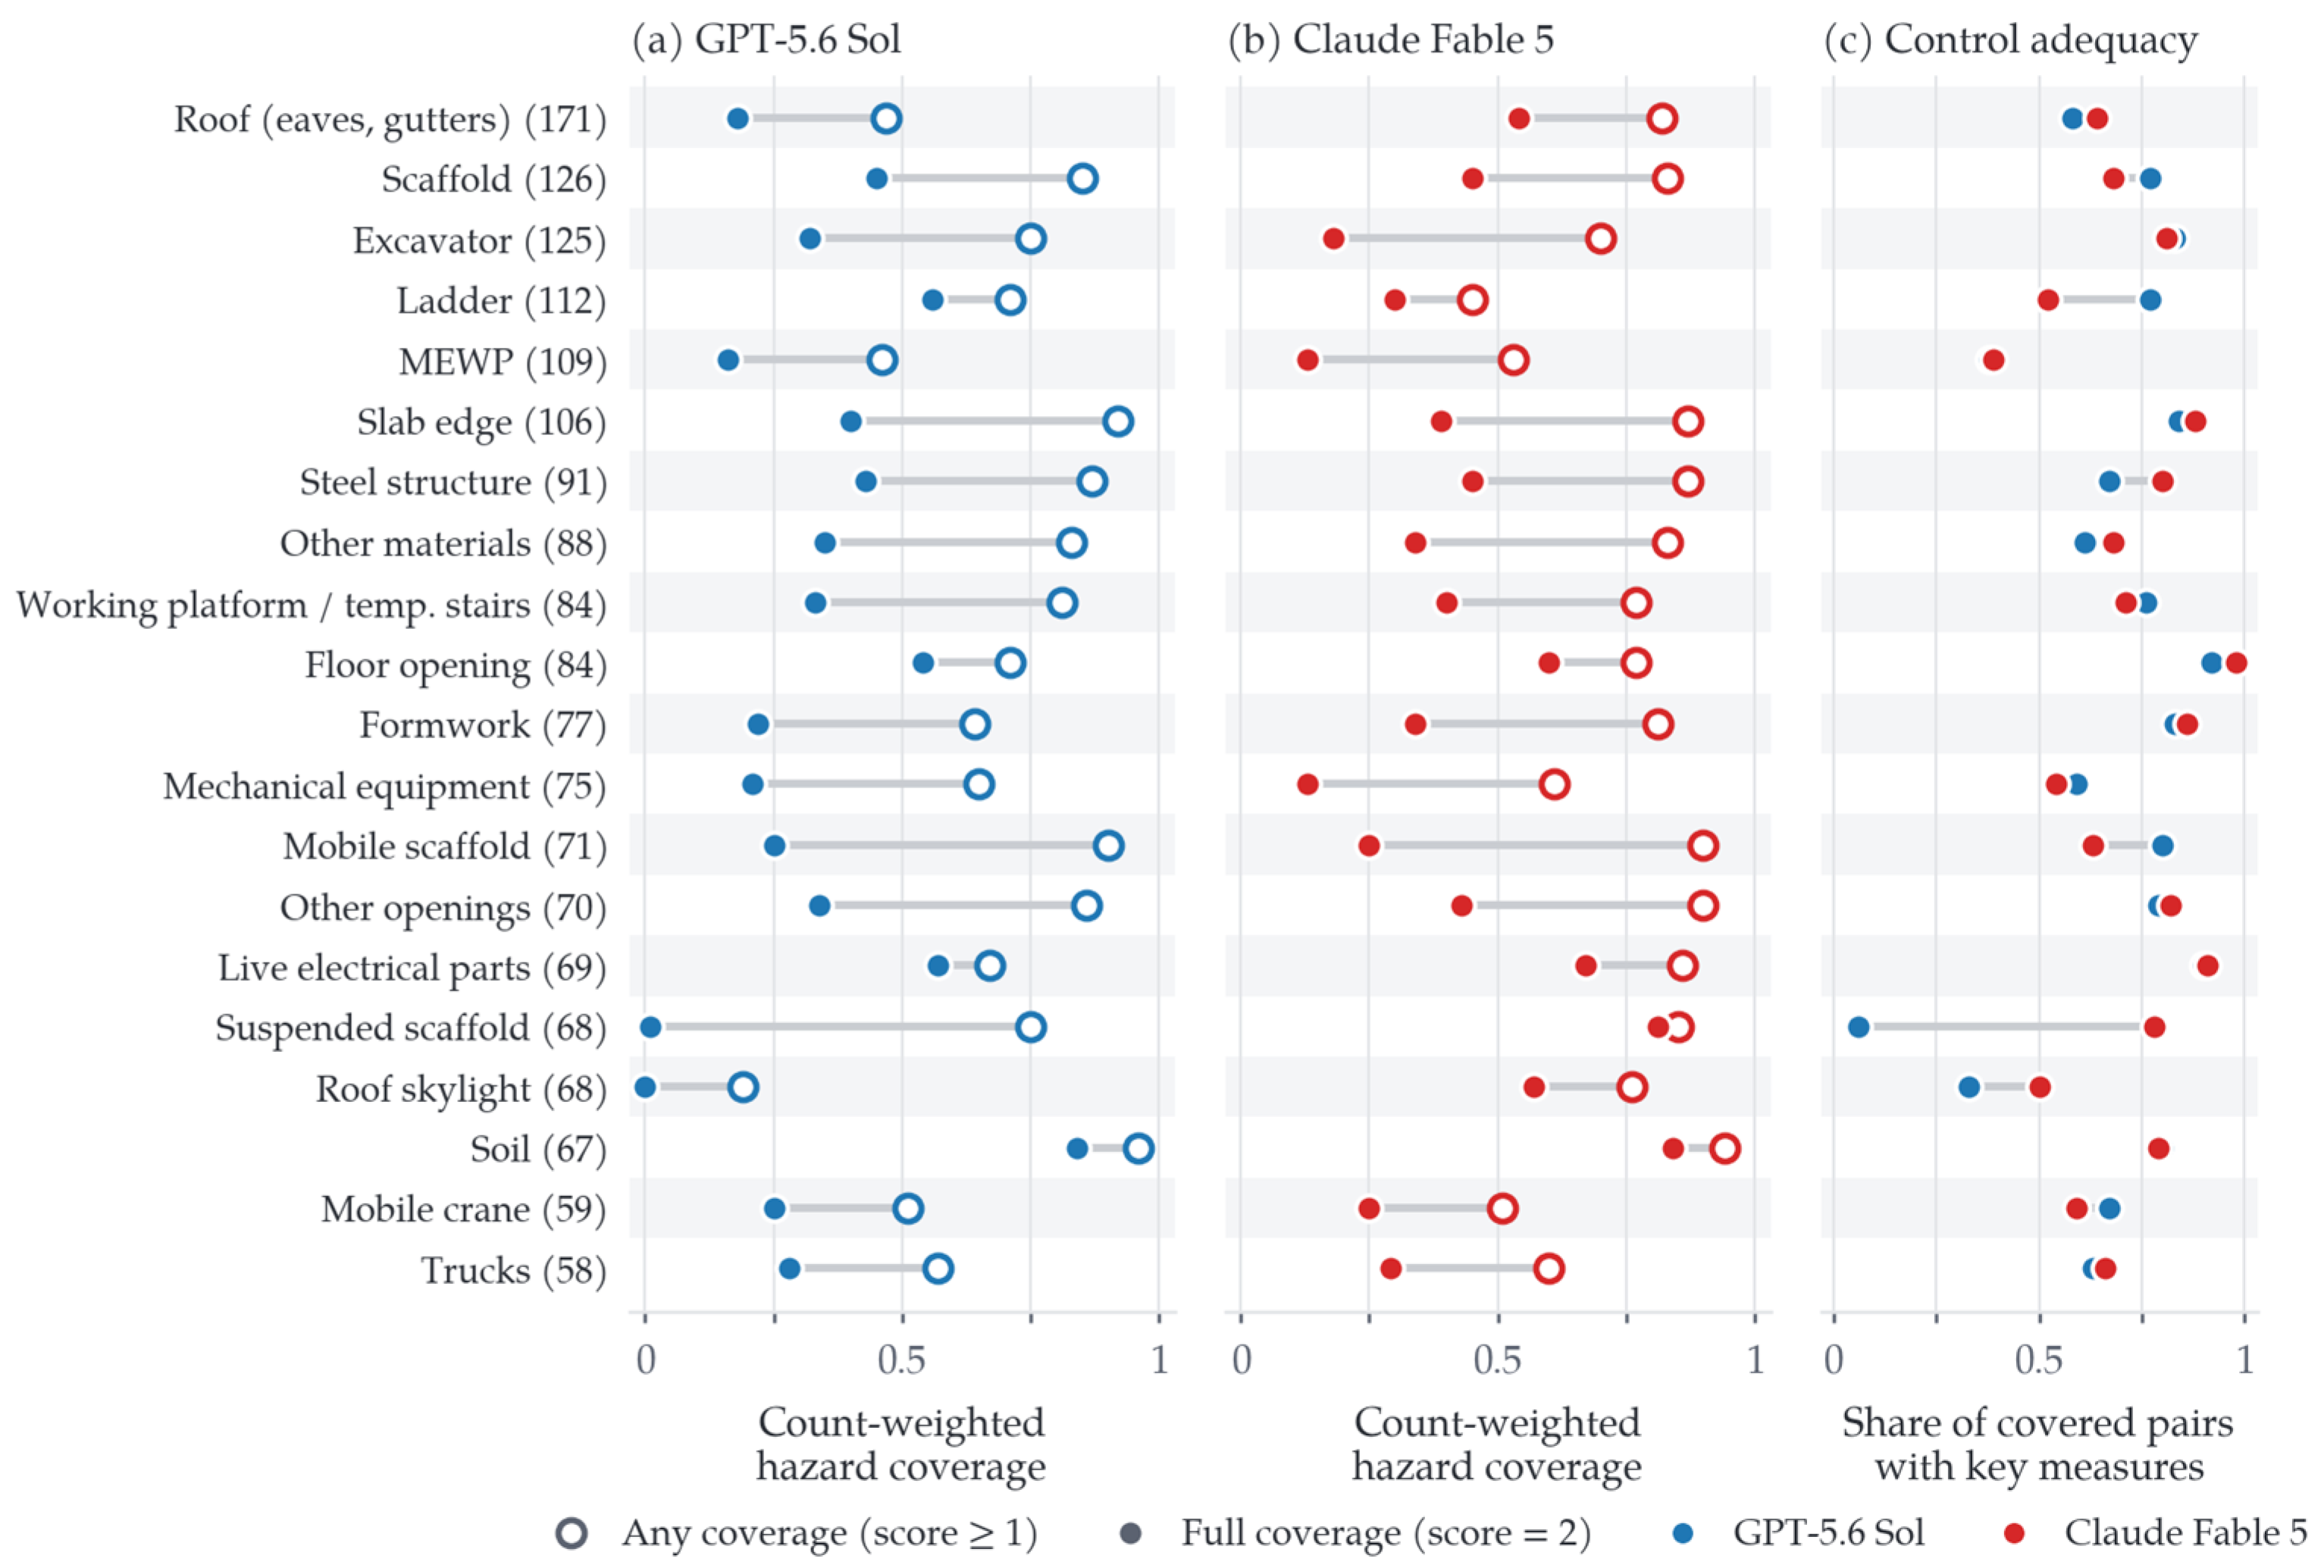
Figure 5 presents the 20 causal agents from Table 4 as dumbbells, so that the gap between naming a hazard and describing its mechanism can be read as the length of the connector. For both services, the gap exceeded 0.40 for mobile scaffolds, slab edges, excavators, other materials, other openings, formwork, mechanical equipment, and steel structures, whereas it was 0.20 or less for soil, live electrical parts, ladders, floor openings, and roof skylights—although for roof skylights, GPT-5.6 Sol named the hazard for only 0.19 of the recorded count. The two services diverged most for suspended scaffolds, where the connector for GPT-5.6 Sol spans almost the whole axis and that for Claude Fable 5 is nearly a point. Panel (c) shows that the lowest control adequacy coincided with items whose mechanism was rarely described—MEWPs for both services and the suspended-scaffold and roof-skylight items of GPT-5.6 Sol—whereas floor openings and live electrical parts, which were among the agents with the highest full coverage, also had the most adequate controls.
Figure 5.
Coverage and control adequacy for the 20 causal agents with the largest recorded counts (Judge 1; data from Table 4). (a,b) Count-weighted any coverage (open markers) and full coverage (filled markers) for each service; the connector between the two markers is the share of the recorded count for which the hazard was named but its mechanism was not described. (c) Share of covered pairs whose controls include the key preventive measures. Recorded counts are given in parentheses. MEWP, mobile elevating work platform.
4.3. Accident Scenarios Missed by Both Services
The hazard factors missed by both generation services numbered 443 (26.3%) by Judge 1 and 301 (17.8%) by Judge 2, with recorded-count sums of 519 (20.2%) and 344 (13.4%). Factors judged as shared omissions by both judges numbered 258 (15.3%; recorded-count sum 296, 11.5%). Figure 6 shows the 15 causal agents with the largest recorded counts of shared omissions by Judge 1; dark bars show the recorded count of shared omissions, and light bars the agent’s total recorded count.
Under Judge 1’s judgments, the count-weighted proportion of reference hazard factors covered at least partially by either service was approximately 80%, which was 5–9 percentage points higher than for either service alone.
Figure 6.
Recorded counts of the hazard factors missed by both services, by causal agent (Judge 1).
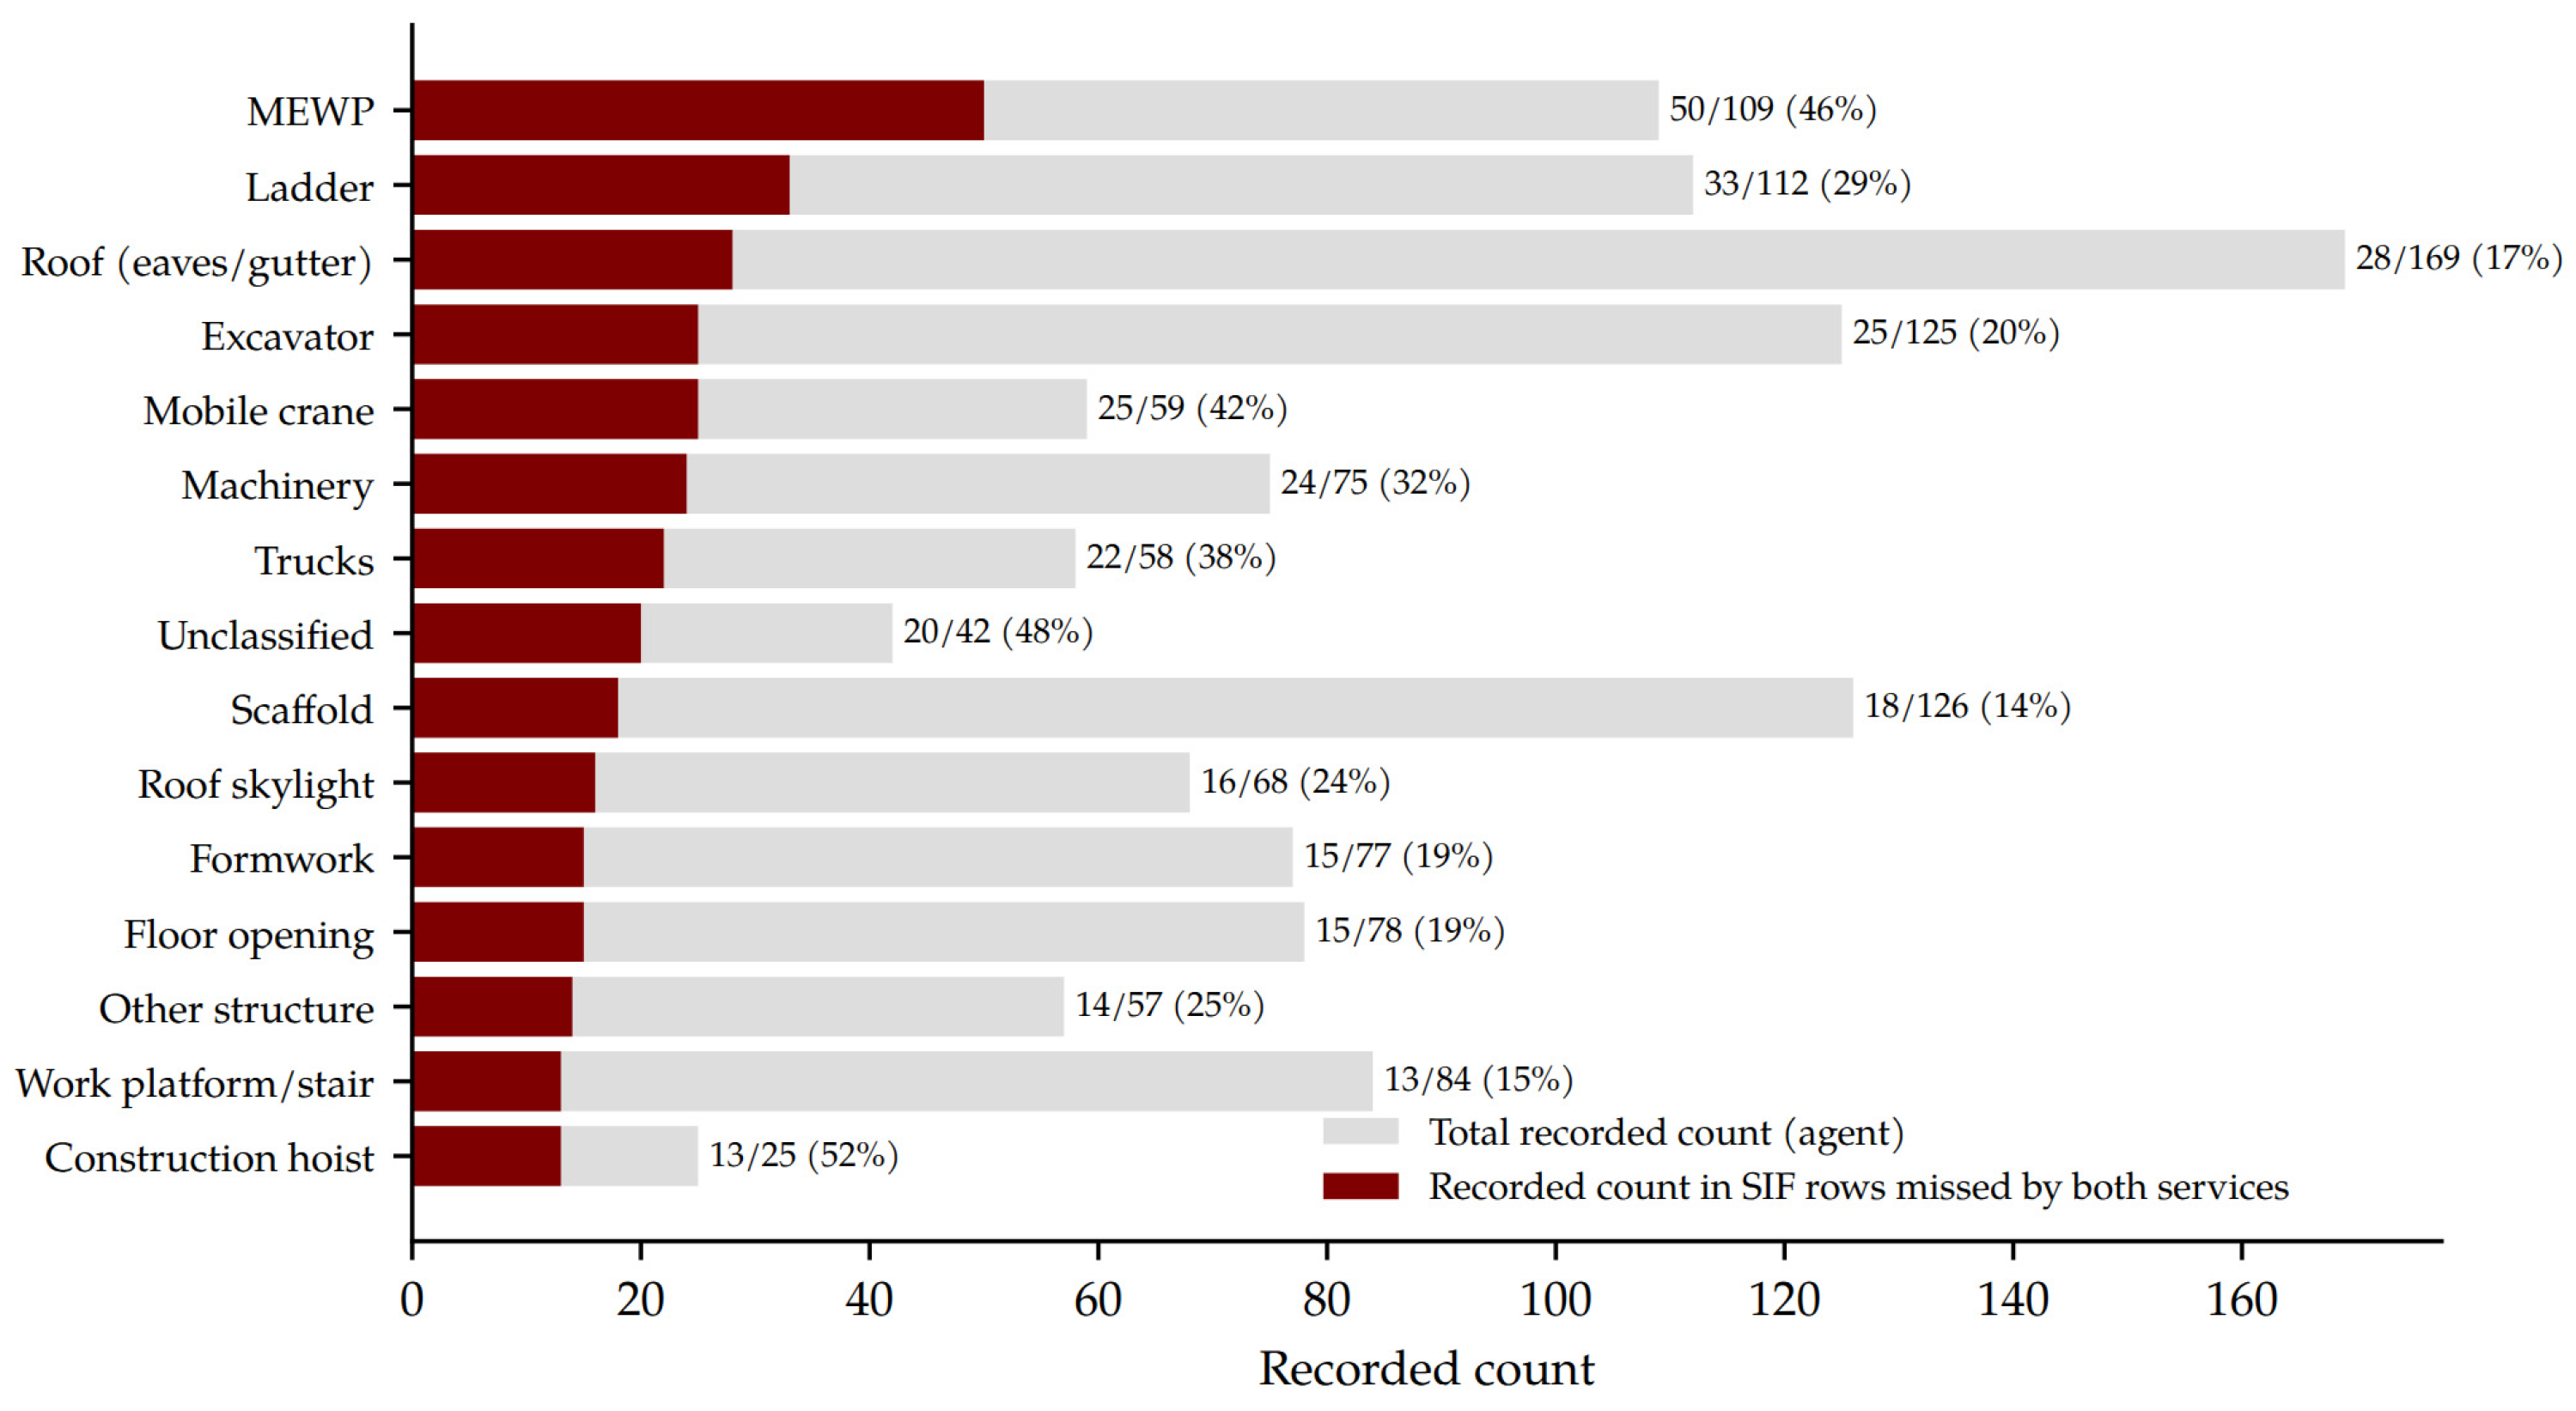
The shared omissions were concentrated not on equipment names or accident types but on accident scenarios that arise only in a particular operating state or work stage of the equipment. Examples include entrapment against an overhead structure when a MEWP rises unexpectedly, overturning while traveling with the platform raised, and slipping or toppling of ladders. Also missed were cage over-travel and the premature removal of mast bolts during the installation and dismantling of construction hoists. Other missed scenarios were climbing-shoe detachment and slider locking problems while a tower crane is being climbed, and accidents during the dismantling of mobile crane booms and counterweights.
Other cases involved the worker’s position and the environment: accidents to workers riding in excavator buckets, on forklift forks, in truck beds, or in loader buckets; failure at the base of a utility pole or streetlight that a worker had climbed; drowning or being swept away by swift currents during repair work; and trees falling during felling. Cases in which a conveyor or other equipment started unexpectedly while a worker was inside or on top of it were also among the shared omissions.
Riding on equipment or loads that are not designed to carry persons is an unsafe act rather than an equipment condition, and a draft written from a work name could be expected to miss it. Such cases were few, however: 7 of the 258 hazard factors missed by both judges (recorded count 9) involved riding in an excavator bucket, on forklift forks, in a truck bed, or in the carriage of a goods lift or conveyor, and a further 12 involved other unsafe positions or acts during otherwise normal use, such as standing on the guardrail of a MEWP or bypassing a hoist door interlock. The remaining 239 describe conditions of the equipment, the work stage, or the environment. The SIF table lists all of these scenarios with recommended controls—for the riding cases, a prohibition on riding and the provision of a suitable working platform—so they belong in a risk assessment document irrespective of who initiated the unsafe condition.
Cases that both services generally covered included falls from unprotected edges and openings, failure of rigging (lifting gear), fires during hot work, electrocution from power tools, oxygen deficiency and asphyxiation in confined spaces, and collapse of excavation faces. In short, the standard hazards that a work name immediately brings to mind were generally covered, whereas accidents that occur only in a specific operating state, work stage, or worker position were not.
4.4. Control Adequacy and the Specificity of Hazard Descriptions
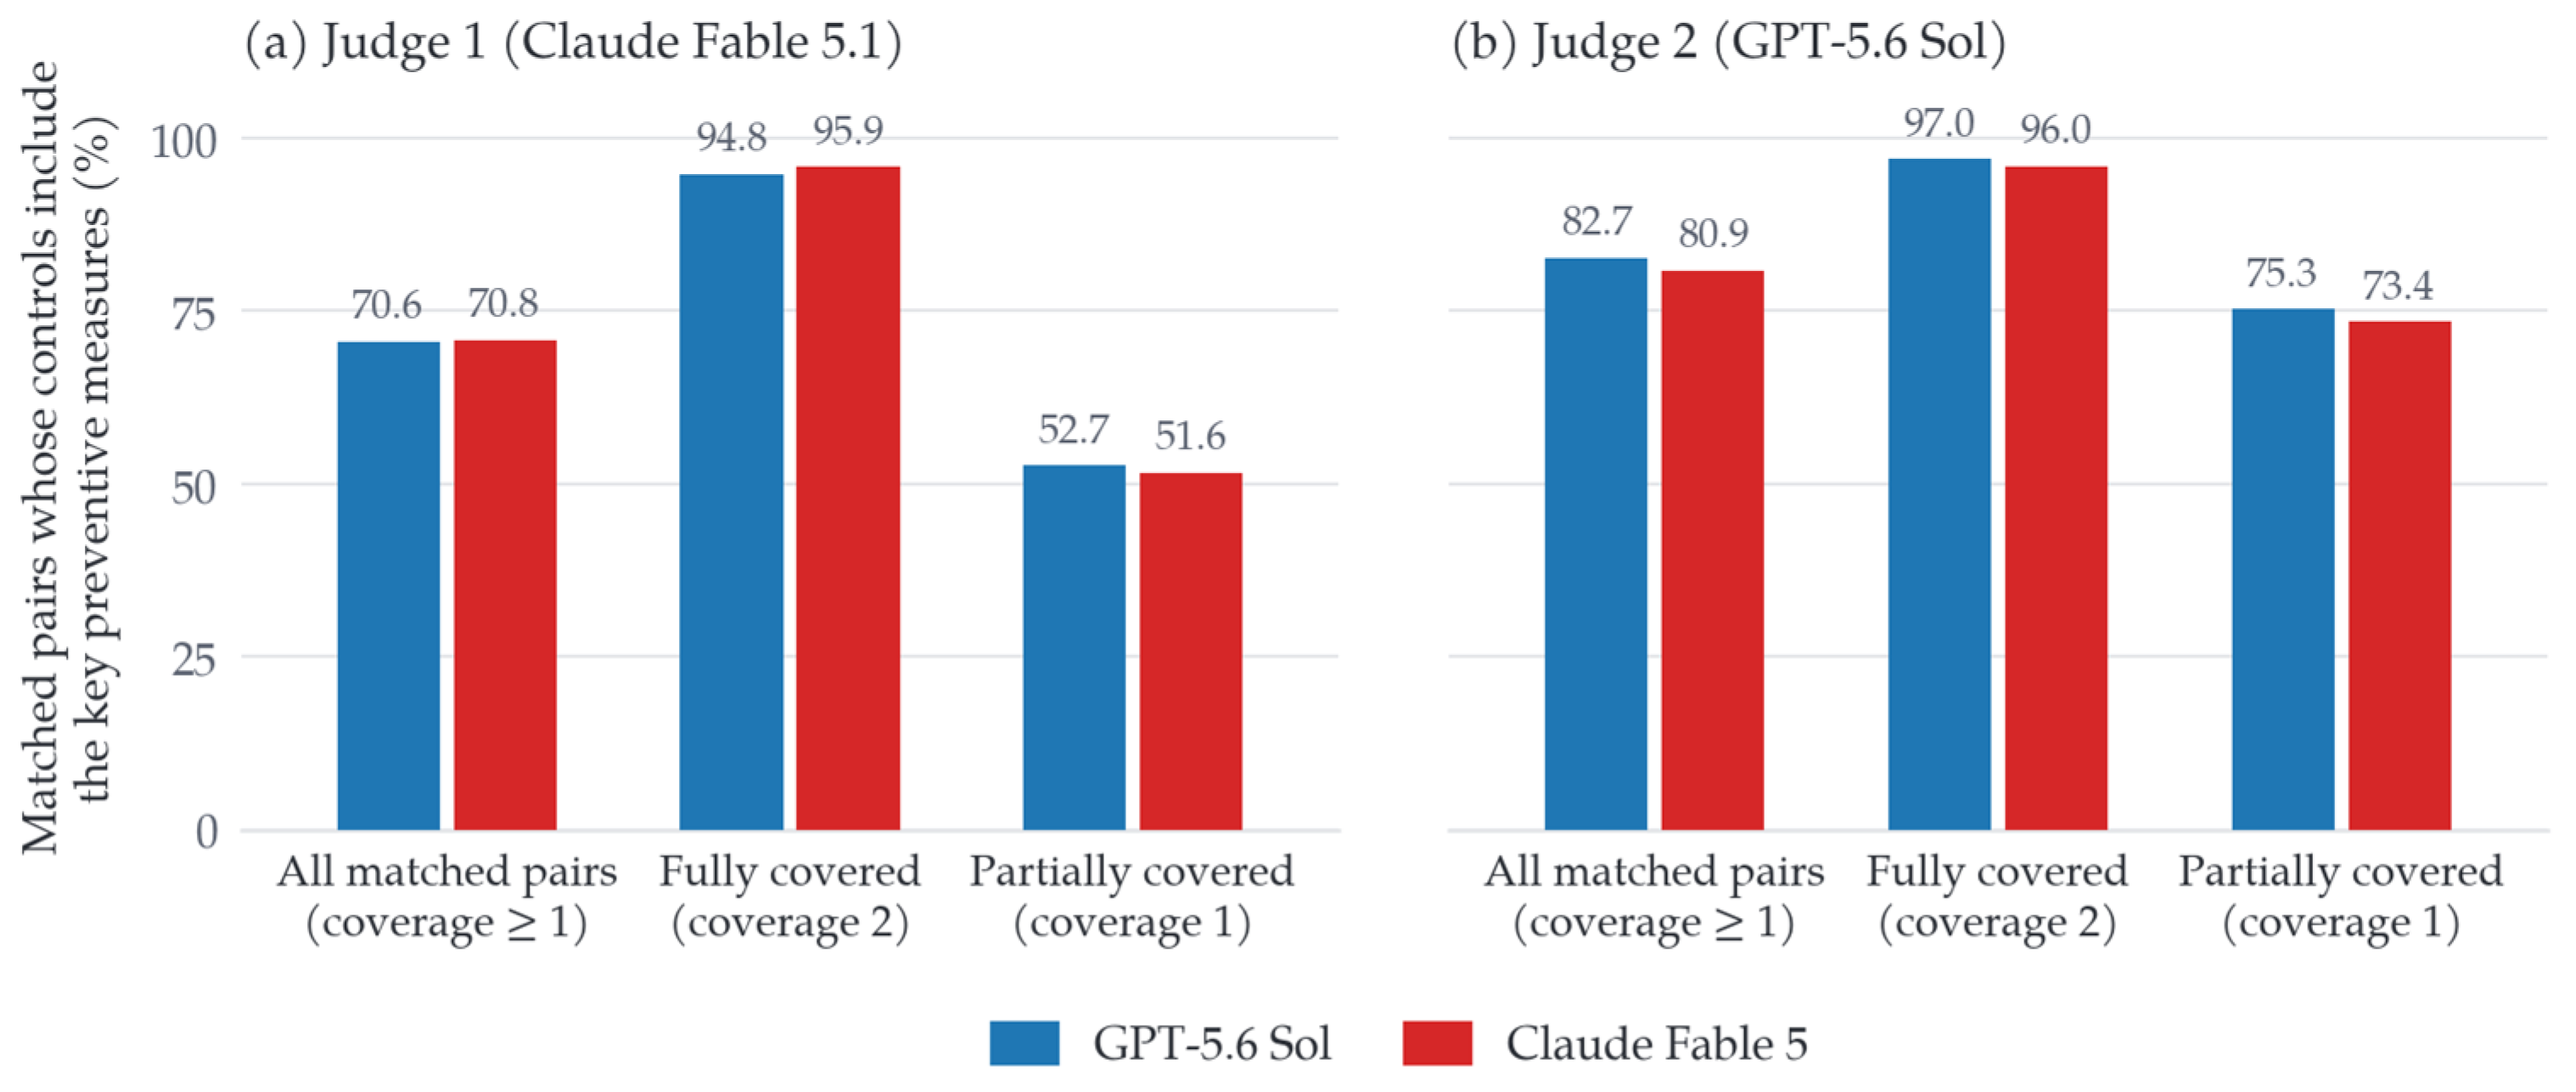
The inclusion of the key preventive measures was associated with the level of coverage. Among matched pairs with any coverage, the proportion whose controls included the key preventive measures (score 2) was 70.6% (802/1136) for GPT-5.6 Sol and 70.8% (799/1128) for Claude Fable 5 by Judge 1, and 82.7% (1049/1269) and 80.9% (1054/1303) by Judge 2. By Judge 1, the proportion with a control score of 2 was 94.8% and 95.9% for fully covered pairs but 52.7% and 51.6% for partially covered pairs. Judge 2 showed the same direction of difference, with 97.0% and 96.0% for fully covered pairs and 75.3% and 73.4% for partially covered pairs. Part of this association follows from the rubric itself: a partially covered pair is one whose key triggering condition is missing from the hazard description, and a control score of 2 requires the measures that block that pathway, with both scores assigned by the same judge to the same pair. The association is therefore descriptive and is not evidence that a more specific hazard description would produce better controls (Section 5.2).
Figure 7 shows these proportions for both judges. The pattern was the same for the two judges and the two services—fully covered pairs above 94% and partially covered pairs well below—although Judge 2 scored the partially covered pairs approximately 20 percentage points more leniently than Judge 1 (Section 4.6).
Figure 7.
Proportion of matched pairs whose controls include the key preventive measures (control score 2) for all matched pairs, fully covered pairs, and partially covered pairs, by generation service and judge. Judge 1 denominators are 1136/483/653 pairs for GPT-5.6 Sol and 1128/489/639 pairs for Claude Fable 5.
By causal agent, control adequacy was high for live electrical parts, at 90% (36 of 40 pairs) for GPT-5.6 Sol and 91% (43 of 47) for Claude Fable 5, and low for mobile elevating work platforms, at 38% (15 of 39) and 39% (17 of 44), respectively (Table 4).
For suspended scaffolds, which GPT-5.6 Sol matched with generic scaffold hazards, count-weighted any coverage was 0.75, but control adequacy was 0.06 (1 of 16 matched pairs). General scaffold controls such as guardrails and safety harnesses were present, but the key preventive measures that rope work requires—an independent lifeline, dual anchor points, and rope edge protection—were missing (Table 4).
4.5. Existence of Cited Articles and Linkage of Their Titles
The two generation services produced 5542 article-level legal citations in total (Table 5). Of these, 4689 (84.6%) cited the Rules: 1857 (71.4%) of GPT-5.6 Sol’s 2601 citations and 2832 (96.3%) of Claude Fable 5’s 2941. GPT-5.6 Sol cited the Occupational Safety and Health Act in 28.6% of its citations (744), most of them the general-duty provision on safety measures (Article 38 of the Act). The 853 citations of the Act and of other instruments were not checked, so the agreement rates below refer to the citations of the Rules only, and the two services’ rates rest on citation populations of different composition.
Table 5.
Legal citations and their comparison with the Rules.
Nearly all of the cited article numbers existed in the designated version, but the linkage between article number and title contained errors. Among the 4689 citations of the Rules (1857 by GPT-5.6 Sol and 2832 by Claude Fable 5), the proportion referring to an existing article was 99.6% for both services (Table 5); because the Rules contain several hundred articles, this figure indicates only that article numbers were rarely invented. Formal article number–title agreement was 94.3% and 94.9% under the strict criterion and 94.6% and 95.9% under the relaxed criterion. These rates describe single generations under the tested conditions and are not directly comparable between the services (Section 5.4). The citations were concentrated: the 1857 and 2832 citations covered 131 and 243 distinct articles, and the ten most cited articles—on the provision of protective equipment, preliminary surveys and work plans, prevention of falls, prohibition of access, and signalling—accounted for 56.7% and 32.5% of each service’s citations of the Rules. Among the distinct articles of the Rules cited, however, 27 of 131 (20.6%) and 54 of 243 (22.2%) were mismatched at least once.
Among citations of existing articles whose titles did not match even under the relaxed criterion, the proportion carrying the title of a different article was 21.7% (20/92) for GPT-5.6 Sol and 41.0% (43/105) for Claude Fable 5.
The relaxed criterion produced no false positives: all 34 citations accepted only under it (6 by GPT-5.6 Sol and 28 by Claude Fable 5) cited the correct article with a suffix or prefix added or omitted, such as “use of the hook release device” for Article 137 (“use of the release device”). Of the 92 and 105 mismatched citations of existing articles, 20 and 43 carried the exact title of another article, 9 and 6 differed from the official title only in wording (the false negatives of the relaxed criterion; counting them as matches raises the agreement rates to 95.1% and 96.1%), and 63 and 56 carried a title that matches no article of the designated version among those cited. Several titles in this last group appear to be the titles that the same articles bore before the recent amendment of the excavation and formwork provisions—for example, “prevention of danger from collapse of the ground” for Article 340 (20 citations by GPT-5.6 Sol) and “prevention of danger during excavation of the ground” for Article 338 (11)—although this was not verified systematically against earlier versions. Counting non-existent article numbers, other articles’ titles, and unmatched titles as formal errors, and wording differences as matches, 4.9% of GPT-5.6 Sol’s and 3.9% of Claude Fable 5’s citations of the Rules were formally in error (Supplementary Table S8).
Title mismatches included both minor wording differences and incorrect linkages between article numbers and titles. For example, the generated and reference titles for “prevention of danger from the descent of booms” differed only by a Korean grammatical particle, but this was still counted as a mismatch under the present criteria. By contrast, assigning the title “prevention of overturning” to Article 198 was a linkage error, because the reference title of Article 198 was “protective structure against falling objects,” whereas “prevention of overturning” corresponded to Article 199.
4.6. Reliability of the Evaluation: Agreement Between Judges and Experts
Judge–expert agreement fell in the same range as the agreement between the two experts. On the same 198 items, the quadratic-weighted κ between the two experts’ coverage scores was 0.69, exact agreement was 60.6%, and 99.5% of the score pairs differed by no more than one level (Table 6). Judge–expert quadratic-weighted κ ranged from 0.65 to 0.84. For the binary distinction between no coverage and any coverage, unweighted κ was 0.37 between the two experts and 0.40–0.71 between judges and experts, whereas for full coverage it was 0.73 and 0.58–0.80 (Table 6). Reweighting by population stratum size lowered κ by 0.02–0.03 relative to the sample values. Parentheses in the table give exact agreement, and the reweighted results are in Supplementary Table S4.
Table 6.
Agreement between the LLM judges and the experts.
Across all 3374 judgments, κ between the two LLM judges was 0.75 and exact agreement was 72.4%; in 92.4% of the evaluations that both judges scored as at least partially covered, they selected the same generated item. The between-judge comparison of control adequacy in Table 6 uses the 2171 evaluations that both judges scored as at least partially covered. κ was similar in the post hoc analysis excluding the two examples used in the instructions (Supplementary Table S4).
Within each generation service, the mean deviation of the judges’ scores from the experts’ scores was nearly the same for the two judges. For the GPT-5.6 Sol drafts, Judge 1 scored 0.31 and 0.07 points below Experts 1 and 2, respectively, and Judge 2 scored 0.29 and 0.05 points below them, respectively. For the Claude Fable 5 drafts, Judge 1 scored 0.19 points below Expert 1 and 0.14 points above Expert 2, and Judge 2 scored 0.18 points below Expert 1 and 0.15 points above Expert 2. Because the tendency to score the Claude Fable 5 drafts relatively higher appeared with the same magnitude in both judges, it is difficult to attribute it to a judge’s preference for the output of its own family [48].
Disagreements between the experts were concentrated at the boundary between no coverage (0) and partial coverage (1). Of the 78 items on which they disagreed, 53 were scored 1 by Expert 1 and 0 by Expert 2, and only one differed by two levels; the disagreement is thus a systematic difference in threshold rather than random error, Expert 1 accepting as partial coverage items that Expert 2 regarded as not covered. Accordingly, the binary κ for full coverage (0.58–0.80) was higher than that for any coverage (0.37–0.71), a pattern seen in the expert–expert comparison and in three of the four judge–expert pairs. The any-coverage figures of 66.9–77.2% therefore rest on a boundary on which raters differ systematically, and a stricter rater would place them lower; the full-coverage figures do not share this sensitivity to the same degree, which is why they are treated as the primary result (Section 3.5). The κ values against the expert consensus (0.876 and 0.780) were computed on the 120 items on which the two experts agreed and exclude, by construction, the items on which the boundary is contested; they are reported for completeness and are not equivalent to the pairwise values.
For the control scores (109 items), κ between the experts was 0.85, and judge–expert κ was 0.41–0.51 for Judge 1 and approximately 0.76 for Judge 2. Judge 1 frequently gave a score of 1 where the experts had given 2. Control adequacy under Judge 1 is therefore likely to be understated relative to expert judgment, which is why the figures of both judges are reported in Table 3 and Figure 7 and the ranges across judges are given in the abstract and the conclusions.
5. Discussion
5.1. Why Drafts Written from Work Names Miss the Mechanism
Both services produced drafts with hazards and controls for every unit work. Yet they fully reflected the specific mechanism of a fatal accident for only 25.5–29.0% of the reference hazard factors (Figure 2). This full-coverage figure is the primary and more reliable result; any coverage (66.9–77.2%) rests on the less stable boundary between no coverage and partial coverage and is secondary. We hypothesize that the gap between the two figures reflects, at least in part, the limited information in the input. A work name carries no information about the operating state of the equipment, the stage of the work, or the position of the worker. The model therefore fills the draft with the combinations of causal agent and accident type that are generally associated with that work. On this hypothesis, hazards at the level of partial coverage—those that name the same hazard category as the reference hazard factor—are mostly generated. The triggering condition that decides whether a fatal accident occurs is not specified by the work name and is mostly not generated. This is why a document that is complete in form can, paradoxically, lead the reviewer to overlook the need for further review. Two alternative explanations deserve consideration. The first is the limit of 5–12 hazards per unit work. Section 4.2 shows, however, that coverage in the unit works whose reference rows did not exceed the number of generated items was no higher than elsewhere, and that most generated items in those unit works matched no reference hazard factor. The limit alone therefore does not account for the gap. The second is a gap in the models’ own knowledge of the mechanisms. The present design cannot separate this from the input hypothesis, because the memorization probe covered only two unit works and does not rule out exposure to the SIF table. The test proposed in Section 6 is intended to distinguish the two.
The content of the shared omissions is consistent with this hypothesis. Entrapment while a MEWP rises, cage over-travel while a construction hoist is being dismantled, and riding in an excavator bucket cannot be described from the equipment name and accident type alone. They are accident conditions that arise only from the combination of the operating state, work stage, and worker position. Combining the matches of the two services widened the coverage, but the shared omissions remained, and the number of items to review grew.
BIM-based safety planning has examined when fall protection is needed and the order in which temporary structures such as scaffolds are installed and dismantled [28,29], and proximity analyses have used the positions of workers and equipment over time to identify struck-by hazards [33]. Together with the omissions found here, these studies point to the need to check not only the work stage but also the operating state of the equipment and the position of the worker.
5.2. Principles for Reviewing Drafts and Directions for Support Tools
The specificity of the hazard description was associated with the adequacy of the controls. Where a suspended-scaffold accident was described as a generic scaffold fall hazard, the measures that the work actually requires, such as an independent lifeline and dual anchor points, were missing. Key preventive measures were present in 95–97% of fully covered pairs but in 52–75% of partially covered pairs, depending on the judge (Figure 7). Judge 1 often assigned a control score of 1 where the experts assigned 2, so the lower end of this range probably understates adequacy (Section 4.4 and Section 4.6). Control adequacy is confined to pairs with any coverage, and both scores were assigned against the same reference hazard factor. The association therefore cannot be read as evidence that making the hazard sentence more specific would improve the controls. Part of it is built into the rubric: partial coverage means that the key triggering condition is missing, and a control score of 2 requires the measure that blocks that pathway. Whether a more specific hazard description would lead to better controls is a hypothesis for future testing, for example by comparing the controls generated for the same unit work with and without equipment and work-stage information. It is not a result of this study. The order of review, however, is clear: only once the accident condition has been identified can one judge whether the key preventive measure that blocks it is present. For a hazard stated at the category level, the controls tend to stay at the category level—guardrails, harnesses, and training.
A review of a draft should therefore ask not whether a hazard is listed but under what conditions the accident happens. The draft should be checked against the site’s equipment list and work sequence to confirm the worker positions and the accident-triggering conditions at each stage of installation, dismantling, raising, and traveling. For each hazard, the reviewer should look for the key preventive measure that blocks the accident pathway and supplement controls that remain at the level of general measures such as training and caution.
Information structures that link risks and responses according to work conditions have been used in ontology-based risk knowledge bases for BIM [25] and in the Safety Risk Library, which connects hazardous situations to recommended measures [34]. Like 4D BIM safety planning that presents hazard locations and timing together with the required protective systems [28], a support tool could link accident conditions and controls by work stage. It could present related fatal-accident cases alongside candidate omissions and let the reviewer judge whether they apply to the site conditions. Where the evidence is supplied through a knowledge graph or RAG [39], the suitability of the retrieved material and the actual reduction in omissions in the draft need to be verified.
Legal citations should be checked against the source text for the name of the regulation, the version in force, the article number, and the title, and then for applicability to the site. Drawing on studies of article recommendation and regulatory information extraction [43,45], a support tool could present candidate articles, their source text, and the location of formal mismatches. The conditions of generation and the review and revision history should be recorded, although the time savings and the accident-prevention effect of the proposed procedure remain to be verified in future studies.
5.3. Interpreting the Differences Between the Generation Services
Differences between the two services varied by metric and by causal agent. Full coverage, the primary and more reliable metric, did not differ significantly between the services. Any coverage is secondary, because it rests on the less stable boundary between no coverage and partial coverage, and the statistical judgment on its between-service difference changed with the clustering unit. The results therefore support neither a consistent advantage for one service nor a conclusion of equivalence. The service with the relatively higher coverage also differed by causal agent, so the omissions for the specific work and equipment should be reviewed alongside the overall averages. All of these comparisons describe the single set of generations obtained from each service under the tested conditions on 2 September 2026. Variation across repeated generations was not measured, and one unit work (4.8.2, exterior panel installation) accounted for more than half of the count-weighted full-coverage difference under Judge 1 (+0.061 overall; +0.027 without it; Table 3). The comparative statements in this paper should therefore not be generalized to the overall performance of the two models.
5.4. Agreement of Article Numbers and Titles in Cited Regulations
The checks reported here are formal. They establish whether a cited article number exists in the designated version and whether the cited title agrees with the title of that article, not whether the article applies to the work. An existing article number may carry the wrong title. Conversely, a string mismatch may stem only from a difference in particles or wording. The overall mismatch rate therefore cannot be read as the rate of substantive legal error. The agreement rates of the two services are not directly comparable, because 15.4% of the citations referred to the Act or other instruments and were not checked, and because the two services differed widely in this share (28.6% versus 3.7%). Like every comparison in this paper, they describe single generations under the tested conditions and should not be generalized to the models’ overall performance. Once the string comparison has identified what needs review, the linkage between number and title should be checked separately from the applicability of the article’s content to the site.
5.5. Reliability of the Evaluation and Limitations
The SIF data do not include non-fatal accidents or every condition of an individual site, so a generated item that matches no reference hazard factor cannot be regarded as an error outright. Conversely, the matched-item ratio (31.5–36.3%) is not a precision score. The completeness of a draft for a particular site cannot be judged from the SIF table alone: a draft may contain hazards that the table does not record, and it may omit site-specific conditions that the table records under a different unit work. The weighted results reflect the distribution of recorded counts and do not represent exposure-adjusted risk or accident-prevention effect. That the SIF text was not reproduced does not rule out exposure to the material during pretraining.
Only one round of responses for the 40 batches was analyzed for each service, so variation across repeated generations could not be estimated. The estimates describe the generations obtained under the tested conditions rather than the services in general. Because 5–12 hazards per unit work were requested without detailed site or equipment information, the contributions of model knowledge, input information, and the item limit to the omissions cannot be separated. The subgroup analysis in Section 4.2 indicates, however, that the item limit alone does not explain the gap.
Three further limitations concern the measurement. First, one generated item could be matched to several reference rows. The alternative matching rules in Supplementary Table S5 change the level of any coverage considerably. They leave intact, however, the ordering of the two coverage levels, the closeness of the two services, and the control-adequacy figures. The one-to-one variant should be read as a lower bound rather than as an alternative estimate, because the reference list itself records one mechanism in several rows. Second, the recorded count is the number of table records attributed to a row. The count-weighted results are therefore weighted by table records rather than by distinct accidents or victims. Third, the boundary between no and partial coverage was the least reliable part of the scoring, so any coverage is reported as a secondary metric and full coverage as the primary one. Because Judge 1’s control scores agreed less with the experts than Judge 2’s, control adequacy is reported for both judges.
In the scoring, the effects of model family and execution environment cannot be separated. Control evaluation was confined to the single selected generated item, so it may differ from the adequacy of the document as a whole when controls are spread across several items.
Generalization is limited to the two generation services at the time of analysis and to Korean-language input. Applying the evaluation procedure in another country or region requires adjusting the matching criteria to local reference data and accident classifications, and confirming inter-rater agreement.
6. Conclusions
A risk assessment draft generated from a work name alone tends to name the hazard category but misses the accident mechanism, that is, the specific hazard through which a fatal accident occurs. The two services named the right hazard category for more than two-thirds of the fatality-derived reference hazard factors. They described the mechanism that led to death for only about a quarter. The second figure, full coverage, is the primary and more reliable result; the first rests on the less stable boundary between no coverage and partial coverage and is secondary. The gap persisted under alternative rules for matching generated items to reference rows. What the drafts missed were accident conditions that arise only when the operating state of the equipment, the work stage, and the position of the worker come together. We hypothesize that the gap is related to the information available in the input: the work name does not carry those conditions, and two services from different developers missed the same types of scenarios at the same level. The separate contributions of input information, model knowledge, and the item limit cannot be determined from this study. All results, including the comparisons between the two services, describe the single generation obtained from each service under the tested conditions. They should not be generalized to the models’ overall performance.
Such a draft should therefore be treated as a starting point for review, not as the risk assessment document itself. Practitioners should check it against the site’s equipment list and work sequence rather than by its number of items or its form. The check should ask three questions: under what conditions an accident would occur, whether the key preventive measure that blocks that condition is present, and whether the cited article numbers and titles are correct. Developers of support tools need a structure that takes in more than the work name: equipment, work stage, and related fatal-accident cases. The evaluation procedure presented here is a yardstick for whether such a tool reduces the missed accident conditions.
This hypothesis is testable. If the omissions stem from the limits of the input, coverage at the mechanism level should rise when equipment and work-stage information is added. If coverage does not rise, model knowledge or other factors also limit performance. A procedure that uses fatal-accident data as its reference, as this study does, can distinguish these possibilities.
Supplementary Materials
The following supporting information can be downloaded at: https://www.mdpi.com/article/10.3390/buildings16224554/s1. Material S1: generation prompt; Material S2: scoring instructions; Material S3: accident-type classification; Material S4: Additional verification. Table S1: consolidation of accident types; Table S2: cluster tests of overall coverage differences; Table S3: coverage under data exclusions; Table S4: sensitivity analysis of expert agreement; Table S5: sensitivity of coverage to the handling of multiple matches; Table S6: coverage by number of reference rows per unit work; Table S7: coverage and control adequacy by causal agent for Judge 2; Table S8: classification of the citations of the Rules by agreement outcome. Data S1: generated drafts, LLM-judge judgments, legal-citation audit, and analysis code (ZIP archive).
Author Contributions
Conceptualization, J.L. (JaeWook Lee) and J.L. (Jongho Lee); methodology, J.L. (Jongho Lee) and Y.L.; data curation, J.L. (Jongho Lee) and Y.L.; formal analysis, J.L. (Jongho Lee); investigation, J.L. (Jongho Lee) and Y.L.; writing—original draft preparation, J.L. (Jongho Lee); writing—review and editing, J.L. (JaeWook Lee) and Y.L.; supervision, J.L. (JaeWook Lee); project administration, J.L. (Jongho Lee); funding acquisition, J.L. (Jongho Lee). All authors have read and agreed to the published version of the manuscript.
Funding
This research was funded by the Ministry of Land, Infrastructure and Transport and the Smart Construction Support Center (Project No. 20260002-019, “Development of Technology for Verifying the Reliability of Generative AI–Generated Safety and Health Documents”).
Institutional Review Board Statement
Not applicable.
Informed Consent Statement
Not applicable.
Data Availability Statement
The source data used in this study are publicly available from the Korea Occupational Safety and Health Agency (KOSHA), as cited in Reference [12]. The generation prompt, scoring instructions, and additional verification and sensitivity analysis results are provided in the Supplementary Materials. The original contributions presented in this study are included in the article/Supplementary Materials: the generated outputs of both services (verbatim responses and parsed items), the judgments of both LLM judges, the reference list with the item keys used in the analysis, the legal-citation audit, and the analysis code are provided as Supplementary Data S1 (ZIP archive). Further inquiries can be directed to the corresponding author.
Acknowledgments
The authors thank the two construction safety professionals who took part in the independent validation. GPT-5.6 Sol (OpenAI) and Claude Fable 5 (Anthropic) were the generation services under evaluation, and Claude Fable 5.1 (Anthropic) and GPT-5.6 Sol (OpenAI) served as the LLM judges that scored the drafts against the rubric. Claude Fable 5.1 and ChatGPT (OpenAI) were used to develop the analysis code, to run the statistical analysis of the scores, and to edit and translate the manuscript. The expert validation of the LLM scoring is described in Section 3.4 and Section 4.6. The authors are responsible for the study design, the analysis results, their interpretation and the content of the manuscript.
Conflicts of Interest
The authors declare no conflicts of interest.
Abbreviations
The following abbreviations are used in this manuscript:
| LLM | Large language model |
| SIF | Serious Injury and Fatality (KOSHA hazard-factor table) |
| KOSHA | Korea Occupational Safety and Health Agency |
| MOEL | Ministry of Employment and Labor |
| MEWP | Mobile elevating work platform |
| RAG | Retrieval-augmented generation |
| BIM | Building information modeling |
| API | Application programming interface |
| JSON | JavaScript Object Notation |
References
- Ministry of Employment and Labor. Notice on Risk Assessment in Workplaces, MOEL Notice No. 2023-19. 22 May 2023. Available online: https://www.moel.go.kr/info/lawinfo/instruction/view.do?bbs_seq=20230501086 (accessed on 3 September 2026).
- Occupational Safety and Health Act, Republic of Korea, Article 36. Korean Law Information Center. Available online: https://www.law.go.kr/LSW/lsInfoP.do?lsiSeq=283449 (accessed on 3 September 2026).
- Serious Accidents Punishment Act, Act No. 17907, Republic of Korea, Enacted 26 January 2021, Effective 27 January 2022. Available online: https://www.law.go.kr/LSW/lsInfoP.do?lsiSeq=228817 (accessed on 3 September 2026).
- Ministry of Employment and Labor. 2024 Industrial Accident Status; MOEL: Sejong, Republic of Korea, 2025; Available online: https://www.moel.go.kr/policy/policydata/view.do?bbs_seq=20250402181 (accessed on 3 September 2026).
- Parasuraman, R.; Manzey, D.H. Complacency and Bias in Human Use of Automation: An Attentional Integration. Hum. Factors 2010, 52, 381–410. [Google Scholar] [CrossRef] [Scilit] [PubMed]
- Goddard, K.; Roudsari, A.; Wyatt, J.C. Automation Bias: A Systematic Review of Frequency, Effect Mediators, and Mitigators. J. Am. Med. Inform. Assoc. 2012, 19, 121–127. [Google Scholar] [CrossRef] [Scilit] [PubMed]
- Sammour, F.; Xu, J.; Wang, X.; Hu, M.; Zhang, Z. Responsible AI in Construction Safety: Systematic Evaluation of Large Language Models and Prompt Engineering. J. Constr. Eng. Manag. 2026, 152, 04025217. [Google Scholar] [CrossRef] [Scilit]
- La Fata, C.M.; Barone, G.; Cammarata, M. Improving Construction Site Safety with Large Language Models: A Performance Analysis. Information 2026, 17, 210. [Google Scholar] [CrossRef] [Scilit]
- Erfani, A.; Khanjar, H. Large Language Models for Construction Risk Classification: A Comparative Study. Buildings 2025, 15, 3379. [Google Scholar] [CrossRef] [Scilit]
- Martin, H.; James, J.; Chadee, A. Exploring Large Language Model AI Tools in Construction Project Risk Assessment: Chat GPT Limitations in Risk Identification, Mitigation Strategies, and User Experience. J. Constr. Eng. Manag. 2025, 151, 04025119. [Google Scholar] [CrossRef] [Scilit]
- Aladağ, H. Assessing the Accuracy of ChatGPT Use for Risk Management in Construction Projects. Sustainability 2023, 15, 16071. [Google Scholar] [CrossRef] [Scilit]
- De Marco, G.; Niederwieser, E.; Siegele, D. Exploring a Multimodal Conversational Agent for Construction Site Safety: A Low-Code Approach to Hazard Detection and Compliance Assessment. Buildings 2025, 15, 3352. [Google Scholar] [CrossRef] [Scilit]
- Mustafa, M.A.; Ahmed, K.; Mahmood, Z.; Hassan, M.U.; Mehmood, I.; Khan, H. Assessing the Effectiveness of Generative Artificial Intelligence in Hazard Identification on Construction Sites. Buildings 2026, 16, 2401. [Google Scholar] [CrossRef] [Scilit]
- Korea Occupational Safety and Health Agency (KOSHA). Core Hazard Factors for Construction Fatalities (SIF) Evaluation Table (Authors’ Translation); KOSHA: Ulsan, Republic of Korea, 2023; Available online: https://kosha.or.kr/notification/notice/contruction?bbsId=B2025021400001&pstNo=20230605093946HESO62 (accessed on 31 August 2026).
- Carter, G.; Smith, S.D. Safety Hazard Identification on Construction Projects. J. Constr. Eng. Manag. 2006, 132, 197–205. [Google Scholar] [CrossRef] [Scilit]
- Albert, A.; Hallowell, M.R.; Kleiner, B.M. Enhancing Construction Hazard Recognition and Communication with Energy-Based Cognitive Mnemonics and Safety Meeting Maturity Model: Multiple Baseline Study. J. Constr. Eng. Manag. 2014, 140, 04013042. [Google Scholar] [CrossRef] [Scilit]
- Shuang, Q.; Liu, X.; Wang, Z.; Xu, X. Automatically Categorizing Construction Accident Narratives Using the Deep-Learning Model with a Class-Imbalance Treatment Technique. J. Constr. Eng. Manag. 2024, 150, 04024107. [Google Scholar] [CrossRef] [Scilit]
- Koc, K.; Ekmekcioğlu, Ö.; Gurgun, A.P. Developing a National Data-Driven Construction Safety Management Framework with Interpretable Fatal Accident Prediction. J. Constr. Eng. Manag. 2023, 149, 04023010. [Google Scholar] [CrossRef] [Scilit]
- Ray, U.; Arteaga, C.; Oh, I.; Park, J. Unveiling Untapped Potential: Leveraging Accident Narratives for Enhanced Construction Safety Management. J. Manag. Eng. 2025, 41, 04025012. [Google Scholar] [CrossRef] [Scilit]
- Zhou, Z.; Goh, Y.M.; Li, Q. Overview and Analysis of Safety Management Studies in the Construction Industry. Saf. Sci. 2015, 72, 337–350. [Google Scholar] [CrossRef] [Scilit]
- Tixier, A.J.-P.; Hallowell, M.R.; Rajagopalan, B.; Bowman, D. Automated content analysis for construction safety: A natural language processing system to extract precursors and outcomes from unstructured injury reports. Autom. Constr. 2016, 62, 45–56. [Google Scholar] [CrossRef] [Scilit]
- Zhang, F.; Fleyeh, H.; Wang, X.; Lu, M. Construction Site Accident Analysis Using Text Mining and Natural Language Processing Techniques. Autom. Constr. 2019, 99, 238–248. [Google Scholar] [CrossRef] [Scilit]
- Xu, N.; Ma, L.; Liu, Q.; Wang, L.; Deng, Y. An Improved Text Mining Approach to Extract Safety Risk Factors from Construction Accident Reports. Saf. Sci. 2021, 138, 105216. [Google Scholar] [CrossRef] [Scilit]
- Kim, T.; Chi, S. Accident Case Retrieval and Analyses: Using Natural Language Processing in the Construction Industry. J. Constr. Eng. Manag. 2019, 145, 04019004. [Google Scholar] [CrossRef] [Scilit]
- Ding, L.Y.; Zhong, B.T.; Wu, S.; Luo, H.B. Construction Risk Knowledge Management in BIM Using Ontology and Semantic Web Technology. Saf. Sci. 2016, 87, 202–213. [Google Scholar] [CrossRef] [Scilit]
- Poh, C.Q.X.; Ubeynarayana, C.U.; Goh, Y.M. Safety Leading Indicators for Construction Sites: A Machine Learning Approach. Autom. Constr. 2018, 93, 375–386. [Google Scholar] [CrossRef] [Scilit]
- Zhang, S.; Teizer, J.; Lee, J.-K.; Eastman, C.M.; Venugopal, M. Building Information Modeling (BIM) and Safety: Automatic Safety Checking of Construction Models and Schedules. Autom. Constr. 2013, 29, 183–195. [Google Scholar] [CrossRef] [Scilit]
- Zhang, S.; Sulankivi, K.; Kiviniemi, M.; Romo, I.; Eastman, C.M.; Teizer, J. BIM-Based Fall Hazard Identification and Prevention in Construction Safety Planning. Saf. Sci. 2015, 72, 31–45. [Google Scholar] [CrossRef] [Scilit]
- Kim, K.; Cho, Y.; Zhang, S. Integrating Work Sequences and Temporary Structures into Safety Planning: Automated Scaffolding-Related Safety Hazard Identification and Prevention in BIM. Autom. Constr. 2016, 70, 128–142. [Google Scholar] [CrossRef] [Scilit]
- Zhang, S.; Boukamp, F.; Teizer, J. Ontology-based semantic modeling of construction safety knowledge: Towards automated safety planning for job hazard analysis (JHA). Autom. Constr. 2015, 52, 29–41. [Google Scholar] [CrossRef] [Scilit]
- Fang, W.; Ma, L.; Love, P.E.D.; Luo, H.; Ding, L.; Zhou, A. Knowledge Graph for Identifying Hazards on Construction Sites: Integrating Computer Vision with Ontology. Autom. Constr. 2020, 119, 103310. [Google Scholar] [CrossRef] [Scilit]
- Malekitabar, H.; Ardeshir, A.; Sebt, M.H.; Stouffs, R. Construction Safety Risk Drivers: A BIM Approach. Saf. Sci. 2016, 82, 445–455. [Google Scholar] [CrossRef] [Scilit]
- Golovina, O.; Teizer, J.; Pradhananga, N. Heat Map Generation for Predictive Safety Planning: Preventing Struck-by and Near Miss Interactions between Workers-on-Foot and Construction Equipment. Autom. Constr. 2016, 71, 99–115. [Google Scholar] [CrossRef] [Scilit]
- Collinge, W.H.; Osorio-Sandoval, C. Deploying a Building Information Modelling (BIM)-Based Construction Safety Risk Library for Industry: Lessons Learned and Future Directions. Buildings 2024, 14, 500. [Google Scholar] [CrossRef] [Scilit]
- Katooziani, A.; Jeelani, I.; Gheisari, M. GPT Applications for Construction Safety: A Use Case Analysis. Buildings 2025, 15, 2410. [Google Scholar] [CrossRef] [Scilit]
- Saka, A.; Taiwo, R.; Saka, N.; Salami, B.A.; Ajayi, S.; Akande, K.; Kazemi, H. GPT Models in Construction Industry: Opportunities, Limitations, and a Use Case Validation. Dev. Built Environ. 2024, 17, 100300. [Google Scholar] [CrossRef] [Scilit]
- Uddin, S.M.J.; Albert, A.; Ovid, A.; Alsharef, A. Leveraging ChatGPT to Aid Construction Hazard Recognition and Support Safety Education and Training. Sustainability 2023, 15, 7121. [Google Scholar] [CrossRef] [Scilit]
- Lewis, P.; Perez, E.; Piktus, A.; Petroni, F.; Karpukhin, V.; Goyal, N.; Küttler, H.; Lewis, M.; Yih, W.-t.; Rocktäschel, T.; et al. Retrieval-Augmented Generation for Knowledge-Intensive NLP Tasks. In Advances in Neural Information Processing Systems 33 (NeurIPS 2020); Curran Associates: Red Hook, NY, USA, 2020; Available online: https://papers.neurips.cc/paper/2020/hash/6b493230205f780e1bc26945df7481e5-Abstract.html (accessed on 3 September 2026).
- Cheng, S.; Qi, Y.; Wu, R.; Guan, Y. A Multimodal Agent Framework for Construction Scenarios: Accurate Perception, Dynamic Retrieval, and Explainable Hazard Reasoning. Buildings 2025, 15, 4439. [Google Scholar] [CrossRef] [Scilit]
- Ji, Z.; Lee, N.; Frieske, R.; Yu, T.; Su, D.; Xu, Y.; Ishii, E.; Bang, Y.J.; Madotto, A.; Fung, P. Survey of Hallucination in Natural Language Generation. ACM Comput. Surv. 2023, 55, 248. [Google Scholar] [CrossRef] [Scilit]
- Dahl, M.; Magesh, V.; Suzgun, M.; Ho, D.E. Large Legal Fictions: Profiling Legal Hallucinations in Large Language Models. J. Leg. Anal. 2024, 16, 64–93. [Google Scholar] [CrossRef] [Scilit]
- Magesh, V.; Surani, F.; Dahl, M.; Suzgun, M.; Manning, C.D.; Ho, D.E. Hallucination-Free? Assessing the Reliability of Leading AI Legal Research Tools. J. Empir. Leg. Stud. 2025, 22, 216–242. [Google Scholar] [CrossRef] [Scilit]
- Zhang, J.; El-Gohary, N.M. Semantic NLP-Based Information Extraction from Construction Regulatory Documents for Automated Compliance Checking. J. Comput. Civ. Eng. 2016, 30, 04015014. [Google Scholar] [CrossRef] [Scilit]
- Wang, X.; El-Gohary, N. Deep learning-based relation extraction and knowledge graph-based representation of construction safety requirements. Autom. Constr. 2023, 147, 104696. [Google Scholar] [CrossRef] [Scilit]
- Kim, M.; Jeong, J.; Kumi, L. Deep Learning-Based Safety Legislation Recommendation System for Construction Safety Reports. Buildings 2026, 16, 2374. [Google Scholar] [CrossRef] [Scilit]
- Lee, C.; Ham, S. BIM-Based Safety Design Guide Systems Using Rule Checking and LLM Approaches for Preventing Construction Accidents. Buildings 2026, 16, 2200. [Google Scholar] [CrossRef] [Scilit]
- Zheng, L.; Chiang, W.-L.; Sheng, Y.; Zhuang, S.; Wu, Z.; Zhuang, Y.; Lin, Z.; Li, Z.; Li, D.; Xing, E.P.; et al. Judging LLM-as-a-Judge with MT-Bench and Chatbot Arena. In Advances in Neural Information Processing Systems 36 (NeurIPS 2023); Curran Associates: Red Hook, NY, USA, 2023; pp. 46595–46623. Available online: https://proceedings.neurips.cc/paper_files/paper/2023/hash/91f18a1287b398d378ef22505bf41832-Abstract-Datasets_and_Benchmarks.html (accessed on 3 September 2026).
- Panickssery, A.; Bowman, S.R.; Feng, S. LLM Evaluators Recognize and Favor Their Own Generations. In Advances in Neural Information Processing Systems 37 (NeurIPS 2024); Curran Associates: Red Hook, NY, USA, 2024; pp. 68772–68802. Available online: https://proceedings.neurips.cc/paper_files/paper/2024/hash/7f1f0218e45f5414c79c0679633e47bc-Abstract-Conference.html (accessed on 3 September 2026).
- Cohen, J. Weighted Kappa: Nominal Scale Agreement with Provision for Scaled Disagreement or Partial Credit. Psychol. Bull. 1968, 70, 213–220. [Google Scholar] [CrossRef] [Scilit] [PubMed]
- Rules on Occupational Safety and Health Standards, Ministry of Employment and Labor Ordinance No. 450, Amended 1 September 2025, in Force 2 March 2026. Korean Law Information Center. Available online: https://www.law.go.kr/LSW/lsInfoP.do?lsiSeq=273603 (accessed on 3 September 2026).

Disclaimer/Publisher’s Note: The statements, opinions and data contained in all publications are solely those of the individual author(s) and contributor(s) and not of MDPI and/or the editor(s). MDPI and/or the editor(s) disclaim responsibility for any injury to people or property resulting from any ideas, methods, instructions or products referred to in the content. |
© 2026 by the authors. Licensee MDPI, Basel, Switzerland. This article is an open access article distributed under the terms and conditions of the Creative Commons Attribution (CC BY) license.