


Abstract
Split air conditioners are widely used in residential homes where a central air conditioning system is not available. Dust accumulation on the mesh-grid air filter of the device can significantly increase airflow resistance, leading to reduced energy efficiency of air conditioners. Current filter maintenance relies primarily on visual inspection results or a fixed cleaning schedule, both of which are ineffective. Based on a dataset of 4900 images of mesh-grid filters collected from split air conditioners, this study proposes a Residual U-Net model with residual connections to simultaneously perform pixel-level dust area segmentation and three-level dust thickness categorization of the filters (mild, moderate, and severe). To bridge visual outputs with physical performance, a dust accumulation index (DAI) was established to quantitatively evaluate the overall dust accumulation degree by integrating the predicted dust area and thickness levels. Model performance on the 500 independent field test samples achieved an average intersection over union of 80%, a Dice coefficient of 86%, and a thickness classification accuracy of 93%. These numbers deviated only marginally (approximately 1%) from the validation performance, confirming the model’s reliable generalization capability under complex real-world operating conditions. This machine learning model provides a solid technical foundation for the image-based assessment of dust accumulation from photographs of the filter to support effective cleaning schedules.
1. Introduction
Split air conditioners are frequently used in residential homes. They not only regulate indoor thermal and humidity environments but also have a significant impact on overall building energy consumption [1,2,3], indoor air quality (IAQ) [4,5], and occupant health [6,7]. The mesh-grid filter, a key component of the device, is highly prone to intercepting and accumulating various suspended particles that contain many different substances, including microplastic fibers [8,9], pollen, mineral particles [10,11], and bioaerosols [12,13,14], to form a flocculent dust layer. The accumulated dust load on the filter can lead to a substantial rise in airflow resistance, which reduces the efficiency of heat exchange, forcing the equipment to operate for longer durations or at higher power to maintain the target indoor temperature [15,16]. Furthermore, under humid conditions at room temperature, accumulated dust can easily become a breeding ground for microorganisms, leading to secondary indoor pollution via the air supply system [17,18]. Timely filter maintenance is essential to maintain the optimal operating efficiency and performance of air conditioners.
Currently, the cleaning of the filter in split air conditioners is either based on a visual assessment of dust accumulation or relies on a fixed cleaning schedule; however, neither is adequate for effective maintenance because visual observation requires removing the outer cover of the device and lacks an objective assessment standard, and fixed maintenance cycles fail to reflect the actual dust load on the filter in each device. As a result, current maintenance practices either waste resources due to over-cleaning or cause higher energy consumption due to under-cleaning. The latter may also create health risks [19,20,21]. Therefore, there is a need for the industry to introduce an intelligent monitoring approach that can remotely assess the dust load on the filter to support effective planning for filter cleaning.
The rapid development of computer vision and deep learning technology has provided an opportunity to address this issue. Compared to visual inspection, image analysis using machine learning not only possesses a high degree of automation but also yields an objective and quantitative assessment. In recent years, this versatile technology has demonstrated great potential in many applications, such as microscopic disease monitoring of crops in agriculture [22,23,24], medical image analysis of lesions in medicine [25,26,27,28,29], and the identification of dust [30], microplastic morphology [31,32], and airborne particulates in environmental science [33,34,35]. However, the application of such technology directly to assess dust on filters in heating, ventilation, and air conditioning (HVAC) components, including split air conditioners, is still rare [36]. Unlike mold growing on the surface of internal baffles in air conditioners [37], which appears as high-contrast spots or patches on the surface, accumulated dust on mesh-grid air conditioner filters is mostly in a flocculent form due to the unique mesh-grid texture of the filter.
The dust first accumulates on the grid threads of mesh-grid filters, then grows progressively towards the center of mesh openings, and eventually bridges the threads to cause total blockage of the airflow. This unique physical characteristic of the dust-thread texture often renders conventional image threshold cut-off methods and basic deep learning architectures inapplicable. For example, standard object detection algorithms, such as the YOLO (You Only Look Once) models [38,39,40], though effective in locating discrete individual targets with distinct images, are incapable of describing the pixel-level boundaries and thickness of the objects. Meanwhile, classic pixel-level semantic segmentation networks such as CNNs (convolutional neural networks) [41,42,43], known for their robust capabilities in automated hierarchical feature extraction and image-level classification, are highly susceptible to local reflections or shadows when facing the strong background interference of a mesh grid and ambiguous dust edges, leading to high computational redundancy and difficulty in accurately extracting the global features required to simultaneously quantify dust area and dust thickness on the filter. To bridge this methodological gap, the novelty of our proposed Residual U-Net model lies in its integration of identity mapping skip connections into a specialized dual-branch framework. Unlike existing image-based segmentation methods that struggle with high-frequency periodic noise, our architecture ensures deep gradient propagation while simultaneously performing high-precision pixel-level dust area segmentation and multi-class thickness classification without being distracted by mesh background textures.
Therefore, there are three major challenges in assessing the dust load on mesh-grid filters of air conditioners: (1) a lack of objective, image-based assessment methods to evaluate dust accumulation from photographs of the filter; (2) a lack of pixel-level segmentation methods that are capable of eliminating interference from grid patterns of the filter; and (3) a lack of effective generic segmentation models that provide sufficient feature extraction in handling images with low-contrast features of dust on filters.
To address the above-mentioned gaps, we propose a U-Net-based deep learning image segmentation architecture. The aim of this study is to develop an intelligent identification method for assessing dust accumulation on mesh-grid filters of split air conditioners by integrating machine learning and image recognition algorithms. The main contributions of this work are summarized as follows: (1) we propose a novel Residual U-Net architecture featuring a shared encoder and dual decoders to simultaneously perform pixel-level dust area segmentation and multilevel thickness classification; (2) we introduce a quantitative DAI metric that integrates spatial area coverage with thickness-based penalty weights, bridging visual features with physical flow resistance characteristics; and (3) utilizing a comprehensive dataset of 4900 standardized images covering four distinct operational scenarios, we demonstrate the model’s superior performance and robust generalization capabilities on independent field test samples.
2. Methods
The method encompasses the entire workflow, ranging from high-resolution micro-image acquisition and standardization to the three-level dust thickness classification network based on the Residual U-Net algorithm. The model was executed on a hardware platform powered by an Intel Core Ultra 7 265K processor (Intel Corp., Santa Clara, CA, USA), an NVIDIA GeForce RTX 5070 Ti GPU (NVIDIA Corp., Santa Clara, CA, USA), and dual-channel high-speed DDR5 RAM. Additionally, a GM7000 series 2TB M.2 NVMe SSD was utilized to facilitate high-throughput, low-latency loading of large-scale micro-dust image datasets across multiple training epochs. The software environment was standardized using Python (version 3.11, Python Software Foundation, Wilmington, DE, USA) and the PyTorch deep learning framework (version 2.1.0, Meta Platforms Inc., Menlo Park, CA, USA), with hardware-level tensor computational acceleration achieved by leveraging the NVIDIA CUDA backend (version 12.1, NVIDIA Corp., Santa Clara, CA, USA) and the cuDNN library (version 8.9, NVIDIA Corp., Santa Clara, CA, USA).
2.1. Construction of Machine Learning Dataset
2.1.1. Raw Image Acquisition
The raw images of the mesh-grid filters of split air conditioners were captured using the 12-megapixel camera lens of an iPhone 15 Pro Max at a vertical distance of approximately 20 cm from the filter surface, ensuring that the complete filter frame was fully captured in a single photograph. To minimize perspective distortion and maintain scale consistency, a strict orthogonal viewing angle was maintained relative to the filter plane, supplemented by slight natural manual angle variations during shooting to account for operational handling tolerances. To counteract fluctuations in ambient lighting conditions and eliminate specular or diffuse reflections from the glossy plastic threads of the mesh grid, cool white auxiliary lighting on the camera was consistently deployed across all processes (see Supplemental Figure S1). The thickness of the accumulated dust layer was measured using a high-precision digital depth gauge (SYNTEK Dial Indicator; range: 0–50 mm, precision: 0.01 mm, measurement error: ≤±0.02 mm).
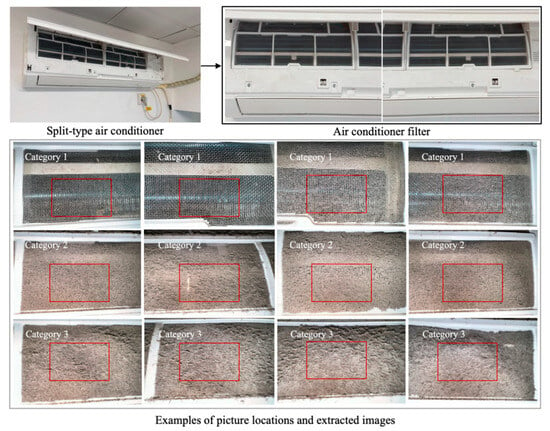
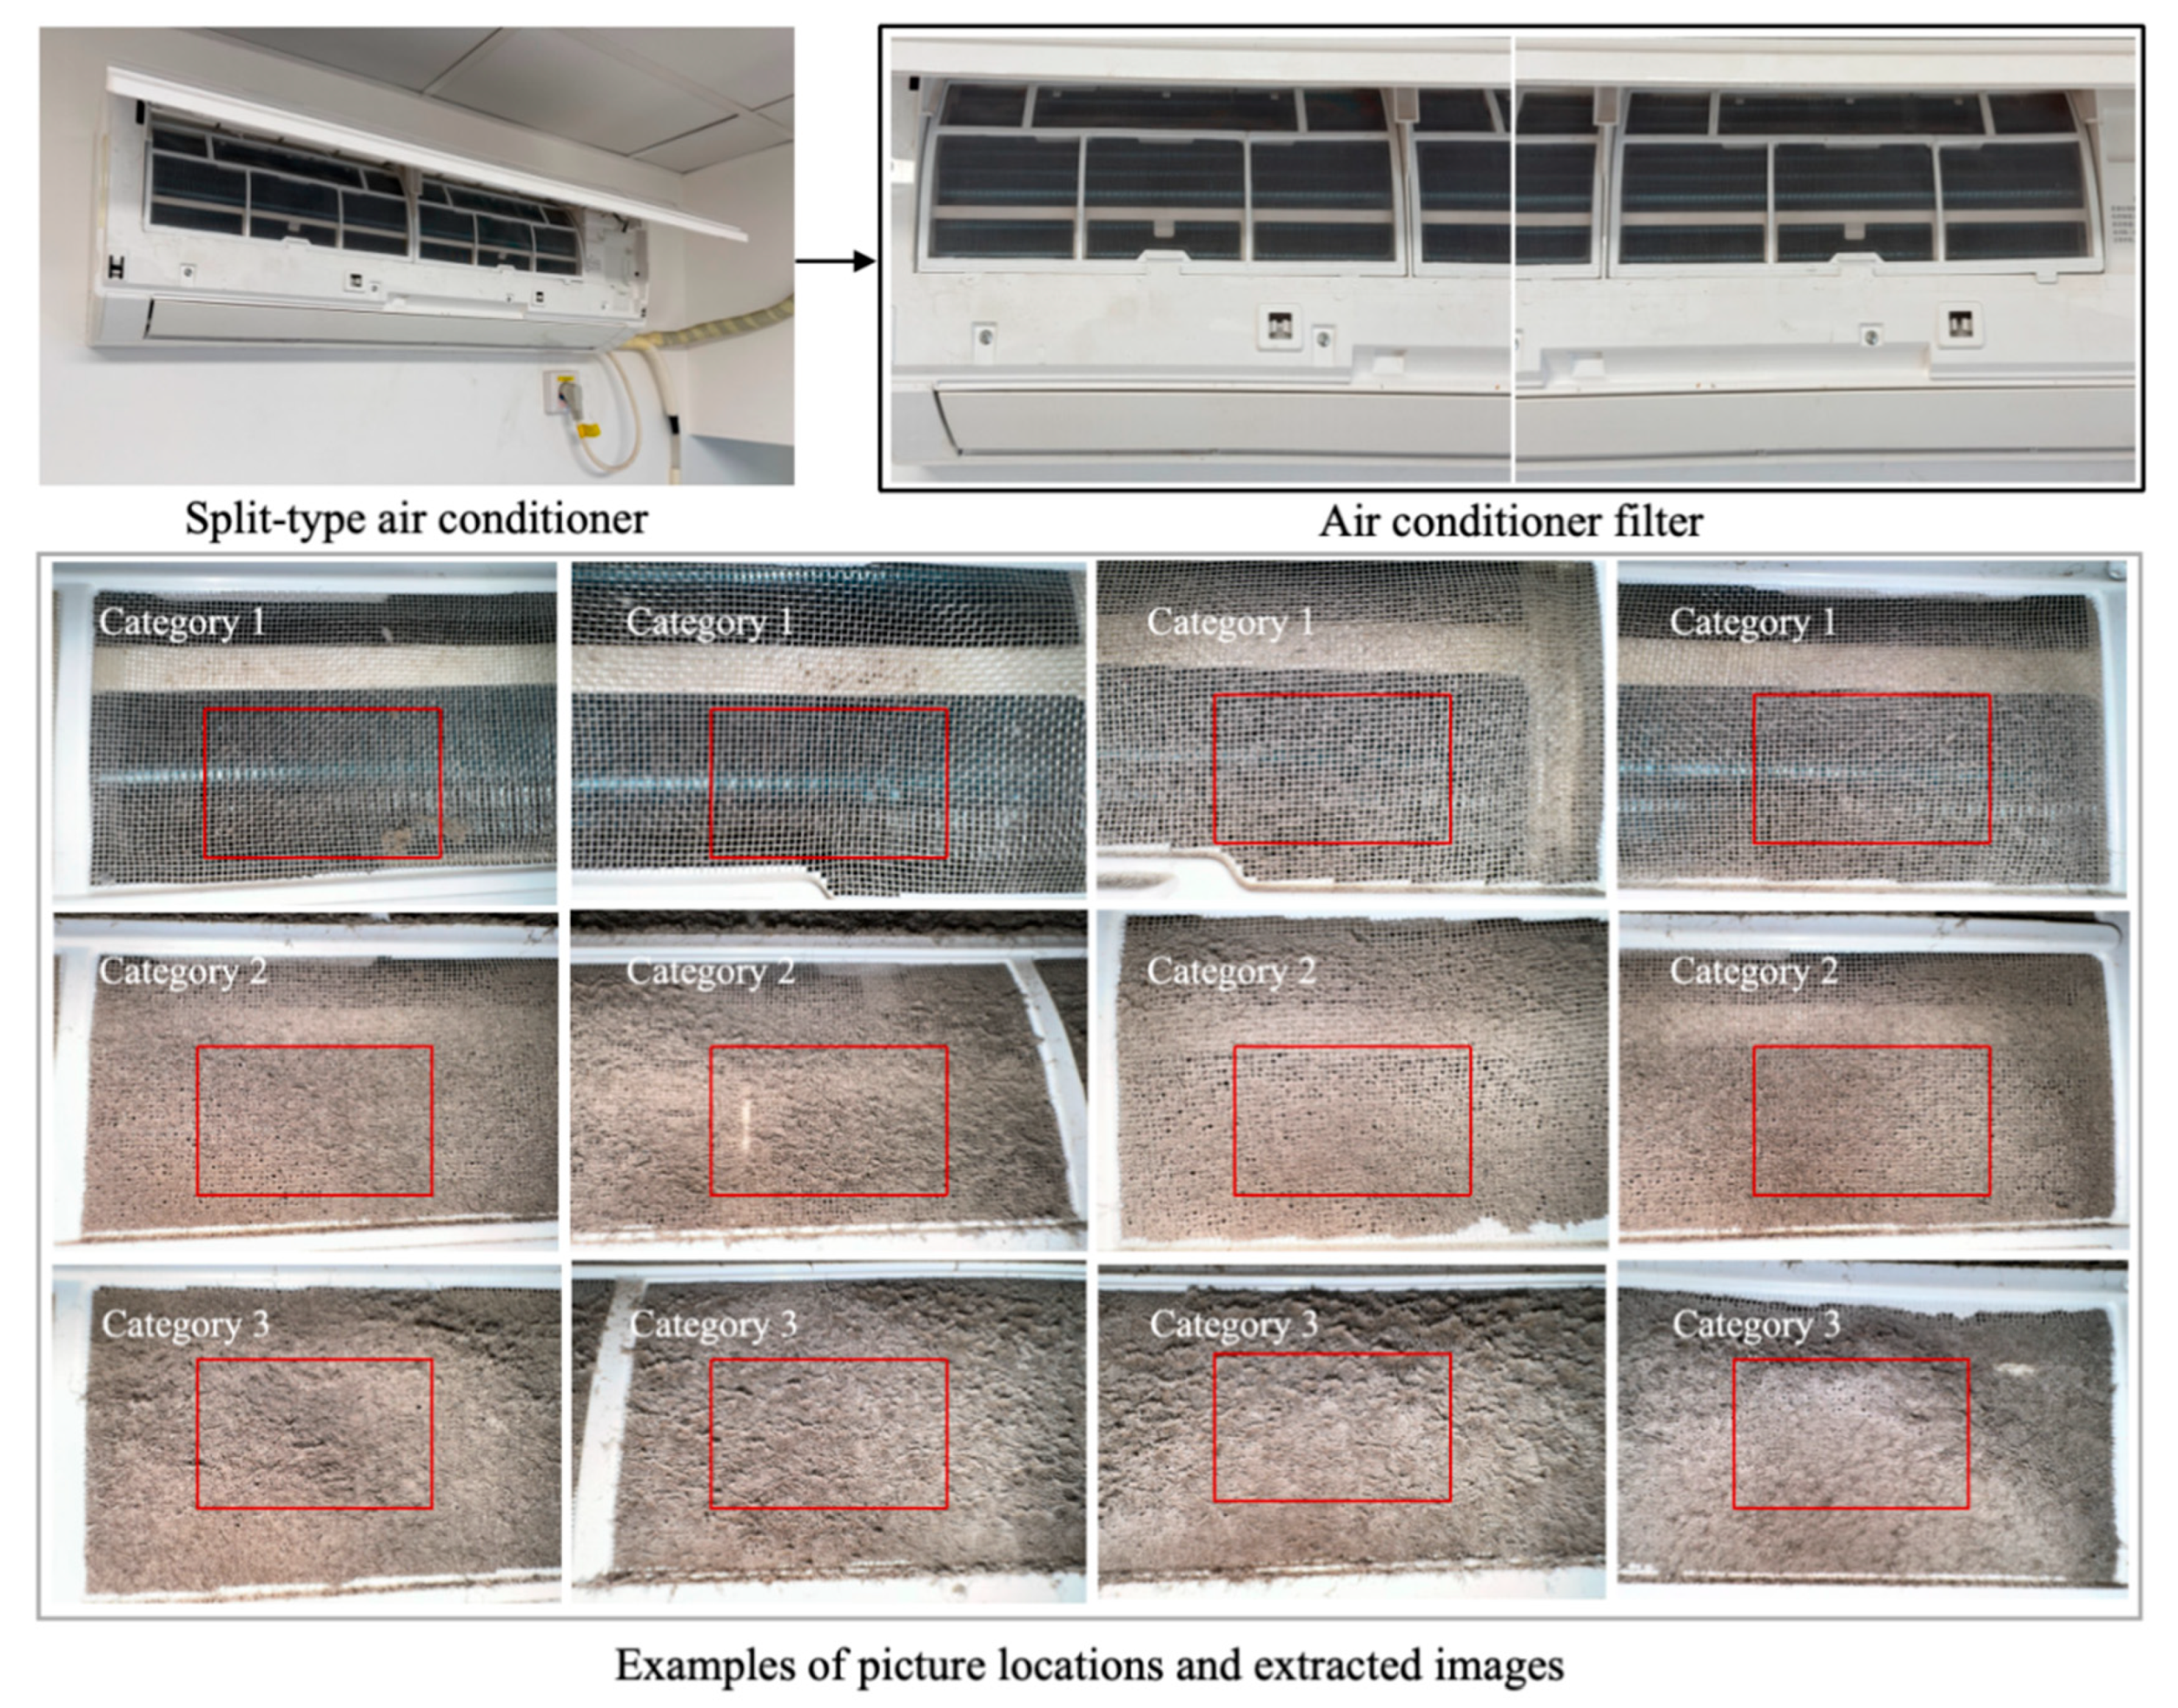
Mesh-grid filters were photographed under the following four scenarios: (1) newly installed, unused filters (Category 1 filters); (2) filters used in operation for about six months in university student dormitories (Category 1 filters); (3) filters of heavily used air conditioners in game rooms and internet cafes (Category 2 filters); and (4) aged, severely clogged filters collected from the second-hand home appliance recycling market (Category 3 filters). Examples of these filters are shown in Figure 1. For each filter, the maximum thickness of the dust spot was manually measured at the time of photographing. Filters with a thickness of <1 mm, 1–2 mm and >2 mm were grouped into Category 1 (mild dust accumulation), Category 2 (moderate dust accumulation) and Category 3 (severe dust accumulation), respectively.
Figure 1.
Examples of mesh-grid filters with different dust loadings and images (marked by red rectangular lines) taken by the camera.
2.1.2. Image Standardization and Dataset Partitioning
Original images (80 mm by 50 mm), centered on the effective filter area, were first automatically cropped using OpenCV boundary detection to remove peripheral frames and non-filter backgrounds. These preprocessed images were then cropped to a standard size of 420 × 420 pixels. Through manual screening, images with defocus blur, severe lens distortion, or significant reflection artifacts were discarded. In the end, 1225 images from each of the above-mentioned four scenarios (Section 2.1.1), i.e., a total of 4900 images, were selected as the standard sample dataset for this study. These 4900 images were divided into three independent datasets: a training set (4000 images), a validation set (400 images), and a test set (500 images). Specifically, the test set consisted of 125 randomly selected images from each filter group (see Section 2.1.1). To strictly prevent data leakage, the partitioning into training, validation, and test sets was performed based on individual physical filters rather than individual image frames. All photographic captures, standardized image patches, and lighting variants originating from a specific physical mesh filter were assigned exclusively to a single dataset split (either training, validation, or test), ensuring no overlapping physical filter entities across subsets. The test set was excluded from the model training and hyperparameter tuning processes, serving solely as a benchmark to evaluate the final convergence and generalization capability of the network.
To investigate the influence of sample size on the performance of the Residual U-Net, five groups of nested subsets of 500, 1000, 2000, 3000 and 4000 images were created for the training set, with corresponding subsets of 50, 100, 200, 300, and 400 images for the validation set, in an incremental manner. This was done by expanding the subset from one gradient to the next, where the incremental samples were acquired from the remaining sample pool via stratified sampling based on the four scenario categories and directly appended to the previous subset. This approach avoids potential oscillations in the data distribution caused by re-randomization.
2.1.3. Image Annotation, Mask Generation, and Data Linkage
Preprocessed 420 × 420 pixel standard original images (archived in a raw folder) were processed using a multi-step workflow comprising interactive image annotation, inter-annotator quality control, single-channel mask generation, and data linkage for network training.
- (1)
- Interactive Image Annotation Protocol
Image annotation was executed using a custom OpenCV-based graphical user interface (GUI) tool featuring a side-by-side view displaying the original image alongside a real-time annotation overlay. To reduce high-frequency noise from mesh-grid background fibers, input RGB images were converted to single-channel grayscale and smoothed using a 5 × 5 Gaussian kernel. An inverse binarization function was then applied to extract candidate dust regions, which were visually displayed in light green (RGB: 0, 200, 0) on the right-hand preview panel. Annotators manually fine-tuned the binarization threshold (defaulting to 85, with a step size of ±1). As the threshold was adjusted, the system calculated the dust area in real time. Once the light green overlay visually aligned with the physical boundaries of dust coverage, the annotation was submitted. The system automatically removed auxiliary interface elements and saved the clean process-labeled images into a marked folder.
- (2)
- Inter-Annotator Quality Control
To ensure annotation consistency, Cohen’s Kappa coefficient was calculated to evaluate the agreement between two independent annotators for each image. An annotation result was accepted into the official masks library only if its single-image Cohen’s Kappa coefficient exceeded 0.90. In cases where the initial coefficient fell below 0.90 or when spatial boundaries were disputed, a third senior researcher (the academic supervisor) acted as an independent arbitrator to moderate a consensus review and determine the final ground truth mask.
Furthermore, the robustness of the “worst-case” class assignment principle, which states that an image exhibiting heterogeneous dust deposition is categorized according to its maximum localized dust thickness, was rigorously verified. Assigning labels based on peak localized thickness ensures that critical airflow resistance bottlenecks and high-risk microbial breeding zones are never under-represented, establishing a robust, safety-conservative warning threshold for operational filter maintenance.
- (3)
- Binary Mask Generation
In the mask generation stage, a Python script converted the accepted threshold annotation images from the marked folder into single-channel binary masks at the original resolution (420 × 420 pixels). Dust-clogged regions were assigned a pixel scale value of 0 (black), while clean, unobstructed mesh areas were set to 255 (white). These generated single-channel masks were saved in a masks folder to serve as the ground truth for pixel-level semantic segmentation by the Residual U-Net.
- (4)
- Multi-Task Data Linkage
In the data linkage stage, index relationships between images and physical thickness data were established via CSV files (training_labels.csv and validation_labels.csv) stored in a thickness folder. Each row in the CSV files corresponded to an individual image, linking its unique identifier to its assigned three-tier dust thickness category label (defined in Section 2.1.1). By aligning the original images (raw), pixel masks (masks), and physical thickness labels, the network established a direct quantitative correlation between the visual morphological blockage of the filter mesh and the actual dust thickness during training.
2.2. Model Training and Performance Evaluation
2.2.1. Model Selection and Description
To identify the optimal baseline for dust segmentation under complex mesh-grid interference, we evaluated established semantic segmentation paradigms, including classic U-Net family variants and DeepLabV3+. Although DeepLabV3+ is widely recognized for multi-scale context capture using atrous spatial pyramid pooling (ASPP), its aggressive dilated convolutions and feature-map down-sampling often sacrifice low-level spatial detail, leading to continuous boundary degradation when segmenting sub-millimeter mesh threads. In contrast, symmetric U-shaped encoder–decoder architectures equipped with skip connections excel at recovering high-resolution geometric boundaries.
The Residual U-Net was ultimately prioritized because it integrates residual connections into the convolutional units of the traditional symmetric U-shaped algorithm, enabling identity mappings that allow gradients to propagate without loss [44]. This structure not only deepens the network to facilitate the extraction of semantic features related to varying dust thicknesses but also effectively mitigates interference from the filter’s inherent grid patterns and complex lighting conditions, thereby improving the recognition accuracy for the pixel-level three-class classification task.
2.2.2. Model Training and Strategies
Based on a shared feature encoder (see Section 2.2.4 U-Net Model Framework), the models incorporated dual-decoder branches for region segmentation and dust thickness classification, enabling the simultaneous acquisition of the spatial distribution of dust on the filter and its severity level. Leveraging the geometric axial symmetry of the filter mesh frame and the directional invariance of surface dust deposition, random horizontal flipping (with a probability of 50%) was introduced during the data input stage. This approach enhances the model’s generalization capability while reducing the workload associated with on-site sample acquisition. To ensure full reproducibility of the experimental results, a deterministic pseudorandom seeding protocol was employed during model training. Detailed hyperparameter settings are listed in Table 1.
Table 1.
Key hyperparameter settings for Residual U-Net model training.
Region segmentation loss (LSeg) and thickness classification loss (LThick) were used as indicators to evaluate model performance in segmentation and thickness classification, respectively. The total loss (LTotal), the sum of the two, was used to address the dual-branch, multi-task learning of the model [45,46].
Over the training period of 50 epochs, the U-Net algorithm automatically recorded the overall validation loss on the validation set for each epoch and determined the weight parameters corresponding to the epoch with the lowest loss as the final model for evaluation. Detailed implementation of the training protocol, hyperparameter configurations, and the complete model workflow are provided in Supplementary Method S1. To ensure robust training, online data augmentations (random flips and rotations), L2 regularization (1 × 10⁻⁴), and a cosine annealing learning rate schedule (decaying from 2 × 10⁻⁴ to 1 × 10⁻⁶) were implemented. The joint loss function weights were set to λSeg = 1.0 and λThick = 0.5.
2.2.3. Performance Evaluation Metrics and Efficiency Measurement
Three performance metrics were evaluated: dust area segmentation precision, thickness classification accuracy, and engineering computational efficiency. The specific calculation formulas for all metrics are summarized in Table S1 of the Supplementary Material. Regarding dust area segmentation precision, the intersection over union (IoU) and Dice coefficient were adopted as core indicators. Both quantify the geometric overlap between the dust area predicted by the model and the actual ground truth masks. For thickness classification, image-level classification accuracy (accuracy) was used as the standard, calculated as the ratio of images that were correctly assigned to their respective physical thickness levels (categories 1, 2, and 3) relative to the total number of evaluated images.
In terms of engineering computational efficiency, in addition to recording the training time required for model convergence, we focused on three hardware-level metrics: the number of network parameters (Params), giga floating-point operations (GFLOPs), and single-pass inference latency (latency). These metrics are critical for evaluating the operational feasibility of deploying the model on micro-edge computing units that can be integrated into split air conditioners in the future.
2.2.4. U-Net Model Framework
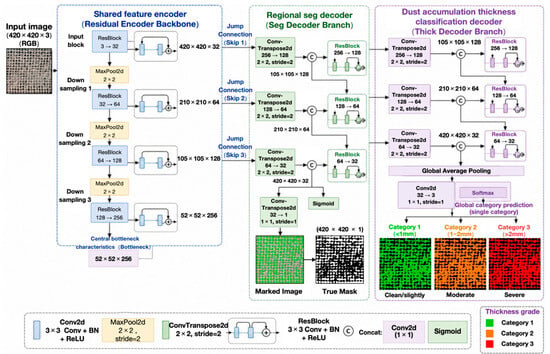
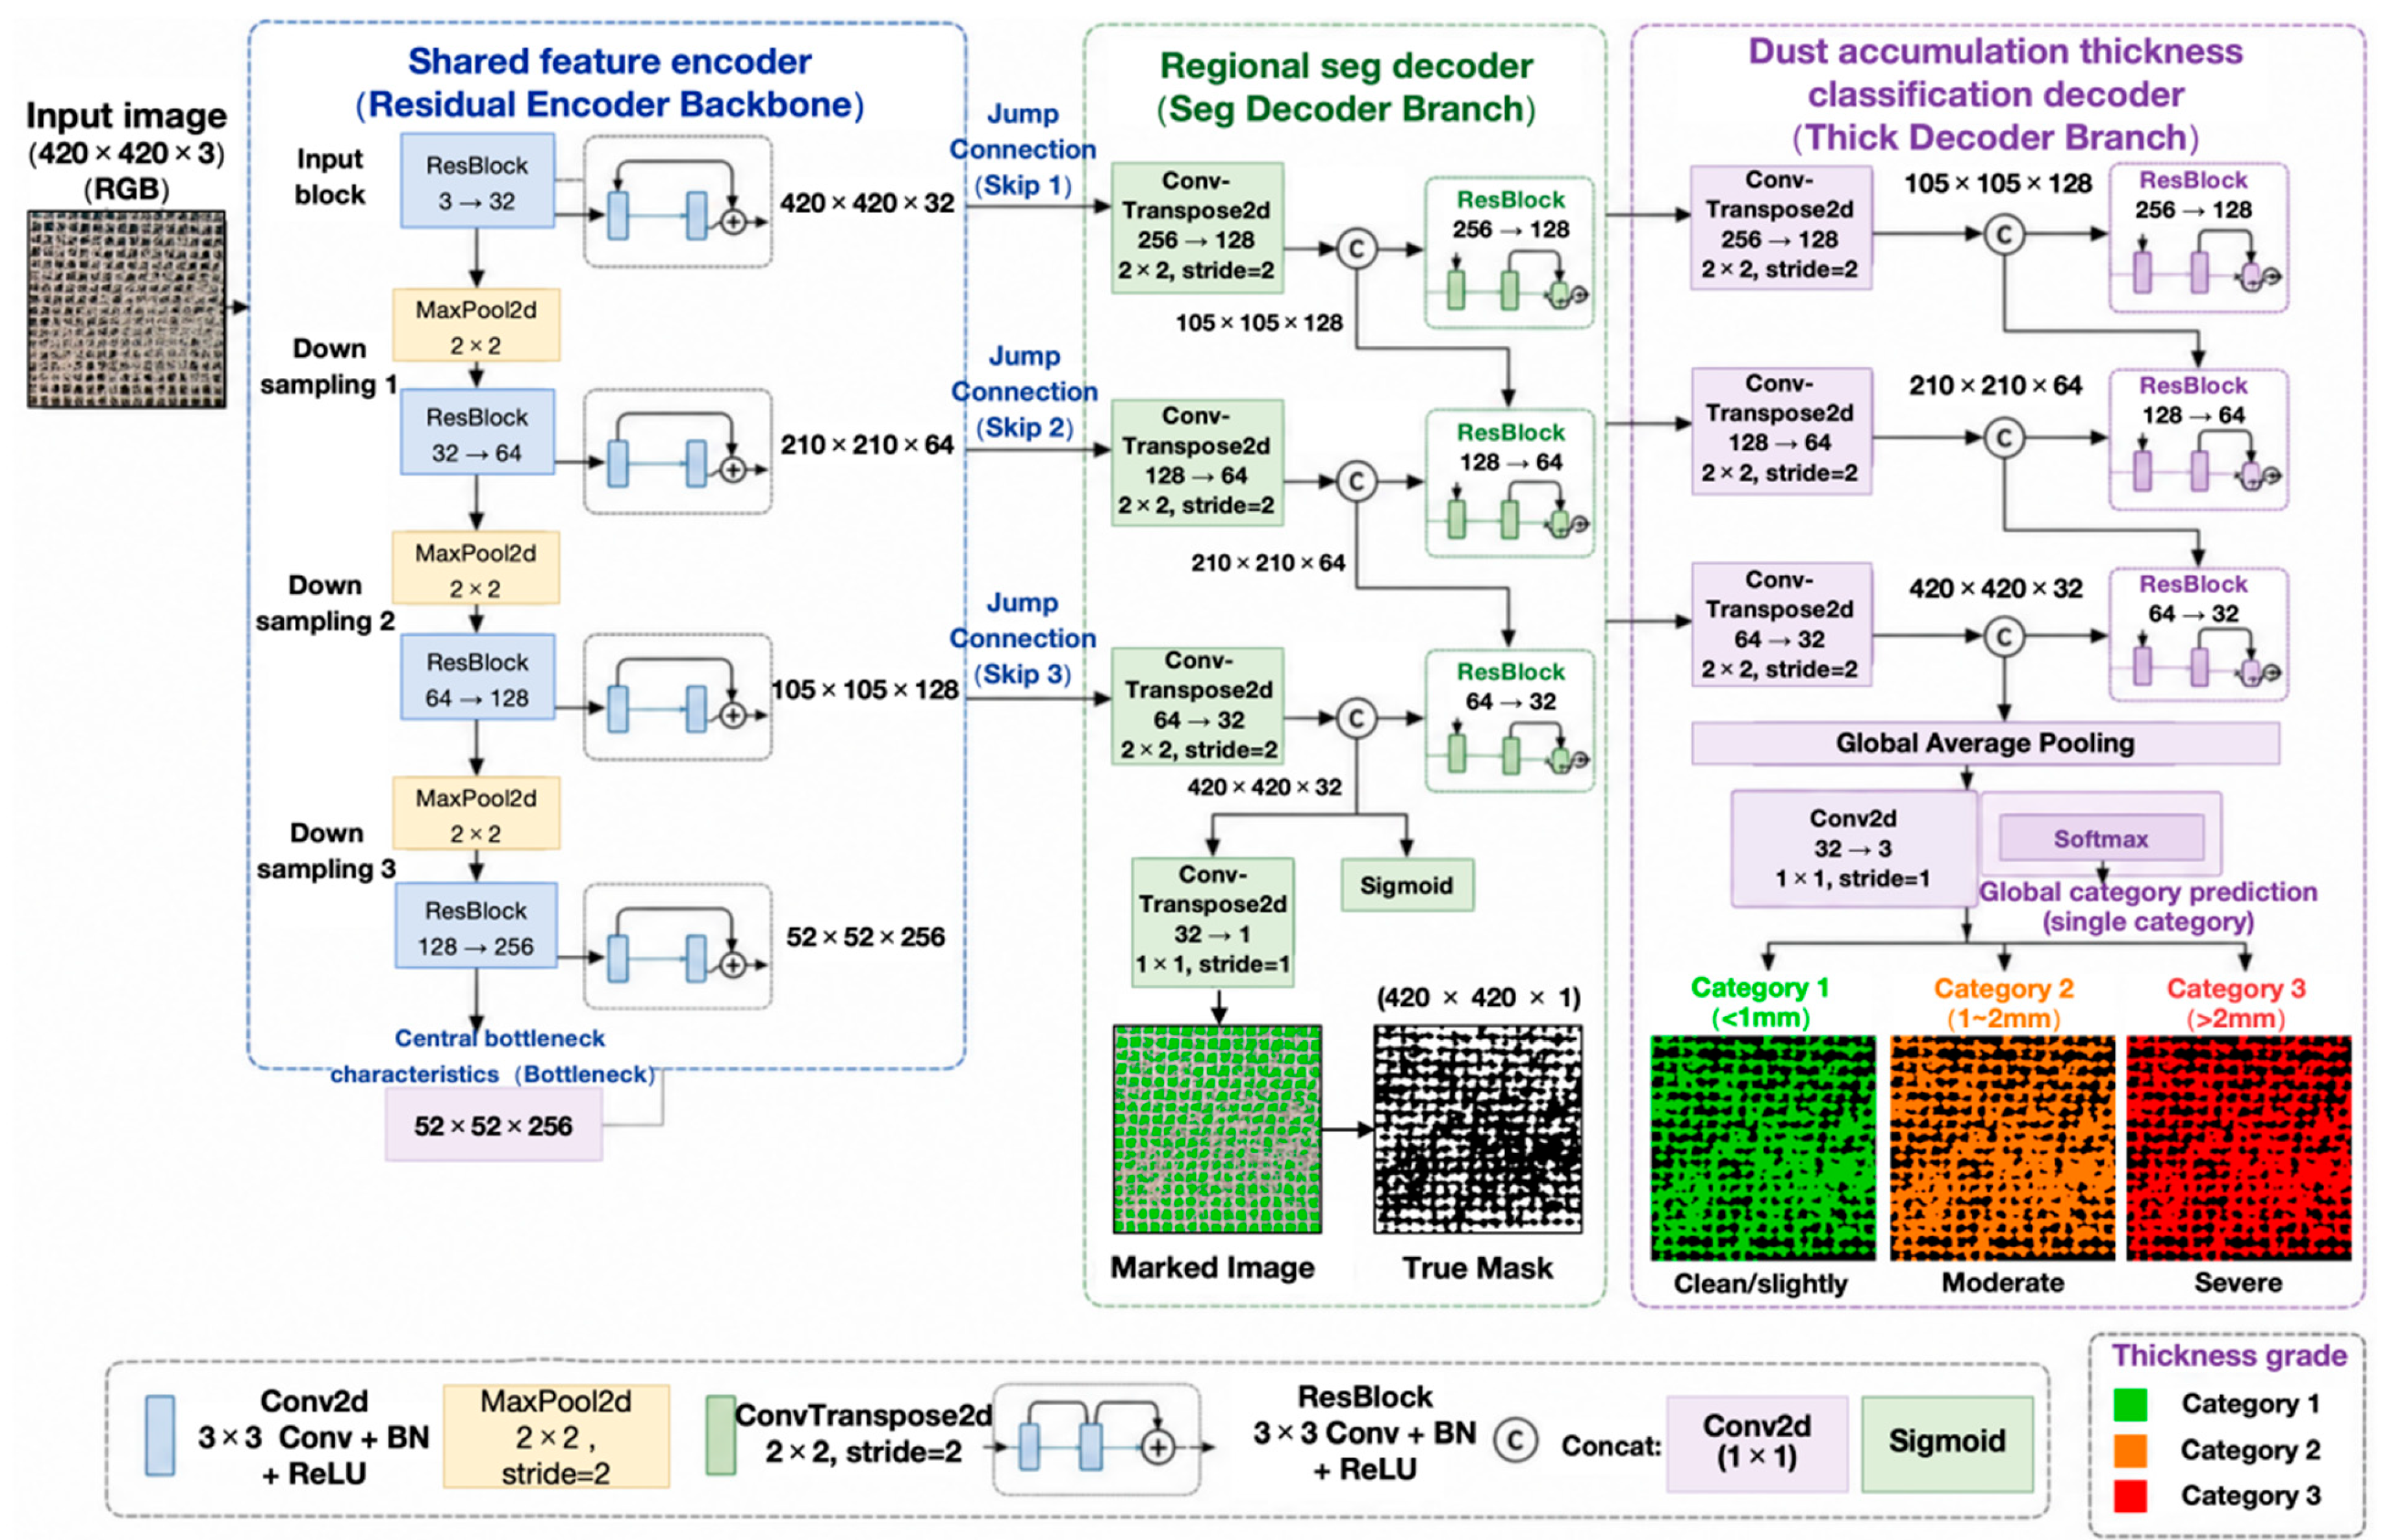
To address the complex mesh textures of air conditioning filters and the limitations of traditional segmentation networks in preserving spatial physical information during deep down-sampling, a dual-task parallel model framework, as illustrated in Figure 2, was used. The network comprises a shared residual feature encoder, a region segmentation decoder, and a dust thickness classification decoder.
Figure 2.
Framework of the proposed dual-task parallel Residual U-Net.
- (1)
- Shared Feature Encoder
The input consisted of preprocessed 420 × 420 pixel standard grayscale images. Departing from conventional single-layer convolution patterns, the encoder fully integrated residual convolution blocks (ResBlock). Each residual block contained two consecutive 3 × 3 convolution layers, a BatchNorm2d layer, and a ReLU activation function. An identity mapping skip connection (shortcut) was incorporated to ensure that low-level spatial information and boundary features are propagated to deeper layers without degradation. The encoder performed progressive down-sampling via three MaxPool2d layers. While the channel depth was incrementally increased (32, 64, 128), the feature matrix dimension was compressed to 52 × 52 × 256 at the central bottleneck, facilitating the preliminary extraction of both the global regular background of the filter mesh and the irregular distribution characteristics of foreign matter.
- (2)
- Region Segmentation Decoder
The segmentation branch received feature information from the central bottleneck and employed transposed convolution (ConvTranspose2d) for progressive up-sampling to reconstruct spatial details. To compensate for edge blurring caused by high-ratio down-sampling, the network utilized symmetric, balanced skip connections to concatenate (Concat) the low-level spatial features retained by the encoder at each stage with the up-sampled features. Residual convolution units were used to smooth the concatenated features. Finally, the output end utilized a 1 × 1 convolution layer followed by a sigmoid activation function to generate a 420 × 420 × 3 pixel-level probability mask, which was used to localize the specific physical regions of dust blockage on the filter.
- (3)
- Dust Thickness Classification Decoder
To achieve a quantitative assessment of the filter’s blockage severity while outputting its spatial distribution, the network incorporated an independent, parallel thickness determination branch. This branch maintained an isomorphic topology to the segmentation decoder, similarly leveraging transposed convolution and symmetric skip connections to progressively recover feature resolution. In the output layer, the branch employed a 1 × 1 convolution to produce a classification matrix with three output channels. Each channel in this matrix independently corresponded to one of the three physical dust thickness levels defined previously (Category 1: <1 mm; Category 2: 1–2 mm; Category 3: >2 mm). The output from this branch not only provided an overall blockage evaluation for the entire filter but also, when combined with the segmentation branch, enabled fine-grained discrimination of dust thickness variations across different local regions.
2.2.5. Evaluation Metrics for Filter Dust Blockage
Unlike in the case of contaminants on the smooth interior surfaces of air conditioning units, airflow restriction across a mesh-grid filter is physically dictated by the reduction in the effective opening area of the mesh. Initial dust deposition merely coats the surface of individual filter threads, leaving the opening apertures largely unobstructed. As dust layer thickness increases, dust particles bridge across adjacent filaments, progressively reducing the opening and eventually forming a continuous dust cake. A simple two-dimensional area ratio alone is physically insufficient to distinguish between minor filament surface coating and continuous dust cakes that completely occlude the mesh pores. Furthermore, a single-image classification label fails to capture the spatial details of local, non-uniform blockage.
To address this problem, this study integrated the dual-branch prediction results from the Residual U-Net to construct a filter dust accumulation index (DAI) intended for engineering warning purposes. It should be explicitly clarified that in the absence of direct aerodynamic pressure drop sensing across the photographic samples, the DAI is formally defined as a relative heuristic proxy metric rather than an absolute physical pressure calibration. For a single local sub-image, the calculation formula is defined as follows:
where Rseg ∈ [ 0, 1] represents the proportion of the dust-covered area within the image as detected by the segmentation branch of the network. The term ω(c) denotes the dimensionless thickness-based penalty weight determined by the thickness classification branch. ω(c) was assigned a weight of 0.2, 0.6 and 1.0 for dust thickness categories 1, 2 and 3 (Category 1 (<1 mm, median 0.5 mm), Category 2 (1–2 mm, median 1.5 mm), and Category 3 (>2 mm, representative thickness 2.5 mm)), corresponding to a physical thickness ratio of 1:3:5. By normalizing the weight of the most severe level (Category 3) to 1.0, the discrete penalty weights of 0.2, 0.6 and 1.0 were assigned to reflect the proportional increase in physical blockage severity.
DAI = Rseg × ω(c) × 100
2.3. Model Performance Testing
To rigorously evaluate the generalization ability and operational robustness of the trained Residual U-Net, an independent test set comprising 500 images (see Section 2.1.2) was deployed. To eliminate data leakage, these test images were strictly excluded from all training iterations and hyperparameter tuning procedures. During the testing phase, preprocessed 420 × 420 pixel images were fed into the model, without manual intervention or post-processing. For each input image, the dual-branch algorithm concurrently generated a pixel-level binary prediction map and an image-level thickness category label.
Performance metrics were then automatically computed across the entire test set. For the spatial distribution recognition, we focused on the parameters of intersection over union (IoU) and Dice similarity coefficient (Dice), quantifying the network’s capability to accurately delineate dust coverage despite complex lighting conditions and filter background interference. For the dust accumulation degree assessment, we focused on classification accuracy, calculating the network’s success rate in determining the dust thickness classification (Categories 1, 2, and 3) of unseen images. Furthermore, a classification error matrix (confusion matrix) was established based on these 500 independent test samples to systematically analyze the granular error distribution across Category 1, Category 2, and Category 3.
3. Results
3.1. Performance of Five Dual-Branch U-Net Models
As the first step, we evaluated five dual-branch U-Net models for the selection of the most suitable model for this application. All five models were trained using a moderate-scale training set of 1000 images paired with a validation set of 100 images (a strict 10:1 ratio). Screening models on a moderate sample size prevents massive training data from masking structural representation flaws. Model training relied solely on the validation set for hyperparameter optimization and early stopping.
Table 2 summarizes the performance comparison of the five dual-branch U-Net algorithms. The five evaluated U-Net models all demonstrated extremely high thickness classification accuracy (97–98%), except for Mobile U-Net (93%). However, Residual U-Net had the lowest discriminative error (total loss = 0.24). It also achieved the highest IoU (82%) and Dice (91%) in spatial segmentation tasks, indicating that the residual connections effectively preserved the physical boundary information of the filter mesh, enabling more accurate discrimination between complex flocculent dust and background grids.
Table 2.
Performance comparison of five different U-Net models.
Significant differences were observed in hardware computational requirements among the models. Mobile U-Net reduced the parameter count to 0.62 M using depthwise separable convolutions, while the standard U-Net exhibited the fastest single-inference latency (2.66 ms). In contrast, despite its relatively higher parameter count (2.82 M) and computational complexity (18.53 GFLOPs), the Residual U-Net maintained a forward inference latency of 3.27 ms on the graphical computing platform used.
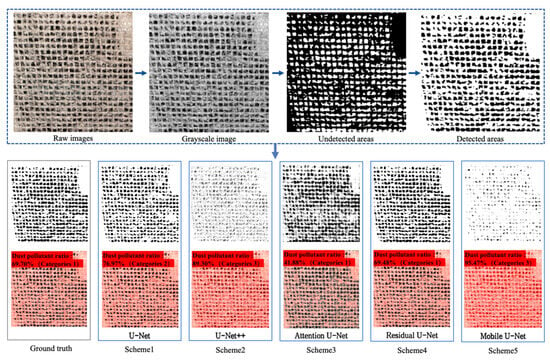
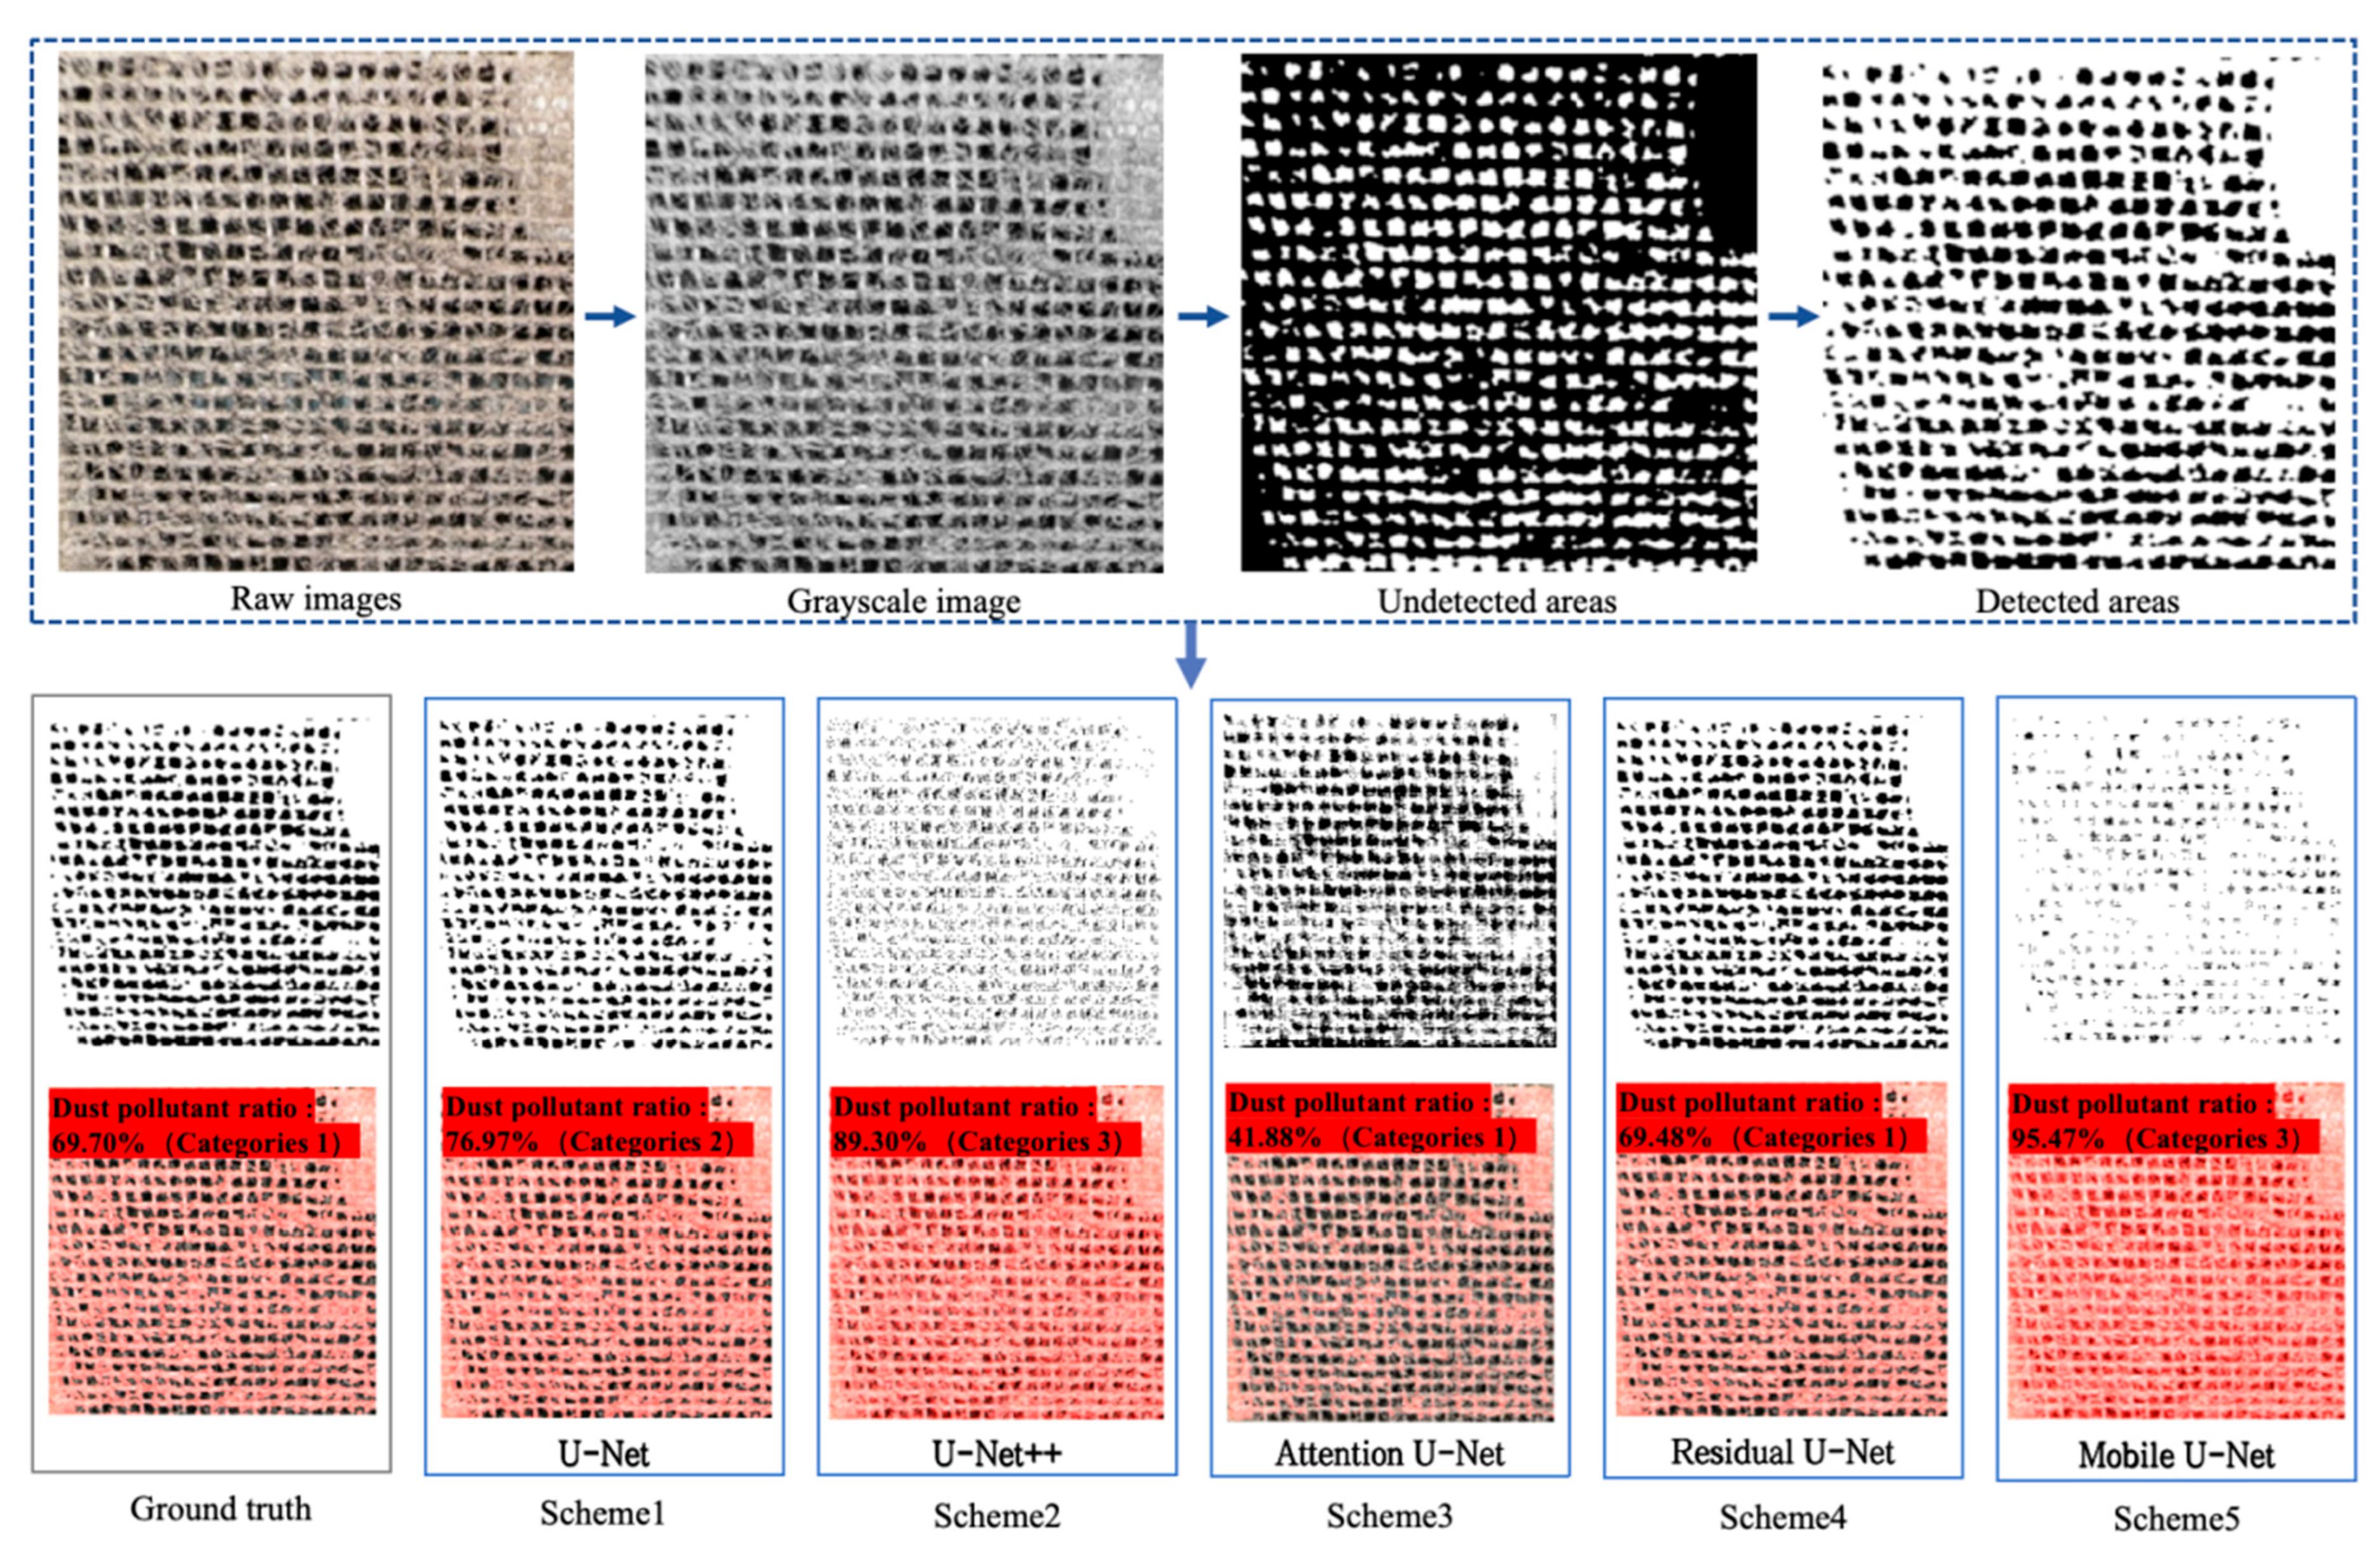
A qualitative analysis of the segmentation masks and thickness classification results, as shown in Figure 3, demonstrates that the predictions from the Residual U-Net (Figure 4) exhibit the highest concordance with the ground truth in both the dust pollutant ratio (69% predicted vs. 70% ground truth) and the thickness classification task (correctly predicting the matching Category 1). These qualitative comparisons further confirm that, by leveraging its residual connection mechanism, the Residual U-Net effectively mitigates visual interference from complex mesh backgrounds, accurately discriminates between clean pores and accumulated dust, and achieves the best overall performance in the dual-branch filter blockage assessment task.
Figure 3.
Comparison of dust accumulation masks and identification results of the five models against the ground truth.
Figure 4.
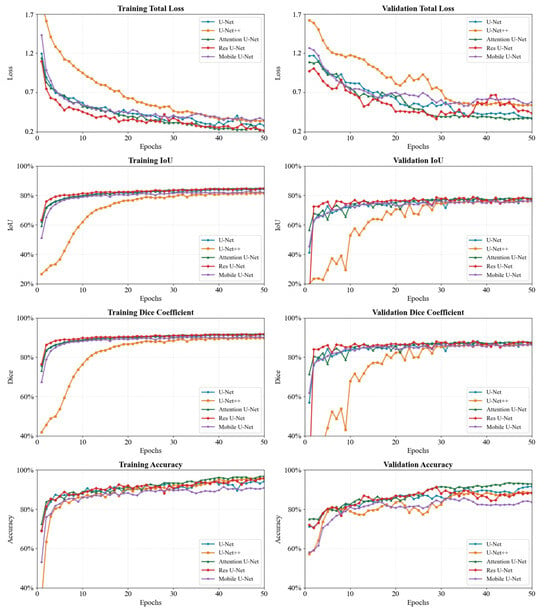
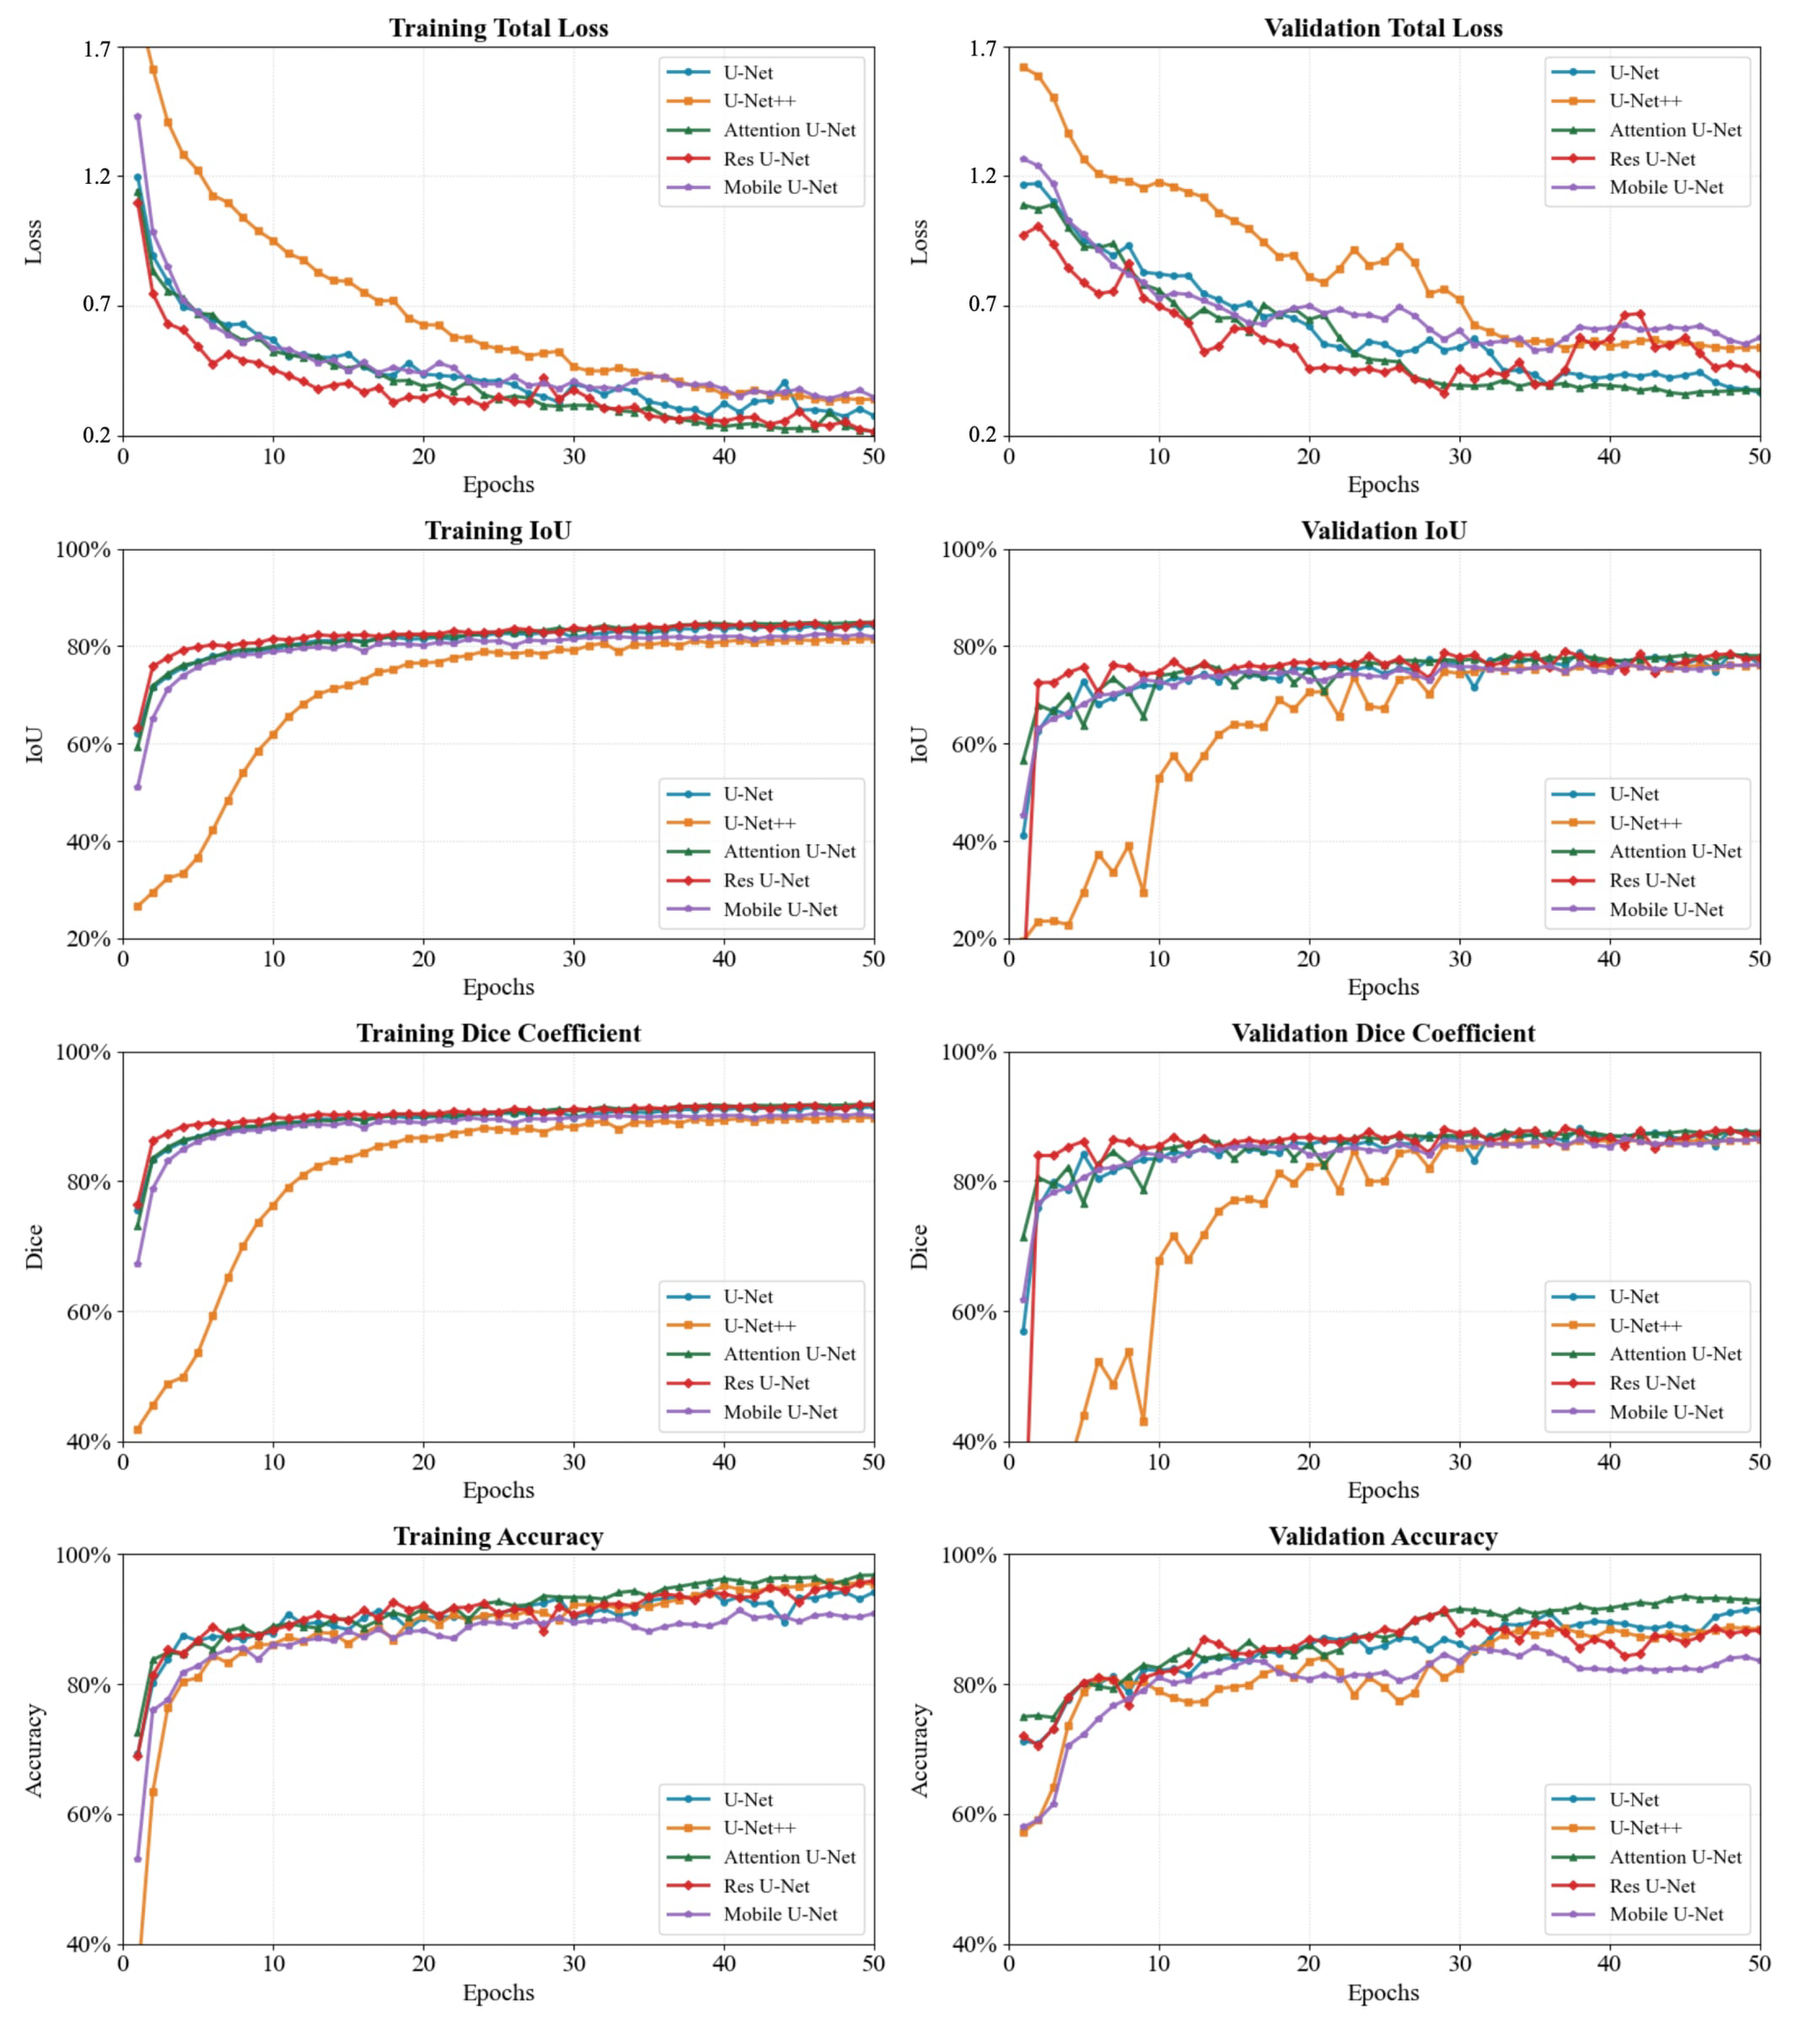
Comparison of training and validation performance metrics for the five U-Net variants over 50 epochs.
Figure 4 illustrates the performance metrics across the five U-Net models. Detailed training and validation curves for segmentation and thickness losses are provided in Supplemental Figure S2. The validation curves for both total loss and segmentation loss indicate that the Residual U-Net exhibits superior training efficiency and convergence stability. Within the first 10 epochs, the validation error of the Residual U-Net declined rapidly, ultimately reaching its global minimum between the 35th and 40th epochs. The validation curves for intersection over union (IoU) and the Dice coefficient further corroborate the robustness of the residual algorithm. The validation Dice curve of the Residual U-Net showed the most rapid recovery in the initial stage and maintained exceptional stability upon reaching the plateau phase, consistently hovering around 90%. In the dust thickness classification task, the validation curves for classification accuracy displayed fluctuation patterns distinct from those observed in the segmentation task. While the segmentation metrics tended to smooth out during the plateau phase, the classification metrics exhibited intense oscillations throughout the entire training cycle. The network’s heightened sensitivity to micro-variations in samples resulted in wide oscillation amplitudes in the validation classification curves across all five models. Despite these overall fluctuations, the classification accuracy of the Residual U-Net remained stable above 90% after 30 epochs, with no evidence of performance degradation resulting from overfitting.
3.2. Performance of Residual U-Net Under Different Sample Sizes
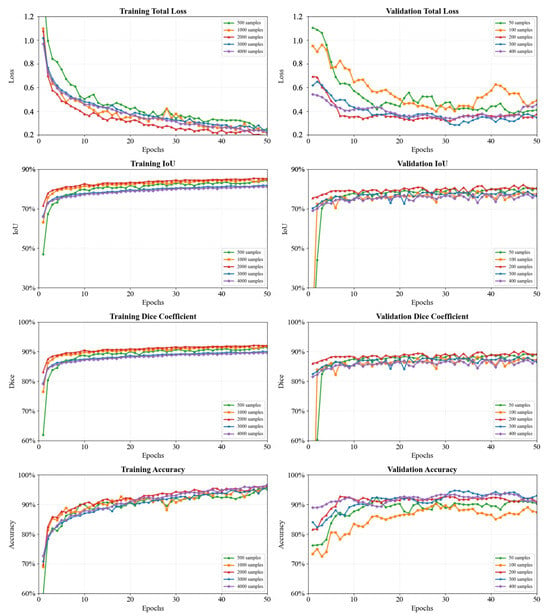
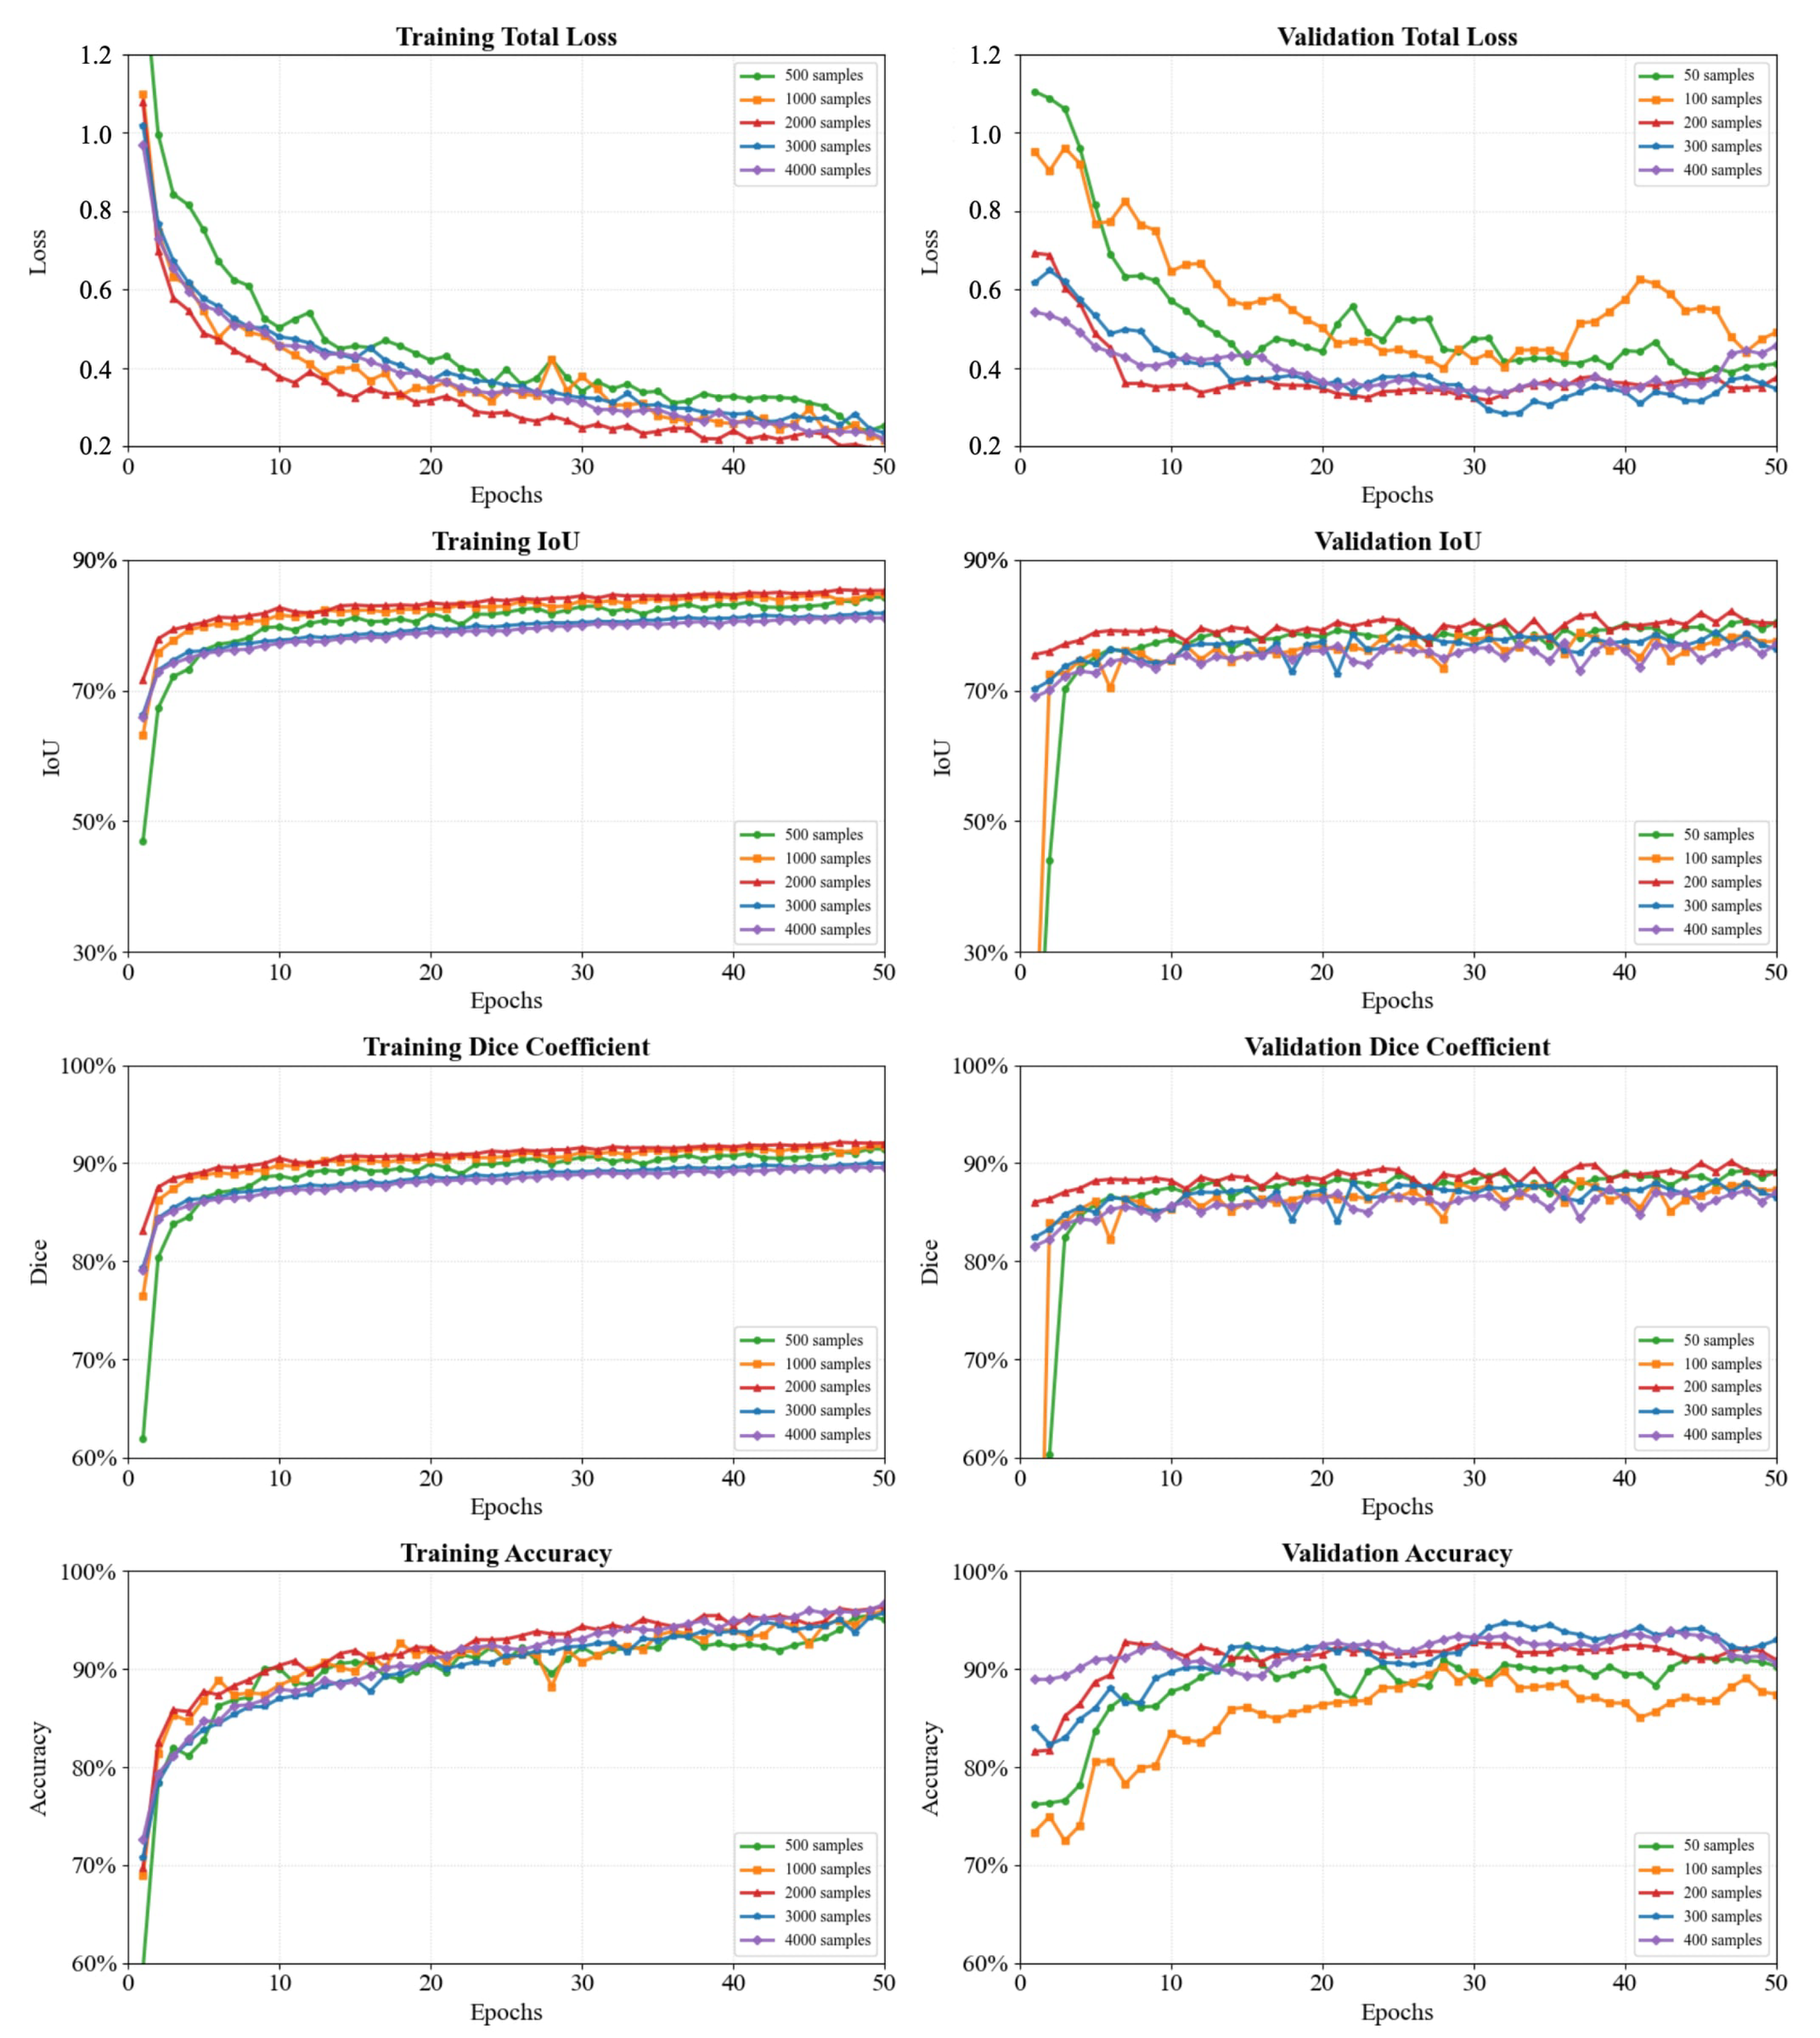
Since the Residual U-Net demonstrated the best performance overall, it was selected for this study. The performance of the Residual U-Net model was further evaluated across five different sample sizes (500:50, 1000:100, 2000:200, 3000:300, and 4000:400) to understand the effects of sample size. The results are presented in Figure 5. While model performance generally improves with increasing dataset size, the gains begin to exhibit diminishing returns once the sample size exceeds 2000. It can be observed from the validation total loss curves that the 500- and 1000-sample groups exhibited intense numerical oscillations throughout the training cycle, with relatively high error baselines, indicating that small-scale data are insufficient to capture the diversity of complex lighting and dust morphologies on actual filters.
Figure 5.
Performance of the Residual U-Net under different training sample sizes (Left: Training dataset; Right: Corresponding validation dataset).
When the sample size was expanded beyond 2000, the validation total loss values decreased rapidly and converged to a very low level. As detailed in Supplemental Figure S3, both the validation segmentation loss and thickness classification loss reached their lowest values among the five sample sizes (0.12 and 0.10, respectively), demonstrating exceptional convergence stability across both multi-task branches.
The dataset containing 2000 training samples and 200 validation samples achieved a stable validation Dice score (>89%), outperforming the 3000/300 dataset (which exhibited Dice fluctuations around 86%). Although the validation thickness accuracy of the 3000/300 dataset (93%) was slightly higher than that of the 2000/200 dataset (92%), its validation total loss (0.30) was also higher than the latter (0.28). These results indicate that expanding the dataset beyond 2000 samples introduces redundancy, potentially leading to overfitting and diminished returns. Therefore, the 2000-sample dataset was selected as the optimal size.
This optimization of sample size, by balancing data diversity and model complexity, further mitigates overfitting, avoids over-parameterization and data redundancy, and prevents the inflation of training metrics.
3.3. Reliability of Residual U-Net Performance
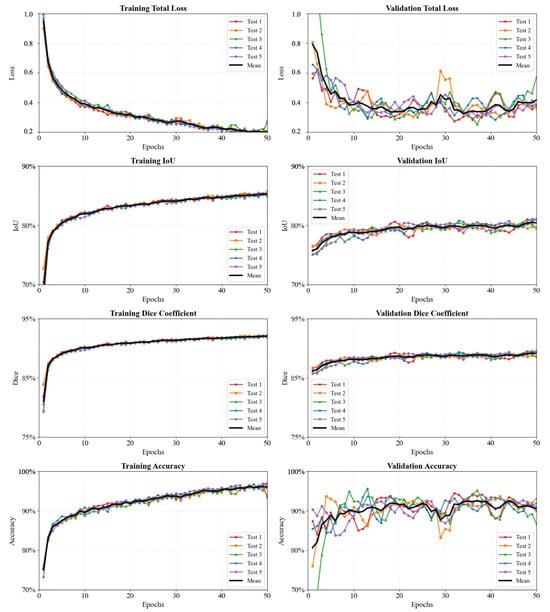
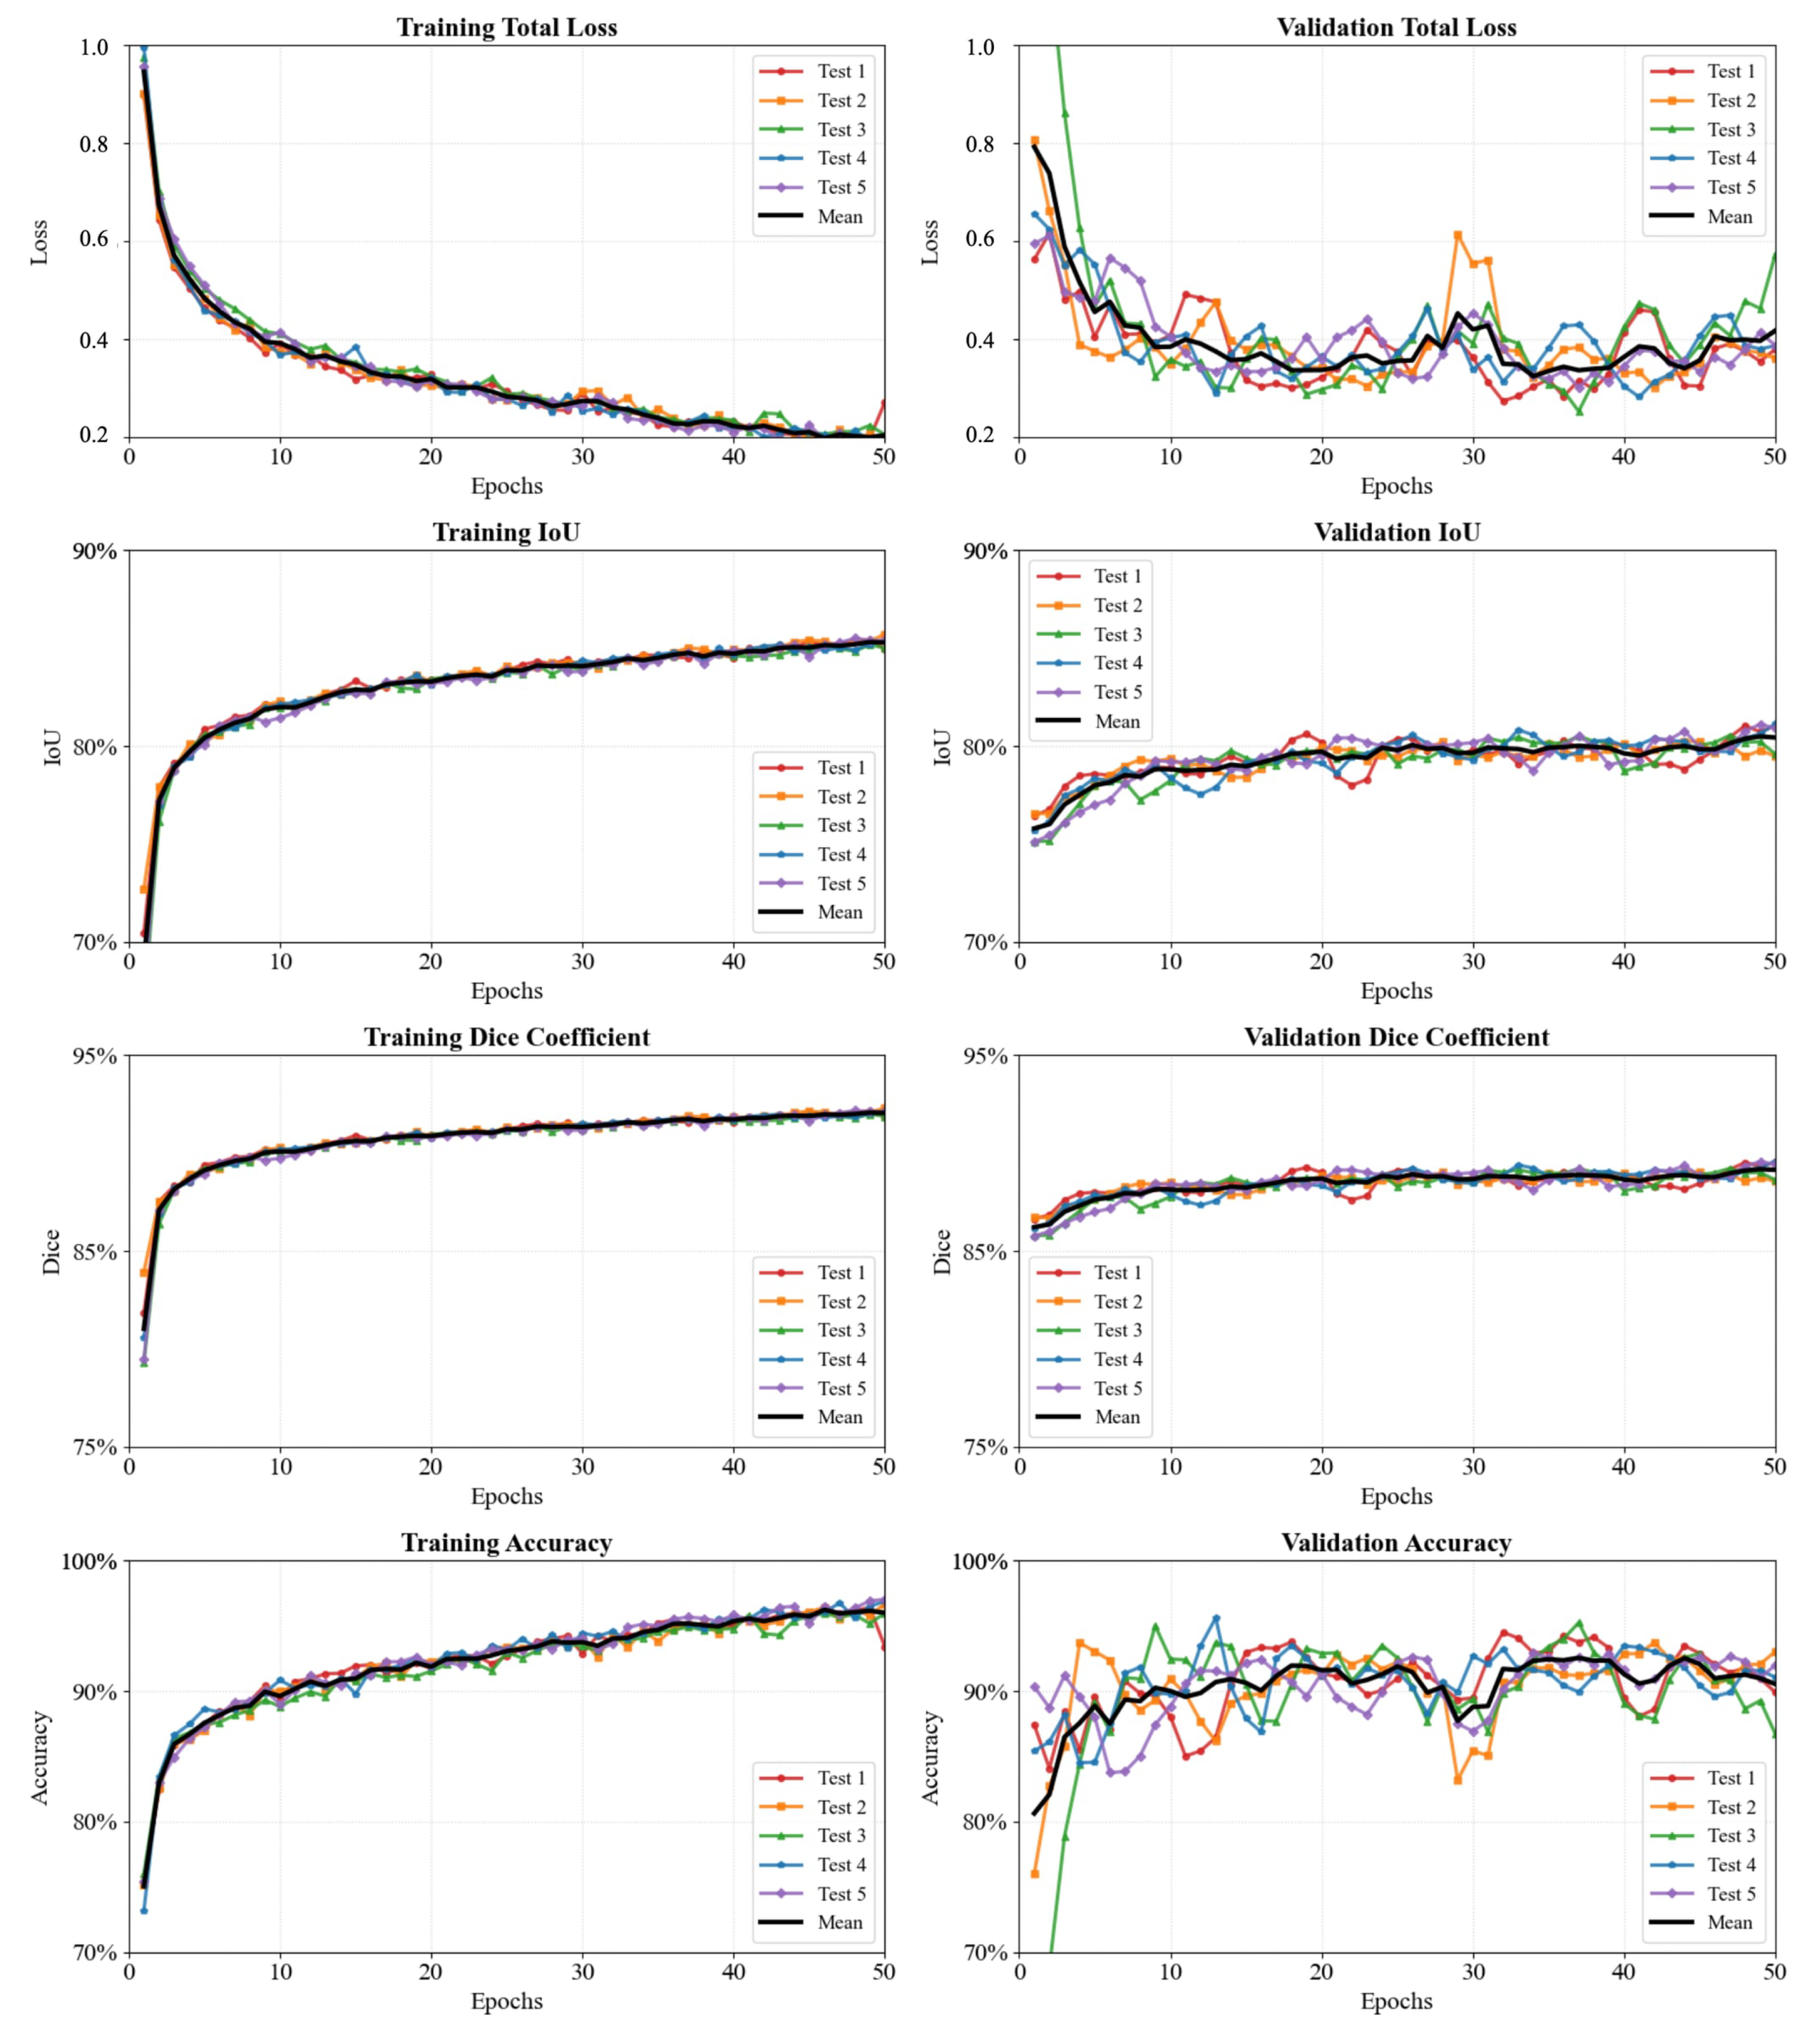
To verify the reliability of the reported performance and exclude potential bias arising from stochasticity, we conducted five repeated independent trials using the optimal 2000-sample configuration. Across the five repeats, the validation Dice coefficient of the Residual U-Net remained consistently above 87%, achieving a mean of 88% with a standard deviation (SD) of merely 1%. Furthermore, the standard deviations for all performance metrics, including total loss, segmentation loss, thickness loss, segmentation IoU, Dice coefficient, and thickness classification accuracy, did not exceed 2% (Table S2, Supplementary Materials). These results confirm that the observed high performance is not a consequence of random weight initialization but rather an intrinsic, stable, and reproducible characteristic of the proposed model, thereby effectively mitigating stochastic bias in model evaluation.
Throughout the 50-epoch training phase (Figure 6, left set of subplots), the performance curves of the five repeats exhibited high consistency and almost complete overlap. Following a rapid optimization phase within the first 10 epochs, the training loss and accuracy metrics (IoU, Dice, and thickness classification accuracy) demonstrated smooth convergence. During the validation phase (Figure 6, right set of subplots), they exhibited slightly wider oscillation amplitudes in specific epochs compared to the training phase, particularly in thickness loss and classification accuracy, along with a modest generalization margin relative to the training baselines. These fluctuations and the modest generalization margin are primarily attributable to the smaller sample size of the validation set (200 images) and evaluation on unseen filter geometries, while the bounded performance gap confirms that the model maintained robust generalization capability without severe overfitting.
Figure 6.
Reliability and reproducibility analysis of the Residual U-Net across five independent training trials using 2000 training and 200 validation samples.
3.4. Qualitative Case Study of Residual U-Net Performance
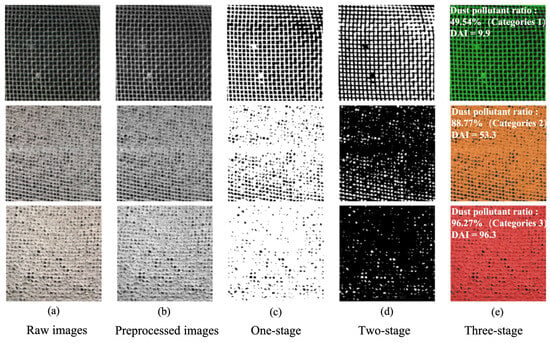
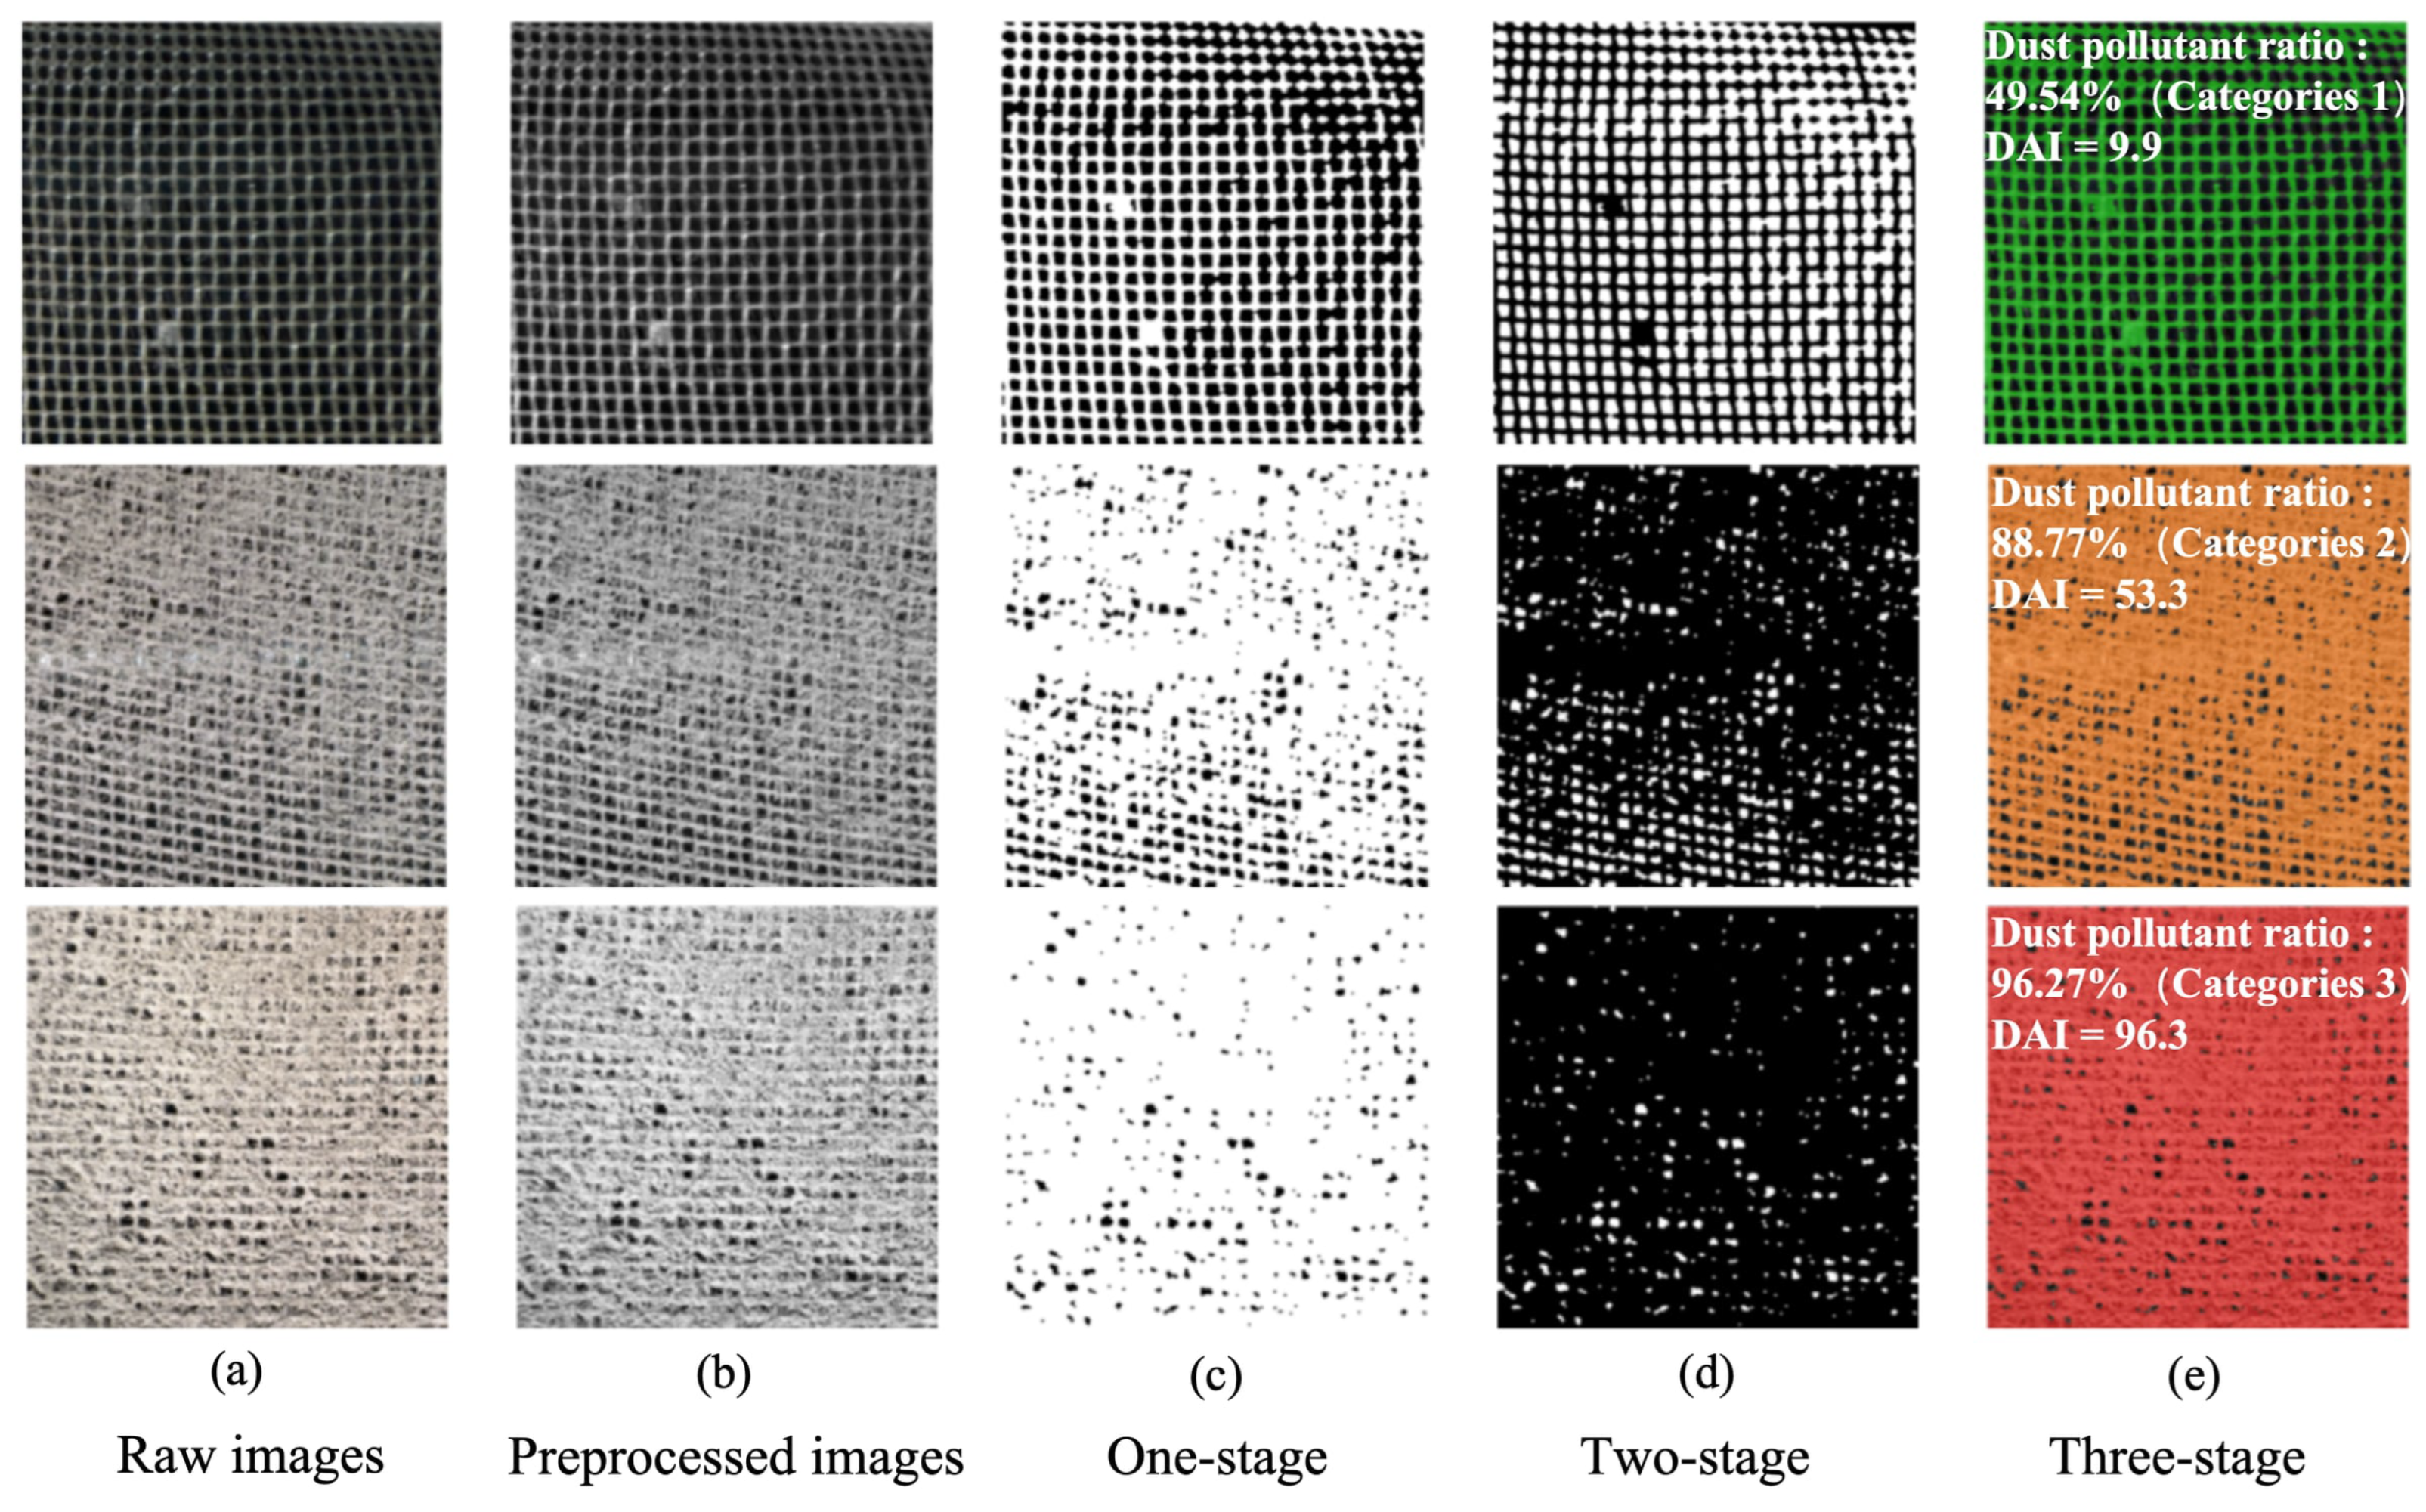
Figure 7 illustrates the identification and classification process of the Residual U-Net model under three representative dust accumulation scenarios: mild (Category 1), moderate (Category 2), and severe (Category 3). The model’s predictions are highly consistent with the visually observed physical blockage. In the mild accumulation (Category 1) scenario (Figure 7, top), where only a thin layer of dust is attached to the mesh threads, the model measured a blocked area ratio of 49.5% and calculated a DAI of 9.9 (49.5% × 0.2). Considering that the intrinsic mesh threads of the filter occupy approximately 45% of the planar area, this correctly reflects a mild dust accumulation. As the flocculent dust accumulation intensifies, transitioning to the moderate accumulation (Category 2) scenario (Figure 7, middle), the model measured a dust-blocked area of 88.7% and determined it to be of moderate thickness, with a DAI value of 53.3 (88.7% × 0.6). In the severe dust accumulation (Category 3) scenario, characterized by dense, caked dust deposits (Figure 7, bottom), minimal effective ventilation pores remain. The model detected a dust-blocked area of 96.3%, assigned the highest severity level, and calculated a DAI of 96.3 (96.3 × 1.0). These real-world cases demonstrate that the proposed dual-branch algorithm is capable of not only accurately delineating the spatial distribution of dust and calculating the dust pollutant ratio but also integrating thickness estimation to classify the dust accumulation degree (Categories 1–3) and compute the comprehensive DAI.
Figure 7.
Examples of dust identification and thickness classification on filters under mild (top), moderate (middle), and severe (bottom) accumulation scenarios. (a) Original images; (b) grayscale preprocessed images; (c) first-stage segmentation images; (d) second-stage mask images; and (e) third-stage integrated classification results with DAI values.
3.5. Model Performance on the Independent Test Set
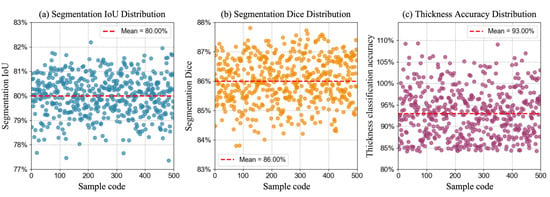
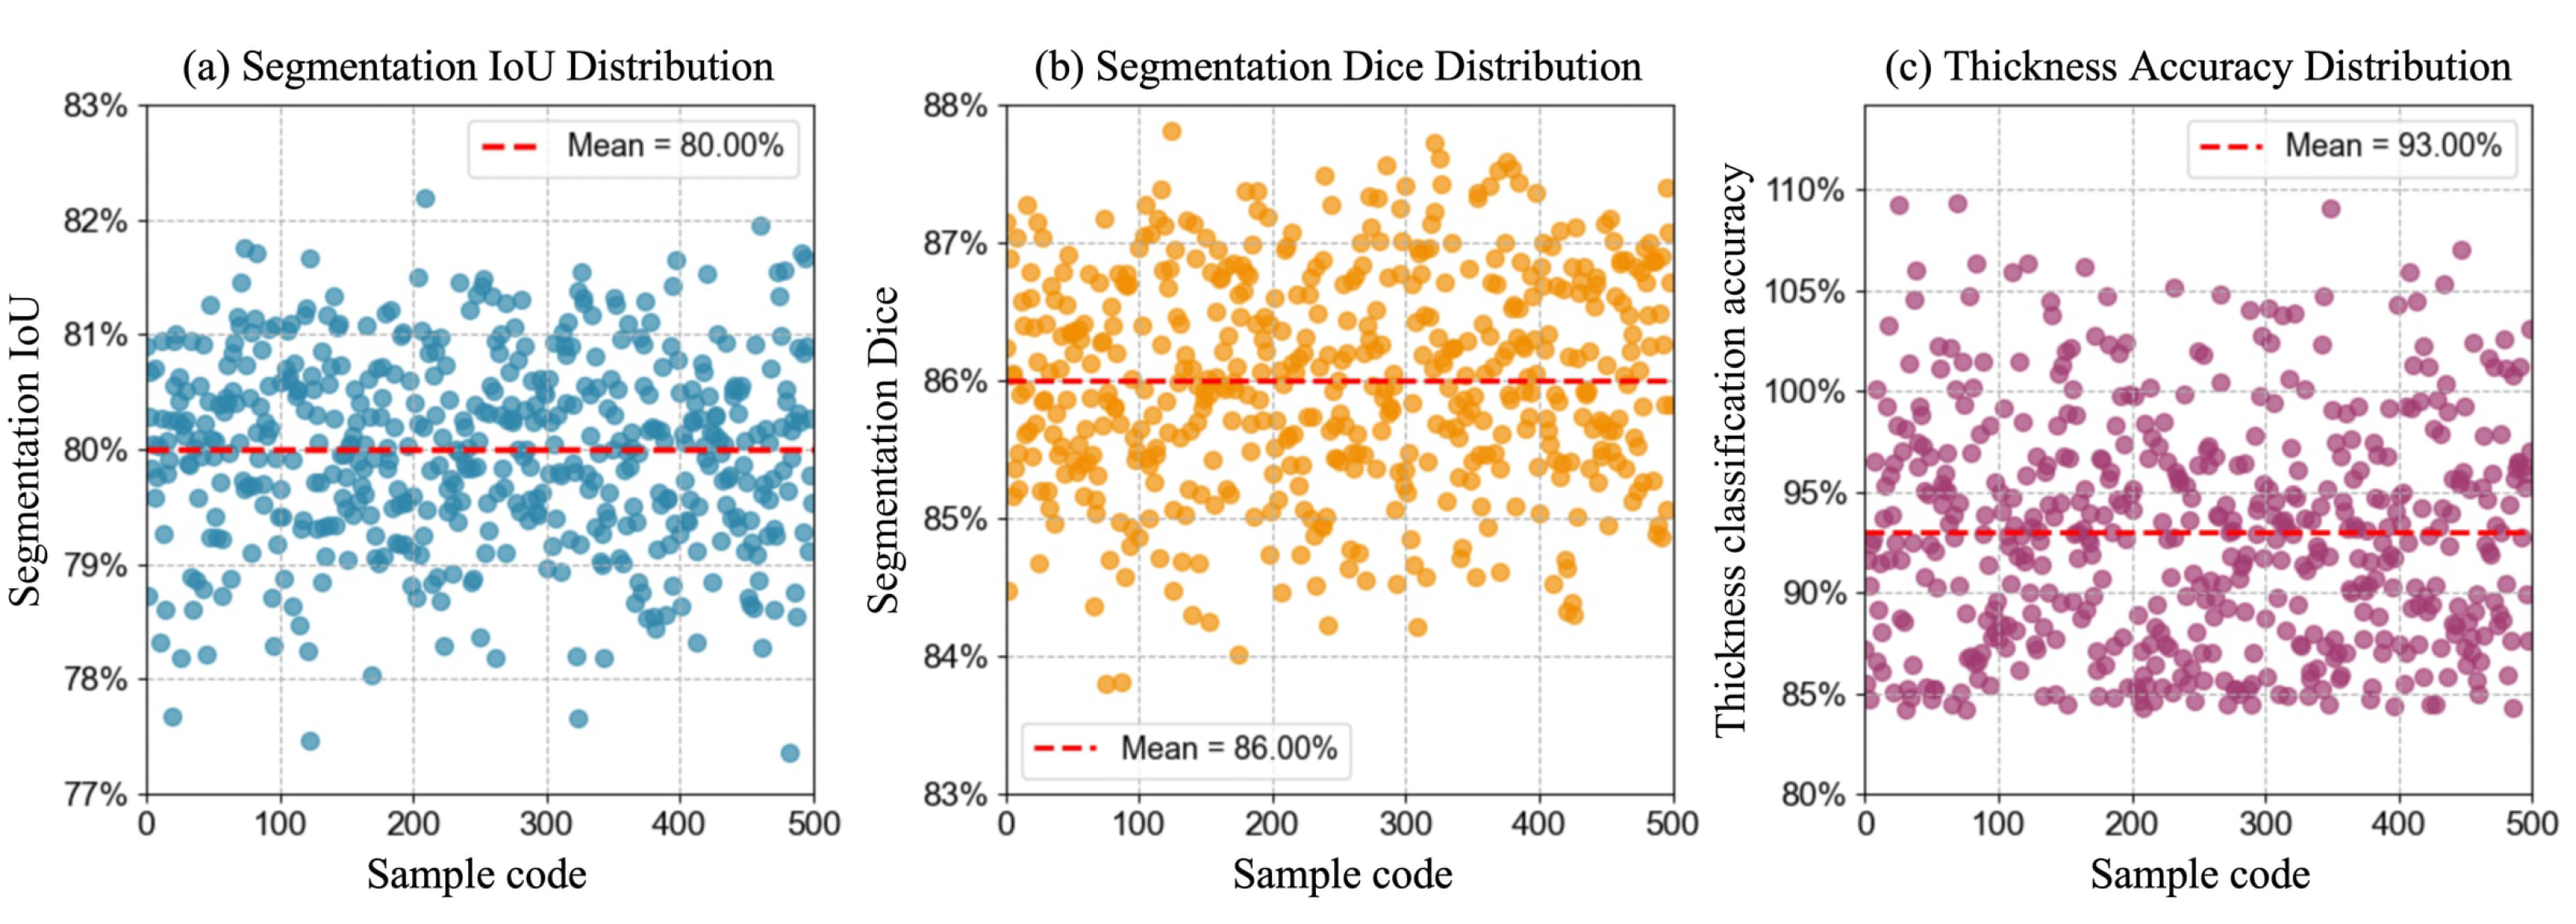
Evaluation on 500 real-world test samples demonstrates that the Residual U-Net maintains robust feature extraction and thickness classification capabilities for the images independent of the training and validation sets. As shown in Figure 8, the core performance metrics of mean intersection over union (IoU), mean Dice coefficient, and mean thickness classification accuracy reached 80%, 86%, and 93%, respectively. The scatter plot distribution of these 500 samples reveals that the metrics are highly clustered, exhibiting minimal variance with no significant low-score outliers. Compared to the optimal metrics observed during the validation phase (IoU of 82%, Dice of 88%, and accuracy of 97%, as shown in Table 2), only marginal performance declines were observed.
Figure 8.
Distribution of performance metrics for 500 independent test samples. (a) Segmentation IoU; (b) segmentation Dice; (c) thickness classification accuracy.
Across five independent training trials and the independent test set of 500 unseen samples, the model demonstrates exceptional training stability and reproducibility across both dust area segmentation and thickness classification tasks. On the training set, the segmentation IoU, Dice coefficient, and thickness classification accuracy reached 82 ± 1%, 88 ± 1%, and 97 ± 1%, respectively. Corresponding metrics for the validation set were 81 ± 2%, 85 ± 3%, and 94 ± 4%, with the standard deviations of error metrics maintained at a remarkably low level, indicating no gradient divergence arising from overfitting.
To further investigate the granular behavior of the thickness classifier across the 500 test samples, the three-level classification error matrix (confusion matrix) was computed and is summarized in Table 3. Among the 500 independent samples, 465 were correctly classified, yielding an overall accuracy of 93%. The error distribution analysis reveals that prediction errors are overwhelmingly concentrated between adjacent categories: misclassifications between Category 1 (mild) and Category 2 (moderate) accounted for 60% of total errors (21 out of 35 misclassifications), while errors between Category 2 and Category 3 represented 34.3% (12 cases). In contrast, extreme cross-category confusions (i.e., Category 1 misclassified as Category 3, or vice versa) were extremely rare, accounting for only 5.7% (2 cases). Qualitatively, prediction failures were mainly driven by two visual scenarios: (1) ultra-thin dust films (Category 1) masked by high-contrast mesh backgrounds and (2) localized dust heaps (Category 2) creating deep casting shadows under oblique lighting, leading to overestimation as Category 3.
Table 3.
Classification error matrix (confusion matrix) of the three-level dust thickness categorization for the 500 independent test samples using the Residual U-Net.
This localized error pattern stems from the continuous and transitional physical nature of dust accumulation on mesh threads. These adjacent-category misclassifications have negligible implications for the dust accumulation index (DAI). Because the DAI integrates spatial area ratios with graded physical penalty weights, minor boundary confusions between adjacent thickness states result in a smooth, bounded shift in the final index rather than abrupt rating jumps. This structural resilience ensures that the DAI remains a stable and reliable proxy metric for real-world filter condition assessment.
4. Discussion
In this study, to ensure the model’s reliability under complex, real-world conditions, we adopted a stratified sampling strategy covering four different use scenarios of filters that encompass varying degrees of mesh degradation and diverse dust loads, thereby compelling the model to learn the heterogeneous physical morphology of the dust rather than merely fitting the background color of the filter mesh. This aligns with recent empirical studies on the distribution of microorganisms and particulate matter in HVAC internal components, ensuring robust generalization capabilities when addressing unknown on-site environments [47,48].
In addition, our proposed DAI overcomes the limitations of planar vision in assessing three-dimensional dust accumulation in the filter. Mathematically, the lower threshold DAI = 20 represents the absolute theoretical ceiling for Category 1 accumulation (Rseg = 1.0, ω(1) = 0.2), guaranteeing that any DAI < 20 strictly corresponds to benign surface coating without active pore blockage. Conversely, the upper threshold DAI = 50 represents a critical failure boundary, mathematically equivalent to 50% area coverage under severe Category 3 occlusion (Rseg = 0.5, ω(3) = 1.0) or over 83% coverage under Category 2 particle bridging (Rseg = 0.833, ω(2) = 0.6). Given that the thickness of dust on the mesh-grid filter is heterogeneous, this study adopts a worst-case labeling principle for image classification, under which the classification is based on the highest thickness of dust on the filter. The area-multiplication logic of the Residual U-Net can automatically smooth out noise from isolated, highly accumulated dust points, ensuring that the DAI objectively reflects the true overall dust accumulation degree of the region. Although the proposed dust accumulation index (DAI) effectively integrates planar coverage with thickness penalties to reflect overall clogging severity, it currently operates as a physical proxy metric. Future work will incorporate dedicated wind-tunnel testing and real-time power meters to directly quantify the mathematical mapping between DAI values, actual filter pressure drop (△P), and air conditioner energy consumption penalties.
By introducing residual connections, which establish paths that allow input features to bypass intermediate convolutional layers and merge directly with deeper features, the Residual U-Net model can prevent the loss of critical spatial information during deep feature extraction. This algorithm enables the network to extract high-level semantic features of dust distribution while preserving low-level structural details, thereby effectively overcoming the inherent mesh-grid background textures and complex lighting interference of images from air conditioning filters. The superior performance and convergence stability of the proposed Residual U-Net stem directly from its specific mechanisms, which effectively resolve the challenge of separating irregular dust features from highly regular filter mesh backgrounds. First, the integration of residual connections via identity mapping in the Residual U-Net facilitates lossless backpropagation of gradients during early training. This architectural feature prevents gradient attenuation when isolating complex, non-uniform dust boundaries against dense grid lines. In contrast, the dense nested skip pathways in U-Net++ introduce severe feature redundancy under high-frequency mesh backgrounds, triggering severe validation loss fluctuations. Second, during the plateau phase, the Residual U-Net maintains smooth convergence by leveraging its residual bottlenecks to suppress local background noise. Conversely, the absence of explicit residual constraints in conventional U-Net and Attention U-Net renders them susceptible to local grid noise, manifested as persistent saw-tooth oscillations in dust edge detection. Finally, regarding the multi-task framework, the dual-branch shared feature encoder in the Residual U-Net plays a critical role in mitigating label switching between adjacent thickness categories. Because real-world dust is spatially irregular and morphologically abstract compared to 2D area, the shared encoder effectively decouples background mesh textures from geometric volume features. This balances the optimization progress between spatial localization and severity classification, enabling synergistic convergence across both tasks.
While non-intrusive filter diagnostics have traditionally relied on differential pressure monitoring, recent computer vision studies have begun evaluating filter degradation, such as extracting global grayscale histograms combined with machine learning (e.g., XGBoost) to predict overall clogging ratios [49] or leveraging flatbed optical scanner analysis with multilayer perceptron neural networks (MLP-ANN) to map surface RGB color/grayscale intensities to particulate accumulation [50]. However, these global statistical methods lack pixel-level spatial localization and multi-class thickness resolution. In contrast, our approach overcomes the limitations of planar vision by introducing a dual-branch architecture that simultaneously resolves local geometric boundaries and thickness categories at the pixel level, thereby advancing filter inspection from macroscopic global estimation to fine-grained spatial diagnosis. In the absence of standardized benchmark datasets specifically for pixel-level dust segmentation on mesh-grid filters, evaluating our Residual U-Net against mature cross-disciplinary computer vision tasks provides essential reference coordinates. In medical image analysis, such as retinal vessel extraction [51,52,53] or brain tumor segmentation [54,55], U-Net variants based on residual mechanisms typically achieve Dice similarity coefficients ranging from 80% to 90%. In industrial surface micro-defect detection [56,57,58] and agricultural leaf disease segmentation [59,60,61,62,63], mainstream lightweight segmentation models generally report intersection over union (IoU) values between 75% and 85%. The performance of our model on the independent test set—an IoU of 80% and a Dice coefficient of 86%—is on par with these mature cross-disciplinary standards, and it even demonstrates superior stability in training convergence. Notably, a minor performance discrepancy was observed between the validation and test sets: mean IoU and Dice similarity dropped by approximately 2 percentage points, while three-level thickness classification accuracy decreased by roughly 4 percentage points. This slight drop is primarily attributed to our strict physical-filter-based dataset partitioning strategy (Section 2.1.2), which evaluates the model on completely unseen physical mesh structures under diverse operational lighting, confirming robust out-of-sample generalization without data leakage.
It is noteworthy that, unlike medical imaging, which is often enhanced with contrast agents, or industrial metal surfaces with relatively uniform backgrounds, the filter meshes studied here generate high-frequency background noise due to their highly periodic and dense plastic grids, which significantly interfere with feature extraction by convolutional operators [64]. This challenge of segmenting fine, continuous structures is also considered a core difficulty in complex medical imaging tasks such as retinal vessel extraction [52]. In those fields, while hard attention mechanisms are frequently employed to reinforce key regions [65], our study verifies that optimized residual connections alone can achieve excellent performance in mitigating grid background interference, with lower computational costs and a more concise algorithm.
Without reliance on complex multi-scale attention fusion modules (e.g., CBAM and Attention Gate) or massive data augmentation, the Residual U-Net achieved highly consistent segmentation and classification through training on 2000 images, even for images with highly disruptive grid backgrounds. This result fully demonstrates the unique suitability of this network topology for handling geometric occlusions in mesh-grid filters. The introduction of residual connections not only effectively mitigates the vanishing gradient problem in deep network training but also enables the network to bypass redundant low-frequency grid features, focusing instead on local variations caused by differences in dust thickness. This substantiates the model’s excellence in balancing high-efficiency data requirements with robustness in complex industrial environments.
From an engineering deployment perspective, it is noteworthy that, considering the actual operational context of air conditioning, dust accumulation on filters is a slow physical process occurring over weeks or months. Consequently, the system is not sensitive to millisecond-level response latency for on-site recognition. Therefore, incurring a marginal inference time increase of 0.61 ms (compared to the baseline U-Net) to achieve a significant improvement in segmentation accuracy (Dice coefficient exceeding 90%) is both reasonable and necessary. With an operational latency of less than 4 ms, the Residual U-Net fully meets the requirements for edge computing deployment. To realize real-world application, the proposed visual framework can be practically integrated by embedding a low-cost, miniature wide-angle camera within the front casing of smart split air conditioners, interfaced with an edge-computing Wi-Fi/IoT module for local inference or automated data transfer. Grounded in physical-level dust morphology and thickness metrics, appropriate cleaning thresholds can be dynamically established using the DAI scale and flexibly customized by users based on their specific indoor air quality requirements or health sensitivities. For instance, a baseline threshold of DAI = 50 (representing severe Category 3 clogging or extensive Category 2 bridging) can serve as an automated trigger for targeted maintenance alerts via companion mobile applications, shifting filter maintenance from subjective visual inspection or rigid schedules to proactive, personalized, and data-driven scheduling.
Some limitations of the study are worth mentioning. First, the model’s feature extraction is heavily dependent on the imaging quality of the acquisition system. Under non-ideal conditions, such as extremely low light, strong backlighting, or severe shadowing inside the equipment, the decrease in image contrast may lead to cross-level drifts in thickness classification. Future system integration should consider incorporating adaptive high dynamic range (HDR) imaging or near-infrared (IR) illumination modules to enhance the model’s resistance to harsh optical environments. Second, although heavy dust layers are widely recognized as breeding grounds for mold colonization within HVAC systems, current optical photography limits the dual-branch network to identifying morphological classifications of dust and pollutants, lacking the capability to serve as an absolute basis for identifying specific microbial species. Future research may attempt to establish a regression mapping relationship between specific microbial community abundances and visual feature parameters of the filter, thereby imparting deeper biological health risk warning significance to the DAI. Third, the economic viability of the proposed system for the residential and consumer segment has not yet been established and requires further, separate study. Fourth, image acquisition in the current stage was conducted with the front panel opened as a proof-of-concept to rigorously validate the performance of the computer vision framework. The physical integration of internal microcamera modules—including line-of-sight visibility and optical clearance when the cover is closed—remains an ongoing engineering task to be fully evaluated in future hardware prototypes.
5. Conclusions
This study proposed and validated a deep-learning-based dual-task visual framework for the image-based assessment of dust accumulation from photographs of split air conditioner mesh-grid filters, providing an objective tool to help plan filter cleaning and maintenance. Residual U-Net was chosen as the best among the five tested U-Net models. Evaluated on 500 independent field test samples, the model achieved an average intersection over union (IoU) of 80%, a Dice coefficient of 86%, and a dust thickness classification accuracy of 93%, with performance metrics deviating by only approximately 1% from the validation baseline. The dual-branch feature of the model outputs simultaneously pixel-level dust area segmentation and a thickness classification, representing a significant advancement in assessing dust accumulation on filters. The multi-metric-based dust accumulation index (DAI) proposed in this work reflects the severity of such accumulation and can be used as an indicator of the degree of filter clogging. This capability shifts filter maintenance from subjective, reactive visual inspection to objective, real-time, and actionable data-driven decision-making. Future research will focus on translating this technique into a remotely controlled, automated system to monitor dust accumulation and filter clogging, including integrating an internal microcamera into the equipment for image acquisition as well as a network for image upload and processing, helping air conditioner users to better assess the cleanliness of the filter in real time.
Supplementary Materials
The following supporting information can be downloaded at https://www.mdpi.com/article/10.3390/buildings16224513/s1, Table S1: The calculation formulas for the evaluation metrics of the training model and the evaluation metrics of operational efficiency; Table S2: Performance and stability statistics of five independent training trials based on the optimal data configuration (2000 samples); Figure S1: Experimental setup and schematics for image acquisition; Figure S2: Detailed training and validation loss curves for the segmentation and thickness classification branches across the five U-Net variants; Figure S3: Detailed training and validation loss curves for the segmentation and thickness classification branches across different training sample sizes; Figure S4: Detailed training and validation loss curves for the segmentation and thickness classification branches across five independent training trials; Method S1: Implementation Details of the Residual U-Net Architecture.
Author Contributions
Y.Z.: Writing—review and editing, writing—original draft, visualization, validation, software, resources, methodology, investigation, funding acquisition, formal analysis, data curation. W.L.: Writing—review and editing, writing—original draft, visualization, validation, resources, methodology, investigation, funding acquisition, data curation, conceptualization. J.Z.: Writing—review and editing, writing—original draft, visualization, validation, software, resources, methodology, investigation, formal analysis, data curation, conceptualization. M.W.: Writing—review and editing, writing—original draft, visualization, validation, methodology, investigation, formal analysis, data curation. N.Z.: Writing—review and editing, writing—original draft, visualization, validation, resources, methodology, investigation, data curation, conceptualization. J.C.: Writing—review and editing, writing—original draft, visualization, validation, supervision, software, resources, project administration, methodology, investigation, funding acquisition, formal analysis, data curation, conceptualization. All authors have read and agreed to the published version of the manuscript.
Funding
This study is financially supported by the National Natural Science Foundation of China (52478078), New Chongqing Youth Innovation Talent Project (CSTB2025YITP-QCRCX0023), Natural Science Foundation of Chongqing, China (CSTB2025NSCQ-LZX0108), and Chongqing Postgraduate Research and Innovation Project (CYS25830).
Data Availability Statement
The original contributions presented in this study are included in the article/Supplementary Materials. Further inquiries can be directed to the corresponding author.
Conflicts of Interest
The authors declare that they have no known competing financial interests or personal relationships that could have appeared to influence the work reported in this paper.
References
- Peng, Y.; Shen, H.; Tang, X.; Zhang, S.; Zhao, J.; Liu, Y.; Nie, Y. Energy consumption optimization for heating, ventilation and air conditioning systems based on deep reinforcement learning. IEEE Access 2023, 11, 88265–88277. [Google Scholar] [CrossRef] [Scilit]
- Liu, J.; Zhai, Z.; Zhang, Y.; Wang, Y.; Ding, Y. Comparison of energy consumption prediction models for air conditioning at different time scales for large public buildings. J. Build. Eng. 2024, 96, 110423. [Google Scholar] [CrossRef] [Scilit]
- Mangin, T.; Barrett, Z.; Palmer, Z.; Tang, D.; Nielson, S.; Sleeth, D.; Kelly, K. Understanding the effect of outdoor pollution episodes and HVAC type on indoor air quality. Build. Environ. 2025, 278, 112978. [Google Scholar] [CrossRef] [Scilit]
- Dimitroulopoulou, S.; Dudzińska, M.R.; Gunnarsen, L.; Hägerhed, L.; Maula, H.; Singh, R.; Toyinbo, U.O. Haverinen-Shaughnessy, Indoor air quality guidelines from across the world: An appraisal considering energy saving, health, productivity, and comfort. Environ. Int. 2023, 178, 108127. [Google Scholar] [CrossRef] [Scilit] [PubMed]
- Elhami, M.; Goodarzi, S.S.; Maleki, S.; Sajadi, B. Three-objective optimization of the HVAC system control strategy in an educational building to reduce energy consumption and enhance indoor environmental quality (IEQ) using machine learning techniques. J. Build. Eng. 2025, 105, 112444. [Google Scholar] [CrossRef] [Scilit]
- Ortiz, M.; Itard, L.; Bluyssen, P.M. Indoor environmental quality related risk factors with energy-efficient retrofitting of housing: A literature review. Energy Build. 2020, 221, 110102. [Google Scholar] [CrossRef] [Scilit]
- Chuang, H.-C.; Ho, K.-F.; Lin, L.-Y.; Chang, T.-Y.; Hong, G.-B.; Ma, C.-M.; Liu, I.-J.; Chuang, K.-J. Long-term indoor air conditioner filtration and cardiovascular health: A randomized crossover intervention study. Environ. Int. 2017, 106, 91–96. [Google Scholar] [CrossRef] [Scilit] [PubMed]
- Fang, C.; Awoyemi, O.S.; Saianand, G.; Xu, L.; Niu, J.; Naidu, R. Characterising microplastics in indoor air: Insights from raman imaging analysis of air filter samples. J. Hazard. Mater. 2024, 464, 132969. [Google Scholar] [CrossRef] [Scilit] [PubMed]
- Dahal, Y.; Babel, S. Microplastics in the indoor laboratory environment: A study on deposition rate, size, shape, polymer, and source. Nepal J. Environ. Sci. 2026, 14, 39–49. [Google Scholar] [CrossRef] [Scilit]
- Liu, Z.; Bai, Y.; Ji, K.; Liu, X.; Cai, C.; Yu, H.; Li, M.; Bao, Y.; Lian, Y.; Gao, B. Detection of dermatophagoides farinae in the dust of air conditioning filters. Int. Arch. Allergy Immunol. 2006, 144, 85–90. [Google Scholar] [CrossRef] [Scilit] [PubMed]
- Liu, Z.; Zhu, Z.; Zhu, Y.; Xu, W.; Li, H. Investigation of dust loading and culturable microorganisms of HVAC systems in 24 office buildings in Beijing. Energy Build. 2015, 103, 166–174. [Google Scholar] [CrossRef] [Scilit]
- Mak, H.K.C.; Chan, D.W.T.; Law, L.K.C.; Tung, T.C.W. A detailed study of window-typed air-conditioner filtration of PM2.5 in residential buildings of Hong Kong. Indoor Built Environ. 2011, 20, 595–606. [Google Scholar] [CrossRef] [Scilit]
- Batterman, S.; Du, L.; Mentz, G.; Mukherjee, B.; Parker, E.; Godwin, C.; Chin, J.-Y.; O’Toole, A.; Robins, T.; Rowe, Z.; et al. Particulate matter concentrations in residences: An intervention study evaluating stand-alone filters and air conditioners. Indoor Air 2012, 22, 235–252. [Google Scholar] [CrossRef] [Scilit] [PubMed]
- Gaston, C.J.; Royer, H.M.; Leibensperger, R.J.I.; Maizel, D.; Lanpher, K.B.; Solo-Gabriele, H.; Brand, L.E.; Zhai, R.G.; Caban-Martinez, A.J.; Popendorf, K.J. Filtration efficiency of air conditioner filters and face masks to limit exposure to aerosolized algal toxins. Aerosol Air Qual. Res. 2021, 21, 210016. [Google Scholar] [CrossRef] [Scilit]
- Pérez-Lombard, L.; Ortiz, J.; Pout, C. A review on buildings energy consumption information. Energy Build. 2008, 40, 394–398. [Google Scholar] [CrossRef] [Scilit]
- Zaatari, M.; Novoselac, A.; Siegel, J. The relationship between filter pressure drop, indoor air quality, and energy consumption in rooftop HVAC units. Build. Environ. 2014, 73, 151–161. [Google Scholar] [CrossRef] [Scilit]
- Bouillard, L.; Michel, O.; Dramaix, M.; Devleeschouwer, M. Bacterial contamination of indoor air, surfaces, and settled dust, and related dust endotoxin concentrations in healthy office buildings. Ann. Agric. Environ. Med. 2005, 12, 187–192. [Google Scholar] [PubMed]
- Liu, Y.; Wang, Z.; Li, X.; Xu, Z.; Jiang, S.; Sun, X.; Zhao, X. Structural characteristics of pathogenic bacteria in split-type air conditioners and environmental factors related to their pathogenicity. Build. Environ. 2024, 265, 111924. [Google Scholar] [CrossRef] [Scilit]
- Wu, Y.; Maravelias, C.T.; Jiang, Y.; Fan, J.; Wenzel, M.J.; Mohammad, E.N.; Turney, R.D. Optimization methods for predictive maintenance scheduling of building heating/cooling equipment with performance decay. In Proceedings of the International High Performance Buildings Conference, West Lafayette, IN, USA, 9–12 July 2018; Available online: https://docs.lib.purdue.edu/ihpbc/273 (accessed on 1 November 2026).
- Liu, Y.; Wang, Z.; Li, X.; Xu, Z.; Yang, Y.; Wang, Z.; Li, Q.; Zhan, B. Fungal communities in split air conditioners and associated health risks. Build. Environ. 2025, 285, 113557. [Google Scholar] [CrossRef] [Scilit]
- Li, A.; Toll, M.; Candido, C.; Bentley, R. The validity and accuracy of self-reported measures in assessing indoor mould exposure. J. Build. Eng. 2025, 102, 111932. [Google Scholar] [CrossRef] [Scilit]
- Zhang, Y.; Wang, B.; Song, Y.; Han, Z.; Zhang, X.; Zhang, L. MicroDeblurNet: High-fidelity restoration of spatially variant defocus in microscopic images for cucumber downy mildew. Plant Methods 2026, 22, 16. [Google Scholar] [CrossRef] [Scilit] [PubMed]
- Iqbal, M.; Anwar, W.; Shafique, H.; Gilanie, G.; Rezk, A.A.; Al-Dossary, O.; El-Beltagi, H.S.; Aldaej, M.I.; Alsubaie, B.; Al-Khayri, J.M.; et al. Automated identification of mango leaf diseases using deep convolutional neural networks. Pol. J. Environ. Stud. 2026. [Google Scholar] [CrossRef] [Scilit]
- Rangarajan, A.K. A vision based crop monitoring system using segmentation techniques. Adv. Electr. Comput. Eng. 2020, 20, 89–100. [Google Scholar] [CrossRef] [Scilit]
- Du, G.; Cao, X.; Liang, J.; Chen, X.; Zhan, Y.; Cao, X.; Liang, J.; Chen, X.; Zhan, Y. Medical image segmentation based on U-net: A review. J. Imaging Sci. Technol. 2020, 64, jist0710. [Google Scholar] [CrossRef] [Scilit]
- Yang, Y.; Fu, H.; Aviles-Rivero, A.I.; Schönlieb, C.-B.; Zhu, L. DiffMIC: Dual-guidance diffusion network for medical image classification. In Medical Image Computing and Computer Assisted Intervention—MICCAI 2023; Greenspan, H., Madabhushi, A., Mousavi, P., Salcudean, S., Duncan, J., Syeda-Mahmood, T., Taylor, R., Eds.; Springer Nature: Cham, Switzerland, 2023; pp. 95–105. [Google Scholar] [CrossRef] [Scilit]
- Qin, Z.; Liu, Z.; Zhu, P.; Xue, Y. A GAN-based image synthesis method for skin lesion classification. Comput. Methods Programs Biomed. 2020, 195, 105568. [Google Scholar] [CrossRef] [Scilit] [PubMed]
- Nair, T.; Precup, D.; Arnold, D.L.; Arbel, T. Exploring uncertainty measures in deep networks for multiple sclerosis lesion detection and segmentation. Med. Image Anal. 2020, 59, 101557. [Google Scholar] [CrossRef] [Scilit] [PubMed]
- Conze, P.-H.; Andrade-Miranda, G.; Singh, V.K.; Jaouen, V.; Visvikis, D. Current and emerging trends in medical image segmentation with deep learning. IEEE Trans. Radiat. Plasma Med. Sci. 2023, 7, 545–569. [Google Scholar] [CrossRef] [Scilit]
- Wang, S.; Yin, J.; Zhou, Z. A comprehensive evaluation method for dust pollution: Digital image processing and deep learning approach. J. Hazard. Mater. 2024, 475, 134761. [Google Scholar] [CrossRef] [Scilit] [PubMed]
- Zhang, Y.; Li, C.; Wang, Y.; Wang, Y.; Yan, S.; Liu, X.; Zhang, X.; Liu, J. Recognition of microplastic aging features based on multimodal data fusion and attention mechanisms. J. Hazard. Mater. 2025, 496, 139301. [Google Scholar] [CrossRef] [Scilit] [PubMed]
- Galata, S.; Walkington, I.; Lane, T.; Kiriakoulakis, K.; Dick, J.J. Rapid detection of microfibres in environmental samples using open-source visual recognition models. J. Hazard. Mater. 2024, 480, 135956. [Google Scholar] [CrossRef] [Scilit] [PubMed]
- Xie, L.; Ma, M.; Ge, Q.; Liu, Y.; Zhang, L. Machine learning advancements and strategies in microplastic and nanoplastic detection. Environ. Sci. Technol. 2025, 59, 8885–8899. [Google Scholar] [CrossRef] [Scilit] [PubMed]
- Lin, J.; Liu, H.; Zhang, J. Recent advances in the application of machine learning methods to improve identification of the microplastics in environment. Chemosphere 2022, 307, 136092. [Google Scholar] [CrossRef] [Scilit] [PubMed]
- Jin, N.; Song, Y.; Ma, R.; Li, J.; Li, G.; Zhang, D. Characterization and identification of microplastics using raman spectroscopy coupled with multivariate analysis. Anal. Chim. Acta 2022, 1197, 339519. [Google Scholar] [CrossRef] [Scilit] [PubMed]
- Darwish, H.; Khapper, K.V.; Gokaraju, B.; Tesiero, R. Smart control for smarter buildings: A review of traditional and intelligent HVAC control strategies toward energy sustainability. IEEE Access 2026, 14, 30937–30964. [Google Scholar] [CrossRef] [Scilit]
- Cai, J.; Zhang, Y.; Zhu, J.; Wang, M.; Zhang, N.; Jia, H.; Li, W.; Tao, Y.; Liu, W. Application of mobile U-net-based image recognition method in assessing internal surface contaminations on split air conditioners. Energy Build. 2026, 362, 117509. [Google Scholar] [CrossRef] [Scilit]
- Jiang, P.; Ergu, D.; Liu, F.; Cai, Y.; Ma, B. A review of yolo algorithm developments. Procedia Comput. Sci. 2022, 199, 1066–1073. [Google Scholar] [CrossRef] [Scilit]
- Terven, J.; Córdova-Esparza, D.-M.; Romero-González, J.-A. A comprehensive review of YOLO architectures in computer vision: From YOLOv1 to YOLOv8 and YOLO-NAS. Mach. Learn. Knowl. Extr. 2023, 5, 1681–1716. [Google Scholar] [CrossRef] [Scilit]
- Sapkota, R.; Flores-Calero, M.; Qureshi, R.; Badgujar, C.; Nepal, U.; Poulose, A.; Zeno, P.; Vaddevolu, U.B.P.; Khan, S.; Shoman, M.; et al. YOLO advances to its genesis: A decadal and comprehensive review of the you only look once (YOLO) series. Artif. Intell. Rev. 2025, 58, 274. [Google Scholar] [CrossRef] [Scilit]
- Alzubaidi, L.; Zhang, J.; Humaidi, A.J.; Al-Dujaili, A.; Duan, Y.; Al-Shamma, O.; Santamaría, J.; Fadhel, M.A.; Al-Amidie, M.; Farhan, L. Review of deep learning: Concepts, CNN architectures, challenges, applications, future directions. J. Big Data 2021, 8, 53. [Google Scholar] [CrossRef] [Scilit] [PubMed]
- Chauhan, R.; Ghanshala, K.K.; Joshi, R.C. Convolutional neural network (CNN) for image detection and recognition. In Proceedings of the 2018 First International Conference on Secure Cyber Computing and Communication (ICSCCC), 15–17 December 2018; pp. 278–282. [Google Scholar] [CrossRef] [Scilit]
- Purwono, P.; Ma’arif, A.; Rahmaniar, W.; Fathurrahman, H.I.K.; Frisky, A.Z.K.; Ul Haq, Q.M. Understanding of convolutional neural network (CNN): A review. Int. J. Robot. Control Syst. 2022, 2, 739–748. [Google Scholar] [CrossRef] [Scilit]
- Zhang, Z.; Liu, Q.; Wang, Y. Road extraction by deep residual U-net. IEEE Geosci. Remote Sens. Lett. 2018, 15, 749–753. [Google Scholar] [CrossRef] [Scilit]
- Kendall, A.; Gal, Y.; Cipolla, R. Multi-task learning using uncertainty to weigh losses for scene geometry and semantics. In Proceedings of the 2018 IEEE/CVF Conference on Computer Vision and Pattern Recognition, Salt Lake City, UT, USA, 18–23 June 2018; pp. 7482–7491. Available online: https://openaccess.thecvf.com/content_cvpr_2018/html/Kendall_Multi-Task_Learning_Using_CVPR_2018_paper.html (accessed on 16 August 2026).
- Milletari, F.; Navab, N.; Ahmadi, S.-A. V-net: Fully convolutional neural networks for volumetric medical image segmentation. In Proceedings of the 2016 Fourth International Conference on 3D Vision (3DV), Stanford, CA, USA, 25–28 October 2016; pp. 565–571. [Google Scholar] [CrossRef] [Scilit]
- Noris, F.; Siegel, J.A.; Kinney, K.A. Evaluation of HVAC filters as a sampling mechanism for indoor microbial communities. Atmos. Environ. 2011, 45, 338–346. [Google Scholar] [CrossRef] [Scilit]
- Mata, T.M.; Martins, A.A.; Calheiros, C.S.C.; Villanueva, F.; Alonso-Cuevilla, N.P.; Gabriel, M.F.; Silva, G.V. Indoor Air Quality: A Review of Cleaning Technologies. Environments 2022, 9, 118. [Google Scholar] [CrossRef] [Scilit]
- Zhang, X.; Zhu, D.; Zhang, T.; Zhou, H.; Zhou, B. Vision-based intelligent diagnostic method for clogging assessment of gas turbine inlet air filters. Measurement 2026, 265, 120352. [Google Scholar] [CrossRef] [Scilit]
- Meseldzija, S.; Nesic, A.; Savic, M.; Momcilovic, M.; Pezo, L.; Onjia, A.; Volkov-Husovic, T. Image analysis method combined with machine learning for the prediction of soil and air quality. Microchem. J. 2025, 215, 114298. [Google Scholar] [CrossRef] [Scilit]
- Viraktamath, S.V.; Koti, V.; Ragi, S.; Pai, N. Blood vessels extraction of retinal image using morphological operations. In Proceedings of the 2018 International Conference on Inventive Research in Computing Applications (ICIRCA), Coimbatore, India, 11–12 July 2018; pp. 1185–1189. [Google Scholar] [CrossRef] [Scilit]
- Abdulsahib, A.A.; Mahmoud, M.A.; Mohammed, M.A.; Rasheed, H.H.; Mostafa, S.A.; Maashi, M.S. Comprehensive review of retinal blood vessel segmentation and classification techniques: Intelligent solutions for green computing in medical images, current challenges, open issues, and knowledge gaps in fundus medical images. Netw. Model. Anal. Health Inf. Bioinf. 2021, 10, 20. [Google Scholar] [CrossRef] [Scilit]
- Wang, D.; Haytham, A.; Pottenburgh, J.; Saeedi, O.; Tao, Y. Hard attention net for automatic retinal vessel segmentation. IEEE J. Biomed. Health Inform. 2020, 24, 3384–3396. [Google Scholar] [CrossRef] [Scilit] [PubMed]
- Bhattacharya, A.; Ray, M.; Gon, D. Brain Tumor Segmentation Using Enhanced and Improved ResUNet++. In Computational Intelligence in Communications and Business Analytics; Chandra Mondal, K., Bhattacharya, M., Bhaumik, P., Mukhopadhyay, S., Mandal, J.K., Dutta, P., Eds.; Springer Nature: Cham, Switzerland, 2026; pp. 455–472. [Google Scholar] [CrossRef] [Scilit]
- Tiwari, A.; Dixit, R.; Jain, P.; Patil, U.A. Advanced brain tumor detection and segmentation using encoder–decoder architectures and conditional random fields. SN Comput. Sci. 2026, 7, 414. [Google Scholar] [CrossRef] [Scilit]
- Liu, Y.; Zhang, C.; Dong, X. A survey of real-time surface defect inspection methods based on deep learning. Artif. Intell. Rev. 2023, 56, 12131–12170. [Google Scholar] [CrossRef] [Scilit]
- Cao, X.; Chen, B.; He, W. Unsupervised defect segmentation of magnetic tile based on attention enhanced flexible U-net. IEEE Trans. Instrum. Meas. 2022, 71, 5011110. [Google Scholar] [CrossRef] [Scilit]
- Chen, F.-C.; Jahanshahi, M.R. NB-FCN: Real-time accurate crack detection in inspection videos using deep fully convolutional network and parametric data fusion. IEEE Trans. Instrum. Meas. 2020, 69, 5325–5334. [Google Scholar] [CrossRef] [Scilit]
- Wang, H.; Ding, J.; He, S.; Feng, C.; Zhang, C.; Fan, G.; Wu, Y.; Zhang, Y. MFBP-UNet: A network for pear leaf disease segmentation in natural agricultural environments. Plants 2023, 12, 3209. [Google Scholar] [CrossRef] [Scilit] [PubMed]
- Dai, W.; Zhu, W.; Zhou, G.; Liu, G.; Xu, J.; Zhou, H.; Hu, Y.; Liu, Z.; Li, J.; Li, L. AISOA-SSformer: An Effective Image Segmentation Method for Rice Leaf Disease Based on the Transformer Architecture. Plant Phenomics 2024, 6, 218. [Google Scholar] [CrossRef] [Scilit] [PubMed]
- Kaur, P.; Harnal, S.; Gautam, V.; Singh, M.P.; Singh, S.P. Performance analysis of segmentation models to detect leaf diseases in tomato plant. Multimed. Tools Appl. 2024, 83, 16019–16043. [Google Scholar] [CrossRef] [Scilit]
- Acosta, D.; Zhao, J.; Xue, B. SAM-based leaf segmentation with morphological quality assessment for enhanced plant disease detection. In Proceedings of the 2025 40th International Conference on Image and Vision Computing New Zealand (IVCNZ), Wellington, New Zealand, 19–21 November 2025; pp. 1–6. [Google Scholar] [CrossRef] [Scilit]
- Zhang, X.; Li, D.; Liu, X.; Sun, T.; Lin, X.; Ren, Z. Research of segmentation recognition of small disease spots on Apple leaves based on hybrid loss function and CBAM. Front. Plant Sci. 2023, 14, 1175027. [Google Scholar] [CrossRef] [Scilit] [PubMed]
- Geirhos, R.; Rubisch, P.; Michaelis, C.; Bethge, M.; Wichmann, F.A.; Brendel, W. ImageNet-Trained CNNs are Biased Towards Texture; Increasing Shape Bias Improves Accuracy and Robustness. 2018. Available online: https://openreview.net/forum?id=Bygh9j09KX&trk=public_post_comment-text (accessed on 12 July 2026).
- Cai, P.; Li, B.; Sun, G.; Yang, B.; Wang, X.; Lv, C.; Yan, J. DEAF-net: Detail-enhanced attention feature fusion network for retinal vessel segmentation. J. Imaging Inform. Med. 2025, 38, 496–519. [Google Scholar] [CrossRef] [Scilit] [PubMed]

Disclaimer/Publisher’s Note: The statements, opinions and data contained in all publications are solely those of the individual author(s) and contributor(s) and not of MDPI and/or the editor(s). MDPI and/or the editor(s) disclaim responsibility for any injury to people or property resulting from any ideas, methods, instructions or products referred to in the content. |
© 2026 by the authors. Licensee MDPI, Basel, Switzerland. This article is an open access article distributed under the terms and conditions of the Creative Commons Attribution (CC BY) license.