


Abstract
Classroom window views are important components of the visual environment in university buildings, yet campus-scale assessment remains largely manual. This study developed an AI-assisted method for the relative screening of outdoor visual content in classroom window views by integrating DeepLabV3+ semantic segmentation with MiDaS monocular relative depth estimation. The dataset comprised 812 standardized window view images from four university buildings in Nanjing, China. Five visual proxy metrics—Visible Vegetation Ratio, Framed Sky Visibility, Relative Visual Depth, Hard Facade Ratio, and Trunk Exposure Ratio—were combined into a Composite Screening Score (CSS). The segmentation model achieved a mean intersection over union of 0.76 on an independent test set. In a range-stratified sample of 80 images, CSS was strongly associated with the mean ratings of five experts judging restorative visual potential from the photographs (Spearman’s ρ = 0.76, p < 0.001). The method supports interpretable relative ranking, metric-specific diagnosis, preliminary screening, and prioritization of on-site inspections in university building management.
1. Introduction
Within the educational built environment, classroom window views constitute an important component of the indoor visual environment in university buildings, providing a direct perceptual link between learning spaces and the surrounding outdoor environment [1,2]. Because students spend substantial periods in classrooms, windows mediate much of their daily visual exposure to vegetation, the sky, and distant spatial layers. The quality of the visible outdoor landscape can influence how effectively educational spaces support occupant well-being and shape students’ everyday experiences of learning environments. Attention Restoration Theory (ART) [3] and Stress Recovery Theory (SRT) [4] suggest that environments characterized by natural elements, spatial extent, and limited visual disturbance may facilitate attentional restoration, alleviate stress, and promote more positive emotional states. Empirical studies have further indicated that visual access to natural landscapes through windows may contribute to improvements in occupants’ emotional states, stress recovery, cognitive performance, and learning outcomes [5,6,7,8,9,10]. Therefore, classroom window views should not be regarded merely as passive representations of the exterior landscape surrounding a building; they may also function as micro-scale restorative resources for improving learning spaces and supporting the planning and management of healthy educational built environments.
Recent window view scholarship has increasingly shifted toward more fine-grained evaluations of scene content and visual quality in buildings. Existing studies indicate that window view experience is influenced not only by the proportion of natural elements but also by sky visibility, viewing distance, spatial openness, nearby building interfaces, landscape layering, and view composition [5,7,11,12,13]. Visible vegetation may provide natural exposure and soft fascination [14], while sky visibility and distant spatial layers may contribute to a stronger sense of openness and extent [15]. By contrast, extensive building facades or nearby hard vertical surfaces may increase visual obstruction and reduce the perceived quality of a window view [16]. Building-oriented reviews and empirical studies further suggest that window view quality depends on the characteristics, combinations, and spatial arrangement of visible natural and built elements [17,18,19]. Accordingly, a single greenness metric may not adequately distinguish between a view dominated by dense foreground vegetation and one that combines visible greenery with greater spatial extension [20]. Alongside this perceptual research, automated approaches have begun to quantify window view content using computer vision and city information models. Deep-learning methods have been applied to estimate the visible proportions of greenery, water, sky, and buildings [21,22], while dedicated window view datasets have supported the pixel-level semantic segmentation of these elements [23]. A recent study has also combined city information models with three-dimensional computer vision to automate window view distance assessment [24]. Together with evidence that viewing distance and the number of landscape layers contribute to perceived view quality [7,25,26], these advances provide a methodological basis for large-scale window view assessment that considers both semantic composition and spatial-structural characteristics.
Previous studies have provided important foundations for understanding window view quality and its potential restorative effects, but further development is needed for the large-scale screening of window views in university teaching spaces. For the large stock of existing university teaching buildings, the dimensions and positions of classroom windows are generally fixed, while extensive modifications to the building envelope may be costly or impractical. Objectively quantifying the outdoor scenes visible through these windows therefore offers a practical means of diagnosing classroom visual environmental quality and identifying potential landscape improvement priorities without altering the physical configuration of the windows. First, existing window view studies have mainly examined the mechanisms through which window views affect preference, emotion, physiological responses, or restorative experience. Although building-oriented assessment frameworks and automated methods have begun to evaluate window view content and quality [11,21,27], relatively few scalable identification methods have been developed specifically for campus management and the renewal of teaching spaces. For universities with large numbers of classrooms, the automated identification of low-potential window views and high-priority sites for further inspection under a standardized framework remains an important practical challenge [5,8,11]. Second, when applying semantic segmentation to classroom window views, it is necessary to account for fixed indoor viewpoints, limited window-framed visual fields, and sustained everyday exposure. These characteristics distinguish classroom window views from more flexible or unrestricted representations of outdoor environments and require image-based methods to be adapted to the conditions of university teaching spaces [7,27]. Third, existing automated assessments of window views continue to rely primarily on greenness, two-dimensional semantic proportions, or geometric visibility descriptors [21,27]. Although these measures provide a useful basis for identifying visible content, they cannot fully capture spatial-structural differences such as foreground obstruction, distant extension, and spatial layering [26]. On this basis, the present study seeks to establish a scalable automated screening method for classroom window views that integrates semantic content with relative depth cues [7,26].
To address these gaps, this study proposes an AI-assisted automated screening method for classroom window views in university buildings. The method integrates DeepLabV3+ semantic segmentation [28] and MiDaS monocular relative depth estimation [29] to extract five interpretable visual proxy metrics from standardized window view images and to construct a Composite Screening Score (CSS). The five metrics were selected to describe visible vegetation, framed sky visibility, image-based relative depth, building-facade proportion, and trunk/branch exposure, which have been associated with window view experience in previous studies [11,14,27,30]. By combining semantic composition with relative depth cues, the proposed method describes both the visible content and the relative depth characteristics of outdoor scenes, thereby addressing visual-structural differences that cannot be adequately represented by a vegetation ratio or by two-dimensional semantic proportions alone [26,27].
Here, “restorative visual potential” refers to the anticipated capacity of the photographed outdoor scene to support a restorative experience. The study approaches this potential through image-derived visual proxies and experts’ holistic judgments, rather than through measurements of students’ actual restorative responses. Accordingly, this study develops an AI-assisted method for the relative screening of classroom window views in university buildings and addresses two research questions. First, under standardized fixed-frame conditions, can visual proxy metrics derived from semantic segmentation and relative depth estimation generate rankings that are consistent with expert judgments of the relative restorative visual potential of classroom window views? Second, compared with schemes based only on vegetation ratio or two-dimensional semantic proportions, does the inclusion of relative depth cues provide incremental information and improve the association between tool-generated scores and expert judgments? The methodological contribution of this study is threefold. First, it establishes a reproducible image-acquisition and automated inference workflow adapted to classroom window views in existing university teaching buildings. Second, it develops an interpretable five-metric Composite Screening Score that integrates visible landscape composition with relative depth cues. Third, it conducts in-domain validation through semantic segmentation accuracy, blind expert ratings, ablation analysis, and weight sensitivity analysis. The proposed method supports the relative screening and inspection prioritization of classroom window views in university buildings.
2. Materials and Methods
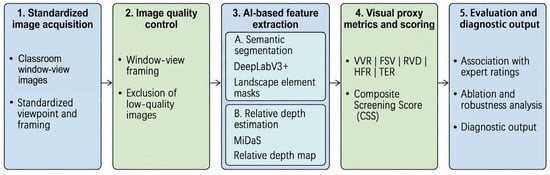
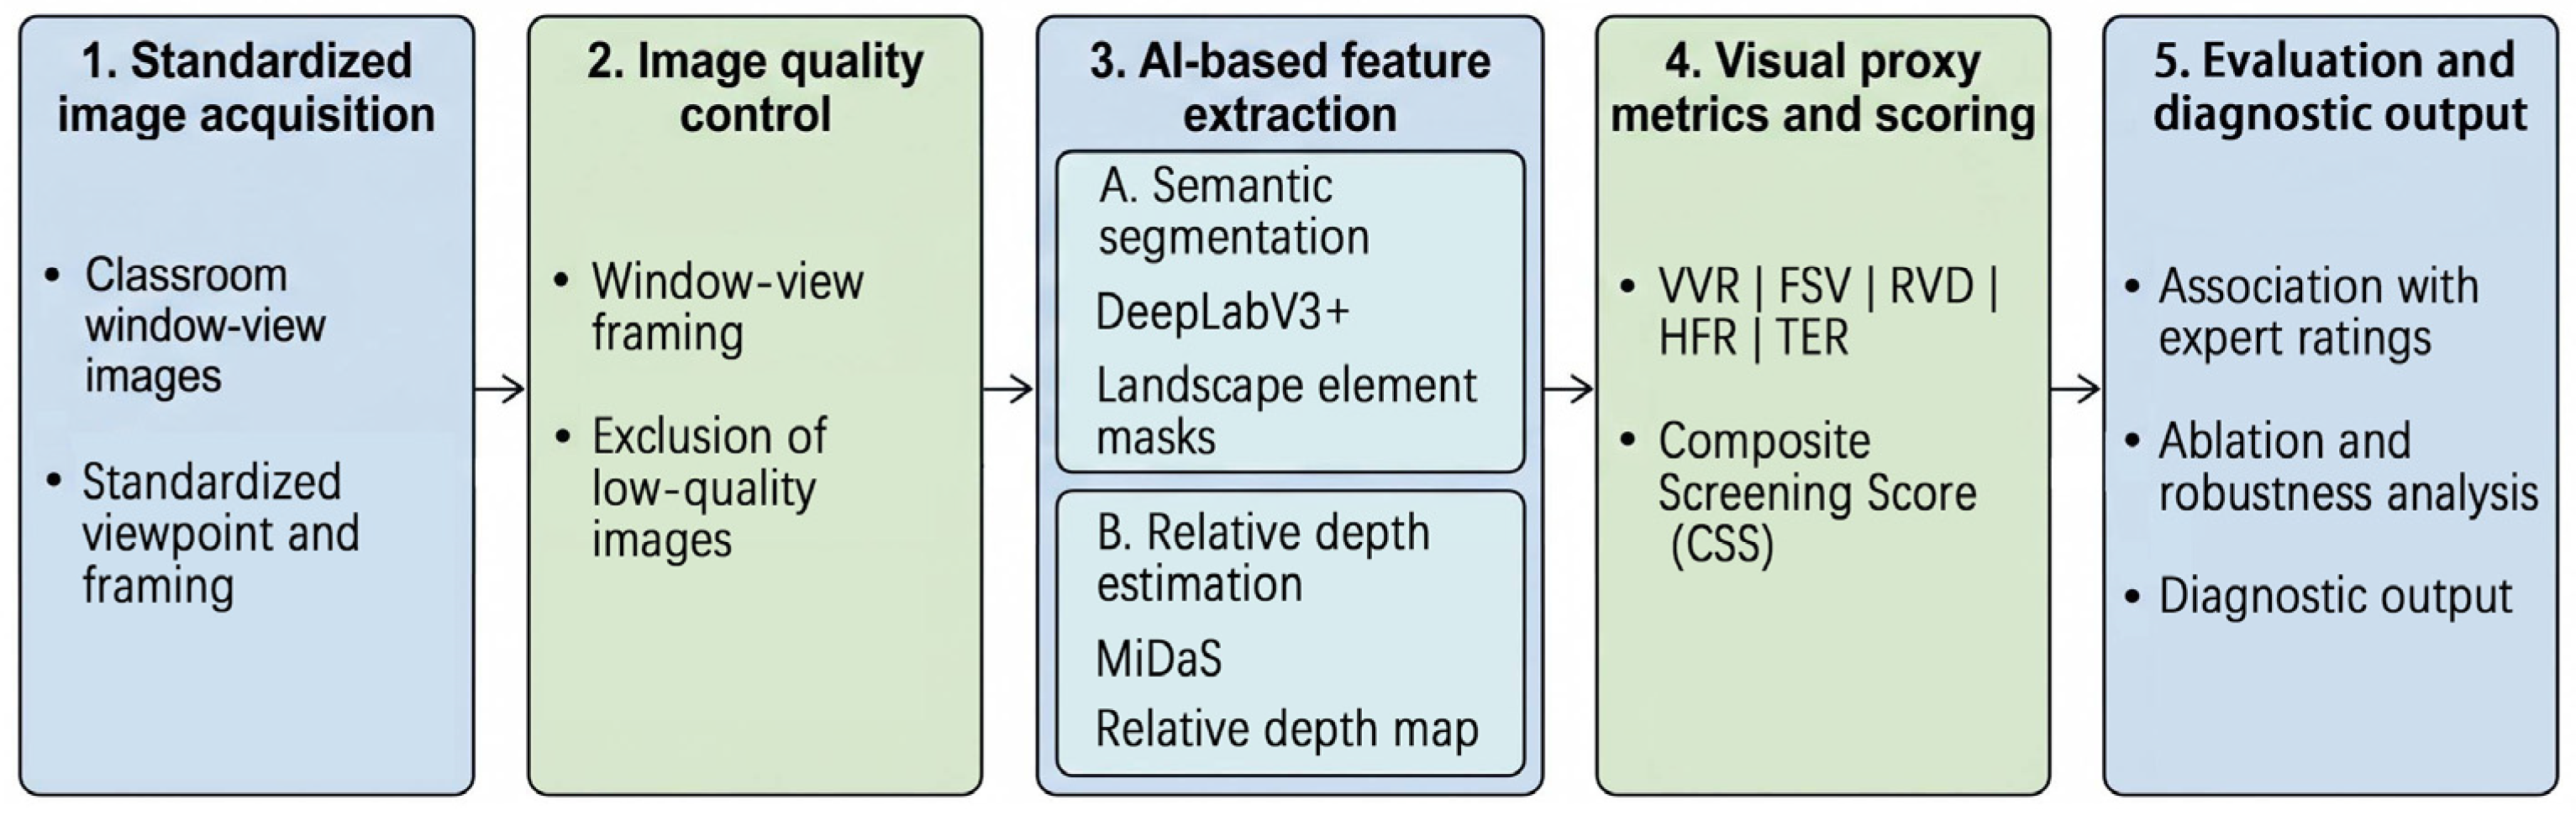
The technical workflow of this study included image acquisition, semantic segmentation, relative depth estimation, calculation of visual proxy metrics, CSS construction, and expert validation. The method was designed to convert standardized classroom window view images into interpretable visual proxy metrics and to examine whether the resulting CSS was associated with expert ratings. Figure 1 presents the analytical workflow of the study. Classroom window view images were first collected. DeepLabV3+ was then used for semantic segmentation [28] to identify sky, canopy, trunk/branch, shrub/grass, building facade, hard ground, water, and other background categories. MiDaS was used to extract relative depth cues [29]. Drawing on previous research concerning window view content, openness, viewing distance, and visual obstruction [7,11,21,26,27], this study operationalized five visual proxy metrics: Visible Vegetation Ratio (VVR), Framed Sky Visibility (FSV), Relative Visual Depth (RVD), Hard Facade Ratio (HFR), and Trunk Exposure Ratio (TER). These metrics were then integrated into the Composite Screening Score (CSS), and the screening performance of CSS was evaluated through its association with expert ratings, ablation comparisons, and weight sensitivity analysis [31]. This study assessed the outdoor visual content represented in standardized photographs taken through classroom windows. Window size and position, sill height, glazing, daylight availability, glare, thermal performance, and interior conditions were not separately evaluated or included as CSS components. The method therefore does not assess window-system performance or the complete viewing experience of classroom occupants [32].
Figure 1.
Analytical workflow of the AI-assisted screening framework integrating semantic segmentation and monocular relative depth estimation for classroom window views.
2.1. Study Area and Image Dataset
2.1.1. Standardized Image Acquisition and Quality Control
To ensure comparability among classroom window view images, this study adopted a standardized image acquisition protocol. All photographs were captured using the native camera application of the same smartphone model, an iPhone 12, with filters, beautification functions, and other stylized processing disabled. During image acquisition, the viewpoint, camera height, and framing range were controlled. All images were captured using the 1× wide-angle camera (26 mm full-frame-equivalent focal length), with the camera kept level. This standardized setting was adopted to maintain a consistent field of view and natural spatial perspective while minimizing variations caused by differences in viewing angle and lens-induced distortion [33]. The shooting position was selected at a typical seated viewing point near the window inside each classroom, with the camera height controlled at approximately 1.2 m above the floor [34]. For each window, the camera was horizontally aligned with its center. Images were collected under clear weather and relatively uniform lighting conditions. The visual field was strictly constrained to the outdoor landscape visible through the window aperture. The windows were opened during photography to minimize interference from glass material, stains, and indoor reflections. Metadata, including building, floor, orientation, time period, and weather conditions, were recorded during image acquisition.
The images were collected from four teaching buildings at Nanjing Forestry University (Table S1). This campus contains buildings constructed in different periods and encompasses varied building layouts, vegetation structures, and surrounding landscape conditions, thereby providing classroom window view samples with diverse visual characteristics. The collected samples covered different floors, orientations, building interfaces, and surrounding greenery conditions. After preprocessing and quality screening, the final dataset consisted of 812 valid classroom window view images from 812 distinct classroom windows, with only one standardized image retained for each window. Together, these samples reflected the main visual differences among classroom window views in the teaching spaces of the studied campus. The dataset was derived from a single university and collected during the spring growing season.
2.1.2. Semantic Annotation, Dataset Partitioning, and Validation Sample Selection
To train and validate the semantic segmentation model, 500 representative images were selected from the 812 valid images for pixel-level annotation. The images were first classified through visual inspection into five scene types: high-coverage multilayered vegetation, permeable sparse woodland, relatively high sky visibility, building-facade dominance, and mixed visual compositions (Figure S1). Sample allocation was approximately proportional to the distribution of these scene types in the full dataset, while building, floor, and orientation were also considered. Slightly higher sampling proportions were assigned to sparsely represented groups to ensure sufficient visual diversity. A total of 500 images were then randomly selected by computer from the candidates according to the adjusted group allocations. The selected images were subsequently reviewed manually. When highly similar images were identified, only one was retained, and the others were replaced with alternative images from the initially unselected pool of 312 images, maintaining a final set of 500 images for annotation. The 500 images were allocated among three graduate students in landscape architecture for pixel-level annotation using LabelMe [35], with each image initially annotated by one student. Before formal annotation, the research team standardized category definitions, boundary interpretation rules, and typical sources of confusion, and calibrated the annotation protocol using pilot annotation samples. Window view pixels were classified into eight categories: sky, canopy, trunk/branch, shrub/grass, building facade, pavement/hard ground, water, and other background. Among these categories, sky, canopy, trunk/branch, shrub/grass, and building facade were directly used in the calculation of the core metrics, whereas pavement/hard ground, water, and other background were retained as auxiliary classes. After the initial annotation was completed, all 500 annotated images underwent centralized review. The review focused on potentially ambiguous areas, including trunk/branch pixels, sky boundaries, building outlines, shadowed regions, and boundaries between canopy and shrub/grass classes. For samples with disagreement or uncertain boundaries, the research team reached a consensus through centralized discussion and revised the annotation masks accordingly. The final labels used for model training, validation, and testing were a single set of consensus reference annotations that had undergone unified review.
The 500 annotated images were divided into training, validation, and test sets at a ratio of 70%, 15%, and 15%, corresponding to 350, 75, and 75 images, respectively. The same five scene types used during annotation sample selection were adopted as stratification categories, and images within each category were randomly allocated to the three subsets according to the specified proportions. The initial allocation was then manually reviewed, and images were exchanged between subsets where necessary to improve within-subset image diversity and reduce the risk of data leakage associated with spatial autocorrelation [36]. The training set was used for model parameter optimization, the validation set for model selection and early stopping, and the test set was reserved only for the final evaluation of semantic segmentation performance.
The remaining 312 unannotated images were not used for model training, validation, or testing. Instead, after model training was completed, they were processed together with the annotated subset through the same automated inference and metric-calculation workflow. The five visual proxy metrics and CSS were calculated for all 812 standardized classroom window view images using this unified procedure.
The 80 images used for expert rating were selected from the test set (75 images) and the unannotated inference samples (312 images) through CSS-stratified random sampling, followed by manual adjustment and supplementation to improve visual diversity (Figure S2). None of the selected images had been used for model training.
2.2. Semantic Segmentation and Relative Depth Estimation
2.2.1. Semantic Segmentation
This study used DeepLabV3+ as the semantic segmentation model for classroom window views [28]. The model was used to extract pixel-level categories, including sky, canopy, trunk/branch, shrub/grass, building facade, hard ground, water, and other background. DeepLabV3+ is a well-established CNN-based semantic segmentation framework that combines atrous convolution with an encoder–decoder structure, enabling it to capture both multi-scale contextual information and boundary details. Its mature architecture and wide application make it suitable for constructing the semantic segmentation prototype in this study and for automated feature extraction across large sets of standardized classroom window view images.
Model training was implemented in 3.9.16 and the PyTorch 2.0.1 deep learning framework [37]. The backbone network was ResNet-101 [38], pretrained on ImageNet [39] and fine-tuned on the annotated window view dataset developed in this study. During training, the Adam optimizer [40] and class-weighted cross-entropy loss were used to alleviate pixel imbalance among low-frequency categories, such as trunk/branch and water [41] (Table A1).
Semantic segmentation performance was evaluated using class-wise intersection over union (IoU), mean intersection over union (mIoU), F1 score, and the confusion matrix [42]. Particular attention was paid to misclassification between trunk/branch and building shadows, between shrub/grass and canopy, and between sky and light-colored building facades.
2.2.2. Relative Depth Estimation and Semantic–Depth Fusion
This study adopted the MiDaS monocular relative depth estimation model to extract internal relative depth cues from single RGB window view images. MiDaS is trained on large-scale mixed datasets and has demonstrated robust performance in zero-shot cross-dataset transfer tasks. It does not require recalibration for new scenes or the acquisition of stereo images, making it suitable for automated deployment in the campus scenarios considered in this study [29].
Owing to the inherent scale ambiguity of monocular vision, MiDaS does not provide absolute metric distance but estimates relative depth relationships among different regions within an image [43]. To reduce the influence of isolated extreme predictions on normalization, the raw MiDaS values were clipped at the 2nd and 98th percentiles of the non-sky pixels in each image and then linearly normalized within the image. Let Di denote the raw MiDaS output for the ith non-sky pixel, and let P2(D) and P98(D) denote the 2nd and 98th percentiles, respectively, of the non-sky depth values in the image. When larger raw values indicate greater proximity to the observer, the normalized proximity value is defined as:
The normalized value is then converted into a farness proxy:
where Dfar,i ∈ [0,1], with larger values indicating greater relative farness within the image. Percentile clipping limits the influence of extreme predictions on the normalization endpoints. The same procedure was applied to every image, allowing image-level summaries of the normalized non-sky farness distribution to be compared across samples. These comparisons concern relative distributional characteristics rather than viewing distances on a common metric scale.
After obtaining the semantic segmentation masks and relative depth maps, this study aligned them to the same image size and coordinate system. For each valid visual-field pixel, both its semantic category and normalized farness proxy value were recorded. Semantic segmentation was used to identify the visible scene elements, whereas the relative depth output provided normalized farness values for non-sky pixels within each image. Their fusion allowed semantic composition to be considered together with the within-image distribution of relative depth predictions. Sky regions were included in the calculation of Framed Sky Visibility (FSV) but excluded from the calculation of Relative Visual Depth (RVD). Through semantic–depth fusion, visible scene composition and the normalized non-sky farness distribution were converted into computable visual proxy information.
2.3. Visual Proxy Metrics and CSS Construction
2.3.1. Visual Proxy Metrics
After the final model was determined, all 812 standardized classroom window view images were processed using the same batch inference and metric-calculation workflow. Semantic segmentation categories and relative depth cues were converted into five visual proxy metrics describing visible vegetation, framed sky visibility, image-based relative depth, building-facade proportion, and trunk/branch exposure. The correspondence between the low-level data and visual proxy metrics is shown in Table 1.
Table 1.
Correspondence between low-level data and visual proxy metrics.
2.3.2. Definitions of the Five Metrics
Let Ω denote the set of valid visual-field pixels in a window view image, and let N denote the total number of pixels in Ω. The numbers of sky, canopy, trunk/branch, shrub/grass, and building-facade pixels are denoted by Nsky, Ncanopy, Ntrunk, Nshrub, and Nfacade, respectively. The set of non-sky pixels is denoted by Ωnon−sky.
Visible Vegetation Ratio () is defined as:
VVR represents the overall visible proportion of plant elements in the window view image. It is the proportion of vegetation pixels in a two-dimensional image and is not equivalent to vegetation coverage in real three-dimensional space.
Framed Sky Visibility () is defined as:
FSV represents the proportion of sky pixels within the standardized window view image. It differs from the Sky View Factor (SVF) [44] and is used only to describe the visible sky area within the fixed window view frame.
Relative Visual Depth (RVD) is defined as:
where Ωnon−sky denotes the set of non-sky pixels and P75 denotes the 75th percentile of their normalized farness values Dfar,i. P75 was selected as an upper-quartile summary to characterize the upper portion of the distribution rather than its central tendency or extreme endpoint. Accordingly, RVD is an image-level summary of the normalized non-sky farness distribution.
RVD = P75({Dfar,i|i ∈ Ωnon−sky})
Hard Facade Ratio () is defined as:
HFR represents the pixel proportion of building facades within the standardized window view image. This metric characterizes the occupation of the visual field by building facades and their potential visual pressure. It is not equivalent to the total proportion of roads, paved areas, or other horizontal hard surfaces. This metric requires positive transformation before being incorporated into the composite score.
Trunk Exposure Ratio () is defined as:
TER represents the proportion of trunk/branch pixels within the segmented vegetation pixels. It is used as an image-based descriptor of trunk/branch exposure. It does not represent the total amount of vegetation, but in tree-dominated window views, greater exposure of trunks and branches may indicate higher understory visual permeability and more discernible vegetation structural layering, particularly where spaces beneath and between canopies remain visible. When no vegetation pixels were detected and the denominator was therefore zero, TER was assigned a value of 0 for numerical completeness.
Among the five metrics, VVR, FSV, RVD, and TER were treated as positive metrics, whereas HFR was treated as a negative metric; a higher HFR indicates a larger proportion of building facades within the visual field. TER was retained as a vegetation-structure component, with its positive scoring direction informed by the visual interpretation described above for tree-dominated window views.
2.3.3. CSS Construction
Before composite scoring, the raw values of the five metrics were normalized to a 0–1 range using min–max normalization based on their observed ranges across the current dataset. For the positive metrics VVR, FSV, RVD, and TER, the normalized component value was calculated as:
was reverse-normalized so that a lower facade proportion contributed a higher component score:
where Xk denotes the raw value of metric k for a given image, Xk,min and Xk,max denote its minimum and maximum values in the current dataset, respectively, and X′k denotes the corresponding normalized component value used for CSS calculation. After normalization, all component scores followed the scoring directions adopted in the CSS framework. Because min–max normalization depends on the empirical ranges of the current sample, the CSS is primarily intended for relative comparison within the current dataset.
The Composite Screening Score () is defined as:
where denotes the weight of metric k, satisfying:
This study adopted an equal-weighting scheme, with all five metric weights set to 0.20.
Equal weighting provided a transparent and interpretable baseline rather than an empirically optimized weighting scheme for the exploratory screening framework, given the absence of student-response data for calibrating differential weights. These weights specify the aggregation of normalized visual proxies rather than empirically established equivalence in their psychological effects [45]. CSS was formulated as a study-specific formative screening index by aggregating normalized image-derived visual proxies. It provides continuous rankings of the sampled outdoor scenes under the selected scoring rules. Its proposed interpretation in relation to restorative visual potential was examined through comparison with expert judgments. CSS values are relative to the current dataset and do not quantify the magnitude of restoration experienced by students.
2.4. Expert Rating and Statistical Analysis
The expert rating analysis examined correspondence between CSS rankings and professional judgments of restorative visual potential based on the original photographs. Previous window view research has compared quantitative view-quality indices with occupants’ subjective ratings and physiological responses [46], while visual landscape assessment research has distinguished expert-based approaches from perception-based approaches [47].
Five experts participated in the blind rating of the window view images. Four experts were from the discipline of landscape architecture, and one was from architecture. All five experts were familiar with campus landscapes, visual environment evaluation, or restorative environment research, and each had more than 15 years of relevant teaching, research, or professional practice experience. None of the experts participated in semantic segmentation model training, CSS calculation, or validation sample selection. Before rating, the experts were informed of the assessment purpose and given the study definition of “restorative visual potential”, the extent to which the overall visual impression of a window view might support attentional restoration, stress reduction, and positive emotional experience. During the rating process, the experts viewed the original window view photographs, which were presented at a uniform size, against a uniform background, and in a randomized order. They had no access to the values of the five visual proxy metrics, CSS values, CSS-based rankings, or any model prediction information. A five-point Likert scale was used for rating, with higher scores indicating that the expert perceived the window view as having higher relative restorative visual potential. The experts made holistic judgments based solely on the original window view images. The rating criteria are shown in Table 2. The mean expert rating for each image was used in the subsequent correlation analysis.
Table 2.
Operational criteria for expert ratings of original window view images.
Inter-expert consistency was evaluated using ICC and Kendall’s W [48,49]. Because the expert ratings used a five-point Likert scale and the analysis focused on rank correspondence, Spearman’s ρ was treated as the primary statistic, with Pearson’s r reported as a supplementary statistic. Associations with the mean expert rating and overlap with expert-based high- and low-ranking subsets were used to compare the scoring schemes. To examine the dependence of CSS ranking on weight settings, this study used the equal-weighting scheme as the baseline and evaluated ranking stability through single-factor weight perturbation and Monte Carlo random weight simulation. The statistical significance level was set at p < 0.05.
3. Results
3.1. Performance of Semantic Segmentation and Distribution of Visual Proxy Metrics
After fine-tuning, the DeepLabV3+ model achieved mIoU = 0.76 on the 75-image test set. The class-wise IoU and F1 scores are presented in Table 3. The model performed well in identifying large-area categories with relatively clear boundaries, such as sky, canopy, and building facade, indicating that it could stably extract the main visual elements in classroom window views. The recognition accuracy for shrub/grass and pavement/hard ground was moderate, with errors mainly occurring at vegetation interfaces, shaded areas, and ground-cover boundaries. The trunk/branch category showed the lowest IoU, which was mainly attributable to its small pixel proportion, slender morphology, and frequent confusion with building shadows or dark background areas. Because TER directly depends on this category, subsequent interpretation of this metric should take segmentation uncertainty into account. Overall, the semantic segmentation results were sufficient to support the calculation of major metrics such as VVR, FSV, and HFR, although metrics related to small-object categories still involved a degree of uncertainty.
Table 3.
Class-wise segmentation performance of the semantic segmentation model on the test set.
Based on the metrics obtained from the final automated processing workflow for the 812 standardized classroom window view images, descriptive statistics were calculated for the five visual proxy metrics, as shown in Table 4. All five metrics showed clear variation across samples, indicating that classroom window views on the studied campus differed quantifiably in vegetation proportion, sky visibility, relative depth, building-facade proportion, and trunk/branch exposure. The relatively high mean value of VVR suggests that most window views contained a certain proportion of natural elements. The overall low FSV indicates limited sky visibility in the classroom window views. The high maximum value of HFR suggests that some window views were clearly dominated by building facades. The mean TER indicates that trunk/branch pixels accounted for a relatively small proportion of the segmented vegetation pixels.
Table 4.
Descriptive statistics of the five visual proxy metrics (n = 812).
The Pearson correlation matrix for the five metrics is shown in Table 5. The correlation analysis revealed a strong negative correlation between VVR and HFR (Pearson’s r = −0.72), indicating that, within a fixed image frame, window views with a higher vegetation proportion generally had a lower building-facade proportion. This relationship is consistent with the pixel-composition logic of window view images, but it also suggests a degree of information overlap between the two metrics. RVD was moderately positively correlated with FSV, and TER was moderately positively correlated with RVD, indicating co-variation among framed sky visibility, trunk/branch exposure, and image-based relative depth within the current sample. VVR showed a weak negative correlation with FSV, indicating that vegetation proportion and sky visibility are not simple substitutes for each other. Overall, although the five metrics were interrelated to some extent, they captured different aspects of window view content and structure.
Table 5.
Pearson correlation matrix of the five visual proxy metrics (n = 812).
3.2. Association Between CSS and Expert Ratings
Five experts independently conducted blind ratings of 80 representative classroom window view images. The intraclass correlation coefficient for expert ratings was ICC (2,5) = 0.78, with a 95% CI of 0.68–0.85, indicating moderate-to-good reliability of the average rating from the five experts. Kendall’s W = 0.72, χ2 = 284.4, df = 79, p < 0.001, indicating a relatively high level of concordance among experts in sample ranking. Based on the median within-image rating range, expert disagreement was greatest for permeable sparse woodland, followed by high-coverage multilayered vegetation, while the other three window view types showed relatively low disagreement. Therefore, the mean expert rating for each image was used as the expert reference score in subsequent analyses.
CSS showed a strong positive association with the mean expert rating, indicating close correspondence between the CSS-based and expert-based rankings. The Pearson correlation analysis yielded Pearson’s r = 0.74, p < 0.001, and the Spearman rank correlation analysis yielded Spearman’s ρ = 0.76, p < 0.001.
3.3. Ablation Analysis and Sensitivity Analysis
3.3.1. Ablation Analysis
To examine the potential incremental value of relative depth cues, this study compared the associations between the mean expert rating and three scoring schemes, as shown in Table 6. When only VVR was used, the tool-generated score showed a moderate association with expert ratings (ρ = 0.58), suggesting that visible vegetation was associated with expert judgments, but that a single greenness metric did not fully capture the variation in those judgments. After FSV, HFR, and TER were added, the correlation coefficient increased to ρ = 0.69. With the further inclusion of RVD, the complete five-metric scheme achieved a correlation coefficient of ρ = 0.76 (Δρ = 0.0723, 95% bootstrap CI [0.0187, 0.1245]). In addition, the three schemes showed an increasing trend in overlap with the expert-identified high- and low-scoring samples, suggesting that the complete five-metric scheme corresponded more closely to the expert-based identification of high- and low-scoring images within the rated sample.
Table 6.
Association between different metric combinations and expert ratings.
3.3.2. Leave-One-Metric Sensitivity Analysis
Given that TER depends on the trunk/branch category, which is a low-frequency and slender class, and that its segmentation accuracy was lower than that of major categories such as sky, canopy, and building façade, a leave-one-metric sensitivity analysis was further conducted. The results showed that, after TER was removed and its weight was redistributed to the remaining four metrics, the CSS ranking remained highly correlated with that of the complete five-metric scheme (Spearman’s ρ = 0.96). The CSS without TER also maintained a strong positive association with the mean expert rating (Spearman’s ρ = 0.73). These results suggest that removing TER had a limited influence on the overall CSS ranking, while TER may still provide complementary information for interpreting vegetation structure and understory visual permeability in tree-dominated window views.
3.3.3. Weight Sensitivity Analysis
This study conducted single-factor weight perturbation and Monte Carlo random weight simulation to further compare the consistency between perturbed CSS rankings and the equal-weight baseline ranking. In the single-factor perturbation analysis, only one metric weight was adjusted at a time, while the remaining four weights were proportionally scaled and renormalized to keep the total weight equal to 1. As shown in Table 7, after the weights of the five metrics were increased or decreased by 10% and 20%, Spearman’s ρ between the perturbed ranking and the baseline ranking remained no lower than 0.87. This result indicates that CSS ranking had relatively high stability under changes in the weight of a single metric.
Table 7.
Ranking consistency of CSS after weight perturbation.
The Monte Carlo random weight simulation further showed that, across 1000 random weight combinations, the median Spearman’s ρ between CSS rankings and the equal-weight baseline ranking was 0.94, with an interquartile range of 0.91–0.96, and that the minimum value remained above 0.82. This result suggests that, within the current sample set, CSS ranking showed a degree of robustness under the weight perturbation and random weight combinations specified in this study.
3.4. Diagnostic Outputs for Representative Cases
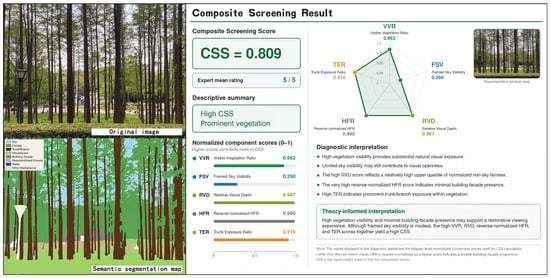
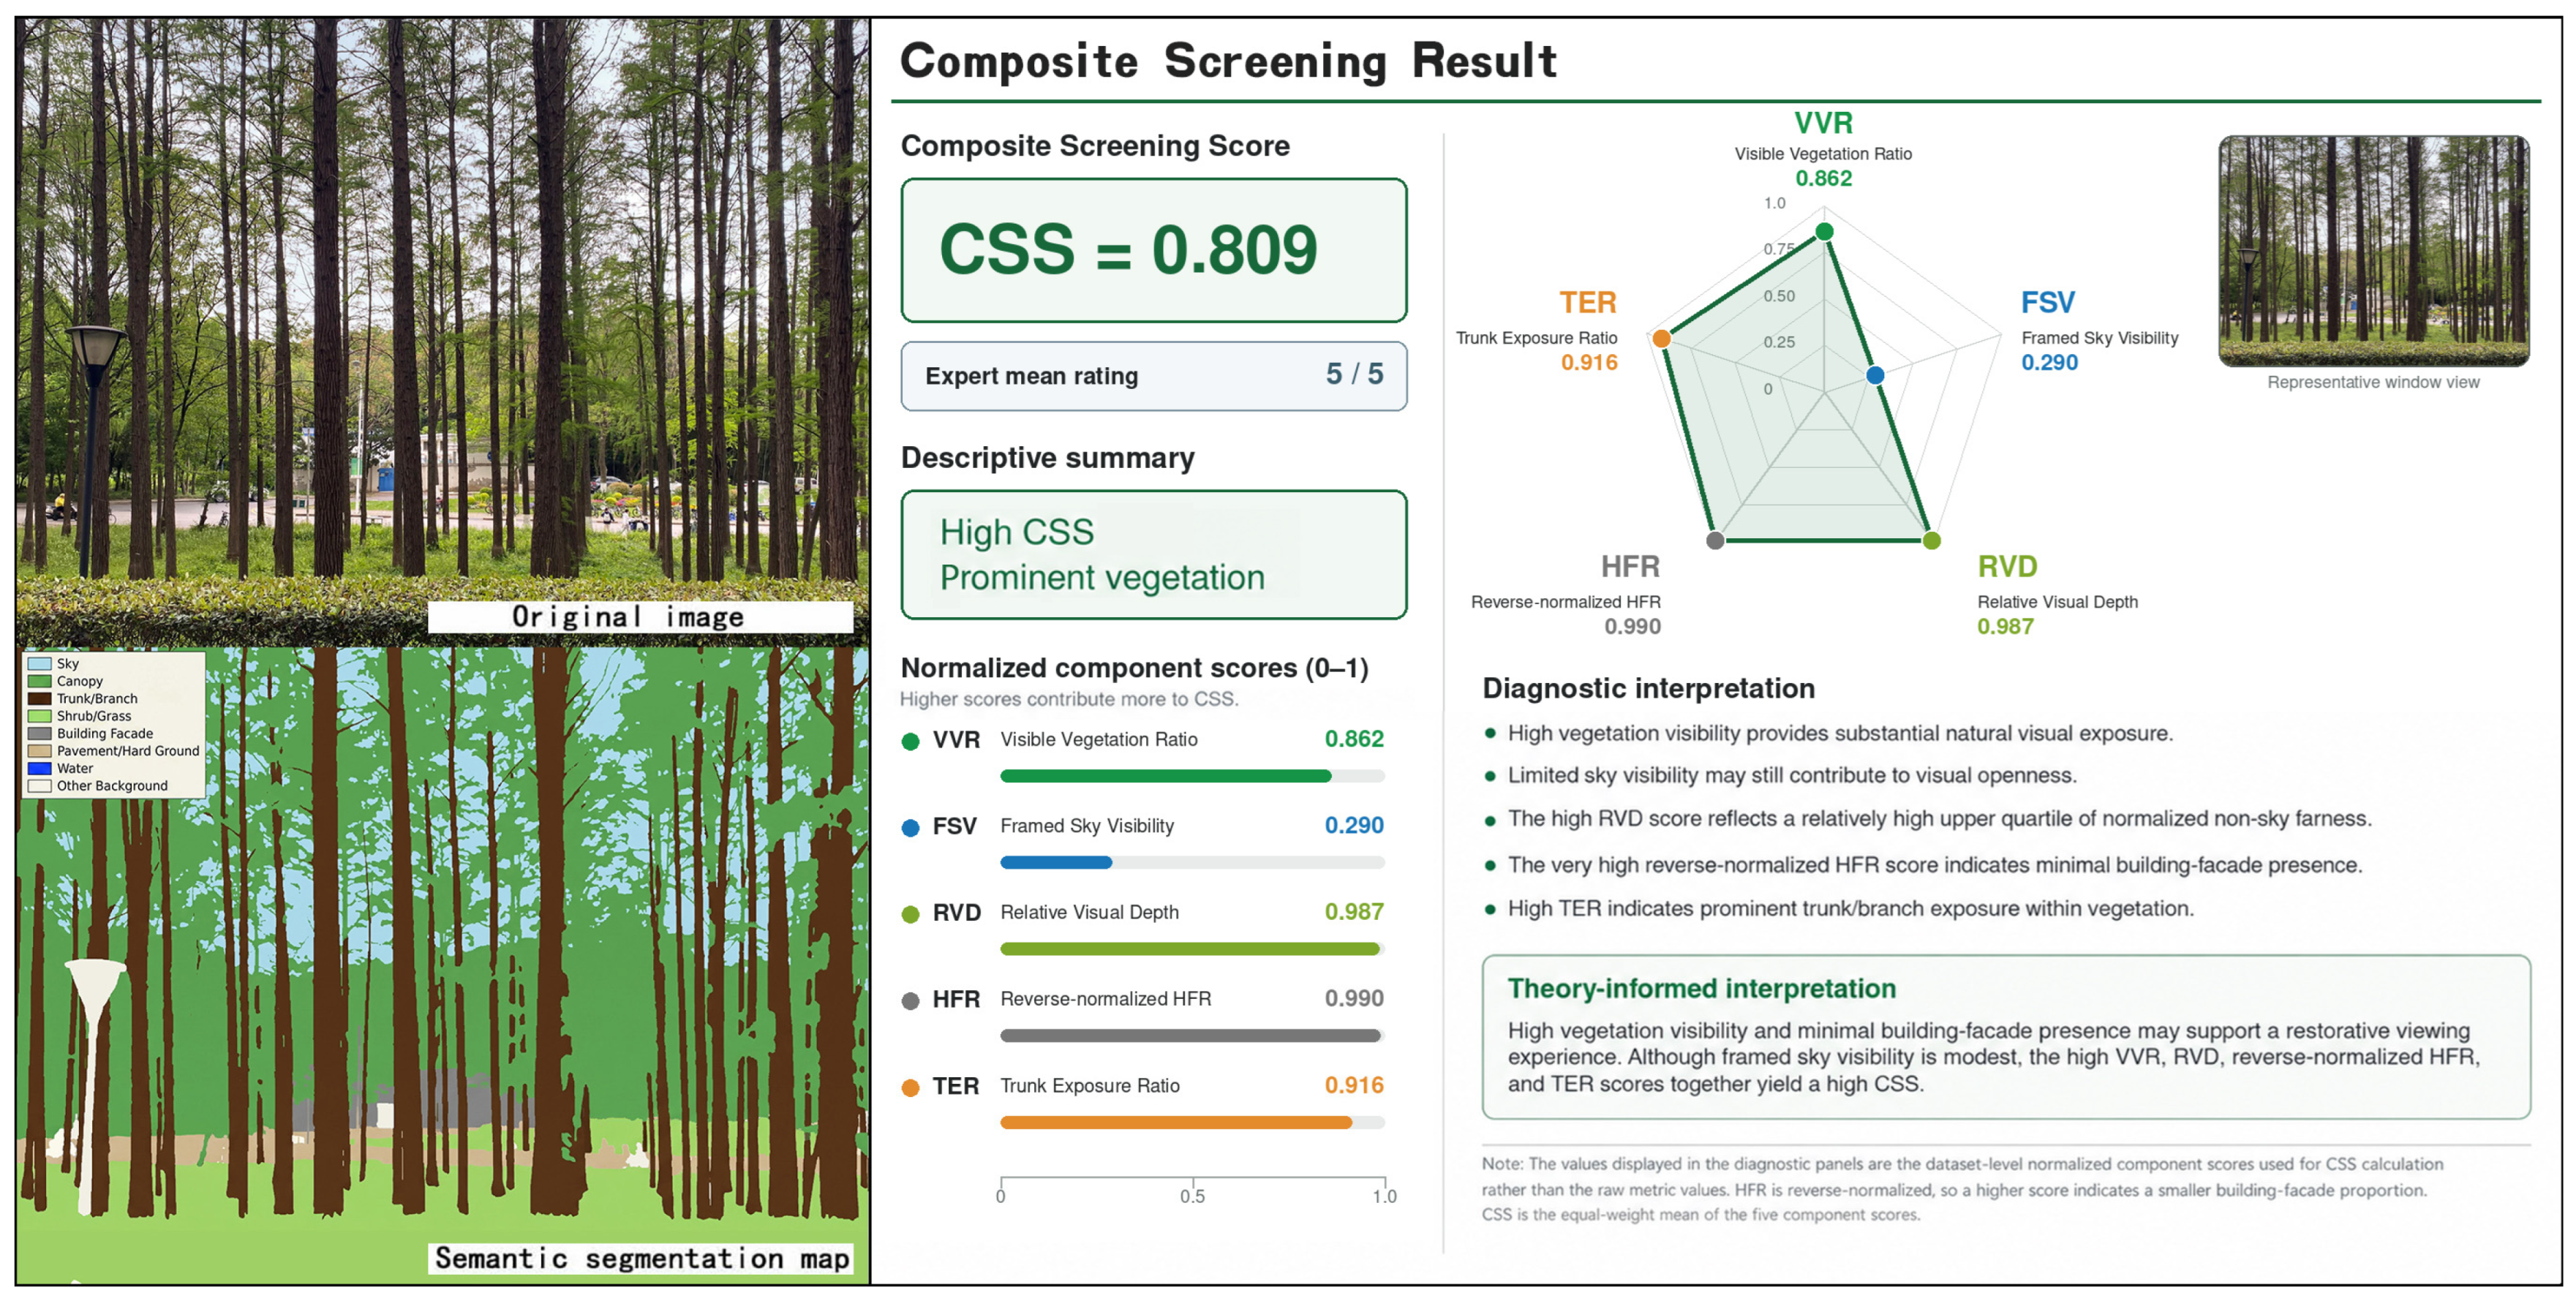
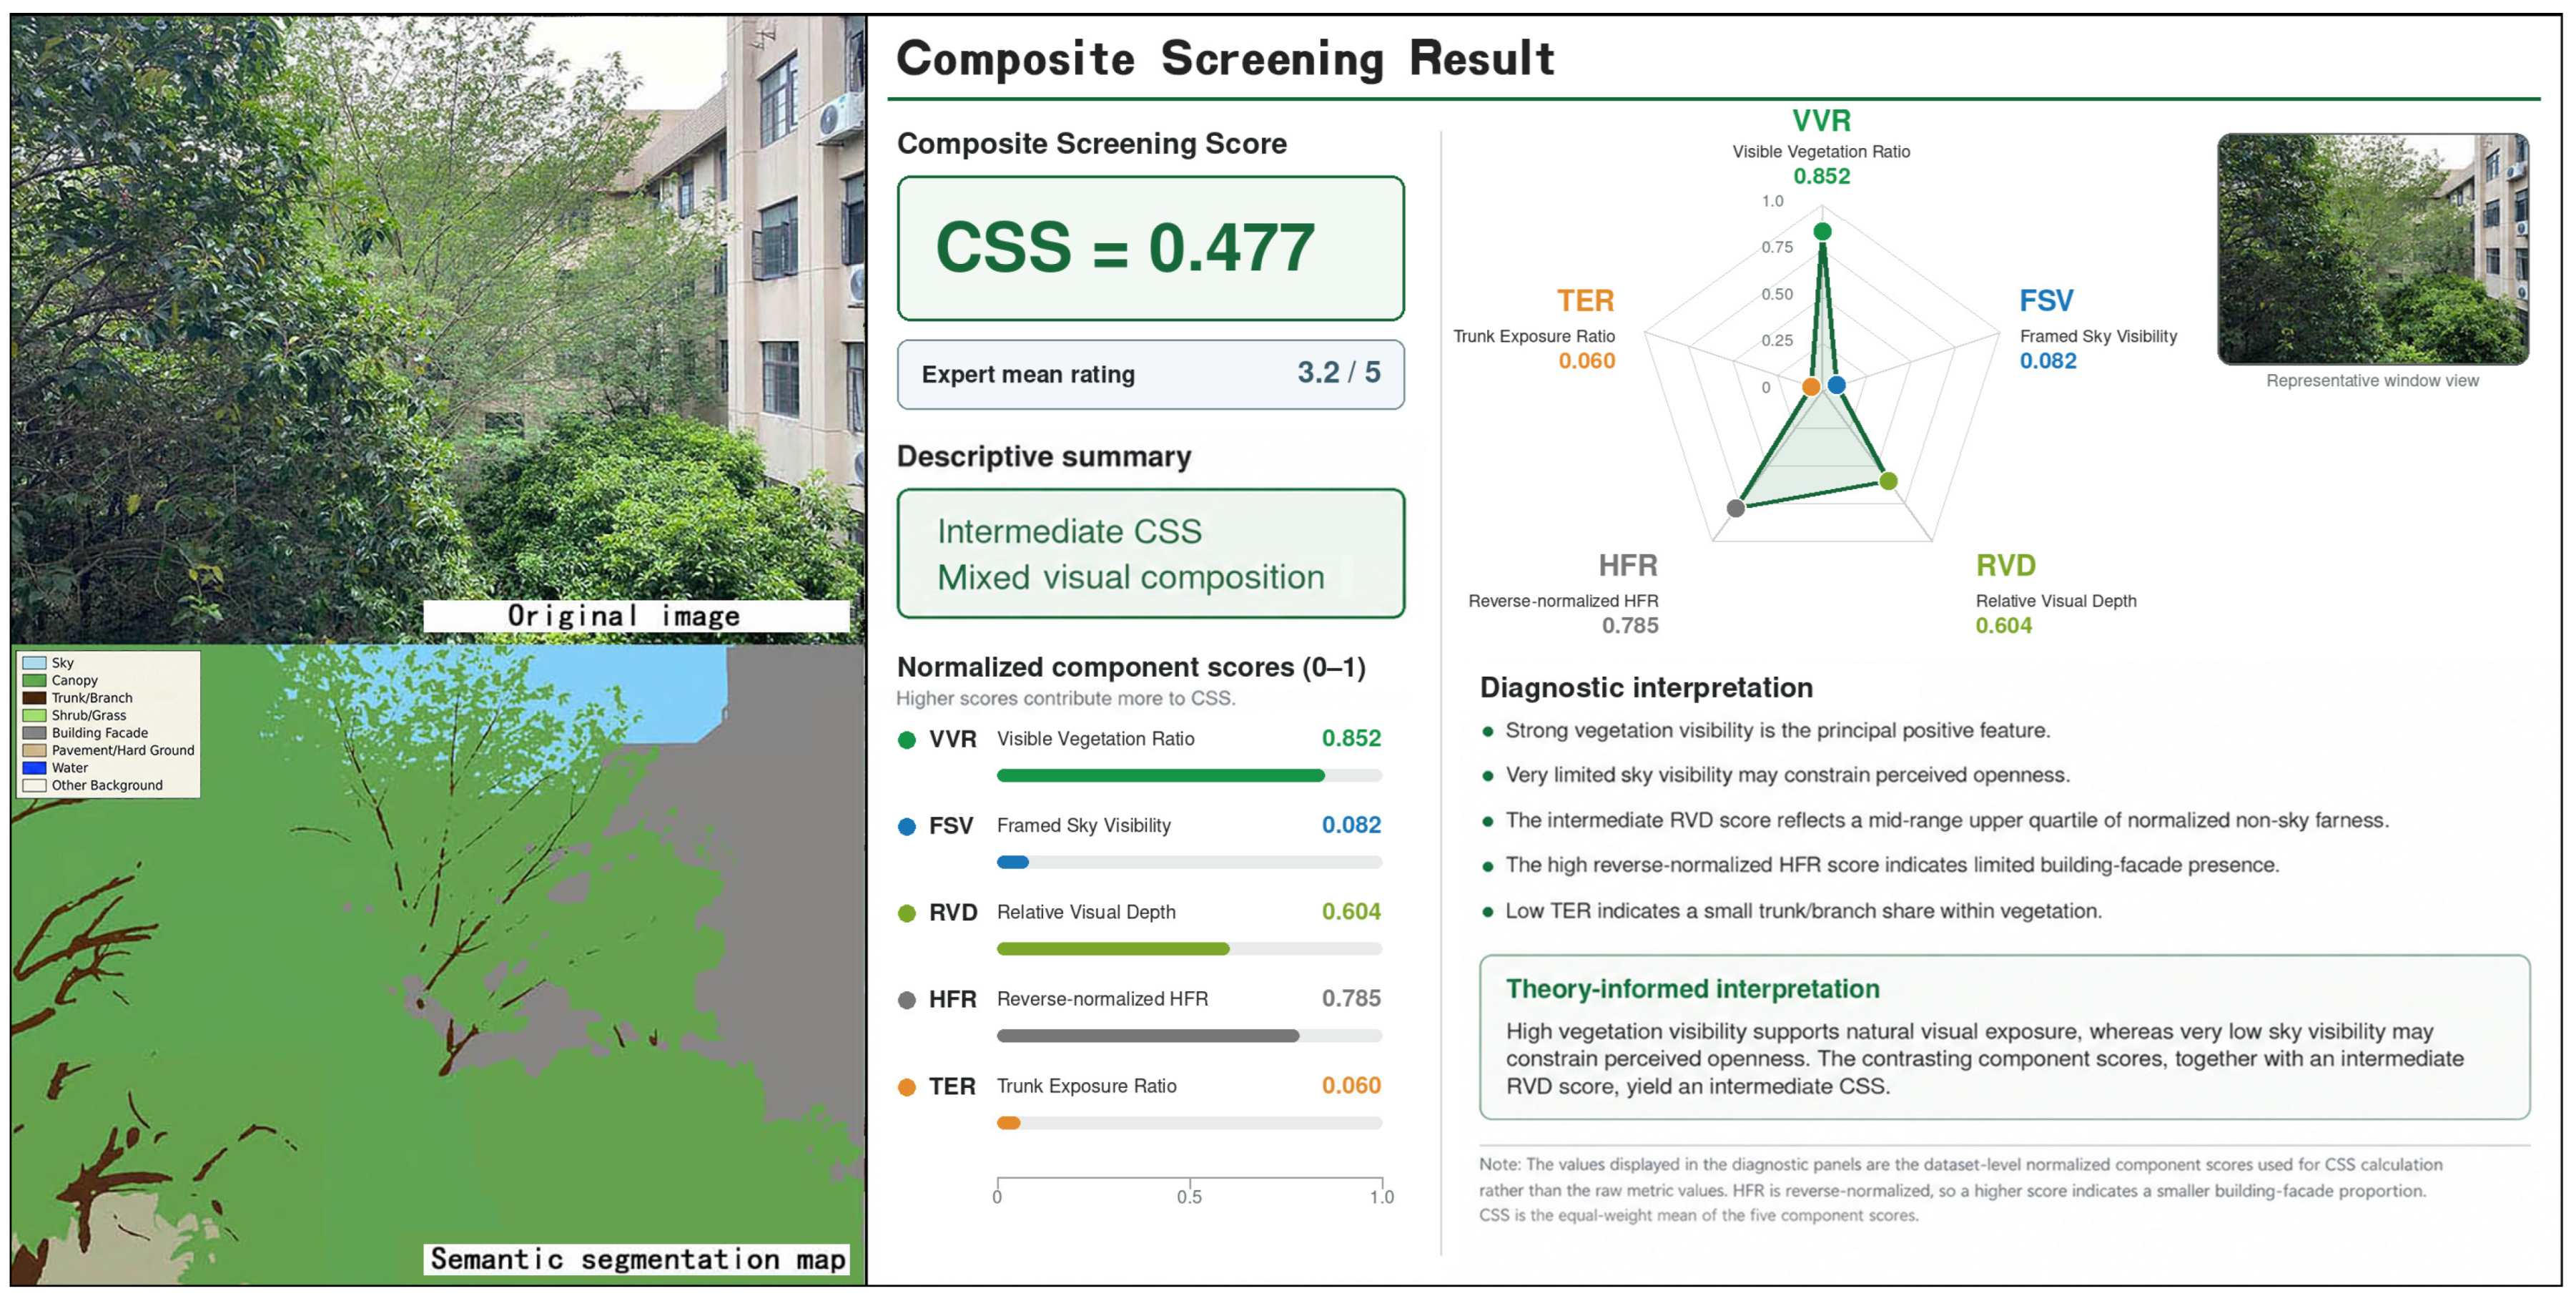
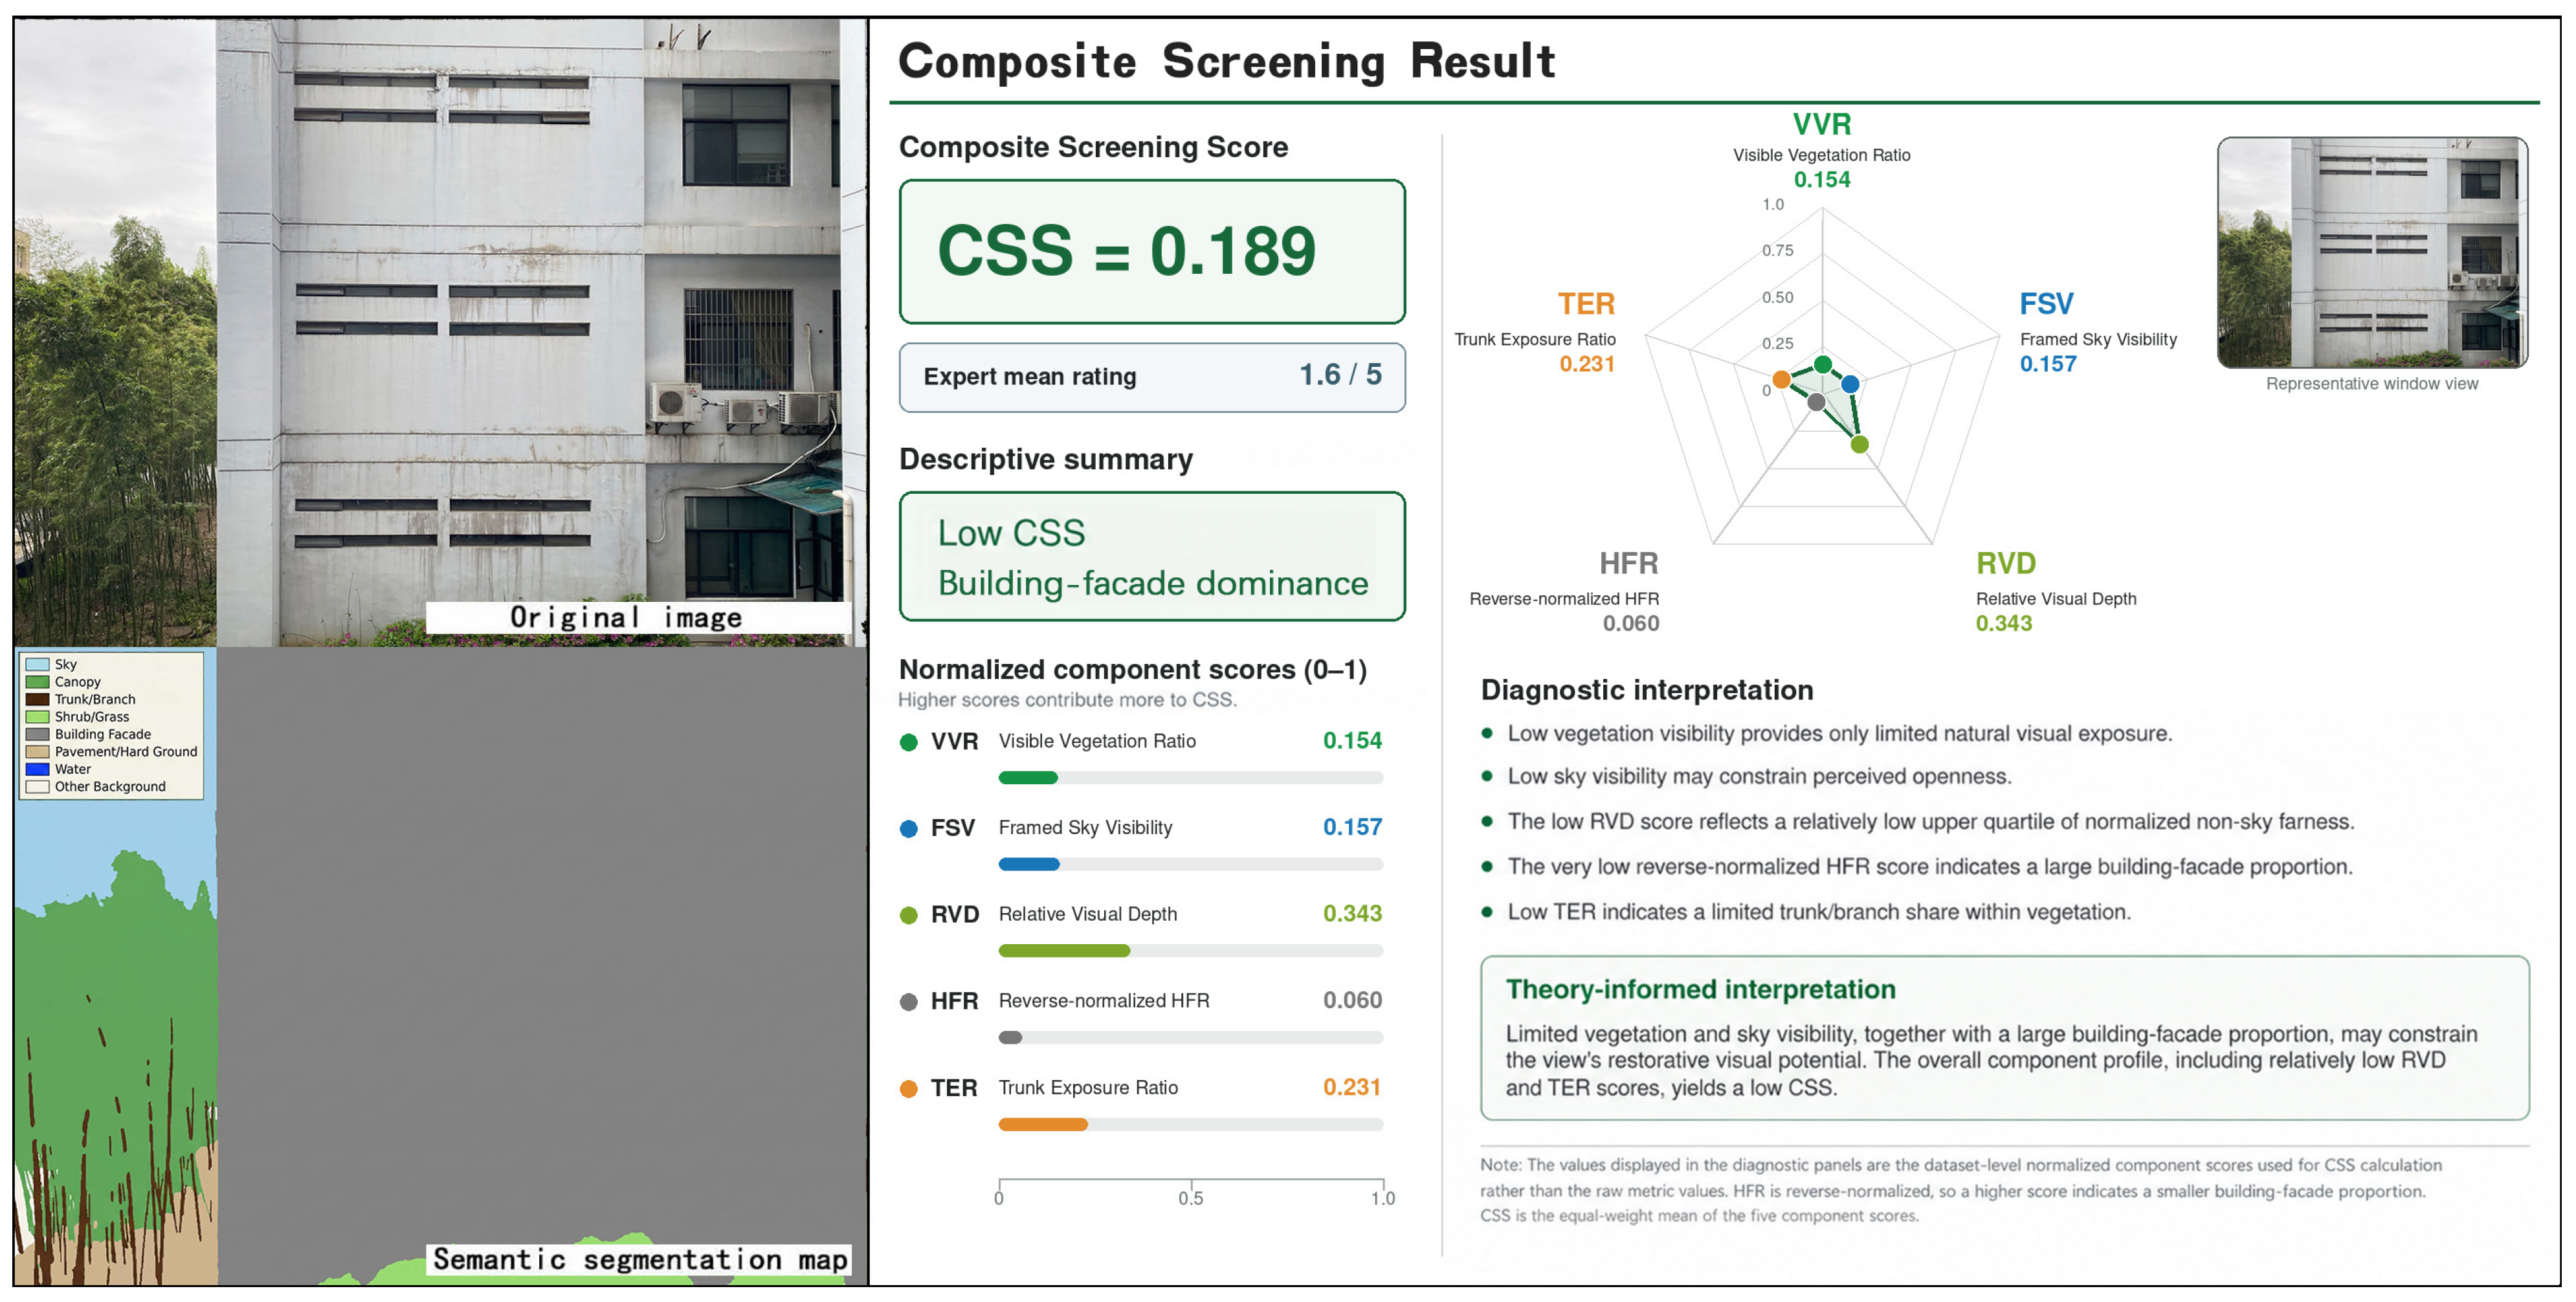
To demonstrate the diagnostic output of the AI-assisted screening prototype, this study selected representative window view samples from the upper, middle, and lower portions of the observed CSS distribution. The outputs included semantic segmentation maps, normalized component scores for the five visual proxy metrics, CSS values, and mean expert ratings.
The three representative cases showed distinct combinations of normalized component scores rather than a uniform metric profile for each CSS range. The selected high-CSS case had a comparatively low FSV component score, but its relatively high VVR, RVD, reverse-normalized HFR, and TER component scores resulted in a high overall CSS. The intermediate-CSS case showed a mixed profile, with relatively high VVR and reverse-normalized HFR scores but relatively low FSV and TER scores. The low-CSS case showed generally lower component scores, particularly a low reverse-normalized HFR score, corresponding to a high raw building-facade proportion.
The representative cases indicate that the prototype can provide CSS-based relative rankings and metric-specific information that helps identify metric-level contributors to low CSS values, such as a low visible vegetation proportion, limited sky visibility, dominance of hard facades, or a low RVD component score. Compared with a single greenness-based evaluation, this multi-metric diagnostic approach provides additional metric-level information to inform on-site inspections and subsequent campus window view improvement (Figure 2, Figure 3 and Figure 4).
Figure 2.
Diagnostic output for a classroom window view with a high CSS value.
Figure 3.
Diagnostic output for a classroom window view with an intermediate CSS value.
Figure 4.
Diagnostic output for a classroom window view with a low CSS value.
4. Discussion
4.1. Evaluation and Scalability of AI-Assisted Window View Screening in University Buildings
The primary finding of this study is that CSS provided a computable approximation of expert-based rankings: CSS-based rankings were strongly associated with the mean expert ratings of restorative visual potential (Spearman’s ρ = 0.76, p < 0.001). This finding indicates that, under standardized image-acquisition and preprocessing conditions, the proposed method can approximate the overall ordering tendency of expert judgments in a reproducible and interpretable manner. At the model level, reliable identification of sky, canopy, and building facade, together with moderate performance for shrub/grass, provided an adequate in-domain basis for calculating FSV, HFR, and VVR. TER additionally describes trunk/branch exposure within vegetation, complementing the total vegetation proportion captured by VVR.
The main practical implication of this finding is that window view evaluation for existing university building inventories can be transformed from manual image-by-image interpretation into a reproducible, computationally scalable automated screening workflow. Standardized photography from controlled indoor viewpoints and consistent image framing enables comparable assessment across classrooms, while focusing on visible outdoor landscape content provides a means of diagnosing deficiencies in window view quality without altering the fixed dimensions or positions of existing windows. For universities that need to manage many teaching spaces, the value of this automated screening workflow lies in improving the consistency and operational feasibility of preliminary window view screening and in providing a basis for subsequent on-site inspection and prioritization of improvement interventions.
4.2. Added Value of RVD Beyond Two-Dimensional Semantic Proportions
The second important finding of this study is that the VVR-only scheme showed a weaker association with expert judgments than the multi-metric schemes. The ablation analysis revealed an incremental pattern: the association with the mean expert rating increased from ρ = 0.58 for the VVR-only scheme to ρ = 0.69 after FSV, HFR, and TER were added, and further increased to ρ = 0.76 after RVD was incorporated into the complete five-metric scheme. Within the current sample, the inclusion of RVD increased the association between the tool-generated scores and expert rankings beyond that achieved by the two-dimensional semantic proportion scheme.
This finding has implications for the assessment of window view quality in existing university buildings. Two window views with similar proportions of green pixels may nevertheless receive substantially different expert assessments because of differences in view distance, spatial openness, and visual obstruction. This interpretation is consistent with building-oriented window view research showing that viewing distance, sky visibility, spatial openness, and obstruction by nearby facades contribute to window view evaluation beyond the amount of visible greenery [15,16,19,26,27,50,51]. A window view with strong foreground vegetation obstruction may have a high VVR, but it may simultaneously compress the visual field and weaken visual extension. By contrast, vegetation or open spaces with mid- to far-distance layers may provide natural exposure, openness, and perceived depth at the same time [19,50,51]. RVD adds a distributional descriptor to the semantic composition measures by summarizing the upper-quartile position of normalized non-sky farness values. Images with similar semantic proportions may therefore differ in RVD, allowing the scoring framework to consider variation in predicted depth distributions alongside visible scene composition.
Restorative environment theory and window view research support considering multiple visual attributes in window view assessment [11,14,52]. VVR primarily represents visible vegetation, whereas TER complements this measure by describing trunk/branch exposure within vegetation. FSV and HFR describe sky visibility and building-facade proportion, respectively, while RVD adds information on the normalized non-sky farness distribution. Together, these metrics integrate scene composition, vegetation structure, and relative depth information to support interpretable screening of classroom window views.
4.3. Implications for Facility Management and Window View Improvement in University Buildings
High CSS values may arise from different combinations of normalized component scores, with some window views showing relatively high VVR scores and others showing more favorable combinations of FSV and RVD scores. Conversely, lower CSS values may reflect combinations of limited sky visibility, high building-facade proportions, or low RVD component scores. These different component-score profiles provide a basis for using CSS results in facility management and identifying potential window view improvement priorities in existing university buildings.
At the facility-management scale, the standardized outputs can be used to establish window view inventories for teaching spaces, identify low-scoring window views, and prioritize locations for on-site verification.
At the design and renewal scale, the component metrics help identify different visual characteristics contributing to low CSS values: low VVR indicates limited visible vegetation, high HFR reflects building-facade dominance, low FSV indicates restricted sky visibility, and low RVD reflects a lower upper-quartile relative-farness value. In tree-dominated window views, TER can be considered alongside the original images and the visible canopy and shrub/grass proportions to help interpret understory visual permeability and vegetation structural layering. Therefore, window view optimization should not aim only to increase greenness. Instead, the metric profiles can inform site-specific improvement options following on-site verification. For window views with limited visible vegetation, additional planting could be considered. For views dominated by nearby hard facades, selective facade greening [53], carefully positioned landscape screening, or the concealment of visually intrusive equipment may help reduce the visual dominance of artificial interfaces without introducing additional foreground obstruction. Where on-site inspection confirms excessive foreground vegetation obstruction, visual corridors and distant views may be preserved or restored where feasible [26]. In this sense, CSS and its component metrics can connect building-level window view inventories with on-site verification and the prioritization of landscape or facility interventions in existing university buildings.
4.4. Limitations and Future Research
This study has several limitations. First, the dataset was collected from a single campus during the spring growing season, with weather, lighting, and camera viewpoints standardized to improve comparability during initial method development. Changes in lighting, seasonal foliage, and viewing position may affect image-derived metrics and CSS rankings; therefore, the reported segmentation performance, CSS–expert association, and ranking stability require further validation across other campuses, building forms, seasons, and image-acquisition conditions. Second, CSS is a composite screening index based on visual proxy metrics, and the current validation is primarily based on professional expert judgment, which may also reflect broader perceptions of visual quality. Although the strong association between CSS and the mean expert rating supports its screening value, it does not establish a direct relationship between CSS and students’ actual restorative responses. The panel’s disciplinary composition and awareness of the rating purpose, together with CSS-stratified sampling and subsequent manual adjustments, may have influenced the observed CSS–expert association. Third, semantic segmentation errors may affect the calculation of some metrics [42], particularly TER, which depends on the low-frequency and morphologically slender trunk/branch class. Future research could use learning-curve analysis to examine how segmentation performance changes with additional annotated training images, particularly for infrequent classes. Fourth, the five metrics were standardized using min–max normalization based on the empirical ranges of the current 812-image dataset. Consequently, the resulting CSS values are sample-dependent. Direct comparisons across campuses or seasons would require common reference ranges, harmonized image-acquisition and processing procedures, and external calibration and validation across contexts. Context-specific recalibration may support relative screening within a new dataset, but it does not by itself establish comparability with other datasets (Supplementary Materials S4). Fifth, RVD depends on the predicted within-image depth distribution. In scenes with limited genuine depth variation, normalization may accentuate prediction noise and affect the resulting P75 summary. Its correspondence with independently measured scene-depth distributions requires further evaluation.
Future research should first conduct external validation across campuses with different building forms, landscape configurations, and climatic contexts. Second, repeated image acquisition across seasons, lighting conditions, and seated viewpoints would help assess variation in the visual metrics and CSS rankings. Third, future validation should compare CSS with student assessments and changes in psychological, cognitive, or physiological outcomes during exposure to window views, including in real teaching contexts, to further examine whether CSS provides information about actual restorative responses beyond its correspondence with expert judgments. Fourth, further validation against spatial reference data should examine the relationship between RVD and scene-depth distributions across different window view types. Future research should investigate metric-weight calibration based on student assessments across campuses and metric reliability, with revised weighting schemes independently validated. After these priorities have been addressed, future studies may further examine whether higher-performing segmentation models, such as SegFormer [54] and Mask2Former [55], can improve the robustness of vegetation-structure metrics, particularly TER.
5. Conclusions
This study developed an AI-assisted method for the relative screening of the restorative visual potential of classroom window views in university buildings. The framework integrates DeepLabV3+ semantic segmentation with MiDaS monocular relative depth estimation to characterize both scene composition and relative depth distributions in standardized fixed-frame window view images. The method was applied to 812 classroom window view images, and the segmentation model achieved an mIoU of 0.76 on the independent test set. In a blind expert rating evaluation involving five experts and 80 representative images, CSS showed a strong positive association with the mean expert rating (Spearman’s ρ = 0.76, p < 0.001). The ablation analysis further showed that the complete five-metric scheme incorporating RVD had a higher observed correlation with expert ratings than the vegetation-only and two-dimensional semantic proportion schemes, suggesting that RVD may provide complementary information beyond semantic composition within the current sample.
For the management and renewal of existing university buildings, the proposed framework can support the establishment of classroom window view inventories, relative screening, the identification of metric-level contributors to low CSS values, and the prioritization of on-site verification to inform potential landscape or facility interventions. The current evaluation is based on expert judgments of standardized images, and further validation involving student responses and additional campuses or seasons would support broader application of the framework.
Supplementary Materials
The following supporting information can be downloaded at https://www.mdpi.com/article/10.3390/buildings16214462/s1: Figure S1: Representative classroom window-view images selected for pixel-level annotation; Figure S2: Representative classroom window-view images from the expert-rating subset; Table S1: Building and floor coverage of classroom window-view image acquisition; Supplementary Materials S4: Application to a New Campus.
Author Contributions
Conceptualization, J.J. and Q.Z.; methodology, J.J. and F.D.; software, F.D.; validation, R.T. and F.D.; formal analysis, J.J. and F.D.; investigation, J.J. and S.H.; resources, J.J. and Q.Z.; data curation, J.J.; writing—original draft preparation, J.J.; writing—review and editing, F.D., R.T., S.H., and Q.Z.; visualization, J.J. and F.D.; supervision, Q.Z.; project administration, Q.Z. All authors have read and agreed to the published version of the manuscript.
Funding
This research was supported by the Humanity and Social Science Foundation of Ministry of Education of China (20YJAZH115).
Institutional Review Board Statement
Ethical review and approval were not required for this study because the only human involvement consisted of anonymous professional expert ratings of non-sensitive outdoor window view images, with no intervention or collection of identifiable personal, medical, or sensitive information. The image dataset contained only outdoor window view scenes, and images containing identifiable individuals were excluded.
Informed Consent Statement
Informed consent was obtained from all experts involved in the study.
Data Availability Statement
The data presented in this study are available on request from the corresponding author. The data presented in this study are part of an ongoing doctoral research project; therefore, some of the data cannot be made publicly available at this stage.
Conflicts of Interest
The authors declare no conflicts of interest.
Abbreviations
The following abbreviations are used in this manuscript:
| ART | Attention Restoration Theory |
| SRT | Stress Recovery Theory |
| CSS | Composite Screening Score |
| VVR | Visible Vegetation Ratio |
| FSV | Framed Sky Visibility |
| RVD | Relative Visual Depth |
| HFR | Hard Facade Ratio |
| TER | Trunk Exposure Ratio |
| SVF | Sky View Factor |
| CNN | Convolutional neural network |
| IoU | Intersection over union |
| mIoU | Mean intersection over union |
| ICC | Intraclass correlation coefficient |
Appendix A
Table A1.
DeepLabV3+ model configuration and training settings.
References
- Ko, W.H.; Schiavon, S.; Zhang, H.; Graham, L.T.; Brager, G.; Mauss, I.; Lin, Y.-W. The Impact of a View from a Window on Thermal Comfort, Emotion, and Cognitive Performance. Build. Environ. 2020, 175, 106779. [Google Scholar] [CrossRef] [Scilit]
- Li, D.; Sullivan, W.C. Impact of Views to School Landscapes on Recovery from Stress and Mental Fatigue. Landsc. Urban Plan. 2016, 148, 149–158. [Google Scholar] [CrossRef] [Scilit]
- Kaplan, R.; Kaplan, S. The Experience of Nature: A Psychological Perspective; Cambridge University Press: Cambridge, UK, 1989. [Google Scholar]
- Ulrich, R.S.; Simons, R.F.; Losito, B.D.; Fiorito, E.; Miles, M.A.; Zelson, M. Stress Recovery during Exposure to Natural and Urban Environments. J. Environ. Psychol. 1991, 11, 201–230. [Google Scholar] [CrossRef] [Scilit]
- Sun, K.; Li, Z.; Zheng, S.; Qu, H. Quantifying Environmental Characteristics on Psychophysiological Restorative Benefits of Campus Window Views. Build. Environ. 2024, 262, 111822. [Google Scholar] [CrossRef] [Scilit]
- Jiang, Y.; Li, N.; Yongga, A.; Yan, W. Short-Term Effects of Natural View and Daylight from Windows on Thermal Perception, Health, and Energy-Saving Potential. Build. Environ. 2022, 208, 108575. [Google Scholar] [CrossRef] [Scilit]
- Lin, T.Y.; Le, A.V.; Chan, Y.C. Evaluation of Window View Preference Using Quantitative and Qualitative Factors of Window View Content. Build. Environ. 2022, 213, 108886. [Google Scholar] [CrossRef] [Scilit]
- Zhang, Y.; Tang, Y.; Wang, X.; Tan, Y. The Effects of Natural Window Views in Classrooms on College Students’ Mood and Learning Efficiency. Buildings 2024, 14, 1557. [Google Scholar] [CrossRef] [Scilit]
- Benfield, J.A.; Rainbolt, G.N.; Bell, P.A.; Donovan, G.H. Classrooms With Nature Views: Evidence of Differing Student Perceptions and Behaviors. Environ. Behav. 2015, 47, 140–157. [Google Scholar] [CrossRef] [Scilit]
- Jing, X.; Liu, C.; Li, J.; Gao, W.; Fukuda, H. Effects of Window Green View Index on Stress Recovery of College Students from Psychological and Physiological Aspects. Buildings 2024, 14, 3316. [Google Scholar] [CrossRef] [Scilit]
- Ko, W.H.; Kent, M.G.; Schiavon, S.; Levitt, B.; Betti, G. A Window View Quality Assessment Framework. LEUKOS 2022, 18, 268–293. [Google Scholar] [CrossRef] [Scilit]
- Feng, J.; Qu, H.; Sun, K.; Ma, F. Restorative Benefits of Campus Window Views: Evidence from an Orthogonal Experiment. Build. Environ. 2026, 305, 115204. [Google Scholar] [CrossRef] [Scilit]
- Chang, S.W.; Schiavon, S. Effects of Window View Attributes on Occupants’ View Satisfaction: Findings from Human Subject Experiments Evaluating Actual Window Views. Build. Environ. 2026, 290, 114164. [Google Scholar] [CrossRef] [Scilit]
- Kaplan, S. The Restorative Benefits of Nature: Toward an Integrative Framework. J. Environ. Psychol. 1995, 15, 169–182. [Google Scholar] [CrossRef] [Scilit]
- Masoudinejad, S.; Hartig, T. Window View to the Sky as a Restorative Resource for Residents in Densely Populated Cities. Environ. Behav. 2020, 52, 401–436. [Google Scholar] [CrossRef] [Scilit]
- Drobne, S.; Zbašnik-Senegačnik, M.; Kristl, Ž.; Koprivec, L.; Fikfak, A. Analysis of the Window Views of the Nearby Façades. Sustainability 2022, 14, 269. [Google Scholar] [CrossRef] [Scilit]
- He, S.; Zhang, W.; Guan, Y. The Impact of Building Windows on Occupant Well-Being: A Review Integrating Visual and Non-Visual Pathways with Multi-Objective Optimization. Buildings 2025, 15, 2577. [Google Scholar] [CrossRef] [Scilit]
- Kristl, Ž.; Fošner, A.; Zbašnik-Senegačnik, M. Tolerance to Urban Window Views with Various Design Features. Buildings 2025, 15, 914. [Google Scholar] [CrossRef] [Scilit]
- Yao, T.; Lin, W.; Bao, Z.; Zeng, C. Natural or Balanced? The Physiological and Psychological Benefits of Window Views with Different Proportions of Sky, Green Space, and Buildings. Sustain. Cities Soc. 2024, 104, 105293. [Google Scholar] [CrossRef] [Scilit]
- Zhang, X.; Lin, E.S.; Tan, P.Y.; Qi, J.; Ho, R.; Sia, A.; Waykool, R.; Song, X.P.; Olszewska-Guizzo, A.; Meng, L.; et al. Beyond Just Green: Explaining and Predicting Restorative Potential of Urban Landscapes Using Panorama-Based Metrics. Landsc. Urban Plan. 2024, 247, 105044. [Google Scholar] [CrossRef] [Scilit]
- Li, M.; Xue, F.; Wu, Y.; Yeh, A.G.O. A Room with a View: Automatic Assessment of Window Views for High-Rise High-Density Areas Using City Information Models and Deep Transfer Learning. Landsc. Urban Plan. 2022, 226, 104505. [Google Scholar] [CrossRef] [Scilit]
- Ingabo, S.N.; Chan, Y.-C. Contextual Evaluation of the Impact of Dynamic Urban Window View Content on View Satisfaction. Build. Environ. 2025, 267, 112303. [Google Scholar] [CrossRef] [Scilit]
- Li, M.; Yeh, A.G.O.; Xue, F. CIM-WV: A 2D Semantic Segmentation Dataset of Rich Window View Contents in High-Rise, High-Density Hong Kong Based on Photorealistic City Information Models. Urban Inform. 2024, 3, 12. [Google Scholar] [CrossRef] [Scilit]
- Li, M.; Xue, F.; Yeh, A.G.O. Efficient and Accurate Assessment of Window View Distance Using City Information Models and 3D Computer Vision. Landsc. Urban Plan. 2025, 260, 105389. [Google Scholar] [CrossRef] [Scilit]
- Matusiak, B.S.; Klöckner, C.A. How We Evaluate the View out through the Window. Archit. Sci. Rev. 2016, 59, 203–211. [Google Scholar] [CrossRef] [Scilit]
- Kent, M.; Schiavon, S. Evaluation of the Effect of Landscape Distance Seen in Window Views on Visual Satisfaction. Build. Environ. 2020, 183, 107160. [Google Scholar] [CrossRef] [Scilit]
- Abd-Alhamid, F.; Kent, M.; Wu, Y. Quantifying Window View Quality: A Review on View Perception Assessment and Representation Methods. Build. Environ. 2023, 227, 109742. [Google Scholar] [CrossRef] [Scilit]
- Chen, L.-C.; Zhu, Y.; Papandreou, G.; Schroff, F.; Adam, H. Encoder-Decoder with Atrous Separable Convolution for Semantic Image Segmentation. In Proceedings of the European Conference on Computer Vision (ECCV), Munich, Germany, 8–14 September 2018; pp. 801–818. [Google Scholar]
- Ranftl, R.; Lasinger, K.; Hafner, D.; Schindler, K.; Koltun, V. Towards Robust Monocular Depth Estimation: Mixing Datasets for Zero-Shot Cross-Dataset Transfer. IEEE Trans. Pattern Anal. Mach. Intell. 2022, 44, 1623–1637. [Google Scholar] [CrossRef] [Scilit]
- Stamps, A.E. Visual Permeability, Locomotive Permeability, Safety, and Enclosure. Environ. Behav. 2005, 37, 587–619. [Google Scholar] [CrossRef] [Scilit]
- Saltelli, A.; Ratto, M.; Andres, T.; Campolongo, F.; Cariboni, J.; Gatelli, D.; Saisana, M.; Tarantola, S. Global Sensitivity Analysis; The Primer Wiley: Chichester, UK, 2007; ISBN 978-0-470-05997-5. [Google Scholar]
- Aries, M.B.C.; Veitch, J.A.; Newsham, G.R. Windows, View, and Office Characteristics Predict Physical and Psychological Discomfort. J. Environ. Psychol. 2010, 30, 533–541. [Google Scholar] [CrossRef] [Scilit]
- Sevenant, M.; Antrop, M. Landscape Representation Validity: A Comparison between On-Site Observations and Photographs with Different Angles of View. Landsc. Res. 2011, 36, 363–385. [Google Scholar] [CrossRef] [Scilit]
- Panero, J.; Zelnik, M. Human Dimension & Interior Space: A Source Book of Design Reference Standards; Whitney Library of Design: New York, NY, USA, 1979. [Google Scholar]
- Russell, B.C.; Torralba, A.; Murphy, K.P.; Freeman, W.T. LabelMe: A Database and Web-Based Tool for Image Annotation. Int. J. Comput. Vis. 2008, 77, 157–173. [Google Scholar] [CrossRef] [Scilit]
- Roberts, D.R.; Bahn, V.; Ciuti, S.; Boyce, M.S.; Elith, J.; Guillera-Arroita, G.; Hauenstein, S.; Lahoz-Monfort, J.J.; Schröder, B.; Thuiller, W.; et al. Cross-validation Strategies for Data with Temporal, Spatial, Hierarchical, or Phylogenetic Structure. Ecography 2017, 40, 913–929. [Google Scholar] [CrossRef] [Scilit]
- Paszke, A.; Gross, S.; Massa, F.; Lerer, A.; Bradbury, J.; Chanan, G.; Killeen, T.; Lin, Z.; Gimelshein, N.; Antiga, L.; et al. PyTorch: An Imperative Style, High-Performance Deep Learning Library. In Proceedings of the Advances in Neural Information Processing Systems (NeurIPS 2019), Vancouver, BC, Canada, 8–14 December 2019; pp. 8024–8035. [Google Scholar]
- He, K.; Zhang, X.; Ren, S.; Sun, J. Deep Residual Learning for Image Recognition. In Proceedings of the 2016 IEEE Conference on Computer Vision and Pattern Recognition (CVPR), Las Vegas, NV, USA, 27–30 June 2016; pp. 770–778. [Google Scholar]
- Russakovsky, O.; Deng, J.; Su, H.; Krause, J.; Satheesh, S.; Ma, S.; Huang, Z.; Karpathy, A.; Khosla, A.; Bernstein, M.; et al. ImageNet Large Scale Visual Recognition Challenge. Int. J. Comput. Vis. 2015, 115, 211–252. [Google Scholar] [CrossRef] [Scilit]
- Kingma, D.P.; Ba, J. Adam: A Method for Stochastic Optimization. In Proceedings of the 3rd International Conference on Learning Representations (ICLR 2015), San Diego, CA, USA, 7–9 May 2015. [Google Scholar]
- Johnson, J.M.; Khoshgoftaar, T.M. Survey on Deep Learning with Class Imbalance. J. Big Data 2019, 6, 27. [Google Scholar] [CrossRef] [Scilit]
- Minaee, S.; Boykov, Y.Y.; Porikli, F.; Plaza, A.J.; Kehtarnavaz, N.; Terzopoulos, D. Image Segmentation Using Deep Learning: A Survey. IEEE Trans. Pattern Anal. Mach. Intell. 2022, 44, 3523–3542. [Google Scholar] [CrossRef] [Scilit]
- Ming, Y.; Meng, X.; Fan, C.; Yu, H. Deep Learning for Monocular Depth Estimation: A Review. Neurocomputing 2021, 438, 14–33. [Google Scholar] [CrossRef] [Scilit]
- Oke, T.R. Canyon Geometry and the Nocturnal Urban Heat Island: Comparison of Scale Model and Field Observations. J. Climatol. 1981, 1, 237–254. [Google Scholar] [CrossRef] [Scilit]
- Nardo, M.; Saisana, M.; Saltelli, A.; Tarantola, S.; Hoffmann, A.; Enrico Giovannini, E. Handbook on Constructing Composite Indicators: Methodology and User Guide; OECD Publishing: Paris, France, 2008; ISBN 978-92-64-04345-9. [Google Scholar]
- Domjan, S.; Arkar, C.; Medved, S. Study on Occupants’ Window View Quality Vote and Their Physiological Response. J. Build. Eng. 2023, 68, 106119. [Google Scholar] [CrossRef] [Scilit]
- Daniel, T.C. Whither Scenic Beauty? Visual Landscape Quality Assessment in the 21st Century. Landsc. Urban Plan. 2001, 54, 267–281. [Google Scholar] [CrossRef] [Scilit]
- Koo, T.K.; Li, M.Y. A Guideline of Selecting and Reporting Intraclass Correlation Coefficients for Reliability Research. J. Chiropr. Med. 2016, 15, 155–163. [Google Scholar] [CrossRef] [Scilit]
- Kendall, M.; Gibbons, J.D. Rank Correlation Methods, 5th ed.; Edward Arnold: London, UK, 1990. [Google Scholar]
- Song, M.; Xu, M.; Wang, Y.; Lu, S.; Gong, X.; Si, R.; Xu, F. Is More Vegetation Always Better? Evaluation of Restorative Benefits and Preference for Window Views. Build. Environ. 2025, 272, 112660. [Google Scholar] [CrossRef] [Scilit]
- Wang, Y.; Wang, D.; Zhang, X. Higher Greenery Visibility Is Not Necessarily Better: A Quantitative Approach to Evaluating Window View Quality in Residential Buildings. Build. Environ. 2025, 285, 113563. [Google Scholar] [CrossRef] [Scilit]
- Samaan, L.; Klock, L.; Weber, S.; Reidick, M.; Ascone, L.; Kühn, S. Low-Level Visual Features of Window Views Contribute to Perceived Naturalness and Mental Health Outcomes. Int. J. Environ. Res. Public Health 2024, 21, 598. [Google Scholar] [CrossRef] [Scilit]
- Drobne, S.; Zbašnik-Senegačnik, M.; Kristl, Ž.; Koprivec, L. How Does Greenery on a Nearby Façade Change Perception of a Window View? Prostor 2022, 30, 14–23. [Google Scholar] [CrossRef] [Scilit]
- Xie, E.; Wang, W.; Yu, Z.; Anandkumar, A.; Alvarez, J.M.; Luo, P. SegFormer: Simple and Efficient Design for Semantic Segmentation with Transformers. In Proceedings of the Advances in Neural Information Processing Systems 34 (NeurIPS 2021), Online, 6–14 December 2021; pp. 12077–12090. [Google Scholar]
- Cheng, B.; Misra, I.; Schwing, A.G.; Kirillov, A.; Girdhar, R. Masked-Attention Mask Transformer for Universal Image Segmentation. In Proceedings of the 2022 IEEE/CVF Conference on Computer Vision and Pattern Recognition (CVPR), New Orleans, LA, USA, 19–24 June 2022; IEEE: Piscataway, NJ, USA, 2022; pp. 1280–1289. [Google Scholar]

Disclaimer/Publisher’s Note: The statements, opinions and data contained in all publications are solely those of the individual author(s) and contributor(s) and not of MDPI and/or the editor(s). MDPI and/or the editor(s) disclaim responsibility for any injury to people or property resulting from any ideas, methods, instructions or products referred to in the content. |
© 2026 by the authors. Licensee MDPI, Basel, Switzerland. This article is an open access article distributed under the terms and conditions of the Creative Commons Attribution (CC BY) license.