


Abstract
Announced bed capacity is often read as if it recorded how a city hospital is used on foot. The measured variables are that capacity and two author-adjudicated language shares in unsolicited public texts. This study tests whether announced beds rank with the hospital-level share of retrieved texts describing navigation-related difficulties or indoor walking and mobility burdens. It does not estimate a causal effect of hospital size on wayfinding performance, and it does not audit physical signage or trace routes. Across the 26 hospitals named on the ministry directory retrieved in July 2026, the complete Yandex corpus comprised 566 texts; 670 Şikayetvar complaints were kept separate and were not pooled. In that complete corpus, author-adjudicated labels marked 35 navigation-related texts and 27 walking-or-mobility texts. Primary tests used 15 hospitals with at least 15 eligible Yandex texts (486 texts; 32 navigation-related and 26 walking-or-mobility). Neither share was statistically supported after correction for the two primary tests (navigation-related: Spearman ρ = 0.512; permutation p = 0.0534; Holm-adjusted p = 0.1040; walking-or-mobility: ρ = 0.513; p = 0.0520; Holm-adjusted p = 0.1040). Removing Bilkent and Etlik weakened the walking association, through both leverage and reduced power at k = 13. OpenStreetMap building footprint ranked with announced beds (ρ = 0.876 on 14 hospitals) and, once beds were partialled out, was not independently associated with either share. The footprint is the horizontal union of mapped building polygons. It is not an estimate of foot traffic inside a multi-storey building. The longest mapped block axis runs from 205 m to 656 m, so the campuses are horizontally extended rather than towers. Visual wayfinding communication is an interpretive layer linking spatial organisation to reported navigation experience; the interior-architecture contribution is this directory-wide language test and a codebook for later audits, not a measured evaluation of spatial configurations or signage systems. The coefficients are not route lengths, signage scores or patient-level prevalences.
1. Introduction
Turkish city hospitals concentrate outpatient clinics, diagnostics and inpatient care in large, often multi-block complexes. On the mapped plans, the longest block axis runs from 205 m to 656 m, so the campuses are horizontally extended rather than towers (Section 2.2.2). That concentration can raise service capacity at the urban scale. It also lengthens indoor journeys and multiplies the points at which a visitor must choose a corridor, a floor or a block. Announced bed capacity records how large the complex is said to be. It does not record whether a writer reports getting lost or walking a long way. This paper tests whether announced bed capacity ranks with navigation-related language and with walking-or-mobility language in public texts about the 26 hospitals named on the ministry directory retrieved in July 2026. The test is a hospital-level rank association. It is not a causal estimate of size on wayfinding performance, and it is not an audit of signs or indoor routes.
A large building can still be intelligible when a visitor can follow the circulation. Architectural legibility is the environmental support for that task. Weisman, O’Neill and later interior-wayfinding reviews separate the plan, the signs and what the person already knows [1,2,3,4]. Section 2.3 sets out that evidence, including percentages from university buildings that do not transfer directly to a hospital.
Hospital studies have already joined layout to observed routes and to space syntax, including the ground floors of Konya and Etlik city hospitals. Section 2.4 reviews those single-building results [5,6,7,8,9,10,11,12,13]. The absence of hospital wayfinding research is therefore not the gap. The comparison specified here is narrower: whether announced bed capacity, across this directory, ranks with navigation-related language and with walking-or-mobility language in retrieved public texts.
Online reviews can carry that second term, and they can also mislead it. Free-text hospital comments have been classified at institution level [14]. A sentiment score is not the outcome required here. A visitor can praise the building and still report being unable to find cardiology, and a sentence that the hospital is large is not, by itself, a wayfinding failure. The text measure in this paper is a spatial-experience classification, not a star rating and not a general polarity.
Four layers that are frequently collapsed in the evaluation of large hospitals are kept apart, and they are ordered. Architectural scale leads to spatial organisation and to visual wayfinding communication; those two layers shape what a visitor experiences; unsolicited language is the trace of that experience that can be retrieved. Spatial organisation, functional medical adjacency and visual wayfinding communication were not measured here. Announced capacity, the scale used in the tests, is a bed count with a written source. Spatial organisation is the physical arrangement of departments: blocks, floors, routes and choices. A clinic name in visitor language usually names a departmental outpatient unit at that address. It is not a hierarchy separate from the departments. Visual wayfinding communication is the information layer that tells a visitor what that arrangement is: signs, names, arrows, maps, symbols, type and colour. The user outcome splits again, because getting lost is not the same event as reading a poor sign, asking for help or walking a long way. The estimated tests use the navigation-related share defined in Section 4.3. That share pools being lost, a block or floor problem, a sign complaint and asking for help. A sign complaint is a visual-communication complaint. The navigation-related union is not a visual-communication score. Announced capacity and the language shares were measured first. Physical scale was then taken from OpenStreetMap building footprints, as an extension added after the text analysis. Indoor routes, departmental adjacencies and the visual wayfinding system itself were not measured. Figure 1 draws measured associations with solid arrows and unmeasured mechanisms with dashed arrows. Figure 2 records the sampling flow from the 26-hospital directory to the 15-hospital primary tests.
Figure 1.
Measured variables and unmeasured mechanisms. The measured layer (solid arrows) is announced bed capacity, the collinear OpenStreetMap building-footprint check, and two author-adjudicated language shares (navigation-related; walking-or-mobility). Those shares are not lexicon scores. Solid arrows are hospital-level rank associations; they are not causal paths. Dashed arrows are untested mechanisms: functional medical adjacency, spatial organisation (departments placed in blocks and on floors, routes and decision points), and the visual wayfinding system (hierarchy, naming, type, pictograms, maps, colour). A sign complaint in a retrieved text is not a signage audit.
Figure 2.
Sampling and coding flow. The directory frame is 26 hospitals. Eligible Yandex texts number 566, of which 35 were navigation-related and 27 walking-or-mobility in the full corpus. Primary rank tests use 15 hospitals and 486 texts (32 and 26 marked). Şikayetvar (670 texts) is a contrast corpus and is not pooled. Holm adjustment of the two primary tests leaves both at p = 0.1040; those tests are not statistically supported. The unit of the rank tests is the hospital.
The outcome is a hospital share: marked texts divided by retrieved texts of at least 40 characters. Announced bed capacity is the ministry profile value used in the original analysis. The Yandex and Şikayetvar texts were retrieved in July 2026; they were not harvested again on 22 September 2026. The file Supplementary S24 records 22 September 2026 as the date those ministry profile URLs were entered in the identity table, not as a second collection of reviews. A language share is that marked count divided by that hospital’s eligible Yandex texts. The unit of the rank tests is the hospital, not the review. Repeating one hospital’s share across its review rows would not create additional hospitals. Figure 1 is that separation: the tested links are announced capacity, footprint and the two language shares; indoor routes and visual wayfinding communication stay outside the test. Section 4 states the codebook, the 15-text rule, the permutation test and the later OpenStreetMap layer. Section 5.2 reports the hospital comparison.
2. Background: Scale, Legibility and What Users Write
The comparison sits at the junction of six lines of work: the spatial consequences of large hospitals, architectural legibility, healthcare wayfinding, walking effort, information support and unsolicited accounts of patient experience. They are reviewed in the order that produces the model. Capacity is not physical size, and physical size is not the number of choices on a route. Distance and decision-making are different burdens. Signs can change how a configuration is used. They do not replace the configuration. What visitors write afterwards is a record of experience, and the sampling frame of that record has to be stated.
2.1. Development and Organisational Context of City Hospitals in Türkiye
City hospitals in Türkiye are a national replacement of the hospital stock, financed in part through public–private partnership under Law No. 6428 [15,16]. A July 2026 statement described 27 city hospitals in service and about 40,000 beds [17,18,19]. The sampling frame is not that operating count. It is the 26 hospitals named on the directory retrieved in July 2026 [20]. Samsun and Ordu were reported in service in July 2026 and were not on that page; neither was added after the harvest. Leaving the newest campuses out could bias the comparison if they differ in layout or in how visitors write. They had no directory profile and no review corpus in this harvest. Photographs, as-built plans, staff counts and healing-space inventories are not part of this file. None of these statements describes the walk from an entrance to a clinic; Figure 1 keeps that route outside the estimated test.
2.2. Hospital Scale and the Spatial Consequences of Large Complexes
Announced beds, floor area, block count and the public route from entrance to clinic are different descriptions of a large hospital. Two hospitals with the same bed count can still differ in footprint and in circulation. Capacity scale, physical scale and circulation scale are therefore kept apart. A bed count can enter the model as capacity. It cannot stand for the route.
2.2.1. Functional Medical Adjacency and Accessibility Constraints
The clinical hierarchy of a hospital is its departments. Blocks, floors and clinics are not a substitute for that hierarchy. A department is reached at a physical address, commonly a block and a floor on these campuses, and a clinic name in visitor language usually names the departmental outpatient unit at that address. The block-or-floor code records a writer who cannot identify that address. It does not reorganise the hospital by blocks. Medical programme and building technology are what keep the complex from being an ordinary large building. Imaging rooms, operating and intensive-care adjacencies, controlled emergency access, service cores and the public information system fix where a department sits and how a visitor is told to move. Those features are constitutive of the hospital. They are not measured predictors. A similar number of beds does not imply an equivalent clinical programme or circulation network. A hospital is arranged around the procedures it is built to deliver. Outpatient clinics, imaging, laboratories and pharmacies form public-access chains that a visitor must follow; emergency, operating and intensive-care units follow a different adjacency and isolation logic, with controlled access that is not the same as the public route to a clinic. Departmental proximity requirements, diagnostic pathways and the distribution of outpatient units can alter both the physical effort and the navigational complexity of hospital visits. Two hospitals with the same announced bed count can therefore differ in block layout, in public choice points and in walking load even when footprint is similar. Inter-department connection and isolation are circulation-scale quantities. Hospital-specific department networks were not available and were therefore not included as measured predictors. No medical-profile variable, no adjacency matrix and no isolation index enters the rank tests. These characteristics remain plausible explanatory factors rather than observed predictors, and no causal pathway from bed capacity to navigation experience can be established [21,22,23].
Large medical centres have been associated with stress, wayfinding difficulty and spatial disorientation, and circulation has received less research attention than other parts of the building [24]. A review of 102 layout studies grouped the challenges as overcrowding, waiting, visibility, wayfinding and walkability, among others [21]. The same programme later specified a configuration model and a design-support architecture in which patient walking distance and wayfinding difficulty are separate criteria [22,23]. That separation is the one this paper uses between access burden and spatial complexity. Bed counts describe the complex. They do not describe the journey to a clinic.
2.2.2. Plan Extent of the Campuses
Among the 14 primary hospitals with a mapped footprint, the layout is horizontally extended rather than a vertical tower. The longest mapped block axis runs from 205 m at Manisa to 656 m at Etlik, and mapped block counts run from 1 at Kocaeli to 18 at Kartal. Thirteen of those fourteen campuses have more than one mapped block. A vertical point-tower would be read from a short footprint together with a high storey count, and that combination is not present in these plans. Figure 3 draws three of them at one scale: Etlik, a spread campus of 15 mapped blocks; Bilkent, four mapped blocks on a long footprint; and Göztepe, a smaller campus of six mapped blocks. The drawing is the OpenStreetMap ground projection retrieved on 24 September 2026. It records that horizontal extent. Each panel is titled Graphic scale and Solar orientation. Graphic scale is the 200 m bar. Solar orientation is the north arrow, which is grid north of the projected plan. It is not an as-built floor plan.
Figure 3.
OpenStreetMap plan outlines of three primary-set campuses, drawn to the same scale from the 24 September 2026 extract. The plans are horizontally extended rather than towers: the longest block axes are 656 m, 597 m and 277 m. Grey polygons are mapped building footprints. The black line is the campus outline. (a) Etlik: 4050 announced beds, 15 mapped blocks, longest block axis 656 m, footprint 211,732 m2. (b) Bilkent: 4050 beds, four mapped blocks, longest block axis 597 m, footprint 147,739 m2; area-weighted mean 6.95 storeys, the only primary campus whose storey tags cover at least 80% of footprint area. (c) Göztepe: 815 beds, six mapped blocks, longest block axis 277 m, footprint 19,460 m2. Each panel is titled in English. Graphic scale marks the 200 m bar. Solar orientation marks the north arrow. The three panels use one scale, so the bars are equal. The arrow is grid north of the projected plan. It is not a sun-path or shadow study. About seven storeys on a plan of this length is a low- to mid-rise campus. These are ground projections. They are not architectural floor plans, sections, three-dimensional models, interior department maps or pedestrian routes.
Where height can be read, it agrees with the plan. Gross floor area is stored only where building: levels tags cover at least 80% of footprint area (Supplementary S23). In the primary set, that condition holds only at Bilkent (tagged share 0.997; estimated gross floor area 1,027,196 m2; area-weighted mean 6.95 storeys on a footprint of 147,739 m2). Outside the primary set, it also holds at Balıkesir (mean 7.00) and Kütahya (mean 6.00). A mean near seven storeys on a footprint hundreds of metres long is a low- to mid-rise campus, not a tower. The untagged campuses are not given a separate height rank. No section or three-dimensional model was drawn, because a storey tag is not a measured section.
2.3. Spatial Legibility, Complexity, and Wayfinding
Wayfinding is the sequence by which a person orients, chooses a route, acts at decision points and reaches a destination. Architectural legibility is the environmental support for that sequence [1,2]. In ten university buildings, judged plan simplicity accounted for 56% of the variance in self-reported disorientation, and familiarity accounted for 9% [1]. The setting was not a hospital, and the outcome was self-report. The plan and the person’s knowledge are separate terms. O’Neill separates configuration, its cognitive representation and observed wayfinding, and treats floor-plan configuration and signage as factors that can be varied independently [2,3]. Signs do not cancel a difficult plan. Whether any campus in this directory repeats similar towers and undifferentiated corridors is not known here, and no entrance-to-clinic length was measured.
An integrative review places floor-plan configuration, landmarks, signs and maps among the environmental factors, and more complex plans are associated with longer travel, wrong turns and backtracking [4]. In hospitals, route choice follows the configuration people can see, not only the shortest line on a drawing [25], and topological knowledge of a layout develops with use, so a first visit and a familiar visit are not the same task [26]. Space syntax describes the building as a network of permeability [27]. A PRISMA review of 38 studies found that the field relates spatial properties to experience by description, correlation and regression [28]. Integration, choice and depth belong to that family. They are not a counted decision point on a stated route.
2.4. Healthcare Wayfinding and Spatial Configuration
Hospital wayfinding studies usually stay inside one building. A video simulation tested drivers’ turn decisions at a parking entrance rather than pedestrians inside a clinic corridor [29]. Observed routes have been set beside visibility graphs [5]. Circulation complexity in the Milad 1000-bed hospital was related to wayfinding behaviour [9]. Space syntax has been used to plan a wayfinding system in Taiwan [10], and a 2026 study of one medical centre pairs spatial complexity with the distribution of signs [11]. A bibliometric review covers the literature from 1974 to 2020 [12]. Plan, virtual reality and observed behaviour have been compared in healthcare buildings [13]. In Türkiye, the ground floor of Konya City Hospital has been analysed with space syntax, and a doctoral thesis examined wayfinding in that circulation [6,7]. The ground floor of Etlik City Hospital has been analysed with space syntax and visibility graphs [8]. Each study answers a question about one plan. None places the city-hospital directory on one route indicator.
Ge and colleagues combined space-syntax indicators with an on-site task in three tertiary hospitals: 50 participants and 600 observations across four outpatient zones. Hesitation time and hesitation count were higher in visually complex layouts than in regular ones, and age and education changed the size of those associations [30]. That is evidence that outpatient configuration and wayfinding behaviour can be measured together. It is not a census of this directory, and this paper does not repeat the task.
The campus outside the front door is a different segment. At one large hospital, space syntax together with vehicle shadowing and pedestrian mapping in the arrival zone covered 219 vehicles and 2096 pedestrian behaviours. Connectivity and integration were correlated with both volumes [31]. A campus that is hard to reach by bus is not a clinic that is hard to find after the entrance. Campus-transport language is therefore kept separate from indoor wayfinding language.
2.5. Walking Distance, Access Burden, and Patient Effort
A long straight corridor is physically heavy and cognitively simple. A short route with many junctions and a change of block or floor is cognitively heavy and may still be short. Hospital design-support models already list walking distance and wayfinding difficulty as separate outputs [22,23].
2.6. Visual Wayfinding Communication
Wayfinding is produced neither by the plan alone nor by the sign alone. Arthur and Passini treat architecture, graphic information and spoken help as one process [32]. Calori and Vanden-Eynden treat the information system as a question of where a message is offered as well as what it says [33]. As used here, hospital wayfinding is the correspondence between spatial organisation and the visual information that communicates it. Plan and signs can be varied independently [3]. A difficult plan is not repaired by declaring that signs exist.
A review of 34 publications grouped signing recommendations into text, hierarchy, symbols, colour, standardisation, the user, legibility, language and placement, and noted that an expanded hospital often inherits a system that no longer matches the plan [34]. In three Portuguese hospitals, 1287 patients and visitors often rated the signs positively and still ignored them and asked staff [35]. A favourable opinion of the signs is not evidence that the signs carried the route. Symbol comprehension varies with the user and the symbol [36]. Asking is a coping behaviour. It is not proof that a sign failed, and it is not the same event as being lost.
A virtual-hospital experiment compared an existing sign system with a redesigned one in 64 participants [37]. That is a test of an information system, not of bed capacity, and it is not a measurement of a city hospital in Türkiye. The medical-centre study cited above locates 194 signs on axial and visibility maps and separates spatial complexity from informational support [11]. It supplies no sign map for this directory.
The codes only partly respect that distinction. Getting lost, missing the block or the floor, a missing or contradictory sign, and having to ask are entered together in the navigation-related share. The first two are navigation outcomes. The sign mark is closer to a visual-communication cause. Asking is a coping behaviour. Pooling them answers whether capacity ranks with a broad navigation complaint. It does not answer whether the visual system failed. What was measured is that four-part language union, the walking-or-mobility union, announced beds, and, later, mapped footprint. What was not measured is the sign system itself: hierarchy, naming, directional continuity, typography, contrast, pictograms, colour, maps and landmarks. Those elements supply the frame for reading a sign complaint, a missed block or floor, and a request for directions in the retrieved texts. An audit of those elements would be a second study. It is not a result of this one, and the navigation-related union is not that audit. A statement that the signs were sufficient is kept out of the difficulty share. Walking-or-mobility language stays outside it, because a long indoor walk is a physical load, not a failure to read a sign. Section 5.3 now reports the four navigation marks one by one against capacity, so that a sign complaint is not treated as if it were the same event as asking.
2.7. Post-Occupancy Evaluation and User Experience
Ulrich and colleagues placed wayfinding among healthcare-environment topics with a usable evidence base [38]. Post-occupancy evaluation returns to a building after use, as in the arrival study that checked space syntax against observed vehicles and pedestrians [31]. The present study is of that kind only in a limited sense. The buildings are in use, and the measured quantities are announced bed capacity and author-adjudicated marks in retrieved texts. There is no random sample of patients and no observed route beside each sentence.
2.8. Online Reviews as Unsolicited Patient-Experience Data
Greaves and colleagues showed that sentiment scores from online comments can be compared across institutions [14]. A sentiment score is not the outcome required here: a visitor can praise the staff and still report being unable to find a clinic. Online complaints treat the care environment as a category of its own [39], and public reviews overlap with, but are not identical to, a formal patient survey [40]. An online corpus does not replace a survey. The writers are people who posted, the platform’s default order is not a random draw, and a complaint site and a map-review page do not share a sampling frame. The codes are built for missed blocks, missing signs, long indoor walks and difficult campus access. They are not a prevalence of getting lost among all patients.
Existing studies usually take one hospital, or one link in that chain. A comparison of announced bed capacity with unsolicited navigation-related and walking language across the Turkish city-hospital directory has not been the object of a published study. The linguistic work in this paper is not a substitute for a layout solution. A marked sentence is a retrieved trace of a reported experience. It is not a measured route, not a sign audit, and not a prescription for how a functional hospital should be arranged. The contribution to interior architecture is therefore the separation of capacity-scale from reported navigation and walking language, and a codebook that later fieldwork can pair with unmeasured spatial configurations and visual information systems. Figure 1 separates tested associations from the route, adjacency and sign-system quantities that were not measured. Figure 2 records the sample that those associations describe, distinguishing the complete 566-text corpus from the 15-hospital, 486-text primary tests.
3. Conceptual Framework and Hypotheses
3.1. Three Meanings of Scale
Scale is three sets of quantities, not one judgement, and a fourth set is named so that it is not silently absorbed into the first three. Capacity scale covers announced beds, outpatient volume and clinic count. Physical scale covers gross floor area, footprint, number of blocks and number of floors. Circulation scale covers the public network and the distribution of entrance-to-clinic routes. Programme scale covers medical profile, department adjacency, and isolation versus rapid-access links. Two hospitals with the same bed count can still differ on the second, third and fourth sets. In the present comparison, the quantity available with a written source for all 26 hospitals is announced bed capacity, a capacity-scale variable [20]. Physical scale was added later from OpenStreetMap. The declared primary quantity is the union of mapped building footprints inside the campus polygon. Block count, the long axis of the largest block and site area are exploratory. Gross floor area is left blank unless building:levels tags cover at least 80% of footprint area; an empty cell is not entered as zero. Programme scale was not operationalised. Financing, including public–private partnership, is context. It is not a spatial score. A long route with no choice and a short route with many choices are different loads. Those route quantities were not calculated. The supplementary note states unused index definitions. It does not report a metre or a decision point.
3.2. The Rank Association
The outcome for hospital j is a share, not a count and not an ordinary-least-squares score. The navigation-related share is the number of retrieved texts carrying that union, divided by the number of eligible texts. The walking-or-mobility share is defined the same way. With few hospitals, a non-normal share and many zeros, Spearman’s rank correlation is used as a non-parametric measure of monotonic association [41]. It does not model the extra uncertainty of a small denominator. The minimum-text threshold, the threshold repeats and the Wilson intervals display that uncertainty. They do not put the size of the denominator into the correlation.
Share_j = positive texts_j/eligible texts_j.
Table 1 summarizes the measured constructs and conceptual variables used in this study.
Table 1.
Construct–measure mapping. Status distinguishes quantities that enter the rank tests from mechanisms that remain conceptual.
3.3. Research Questions and Hypotheses, in Operational Terms
RQ1–RQ4 and H1–H2 are marks used in this paper. They are not borrowed from a cited article. Each is defined by a numerator, a denominator, a hospital set and a test. RQ1 is descriptive: for each directory hospital with eligible Yandex texts, the navigation-related share and the walking-or-mobility share are the marked counts divided by the eligible count. RQ2 is H1: among hospitals with at least 15 eligible Yandex texts, Spearman’s rank correlation of announced beds with the navigation-related share, with a two-sided permutation p value. RQ3 is H2: the same test for the walking-or-mobility share. RQ4 is a composition count: how the navigation-related texts split among lost, block or floor, signage failure and asked, without entering those four marks into the primary Holm pair. Holm adjustment is applied only to H1 and H2. Component correlations, size mentions, OpenStreetMap partials and threshold repeats are exploratory. The 15-text rule is an analytic choice: below that count, one marked text moves a share by more than six percentage points.
4. Materials and Methods
This section states the sampling frame, the retrieval rules, the codebook, the rank tests and the later OpenStreetMap layer. Section 4.6 reports the ethics of this public-text retrieval, with reference to the AOIR guidelines [42]. Figure 4 and Table 2 set out the eight-step sequence before the detailed subsections.
Figure 4.
Eight-step analysis workflow, placed here so the sequence is visible before Section 4.1, Section 4.2, Section 4.3, Section 4.4, Section 4.5 and Section 4.6. Table 2 is the same sequence as a table. The unit of the rank tests is the hospital. Step 8 states the interpretation limit: the drawings are OpenStreetMap ground plans; indoor routes and signage systems were not measured.
Table 2.
Eight-step analysis workflow. The unit of the rank tests is the hospital, not the text.
4.1. Hospitals
The set is the 26 city hospitals named on the Ministry of Health directory retrieved in July 2026 [20]. That page is the sampling frame. It is not a claim that 26 was, in that month, the complete national count of every campus in service. A ministry statement reported in July 2026 described 27 city hospitals in service and about 40,000 beds, with 13 further hospitals under construction [17]. The presidential address at the Samsun opening stated the same operating count and bed total, and described eight additional hospitals still at project stage, 21 further campuses in all [18]. Ordu was reported to have begun accepting patients in July 2026 [19]. Samsun and Ordu were not on the retrieved directory page, and neither was added after the harvest. Campuses still under construction or still at project stage are outside the comparison because they had no directory profile in that retrieval and no review corpus in this dataset. Being named on the directory is an inventory fact. It is not a traced route, and it is not the 15-text rule used in the primary correlations. Procurement was not one method. The Ministry’s account distinguishes classical tender and the general budget from public–private partnership, and states that ten city hospitals were built by the partnership method while many other hospitals were completed from the general budget [15]. This file does not record the contract type of each of the 26 hospitals. Law No. 6428 authorises the partnership route [16]. It does not identify which campuses used it, and a financing statute is not a plan and not a floor area. Announced bed capacity was read from each hospital’s profile on the ministry site in July 2026. Table 3 states the code definitions. Table 4 gives the page. The file Supplementary S24 records 22 September 2026 as the date those profile URLs and bed counts were entered in the identity table around the original submission files. No second harvest of the 566 Yandex texts was performed on that date. No capacity figure in the analytic file was updated after the identity table was recorded. Kahramanmaraş’s ministry profile did not state a count. The hospital’s “about” page states 1040 beds, and that current profile value is the one used. A history page on the same site, dated January 2022, states 1000. The two official figures conflict, and the note is in the supplementary hospital-level table. Kahramanmaraş is not among the hospitals with at least 15 Yandex texts, so the choice does not enter the primary correlations. The figure is announced capacity. It is not occupied beds, and it is not floor area.
Table 3.
Code definitions and exclusion rules. The middle column is a definition, not a quotation from a review.
Table 4.
Ministry page used for announced bed capacity, accessed in July 2026. Supplementary S24 later records 22 September 2026 as the identity-table stamp; that stamp is not a second review harvest.
4.2. Review Texts
Three public sources were requested in July 2026. They were not requested again on 22 September 2026. Each Yandex page was the business-reviews URL listed in the Supplementary S24. Texts were split on the reviewer marker “seviye şehir uzmanı Abone ol”, then cut at reply, photo or like markers. On the saved pages, a note stored with the generative-coding file recorded 43 retrieved cells that still contained more than one review after that split. The note did not keep review identifiers. Re-parsing the same pages finds 42 eligible cells that still contain the string “seviye şehir uzmanı”; 20 of those 42 also contain a second full dated stamp, and those 20 are the exclusion file in Supplementary S12. Unique Yandex review identifiers were not retained after chrome was stripped, so the mixed cells cannot be separated into newly labelled reviewer-level texts. They remain retrieved units in the denominator. Section 5.1 and Supplementary S13 state why the exclusion file has 20 records rather than 43, and what stays unidentified. The saved page is the platform’s default order. It is not a latest-N list. A zero parsed count, as at Kayseri, is an empty retrieval in this harvest. It is not evidence that the platform holds no reviews. Şikayetvar was a contrast corpus only: two listing pages, then at most 40 complaint pages per hospital, with the title and the complaint body kept and the platform timestamp stripped. Google Maps returned an HTML shell with no review sentence, and Google text is not in the rates. A dated calendar day exists for 392 of 566 Yandex texts; 174 texts remain undated or lack a year; hospitals do not share one observation window, and the dated reviews precede the July 2026 capacity figures (Section 5.1). Detailed logs remain in Supplementary S15 and S16. No route was traced, so decision points, route length and walking time have no hospital values.
Platforms are not pooled. A star rating without text is outside the denominator. Institutional replies are not visitor reviews. Texts shorter than 40 characters, counted with spaces and punctuation, were dropped at retrieval and were not retained. Their number, their hospital distribution and their code rate were not archived, so those quantities cannot be recovered. A table cell of 0 would imply that a drop count had been observed; no such count was observed, and none is reported. Among the 566 saved Yandex texts, none is shorter than 40 characters; the median length is 129 characters. The 40-character rule was a length screen, not a threshold chosen to maximise a p value. Short texts such as a bare “no signs” could have been informative and are absent from this corpus. The printed count on the saved Yandex page (Page n on the saved Yandex page) is not that drop count. Printed and parsed counts differ because a saved page can combine more than one review in one cell, and because replies and chrome are stripped. Reviews were not collected by searching for the words kaybol or tabela. Names, diagnoses and plate numbers are not fields in the analytic table. The manuscript does not quote writers.
4.3. Spatial-Experience Codes
The counting unit is the text. One text may carry several codes and still counts once in the denominator. Navigation-related language, as used in H1, is the union of four codes: getting lost or being unable to orient; a block or floor that could not be identified; signage described as missing, contradictory or insufficient; and having to ask in order to proceed. The union carries that name because the four marks are not one mechanism. Being lost is an outcome. A sign failure is closer to a visual-communication complaint. Asking is a coping behaviour and is counted only when the text links the question to a failed search. The union is not a measure of the sign system. Section 5.1 reports the four marks one by one. Section 5.3 reports each mark’s rank correlation with announced beds. Those component tests are exploratory and are not Holm-adjusted with H1 and H2. Walking-or-mobility language is a long indoor walk, or a mobility limit that the text ties to that indoor route. A wheelchair word alone is not enough. Campus transport—buses, the campus being outside the city, a missing service—is a third share and is not added to navigation-related language. A sentence that only says the hospital is large or huge is counted as a size mention and is not navigation-related. That size screen is a lexicon rule (çok büyük, kocaman, devasa and close variants, with no lost, block, sign or walking mark). It is not an author-adjudicated outcome. It marked 45 of 566 Yandex texts (41 of 486 in the primary set). Its hospital-level rank correlation with announced beds was ρ = 0.196 (permutation p = 0.4792) and is not used as a third primary test. Positive signage, including a statement that the signs were sufficient, is kept separate and does not enter the navigation-related share (6 Yandex texts). The same rules are listed in Table 3.
The screen is a Turkish lexicon with two guards. A lost-word match is dropped when the preceding words name a doctor, a nurse, a result, an appointment or a belonging, so that a missing physician is not read as a missing corridor. A sign or a transport match is read with the following words, so that “the signs were sufficient” and “access was easy” are not failures. Negation immediately around “kaybolmadı” is not a failure. This screen is a rule list, not the transformer pretraining model described by Devlin and colleagues [43]. Turkish morphology, spelling and irony will move some texts across the boundary. Section 4.3.1 compares two NLI models that applied the same hypotheses. Navigation-related marks are rare, so a missed paraphrase can still move a hospital rank. Exact duplicate Yandex texts were checked by normalised string; none were found. A screen for Turkish-specific letters or a short list of function words marked 564 of the 566 Yandex texts. The other two are still Turkish sentences the short list missed. No text was dropped for language, and no language-identification model was used. Precision on an enriched sample would not, in any case, be performance on the natural balance [44]. The lexicon is retained as a screening method. It is not the primary outcome.
4.3.1. Author Labels and Method Error
All 566 retrieved Yandex texts were coded against Table 3. The two authors did not first code those texts independently of one another and then reconcile a disagreement table. They applied the codebook to the full retrieved set with hospital names visible, and therefore without blinding to announced capacity, and they resolved disagreements with a previously blinded Grok 4.7 reading (made without the lexicon flags) into a third, final label file. Pre-adjudication author–author agreement is therefore not available. Those adjudicated labels remain the primary Yandex outcomes in Section 5. Computational assistance organised the sheets and listed candidate texts; the authors take responsibility for every final label. Because the Grok reading entered that adjudication, agreement between the Grok file and the final labels is not independent validation. Independent human agreement, recorded before any consensus substitution, is the hospital-masked 140-text panel in Section 4.3.4: site codes replaced hospital names, the hypothesis and the author labels were withheld, and the two workbooks were independently shuffled. The lexicon, NLI and generative comparisons in Section 4.3.1, Section 4.3.2 and Section 4.3.3 remain method checks; they are not a substitute for that panel. Şikayetvar contrast labels remain lexicon marks; that corpus was not recoded by hand.
Table 5 compares the lexicon, the Grok reading and two local NLI models with the final labels. The lexicon recovered 17 of 35 navigation-related texts (precision 0.810; recall 0.486) and 14 of 27 walking-or-mobility texts. That aggregate hides variation across the four navigation marks. Against the same final labels, the lexicon recovered 10 of 24 lost texts (precision 1.000; recall 0.417), 2 of 5 block-or-floor texts (precision 0.667; recall 0.400), 7 of 14 signage-failure texts (precision 0.778; recall 0.500), and 0 of 10 asked-for-directions texts (precision 0.000; recall 0.000) [44]. Asking is the component the lexicon missed completely. NLI A marked 477 texts as navigation-related, with 444 false positives (specificity 0.164). NLI B showed the same over-marking pattern. Relative to the final labels, the task-specific lexicon had high precision and incomplete recall; the generic zero-shot NLI classifiers substantially over-classified spatial-experience language. Pass A is MoritzLaurer/mDeBERTa-v3-base-mnli-xnli. Pass B is MoritzLaurer/multilingual-MiniLMv2-L6-mnli-xnli. Both ran locally in July 2026, multi-label, threshold 0.70. The score is a pipeline entailment score, not a calibrated probability [43]. Gwet’s AC1 is defined in [45]; Hill and colleagues report it beside a human panel [46]. The two NLI passes remain a method-sensitivity check. They do not replace the final labels. Section 4.3.2 reports a second sensitivity check, in which two generative models applied the same codebook.
Table 5.
Final author-adjudicated labels versus the lexicon, the Grok reading, two NLI models and two generative models.
4.3.2. Generative Double Coding
In July 2026, two instruction-tuned models applied the Section 4.3 codebook to the same 566 texts, independently of each other and of the author labels. Model A is Qwen/Qwen2.5-7B-Instruct. Model B is ytu-ce-cosmos/Turkish-Llama-8b-Instruct-v0.1. Both ran in 4-bit NF4 weights with greedy decoding, a repetition penalty of 1.0 and seed 42. Hospital names were withheld. The prompt carried the seven outcomes and one extra flag, uncertain, for a sentence that cannot be coded 0 or 1 without guessing. When that flag is 1, the seven outcomes stay 0. No parsed text broke that rule. Separate model runs of one corpus have been treated as coders, and a predefined scheme can be scored with Cohen’s κ [47,48]. Generative coding is not a substitute for a human check when the decision is interpretive [49]. A guide to qualitative coding with large language models places that check with the analyst, not with the model [50]. Gwet’s AC1 is reported beside κ because several codes are rare [45,46]. This pass is model–model agreement. It is not a hired two-coder panel.
Model B did not parse one text. That text is one of the 35 navigation-related author labels, so Model B is scored on 565 texts. Two further Model B rows parsed on a second attempt. On the 565 paired texts the seven outcomes matched exactly in 499 texts (88.3%). For the navigation-related union, Cohen’s κ was 0.646 and Gwet’s AC1 was 0.952. For walking or mobility, κ was 0.685 and AC1 was 0.958. A text with at least one of the seven outcomes had κ = 0.782 and AC1 = 0.914 (Model A 107 texts; Model B 86; both 79). On the Landis–Koch band, those κ values sit in the substantial range [51]. They are not high enough to replace a human panel, and they are not high enough to substitute the generative pair for the author labels. Rare positives pull κ down while AC1 stays high; that is why both coefficients are reported. The uncertain flag did not agree: Model A marked 75 texts and Model B marked 5 (κ = 0.059). If that flag is counted, exact agreement falls to 428 of 565 texts and 137 texts disagree. Those 137 texts and the unparsed text were listed for adjudication (138 rows). The adjudication columns were left empty. They were not written into the label file used in Section 5. Disagreements with the author labels are not spread evenly. Of 26 Qwen–author disagreements on the navigation union, 6 are at Etlik and 3 each at Bilkent, Başakşehir and Kocaeli. Of 19 Llama–author navigation disagreements, 5 are at Etlik and 4 at Kocaeli. High-capacity campuses contribute a large share of the hard sentences, which is one reason the Ankara-drop is reported in Section 5.3.
Table 5 places both models against the author labels. Qwen2.5-7B recovered 28 of 35 navigation-related texts (precision 0.596; recall 0.800; κ = 0.659) and 24 of 27 walking-or-mobility texts (precision 0.615; recall 0.889; κ = 0.711). Turkish-Llama-8B recovered 21 of 34 navigation-related texts in its scored set (precision 0.808; recall 0.618; κ = 0.683) and 20 of 27 walking-or-mobility texts (precision 0.625; recall 0.741; κ = 0.660). Both sit between the lexicon and the NLI passes: higher recall than the lexicon on these unions, and far fewer false positives than either NLI model. The author labels remain the primary Yandex outcomes.
Campus transport is the weak code in this pass. Qwen2.5-7B marked 55 texts against 25 author labels (precision 0.255). Turkish-Llama-8B marked 40 texts against 24 labels in the scored set (precision 0.300). On the 565 paired texts, a string screen for otopark, park yeri or park sorunu matched 42 of 54 Qwen transport marks and 29 of 40 Turkish-Llama transport marks. A screen for otobüs, minibüs or dolmuş matched 2 and 1 of those marks. The codebook counts bus, minibus or a site outside the city. It does not count a parking complaint by itself. The generative transport marks are not an alternative transport share.
Returned evidence spans were checked as substrings of the text. Qwen2.5-7B had 18 spans that were not in the text (90 spans were verbatim). Turkish-Llama-8B left the evidence field empty on 63 texts, returned 19 verbatim spans and had 4 spans that were not in the text. Item-level codes, without review wording, are in Supplementary S18 and S19. Model–model agreement is in Supplementary S20. Mixed retrieved cells are treated in Section 4.2 and Section 5.1, not as a generative-coding result.
4.3.3. Classification Uncertainty and Alternative Labels
The Wilson intervals in the supplementary table describe sampling uncertainty of a share only if the retrieved texts are treated as a sample. They do not absorb misclassification. Two further checks were added in this revision. A nested bootstrap resamples the 15 primary hospitals with replacement and then resamples texts within each drawn hospital (10,000 draws, seed 22). That interval is wider than the hospital-only bootstrap because it puts the size of each denominator back into the share. For the navigation-related share the nested 95% interval was −0.165 to 0.749 (median ρ = 0.353). For walking or mobility, it was 0.008 to 0.831 (median ρ = 0.527). A label-error simulation then flips each text with the false-positive and false-negative rates observed against the author labels (5000 draws). Under the Grok disagreement rates, the navigation coefficient stayed near 0.50 (median ρ = 0.503; 95% interval 0.297 to 0.566). Under the Qwen rates, which include a 0.20 false-negative rate on navigation-related texts, the median fell to 0.299 (interval −0.120 to 0.633). Recomputing H1 and H2 on the Grok labels, the Qwen labels and the Llama labels, and after dropping texts where the author and Qwen disagree, is reported in Section 5.6. A separate human-disagreement simulation, using the A–B mismatch rates from Section 4.3.4, is reported in Section 5.7. The Grok/Qwen/Llama checks are not an independent human panel.
4.3.4. Independent Human Coding Panel
Two independent coders marked 140 Yandex texts (seed 22): all 55 texts that carry a navigation-related or walking-or-mobility mark in the author file, together with 85 texts that carry neither mark. Hospital names in the sheets were replaced by site codes and stripped from the wording. The hypothesis, the author labels, the lexicon flags and the model files were withheld. The two workbooks were independently shuffled. Each row asked for the four navigation marks, the two walking marks, campus transport and an uncertain flag. If uncertain = 1, the other seven codes stay 0 for the union scores. Agreement is Cohen’s κ and Gwet’s AC1 for each mark and for the two unions, with coder-versus-coder precision and recall and the hospital distribution of disagreements (Supplementary S10). On the navigation-related union, κ = 0.913 and Gwet’s AC1 = 0.957 (97.1% agreement). On the walking-or-mobility union, κ = 0.921 and AC1 = 0.983 (98.6% agreement). Lost was 0.837; long walking 0.921. Block-or-floor, signage failure, asking and mobility were 1.000, on very small positive counts (2, 13, 7 and 1). Coder A’s navigation-related positives were a subset of coder B’s (27 versus 31; four texts B-only). The same nesting held for walking (13 versus 15). The workbooks were not identical. Uncertain was the most discordant extra flag (κ = 0.763). Union disagreements were not concentrated on one campus (Kocaeli 2; Etlik, Konya, Aydın and Bilkent 1 each). The workbooks contain review wording and are not deposited. The English codebook is Supplementary S8b.
4.4. Association
The two primary tests are H1 and H2 on the Yandex corpus. Campus transport, the Şikayetvar contrast corpus, the split of walking into long-walk and mobility language, the four navigation component shares, the size-mention screen, the threshold repeats, mixed-cell exclusion, and calendar-window subsets are exploratory. Hospitals with at least 15 coded texts enter the primary rank correlation. Fifteen is an analytic choice, not a theoretical constant: below that count, one positive text moves a share by more than six percentage points. The same correlations are repeated at 10, 20 and 30 texts. Those repeats are nested subsets of the same texts, not extra samples. Hospitals below 15 texts remain in Section 5.2. The p value is a two-sided permutation of the hospital shares, 100,000 shuffles, seed 22, with one added to the numerator and the denominator. A hospital-level bootstrap, 10,000 paired draws, seed 22, resamples hospitals once and recomputes both correlations and their difference on the same draw. Holm adjustment is applied to the two primary p values only. Fisher’s z approximation gives a minimum detectable Spearman coefficient of 0.669 at k = 15 for 80% power and two-sided α = 0.05. That figure is an approximation only; it is not the power of this zero-heavy permutation design. A permutation Monte Carlo that preserves the observed share marginal, including zeros, and tests each replicate with the same Spearman–permutation procedure (1500 simulations; 3000 inner permutations) gave estimated power of 0.53 for navigation and 0.46 for walking if the true ρ were 0.51 at k = 15. At k = 13, after dropping Bilkent and Etlik, the same walking simulation gave power of 0.37. Non-significant Holm tests at the primary threshold are therefore compatible both with a weak association and with a moderate association that this sample cannot resolve. Section 5.4 reports k, text totals and the number of hospitals with a zero share at each nested threshold. Wilson intervals in the supplementary table describe sampling uncertainty of a share only if the retrieved texts are treated as a sample. They do not absorb misclassification. Kendall’s tau-b and leave-one-hospital-out repeats are robustness checks on the walking association. A further check that uses the denominator is a hospital-level binomial generalised linear model. For hospital j, the marked count Y_j is treated as Binomial(n_j, p_j), where n_j is the number of eligible retrieved Yandex texts and logit(p_j) = β0 + β1 log(beds_j). Estimation is iteratively reweighted least squares (40 iterations; starting values β0 = −4, β1 = 0). Inferential p values are not Wald statistics. They are two-sided permutations that shuffle the pairs (Y_j, n_j) jointly against the bed vector (10,000 shuffles, seed 22), with p = (extreme + 1)/(nperm + 1). Pearson dispersion is Pearson χ2 divided by k − 2. That model is exploratory. It does not replace H1 or H2.
4.5. OpenStreetMap Campus Metrics
Physical scale was measured after the text analysis, from OpenStreetMap, via the Overpass API [52,53]. Supplementary S23 records Overpass timestamps of 24 September 2026. The declared primary OSM quantity is footprint_m2: the union of mapped building polygons whose representative point falls inside the campus polygon. OpenStreetMap was not used to estimate foot traffic, indoor routes or movement between storeys. The footprint contains no pedestrian count and no path through a multi-storey interior. Walking-or-mobility language comes only from the retrieved texts. Matching hospital polygons within 300 m were merged, which is intended to join separately mapped parts of one campus. Campus identifiers were checked against a 26-panel plot. İzmir was restricted to the Bayraklı city-hospital polygon after a private hospital with a similar name entered the name query. Erzurum uses the polygon still tagged as the regional training hospital because that is the amenity polygon at the city-hospital helipad. Kartal uses the polygon tagged as the former training hospital. Elazığ and Tekirdağ have campus outlines but almost no indoor building parts; their footprint cells are left blank. A blank is not a zero. Gross floor area is reported only where building:levels tags cover at least 80% of footprint area. Block count, the long axis of the largest block and site area are exploratory. This OSM layer was not locked in a dated protocol before the review labels were seen. Among hospitals that also meet the 15-text rule, the reportable OSM tests are the Spearman correlation of footprint with each language share and the rank partial correlation of footprint with that share given announced beds, 100,000 permutations, seed 22. Collinearity was quantified as the two-predictor variance inflation factor VIF = 1/(1 − r2), where r is the Pearson correlation of announced beds with footprint on the k = 14 hospitals that have a mapped footprint. On the raw scale, r = 0.948 and VIF = 9.85. After a natural-log transformation of both variables, r = 0.915 and VIF = 6.15. The rank coefficient used elsewhere in the paper is Spearman ρ = 0.876 and is not the r inside the VIF formula. Conventional linear-model guidance treats VIF above 5 as concerning and above 10 as severe. Both the raw and the log values are high enough that beds and footprint are not entered together as competing predictors. Announced beds remain the single primary scale variable. Footprint is retained only as a collinear physical-scale check and as rank partial correlations given beds (Section 5.5). Section 5.5 also reports the partial correlations after dropping the three manually overridden campuses, after dropping campuses that still carry former or training-hospital names, after removing Bilkent and Etlik, and after filling the two blank footprints with site area as a documented sensitivity that is not recommended as a primary rule. The k = 11 override-drop row and the k = 12 former-or-training-name row are exploratory subset sensitivities: they depend on which campuses are excluded, they coincide with still-severe collinearity, they were not the pre-specified OSM test, and they do not replace the listwise k = 14 result. Section 5.5 lists the OSM descriptors and the recorded opening year for the 15 hospitals that enter the primary tests. Those rows are not photographs, not as-built plans, and not a staff or healing-space inventory. Section 2.2.2 and Figure 3 describe plan extent. The mapped axes, from 205 m to 656 m, are horizontally extended campuses rather than towers. A full height ranking is not made: the 80% storey-tag rule holds for only one primary campus, Bilkent, where the area-weighted mean is 6.95 storeys (Section 2.2.2).
4.6. Ethics and Software
The retrieval used already public web pages: Yandex Maps business-review pages and Şikayetvar complaint pages. Those texts were posted by their writers before this study. No person was recruited and no writer was contacted. No survey, interview, observation or experiment was administered. Health details and names that may sit in a public review were not extracted as variables, and writers are not quoted. Analyses are hospital-level shares. Identifiable comments are not reproduced and raw wording is not deposited. Ethics-committee approval is not required for this design. The materials are unsolicited public documents, not a recruited human-subjects sample. A numbered committee waiver was not issued because committee review is not applicable, not because an application was refused. The legal basis recorded here is Turkish Law No. 6698 on the Protection of Personal Data (KVKK), Article 5(2)(d) (processing of personal data that the data subject has made public) and Article 28(1)(ç) (scientific research with data that do not identify the person). The rank correlations, permutations and bootstrap intervals were computed in Python 3.12.3 with the project script, using the standard-library random generator, seed 22. OpenStreetMap geometries were handled with GeoPandas 1.1.4 (https://geopandas.org). Figures were drawn with Matplotlib 3.11.0. No separate statistics package produced the coefficients.
5. Results
5.1. Retrieved Corpus
Of the 26 hospitals in the directory frame, 25 contributed eligible Yandex texts. The complete retrieved Yandex corpus contained 566 texts. Author-adjudicated labels marked 35 navigation-related texts and 27 walking-or-mobility texts in that complete set. Fifteen hospitals, contributing 486 texts, met the minimum of 15 texts for the primary analyses. Within this primary subset, 32 texts carried a navigation-related mark and 26 carried a walking-or-mobility mark. Fifteen of the 35 navigation-related texts in the complete corpus carry more than one of the four component marks, so component counts are not added to make the union (Supplementary S1). Şikayetvar complaint articles were saved for 26 hospitals, 670 texts, of which 8 (1.2%) carried navigation-related language. That contrast did not use the same retrieval rule, so it is not an independent confirmation. Google contributed no text. Route length and signage performance were not measured.
The note of 43 mixed cells was stored without review identifiers. Re-parsing the saved pages with the same splitter identifies 42 eligible cells that still contain the string “seviye şehir uzmanı” after the cut on “N. seviye şehir uzmanı Abone ol”. All 42 match a saved text (Supplementary S13). The forty-third cell in the stored note is not reproduced by this parse and cannot be named. The exclusion already reported used a narrower rule inside those 42: a second full dated stamp, with day, month and year. That rule marks 20 texts, and those 20 are exactly the records in Supplementary S12. The other 22 contain the unsplit reviewer marker but not a second full date, which is why the exclusion file has 20 records rather than 43. Of the 42, 32 lie in the original 15-hospital set (6 navigation-related and 1 walking-or-mobility). Across all 566 texts, the 42 carry 7 navigation-related marks and 1 walking-or-mobility mark. Excluding those 20 leaves 546 texts and still 15 hospitals at the 15-text rule (472 primary texts; 30 navigation-related and 26 walking-or-mobility marks). On that reduced set, navigation-related ρ = 0.464 (permutation p = 0.0837; Holm p = 0.1000) and walking-or-mobility ρ = 0.520 (p = 0.0500; Holm p = 0.1000). Those coefficients do not replace H1 or H2. Excluding all 42 recoverable cells, rather than splitting them into new labelled reviews, leaves 524 texts. Konya falls from 16 texts to 14 and Manisa from 16 to 13, so both leave the 15-text set. The rank test is then on 13 hospitals and 427 texts (22 navigation-related and 23 walking-or-mobility marks): navigation-related ρ = 0.679 (permutation p = 0.0140; Holm p = 0.0280) and walking-or-mobility ρ = 0.649 (p = 0.0196; Holm p = 0.0280). That change of hospital set is exploratory. Removing Bilkent and Etlik from those 13 leaves navigation-related ρ = 0.552 (p = 0.0807) and walking-or-mobility ρ = 0.390 (p = 0.2388). Holding the original 15 hospitals fixed, including the two denominators that fall below 15, gives 454 texts (26 navigation-related and 25 walking-or-mobility marks), navigation-related ρ = 0.379 (p = 0.1628; Holm p = 0.1628) and walking-or-mobility ρ = 0.591 (p = 0.0233; Holm p = 0.0465). Neither row replaces the published H1 or H2 pair (ρ = 0.512 and 0.513; Holm p = 0.1040). The same permutation procedure as Supplementary S12 was used (100,000 shuffles, seed 22). The remaining limitation is that the 42 cells were dropped, not separated into reviewer-level texts, and that the unreproduced forty-third cell, if it was a further mixed cell, is still unnamed inside the published denominator.
A common observation period cannot be imposed on the primary 15-hospital set. A dated calendar day exists for 392 of 566 texts; 174 remain undated or lack a year. Dated texts fall mainly in 2024–2025 and precede the July 2026 capacity figures. Restricting to day-dated texts in calendar 2025 leaves 324 texts and only nine hospitals with at least 15 such texts (227 texts; 13 navigation-related and 8 walking-or-mobility marks in that primary subset). That subset is selected for hospitals that currently show enough dated 2025 reviews on the default-order page, still includes Bilkent and Etlik, and is not a shared window for the original 15. Navigation-related ρ = 0.958 (p = 0.0003) on those nine hospitals is exploratory, sample-selection sensitive, and is not a new primary test. Walking-or-mobility ρ = 0.438 (p = 0.2352). A time series of announced beds is not in the analytic file, except the Kahramanmaraş 1000 versus 1040 conflict already reported in Table 4; capacity consistency during 2024–2025 cannot be verified from this file. Unequal windows can favour campuses whose saved pages currently display more recent dated posts.
Table 6 splits the navigation-related outcome into the four marks that the H1 union pools. Across 566 Yandex texts, 14 name a sign as missing, contradictory or insufficient, in 10 hospitals. That count is the visual-communication sentence in this corpus. It is not an audit of the signs. The navigation-related union is 35 texts. Fifteen of those texts carry more than one of the four marks, so the component counts are not added to make the union. In the primary 486 texts, the same four marks were 21 lost, 4 block or floor, 13 signage failure and 9 asked. The table is descriptive. Section 5.3 reports each mark, and the lexicon size-mention screen, as a rank correlation with bed capacity.
Table 6.
Composition of the navigation-related outcome in the retrieved Yandex texts.
5.2. The Hospital Comparison
Table 7 places announced capacity beside the Yandex counts and the OpenStreetMap footprint. A hospital with a small retrieved set can show a large percentage. That percentage is reported, and it is kept out of the rank correlation when the text count is below 15. A zero Yandex denominator, as at Kayseri, means this retrieval returned no eligible text. It does not mean the hospital has no wayfinding problem, and the absence of a traced plan from this paper does not mean that no plan exists. Among the hospitals in the primary set, the navigation-related share ran from 0.0% at Isparta (n = 17) to 25.0% at Konya (n = 16).
Table 7.
Announced bed capacity, author-adjudicated Yandex language counts, the printed page count and OpenStreetMap campus footprint.
5.3. Capacity and the Two Language Shares
Across the 15 hospitals with at least 15 retrieved texts, the Spearman rank correlation between announced bed capacity and the navigation-related share was 0.512, bootstrap 95% CI 0.040 to 0.800 (two-sided permutation p = 0.0534, 100,000 shuffles). The correlation with the walking-or-mobility share was 0.513, bootstrap 95% CI -0.015 to 0.853 (two-sided permutation p = 0.0520, 100,000 shuffles). Those two results are H1 and H2. Neither Holm-adjusted p value is below 0.05. Figure 5 plots bed capacity against the navigation-related share for hospitals at or above the text threshold. Figure 6 does the same for walking-or-mobility language. Long walking, mobility, campus transport and the Şikayetvar contrast are the remaining rows of Table 8. H2 remains the walking-or-mobility composite. Şikayetvar is not plotted, and Şikayetvar shares remain lexicon marks.
Figure 5.
Announced bed capacity and the share of retrieved Yandex texts with navigation-related language. Point area is proportional to the number of retrieved texts; the legend shows n = 15 and n = 40. Vertical bars are Wilson intervals for the retrieved texts. They are not intervals for a patient population.
Figure 6.
Announced bed capacity and the share of retrieved Yandex texts with walking-or-mobility language. Point area is proportional to the number of retrieved texts; the legend shows n = 15 and n = 40. Vertical bars are Wilson intervals for the retrieved texts. They are not intervals for a patient population.
Table 8.
Primary tests on author-adjudicated language shares, OSM footprint tests, exploratory splits and the Şikayetvar contrast, for hospitals with at least 15 texts.
Table 8 collects the primary tests and the exploratory splits. Holm adjustment of the two primary p values leaves both at 0.1040. Those two tests are not statistically supported. Kendall’s tau-b is 0.329 for navigation-related language and 0.409 for walking-or-mobility language. The difference, walking rho minus navigation-related rho, is 0.001 (bootstrap 95% CI −0.522 to 0.468). The interval includes zero, so the two associations are not shown to differ. Near-equal point estimates are not a tested dissociation. Leave-one-hospital-out walking rho ranged from 0.397 to 0.637. Removing both Ankara hospitals, Bilkent and Etlik, leaves rho = 0.269 on the remaining 13 hospitals (permutation p = 0.3674; bootstrap 95% CI −0.290 to 0.733). The interval includes zero, and the p value is above 0.05. Two readings of that drop should be kept together. Twelve of the twenty-seven walking-or-mobility texts in the whole Yandex corpus are from Bilkent and Etlik, so the point estimate is partly carried by those two high-capacity campuses. At the same time, permutation Monte Carlo power at k = 13, if the true walking ρ were still 0.51, is about 0.37. Fisher’s z 80% MDE at k = 13 is about 0.71 and is an approximation only. The wider interval is therefore both a leverage result and a power result. It does not, by itself, show that the remaining hospitals have no association. The four navigation marks are reported separately in Section 5.4. Asking for directions ranked with capacity (ρ = 0.701; permutation p = 0.0053; 9 marked texts in the primary set; 8 of 15 hospitals have a zero share). Lost language was weaker (ρ = 0.365; p = 0.1796). Signage-failure language was near zero (ρ = 0.069; p = 0.8026). Block-or-floor language was also weak (ρ = 0.106; p = 0.7104; 5 texts in the full corpus). Those component tests are exploratory, are not Holm-adjusted, and do not rescue H1. An unadjusted p below 0.05 on nine asking texts is not a confirmed mechanism and is not a signage result. A one-factor summary of the four hospital-level component shares is equally limited. Cronbach’s α was 0.405. The first principal component explained 46% of the standardised variance, loaded mainly on lost and asked, and ranked with beds at ρ = 0.608 (p = 0.0189). Pairwise hospital-level Spearman coefficients among the four shares were low except for lost with asked (ρ = 0.513). Several indicators are zero-heavy at hospital level (Supplementary S2). A confirmatory latent-variable model is not justified at k = 15 with these event counts; we therefore report disaggregated components rather than impose an empirically unsupported common factor. Replacing beds with their logarithm does not change the walking Spearman coefficient (ρ = 0.513), because the logarithm is strictly increasing and the tied bed counts stay tied. A Pearson correlation of the walking share with log beds is 0.627 (permutation p = 0.0127). A binomial model of walking counts on log beds, using the same 15 hospitals and 26 marked texts, has a positive coefficient (1.146). Positive counts and their denominators were permuted together against bed counts (permutation p = 0.0404; 10,000 shuffles). Pearson dispersion is 1.434. That value does not show strong extra-binomial scatter in this fit, but with 15 hospitals it is only a limited check. Doubling announced beds multiplies the model odds by about 2.21, which is a transformation of this coefficient, not a causal effect. The same model for navigation-related counts does not show that association (coefficient 0.456; permutation p = 0.1876). Announced capacity and the number of retrieved Yandex texts, across all 26 hospitals, had rho = 0.256 (permutation p = 0.2076). Median beds were 1295 among the 15 hospitals with at least 15 texts and 1150 among the 11 below that threshold. Of 566 Yandex texts, 7 carried both codes, 28 carried navigation-related language only and 20 carried walking-or-mobility language only (Jaccard 0.127; phi 0.18). The binomial check specified in Section 4.4, on the same 15 hospitals, gives β1 = 1.146 for walking-or-mobility counts (permutation p = 0.0404; 26 marked texts; intercept −11.512; Pearson dispersion 1.434) and β1 = 0.456 for navigation-related counts (permutation p = 0.1876; 32 marked texts; intercept −6.037; dispersion 1.426). Doubling announced beds multiplies the fitted walking odds by about 2.21; that transformation is not a causal effect. Wide bootstrap intervals, the influence of Bilkent and Etlik, and the exploratory status of the binomial, mixed-cell and calendar-window rows are retained in the interpretation.
5.4. Threshold Sensitivity
Table 9 repeats the rank tests at minimum text counts of 10, 15, 20 and 30. Each row is a nested subset of the same texts, not an independent replication. A hospital that falls below a threshold leaves that column. Where fewer than eight hospitals remain, the cell is a count rather than a coefficient. Both primary coefficients stay positive across the nested thresholds; unadjusted p values move with the subset. Table 10 reports the four component correlations. Table 11 gives the hospital count, the text total and the number of hospitals with a zero navigation or walking share. At the primary threshold, two hospitals have a zero navigation share and seven have a zero walking share. Fisher’s z 80% MDE at k = 15 is 0.67; permutation Monte Carlo power if the true ρ were 0.51 is 0.53 (navigation) and 0.46 (walking). The observed coefficients of about 0.51 therefore sit in a low-power region for this design. The larger coefficients at 20 and 30 texts are estimated on 10 and 9 hospitals; those rows have still less power, not more independent information. The Yandex walking-or-mobility coefficient stayed positive at every nested threshold: 0.412 at 10 texts (p = 0.0798, 19 hospitals); 0.513 at 15 texts (p = 0.0520, 15 hospitals); 0.648 at 20 texts (p = 0.0499, 10 hospitals); 0.624 at 30 texts (p = 0.0766, 9 hospitals). Campus-transport coefficients weaken once the smallest retrieved pages are left out. Şikayetvar navigation-related language does not rank with bed capacity at the thresholds that still include the full set of hospitals.
Table 9.
Threshold sensitivity of the Spearman correlations. Nested subsets, not independent replications.
Table 10.
Component-level rank correlations with announced bed capacity among hospitals with at least 15 Yandex texts.
Table 11.
Nested threshold, hospital count, text total and zero-share hospitals.
VIF is 1/(1 − r2) from the Pearson correlation of announced beds with footprint on k = 14 hospitals with a mapped footprint. On the raw scale, r = 0.948 and VIF = 9.85; on the log–log scale, r = 0.915 and VIF = 6.15. Both remain high. Partial coefficients are rank partial Spearman given beds, 100,000 permutations, seed 22. Filling a blank footprint with site area substitutes campus outline for indoor building parts and is a sensitivity only.
Within the retrieved Yandex frame, both primary rank tests were positive in sign and both Holm-adjusted p values were 0.104. H1 is the navigation-related association. H2 is the walking-or-mobility association. Absence of support after Holm adjustment is not evidence that either association is zero. Both statements are limited to the default-order pages in Section 4.2. Yandex labels for those tests are the author-adjudicated file in Section 4.3.1. The generative pair in Section 4.3.2 was not substituted for that file. Independent human coding of a 140-text sample is in Section 4.3.4 and Section 5.7; it does not replace H1 or H2.
5.5. OpenStreetMap Physical Scale
Figure 3 is the plan drawing for three of the campuses whose footprints are tested in this section. The plans are horizontally extended ground projections, not towers. The drawing is not a footfall surface, not an indoor route and not a section. Building footprints were recovered for 24 of the 26 directory hospitals. Elazığ and Tekirdağ retain campus outlines but no usable indoor building parts; those footprint cells are blank. Among the 14 hospitals that also met the 15-text rule, footprint ranked strongly with announced beds (Spearman ρ = 0.876; Pearson r = 0.948; raw-scale VIF = 9.85; log-scale VIF = 6.15). The unadjusted association of footprint with walking-or-mobility language was 0.355 (permutation p = 0.2113; bootstrap 95% CI −0.248 to 0.803). The association with navigation-related language was 0.604 (p = 0.0242; CI 0.040 to 0.897). Because footprint and beds are collinear, the reportable OSM result is the rank partial correlation given announced beds. Partial ρ was −0.128 for walking-or-mobility language (p = 0.6691) and 0.399 for navigation-related language (p = 0.1597). Neither partial test supports an independent footprint association once capacity is held in the ranks. Table 12 holds the matching sensitivities. Filling Tekirdağ’s blank footprint with site area, which is not indoor building area, leaves the walking partial near zero (partial ρ = −0.144; p = 0.6139). Dropping the three manually overridden campuses raises the navigation partial (partial ρ = 0.703; p = 0.0156) on only 11 hospitals and a VIF of 23.01. Dropping campuses that still carry former or training-hospital names similarly raises the navigation partial (partial ρ = 0.652; p = 0.0155) on 12 hospitals and a VIF of 10.43. Those two p values are exploratory and sample-selection sensitive. They were not pre-specified confirmatory tests, they appear only after hospitals are dropped, and they do not overturn the listwise k = 14 partial of 0.399 (p = 0.1597), which remains the reportable OSM result. Neither subset row is a new primary finding that footprint is independently associated with navigation-related language once beds are held in the ranks. Block count did not rank with either language share. The long axis of the largest block, an exploratory circulation-scale proxy, ranked with walking-or-mobility language (ρ = 0.678; p = 0.0100; partial ρ given beds = 0.663; p = 0.0087). That axis test was not the declared OSM primary and is not Holm-adjusted against the other OSM metrics. Supplementary S21 stores the four metrics and both outcomes. Supplementary S22 is the 26-campus check plot. Table 13 lists the campus descriptors for the 15 hospitals in the primary set.
Table 12.
OpenStreetMap footprint collinearity and campus-matching sensitivity.
Table 13.
Campus descriptors available for the 15 hospitals with at least 15 Yandex texts.
Opened is the year in Supplementary S25, not a construction-start date and not a phased-block history. Site and footprint are OpenStreetMap areas. Blocks and the long axis of the largest mapped block describe horizontally extended campuses. Figure 3 draws three of these plans at one scale. Each panel is titled Graphic scale (200 m) and Solar orientation (north). The columns are not a full height ranking. A dash is an unmapped indoor footprint, not a zero. Photographs, plans, staff counts and healing spaces are not in this table.
5.6. Alternative Labels and Label-Error Simulation
Replacing the author navigation labels with the Grok reading left a positive rank correlation with beds (ρ = 0.566; p = 0.0304). The Qwen labels gave ρ = 0.604 (p = 0.0193). The Llama labels gave ρ = 0.260 (p = 0.3454). For walking or mobility, the same substitutions gave ρ = 0.661 (Grok), 0.622 (Qwen) and 0.532 (Llama). Dropping the 26 texts on which the author and Qwen navigation labels disagree left ρ = 0.391 (p = 0.1487) on the remaining texts, still grouped by the same 15 hospitals. The walking coefficient after dropping Qwen walking disagreements was ρ = 0.504 (p = 0.0577). These rows are method checks. They are not the independent human panel. The Grok substitution is particularly not independent, because the Grok reading was one of the files from which the authors formed the final labels. Human-coder substitutions are in Section 5.7. The nested hospital-then-text bootstrap in Section 4.3.3 is the interval that puts text-level sampling back into the share. It is wider than the hospital-only interval used in Table 8, and the navigation nested interval includes zero. The Grok-rate error simulation did not move the navigation coefficient through zero. The Qwen-rate simulation, which assumes a much higher false-negative rate, did. A correlation of about 0.51 in this corpus is therefore sensitive to how missed navigation paraphrases are treated, and it is not sensitive to the small Grok disagreement rate.
5.7. Independent Human Coding and Label Sensitivity
The primary H1 and H2 tests remain the author-adjudicated labels (ρ = 0.512 and 0.513; published permutation p = 0.0534 and 0.0520; Holm p = 0.1040). They are not replaced by the independent panel. Where both coders agreed, those labels were written onto the 140-text sample and the unsampled author-negative texts were left unchanged. Under that consensus, primary-set navigation-related texts fell from 32 to 28 (ρ = 0.430, p = 0.1098) and walking-or-mobility texts from 26 to 15 (ρ = 0.620, p = 0.0165; Holm p = 0.0330). Using coder A or coder B alone on the sample gave the same pattern: navigation weaker, walking stronger. Dropping the texts on which both coders agreed with each other and disagreed with the author left 471 primary texts (navigation ρ = 0.368, p = 0.1756; walking ρ = 0.609, p = 0.0191). Both coders agreed with each other but not with the author on four navigation-related texts and on 12 walking-or-mobility texts. The independent raters were stricter than the authors on walking language. That split is a sensitivity result. It is not a new primary test and does not rescue H1. A nested hospital-then-text bootstrap that also flips labels at the observed A–B disagreement rates (2.9% navigation, 1.4% walking; 5000 draws) gave 95% intervals of −0.221 to 0.700 for navigation and −0.046 to 0.814 for walking. Using author-versus-coder-A mismatch rates instead (5.7% and 10.0%) gave −0.267 to 0.677 and −0.211 to 0.739. Those intervals include zero. They describe clustered sampling plus plausible human label error; they are not a reason to treat the A–B kappas as low. Table 14 reports the two-coder agreement on the 140-text sample.
Table 14.
Independent two-coder agreement on the 140-text blinded sample (seed 22). Unions are scored after applying the uncertain rule. Workbooks are not deposited.
6. Discussion
On the retrieved Yandex frame, announced bed capacity ranked similarly with navigation-related language and with walking-or-mobility language. Both Spearman coefficients were about 0.51, and neither Holm-adjusted p value was below 0.05. The primary pair is therefore not statistically supported. The nested hospital-then-text interval for navigation included zero (−0.165 to 0.749). At k = 15, permutation Monte Carlo power if the true ρ were 0.51 is about one half. Once the navigation union is split, asking is the only component with an unadjusted p below 0.05 (ρ = 0.701; nine texts); signage-failure language is near zero (ρ = 0.069). That split is exploratory and does not rescue H1.
The labelled pattern is a reason to assess physical access and navigation separately. It does not identify the mechanism of either outcome. In the retrieved texts, 14 Yandex reviews, spread across 10 hospitals, describe a sign as missing, contradictory or insufficient. That count is a user complaint about signs. It is not an audit of typography, continuity or symbol comprehension. That sign complaint is the visual-communication mark inside the navigation-related union. The union is not a visual-communication score.
The distinction can be shown without quoting a writer. A navigation illustration is a sentence in which the clinic cannot be found and the block cannot be named. A visual-communication illustration is a sentence in which a sign is missing or contradicts another sign. An assistance illustration is a sentence in which the writer has to ask in order to go on. A walking illustration is a sentence in which the way is clear and the indoor walk is still described as long. These four sentences mark the code boundary. They are not quotations, they are not tied to a named hospital, and they do not report a measured minute or a measured metre.
Four mechanisms could produce a capacity–walking association, and none was identified here. The route from entrance to clinic may be longer. Clinics may sit far from laboratories and imaging, including where a service core and clinic wings lengthen the public path even if they shorten staff movement. Patient volume and the tendency to post may differ with announced capacity. A walk described in a review may also begin in the car park rather than at the clinic door. Campus edges were not mapped, so that last reading is not a fact about these 26 hospitals. A fifth, still unmeasured, mechanism is the medical programme together with the building technology that places it, as Section 2.2.1 sets out. Those features make the complex a hospital rather than an ordinary large building, and they were not entered as predictors. Two campuses with similar bed counts can differ in which departments must be adjacent and which must be isolated, and that difference can change walking and choice load without changing announced capacity [21,22,23]. The long-walking component, rather than the mobility component, carries more of the capacity association. That is still a labelled-text result. OpenStreetMap footprint, added after the labels, ranks with announced beds (raw VIF = 9.85; log VIF = 6.15). Once beds are partialled out, footprint does not account for walking language. The long axis of the largest block, an exploratory quantity, still ranked with walking language after that partial (ρ = 0.678; partial ρ given beds = 0.663). It was not the declared OSM primary, it was selected among several OSM metrics, and it is not a traced corridor.
The present estimates sit inside hospital wayfinding. They also sit inside a wider question about how people move through, and write about, large public complexes in cities. Multi-agent simulations of urban safe liveability treat resident decisions, environmental conditions and policy interventions as interacting over time [54]. That work is not a model of a clinic corridor, and this paper is not a simulation of a district. It is a reminder that a hospital campus is one of the places where urban liveability is used on foot, and that an unsolicited sentence about being lost or walking a long way is a resident-side trace rather than a complete environmental score. A later study could join the text shares used here with a simulation or with observed indoor agents; that combination was not attempted in this file. The calendar mismatch in the retrieved pages is one reason such a joining would need a common time window that this harvest does not supply.
Implications for Design and Wayfinding Audits
The text categories may help identify questions for subsequent post-occupancy and signage audits, but they are not themselves measures of plan connectivity, corridor length, signage legibility or observed navigation performance. No hospital-level design diagnosis is inferred solely from the retrieved texts. A later audit could treat lost language as a question about entrance decisions and landmarks; block-or-floor language as a question about the visibility of storey and pavilion identity; signage-failure language as a question about information continuity at decision nodes; asking as a question about where staff intervention is required; long walking as a question about entrance–clinic and clinic–imaging distances; and mobility language as a question about vertical circulation and accessible routes. Those pairings are a hypothesis list for fieldwork, not a completed audit of any of the 26 campuses. A future research direction is to integrate text-derived spatial-experience indicators with measured circulation networks and agent-based simulation of visitor movements [54]. Such integration could test potential intervention scenarios. No multi-agent simulation was performed in the present study, and urban safe-livability models are not identical with clinical indoor wayfinding. A further description, not used here, stores a building as named parameters. The Industry Foundation Classes and IndoorGML record storeys, rooms, doors and circulation as entities that can be queried. Navigation-related language could in principle be joined to those parameters. No such model was available for these 26 campuses, and none was built. The codes in this paper remain labels on public texts.
Şikayetvar is a contrast corpus, not a second draw from the same frame, and its labels were not author-adjudicated. It did not show the same positive walking association, so the portability of the Yandex pattern remains unresolved. A near-zero or reversed association is part of the result. A complaint site is already selected for dissatisfaction.
The writers are people who posted, and silent visitors are absent. Each Yandex page was the platform’s default order; hospitals do not share a calendar window; 174 texts are undated; and dated reviews precede the July 2026 capacity figures. Two independent coders marked a masked 140-text sample with almost-perfect union agreement (Table 14); the primary tests still use the author-adjudicated file, and walking language is the mark on which those authors were more liberal than the panel. No plan was traced, so the shares cannot be read as a route length or a signage score. OpenStreetMap footprint is collinear with announced beds. The codebook and the 15-text rule were not locked in a dated preregistered protocol. Limits are collected in Section 7.
7. Conclusions
This cross-hospital comparison provides a descriptive assessment of how announced hospital capacity relates to navigation-related language and walking-or-mobility language in retrieved public texts. The complete Yandex corpus comprised 566 texts, kept apart from 670 Şikayetvar complaints; author-adjudicated labels marked 35 navigation-related texts and 27 walking-or-mobility texts. The primary tests used 15 hospitals and 486 of those texts (32 and 26 marked). The two associations were positive (ρ ≈ 0.51) but not statistically supported after correction for the primary tests (Holm p = 0.1040). The walking coefficient weakened when Bilkent and Etlik were removed, through both leverage and reduced power, and the two correlations were not shown to differ. The interior-architecture contribution is this directory-wide language test and a codebook that can later be paired with unmeasured layout and signage audits; reported experience is not treated as the performance of spatial configurations or of signage systems. Split into parts, asking rather than signage-failure language sits closer to the navigation union; that split is exploratory, rests on nine texts, and does not rescue H1. Two independent coders marked 140 masked texts with κ = 0.913 (navigation-related union) and κ = 0.921 (walking-or-mobility union). Substituting their consensus does not rescue H1 and is not used as a new primary test. The results should be used to motivate targeted spatial and visual communication audits, not to rank hospitals or infer causal effects. Limits of this research: This design is a directory-wide public-text comparison, not a case-study post-occupancy evaluation of selected buildings. Author coding of the 566 texts was not independent dual coding and was not blinded to hospital identity or capacity; independent agreement is the 140-text panel. A stored note named 43 mixed cells without identifiers. Re-parsing identifies 42, of which the dated-stamp exclusion removes 20; dropping all 42 changes the hospital set and does not replace H1 or H2 (Section 5.1; Supplementary S13). The cells were not split into new labelled reviews. Hospitals do not share a review window; 174 texts are undated; dated reviews precede the July 2026 capacity figures; a common 2025 window leaves only nine hospitals at the 15-text rule and is not a new primary test. Photographs, as-built plans, space-syntax graphs and block-to-block connection diagrams were not collected. Staff headcount, occupied-bed census and inpatient/outpatient mix were not in the analytic file; announced beds remain the scale variable. Design and construction phasing beyond the opening year in Supplementary S25 was not reconstructed. Indoor and outdoor healing spaces were not inventoried. OpenStreetMap supplies campus footprint, block count, site area and the long axis of the largest mapped block (Table 13). Those axes run from 205 m to 656 m, so the readable layout is a horizontally extended campus rather than a tower. Figure 3 shows three of those plans at one scale. They are ground projections, not as-built floor plans, not sections and not footfall. A usable storey tag in the primary set exists only at Bilkent (area-weighted mean 6.95 storeys on a footprint of 147,739 m2), which is low- to mid-rise on a long plan. The other primary campuses are not ranked by height. The Yandex pages are a default-order retrieval, not a probability sample of recent visitors. Ethics-committee approval was not required, because the corpus is already public unsolicited text, no person was recruited or contacted, and results are hospital-level aggregates without identifiable quotations (KVKK Law No. 6698, Art. 5(2)(d) and Art. 28(1)(ç)). Later comparative work would need route-based spatial measures together with an audit of signs, maps, naming, typography and directional continuity, and it could be joined to simulation of how people use large urban complexes [54].
Supplementary Materials
The following supporting information can be downloaded at: https://www.mdpi.com/article/10.3390/buildings16214278/s1, Supplementary S1: S1_component_frequency.csv. Supplementary S2: S2_component_association.csv. Supplementary S3: S3_lexicon_validity.csv. Supplementary S4: S4_model_disagreements.csv. Supplementary S5: S5a_permutation_power.json; S5b_threshold_counts.csv. Supplementary S6: S6_osm_vif_raw_and_log.csv. Supplementary S7: S7_label_uncertainty.csv. Supplementary S8: S8a_blinded_coding_protocol.json; S8b_codebook_english.txt. Supplementary S9: S9_campus_descriptors.csv. Supplementary S10: S10a_intercoder_reliability.csv; S10b_coder_disagreements_no_text.csv. Supplementary S11: S11_label_sensitivity.csv. Supplementary S12: S12a_multicell_records.csv; S12b_sensitivity_tests.csv; S12c_multicell_by_hospital.csv; S12d_r4_unit_and_time.json. Supplementary S13: S13a_marker_mixed_cells.csv; S13b_note.txt; S13c_marker_mixed_summary.json; S13d_sensitivity.csv. Supplementary S14: S14_hospital_level_table.csv. Supplementary S15: S15_retrieval_log.csv. Supplementary S16: S16_yandex_review_dates.csv. Supplementary S17: S17_method_validation.csv. Supplementary S18: S18_llm_A_codes.csv. Supplementary S19: S19_llm_B_codes.csv. Supplementary S20: S20_llm_agreement.csv. Supplementary S21: S21_osm_scale_results.csv. Supplementary 22: S22_qa_campuses.png. Supplementary 23: S23_campus_metrics.csv. Supplementary 24: S24_hospital_identity.csv. Supplementary 25: S25_hospital_spatial_rates.csv.
Author Contributions
Conceptualization, G.D.A. and O.A.; methodology, G.D.A. and O.A.; software, G.D.A. and O.A.; validation, G.D.A. and O.A.; formal analysis, G.D.A. and O.A.; investigation, G.D.A. and O.A.; data curation, G.D.A. and O.A.; writing—original draft preparation, G.D.A. and O.A.; writing—review and editing, G.D.A. and O.A. Validation here is the author codebook, the adjudication of the Yandex labels, the independent two-coder exercise in Section 4.3.4 (Table 14), the generative double-coding check in Section 4.3.2, the uncertainty checks in Section 4.3.3 and checks of the computed tables. All authors have read and agreed to the published version of the manuscript.
Funding
This research received no external funding.
Institutional Review Board Statement
Ethical review and approval were not required for this study. The study analyses already published, unsolicited public reviews; it does not recruit, contact or intervene with human participants; it performs no survey or experiment; and it reports only hospital-level aggregates without identifiable quotations. Under Turkish Law No. 6698 on the Protection of Personal Data (KVKK), Article 5(2)(d) and Article 28(1)(ç), this retrospective public-document design does not require a separate ethics-committee application. No numbered approval or numbered exemption letter is attached, because none is applicable to this design.
Informed Consent Statement
Informed consent was not applicable. The texts were already public on Yandex Maps and Şikayetvar. Writers were not recruited or contacted, and no consent form was collected. Identifiable comments are not reproduced.
Data Availability Statement
The original contributions presented in this study are included in the supplementary materials. Further inquiries can be directed to the corresponding author.
Acknowledgments
During the preparation of this manuscript, the authors used Grok 4.7 (xAI) for language editing and for producing the Python scripts. The rank correlations, permutations and bootstrap intervals were computed by those scripts, not by the language model. Section 4.3.1 uses two local NLI models, mDeBERTa-v3-base-mnli-xnli and multilingual-MiniLMv2-L6-mnli-xnli, in July 2026. Section 4.3.2 uses Qwen/Qwen2.5-7B-Instruct and ytu-ce-cosmos/Turkish-Llama-8b-Instruct-v0.1, run locally in 4-bit NF4 with greedy decoding in July 2026. Neither generative model saw the author labels or the hospital names. The primary Yandex shares are the author-adjudicated labels described in Section 4.3.1. No generative system wrote the source pages. The authors have reviewed and edited the output and take full responsibility for the content of this publication.
Conflicts of Interest
The authors declare no conflicts of interest.
Abbreviations
The following abbreviations are used in this manuscript:
| AC1 | Gwet’s first-order agreement coefficient |
| CI | Confidence interval |
| OSM | OpenStreetMap |
| PPP | Public–private partnership |
| RQ | Research question |
| VIF | Variance inflation factor |
| MDE | Minimum detectable effect |
References
- Weisman, J. Evaluating Architectural Legibility: Way-Finding in the Built Environment. Environ. Behav. 1981, 13, 189–204. [Google Scholar] [CrossRef] [Scilit]
- O’Neill, M.J. Evaluation of a Conceptual Model of Architectural Legibility. Environ. Behav. 1991, 23, 259–284. [Google Scholar] [CrossRef] [Scilit]
- O’Neill, M.J. Effects of Signage and Floor Plan Configuration on Wayfinding Accuracy. Environ. Behav. 1991, 23, 553–574. [Google Scholar] [CrossRef] [Scilit]
- Jamshidi, S.; Ensafi, M.; Pati, D. Wayfinding in Interior Environments: An Integrative Review. Front. Psychol. 2020, 11, 549628. [Google Scholar] [CrossRef] [Scilit] [PubMed]
- Aksoy, E.; Aydın, D.; İskifoğlu, G. Analysis of the Correlation Between Layout and Wayfinding Decisions in Hospitals. Megaron 2020, 15, 509–520. [Google Scholar] [CrossRef] [Scilit]
- Noraslı, M.; Çınar, K. Konya Şehir Hastanesi Sirkülasyon Alanlarının Mekân Dizimi Yöntemi ile Analizi. Turk. Online J. Des. Art Commun. 2021, 11, 1348–1359. Available online: https://dergipark.org.tr/tr/pub/tojdac/issue/64720/968916 (accessed on 21 September 2026).
- Noraslı, M. Şehir Hastanelerindeki Sirkülasyon Sisteminin Yön Bulmaya Etkilerinin Mekân Dizimi ile İncelenmesi: Konya Şehir Hastanesi Örneği. Doctoral Thesis, KTO Karatay University, Konya, Türkiye, 2022. Available online: https://tezara.org/theses/732929 (accessed on 21 September 2026).
- Bitik, Z.S. Navigating Complexity: Enhancing Wayfinding in Etlik City Hospital. Master’s Thesis, Ankara Yıldırım Beyazıt University, Ankara, Türkiye, 2024. Available online: https://avesis.aybu.edu.tr/yonetilen-tez/fa65cdc9-14de-4538-b60a-ee54ba6fb80c/navigating-complexity-enhancing-wayfinding-in-etlik-city-hospital (accessed on 21 September 2026).
- Pouyan, A.E.; Ghanbaran, A.; Shakibamanesh, A. Impact of Circulation Complexity on Hospital Wayfinding Behavior (Case Study: Milad 1000-Bed Hospital, Tehran, Iran). J. Build. Eng. 2021, 44, 102931. [Google Scholar] [CrossRef] [Scilit]
- Chen, M.-S.; Ko, Y.-T.; Hsieh, W.-C. Exploring the Planning and Configuration of the Hospital Wayfinding System by Space Syntax: A Case Study of Cheng Ching Hospital, Chung Kang Branch in Taiwan. ISPRS Int. J. Geo-Inf. 2021, 10, 570. [Google Scholar] [CrossRef] [Scilit]
- Lee, K.; Lim, T.; Lee, K.; Park, C.-K. Quantifying Spatial Complexity and Signage Distribution in Large-Scale Hospital Wayfinding: A Space Syntax Analysis of a Medical Center. ISPRS Int. J. Geo-Inf. 2026, 15, 399. [Google Scholar] [CrossRef] [Scilit]
- Deng, L.; Romainoor, N.H. A Bibliometric Analysis of Published Literature on Healthcare Facilities’ Wayfinding Research from 1974 to 2020. Heliyon 2022, 8, e10723. [Google Scholar] [CrossRef] [Scilit] [PubMed]
- Okuyucu, B.; Yazıcı, S. A Comparative Study Driven by Spatial Performance and VR toward Wayfinding in Architectural Space: Healthcare Buildings as a Case Study. Estoa 2024, 13, 79–94. [Google Scholar] [CrossRef] [Scilit]
- Greaves, F.; Ramirez-Cano, D.; Millett, C.; Darzi, A.; Donaldson, L. Use of Sentiment Analysis for Capturing Patient Experience from Free-Text Comments Posted Online. J. Med. Internet Res. 2013, 15, e239. [Google Scholar] [CrossRef] [Scilit] [PubMed]
- Republic of Türkiye Ministry of Health. Statement on Newly Planned City Hospitals. Available online: https://www.saglik.gov.tr/TR-60550/yeni-planlanan-sehir-hastaneleri-iliskin-aciklama.html (accessed on 23 September 2026).
- Republic of Türkiye. Law No. 6428 on the Construction, Renovation and Service Procurement of Facilities by the Ministry of Health and Its Affiliates through the Public–Private Partnership Model. Official Gazette, 9 March 2013, No. 28582. Available online: https://www.mevzuat.gov.tr/mevzuat?MevzuatNo=6428&MevzuatTur=1&MevzuatTertip=5 (accessed on 23 September 2026).
- Anadolu Agency. City Hospitals Serve with a Capacity of About 40,000 Beds. July 2026. Available online: https://www.aa.com.tr/tr/gundem/sehir-hastaneleri-yaklasik-40-bin-yatak-kapasitesiyle-hizmet-veriyor/4059734 (accessed on 23 September 2026).
- Presidency of the Republic of Türkiye. Address at the Opening Ceremony of Samsun City Hospital. Available online: https://www.tccb.gov.tr/konusmalar/353/166171/samsun-sehir-hastanesi-acilis-toreni-nde-yaptiklari-konusma (accessed on 23 September 2026).
- Demirören News Agency. Ordu City Hospital Began Accepting Patients. July 2026. Available online: https://www.dha.com.tr/yerel-haberler/ordu/ordu-sehir-hastanesi-hasta-kabulune-basladi-2947476 (accessed on 23 September 2026).
- Kamu Hastaneleri Genel Müdürlüğü. Şehir Hastanelerimiz. Available online: https://khgm.saglik.gov.tr/TR-92795/sehir-hastanelerimiz.html (accessed on 22 September 2026).
- Jia, Z.; Nourian, P.; Luscuere, P.; Wagenaar, C. Spatial Decision Support Systems for Hospital Layout Design: A Review. J. Build. Eng. 2023, 67, 106042. [Google Scholar] [CrossRef] [Scilit]
- Jia, Z.; Nourian, P.; Luscuere, P.; Wagenaar, C. HDSS: A Hospital Design Support System Architecture. Dev. Built Environ. 2026, 26, 100916. [Google Scholar] [CrossRef] [Scilit]
- Jia, Z.; Nourian, P.; Luscuere, P.; Wagenaar, C. A Configuration Model for Hospital Design Support Systems. Buildings 2025, 15, 163. [Google Scholar] [CrossRef] [Scilit]
- Jiang, S.; Verderber, S. On the Planning and Design of Hospital Circulation Zones: A Review of the Evidence-Based Literature. Health Environ. Res. Des. J. 2017, 10, 124–146. [Google Scholar] [CrossRef] [Scilit] [PubMed]
- Peponis, J.; Zimring, C.; Choi, Y.K. Finding the Building in Wayfinding. Environ. Behav. 1990, 22, 555–590. [Google Scholar] [CrossRef] [Scilit]
- Haq, S.; Zimring, C. Just Down the Road a Piece: The Development of Topological Knowledge of Building Layouts. Environ. Behav. 2003, 35, 132–160. [Google Scholar] [CrossRef] [Scilit]
- Hillier, B.; Hanson, J. The Social Logic of Space; Cambridge University Press: Cambridge, UK, 1984. [Google Scholar]
- Lee, J.H.; Ostwald, M.J.; Zhou, L. Socio-Spatial Experience in Space Syntax Research: A PRISMA-Compliant Review. Buildings 2023, 13, 644. [Google Scholar] [CrossRef] [Scilit]
- Carpman, J.R.; Grant, M.A.; Simmons, D.A. Hospital Design and Wayfinding: A Video Simulation Study. Environ. Behav. 1985, 17, 296–314. [Google Scholar] [CrossRef] [Scilit]
- Ge, J.; Yu, S.; Zheng, S.; Qiu, X.; Wei, Z.; Chen, J.; Luo, X. Outpatient Spatial Layout and Wayfinding Efficiency: Quantitative Assessment and Design Implications for Healthcare Operations. Results Eng. 2026, 29, 109528. [Google Scholar] [CrossRef] [Scilit]
- Cai, H.; Daneshvar, Z.; Miller, K.; Dash, M.; Jiang, S. Exploring Campus Configuration and Patient Arrival Behaviors at Large Hospitals: An Integrated Post-Occupancy Evaluation (POE) Protocol. Health Environ. Res. Des. J. 2024, 17, 45–64. [Google Scholar] [CrossRef] [Scilit] [PubMed]
- Arthur, P.; Passini, R. Wayfinding: People, Signs, and Architecture; McGraw-Hill: New York, NY, USA, 1992. [Google Scholar]
- Calori, C.; Vanden-Eynden, D. Signage and Wayfinding Design: A Complete Guide to Creating Environmental Graphic Design Systems, 2nd ed.; Wiley: Hoboken, NJ, USA, 2015. [Google Scholar]
- Rodrigues, R.; Coelho, R.; Tavares, J.M.R.S. Healthcare Signage Design: A Review on Recommendations for Effective Signing Systems. Health Environ. Res. Des. J. 2019, 12, 45–65. [Google Scholar] [CrossRef] [Scilit] [PubMed]
- Rodrigues, R.; Coelho, R.; Tavares, J.M.R.S. Users’ Perceptions of Signage Systems at Three Portuguese Hospitals. Health Environ. Res. Des. J. 2020, 13, 36–53. [Google Scholar] [CrossRef] [Scilit] [PubMed]
- Lee, S.; Dazkir, S.S.; Paik, H.S.; Coskun, A. Comprehensibility of Universal Healthcare Symbols for Wayfinding in Healthcare Facilities. Appl. Ergon. 2014, 45, 878–885. [Google Scholar] [CrossRef] [Scilit] [PubMed]
- Wang, C.-Y.; Chen, C.-I.; Zheng, M.-C. Exploring Sign System Design for a Medical Facility: A Virtual Environment Study on Wayfinding Behaviors. Buildings 2023, 13, 1366. [Google Scholar] [CrossRef] [Scilit]
- Ulrich, R.S.; Zimring, C.; Zhu, X.; DuBose, J.; Seo, H.-B.; Choi, Y.-S.; Quan, X.; Joseph, A. A Review of the Research Literature on Evidence-Based Healthcare Design. Health Environ. Res. Des. J. 2008, 1, 61–125. [Google Scholar] [CrossRef] [Scilit] [PubMed]
- Liu, J.; Hou, S.; Evans, R.; Xia, C.; Xia, W.; Ma, J. What Do Patients Complain About Online: A Systematic Review and Taxonomy Framework Based on Patient Centeredness. J. Med. Internet Res. 2019, 21, e14634. [Google Scholar] [CrossRef] [Scilit] [PubMed]
- Ranard, B.L.; Werner, R.M.; Antanavicius, T.; Schwartz, H.A.; Smith, R.J.; Meisel, Z.F.; Asch, D.A.; Ungar, L.H.; Merchant, R.M. Yelp Reviews of Hospital Care Can Supplement and Inform Traditional Surveys of the Patient Experience of Care. Health Aff. 2016, 35, 697–705. [Google Scholar] [CrossRef] [Scilit] [PubMed]
- Spearman, C. The Proof and Measurement of Association between Two Things. Am. J. Psychol. 1904, 15, 72–101. [Google Scholar] [CrossRef] [Scilit] [PubMed]
- Franzke, A.S.; Bechmann, A.; Zimmer, M.; Ess, C.; the Association of Internet Researchers. Internet Research: Ethical Guidelines 3.0. 2020. Available online: https://aoir.org/reports/ethics3.pdf (accessed on 22 September 2026).
- Devlin, J.; Chang, M.-W.; Lee, K.; Toutanova, K. BERT: Pre-training of Deep Bidirectional Transformers for Language Understanding. In Proceedings of the 2019 Conference of the North American Chapter of the Association for Computational Linguistics: Human Language Technologies, Minneapolis, MN, USA, 2–7 June 2019; pp. 4171–4186. [Google Scholar] [CrossRef] [Scilit]
- Saito, T.; Rehmsmeier, M. The Precision-Recall Plot Is More Informative than the ROC Plot When Evaluating Binary Classifiers on Imbalanced Datasets. PLoS ONE 2015, 10, e0118432. [Google Scholar] [CrossRef] [Scilit] [PubMed]
- Gwet, K.L. Computing Inter-Rater Reliability and Its Variance in the Presence of High Agreement. Br. J. Math. Stat. Psychol. 2008, 61, 29–48. [Google Scholar] [CrossRef] [Scilit] [PubMed]
- Hill, C.; Dahil, A.; Simpson, G.; Hardisty, D.; Keast, J.; Pinn, C.K.; Dambha-Miller, H. Large Language Models for Thematic Analysis in Healthcare Research: A Blinded Mixed-Methods Comparison with Human Analysts. PLoS Digit. Health 2026, 5, e0001189. [Google Scholar] [CrossRef] [Scilit] [PubMed]
- Bijker, R.; Merkouris, S.S.; Dowling, N.A.; Rodda, S.N. ChatGPT for Automated Qualitative Research: Content Analysis. J. Med. Internet Res. 2024, 26, e59050. [Google Scholar] [CrossRef] [Scilit] [PubMed]
- Long, Y.; Luo, H.; Zhang, Y. Evaluating Large Language Models in Analysing Classroom Dialogue. npj Sci. Learn. 2024, 9, 60. [Google Scholar] [CrossRef] [Scilit] [PubMed]
- Prescott, M.R.; Yeager, S.; Ham, L.; Rivera Saldana, C.D.; Serrano, V.; Narez, J.; Paltin, D.; Delgado, J.; Moore, D.J.; Montoya, J. Comparing the Efficacy and Efficiency of Human and Generative AI: Qualitative Thematic Analyses. JMIR AI 2024, 3, e54482. [Google Scholar] [CrossRef] [Scilit] [PubMed]
- Dunivin, Z.O. Scaling Hermeneutics: A Guide to Qualitative Coding with LLMs for Reflexive Content Analysis. EPJ Data Sci. 2025, 14, 28. [Google Scholar] [CrossRef] [Scilit]
- Landis, J.R.; Koch, G.G. The Measurement of Observer Agreement for Categorical Data. Biometrics 1977, 33, 159–174. [Google Scholar] [CrossRef] [Scilit]
- OpenStreetMap Contributors. OpenStreetMap. Available online: https://www.openstreetmap.org/copyright (accessed on 24 September 2026).
- Overpass API. Available online: https://overpass-api.de (accessed on 24 September 2026).
- Pan, L.; Yang, F.; Lu, F.; Qin, S.; Yan, H.; Peng, R. Multi-Agent Simulation of Safe Livability and Sustainable Development in Cities. Sustainability 2020, 12, 2070. [Google Scholar] [CrossRef] [Scilit]
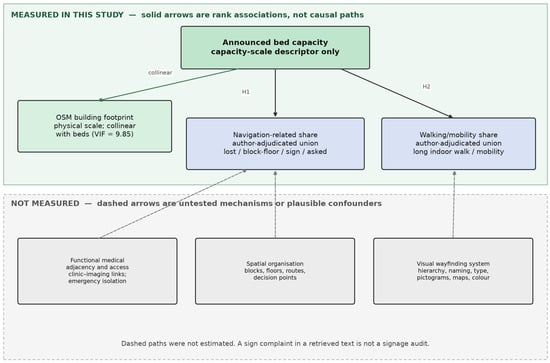
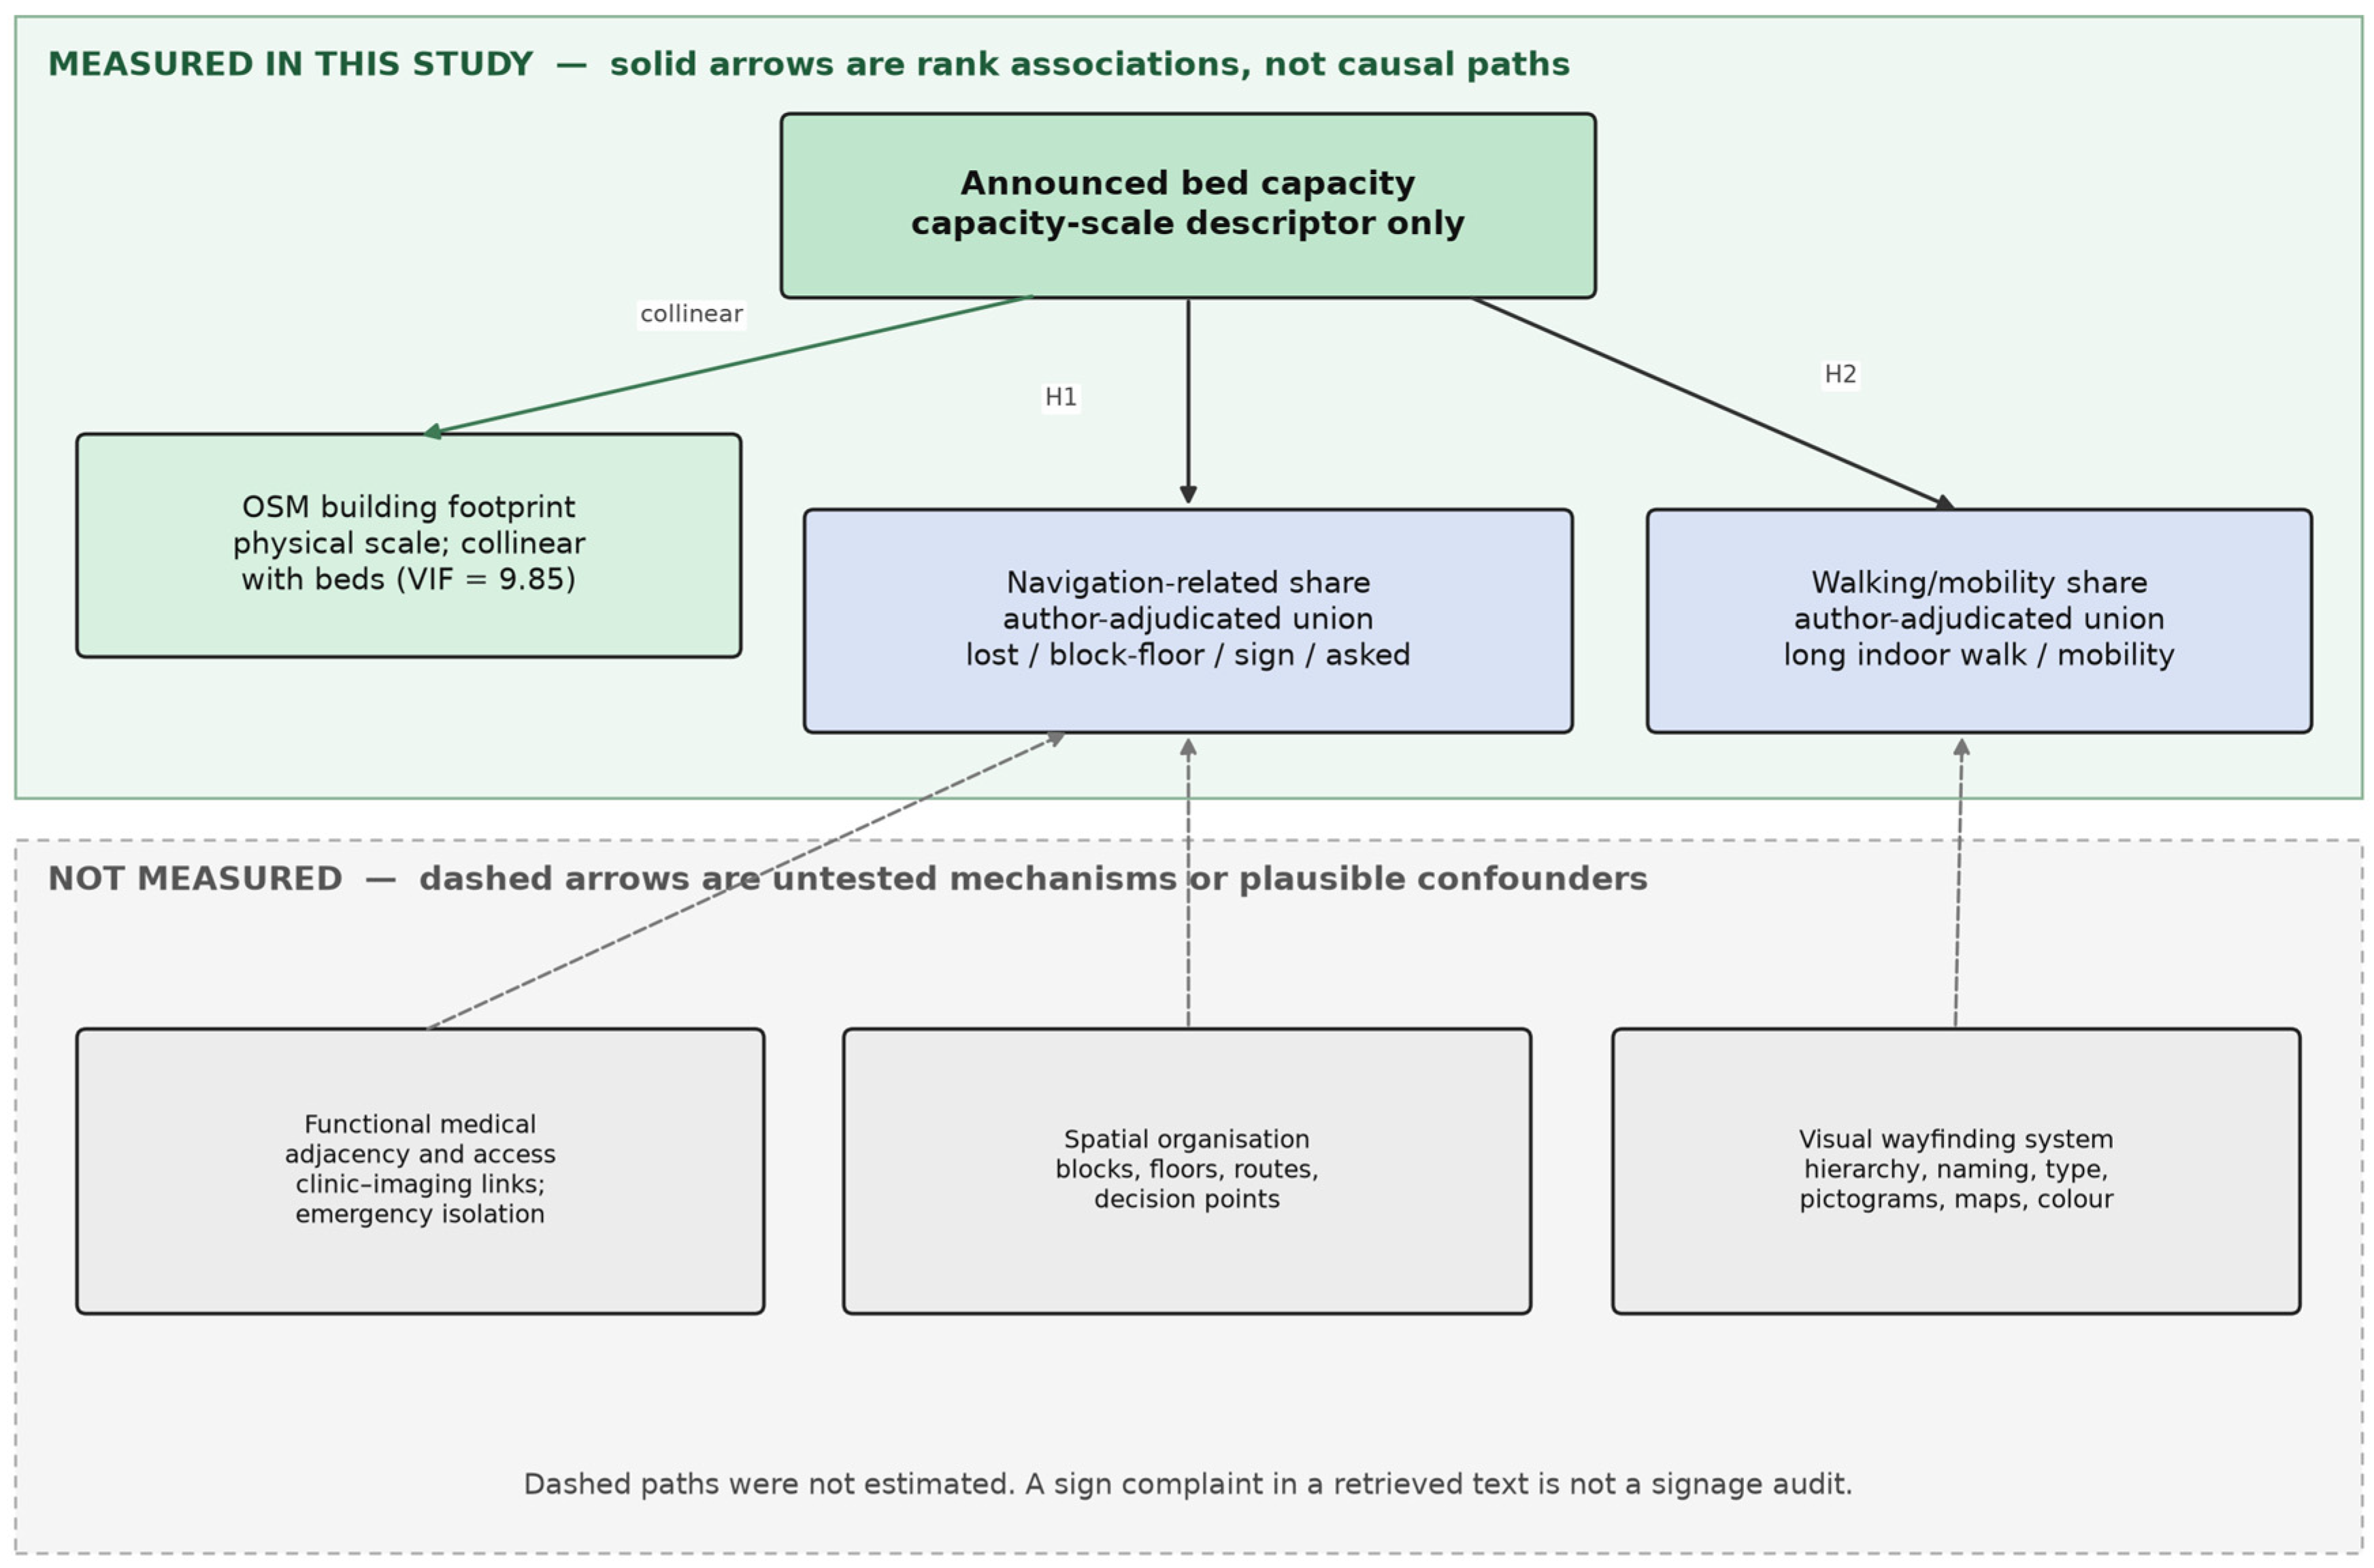
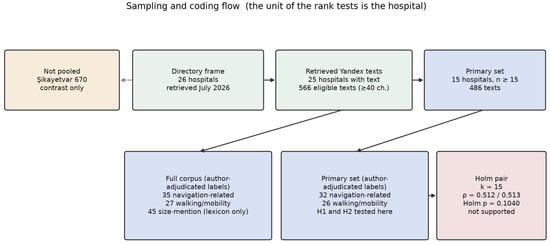
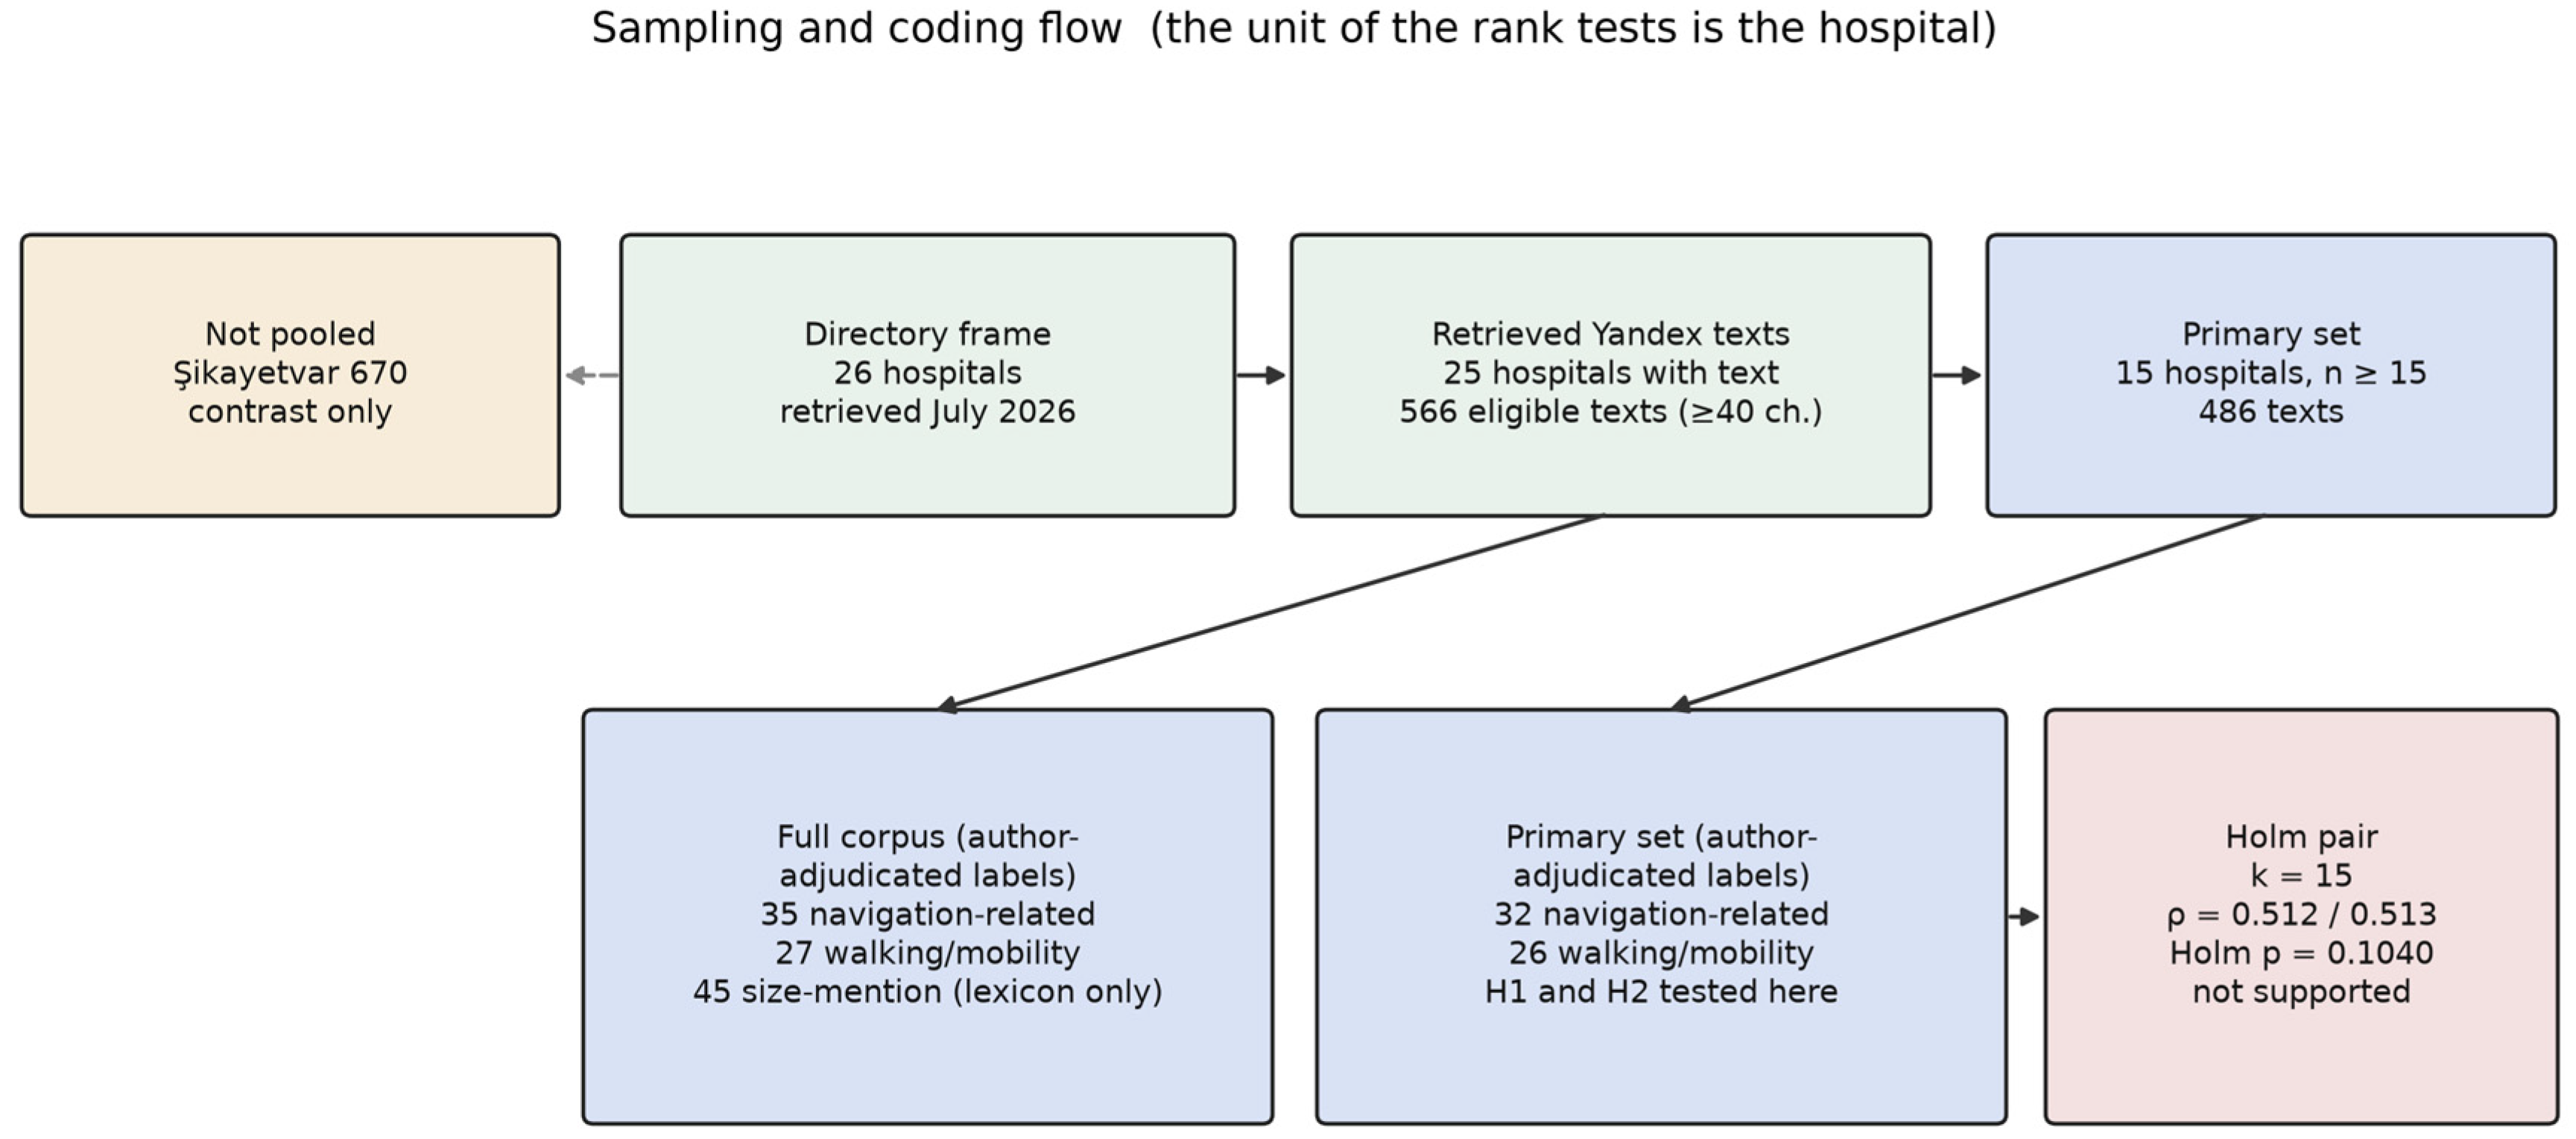
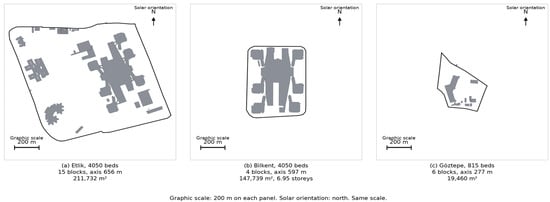
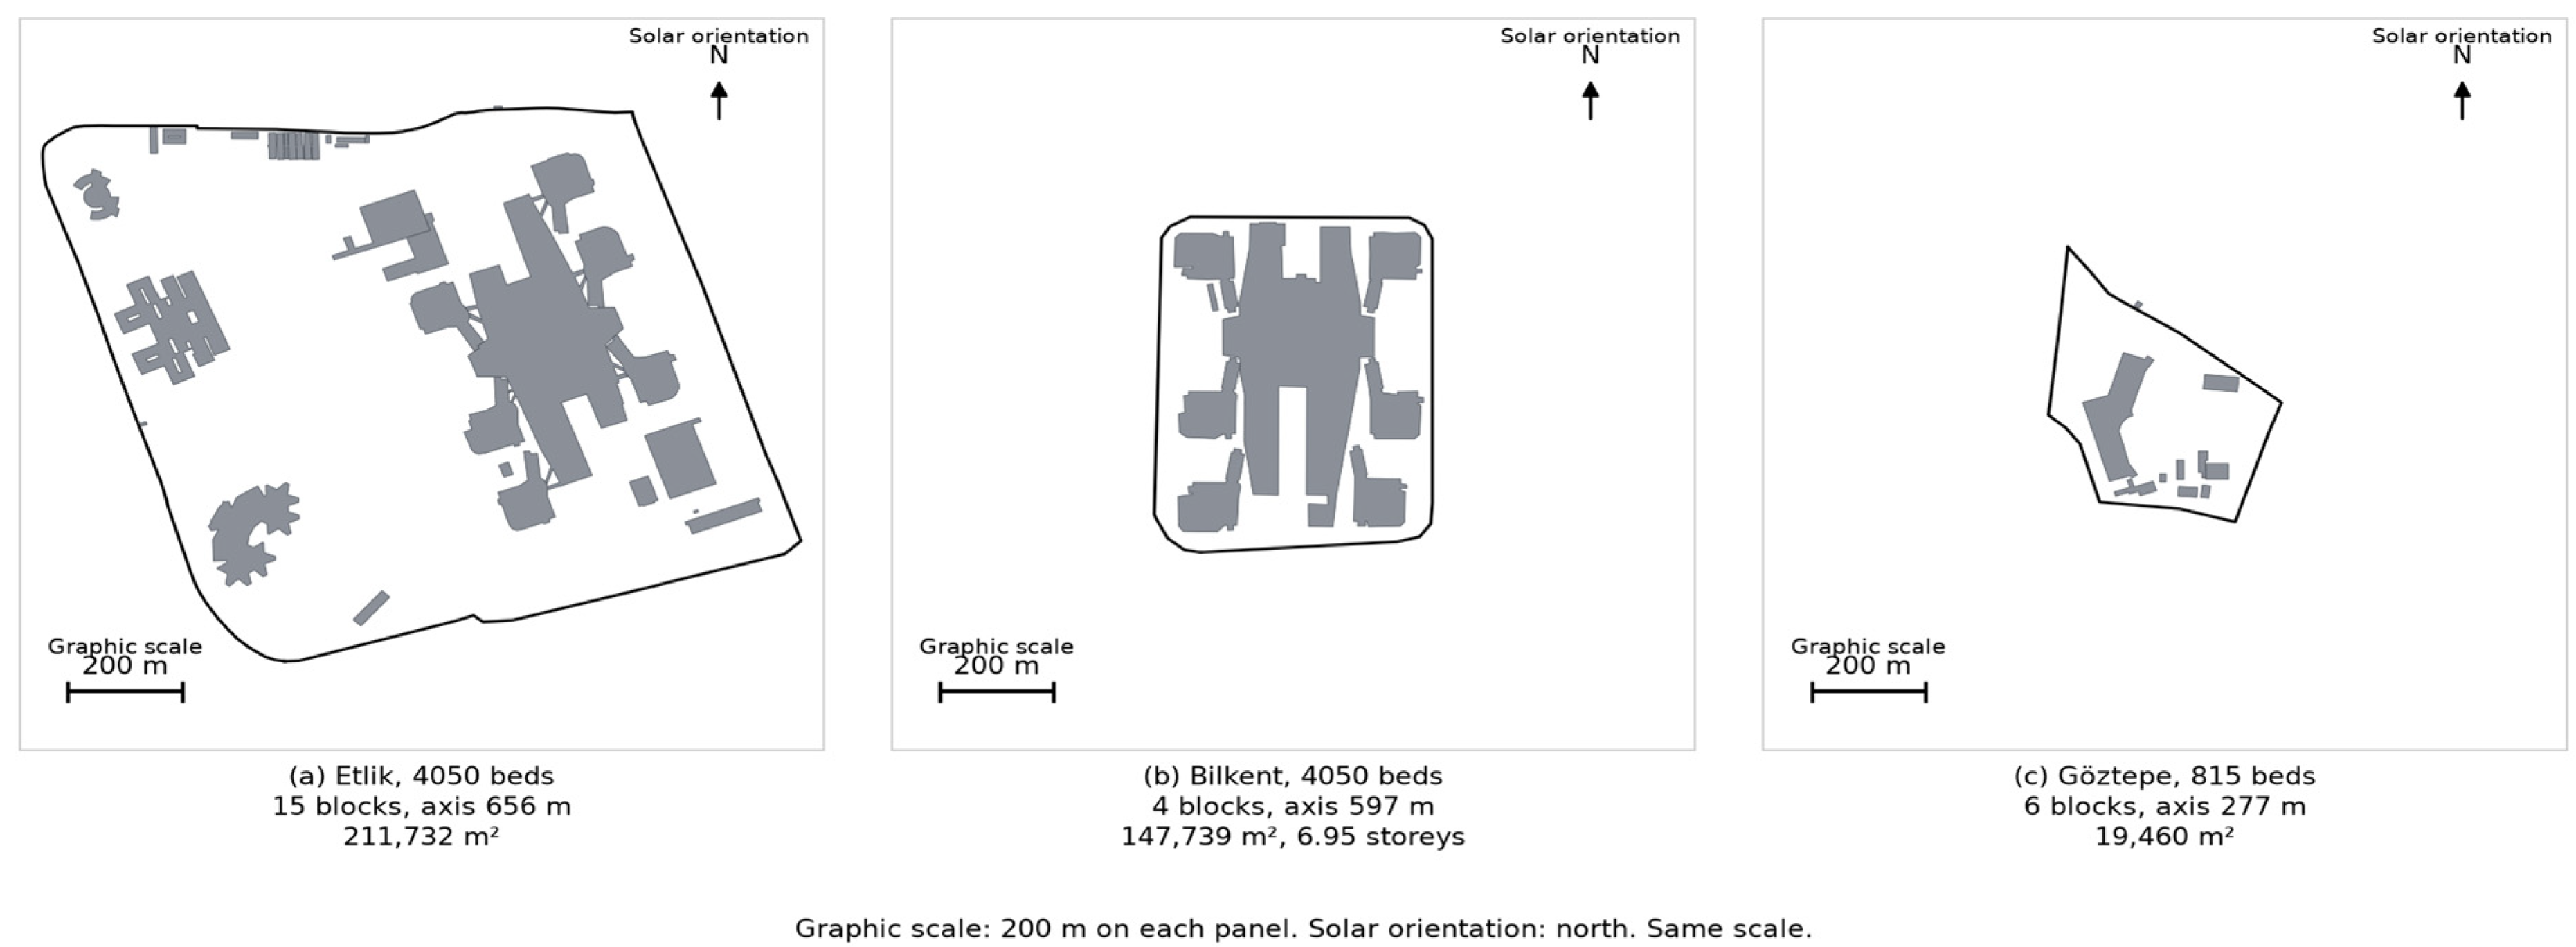
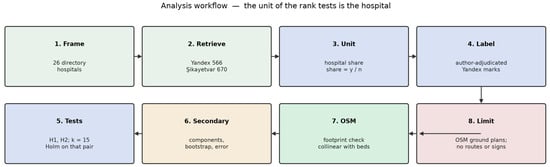
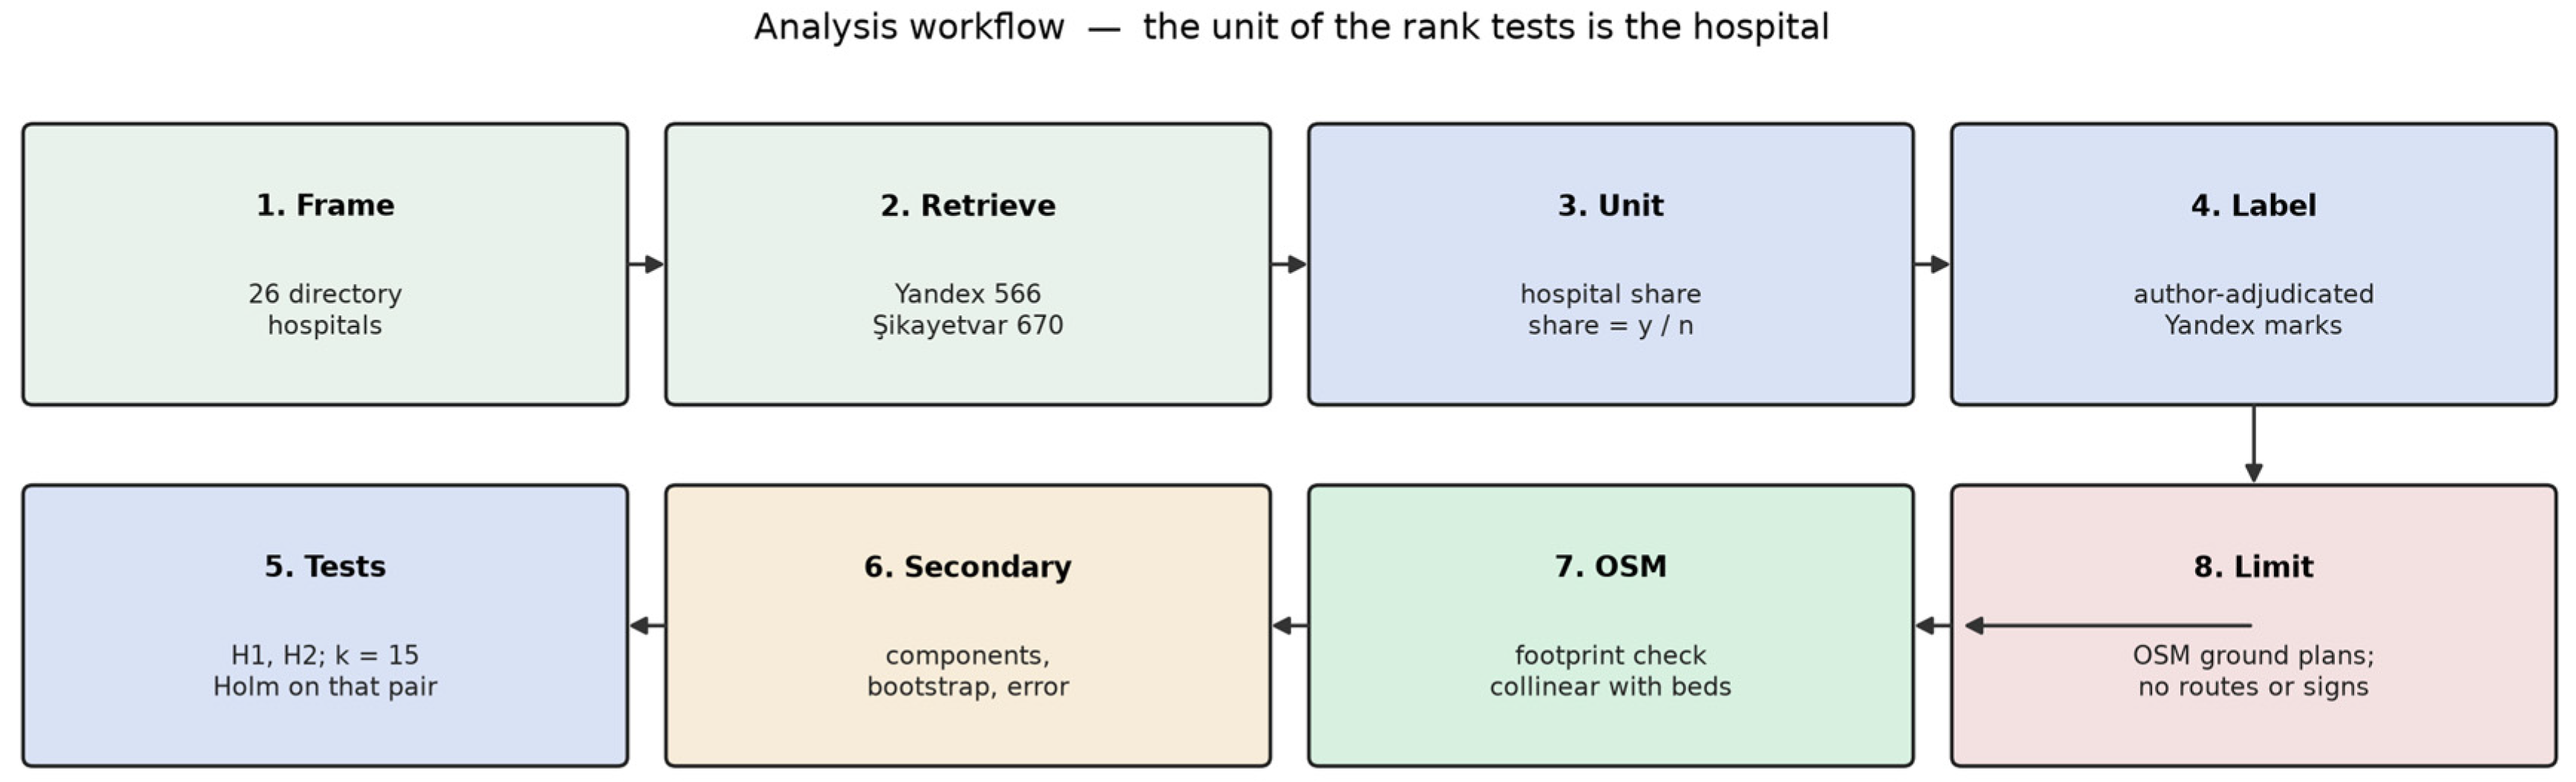
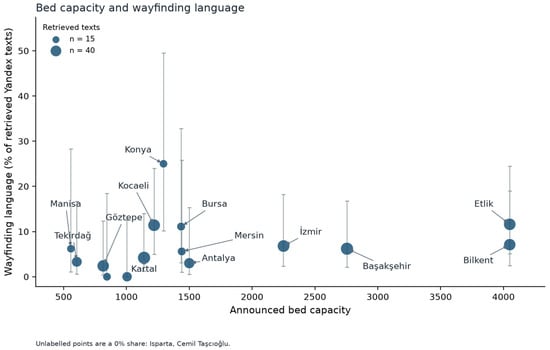
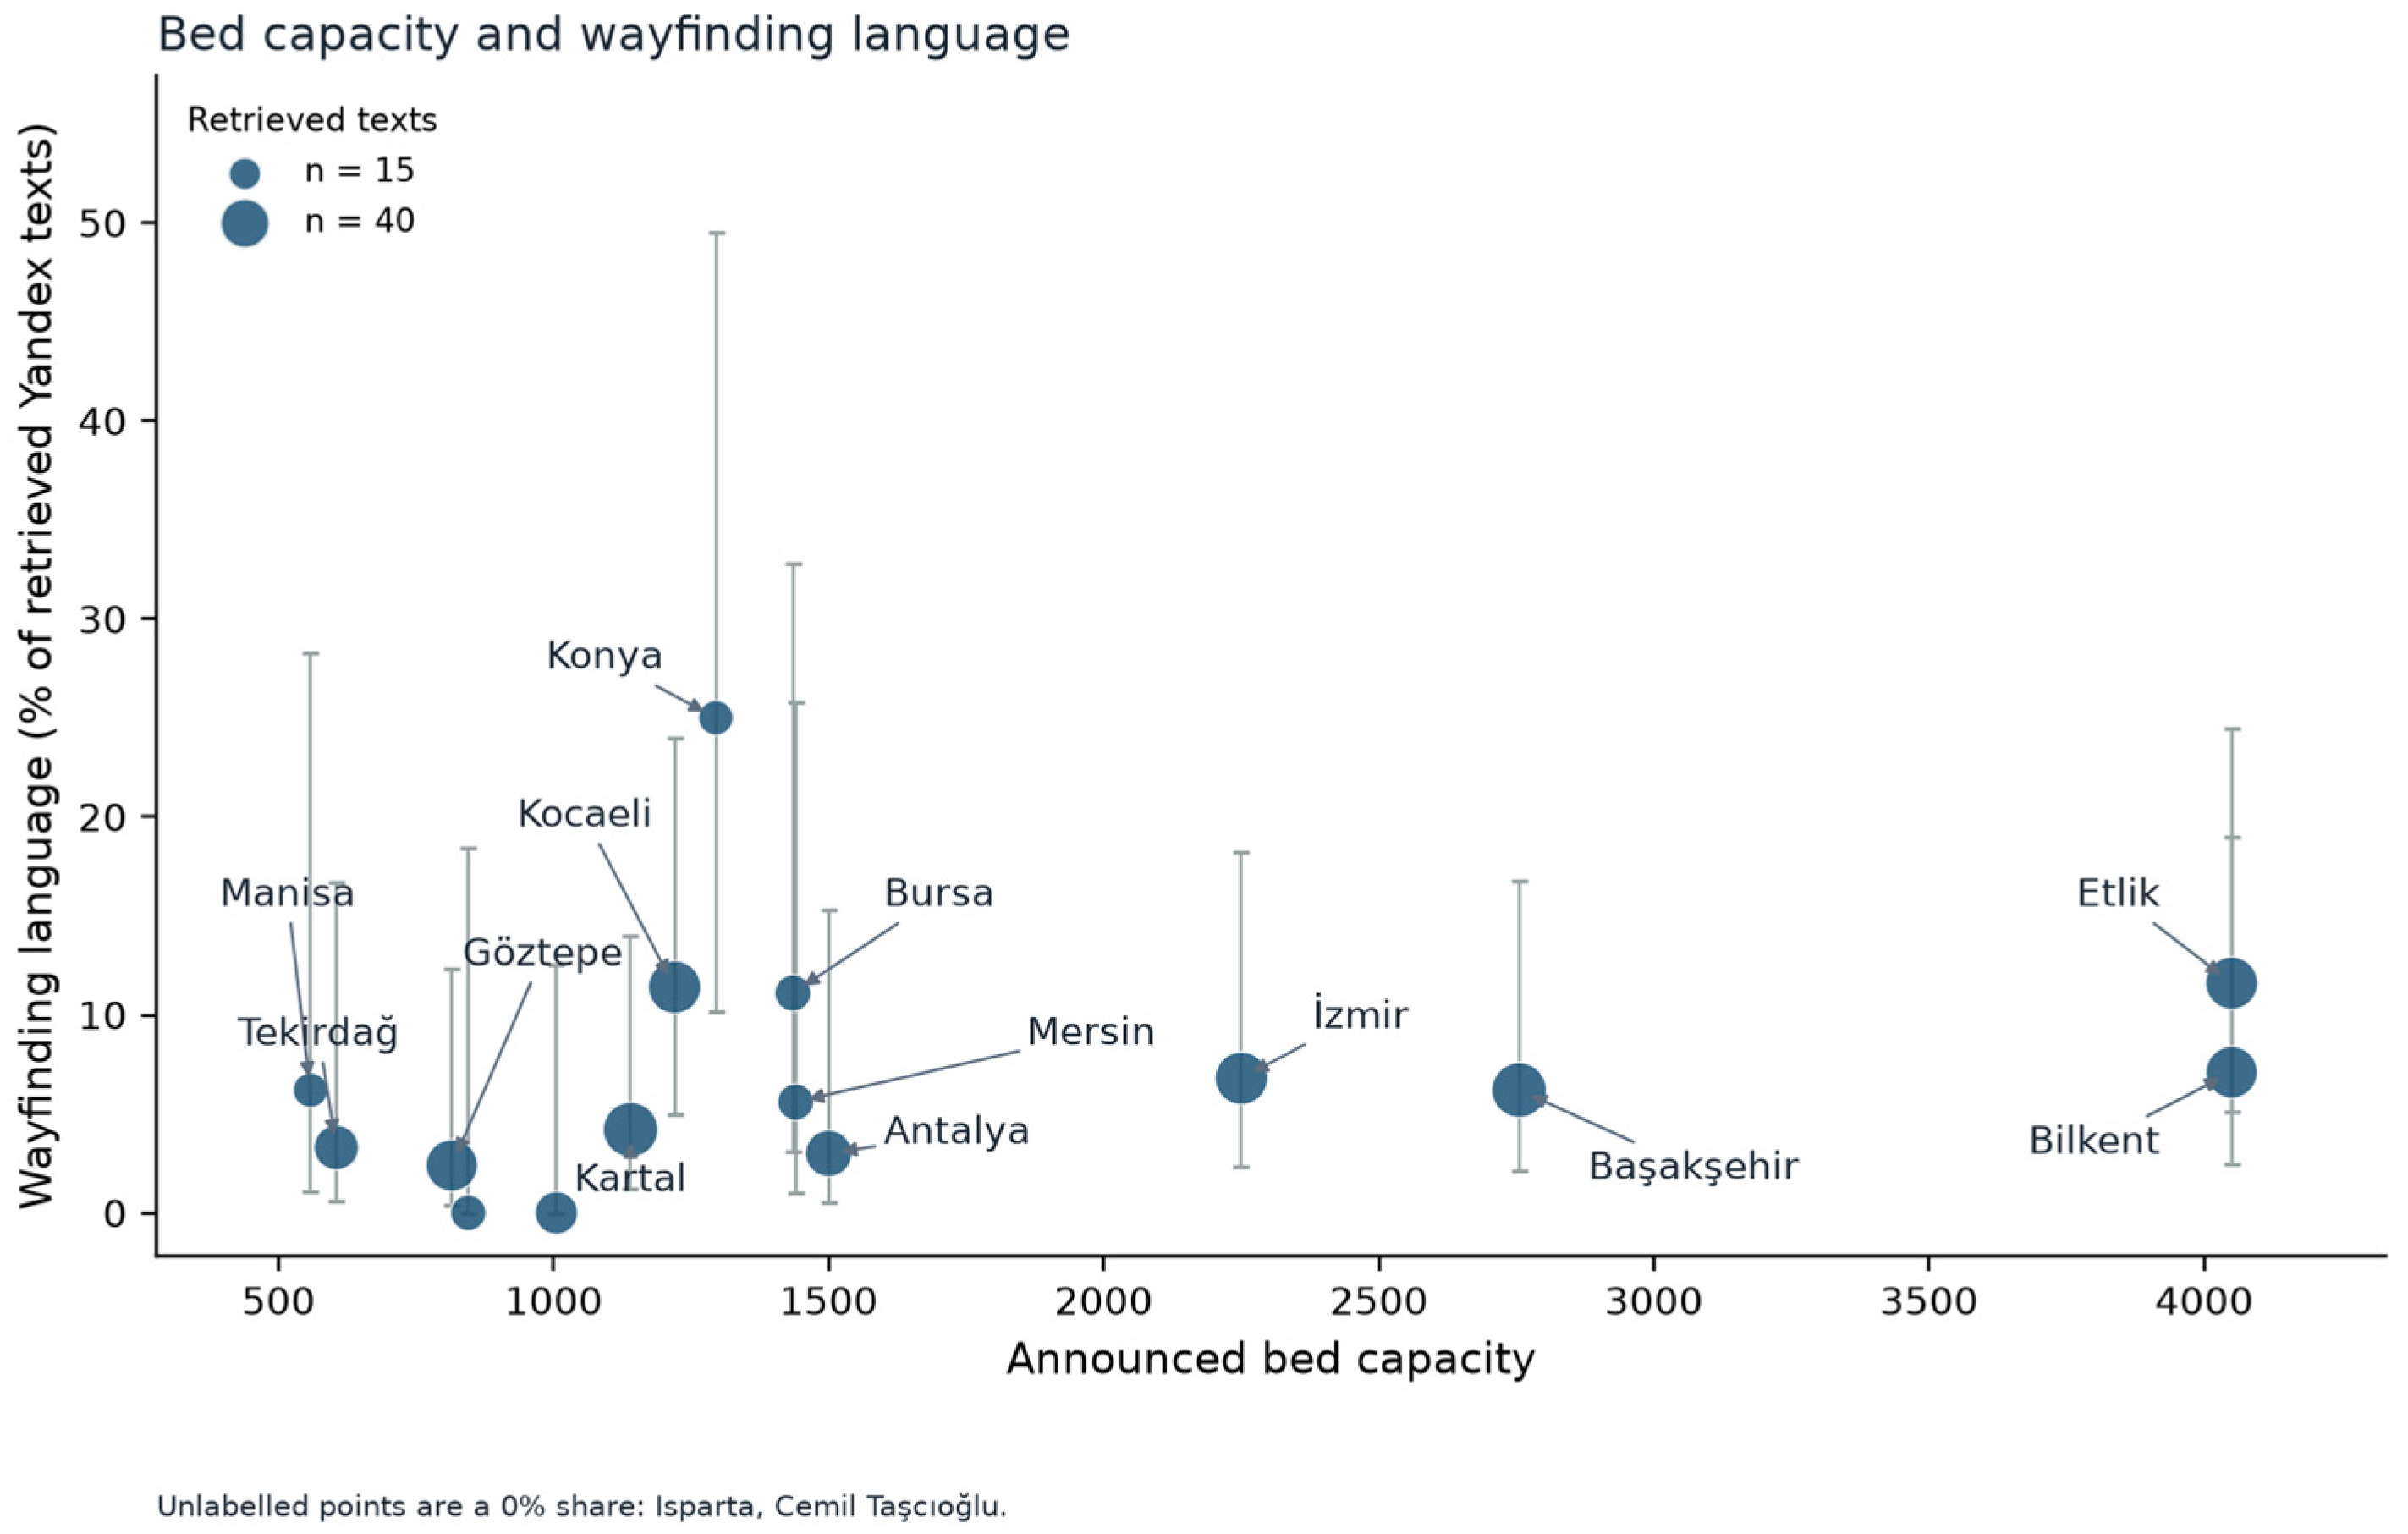
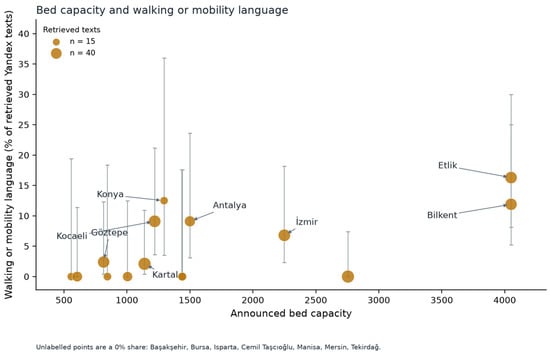
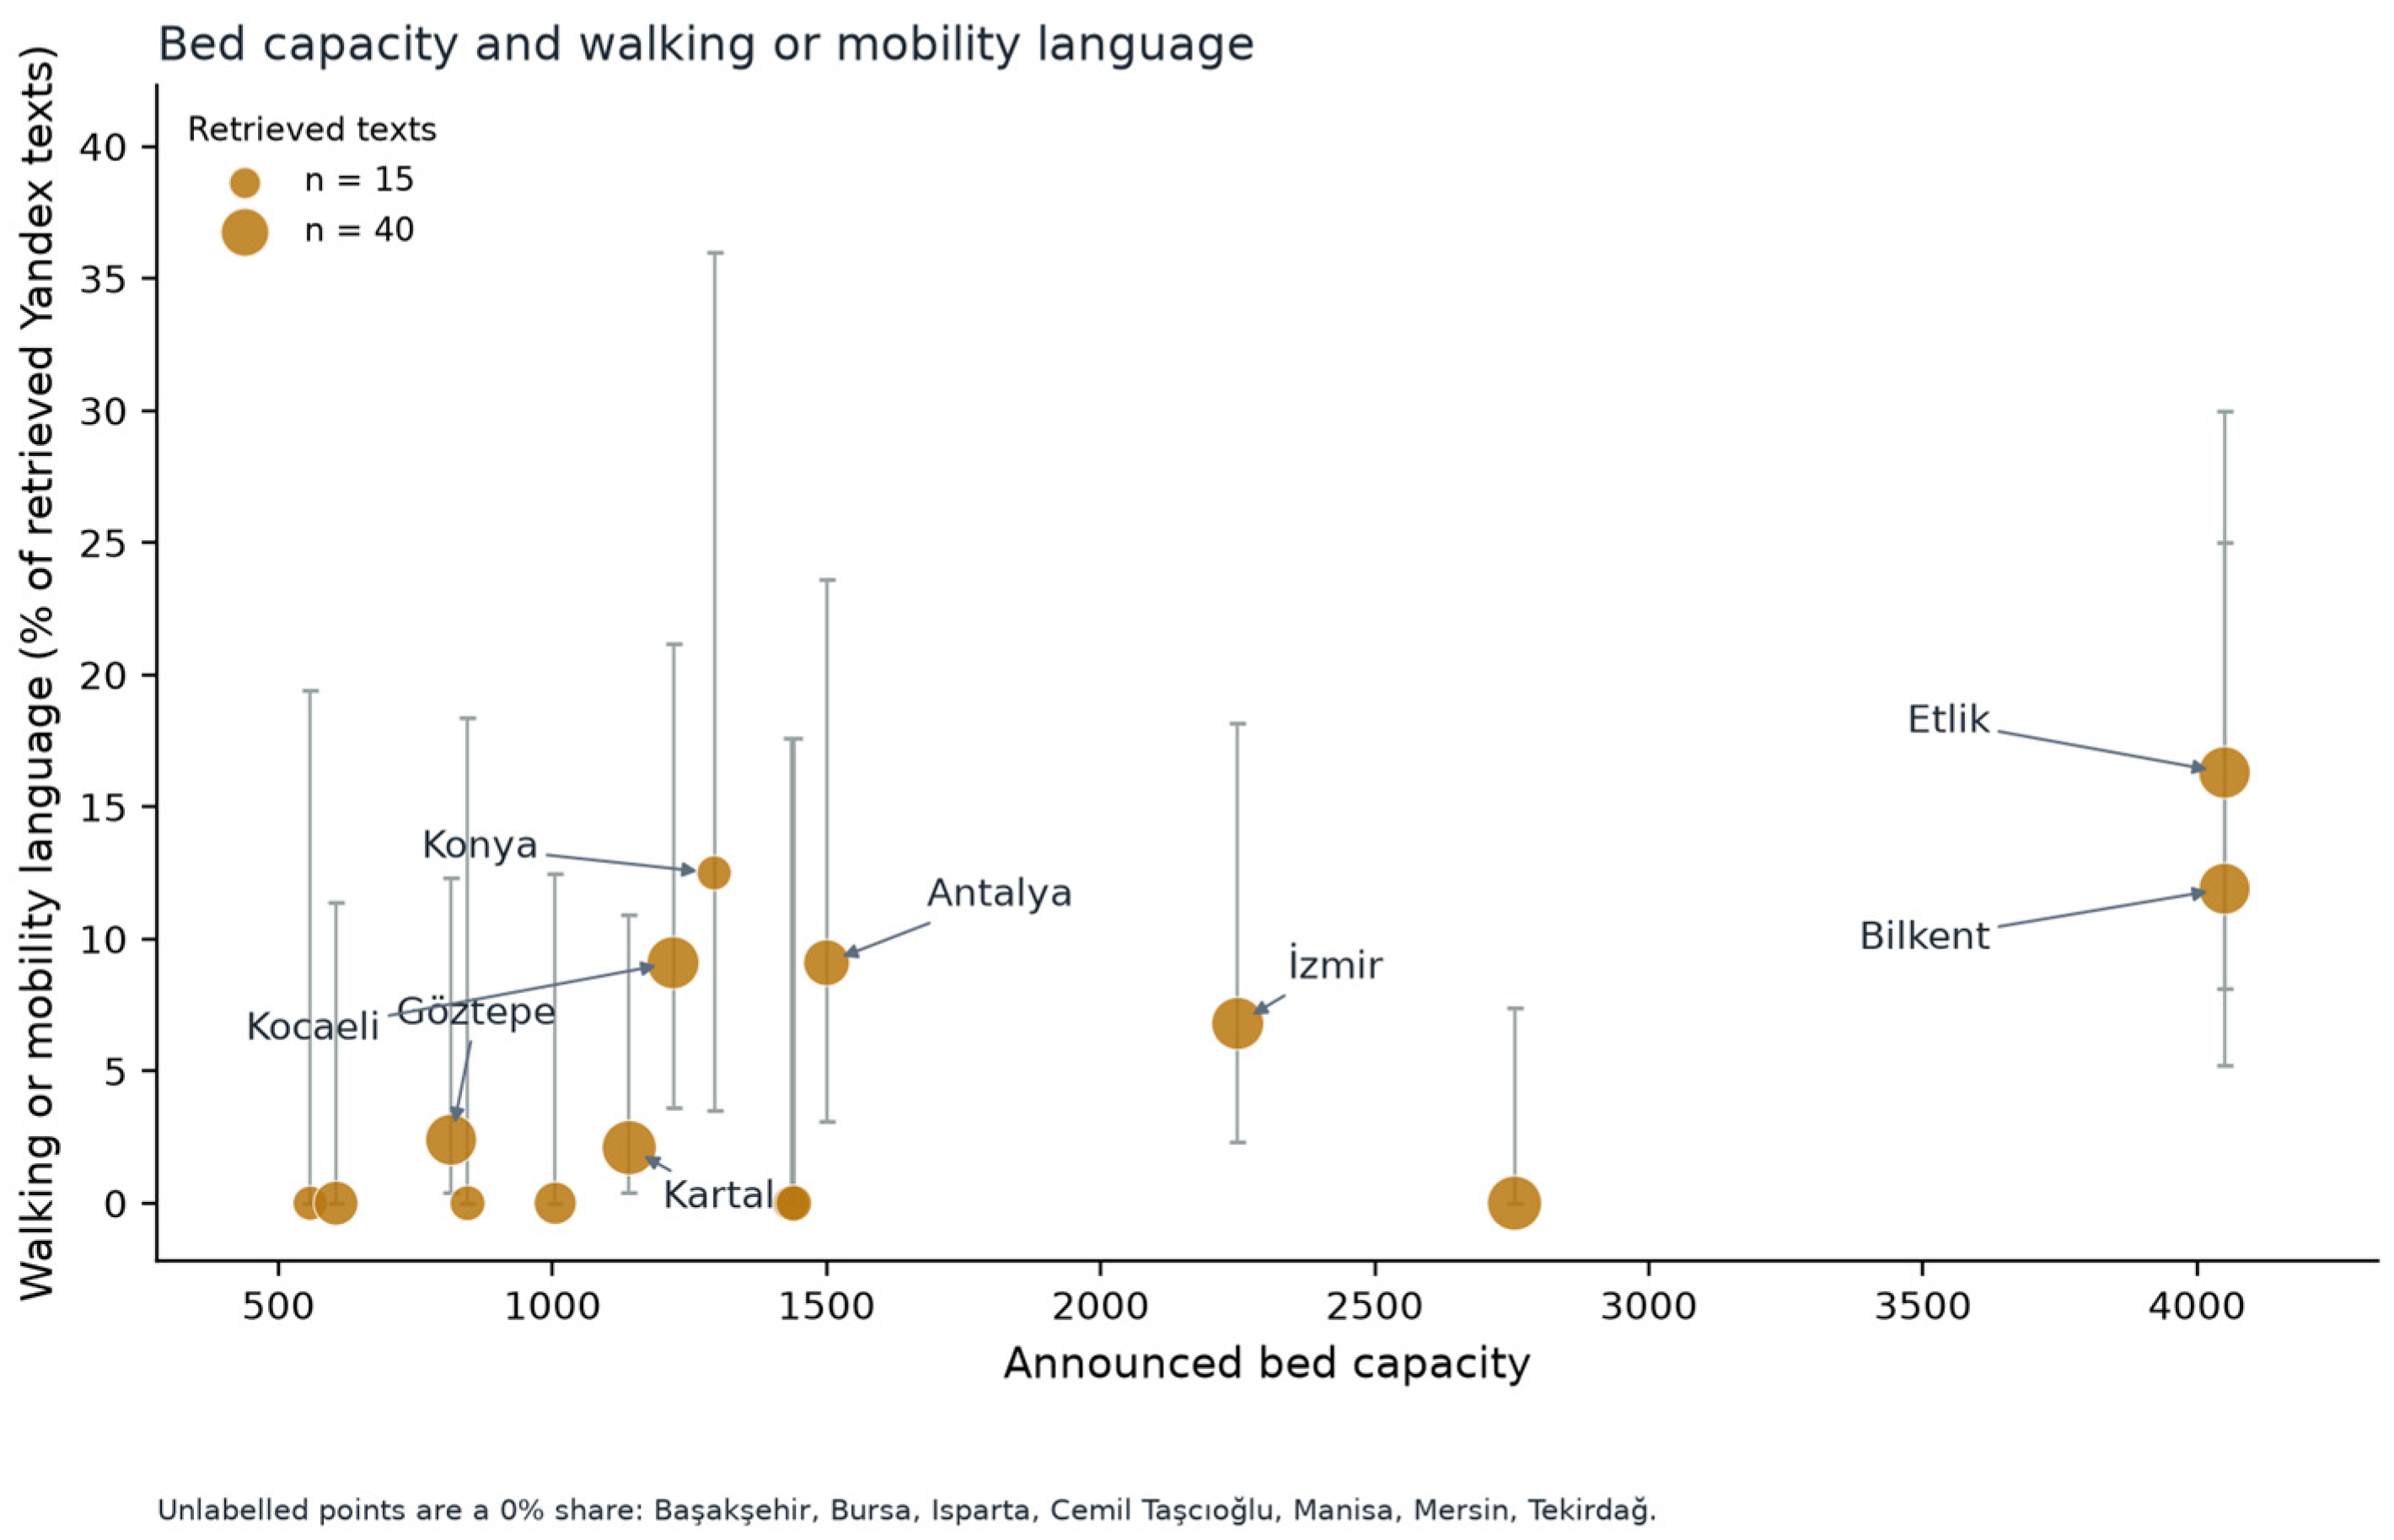

Disclaimer/Publisher’s Note: The statements, opinions and data contained in all publications are solely those of the individual author(s) and contributor(s) and not of MDPI and/or the editor(s). MDPI and/or the editor(s) disclaim responsibility for any injury to people or property resulting from any ideas, methods, instructions or products referred to in the content. |
© 2026 by the authors. Licensee MDPI, Basel, Switzerland. This article is an open access article distributed under the terms and conditions of the Creative Commons Attribution (CC BY) license.