


Abstract
Particle accumulation increases the pressure drop and reduces the long-term performance of micro-electrostatic precipitators (MESPs). This study quantifies wet-spray regeneration responses for a single MESP geometry intended for residential ventilation. The effects of spray pressure, spray angle, nozzle-to-module distance, and washing duration were evaluated using single-factor and orthogonal experiments. Increasing the spray pressure from 0.1 to 0.3 MPa decreased the post-cleaning pressure drop from 38.5 to 16.5 Pa and increased the pressure recovery rate from 54.9% to 95.3%, while further increases produced diminishing benefits. The operating ranges identified for nozzle-to-module distance and washing duration were 50–100 mm and 20–30 s, respectively. Within the selected factor levels, the factor order was nozzle-to-module distance > spray pressure > washing duration > spray angle. The preferred parameter combination identified by orthogonal range analysis was 0.4 MPa, 30°, 50 mm, and 30 s, based on the factor-level means. This combination requires confirmation using the same module and dust-loading conditions. The numerical comparison gave a relative deviation of 5.5% at 0.3 MPa and provided flow-field context for the parameter trends. The findings link the four spray parameters to residual airflow resistance and post-cleaning particle-collection efficiency, providing operating data for residential MESP regeneration.
1. Introduction
Residential ventilation must provide outdoor air while limiting the entry and persistence of particulate pollutants in occupied spaces. Measurements in a modern house have shown that particle reduction depends on both filter efficiency and whether filtration is applied to supply air or recirculated indoor air [1]. Filtration performance in homes also depends on the resistance imposed on the ventilation system. In year-long monitoring of ten residential systems, Walker et al. found that filter loading affected airflow and blower power differently for different motor types [2]. These findings make sustained particle removal at an acceptable pressure drop an important objective for residential ventilation.
Micro-electrostatic precipitators (MESPs) are relevant to this objective because electrostatic collection offers an alternative to relying solely on dense fibrous media. Reviews of electrostatic particle removal describe the use of electric charging and collection for fine-particle control [3,4]. Studies of compact electrostatic filters have examined the balance between collection efficiency and aerodynamic resistance [5,6]. Recent work on dielectric-coated ESPs has further examined collection efficiency, pressure drop, and ozone generation under indoor-ventilation operating conditions [7], while work on ionic wind has considered the associated internal airflow characteristics [8]. For residential ventilation, the value of these developments lies in the possibility of incorporating particle collection into a compact, low-resistance air-treatment module. Maintaining that performance during service is therefore as important as achieving favorable performance in the clean state.
Regeneration is central to maintaining the performance of a reusable MESP. Deposited particles can obstruct flow passages and change the condition of collecting surfaces, making performance recovery after dust loading a practical maintenance concern. Reviews of filter cleaning and regeneration cover both dry and wet approaches [9], and self-cleaning filter materials illustrate the wider interest in restoring air-cleaning performance during use [10]. In a residential unit, an effective regeneration procedure could reduce the need to remove the module for manual cleaning and help restore its airflow and collection characteristics. Pressure recovery and post-cleaning particle-collection efficiency therefore provide practical measures of the module’s return to ventilation service.
Reverse-air cleaning and compressed-air pulse-jet cleaning are already well-established technologies in industrial dust collection. The US Environmental Protection Agency identifies both as common methods for removing accumulated dust from fabric filters [11]. Experimental and numerical investigations have examined pulse pressure, cleaning duration, and cartridge response [12,13], while studies of filtration operation, surface treatment, and dust emissions have addressed the influence of the deposited layer and its release during cleaning [14,15]. Studies of nozzle settings and diffusion nozzles have also examined how nozzle configuration affects cleaning performance [16,17]. This industrial experience motivates adapting the cleaning-flow distribution to the geometry of a compact residential MESP.
The application question is, therefore, how to adapt established regeneration approaches to a compact residential ventilation module. Industrial filter cleaning and residential MESP regeneration share basic principles, but differ in airflow rate, mean duct air velocity, dust type, and duct dimensions. Industrial studies provide a background for parameter selection. Reverse-flow cleaning offers a useful reference for active dust removal, whereas wet spraying provides a distinct route in which liquid impingement and washing can carry detached material toward a collection point [9]. Recent wet-ESP research also used pulse-air-jet-assisted water flow for online dust-cake removal, reporting 1.2 L per tube during each 10 s hourly cleaning cycle [18]. For residential ventilation, wet regeneration aims to restore a reusable module within a controlled maintenance cycle. Water collection and drying must be compatible with subsequent electrostatic operation. These requirements motivate evaluation of wet regeneration under the geometry and operating conditions of the residential module.
Flow-field analysis can assist this adaptation by showing how a selected inlet or nozzle arrangement distributes the cleaning flow. Previous CFD work has examined flow distribution in pulse-jet fabric filters [19] and ventilation and wet dust removal in industrial equipment [20]. Impinging-jet experiments provide context for interpreting jet development near a target surface [21], while studies of electrostatic-fabric systems connect filtration behavior with the electrical and structural conditions of the collector [22,23]. For a residential MESP, these approaches help relate nozzle placement and operating conditions to flow access within confined passages. Combining such analysis with pressure-drop and collection measurements provides a basis for evaluating regeneration settings for the intended module.
Accordingly, this study evaluates wet-spray regeneration parameters for a dust-loaded MESP intended for residential ventilation. Single-factor and orthogonal experiments examine spray pressure, spray angle, nozzle-to-module distance, and washing duration using post-cleaning pressure drop, pressure recovery, and post-cleaning particle-collection efficiency as performance indicators. Numerical analysis is used to examine the associated flow distribution. The contribution is to quantify how these four spray settings affect residual airflow resistance and post-cleaning particle-collection efficiency. These relationships guide the selection of wet-regeneration settings for the investigated MESP geometry and loading conditions.
2. Experimental System Design and Performance Evaluation
2.1. Experimental Platform and Dust Removal Procedure
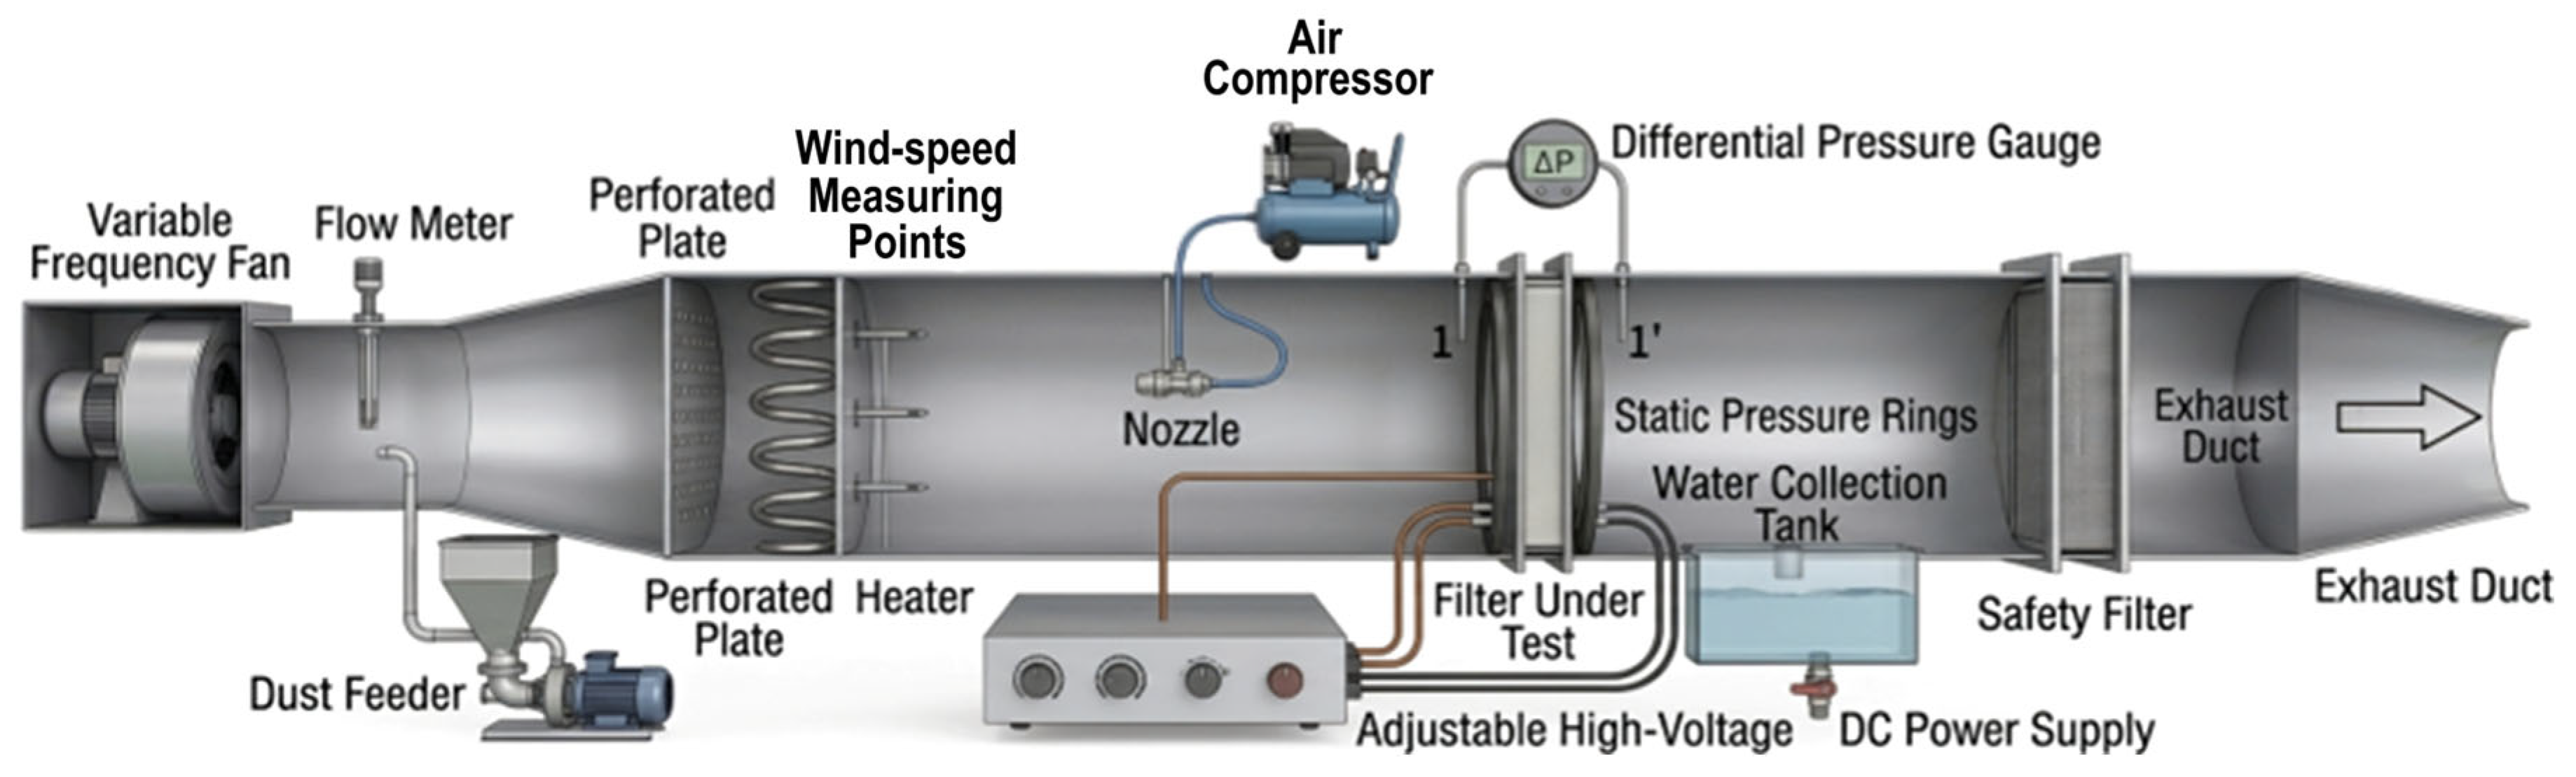
Wet-spray regeneration experiments were conducted using a self-developed test platform for micro-electrostatic precipitator (MESP) modules intended for residential ventilation systems. The platform was designed to control dust loading, regenerate the module by wet spraying, drain and dry the module after washing, and evaluate the recovery of its aerodynamic and particle-removal performance. As shown in Figure 1, the system consisted of an airflow-supply section, a dust-feeding section, an MESP test section, a wet-spray unit, a drainage and water-collection unit, a hot-air drying unit, and pressure and particle-concentration measurement devices.
Figure 1.
Schematic of the wet-spray regeneration experimental platform.
The airflow-supply section used a variable-frequency centrifugal fan to provide a stable and adjustable flow through the duct. The airflow rate was maintained at 300 m3 h−1 during dust loading and performance evaluation. The main test duct was fabricated from transparent acrylic and had a cross-section of 480 mm × 100 mm. A perforated flow-straightening plate was installed upstream of the test section to reduce swirl and improve inlet-flow uniformity. Static-pressure measurement rings were arranged immediately upstream and downstream of the MESP module, and the corresponding pressure difference was measured using a differential-pressure transmitter.
Before each loading run, the initial stabilized pressure drop of the clean MESP module was checked at the controlled airflow rate of 300 m3 h−1. ISO 12103-1 [24] A2 test dust was then introduced upstream using the dust-feeding system, with the MESP energized at 10 kV. Dust feeding was stopped when the module pressure drop reached three times its initial stabilized value. The module was then isolated from the high-voltage power supply before wet regeneration.
The wet-spray unit comprised a water-supply device, an air compressor, a flat-fan spray nozzle (model 1/8 6501), pressure-control valves, and connecting pipelines. The nozzle had a product-specified nominal spray angle of 65°. Water spray was directed toward the upstream surface of the dust-loaded MESP, and covered the entire module. Spray pressure, spray angle, nozzle-to-module distance, and washing duration were varied, as described in Section 3. The high-voltage power supply remained switched off throughout spraying and drainage.
After washing, the liquid containing detached dust was collected in the drainage tank. The module was initially dried using hot-air circulation for 10 min and was subsequently conditioned before re-energization. A total interval of 2 h was maintained between successive experimental groups to minimize the influence of residual moisture and temperature variation.
2.2. Experimental Instruments and Uncertainty Analysis
Measurement results and uncertainty components are reported separately, following JCGM 100:2008 and NIST TN 1297 [25,26]. Each tested condition was evaluated in one MESP dust-loading–regeneration run, and the reported result is the mean of three stable technical readings taken within that run. Equation (1) defines the mean and the Type A standard uncertainty of the mean for uncorrelated readings.
Equation (2) gives the conversion of instrument accuracy limits and digital resolution under rectangular distributions, together with the definitions of combined and expanded uncertainty for a coverage factor of 2.
For a derived quantity, uncertainty propagation includes input variances and covariances, as expressed in Equation (3). Here, ci denotes the sensitivity coefficient for input xi, and u(xi, xj) denotes the covariance between two inputs. For post-cleaning particle-collection efficiency, N1 and N2 denote the upstream and downstream concentrations, respectively; Equation (4) gives the propagation relation for independent concentration measurements.
The pressure transmitter in Table 1 has a measurement range of 0–1000 Pa and an accuracy specification of 0.5% of full scale, corresponding to a pressure-error bound of ±5 Pa. Treating this bound as rectangular gives the Type B standard uncertainty component in Equation (5).
The value in Equation (5) is the pressure transmitter’s Type B standard uncertainty. The representative post-cleaning results are (16.5 ± 1.5) Pa and (91.8 ± 0.5)%, with an airflow velocity of 1.74 m s−1. The ± values and error bars describe fluctuations in the three stable technical readings within one run. These readings are not treated as independent experimental replicates or used to establish statistical significance between conditions. Pressure-recovery uncertainty requires the joint budget for the clean, dust-loaded, and regenerated module pressures, including their covariance.
Table 1.
Main experimental apparatus and measurement instruments.
2.3. Performance Evaluation Metrics
Wet-spray regeneration performance was quantified using post-cleaning particle-collection efficiency, pressure recovery rate, and post-cleaning pressure drop. These indicators describe the regenerated module’s air-cleaning performance and aerodynamic resistance.
- (1)
- Post-cleaning particle-collection efficiency
Post-cleaning particle-collection efficiency, η, is determined from the upstream and downstream airborne particle concentrations after washing, drying, and re-energizing the MESP under the same operating conditions. This metric is presented in the figures in Section 3.3.1, Section 3.3.2, Section 3.3.3, Section 3.3.4 and Section 4.5 and calculated using Equation (6):
where Nin and Nout are the upstream and downstream airborne-particle mass concentrations (mg m−3), respectively, for the same particle-size channel. This concentration-based efficiency describes particle collection after regeneration, whereas deposited-dust removal is a separate mass-based measure.
- (2)
- Pressure Recovery Rate
The pressure recovery rate represents the proportion of the dust-loading-induced resistance that is removed by wet regeneration. A value of 0% indicates that the additional resistance caused by dust loading remains unchanged, whereas 100% indicates that the module has returned to its initial clean-state resistance. The pressure recovery rate was calculated using Equation (7):
where ΔP0 is the pressure drop of the dust-loaded module immediately before regeneration, ΔP1 is the pressure drop measured after washing and drying, and ΔPmin is the initial stabilized pressure drop of the clean module before dust loading. All three pressure drops refer to the same module measurement positions at the controlled airflow rate.
- (3)
- Post-Cleaning Pressure Drop
The post-cleaning pressure drop, denoted by ΔP, represents the residual airflow resistance of the module after wet-spray regeneration and subsequent drying. A lower value indicates more complete reopening of the internal flow passages. Unlike the dimensionless pressure recovery rate, this parameter directly describes the aerodynamic resistance under the actual post-regeneration operating condition.
2.4. Experimental Procedure and Operating Conditions
The experimental procedure comprised dust loading, wet-spray regeneration, and post-cleaning performance evaluation. Test dust was supplied until the module pressure drop reached three times its initial stabilized value, as specified in Section 2.1. This common relative pressure-drop criterion was used to control the initial dust-loading condition for the regeneration comparisons and reduce loading-related differences between conditions. The module was then isolated from the high-voltage supply before washing. Spray pressure, spray angle θ (30°, 45°, and 60°), nozzle-to-module distance, and washing duration were varied, as described in Section 3. After drainage and drying, the module was re-energized and evaluated at the controlled airflow rate. The upstream and downstream particle concentrations were used to calculate post-cleaning particle-collection efficiency, while the measured pressure drops were used to calculate pressure recovery.
The 1/8 6501 nozzle had an equivalent orifice diameter d = 0.66 mm and a product-specified liquid-flow range Q = 0.23–1.3 L min−1. Air consumption, droplet-size distribution, and quantitative wetting-coverage data were not specified in the available product information. Using the equivalent circular orifice area, the nominal mean liquid-exit velocity over the stated flow range was estimated as follows:
3. Experimental Design
3.1. Experimental Objectives and Controlled Conditions
The experimental objective was to compare wet-spray regeneration settings for the tested MESP under controlled conditions. Spray pressure, spray angle, nozzle-to-module distance, and washing duration were selected to assess changes in pressure recovery and post-cleaning particle-collection efficiency. A single dust-loading–regeneration run was conducted for each condition, with the mean of three stable technical readings used for analysis.
To ensure experimental comparability, the baseline operating conditions were standardized as follows: airflow rate of 300 m3 h−1, ISO 12103-1 A2 standard fine dust at a dust-feed concentration of 100 mg m−3 during loading, applied voltage of 10 kV, ambient temperature of 25 ± 1 °C, and relative humidity of 50% ± 2%. The same pressure-ratio loading criterion specified in Section 2.1 was applied to each tested condition. Deposited dust mass was not weighed separately in these experiments. Pressure recovery rate and post-cleaning particle-collection efficiency were selected as the evaluation metrics.
The following quality-control procedures were used. Before each experimental run, the system was warmed up and its baseline was checked for at least 30 min. A 2 h cooling and conditioning interval was maintained between consecutive experimental groups. Hot-air drying and subsequent conditioning, as described in Section 2.1, were used to reduce residual-moisture effects on subsequent electrical and pressure-drop measurements.
3.2. Selection of Experimental Variables and Range Settings
Based on preliminary tests and the geometric constraints of the experimental duct, spray pressure (P), spray angle (θ), nozzle-to-module distance (D), and washing duration (T) were selected as the primary operating variables.
Spray pressure can affect the atomization state and impact momentum of the droplets. The spray angle can influence the balance between local impact intensity and effective coverage of the MESP cross-section. The nozzle-to-module distance influences both spray expansion and momentum attenuation before the droplets reach the collecting surfaces. Washing duration determines the cumulative wetting and flushing action. The selected ranges are summarized in Table 2.
Table 2.
Experimental variables and operating ranges for wet-spray regeneration.
Single-factor experiments were first conducted by varying one parameter while maintaining the remaining parameters at their baseline values. The operating conditions and drying procedure followed Section 3.1 and Section 2.1, respectively.
3.3. Experimental Results and Analysis
3.3.1. Effect of Spray Pressure on Regeneration Performance
The effect of spray pressure was investigated over the range of 0.1–0.5 MPa at a fixed spray angle of 45°, nozzle-to-module distance of 100 mm, and washing duration of 20 s. The resulting post-cleaning pressure drop, pressure recovery rate, and post-cleaning particle-collection efficiency are presented in Figure 2.
Figure 2.
Effect of spray pressure on wet-regeneration performance. Values are means of three stable technical readings within one run per condition; error bars represent within-run reading fluctuations.
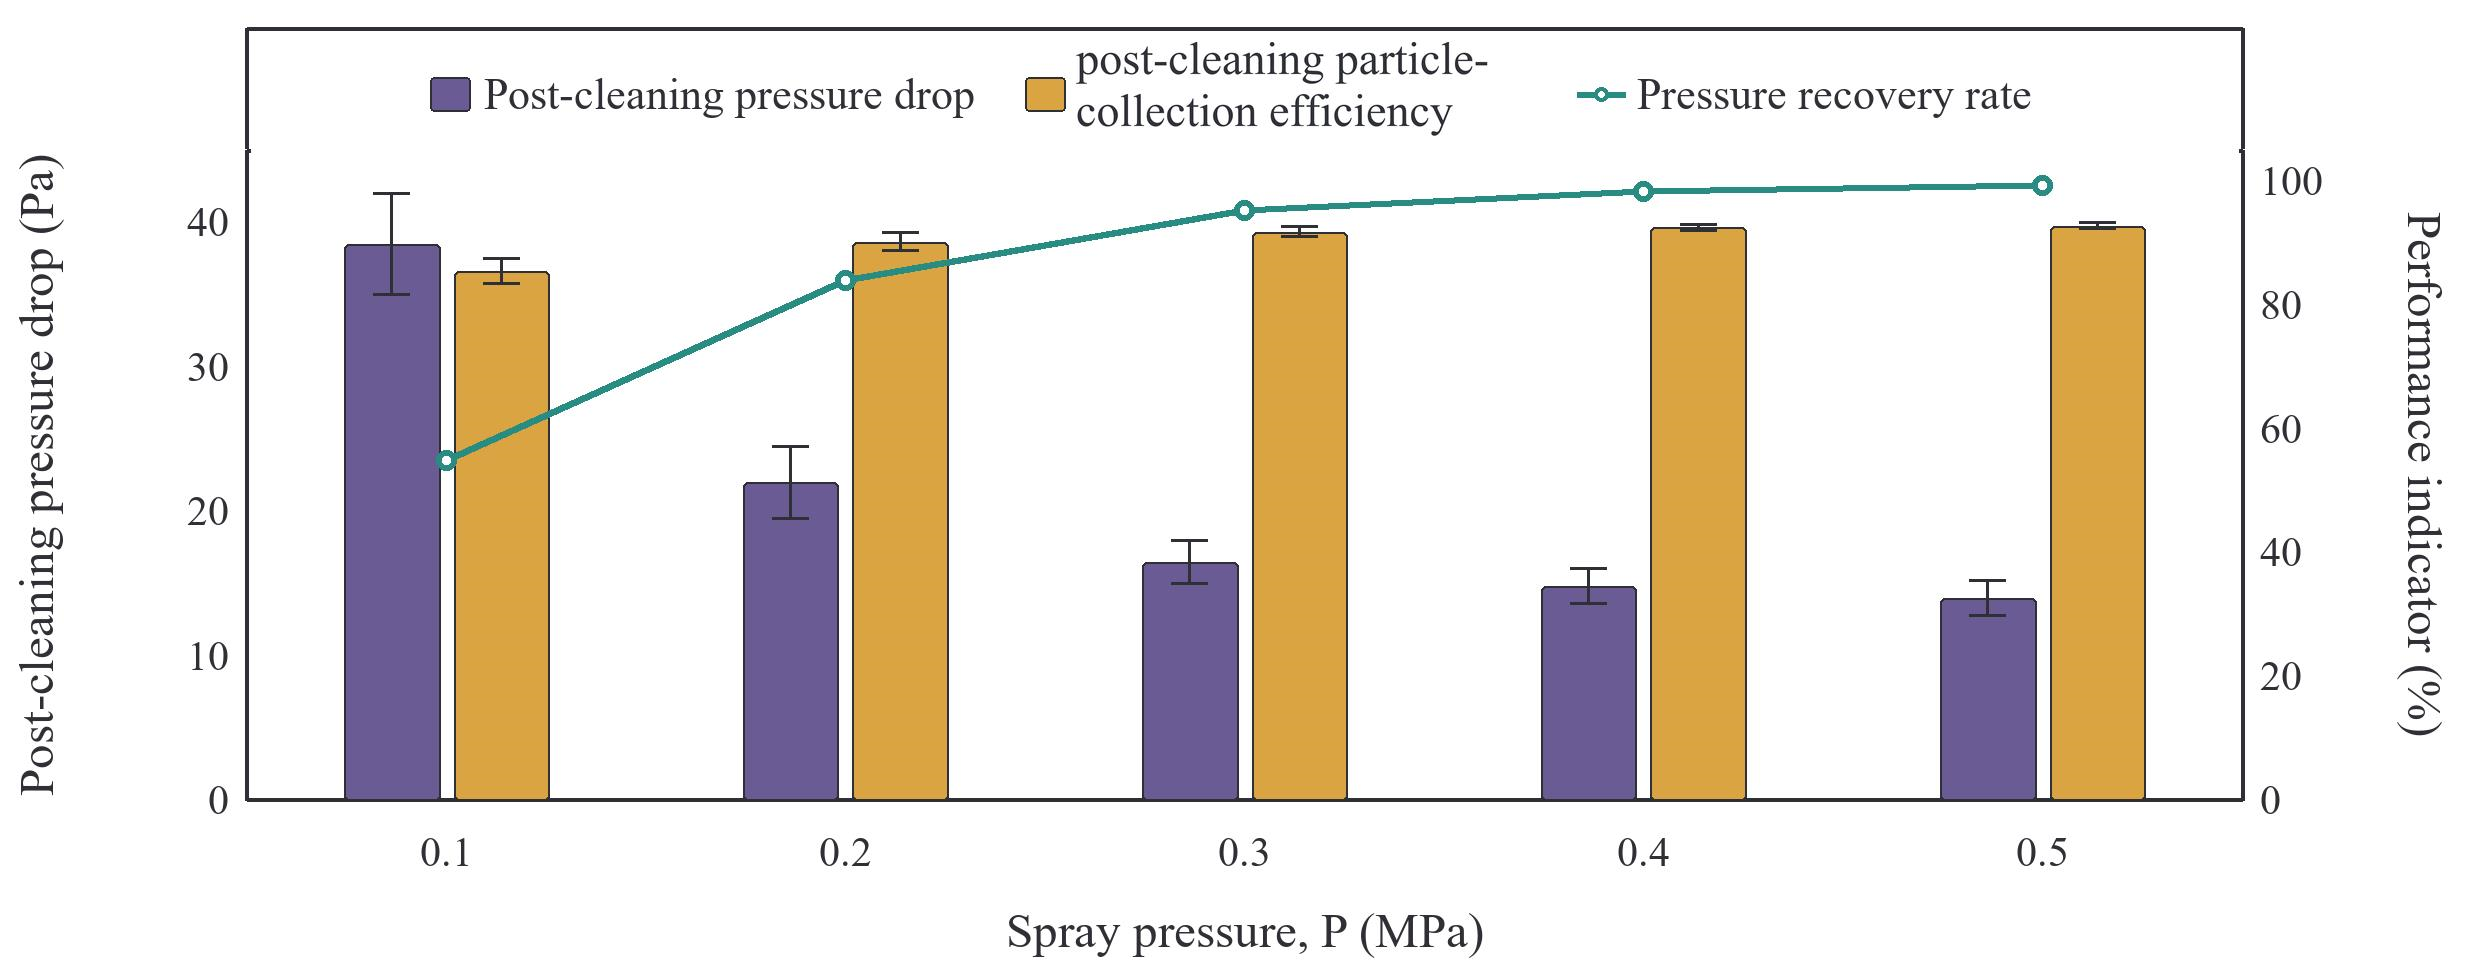
Increasing the spray pressure markedly improved the recovery of the dust-loaded MESP module. When the pressure increased from 0.1 to 0.5 MPa, the post-cleaning pressure drop decreased from 38.5 ± 3.5 Pa to 14.0 ± 1.2 Pa, while the pressure recovery rate increased from 54.9% to 99.2%. The post-cleaning particle-collection efficiency also increased, from 85.5 ± 2.0% to 92.8 ± 0.5%. These results show substantial changes in post-cleaning resistance and particle collection across the tested pressure range.
The improvement was most pronounced between 0.1 and 0.3 MPa. The response is consistent with improved spray delivery, droplet impact, and liquid-assisted removal. Over this pressure interval, the post-cleaning pressure drop decreased rapidly from 38.5 Pa at 0.1 MPa to 16.5 Pa at 0.3 MPa, and the corresponding pressure recovery rate increased to 95.3%.
When the pressure was increased further, from 0.3 to 0.5 MPa, the reported means continued to improve, but the incremental benefit became substantially smaller. A lower incremental response is compatible with diminishing removal of the deposits accessible to the spray. Increasing the pressure from 0.3 to 0.5 MPa yielded only a 2.5 Pa additional reduction in post-cleaning pressure drop and a 1.0 percentage-point increase in post-cleaning particle-collection efficiency.
The pressure-related indicators were more sensitive to spray pressure than the post-cleaning particle-collection efficiency. The different responses indicate that pressure recovery and post-cleaning particle-collection efficiency describe different aspects of the regenerated module. The measured performance trend supports a spray-pressure operating range of 0.3–0.4 MPa.
3.3.2. Effect of Spray Angle on Regeneration Performance
The effect of spray angle was evaluated at 30°, 45°, and 60°, while the spray pressure, nozzle-to-module distance, and washing duration were fixed at 0.3 MPa, 100 mm, and 20 s, respectively. The results are shown in Figure 3.
Figure 3.
Effect of spray angle on wet-regeneration performance. Values are means of three stable technical readings within one run per condition; error bars represent within-run reading fluctuations.
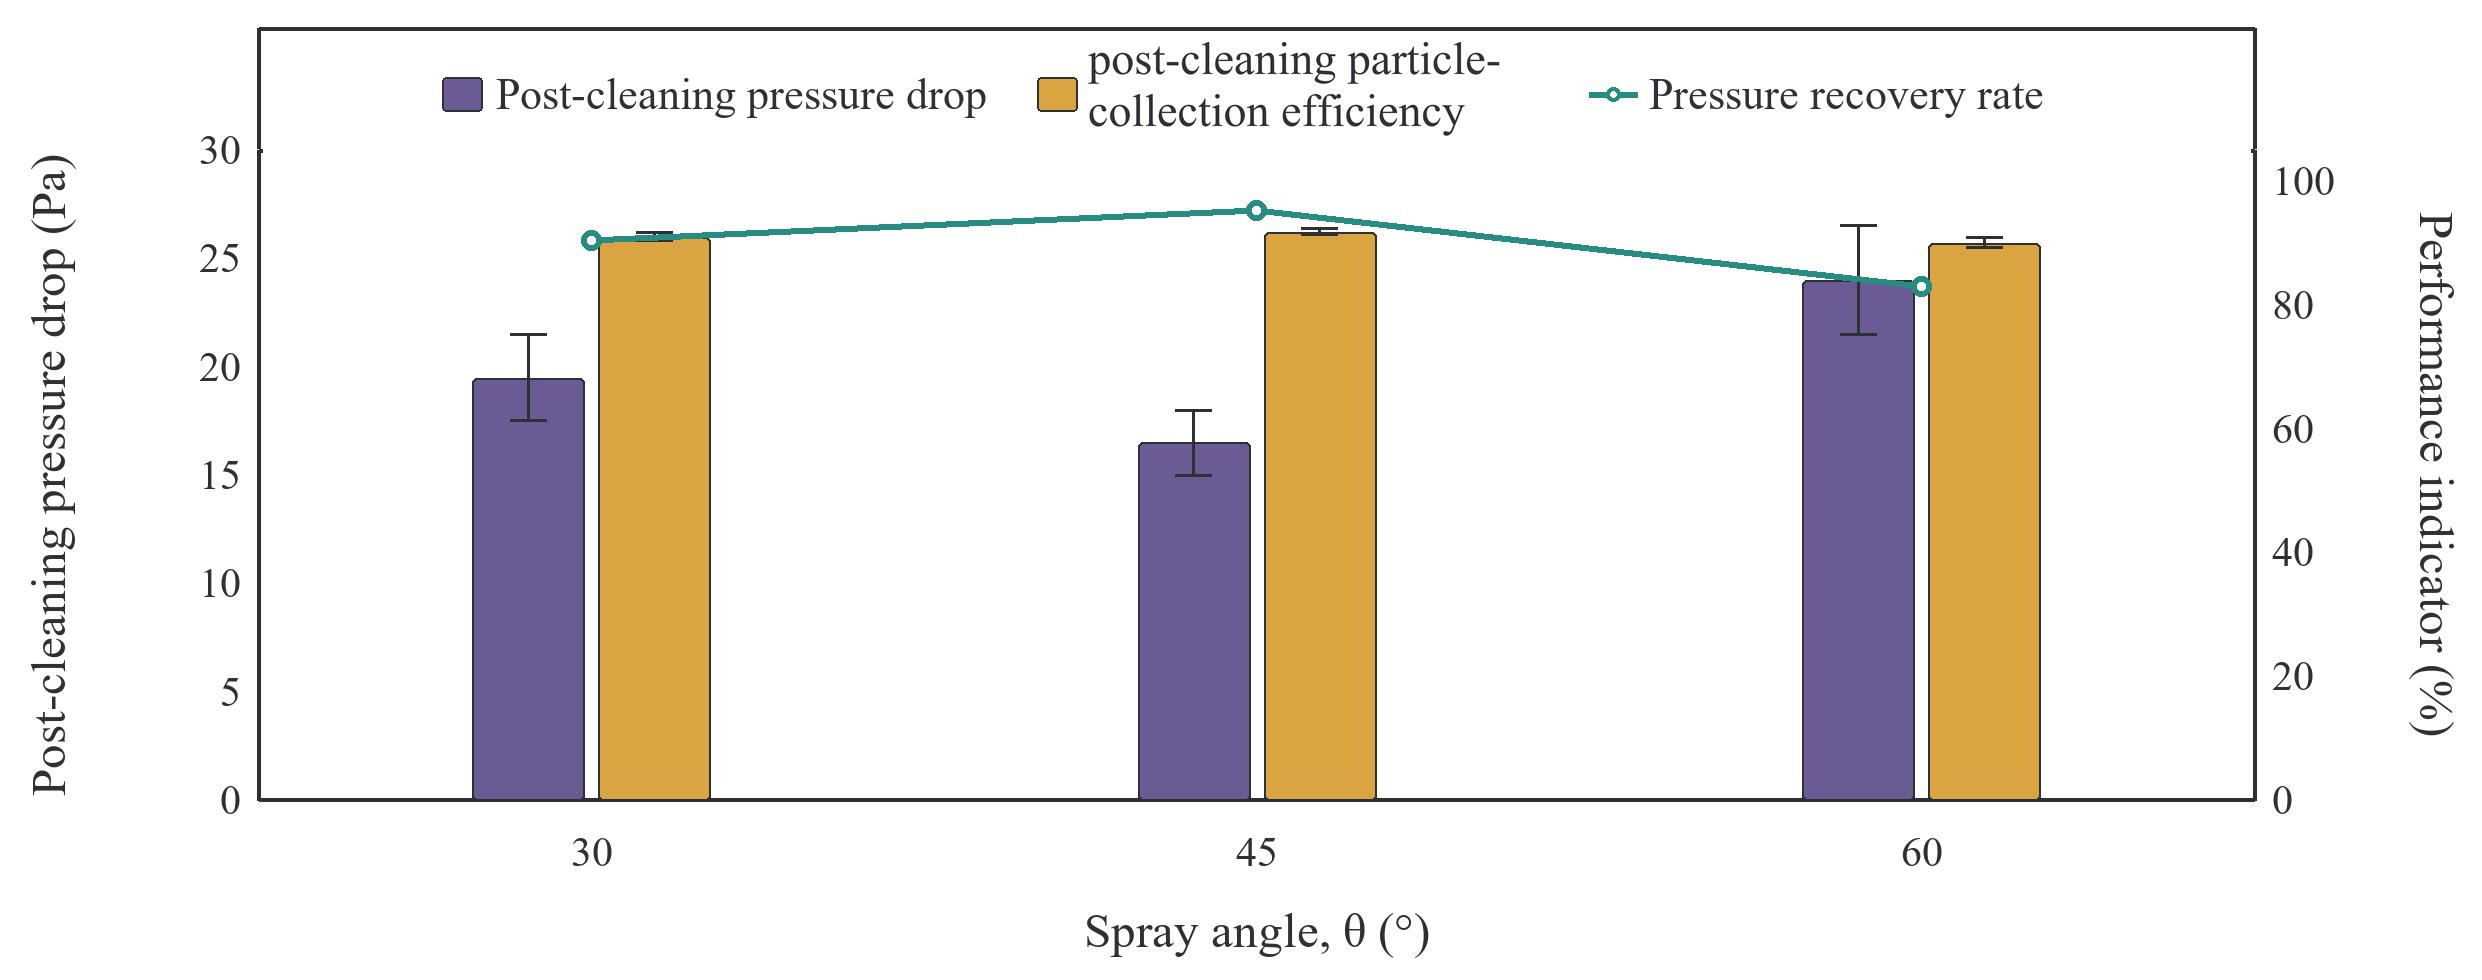
The regeneration performance exhibited a non-monotonic dependence on spray angle. At 30°, the post-cleaning pressure drop was 19.5 ± 2.0 Pa, the pressure recovery rate was 90.4%, and the post-cleaning particle-collection efficiency was 91.0 ± 0.6%. Increasing the angle to 45° reduced the post-cleaning pressure drop to 16.5 ± 1.5 Pa and increased the pressure recovery rate and post-cleaning particle-collection efficiency to 95.3% and 91.8 ± 0.5%, respectively. At 60°, however, the post-cleaning pressure drop increased to 24.0 ± 2.5 Pa, while the pressure recovery rate and post-cleaning particle-collection efficiency decreased to 82.9% and 90.0 ± 0.8%.
At 0.3 MPa, 100 mm, and 20 s, a spray angle of 45° gave the lowest measured mean post-cleaning pressure drop in the single-factor series. This response is consistent with a balance between spray coverage and local impact.
3.3.3. Effect of Nozzle-to-Module Distance on Regeneration Performance
The nozzle-to-module distance was varied from 50 to 200 mm at a spray pressure of 0.3 MPa, a spray angle of 45°, and a washing duration of 20 s. The measured performance indicators are presented in Figure 4.
Figure 4.
Effect of nozzle-to-module distance on wet-regeneration performance. Values are means of three stable technical readings within one run per condition; error bars represent within-run reading fluctuations.
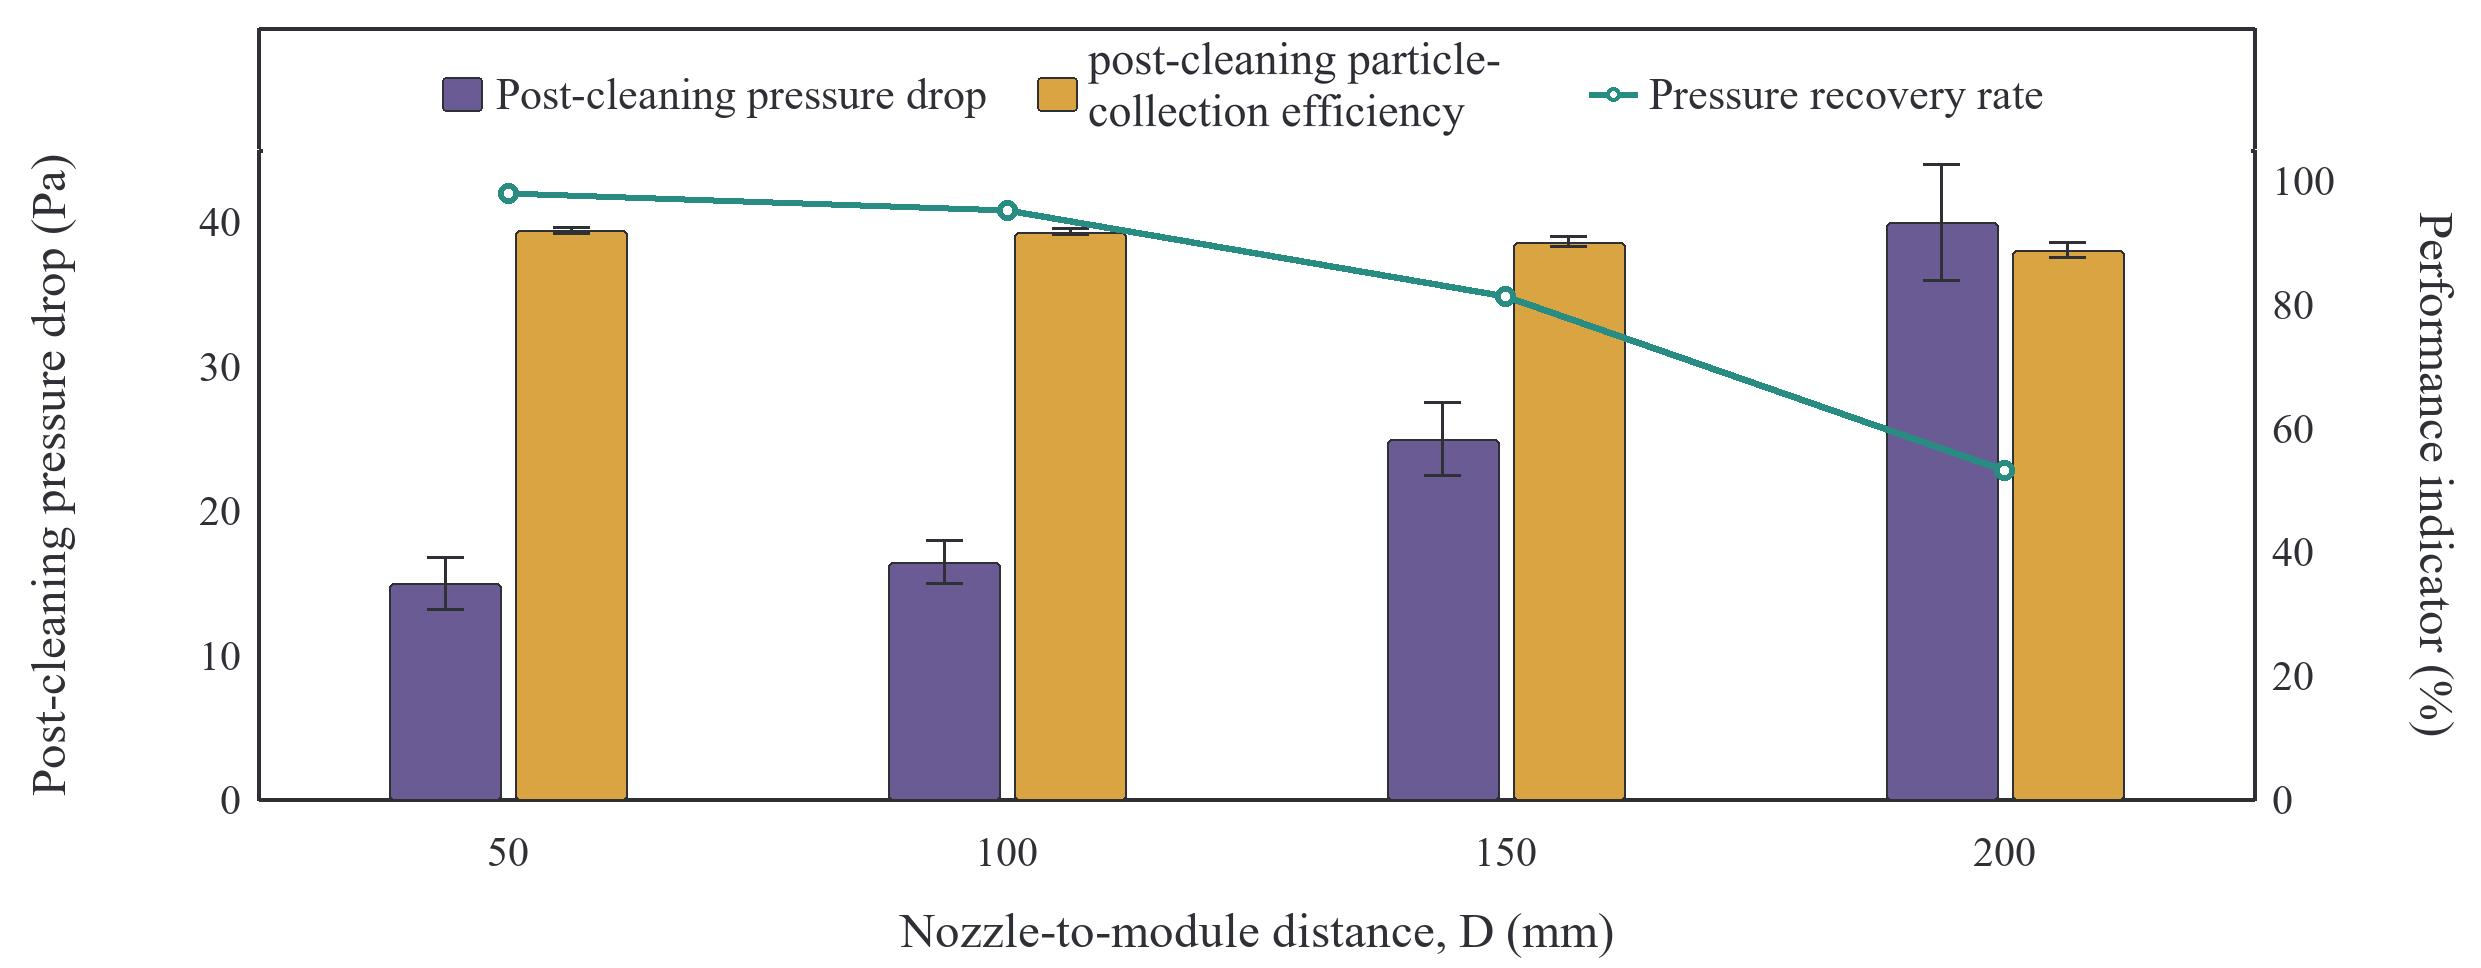
The distance had a strong negative effect on regeneration performance. When the distance increased from 50 to 200 mm, the post-cleaning pressure drop increased from 15.0 ± 1.8 Pa to 40.0 ± 4.0 Pa. Over the same range, the pressure recovery rate decreased from 97.9% to 53.2%, and the post-cleaning particle-collection efficiency decreased from 92.0 ± 0.5% to 88.8 ± 1.2%. The magnitude of these changes identifies distance as a sensitive parameter over the tested range for this module.
At distances of 50–100 mm, the post-cleaning pressure drops were relatively low, and the performance difference was small.
At 150–200 mm, pressure recovery was lower than at the shorter distances, while the change in post-cleaning particle-collection efficiency was comparatively smaller. Spray expansion and changes in local impact may contribute to the distance response.
The mean pressure recovery was 97.9% at 50 mm and 95.3% at 100 mm, a difference of 2.6 percentage points. Both distances produced low residual pressure drops. The interval of 50–100 mm is therefore retained for the tested nozzle and module arrangement.
3.3.4. Effect of Washing Duration on Regeneration Performance
The washing duration was varied from 5 to 60 s at a fixed spray pressure of 0.3 MPa, spray angle of 45°, and nozzle-to-module distance of 100 mm. Figure 5 shows the changes in post-cleaning pressure drop, pressure recovery rate, and post-cleaning particle-collection efficiency.
Figure 5.
Effect of washing duration on wet-regeneration performance. Values are means of three stable technical readings within one run per condition; error bars represent within-run reading fluctuations.
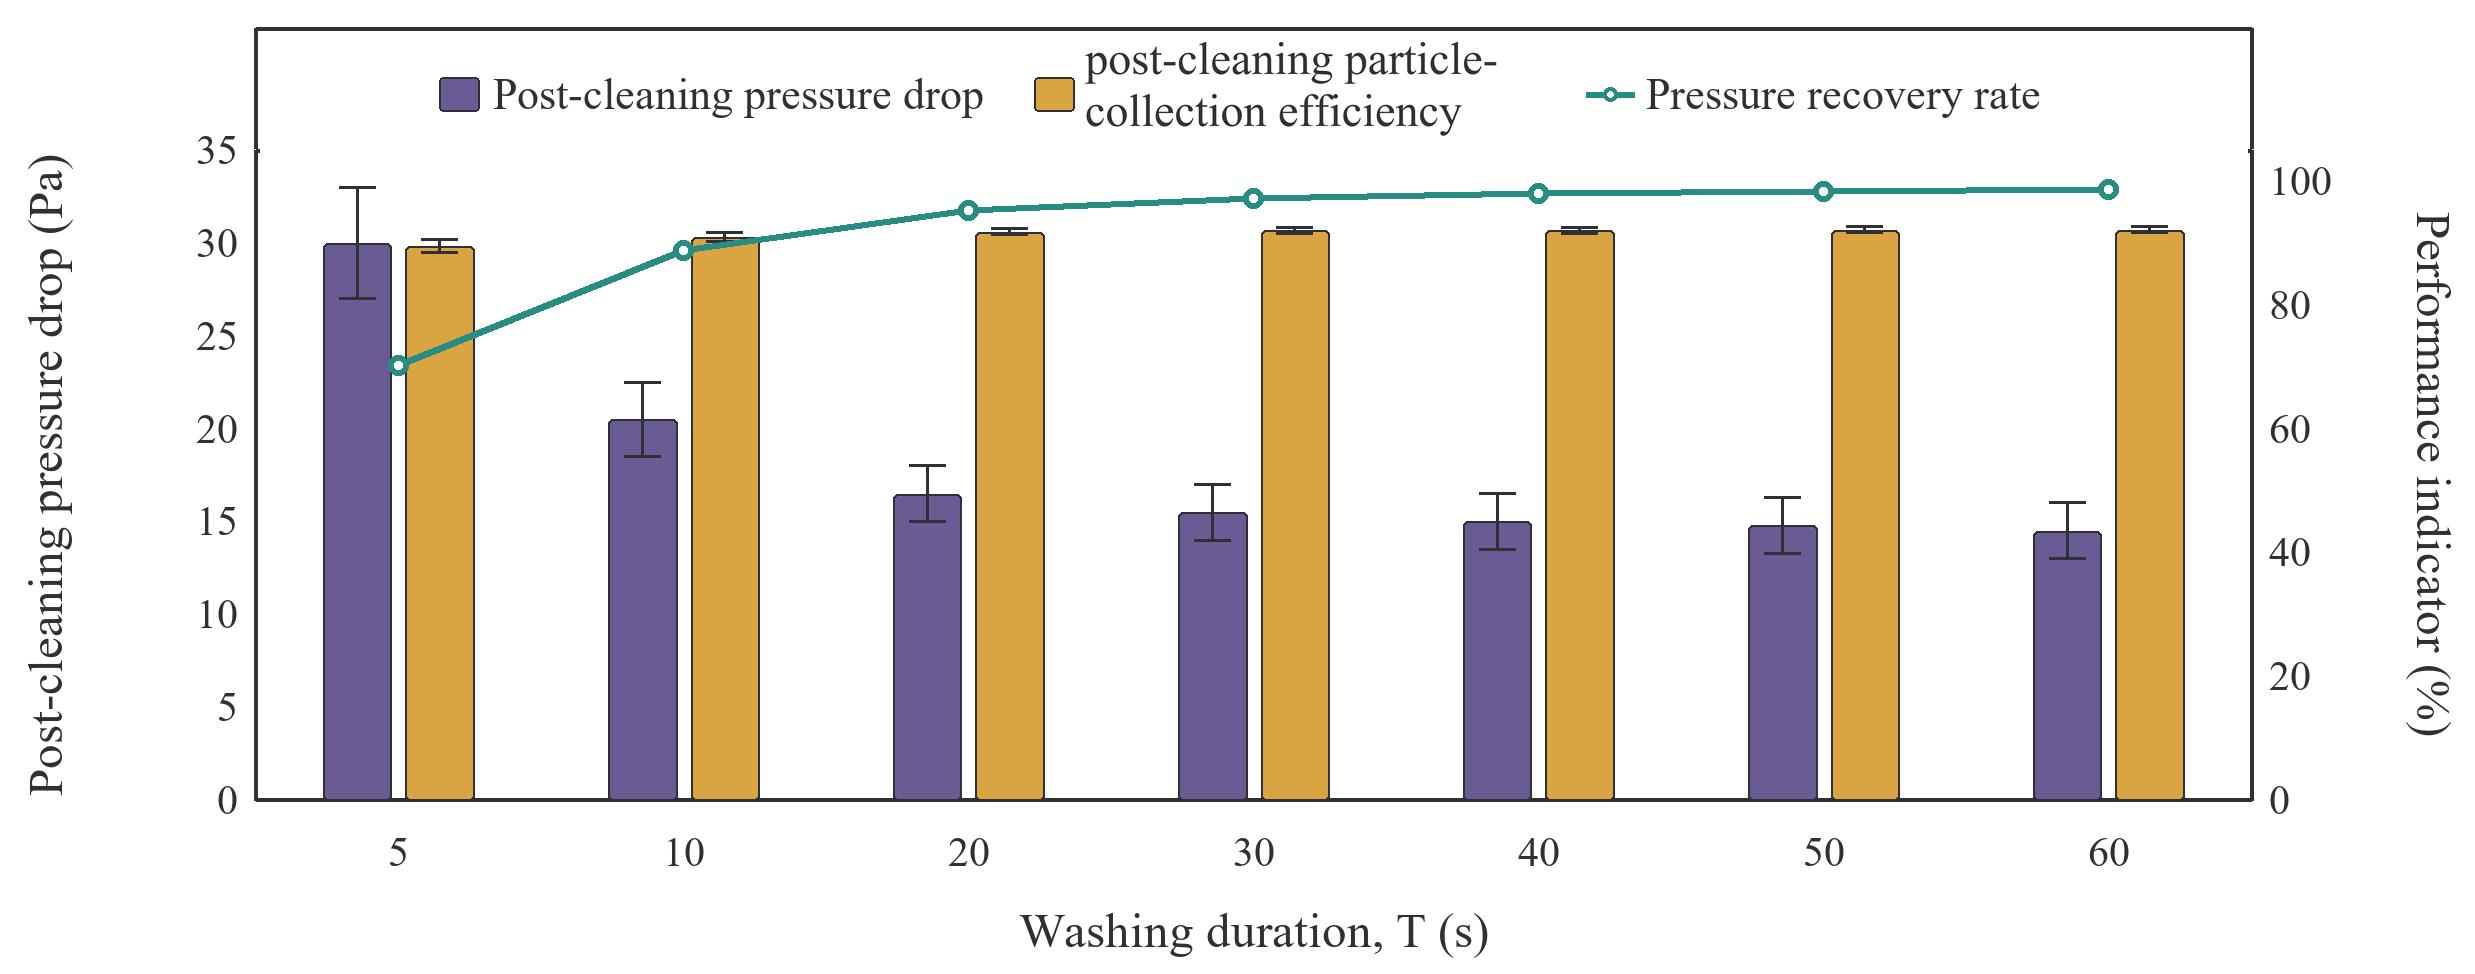
Extending the washing duration improved all three performance indicators, but the improvement was highly nonlinear. At 5 s, the post-cleaning pressure drop was 30.0 ± 3.0 Pa, the pressure recovery rate was 70.2%, and the post-cleaning particle-collection efficiency was 89.5 ± 1.0%. At 20 s, these values improved to 16.5 ± 1.5 Pa, 95.3%, and 91.8 ± 0.5%, respectively. Extending the duration to 60 s further reduced the pressure drop to 14.5 ± 1.5 Pa, but the post-cleaning particle-collection efficiency increased only to 92.1 ± 0.5%.
Between 5 and 20 s, the pressure recovery rate increased by 25.1 percentage points.
Beyond approximately 20–30 s, the measured responses changed little. Between 30 and 60 s, the post-cleaning pressure drop decreased by only 1.0 Pa and the post-cleaning particle-collection efficiency increased by only 0.1 percentage points. These results support the 20–30 s operating window.
Within the 20–30 s operating window, a 20 s cycle already achieved a pressure recovery rate above 95%, whereas 30 s gave a slightly lower mean post-cleaning pressure drop. Longer cycles gave smaller incremental improvements in this series.
3.4. Combined Parameter Evaluation by Orthogonal Design
An L9(34) orthogonal design was used to evaluate four factors at three levels, while limiting the experimental burden to nine combinations, as shown in Table 3. Post-cleaning pressure drop was selected as the response variable because it directly reflects the residual obstruction of the module and exhibited greater sensitivity to the operating variables than post-cleaning particle-collection efficiency.
Table 3.
Factors and levels used in the L9(34) orthogonal design.
The nine factor combinations and their post-cleaning pressure drops are listed in Table 4. Each level occurs three times for every factor, and each pair of levels occurs once for any two factors.
Table 4.
L9(34) orthogonal experimental combinations and measured post-cleaning pressure drops.
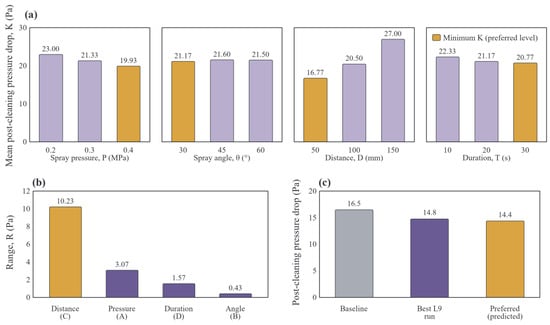
The factor-level means (K1–K3) and ranges calculated from the nine measured responses are summarized in Table 5 and illustrated in Figure 6. Because a lower post-cleaning pressure drop represents better regeneration, the preferred level of each factor corresponds to its minimum mean response.
Table 5.
Factor-level means and ranges calculated from the nine measured orthogonal-test responses.
Figure 6.
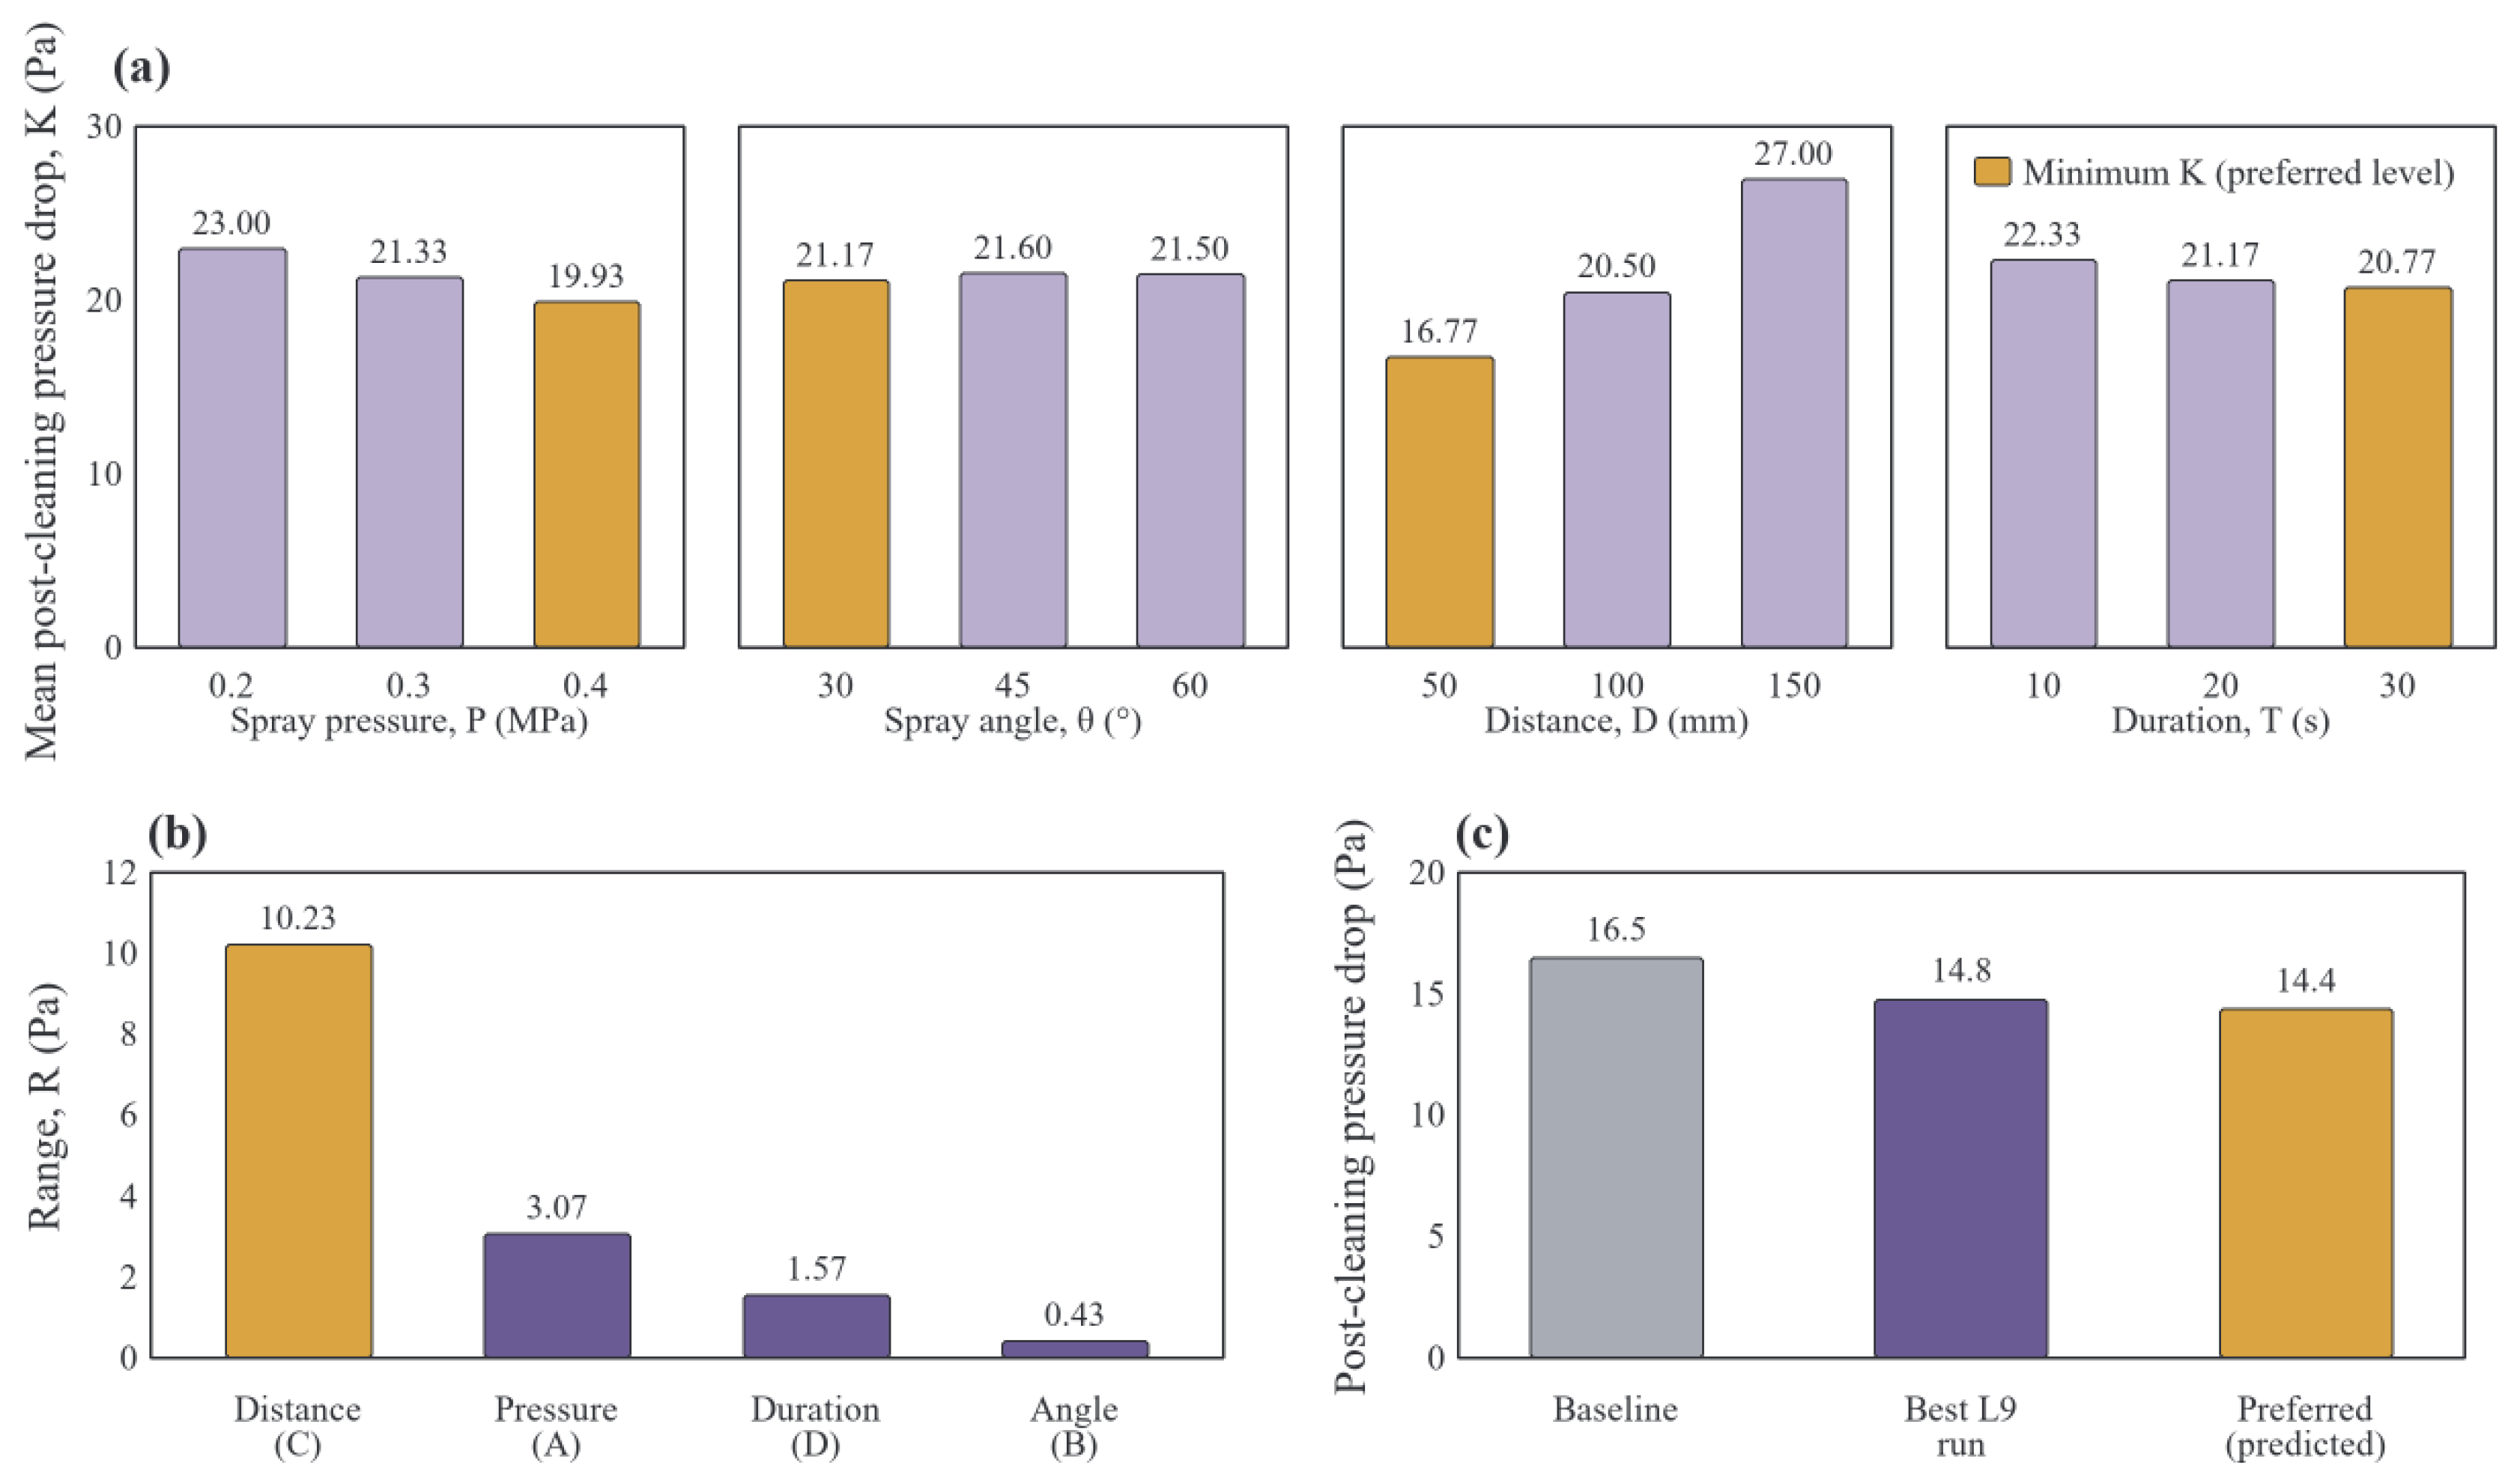
Combined parameter evaluation of wet-spray regeneration: (a) main-effect plots, (b) relative factor ranges, and (c) the measured baseline (16.5 Pa), measured Run 8 (14.8 Pa), and additive prediction for the preferred 30° combination (14.4 Pa).
The nozzle-to-module distance produced the largest range (R = 10.23 Pa), followed by spray pressure (R = 3.07 Pa), washing duration (R = 1.57 Pa), and spray angle (R = 0.43 Pa). The resulting order of influence was therefore C > A > D > B. This order describes the relative changes in level means over the selected factor intervals.
Run 8 (0.4 MPa, 45°, 50 mm, and 30 s) gave the lowest measured pressure drop among the nine orthogonal runs, at 14.8 Pa. The preferred parameter combination identified by orthogonal range analysis was A3B1C1D3 (0.4 MPa, 30°, 50 mm, and 30 s), selected from the minimum factor-level means. The orthogonal angle-level means average responses across different combinations of pressure, distance, and duration, whereas the single-factor series compares angles at a fixed baseline. These two angle selections do not establish interaction effects.
The 14.4 Pa value for the 30° combination in Figure 6c is an additive main-effect prediction, rather than a measured response for that combination. It was obtained by adding the four selected level means and subtracting three times the overall mean (21.4222 Pa), giving 14.3667 Pa. This calculation assumes negligible interactions.
The L9(34) design has eight total degrees of freedom, all assigned to four three-level factors. It is therefore saturated, with no independent residual-error term. Range analysis is used for descriptive comparison of factor-level means and selection of preferred parameter levels.
3.5. Summary of Experimental Findings
The experiments quantify aerodynamic and particle-collection recovery after wet-spray regeneration of the tested dust-loaded MESP. Over the investigated intervals, spray pressure and nozzle-to-module distance gave the larger performance changes, while washing duration showed a clear diminishing-return behavior, and spray angle required geometric matching with the module. The single-factor tests identified operating ranges of 0.3–0.4 MPa, 50–100 mm, and 20–30 s. The preferred parameter combination identified by orthogonal range analysis was 0.4 MPa, 30°, 50 mm, and 30 s, based on the factor-level means.
4. Numerical Simulation and Flow-Field Interpretation
4.1. Numerical Model
4.1.1. Geometry and Mesh
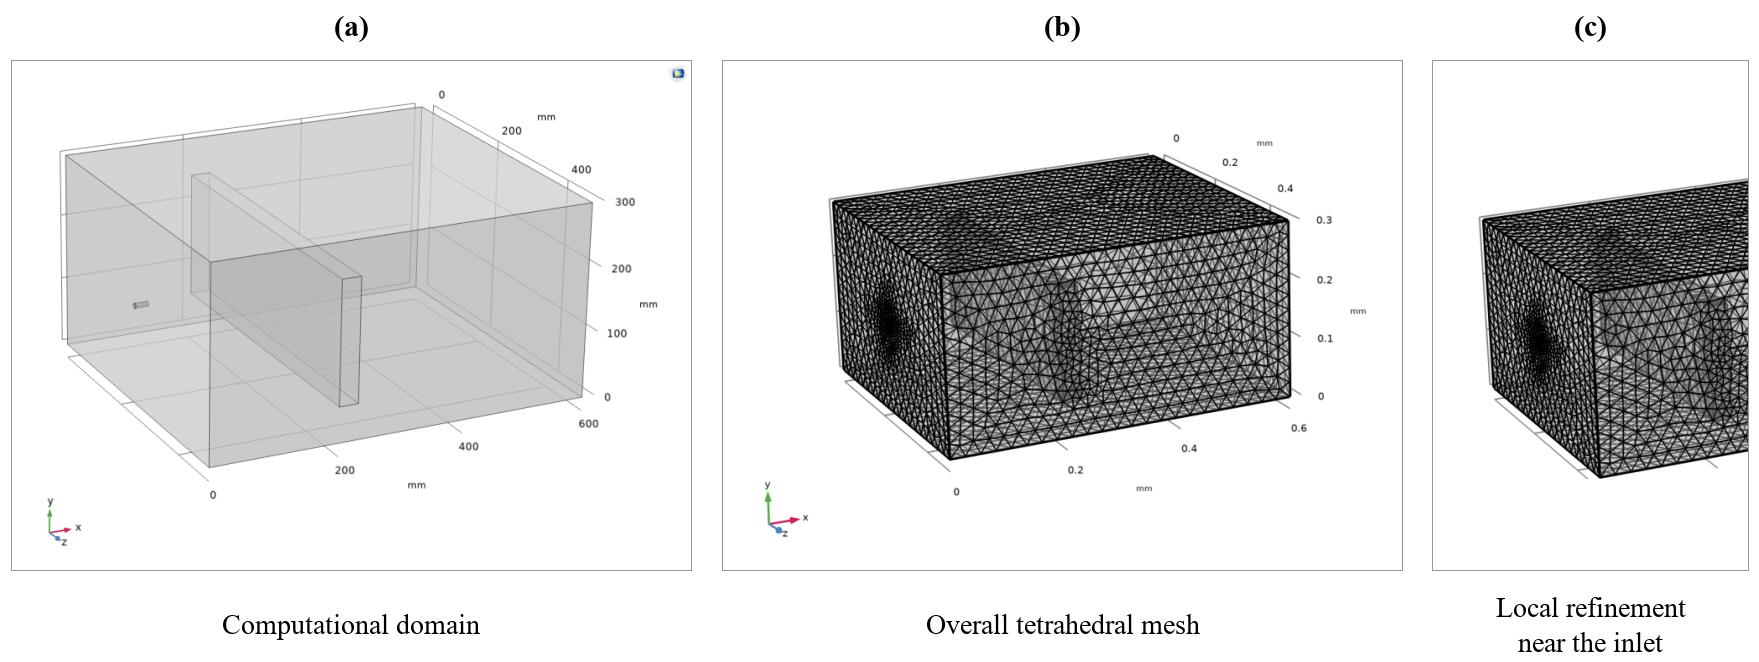
A numerical model was developed in COMSOL Multiphysics (version 6.4) to examine the internal flow structure and droplet-transport behavior. The computational domain measured 600 mm × 400 mm × 300 mm. A computational inlet 8 mm in diameter was positioned upstream of a 30 mm thick equivalent porous region representing the MESP module. Non-essential supports and small geometric details were omitted to reduce computational cost while retaining the principal jet-development, module-resistance, and downstream-flow regions.
As shown in Figure 7, an unstructured tetrahedral mesh was used throughout the domain. Local refinement was applied at the nozzle outlet, along the jet core, and near the upstream surface of the MESP, where large velocity and pressure gradients were expected. Five boundary-layer elements were applied along solid walls and the porous-region interfaces. Three meshes containing approximately 0.45, 1.20, and 2.80 million elements were compared, using the maximum velocity at the center of the module inlet as the monitoring variable. Increasing the element count from 1.20 to 2.80 million changed the monitored velocity by only 0.4%; therefore, the 1.20-million-element mesh was adopted for the subsequent simulations.
Figure 7.
Numerical model and mesh configuration: (a) computational domain, (b) overall mesh, and (c) local refinement near the nozzle and MESP module.
4.1.2. Governing Equations and Boundary Conditions
The continuous gas phase was treated as incompressible with constant density and governed by mass and momentum conservation. The MESP was represented as an equivalent porous region using the Brinkman formulation, avoiding explicit resolution of each microchannel. Dust accumulation and detachment affect the module’s surface characteristics and flow resistance, providing a physical basis for describing pre- and post-cleaning resistance states through an equivalent porous medium. The model was used for an exploratory study of the self-cleaning process and comparison with the experimental results. The governing equations are expressed as follows:
∇⋅u = 0
In Equations (9) and (10), ρ and μ are the density and dynamic viscosity of air; u is the superficial gas-velocity vector; p is pressure; I is the identity tensor; ϵp is porosity; κ is permeability; and βF is the inertial resistance coefficient of the porous region, with units of kg m−4.
The dispersed droplets were calculated in a Lagrangian reference frame. A dilute dispersed phase was assumed, and one-way coupling was adopted, so the gas flow affected droplet motion while feedback from the droplets to the continuous phase was neglected. Under this assumption, droplet trajectories were determined mainly by aerodynamic drag and gravity:
In Equation (11), mp and v denote droplet mass and velocity, respectively; FD is aerodynamic drag; and Fg = mpg is gravity, where g is gravitational acceleration. Consequently, the model can be used to identify likely droplet paths and low-velocity retention zones, but it does not explicitly resolve droplet collision, coalescence, dust-layer fracture, or liquid-to-gas momentum feedback.
The principal boundary conditions used in the numerical model are listed in Table 6.
Table 6.
Principal boundary conditions used in the numerical model.
4.2. Comparison with Experimental Results
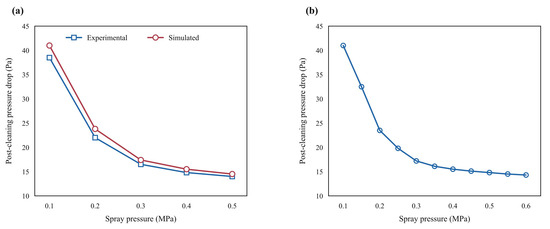
Figure 8a compares numerical and experimental post-cleaning pressure drops over the spray-pressure range of 0.1–0.5 MPa. Both series show a rapid decrease in residual pressure drop at lower spray pressures, followed by smaller changes toward the upper end of the range. At the reference pressure of 0.3 MPa, the measured post-cleaning pressure drop was 16.5 Pa and the simulated value was 17.4 Pa, corresponding to a relative deviation of 5.5%.
Figure 8.
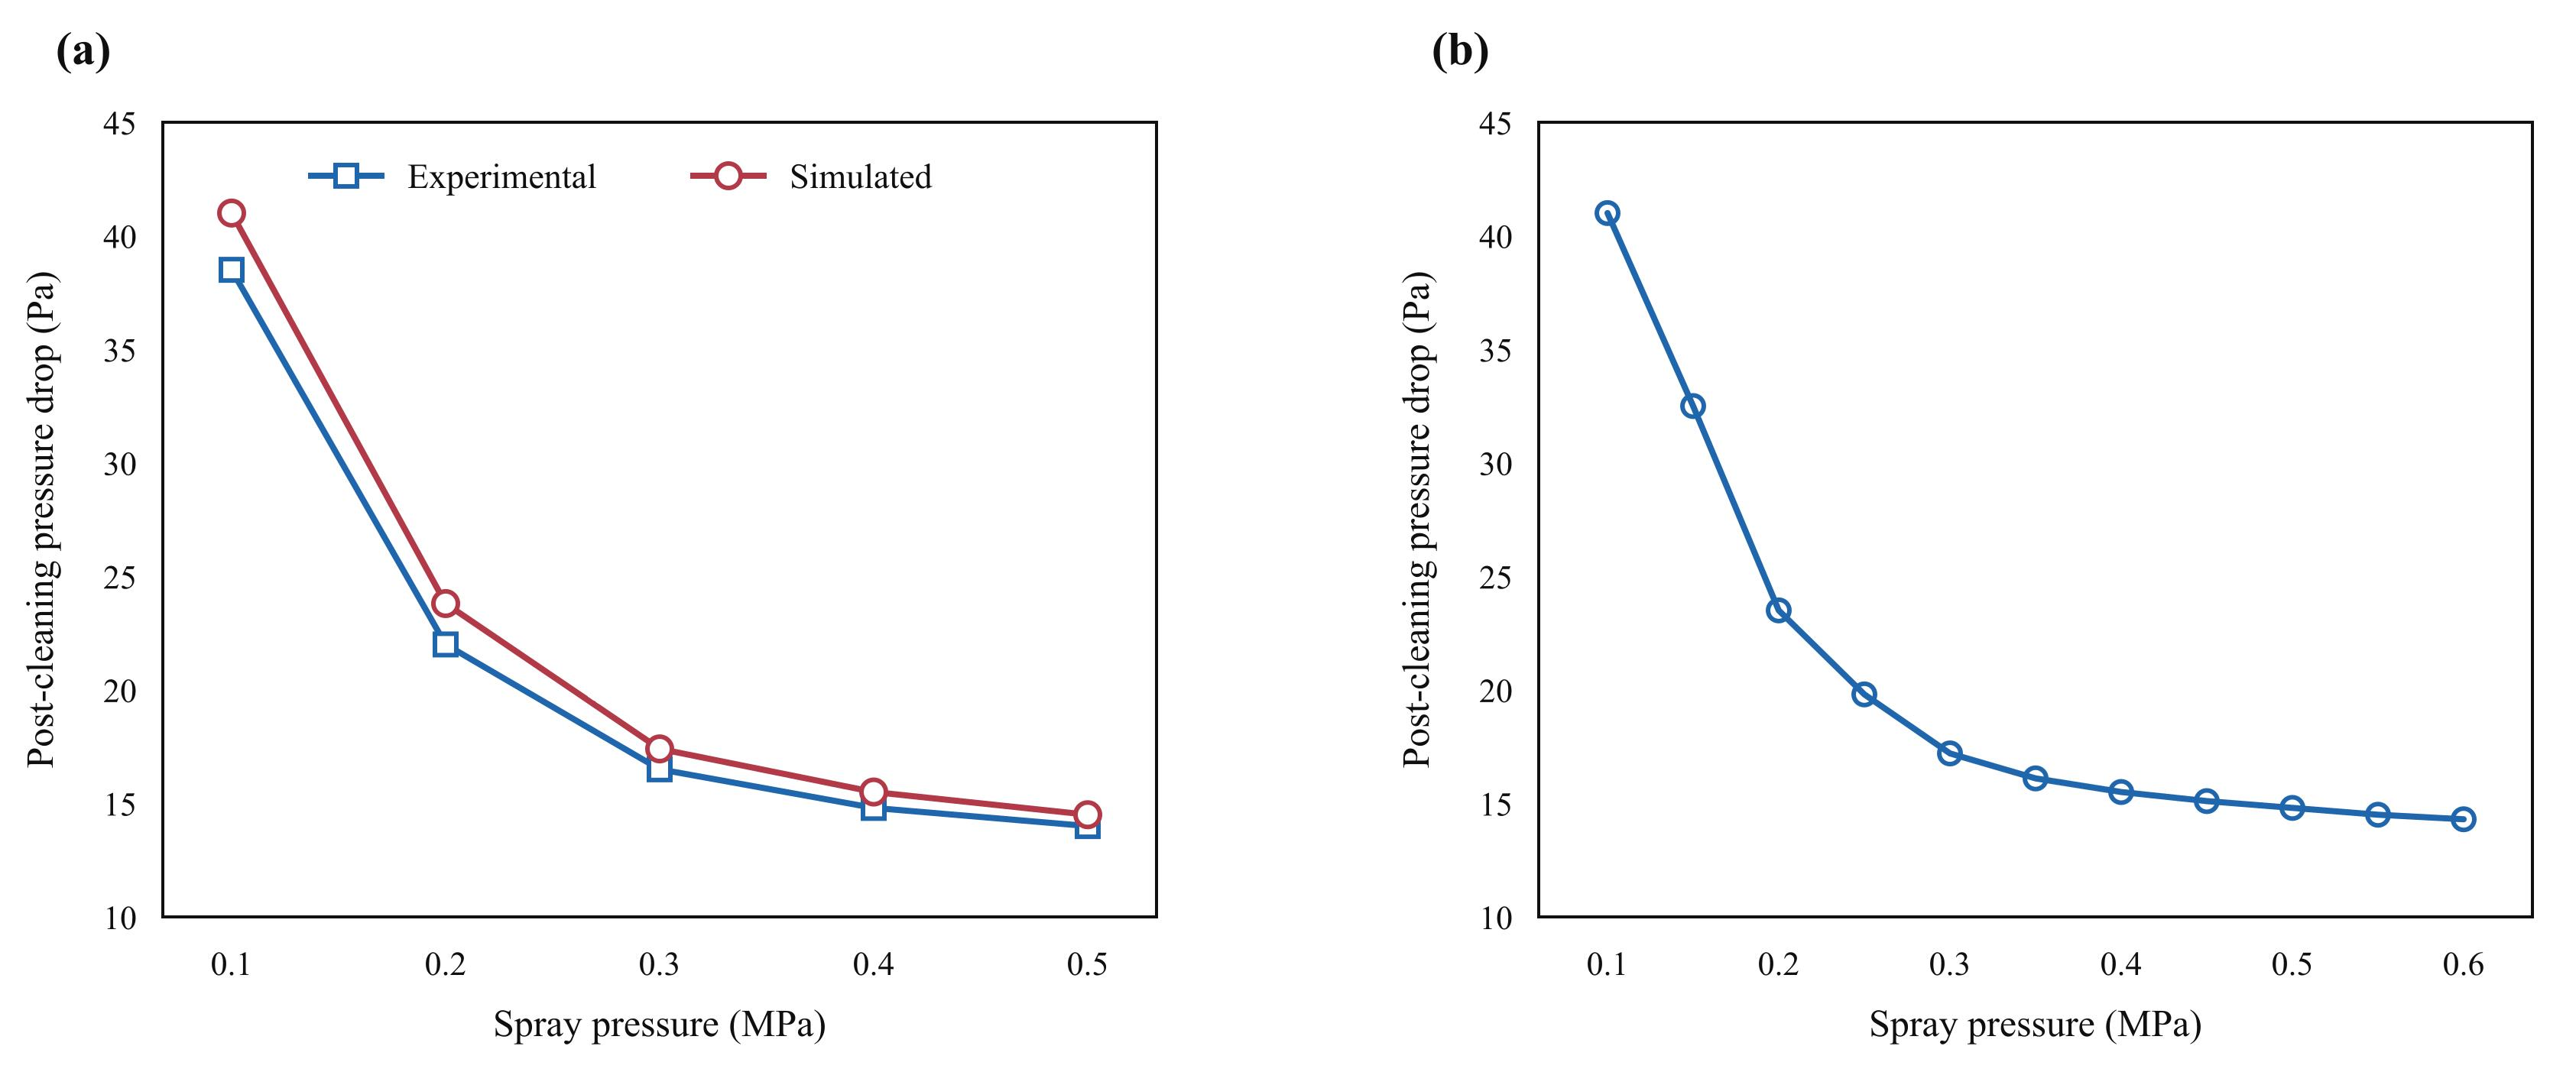
Numerical comparison and pressure-dependent simulation results: (a) comparison of measured and simulated post-cleaning pressure drops and (b) simulated response from 0.1 to 0.6 MPa in increments of 0.05 MPa.
The flow-field and droplet-transport results in Section 4.4 complement the pressure-dependent comparison by relating spray delivery and low-velocity regions to the measured pressure-drop recovery. Remaining differences may reflect dust-layer morphology and wetting-related surface changes. Future work will incorporate resistance changes associated with dust removal and extend the experimental comparison to additional operating conditions.
4.3. Effect of Spray Pressure in the Numerical Model
Spray pressure was varied from 0.1 to 0.6 MPa in increments of 0.05 MPa. The predicted post-cleaning pressure drop decreased rapidly in the low-pressure range, and then approached a plateau above approximately 0.3–0.4 MPa. This computed trend is consistent with the diminishing pressure response in the experimental series.
4.4. Flow-Field and Droplet-Transport Characteristics
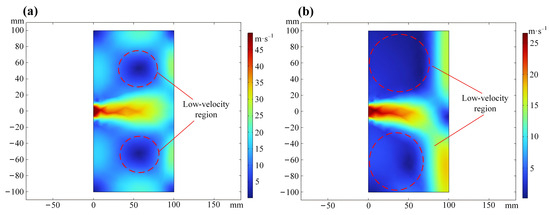
Figure 9 compares the dry gas-jet field with the wet-case gas field at a representative pressure of 0.3 MPa and distance of 100 mm. In the confined duct, jet expansion and interaction with the porous module generated local low-velocity and recirculation regions near the periphery of the principal jet. These regions identify differences in computed gas-flow distribution that may be relevant to spray delivery within the module.
Figure 9.
Flow-field characteristics at a spray pressure of 0.3 MPa and a nozzle-to-module distance of 100 mm: (a) dry gas-jet velocity field and (b) wet-case velocity field. Dashed annotations identify the peripheral low-velocity regions.
Liquid-assisted transport may carry detached material toward drainage. The velocity maps show the spatial distribution of the modeled flow across the module.
4.5. Transient Washing Performance and Water-Use Efficiency
A transient simulation was conducted to examine the experimentally identified 20–30 s operating window. The reference spray pressure was 0.3 MPa, the time step was 1 s, and the water-supply rate was 0.075 L s−1. A heavily dust-loaded initial resistance state, distinct from the steady comparison case, was used to examine recovery over time. The relevant results are shown in Figure 10.
Figure 10.
Simulated wet-regeneration performance from 20 to 30 s: (a) post-cleaning pressure drop, (b) pressure recovery rate and post-cleaning particle-collection efficiency, (c) calculated cumulative water use, and (d) pressure-recovery-to-water-use ratio. The vertical dashed lines mark 25 s, a compromise between pressure recovery and water use in this simulation.
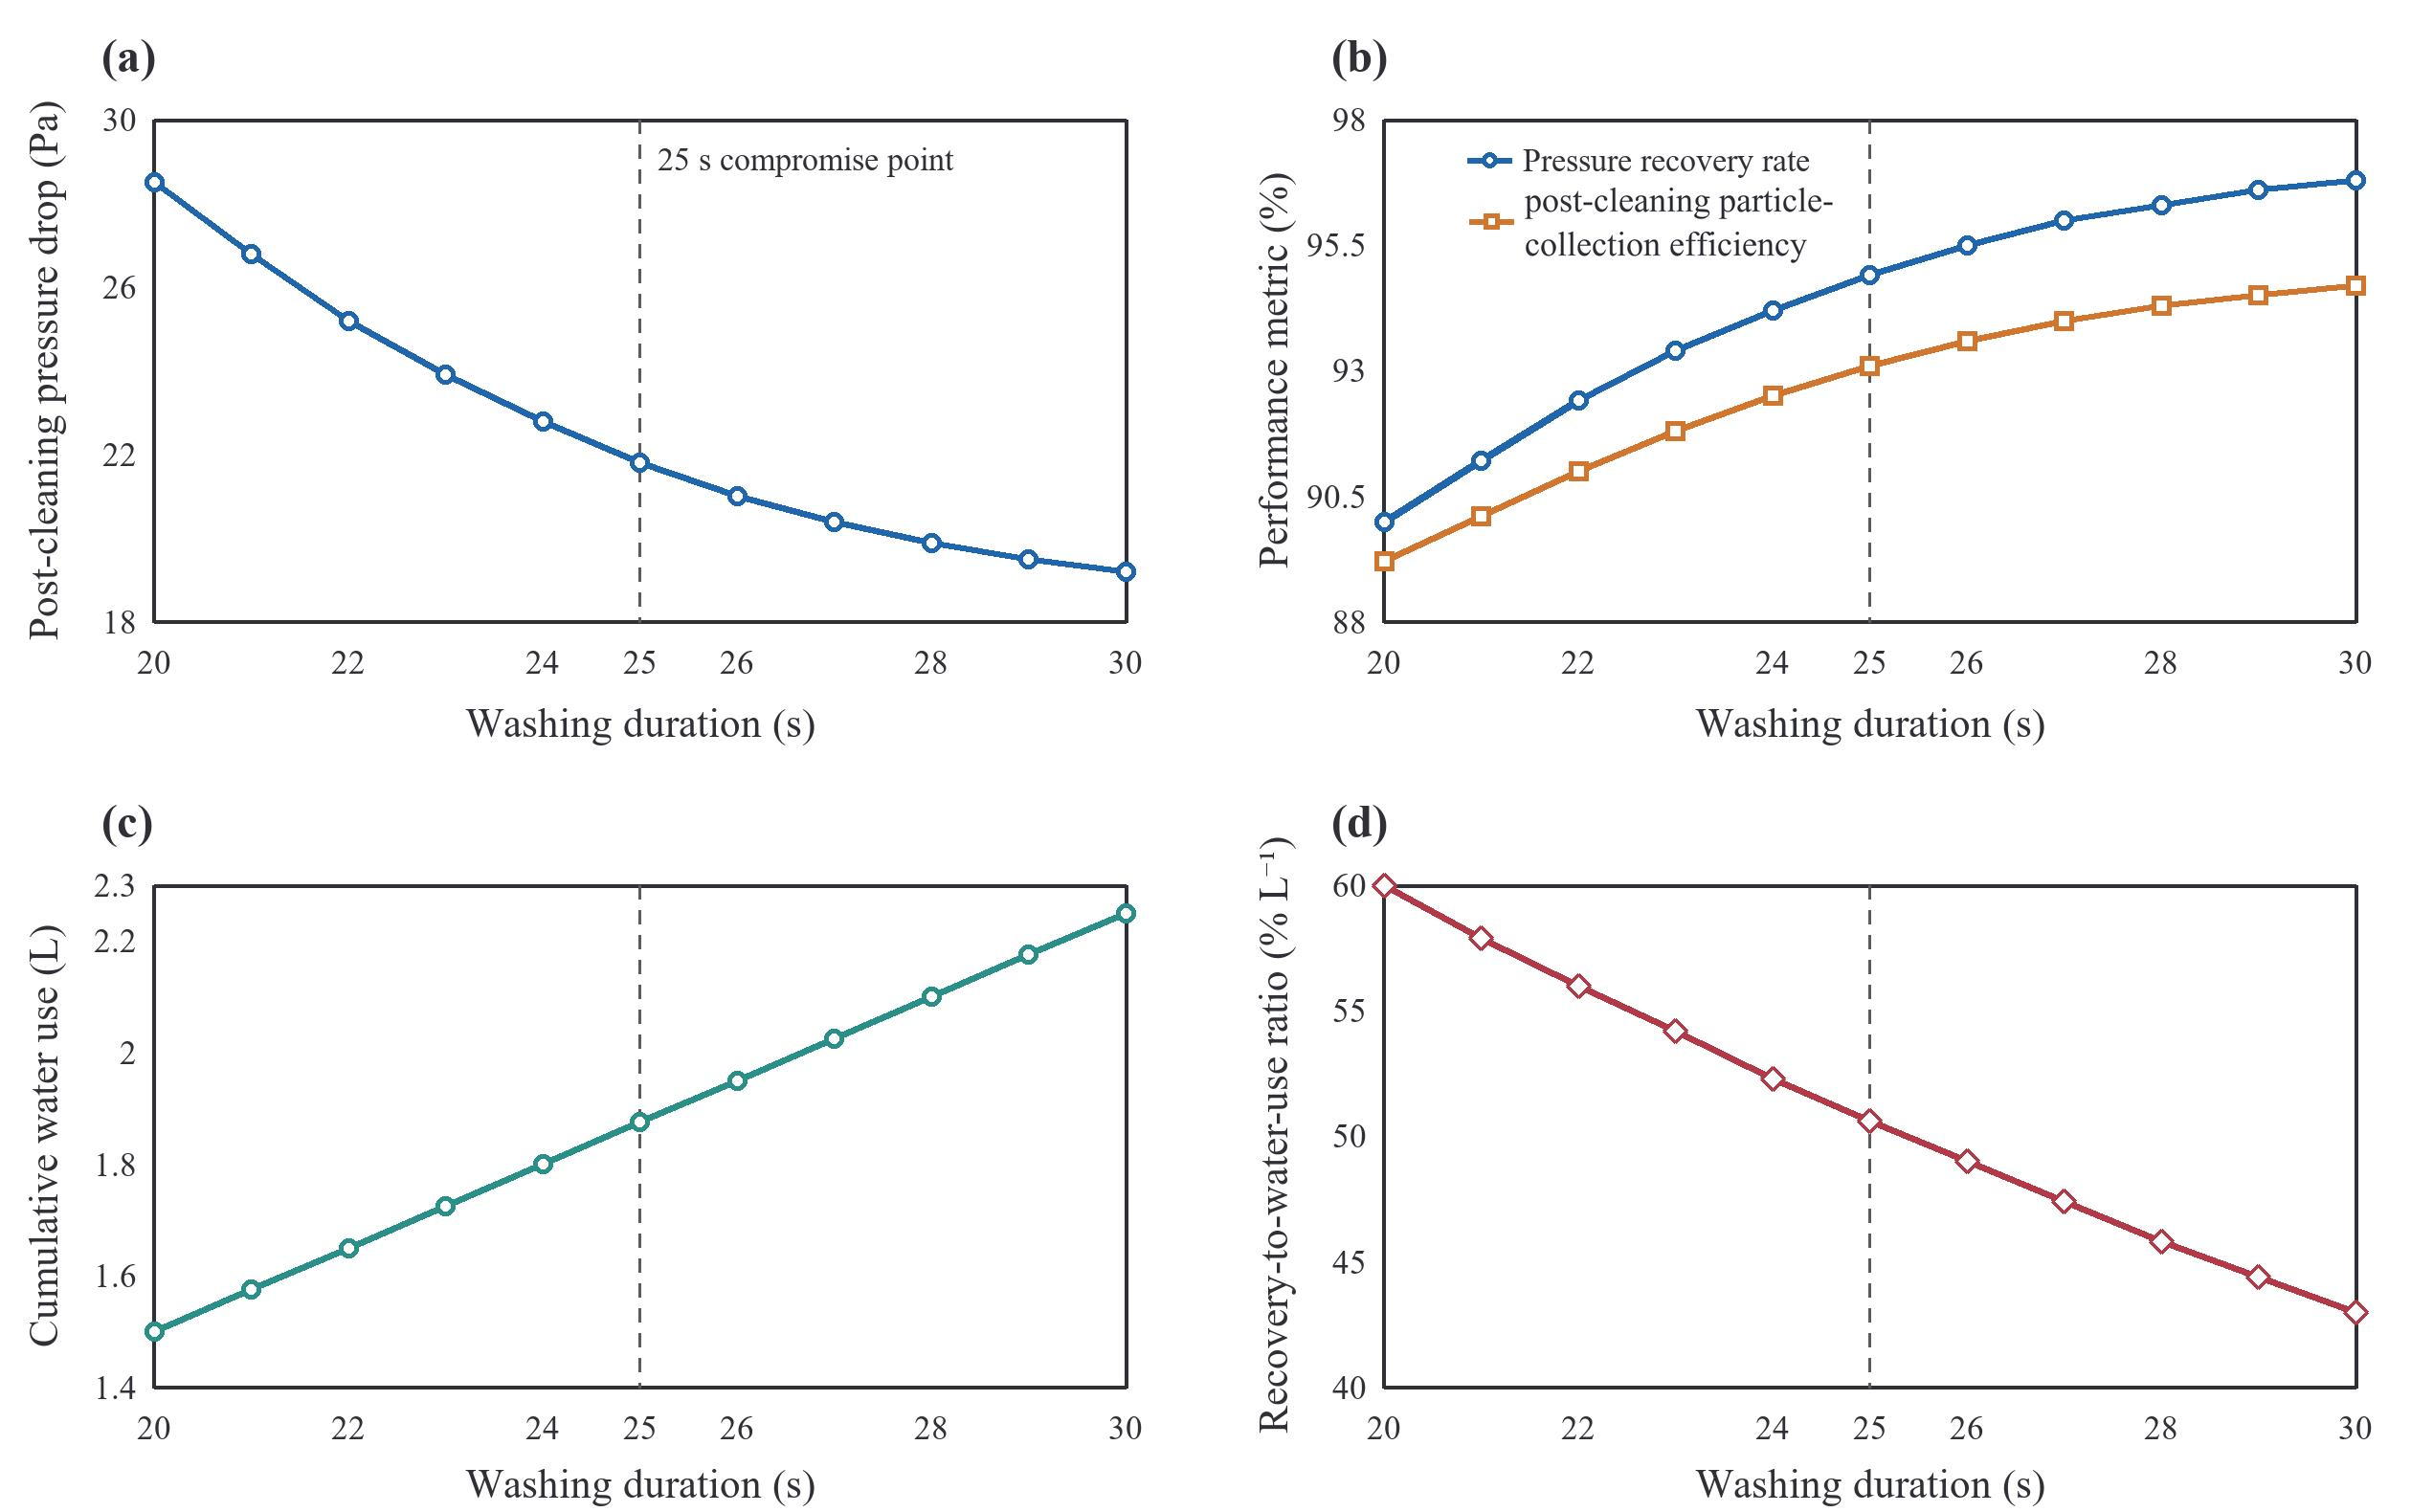
Between 20 and 25 s, the predicted post-cleaning pressure drop decreased from 28.5 to 21.8 Pa, while the pressure recovery rate increased from 90.0% to 94.9%. The predicted post-cleaning particle-collection efficiency increased from 89.2% to 93.1%. Between 26 and 30 s, however, the post-cleaning pressure drop decreased by only 1.8 Pa and the pressure recovery rate increased by only 1.3 percentage points, indicating that the process had entered a pronounced plateau.
Calculated cumulative water use increased linearly, from 1.50 L at 20 s to 2.25 L at 30 s, whereas the performance improvement was nonlinear. To compare washing durations within this numerical case, the pressure-recovery-to-water-use ratio was defined as pressure recovery rate divided by cumulative water consumption, expressing recovery per unit water volume. The ratio decreased from 60.0% L−1 at 20 s to 43.0% L−1 at 30 s. Thus, extending the washing duration improved the absolute recovery, but reduced the amount of recovery obtained per unit volume of water. The numerical comparison suggests approximately 25 s as a compromise between recovery and water use within the 20–30 s interval.
4.6. Summary of Numerical Findings
The numerical results reproduced the pressure-dependent recovery trend measured experimentally, and provided complementary information on jet development, low-velocity regions, and droplet transport. The calculated trends are consistent with smaller incremental changes above approximately 0.3–0.4 MPa and over the 20–30 s interval.
5. Residential Application Prospects and Future Work
This parameter study provides a starting point for residential MESP prototype development. The experiments identify starting ranges of 0.3–0.4 MPa for spray pressure, 50–100 mm for nozzle-to-module distance, and 20–30 s for washing duration. The preferred parameter combination identified by orthogonal range analysis was 0.4 MPa, 30°, 50 mm, and 30 s. Subsequent prototype studies should quantitatively compare wet regeneration with industrial pulse-jet and reverse-air approaches under matched airflow, dust-loading conditions, and recovery targets, accounting for differences in module geometry and auxiliary equipment.
Future hardware integration should select and size the compressor or compressed-air storage system, water supply, pressure regulators, valves, and connecting pipework for the required spray conditions. The evaluation should include pressure and flow stability, the controller, installation space within the residential ventilation unit, and access for servicing.
Future prototype work should evaluate coordinated control of the high-voltage supply, spraying, drainage, and drying. The control design must keep the high voltage off during washing and drainage and permit re-energization only after an acceptable dry state has been established. Drying criteria and interlock performance should be evaluated alongside residual moisture and the risk of insulation failure before re-energization. A pressure-drop-based cleaning trigger should be compared with a fixed schedule under representative loading conditions, with cleaning frequency and resource use recorded to assess the control strategy.
Dust handling should be developed, together with drainage. Future prototypes should collect dust-bearing washwater and retained solids, with storage, removal, and disposal procedures evaluated for household servicing. Tests should also examine retained moisture, microbial growth on wet surfaces or in collected washwater, downstream droplet carryover, and particle re-entrainment when ventilation resumes. Future tests should quantify surface-wetting coverage and the amount of deposited dust removed.
Residential evaluation should include noise during compressor operation, valve actuation, spraying, and drying, together with air and water leakage from the assembled system. Repeated operation should be used to examine nozzle blockage, drainage fouling and blockage, seal condition, and the effort required for routine maintenance.
The energy implications of the observed pressure-drop reductions will be assessed at the system level, accounting for both ventilation and regeneration.
Future prototype assessment should meter electricity use by the compressor, any water pump, drying equipment, and controls or standby systems, together with water use per cleaning cycle and compressed-air leakage. At comparable ventilation duty, this additional consumption should be compared with any fan-energy reduction over the interval between cleaning events, recording cleaning frequency and operating time. Energy and water demand should also be compared at equivalent pressure-recovery targets, to quantify the trade-off between operating settings. Economic assessment should include equipment and installation costs, water use, maintenance, consumables, and waste handling. Model-based estimates of building energy use and savings, together with metered operating data, would support this assessment.
Long-term testing should extend the present short-term recovery comparisons to repeated cleaning cycles. Tests with ISO 12103-1 A2 dust should be complemented by representative residential aerosol mixtures containing fibers, oily particles, biological material, and hygroscopic salts. Future loading tests should record the initial stabilized and dust-loaded module pressure drops, loading duration, deposited dust mass, airflow, and dust-feed rate, to quantify dust-loading repeatability. Subsequent tests should track recovery retention, electrode condition, drainage, corrosion, electrical insulation, and ozone generation. These measurements would help determine maintenance intervals and assess sustained performance in residential service.
6. Conclusions
This study quantifies how four wet-spray parameters affect resistance recovery and post-cleaning particle-collection efficiency in the tested residential MESP module.
- (1)
- Wet-spray regeneration effectively restored the aerodynamic and particle-collection performance of the MESP module. Increasing the spray pressure from 0.1 to 0.3 MPa reduced the post-cleaning pressure drop from 38.5 to 16.5 Pa and increased the pressure recovery rate from 54.9% to 95.3%. Further pressure increases produced limited additional benefits, supporting a spray-pressure operating interval of 0.3–0.4 MPa. Post-cleaning pressure drop and pressure recovery rate were more sensitive to regeneration conditions than post-cleaning particle-collection efficiency, and are useful performance indicators for subsequent control studies.
- (2)
- Regeneration performance depended strongly on nozzle arrangement and washing duration. Increasing the nozzle-to-module distance from 50 to 200 mm increased the post-cleaning pressure drop from 15.0 to 40.0 Pa and decreased the pressure recovery rate from 97.9% to 53.2%, supporting a nozzle-to-module operating distance of 50–100 mm. A spray angle of 45° gave the lowest mean post-cleaning pressure drop in the single-factor angle series under the baseline conditions. Most of the measured recovery increase occurred within the first 20 s. The numerical water-use comparison suggested approximately 25 s as a compromise between recovery and water consumption.
- (3)
- Orthogonal range analysis ranked the effects of the investigated factors as nozzle-to-module distance > spray pressure > washing duration > spray angle. The preferred parameter combination identified by orthogonal range analysis was 0.4 MPa, 30°, 50 mm, and 30 s, based on the factor-level means. This combination requires confirmation using the same module and dust-loading conditions.
- (4)
- The numerical model reproduced the experimentally observed pressure-dependent trend, with a relative deviation of 5.5% at 0.3 MPa. The experimental results provide a basis for selecting wet-regeneration settings for the residential MESP module.
Author Contributions
Conceptualization, J.Z. and X.N.; methodology, J.Z., Yunzhi Ling and X.N.; software, H.H.; validation, C.G., H.H. and C.N.E.; formal analysis, H.H.; investigation, H.H., C.G., A.M.A. and C.N.E.; resources, Y.L.; data curation, H.H.; writing—original draft preparation, H.H., A.M.A. and C.N.E.; writing—review and editing, H.H., X.N.; supervision, X.N.; project administration, X.N.; funding acquisition, X.N., J.Z. and Y.L. All authors have read and agreed to the published version of the manuscript.
Funding
The National Natural Science Foundation of China (No. 51406076 and No. 42302306), the Fundamental Research Funds for Xuzhou (No. KC23046), and the Scientific Research Project of China Construction Third Engineering Bureau (No. CSCEC-YP-2024-05).
Data Availability Statement
The original contributions presented in this study are included in the article. Further inquiries can be directed to the corresponding author.
Conflicts of Interest
The authors declare no conflicts of interest.
References
- Singer, B.C.; Delp, W.W.; Black, D.R.; Walker, I.S. Measured performance of filtration and ventilation systems for fine and ultrafine particles and ozone in an unoccupied modern California house. Indoor Air 2017, 27, 780–790. [Google Scholar] [CrossRef] [Scilit]
- Walker, I.S.; Dickerhoff, D.J.; Faulkner, D.; Turner, W.J.N. System Effects of High Efficiency Filters in Homes. Lawrence Berkeley National Laboratory, LBNL-6144E, 2013. Available online: https://eta-publications.lbl.gov/sites/default/files/lbnl-6144e.pdf (accessed on 7 March 2026).
- Jaworek, A.; Krupa, A.; Czech, T. Modern electrostatic devices and methods for exhaust gas cleaning: A brief review. J. Electrost. 2007, 65, 133–155. [Google Scholar] [CrossRef] [Scilit]
- Lima, F.D.A.; Medeiros, G.B.; Chagas, P.A.M.; Aguiar, M.L.; Guerra, V.G. Aerosol Nanoparticle Control by Electrostatic Precipitation and Filtration Processes—A Review. Powders 2023, 2, 259–298. [Google Scholar] [CrossRef] [Scilit]
- He, J.; Liu, J.; Kong, L.; Wang, P.; Zhang, X. Simulation Study of a Novel Cylindrical Micro-Electrostatic Particulate Air Filter with High Filtration Efficiency and Low Resistance. Buildings 2021, 11, 465. [Google Scholar] [CrossRef] [Scilit]
- Wang, C.; Jiang, J.; Wang, P.; Kong, L.; Liu, J. Exploring the potential of a novel electrostatic precipitator as an alternative to air filters in air purifiers. Build. Environ. 2025, 270, 112535. [Google Scholar] [CrossRef] [Scilit]
- Wang, C.; Xu, J.; Wen, S.; He, J.; Han, X.; Liu, J. Holistic performance optimization of dielectric-coated electrostatic precipitators for efficient submicron particle removal. Build. Environ. 2026, 302, 114817. [Google Scholar] [CrossRef] [Scilit]
- Chang, S. Influence of Ionic Wind in Micro Electrostatic Precipitator on Internal Air Flow Characteristics. Int. J. Heat Technol. 2023, 41, 87–94. [Google Scholar] [CrossRef] [Scilit]
- Wu, S.; Cai, R.; Zhang, L. Research progress on the cleaning and regeneration of PM2.5 filter media. Particuology 2021, 57, 28–44. [Google Scholar] [CrossRef] [Scilit]
- Reimers, A.; Bouhanguel, A.; Greve, E.; Möller, M.; Saure, L.M.; Kaps, S.; Wegner, L.; Nia, A.S.; Feng, X.; Schütt, F.; et al. Multifunctional, self-cleaning air filters based on graphene-enhanced ceramic networks. Device 2023, 1, 100098. [Google Scholar] [CrossRef] [Scilit]
- US Environmental Protection Agency. Monitoring by Control Technique: Fabric Filters. Available online: https://www.epa.gov/air-emissions-monitoring-knowledge-base/monitoring-control-technique-fabric-filters (accessed on 8 September 2026).
- Lu, H.-C.; Tsai, C.-J. Numerical and Experimental Study of Cleaning Process of a Pulse-Jet Fabric Filtration System. Environ. Sci. Technol. 1996, 30, 3243–3249. [Google Scholar] [CrossRef] [Scilit]
- Lo, L.-M.; Chen, D.-R.; Pui, D.Y.H. Experimental study of pleated fabric cartridges in a pulse-jet cleaned dust collector. Powder Technol. 2010, 197, 141–149. [Google Scholar] [CrossRef] [Scilit]
- Qian, Y.; Bi, Y.; Zhang, M.; Chen, H.; Xu, G. Effect of filtration operation and surface treatment on pulse-jet cleaning performance of filter bags. Powder Technol. 2015, 277, 82–88. [Google Scholar] [CrossRef] [Scilit]
- Binnig, J.; Meyer, J.; Kasper, G. Origin and mechanisms of dust emission from pulse-jet cleaned filter media. Powder Technol. 2009, 189, 108–114. [Google Scholar] [CrossRef] [Scilit]
- Qian, Y.; Chen, H.; Dai, H.; Liu, T.; Kuang, T.; Bian, L. Experimental study of the nozzle settings on blow tube in a pulse-jet cartridge filter. Sep. Purif. Technol. 2018, 191, 244–249. [Google Scholar] [CrossRef] [Scilit]
- Li, J.; Xie, W.; Wu, Q.; Chen, D.-R.; Shi, D.; Chen, Q.; Ma, Z.; Wu, D. Improved Pulsed-Jet Cleaning of Pleated Cone Filter Cartridges Using a Diffusion Nozzle. Aerosol Air Qual. Res. 2023, 23, 220324. [Google Scholar] [CrossRef] [Scilit]
- Lu, H.-H.; Lin, C.-P.; Le, T.-C.; Lu, M.-C.; An, Z.; Tsai, T.-S.; Dai, Y.; Huang, Y.-S.; Tsai, C.-J. Novel wet electrostatic precipitator using pulse-air-jet-assisted water flow (PJWF) for online dust cake removal. Sep. Purif. Technol. 2025, 367, 132863. [Google Scholar] [CrossRef] [Scilit]
- dos Santos, L.G.P.; Sartim, R.; Rocha, S.M.S.; Siqueira, R.D.N. Flow distribution and jet behavior analysis of fabric filter’s pulse-jet cleaning. J. Air Waste Manag. Assoc. 2020, 70, 544–556. [Google Scholar] [CrossRef] [Scilit]
- Qian, J.; Wang, J.; Liu, H.; Xu, H. CFD Modeling of Ventilation and Dust Flow Behavior in Polishing and the Design of an Innovative Wet Dust Removal System. Int. J. Environ. Res. Public Health 2020, 17, 6006. [Google Scholar] [CrossRef] [Scilit]
- Yao, S.; Guo, Y.; Jiang, N.; Liu, J. An experimental study of a turbulent jet impinging on a flat surface. Int. J. Heat Mass Transf. 2015, 83, 820–832. [Google Scholar] [CrossRef] [Scilit]
- Chen, K.; Huang, Y.; Wang, S.; Zhu, Z.; Cheng, H. Experimental Research on Dynamic Filtering Characteristics of Filter Materials for Electrostatic-Fabric Integrated Precipitator. App. Sci. 2022, 12, 5824. [Google Scholar] [CrossRef] [Scilit]
- Li, H.; Wang, Z.; Ye, Y.; Wang, Z. A model analysis on the pulse-jet cleaning performance of electrostatically stimulated fabric filtration. Powder Technol. 2016, 291, 499–505. [Google Scholar] [CrossRef] [Scilit]
- ISO 12103-1:2024; Road vehicles — Test contaminants for filter evaluation — Part 1: Arizona test dust. ISO: Geneva, Switzerland, 2024. Available online: https://www.iso.org/standard/85949.html (accessed on 24 March 2026).
- Joint Committee for Guides in Metrology (JCGM). Evaluation of Measurement Data—Guide to the Expression of Uncertainty in Measurement. JCGM 100:2008; Corrected Version 2010; BIPM: Sèvres, France, 2008. [Google Scholar] [CrossRef] [Scilit]
- Taylor, B.N.; Kuyatt, C.E. Guidelines for Evaluating and Expressing the Uncertainty of NIST Measurement Results. In NIST Technical Note 1297; National Institute of Standards and Technology: Gaithersburg, MD, USA, 1994. [Google Scholar] [CrossRef] [Scilit]

Disclaimer/Publisher’s Note: The statements, opinions and data contained in all publications are solely those of the individual author(s) and contributor(s) and not of MDPI and/or the editor(s). MDPI and/or the editor(s) disclaim responsibility for any injury to people or property resulting from any ideas, methods, instructions or products referred to in the content. |
© 2026 by the authors. Licensee MDPI, Basel, Switzerland. This article is an open access article distributed under the terms and conditions of the Creative Commons Attribution (CC BY) license.