


Abstract
School buildings are characterized as energy-intensive buildings, while indoor thermal comfort and air quality remain inadequate. This study addresses the fragmented assessment of school building renovations by integrating energy performance, indoor thermal comfort, and life-cycle environmental and economic impacts into a unified evaluation framework. Multiple energy, environmental, and economic indicators are calculated to enable a multidimensional evaluation of alternative renovation strategies. Emphasis is placed on the school’s potential role as an active prosumer within a renewable energy community and the identification of trade-offs between environmental benefits and economic feasibility. For this purpose, a school building located in Kifissia, Greece, is investigated using two in-house developed tools: T-DEOS, an energy simulation tool, and VERIFY, a life-cycle environmental and economic assessment tool. To identify the most efficient renovation strategy, four holistic strategies that involve multiple passive building envelope technologies, highly efficient energy systems, and renewable energy systems are examined, whereas the building is considered to participate in a local renewable energy community. According to the analysis, the optimum renovation strategy is calculated to result in more than 79% energy savings for heating and a 7.09% enhancement of indoor thermal comfort conditions during the school’s occupied hours. The electrification of the building energy systems along with rooftop PV electricity generation results in a self-sufficiency rate of approximately 52% and a self-consumption rate of almost 19%. Finally, the optimum scenario results in a 95% decrease in annual operational expenses compared to the existing school state.
1. Introduction
Students spend almost one-third of their day on school premises; however, proper conditions for a viable and healthy learning environment are not always guaranteed. Despite the fact that a substantial share of annual school expenses is associated with energy bills, adequate thermal comfort and indoor air quality remain challenging [1]. The energy renovation of school units is a complex and multifaceted project that is often hindered by multiple socio-economic constraints, scarce technical expertise, and inefficient management skills [2]. Additionally, the absence of comprehensive guidelines and a nationally established framework for school renovation raises a barrier for local municipalities to initiate and implement energy upgrades in public buildings [3]. Deep energy renovation of public schools is characterized by a high investment cost, is rarely financially self-supported, and is therefore often dependent on public subsidies, European-funded projects, or private financial initiatives. However, it can have a significant impact on shaping students’ and the community’s rationale regarding the necessity of such projects, and on the environment and their own health [4].
A holistic energy upgrade of a school unit requires the combined implementation of passive thermal envelope technologies and highly efficient, renewably driven energy systems [5]. This approach can support the electrification of school unit operation and simultaneously increase the level of self-sufficiency. In a case study of an existing school in Hangzhou, China, the combinational implementation of envelope interventions, lighting system replacement, PV installation, and the installation of efficient energy systems for heating and cooling is investigated under energy, environment, economic, and thermal comfort criteria [6]. It is found that the holistic renovation strategy resulted in a net zero annual energy balance. Moreover, in a comprehensive study of eight different Serbian school units that underwent energy retrofit, wall and roof insulation, along with window replacement, LED lighting installation, and installation of new and efficient boiler systems were implemented [7]. This retrofit strategy resulted in decreasing the annual energy demand for space heating by 48% to 56%, while also reducing annual CO2 emissions by 45% to 56%. Finally, in a study by Sánchez et al. [8], the deep renovation strategy applied to a Mediterranean public school comprises thermal envelope insulation, installation of double-glazed low-e windows, enhancement of building-level airtightness, installation of external shading elements, PV installation, and heating energy system renovation, a strategy found to result in approximately 40% annual energy savings.
High thermal performance in school buildings can be achieved through interventions that regulate seasonal thermal loads. The addition of insulation material to the thermal envelope horizontal and vertical components is a widely adopted strategy [9]. Specifically, it is recognized as a top-priority renovation intervention, with favorable results during the heating and cooling periods [10]. Moreover, window replacement is considered a high-investment retrofit measure, which cannot be omitted when renovation objectives extend beyond energy savings to include thermal and visual comfort. It is also linked to enhancing building-level airtightness, restraining thermal losses due to infiltration up to 35% [11]. However, due to high solar irradiation and the warm climatic conditions of the Mediterranean, window replacement should be combined with the installation of external shading elements for enhanced regulation of solar heat gains [12]. In a study by Gil-Baez et al. [13], the energy renovation of a school unit is investigated under the Mediterranean climatic conditions of southern Spain. It is concluded that the combined implementation of thermal insulation, window replacement, and external shading results in 17.7% and 15.9% energy savings for heating and cooling, respectively, and a 48% decrease in annual emissions.
The installation of a mechanical ventilation system with heat recovery is reported to result in decreased energy consumption and enhanced thermal comfort conditions. Specifically, according to the study by Stabile et al. [14], energy savings of 32% are achieved by eliminating manual airing with controlled ventilation with heat recovery, achieving adequate indoor air quality. Similarly, a recent analysis of a Mediterranean school under renovation indicated that natural ventilation techniques result in 80% increased energy consumption [15]. The replacement of conventional fluorescent lighting systems with LED lighting and automated lighting controls is considered a low-investment retrofit measure with high potential for reducing electricity consumption by up to 50% [16]. Interestingly, a case study in Portugal reported approximately 11% electricity savings due to proper daylight harvesting techniques [17], whereas investigating the replacement of fluorescent lighting with LED luminaires in South African schools reported a 21% to 39% decrease in operational costs related to lighting [18].
The formation of renewable energy communities directly promotes citizen involvement in local renewable energy production and consumption. Such communities may comprise various building types, characterized by different operation profiles, energy demands, and production capabilities, a diversity which facilitates an effective balance between generation and consumption flows. Specifically, public and tertiary buildings are valuable members of a renewable energy community that also incorporates residential buildings, because of their different demand profiles. Given that all buildings are equipped with electrically driven energy systems, the optimum community configuration involves 40 members and a PV electricity generation capacity of 50 kW each [19]. According to the study by Ahile et al. [20], a school unit that operates as a prosumer and exports surplus electricity to local residences contributes to reducing household electricity consumption by 16%, household electricity bills by 8%, and maximum electrical load by over 13%. This is feasible due to the temporal matching of generation and demand among multiple prosumers and members of a renewable energy community, making the annual electricity balance of individual members a matter of secondary importance [21]. Finally, Efthymiou et al. [22] highlight the fact that renewable energy communities advocate energy democracy and alleviate energy poverty. In their case study, photovoltaic installations on school buildings and at a wider municipal level are calculated to contribute to a reduction of more than 68% in CO2 emissions.
The present research presents a holistic investigation of a school building renovation process, together with a comprehensive assessment based on energy, thermal comfort, and environmental and economic indicators. For this purpose, the building accommodating the 2nd Junior High School and the 2nd High School of Kifissia, Greece, a presentative Greek school building, is examined, considering the implementation of multiple passive building envelope actions and high-efficiency energy systems. The school building is assumed to operate as an active prosumer within a renewable energy community, exporting surplus PV-generated electricity and generating associated revenues. The study is performed using two in-house developed tools: T-DEOS, an energy simulation tool, and VERIFY, a life-cycle environmental and economic assessment tool. The importance of the present study lies in the establishment of an integrated framework that enables the assessment and comparison of school renovation strategies across multiple dimensions. While existing studies often investigate the energy, environmental, and economic aspects of building renovation separately, the present research study addresses this fragmentation by integrating energy performance, indoor thermal comfort, life-cycle environmental impacts, and economic feasibility into a unified assessment framework. A key novelty of the present study is the consideration of the school as an active prosumer, an approach that extends conventional building-level renovation assessments by accounting for and integrating the potential economic benefits associated with surplus PV electricity exports into the life-cycle evaluation. In contrast to conventional renovation studies that primarily focus on energy savings or investment payback, the proposed approach evaluates the wider consequences of school renovation across energy performance, environmental footprint, and economic viability and aims to identify tradeoffs among these competitive levels. Finally, the study aims to highlight the effects of a holistic renovation strategy on school-specific operating conditions, with the broader objective of shifting the focus of school energy renovation beyond economic performance toward environmental benefits and indoor thermal comfort.
2. Materials and Methods
In this section, analytical information regarding the geometry, the construction, and the operation of the examined school unit is given. Additionally, the simulation methodology and key input parameters adopted in both the energy simulation and the life-cycle tool are presented. Four different renovation scenarios are examined and evaluated in terms of energy, environmental, and economic criteria.
2.1. Description of School Unit
The examined school unit comprises the 2nd Junior High School and 2nd High School of Kifissia in Greece (38.07645° Ν, 23.798559° E), accommodated in a three-floor building with a treated floor area of 1329 m2. The school unit also includes a non-conditioned basement, used for storage and mechanical equipment. There is a landscaped atrium in the middle of the building serving as a schoolyard. The selected school building, constructed in 1978, exhibits characteristics commonly found in older Greek school buildings, many of which were constructed before the introduction of mandatory thermal insulation requirements. In particular, the absence of thermal insulation, reliance on fossil-fuel-based heating systems, and relatively poor indoor thermal comfort are typical characteristics of this building category. Furthermore, the building’s size and functional characteristics are considered representative of junior high schools and high schools in urban areas of Greece. The main geometric data, along with the thermal properties of the main building components, are given in Table 1, with respect to orientation. These data are obtained via architectural drawings and on-site surveys.
Table 1.
Geometric data and thermal properties of building components.
The school unit operates on working days, from 11 September to 15 June. The daily operating program includes partial operation of 10% from 07:30 to 08:00, full operation from 08:00 to 13:00, operation at 75% from 13:00 to 14:00, and operation at 10% from 14:00 to 15:00. On average, the building is occupied by 295 students and teachers, for whom a specific load of 80 W per person is considered [23]. The specific electrical load for appliances and lighting is considered equal to 2.6 W/m2 and 10 W/m2 [24], respectively, according to data obtained via survey and in accordance with the technical guidelines of the Technical Chamber of Greece [25]. The infiltration rate is set to 0.8 ACH [23], while the natural ventilation rate is set to be 1.2 ACH [26]. These relatively high air exchange rates are attributed to the age and construction characteristics of the school buildings, including their limited airtightness, as well as the increased ventilation requirements associated with maintaining adequate indoor air quality and ensuring a healthy indoor environment for students and teaching staff. The adopted assumptions are in accordance with the Greek national regulations [25].
Table 2 summarizes the main operation data of the school unit. At present, the heating energy demand of the examined school unit is covered by well-maintained natural gas boilers coupled with radiators distributed throughout the building. According to information provided by the school administration, the natural gas boiler system was installed in 2010. Cooling demand is only partially covered by local split-type air-conditioning units. The fundamental operating characteristics of the building energy systems are given in Table 3.
Table 2.
Operation data of the examined school unit.
Table 3.
Heating and cooling energy systems operation data.
2.2. Description of Examined Renovation Scenarios
For the 2nd Junior High School and the 2nd General Lyceum of Kifissia, four different energy renovation scenarios are examined. These scenarios include thermal envelope interventions, as well as energy systems replacement. More specifically, the investigated interventions concern:
- The installation of insulation material on the floor slab, external walls, and on the exterior surface of the rooftop.
- The replacement of existing windows with triple-glazed, low-e windows, with a total window U-value of 0.8 W/(m2·K) and a g-value factor equal to 0.5.
- The installation of 18 mechanical ventilation system with heat recovery (MVHR), with a heat recovery effectiveness of 85%, a maximum air supply rate of 460 m3/h, and a specific electric power of 0.15 Wh/m3. According to the guidelines of the Technical Chamber of Greece [25], fresh air supply to secondary education buildings is set to 6.1 L/s per occupant, which is fully met by the proposed MVHR systems, and is set as the nominal mechanical ventilation rate. No heat recovery bypass operation is considered, while MVHR systems are set to operate at 20% of nominal ventilation rate during afternoon hours, weekends and holidays.
- The enhancement of the building envelope airtightness level through the application of airtight sealing tapes around the perimeter of the windows. The infiltration rate is considered to be equal to n50 = 1 ach at a 50 pressure difference of 50 Pa [27], which corresponds to 0.05 ach at typical pressure level [28]. Natural ventilation rate is decreased at 0.2 ach.
- The installation of rooftop monocrystalline silicon photovoltaic modules with a nominal efficiency of 22% [29] and a total capacity of 46.23 kWp coupled with three-phase grid-connected inverters with a total nominal power of 50 kVA.
- The installation of an efficient air-to-water heat pump with a rated thermal capacity for heating and cooling ranging between 160 and 220 kWth, with a seasonal coefficient of performance (SCOP) and a seasonal energy efficiency ratio (SEER) equal to 4 [23], and the installation of 40 fan coil terminal units, with a thermal output of 5 kWth.
- The replacement of 3987 klm fluorescent lighting with a specific electrical load of 10 W/m2 with LED technology luminaires of 3987 klm with a specific power of 5 W/m2.
It is important to underline that the nominal capacity of the air-to-water heat pump system varies within a defined range, as the required thermal capacity depends on the combination of other implemented interventions, and on the maximum heating and cooling load of the building in each case examined. Additionally, the comparison between the baseline scenario and the renovation scenarios incorporating MVHR systems indicates that the calculated energy savings result from the combined effects of reduced uncontrolled air infiltration, controlled outdoor-air supply in accordance with national ventilation requirements, and heat recovery, rather than from heat recovery alone. Table 4 summarizes the four investigated energy renovation scenarios, with a description of the interventions applied in each case:
Table 4.
Interventions per renovation scenario.
In addition, the thermal permeability values of the opaque structural elements presented in Table 4 refer to the final thermal transmittance coefficient U-value after application of the thermal insulation intervention. For completeness, it is pointed out that for buildings located in areas of climate zone B and undergoing a radical upgrade, in accordance with the Technical Instruction of the Technical Chamber of Greece [25], the maximum permissible U-value is 0.90 W/(m2·K) for floors in contact with the ground, 0.50 W/(m2·K) for external walls in contact with air, and 0.45 W/(m2·K) for the rooftop in contact with air.
2.3. Simulation Tools and Methodology
2.3.1. Energy Simulation Tool—T-DEOS
The thermal analysis of the investigated school unit and the assessment of various renovation upgrade scenarios are conducted using the validated energy simulation tool T-DEOS (Thermal—Dynamic Energy Oriented Simulation) [30]. This tool is developed by the University of West Attica (UNIWA) [31], and it is built using the MATLAB 2026a framework [32]. The possibilities of T-DEOS include the accurate dynamic simulation of building thermal behavior through the development of detailed grey-box models and energy twins of existing buildings, as well as the calculation of fundamental economic indicators. More analytically, T-DEOS allows the detailed simulation of multiple energy systems and renewable energy systems; it supports the dynamic thermodynamic analysis of heat pumps and other systems, while it also supports the calculation of indoor thermal comfort indicators.
Weather data are extracted from the PVGIS database [33] for the location of Kifissia, Greece, including exterior dry-bulb air temperature and direct and diffuse irradiation on a horizontal surface. The thermal response of the external opaque building components is simulated by solving the one-dimensional heat conduction equation using the finite volume method, taking into account the incident solar irradiation. The convective heat transfer coefficient is 8 W/(m2·K) and 25 W/(m2·K) for the interior and exterior surfaces [34]. Regarding the transparent elements, 10% of the transmitted solar irradiation is considered to be directly absorbed by the indoor air, while the remaining energy is absorbed by the surrounding indoor environment and furniture [35]. The simulation analysis is performed using a 5 min step [36]. Every building element is discretized into 200 computational nodes based on an appropriate mesh-independence study to ensure accurate calculations and short computational time.
The heating period is assumed to last from the beginning of October to the end of April, and the cooling period spans from the beginning of May until the end of September [37]. The temperature setpoint is set at 20 °C during the heating season, and at 26 °C during the cooling season [38]. T-DEOS integrates a control system that retains indoor air temperature within an acceptable range. To simplify the energy and thermal comfort simulation process, the entire school building volume is modelled as a single thermal zone, assuming uniform indoor thermal conditions throughout the building [39].
2.3.2. Environmental and Economic Simulation Tool—VERIFY
The VERIFY platform [40] is an integrated online platform to support life-cycle assessment (LCA) and life-cycle cost (LCC) analyses in building energy renovation projects. The platform is developed by the Hellenic Research and Technology Centre (CERTH), specifically by the Chemical Process and Energy Resources Institute (CPERI) [41]. Its methodological basis is based on the ISO 14040/14044 [42] standards, which are appropriately extended to incorporate near-real-time operation data from remote monitoring systems and sensors. Through specialized tools, VERIFY enables the assessment of the environmental and economic performance of different energy upgrade scenarios, considering consumption, production and, where applicable, energy storage during the different stages of the project life cycle. The analysis is based on the exploitation of historical, estimated and, where available, actual operational data. In this way, VERIFY acts as a decision-making support tool, allowing the comparison of alternative renovation strategies based on evidence-based environmental, energy and economic criteria.
The platform applies a multi-criteria assessment, combining energy, environmental and techno-economic indicators. At the same time, it has been gradually integrated into various H2020 and Horizon Europe projects related to sustainable energy systems, which has contributed to the continuous improvement of its methodological and technical capabilities [43,44,45,46,47,48]. These different applications have allowed the expansion of the platform’s life-cycle database with emerging technologies and processes, covering multiple spatial and temporal scales. The tool has been used in multiple research studies, confirming its usefulness in different fields of application. In particular, it has been used to promote energy-efficient renovations through dynamic life cycle analysis and costing [49,50,51], as well as for the comparative life-cycle analysis of renewable energy investments in public buildings [52]. In addition, it has been applied to energy analysis and environmental impact assessment for self-sufficient non-interconnected islands [53]. At the same time, the tool supports efficient energy, environmental, and economic design in the context of energy upgrades of buildings, as analyzed in the study [54].
The life-cycle analysis used to assess the environmental and economic performance of the four renovation scenarios is conducted over a 20-year assessment period [55]. The analysis takes into consideration the primary energy demand, GHG emissions, and investment cost integrated into every material and technology that is to be implemented, together with the corresponding operational energy use, emissions, and costs accumulated throughout the project lifetime. The operating cost includes the maintenance expenses associated with the building energy systems. Specifically, an annual maintenance cost of EUR 250 is assumed for both the natural gas burner-boiler system and the air-to-water heat pump considered in the renovation scenarios, according to information provided by the Municipality of Kifissia regarding the school’s annual maintenance expenses. This value is consistent with the range of maintenance costs reported in European building studies [56].
For the purpose of this study, the school building is considered a potential participant in a renewable energy community, with surplus PV electricity exported to the grid under an assumed net-billing scheme. The economic benefits associated with electricity exports are incorporated into the life-cycle economic assessment. Beyond the building-level analysis, the integration of the renovated school into a wider renewable energy community could enable future applications involving electricity sharing among participating school buildings and other local consumers, potentially supported by physical or virtual energy storage systems. Such arrangements could contribute to increased local renewable energy utilization and reduced dependence on grid electricity imports. However, these potential community-level benefits are not quantitatively assessed in the present study and would require further investigation considering the energy demand profiles, storage capacities, and operational characteristics of the participating buildings. For the economic assessment, the selling price of excess electricity from photovoltaic systems was considered equal to EUR 0.06/kWh [57]. The cost of electricity imported from the grid is set at EUR 0.24/kWh, according to the present electricity tariffs, including VAT and municipal charges [58].
2.4. Embodied Primary Energy and GHG Emissions of Materials and Technologies
In this section, the primary energy and GHG emissions values are given for the individual technologies and materials considered in this study. This information is crucial for the assessment of both the production and installation impacts as well as the environmental contribution of end-of-life material management. The sources of information on the technical characteristics of the materials and technologies are the technical brochures of the manufacturers, while the values for the individual stages of the life cycle are derived according to the data of the SimaPro software [59]. These values are considered to cover all stages of the life cycle from production to installation. Specifically, they include the supply and processing of raw materials, their transport to the production unit, the industrial production process, packaging, and the transport of the final product to the construction site, as well as the installation phase. For the sake of simplicity, in the tables below, these phases are collectively referred to as Stage A. In addition, the values related to the end-of-life (EoL) stage of materials and technologies are listed, with an emphasis on recycling processes. These indicators reflect the primary energy and GHG emissions associated with the recovery and reintroduction of individual materials into production processes after their dismantling, replacement, or withdrawal.
In Table 5, the primary energy demand and GHG emissions for stage A and the EoL phase are given for the materials and technologies used and described in this study. The table refers to insulation materials, windows, photovoltaic systems with inverter, mechanical ventilation systems with heat recovery, and heating and cooling systems, i.e., heat pumps as well as natural gas boiler systems, which concern the current state and the renovation scenario of the examined school unit. Regarding the insulation material added to the renovation scenarios, fiberglass is selected due to its favorable fire-resistance characteristics and thermal performance. For the examined school unit, average thicknesses of 90 mm for renovation scenario 1 and 3 and 45 mm for renovation scenario 2 and 4 are to be implemented, which correspond to a volume of 316.8 m3 (Scenario 1 and 3) and 158.4 m3 (Scenario 2 and 4) over a surface of 3273 m2. Moreover, triple-glazed windows with aluminum frames are selected with a total U-value of 0.8 W/(m2·K) and a g-value of 0.5. The window area to be replaced is 470.5 m2. The photovoltaic system comprises monocrystalline PV panels with a total nominal capacity of 46.23 kW and a total module area of 210 m2, coupled with an inverter system of 50 kW nominal capacity. Eighteen MVHR units with a nominal volumetric rate of 460 m3/h are installed throughout the building, for Scenario 1 and 2, serving the classrooms, teachers’ offices and auditorium. Air-to-water heat pump systems with a nominal capacity of 160 kW, 180 kW, 200 kW and 220 kW are selected to cover the building thermal loads via fan coil terminal units for renovation scenarios 1, 2, 3, and 4, respectively. The installed capacity of the LED lighting system is calculated at 6.65 kW. In the case of the baseline scenario, the natural gas boiler is characterized by a nominal power of 450 kW. Finally, Table 6 summarizes the investment and installation costs of the examined materials and technologies. The given costs derive from the current local market prices.
Each examined material and technology is assigned a specific service lifetime, at the end of which its replacement is considered within the assessment period. The life-cycle assessment accounts for the embodied primary energy demand and GHG emissions associated with equipment replacement. Regarding refrigerants in the air-to-water heat pump systems, an end-of-life leakage rate of 15% of the remaining charge is considered [60], with the associated GHG emissions calculated based on the GWP of the refrigerant used.
Table 5.
Primary energy demand and GHG emissions from construction to installation and end-of-life for examined materials and technologies.
Table 6.
Investment and installation costs for the technologies and materials.
2.5. Basic Mathematical Formulation
The coefficient of performance (COP) for the electrically driven heat pump systems is defined as the division of the heating thermal input, Qheat [kW], by the electrical consumption, Pel,heat. Correspondingly, the energy efficiency ratio for the cooling mode is defined as the division of the cooling thermal input, Qcool [kW], by the electrical consumption for cooling, Pel,cool [kW] [67].
The seasonal indicators of SCOP and SEER are calculated using the annual energy quantities, E [kWh], namely:
For the assessment of the indoor thermal comfort environment, the indicators of predicted mean vote (PMV) and predicted percentage of dissatisfied (PPD) are used, derived from Fanger’s model [68]. These indicators are calculated by taking into account indoor air temperature, mean radiant temperature, humidity, air velocity, and the personal factors of clothing and metabolic rate [69]. Specifically, the PMV indicator is calculated as [70]
where M [W/m2] stands for a person’s metabolic rate and L [W/m2] for total specific energy losses. The PPD thermal indicator is subsequently calculated as [36]
PMV = [0.303 · e−0.036·M + 0.028] · [M − L],
For the calculation of the PMV and PPD indices, the occupants’ metabolic rate is set to 70 W/m2, which corresponds to 1.2 met, representing typical sedentary educational activities performed by students in junior high school and high school classrooms, including attending lectures, reading, writing, and studying, in accordance with ISO 7730 [71] and ASHRAE 55 [72]. Additionally, the thermal insulation of students’ and teachers’ clothing ranges between 1.0 clo or 0.2325 [(m2·K)/W] for the winter period and 0.5 clo or 0.0775 [(m2·K)/W] for the summer period [73]. The indoor air humidity and indoor air velocity are assumed to be constant and equal to 40% and 0.1 m/s, according to the reference values proposed in the technical guidelines of the Greek legislation [25] and ISO 7730 [71]. The mean radiant temperature is calculated according to the following equation considering the interior surface area Ai and inner surface temperature Ts,in of each building envelope component (i) exposed to the outdoor environment [70].
Thermal comfort calculations regard the entire entity of the school. The energy simulation and thermal comfort simulation are conducted by taking into consideration that the entire school building belongs in the same thermal zone.
Global warming potential (GWP) is a fundamental environmental indicator that represents the total greenhouse gas emissions generated over the entire lifetime of a project. The GWP index comprises the embodied emissions, IGHG [kgCO2-eq], that relate to the production, transportation, and installation phase of a component or technical system [74], and the operational and maintenance emissions, OGHG [kgCO2-eq], that incorporate emissions associated with energy consumption, maintenance, replacement, or renovation activities of individual systems [75].
The lifetime GWP emissions, indicated as LGWP, are calculated as
where N stands for the years of the analysis period, and TF [m2] is the building treated floor area that is thermally conditioned.
Greenhouse gas (GHG) emissions that stem from imported energy are calculated based on annual energy consumption, ECk [kWh], of each type of fuel or electrical energy, k, and the corresponding emissions factor, EFk, that depends on country, energy mix, and year reference, as
For Greece, the GHG emissions factor (EF) of grid electricity is considered to be equal to 0.411/kWh [76]. This value represents the most recent official EF of the Greek electricity generation system and results from the electricity mix consumed in the country, including both domestic production and cross-border exchanges, imports and exports of electricity, according to official data of the European Union for the year 2021. For natural gas, the corresponding EF is obtained as 0.261 /kWh [76], while for local renewable electricity generation, the EF for photovoltaics (PVs) is considered to be equal to 0 /kWh, because PV electricity generation does not lead to direct GHG emissions during operation [77].
Life-cycle primary energy demand (PED) is a key environmental indicator, as it captures the total primary energy required over the lifetime of a project. The total primary energy demand, LPED [kWh], is derived from the integrated primary energy demand, IPED [kWh], which refers to the energy required for the production, transport and installation of the new structural elements and technical systems of the project, and the operating primary energy demand and maintenance energy [78], OPED [kWh], which refers to the energy consumed during the use of the building, such as for heating, cooling, lighting and other electrical consumption, as well as the energy related to maintenance, repair or replacement of elements [79].
The overall indicator is calculated for an analysis period of N years as follows:
Primary energy factors are differentiated depending on the country, the energy mix and the reference year. In VERIFY, primary energy factors are used according to relevant European studies and databases [80,81]. More specifically, the primary energy factor (PEF) for grid electricity in Greece is considered equal to 2.1 [82], while the PEF for natural gas is set equal to 1.05 [25,]. For electricity produced from renewable sources, a primary energy factor equal to 1.0 is adopted, according to the Natural Energy Content Method [83]. According to this method, the PE equivalent of electricity produced by solar systems is equal to the electricity produced; therefore, it corresponds to an assumed conversion efficiency of 100%.
The self-consumption of electricity from renewable energy systems (RES) indicator expresses the percentage of electricity produced by the PV system, REPV [kWh], that is consumed directly by the building, SC [kWh] [84]. It is an indication of the building’s ability to utilize the on-site electricity produced from renewable energy sources, reducing dependence on the grid. Higher values of the index indicate better utilization of on-site electricity. The index is calculated as
The energy self-sufficiency indicator expresses the percentage of the total building electricity consumption, Elcons [kWh], covered by self-consumed electricity from on-site renewable production, SC [kWh] [85]. A higher value of the index indicates a greater coverage of the electrical needs from on-site renewable production and, therefore, increased energy autonomy. It is an indication of the degree of independence of the building from the electricity grid. The index is calculated as
The life-cycle cost, LCC [EUR], is an important economic indicator for assessing the total cost of a project over its lifetime. It allows the overall assessment of the economic performance of different energy renovation scenarios, supporting the selection of the most cost-effective solution. The LCC indicator constitutes the investment cost, IC [EUR], which relates to the purchase, transfer, and installation of new components or systems, as well as their possible replacements during the analysis period [86], the operating costs, OC [EUR], that include the cost of electricity or fuel consumption and several building maintenance costs [87], and finally the residual values, VR [EUR], which correspond to the value of the items that have not been fully depreciated at the end of the analysis period. It is determined on the basis of its remaining life, using linear depreciation, assuming that the item is fully depreciated at the end of its useful life [88]. The LCC indicator is calculated as
Operating costs do not include revenues that may stem from the building operation, for instance, revenues from the export of electricity from RES to the grid [89]. For all annual costs, a price discount rate, r, of 5% [90] is applied, to be expressed in present value, D [EUR], based on the undiscounted value of the costs in year (i):
The whole life cost (WLC) indicator represents the net cost of a project throughout its lifetime. The basic difference between WLC and LCC lies in the fact that WLC takes into consideration possible revenues that come from the building operation, R, expressed in present value terms [91], for instance, revenues from the export of excess electricity to the grid under a net billing scheme. WLC is calculated for the entire building as an annual price according to the following equation:
The payback period (PP) [years] is based on the difference in annual operational cost between the baseline scenario, OC,bl [EUR], and the renovation scenario, OC,ren [EUR], and is defined as the point in time at which the accumulated annual cost savings become equal to or greater than the initial investment cost of the upgrade, [EUR], according to the following repayment condition:
Net present value (NPV) expresses the difference between the present value of income or savings and the present value of the corresponding expenditure during the analysis period, considering the value of money over time through a discount rate [92]. A positive NPV value indicates that the investment is financially advantageous. Cash flow is denoted as CF [EUR], and the NPV ratio [EUR] is calculated as
The internal rate of return (IRR) expresses the discount rate at which the net present value of all future cash flows is zero. It is the interest rate at which the investment is at the point of economic equilibrium, with no net profit or loss in present value. A project is generally considered financially viable when the IRR ratio is higher than the selected discount rate of the analysis. The ratio is calculated as the value of the discount rate, r, that satisfies the equation:
Return on investment (ROI) expresses the net economic benefit of an investment relative to its initial cost, without considering the value of money over time, but providing a direct indication of whether the investment is paying off financially [93]. A positive ROI value indicates that the investment yields a net financial benefit, while a negative value indicates a net financial loss. The ratio is calculated as
The marginal cost of emission reduction (MAC) assesses the efficiency of measures or investments aimed at reducing greenhouse gas emissions. The indicator is particularly useful for prioritizing renovation scenarios based on the cost per ton of avoided emissions. A negative MAC value means that the measure leads to both emission reductions and economic savings [94]. On the contrary, a positive MAC value means that a net cost is required to achieve the specific emission reduction. To compare an upgrade scenario with the baseline, the indicator of the net present value of the current situation and the scenario is divided by the annual CO2 equivalent emissions avoidance of the scenario compared to the current situation:
3. Results
In this section, the results of energy simulation, the environmental assessment, and the life-cycle cost analysis are presented for the baseline scenario and each of the investigated renovation scenarios. A comparative evaluation is first conducted based on the main energy, environmental, and economic indicators, while analytical and dynamic results are given for the optimum renovation scenario in each case.
3.1. Energy and Thermal Comfort Assessment
3.1.1. Baseline Scenario: Verification and Energy Assessment
The first step in the energy assessment analysis is the investigation of the baseline scenario, which will serve as a reference in the comparative analysis of the different renovation scenarios. The energy metrics are thoroughly presented, while a verification study using the available electricity and natural gas bills provided by the school unit’s administration office is performed. Figure 1a illustrates the heating load and the heating energy demand of the investigated school unit. The annual heating energy demand is found to be 78,966 kWh, while the maximum heating load is found to be 381.4 kW. Correspondingly, Figure 1b depicts the fuel consumption load and cumulative consumption for the entire year. The annual fuel consumption is found to be 92,358 kWh, indicating an annual efficiency ratio of the natural gas boiler of 85.5%. Moreover, Figure 1c presents the electrical load and electricity demand for lighting and appliances, with an annual electricity consumption of 27,850 kWh. The school unit operates during the school calendar, and therefore, during holidays and weekends, heating energy demand is assumed to be zero.
Figure 1.
(a) Heating load and heating energy demand, (b) fuel consumption load and cumulative fuel consumption for heating, and (c) electrical load and electricity demand for lighting and appliances for the baseline scenario.
Figure 2 depicts the monthly total electricity consumption of the school unit, according to the electrical bills and the energy simulation results. The absolute maximum deviation between the two datasets is observed for July, and it is calculated at 41.6%. This relatively high discrepancy may be attributed to a temporal mismatch between actual electricity consumption and its allocation to the corresponding billing period. On an annual basis, electricity consumption according to bills amounts to 26,600 kWh, and according to the energy simulation, it is calculated at 27,851 kWh. The absolute deviation between measured and simulated data is found to be only 4.6%, indicating a high level of accuracy. The accuracy of the developed energy model is further evaluated using the Normalized Mean Bias Error (NMBE) and the Coefficient of Variation of the Root Mean Square Error (CV(RMSE)), based on monthly energy consumption data [95]. For electricity consumption, the calculated NMBE and CV(RMSE) are calculated at −5.13% and 17.39%, respectively, indicating moderate agreement between simulated and billed consumption. These findings highlight the limitations of relying exclusively on annual energy consumption comparisons to assess model accuracy, as discrepancies in monthly consumption profiles may remain despite close annual agreement. The only available natural gas consumption data correspond to the annual consumption recorded for 2025, amounting to 92,600 kWh. The corresponding simulated natural gas consumption is calculated at 92,358 kWh, resulting in an absolute relative deviation of only 0.3%. This close agreement indicates satisfactory accuracy in estimating the building’s annual natural gas consumption, although it does not necessarily reflect the model’s ability to reproduce monthly consumption patterns.
Figure 2.
Monthly total electricity consumption according to bills and energy simulation analysis.
3.1.2. Comparative Energy Analysis of Renovation Scenarios
The energy renovation scenarios are investigated and compared regarding the annual building energy performance. All investigated scenarios incorporate the replacement of the polluting, inefficient natural gas boiler with an electrically driven air-to-water heat pump system in conjunction with fan coil terminals distributed throughout the building. Additionally, all scenarios include the installation of rooftop PV systems, the replacement of windows, the enhancement of thermal envelope airtightness, and the replacement of fluorescent with LED lighting. The interventions that differentiate the examined scenarios are the thickness of added thermal insulation and the installation of MVHR.
According to the energy simulation analysis, the renovation scenario that presents the optimum energy performance is renovation scenario 1. This scenario is characterized by the addition of the full thermal insulation thickness, leading to the lowest mean thermal transmission value of the thermal envelope, and the installation of the MVHR. The annual energy demand for space heating is calculated at 16,480 kWh, indicating a 79.13% reduction compared to the baseline scenario, while the maximum space heating load is calculated at 122 kW, which is reduced by 68.01%. The annual electricity consumption of the heat pump is found to be 4120 kWh. The positive effect of insulation addition is evident in comparison with renovation scenario 2, where the annual heating energy demand presents only a 73.51% reduction with reference to the baseline scenario. Moreover, the controlled air renewal via MVHR is of primary importance to the thermal behavior of the building. Its absence results in substantially higher heating energy demand, due to uncontrolled natural ventilation. Specifically, the additional heating energy demand amounts to 13,493 kWh when comparing scenarios 1 and 3 and to 13,830 kWh when comparing the less-insulated scenarios 2 and 4.
In terms of thermal behavior during the cooling period, scenario 1 also demonstrates superior performance. The annual energy demand for space cooling is calculated at 2778 kWh, with a corresponding electricity consumption of 695 kWh, and a maximum space cooling load of 37 kW. A direct comparison with the baseline scenario is not considered meaningful, since the building in its current state is not equipped with a space cooling energy system. Additionally, for cooling, MVHR presents a more important effect on the building thermal behavior. This is shown by the comparison between scenarios 1 and 3, where the absence of MVHR results in an additional cooling energy demand of 1431 kWh. In contrast to the heating season, however, a lower insulation thickness is more beneficial for building thermal behavior. Scenario 2 presents a lower annual cooling energy demand, equal to 258 kWh. The difference is attributed to the increased thermal resistance of the building envelope through thermal insulation, which restricts thermal discharge during night non-operating hours. Therefore, part of the heat accumulated during the day remains inside, increasing cooling requirements during subsequent operating hours.
The hourly thermal load for space heating and space cooling for the baseline and renovation scenario 1 are illustrated in Figure 3. It is underlined that no space cooling energy system exists in the baseline scenario. It is interesting to notice that during the transitional spring and autumn months, the kind of thermal load differs between the baseline and renovation scenarios. More specifically, according to the simulation analysis, the baseline scenario exhibits a heating energy demand that extends until approximately the middle of May, whereas in renovation scenario 1, cooling energy demand emerges during the first week of May. Similarly, at the beginning of the heating season, the baseline scenario presents heating thermal loads from the first week of October, while in the renovation scenario, cooling thermal load ceases at this period. These results indicate that the following renovation strategy results in shortening the heating period, altering the building thermal response during the transitional spring and autumn months.
Figure 3.
Thermal load for space heating and cooling for the baseline scenario and renovation scenario 1.
Electricity consumption for lighting and appliances is reduced by 23.81% across all examined renovation scenarios compared with the baseline scenario. This reduction reflects the combined effect of electricity savings from lighting and appliances and the additional electricity demand associated with the operation of the mechanical ventilation systems with heat recovery (MVHR). The annual electricity consumption of the MVHR systems is calculated at 994.5 kWh and is included in the reported total. Thus, the net reduction of 23.81% already accounts for the additional electricity demand of the MVHR systems. Despite the installation of the heat pump system, the total electricity consumption is calculated at 26,035 kWh, presenting a 6.52% reduction. Finally, the total PV electricity production is calculated at 71,115 kWh, a quantity that is similar for all investigated scenarios. In Figure 4, the total electricity consumption for the heat pump system, lighting, and appliances is illustrated against the PV electricity production. According to the simulation results, 18.82% of the PV-produced electricity is self-consumed, while the remaining surplus is exported to the energy community at a relatively low remuneration tariff. The relatively limited self-consumption rate is attributed to the school operating schedule, particularly during summer months and the early afternoon hours, when PV electricity generation is high while the school unit remains largely unoccupied and electricity demand is consequently low. However, the self-sufficiency rate reaches 51.73%, indicating a considerable contribution of the PV rooftop system to reducing the building’s dependence on the electrical grid, despite the temporal imbalance between electricity production and demand. Figure 5 illustrates the hourly electrical load that is imported from the grid, the hourly electricity load exported to the grid and the self-consumed electricity produced from the PV system. Finally, the annual energy quantities for every investigated renovation scenario are summarized in Table 7.
Figure 4.
Total electricity consumption and PV electricity production for renovation scenario 1.
Figure 5.
Hourly electrical load import, export and self-consumption for renovation scenario 1.
Table 7.
Annual energy quantities for the baseline and renovation scenarios of the investigated school unit.
3.1.3. Indoor Thermal Comfort Assessment
The implementation of various interventions influences not only the energy performance, but also the indoor thermal environment of the building. For this reason, the thermal comfort indicators of PMV and PPD are calculated for the entire building, as an additional assessment aspect between the baseline and renovation scenario 1. This approach only contributes to general results, and not more specific ones, to draw some general conclusions.
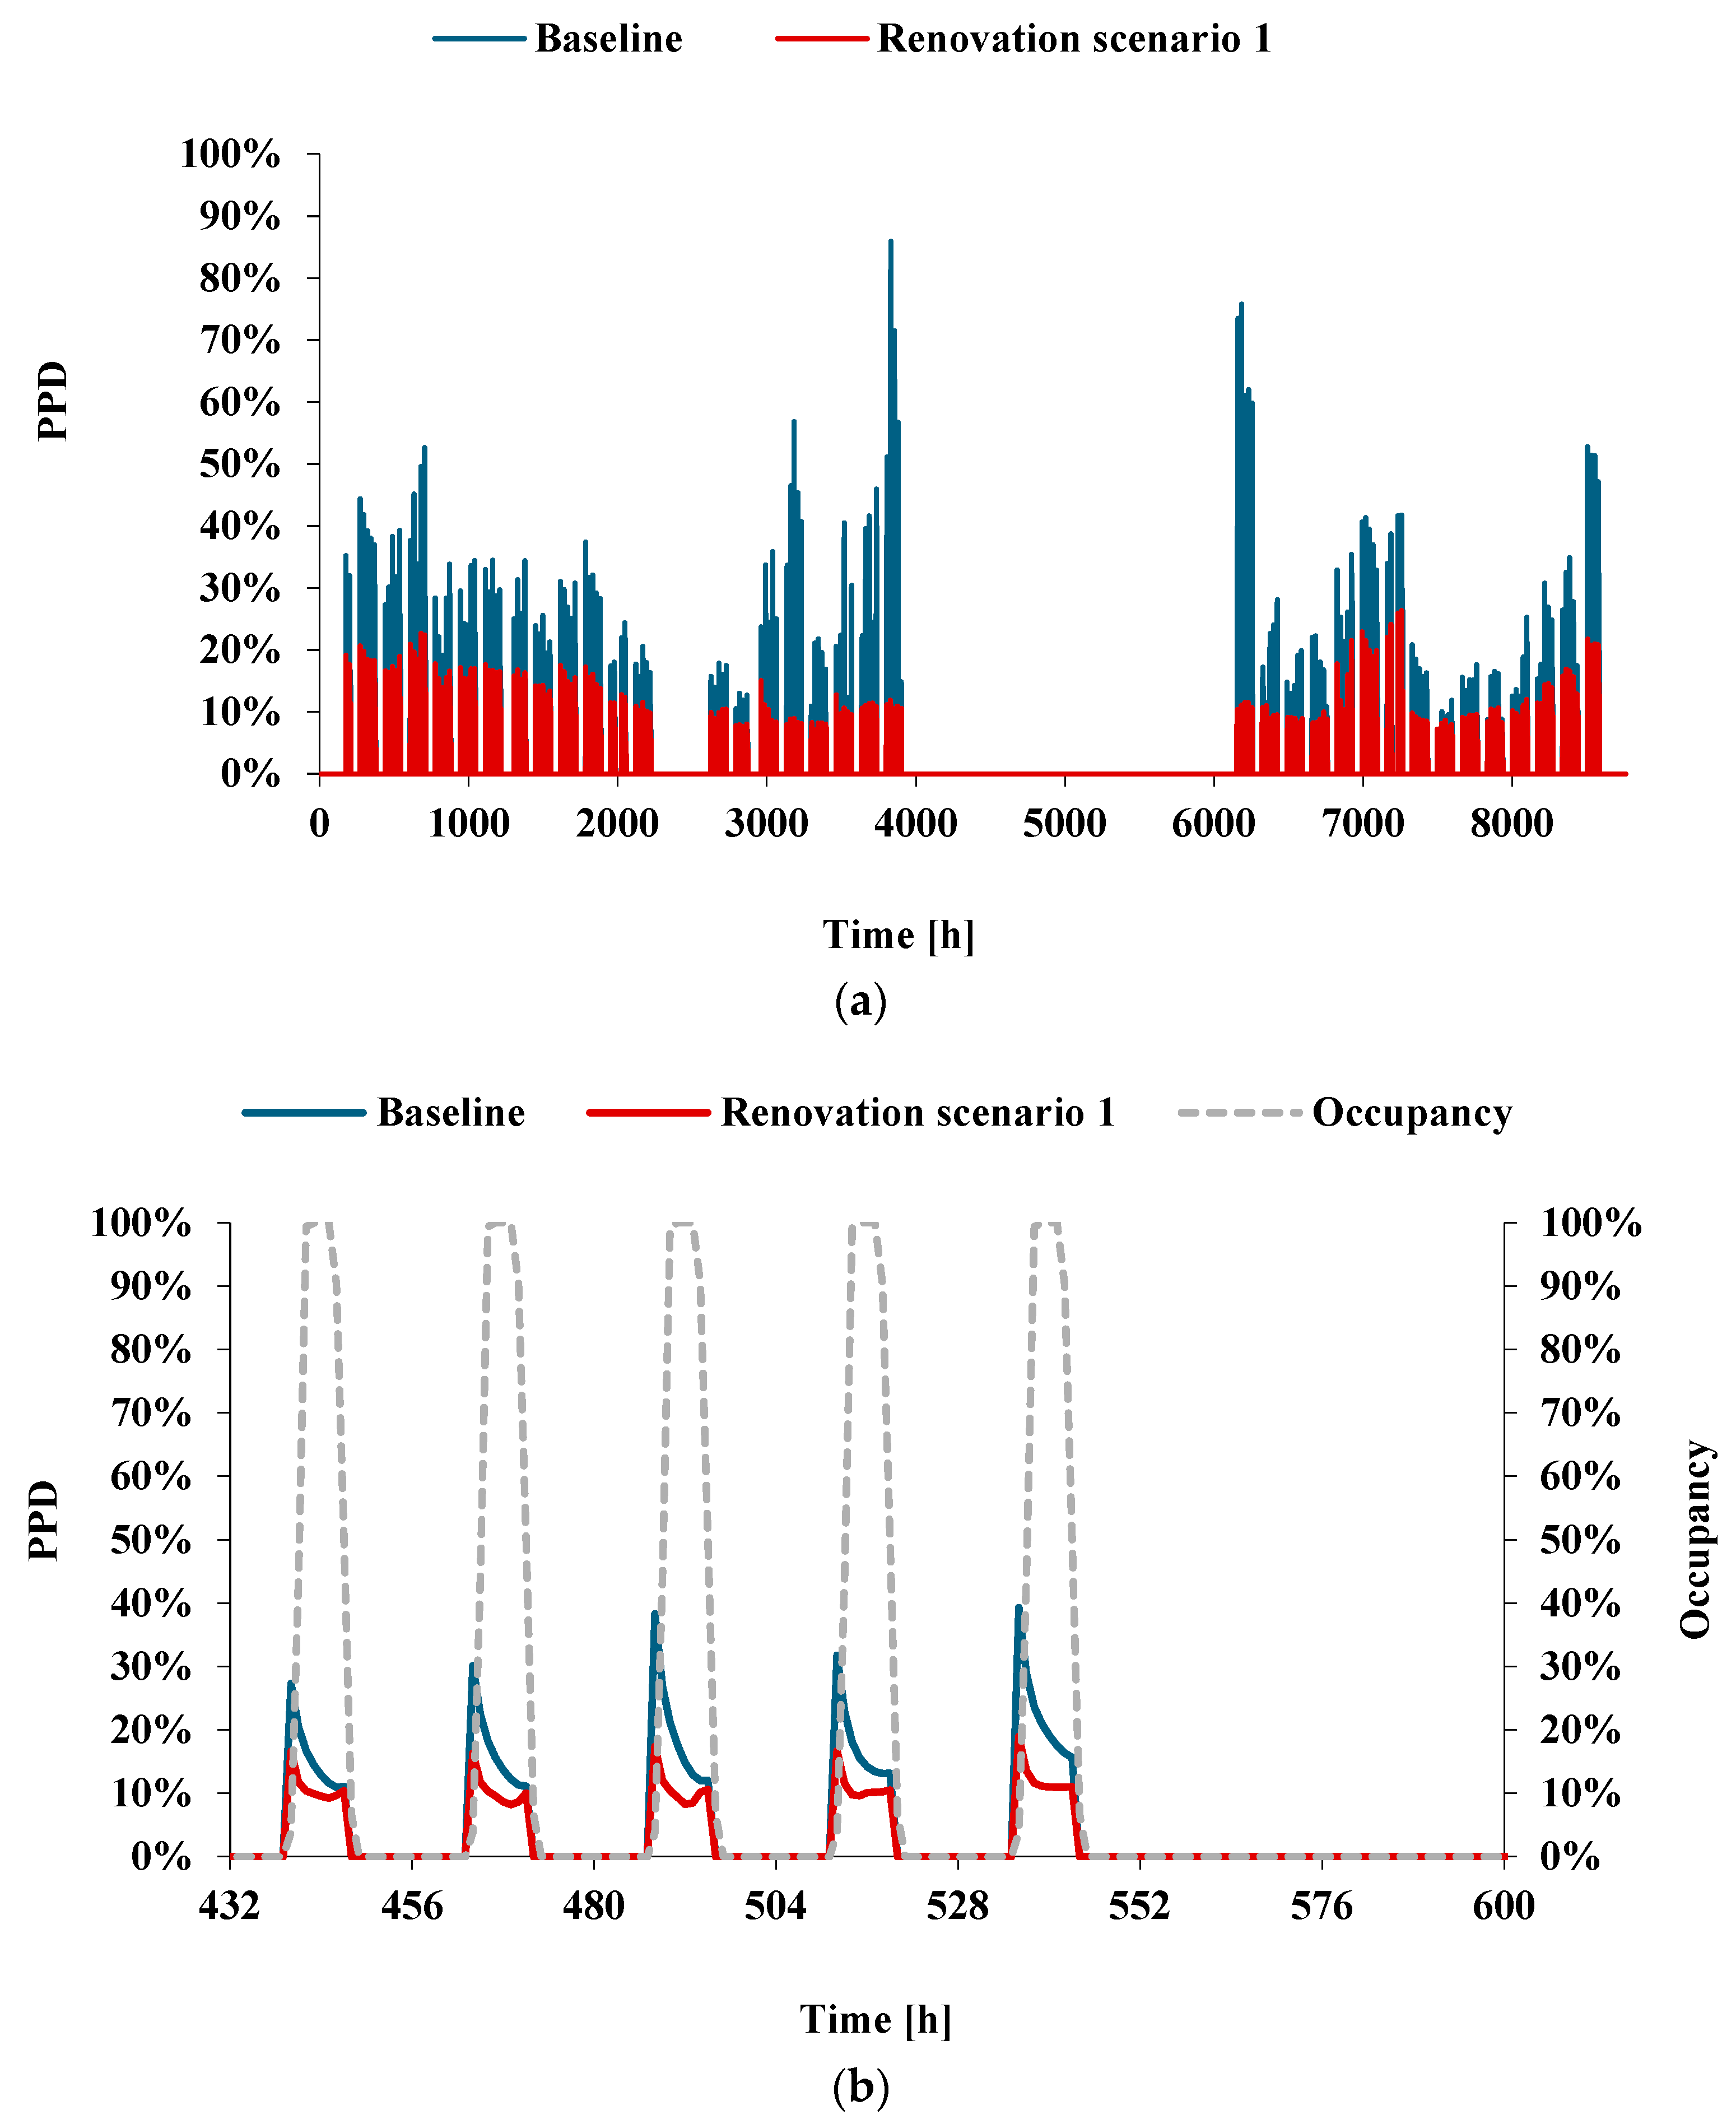
Figure 6a illustrates the average indoor air temperature of the school unit, calculated over the entire thermally conditioned volume of the building. According to the simulation results, the renovation scenario is characterized by higher indoor air temperature during the heating season in comparison with the baseline scenario. The figure presents the indoor air temperature plotted throughout the entire year, including holidays and weekends. It is important to note that, during the non-operating periods, the energy systems remain inactive and therefore, the air temperature drops below 20 °C after the end of the school operating hours. This behavior is explicitly presented in Figure 6b. The indoor thermal environment is reflected in the thermal indicator of PPD, depicted in Figure 7. Higher PPD values are observed during the first hour of morning operation, and the last hour of afternoon operation, when the indoor thermal conditions have not yet reached, or begin to depart from, the desired thermal comfort requirements, while the school unit is mainly occupied by the cleaning personnel, instead of students and teaching staff. The annual average PPD index calculated for the entire school building during its operation hours is 16.02% for the baseline scenario. The value drops to 8.93% for renovation scenario 1, corresponding to a reduction of 7.09 percentage points and indicating a substantial improvement in indoor thermal comfort.
Figure 6.
Indoor dry bulb air temperature of the baseline and renovation scenario 1 for (a) the entire year, and (b) for two weeks in heating season.
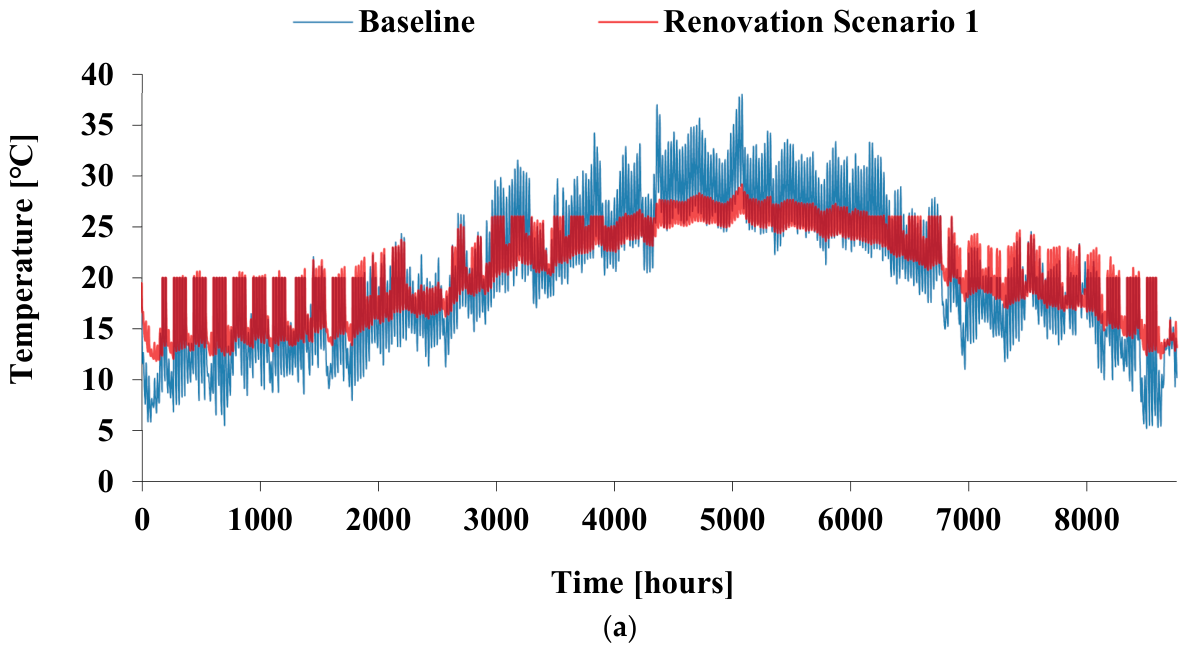
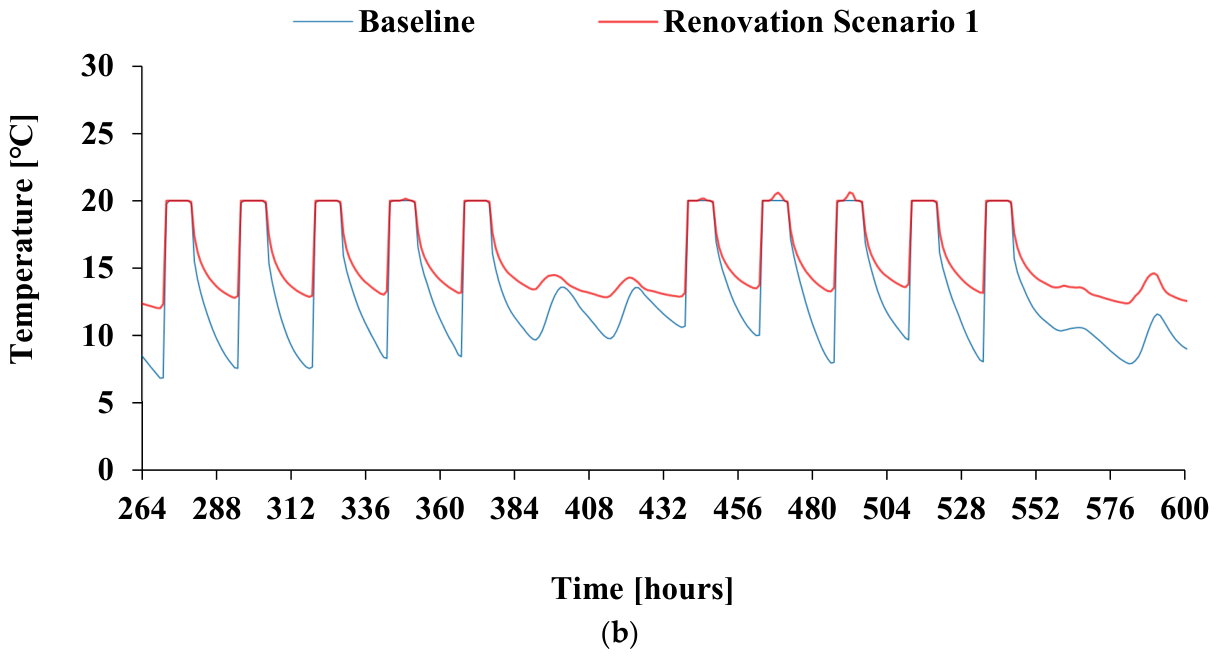
Figure 7.
Thermal comfort indicator PPD for the baseline and renovation scenario 1 for (a) the entire year, and (b) a week during the heating season, against occupancy profile.
3.2. Life-Cycle Environmental Assessment
A comparative life-cycle assessment is performed for the four examined renovation scenarios, each of which is directly compared to the baseline scenario, which serves as a reference for evaluating the lifetime environmental performance of the proposed renovation strategies. The assessment is based on fundamental indicators related to lifetime primary energy demand and lifetime GHG emissions, both calculated as the sum of embodied and operational contributions.
The annual primary energy consumption of the school unit is given for a 20-year period of operation in Figure 8a, for its existing state and for every investigated energy upgrade scenario. According to the analysis results, the annual primary energy demand for the baseline scenario peaks in the year 2035 due to the replacement of the existing fluorescent lighting system. Fluorescent lighting is considered to have a lifespan of 16 years [96] and to be halfway through its lifetime at the start of the project. For every examined case, a gradual increase in the annual primary energy consumption is observed, a phenomenon linked to degradation, which, for the purpose of the study, is considered to be equal to 1% [97]. In Figure 8b, the results focus on the four energy upgrade scenarios. According to the results of the comparative study, Scenario 1 consistently leads to lower annual primary energy consumption compared to any other energy upgrade scenario. Compared to the baseline scenario, renovation scenario 1 presents an annual decrease in primary energy demand that ranges between 77.17% and 78.69%.
Figure 8.
Annual primary energy demand for (a) the baseline and the four renovation scenarios, and (b) for the four renovation scenarios.
For the comparison of the four scenarios, the total embodied and operational energy demand is calculated and summarized in Table 8 for the baseline and each of the four examined renovation scenarios. According to the results of the analysis, every renovation scenario achieves full depreciation of the initial-phase embodied primary energy, achieving lower total values compared to the baseline scenario. Despite the fact that the embodied primary energy in the start-up year is estimated to be higher for Scenario 1 compared to the rest of the scenarios, the consistently lower operational primary energy demand ultimately results in more energy-efficient behavior and overall lower primary energy consumption. The total primary energy for Scenario 1 is calculated at 1188 MWh.
Table 8.
Total embodied and operational primary energy demand for the baseline and four renovation scenarios.
The relatively high specific total energy demand of the school unit can be attributed to the large number of implemented interventions, the extensive building surface and conditioned volume, and the high installed capacities of energy systems. These characteristics result in considerable embodied primary energy requirements, and consequently, elevated values of the total and specific total primary energy demand.
The annual greenhouse gas emissions during the investigated 20-year period are presented in Figure 9a for the existing state of the investigated school unit, as well as for the four renovation scenarios. In the baseline case, a maximum in the annual GHG emissions is observed in the year 2035, attributed to the replacement of the fluorescent lighting system with LED lighting. Figure 9b focuses on the four investigated renovation scenarios. According to the analysis, scenario 1 results in the lowest annual GHG emissions among the four scenarios, with an annual decrease, compared to the baseline case, that ranges between 85.73% and 92.23%. For every case, a gradual increase in the annual GHG emissions is observed, which is explained by the reduction in the energy system efficiency, considered at an equal magnitude of 1%. Additionally, Figure 10 illustrates the payback of the embodied GHG emissions of the examined renovations. According to the calculations, the depreciation of the initial embodied greenhouse gas emissions is completed at 7.37 years for Scenario 1, 7 years for Scenario 2, 7.65 years for Scenario 3, and 7.43 years for Scenario 4.
Figure 9.
Annual GHG emissions for the (a) baseline scenario and four renovation scenarios, and (b) four renovation scenarios.
Figure 10.
Payback of embodied GHG emissions for each of the four renovation scenarios.
Figure 11 and Table 9 summarize the total GHG emissions related to the installation of the various technologies and materials as well as the operation of the school building for the full duration of the life-cycle analysis for the baseline scenario and each of the four scenarios under study. According to the results, payback is achieved for every renovation scenario; however, Scenario 1 is distinguished by the lowest total greenhouse gas emissions, equal to 336,196 for the full life cycle. The existence of MVHR emerges as decisive for the final sum of the operational emissions of the school units under study. Specifically, when comparing Scenarios 1 and 3, which are characterized by the application of full-thickness thermal insulation but differ in terms of the existence of MVHR, the difference in total operating emissions is estimated at 40,423 kgCO2-eq. Respectively, for Scenarios 2 and 4, in which half the thickness of thermal insulation is applied and the differentiation also concerns the existence or not of MVHR, the difference in total operating emissions is estimated at 35,506 kgCO2-eq. The difference in total operating emissions for the group of Scenarios 2 and 4 is smaller than the corresponding one between Scenarios 1 and 3. This can be attributed to the fact that the most intensely thermally insulated buildings show an increased need for controlled ventilation and removal of thermal loads, especially during the summer months of school operation. Regarding the effect of thermal insulation thickness, the comparison of the scenarios that differ in terms of the application of full- or half-thickness thermal insulation also shows significant differences in operational emissions. In particular, the difference between Scenarios 1 and 2 is calculated at 16,984 kgCO2-eq, while for Scenarios 3 and 4, it amounts to 12,067 kgCO2-eq. These results confirm the significant contribution of adequate thermal insulation to the reduction of energy requirements and, by extension, to the reduction of operational emissions of school buildings.
Figure 11.
Total GHG emissions of installation and building operation for the baseline and the four renovation scenarios.
Table 9.
Total embodied and operational GHG emissions for the baseline and four renovation scenarios.
3.3. Life-Cycle Cost Analysis
Finally, an economic evaluation of the examined renovation strategies is conducted. Key economic indicators are calculated to assess the economic performance of the investigated renovation strategies, aiming to verify that the energy and environmental optimum renovation scenario is also discerned as the economic optimum one.
The annual operational cost of the investigated school in the existing state and in each of the four renovation scenarios is depicted in Figure 12. The presented costs include energy consumption expenditures but exclude revenues generated from the export of surplus electricity to the grid under the net-billing scheme. These revenues are accounted for separately in the calculation of the whole life cost indicator. According to the calculations, Scenario 1 is characterized by the lowest annual operating costs over the entire project lifespan, with a cost reduction equal to 74.51% compared to the baseline scenario. However, despite the substantially lower operating costs associated with the renovation scenarios investigated, none of the scenarios are expected to achieve full payback of the initial investment within the 20-year analysis period. Annual cash-flow tables are presented in Appendix A for each examined scenario over the 20-year assessment period, providing a detailed breakdown of electricity import costs, revenues from electricity exports, maintenance expenditures, equipment replacement costs, and residual values. All future costs and revenues are discounted to their present values using a discount rate of 5%.
Figure 12.
Annual operational costs for the baseline and renovation scenarios.
Table 10 summarizes the total investment and operating costs for each renovation scenario under study and for the existing state over the full duration of the life-cycle analysis. Among the investigated scenarios, Scenario 4 is the one characterized by the lowest total investment and operating costs, compared to the other scenarios, equal to EUR 509,119, although leading to no economic payback. According to the economic indicator presented in Table 11, all renovation scenarios result in higher specific WLC and LCC than the Baseline scenario. All renovation scenarios exhibit negative net present values, ranging from EUR −183,136 for Scenario 2 to EUR −176,695 for Scenario 4, indicating that the initial investments are not fully recovered over the analysis period. This is also reflected in the low internal rates of return (1.45–1.54%) and the negative ROI values, which range from −39.13% to −34.40%. Among the investigated alternatives, Scenario 1 demonstrates the lowest marginal abatement cost of EUR 413.35/tCO2-eq, which corresponds to the greatest cost-effectiveness in achieving life-cycle GHG emission reductions.
Table 10.
Total installation and operational costs for the baseline and four renovation scenarios.
Table 11.
Key economic indicators of the investigated renovation scenarios.
4. Discussion
The selection of insulation materials for newly constructed or renovated buildings is commonly based on the investment cost. However, thermal properties, fire resistance, and environmental impact should also be considered to ensure a more comprehensive and sustainable material selection process. Fiberglass, stone wool and extruded polystyrene (XPS) are some of the most commonly applied insulation materials observed in building projects. From a cost perspective, fiberglass is characterized by a lower investment cost, followed by stone wool and XPS [98,99]. Fiberglass and rock wool are fibrous inorganic thermal insulation materials, as well as extruded polystyrene, which belongs to the category of organic foaming materials. They are characterized by high thermal insulation performance; however, they differ significantly in terms of their behavior in fire conditions. In particular, rock wool exhibits high fire resistance and non-combustible behavior, according to ASTM E136 [100], which makes it suitable for applications where increased fire protection is required. Similarly, fiberglass, as a mineralogenic fibrous material, is classified in the Euroclass A1 category according to EN 13501-1 [101], which suggests that it does not contribute substantially to the development or spread of fire. In contrast, extruded polystyrene, due to its organic polymer composition, exhibits a lower fire protection behavior and is usually classified in the Euroclass E or E-d0 category. This classification indicates increased susceptibility to fire compared to inorganic fibrous materials and, consequently, the need to apply an appropriate protective coating or its incorporation into structural systems that ensure adequate fire safety [102]. A final crucial parameter in the selection of the most appropriate thermal insulation material is the primary energy demand for its production and transportation to the project site. Among the three insulation materials investigated, fiberglass is characterized by the lowest embodied primary energy demand. Its environmental performance is further favored by its domestic production in northern Greece, which reduces the energy requirements and associated impacts of transportation.
In the present study, the addition of insulation material to the building thermal envelope is investigated by considering the full thickness in scenarios 1 and 2, and half of this thickness value in scenarios 3 and 4. The results indicate that increasing the insulation thickness results in only limited additional energy savings of 5.6% for the mechanically ventilated pair of Scenarios 1 and 2, whereas a higher reduction of 22.3% is observed for the corresponding pair of Scenarios 3 and 4. This finding is consistent with the study by Bruno et al. [103], who parametrically investigate thermal envelope insulation in combination with mechanical ventilation under the Mediterranean climatic conditions, and report that insulation thickness over 12 cm only slightly enhances building thermal performance, while increasing the initial cost. However, it is interesting to notice that the less insulated scenarios are also characterized by slightly lower space-cooling energy demand, with reductions of 9.3% and 6.9% for the two examined scenario pairs, respectively. A similar result is reported in the study by Zhu et al. [104], who identify the heat-trap effect in highly insulated buildings. Specifically, they calculated an increase in annual cooling energy demand that ranges between 6.86% and 9.29% in climates with high temporal variation during nighttime, underlining that excessive insulation dissipates heat to the ambient during periods of lower outdoor air temperature.
Additionally, MVHR is found to significantly increase the school energy performance during the heating and cooling seasons. Specifically, comparing the pairs of scenarios 1 and 3 and scenarios 2 and 4, which differ only in the installation or not of an MVHR, it is found that the additional savings in energy demand for heating are equal to 17.1% and 17.51%. This result is verified by Stabile et al. [14], who reported that the controlled air renewal in classrooms reduces heating energy demand by 32% in comparison to the typical manual window air renewal tactic. A high energy savings performance is also reported by Shuailing et al. [105], with up to 35.3% heating energy saving potential in low-energy-consumption buildings. Given the school calendar and the fact that, during summer months, the school unit is out of operation, MVHR is linked to greater heating rather than cooling energy savings, a conclusion that is also verified in the study by Monge-Barrio et al. [106].
Deep energy retrofit of school buildings is found to be an economically inviable project that requires subsidies to become financially attractive. According to the findings of the present study, the economic payback of the renovation scenario that exhibits optimal energy, environmental, and economic performance is not achieved within the first 20 years of the project. This finding is in agreement with the study by Stavrakakis et al. [107], who underline that deep energy retrofit strategies combining thermal envelope enhancement and RES integration are linked to payback periods that range between 20 and 30 years. Despite the direct reductions in the annual operational cost and space heating energy demand that a renovation strategy can result in, economic viability is not necessarily guaranteed. In the present study, for instance, the annual heating energy demand is reduced by over 73%. A similar conclusion is drawn in a case study of a deep retrofit project of a school unit in Poland that is investigated by Michalak et al. [108]. Specifically, they report that a holistic renovation approach can result in significant space heating energy demand reduction, approximately 64%, but still be characterized by a rather long payback period of 35.6 years.
Selecting retrofit interventions that deliver robust returns is a solution to increasing the financial attractiveness of a school renovation project. According to a study by Karakosta and Vryzidis [109], the application of ceiling thermal insulation and the installation of an efficient lighting system are identified as low-cost and economically efficient energy interventions. On the other hand, capital-intensive interventions are characterized as those that are associated with the thermal upgrade of wall components and the replacement of windows. This explains the negative net present value and low internal rate of return that are calculated for the renovation scenarios in this study. However, pursuing keeping the initial investment cost of a renovation as low as possible operates as a trade-off to achieving the optimum possible energy performance and self-sufficiency. This is also underlined in the study by Luo et al. [6], where securing a low payback period of 22.3 years reduces the energy-saving potential to only 32% and treats the PV installation as a capital-intensive measure.
5. Conclusions
In the present study, a multi-level assessment of the deep energy upgrade of the 2nd Junior High School and the 2nd High School of Kifissia is thoroughly investigated on the basis of energy, environmental, and economic criteria. The selected school building is considered representative of older Greek school buildings in terms of its construction characteristics and size, reflecting features commonly found in the existing Greek school-building stock. For this purpose, four different holistic renovation strategies are investigated, comprising multiple passive building envelope technologies and energy systems interventions. Beyond the scope of the present analysis, the upgraded school building could potentially serve as a local energy hub, integrating renewable energy production, community-based storage, and electricity sharing with nearby consumers, with the aim of enhancing local renewable energy utilization, reducing grid dependence, and improving energy resilience at the municipal level. The main conclusions to be drawn are summarized below:
- •
- The holistic energy renovation of the school unit results in thermal enhancement, with calculated heating energy savings that amount to 79.1%, and a 7.09 percentage point enhancement of indoor thermal comfort conditions during the school occupied hours.
- •
- The addition of thermal insulation with an average thickness value of 9 cm to the building rooftop, external wall, and ground slab, combined with the installation of a mechanical ventilation system with heat recovery, emerges as a fundamental and high-priority renovation intervention.
- •
- The integration of rooftop photovoltaics combined with the enhancement of the building thermal behavior and high-efficiency electrically drive heat pump system results at a satisfactory self-sufficiency rate of 51.7% and a self-consumption rate of 18.8%.
- •
- Scenario 1 results in the maximum achieved decrease in annual operational primary energy demand, calculated at 78.7%. By taking into consideration the embodied impact, the specific total primary energy demand of the school unit is decreased by 52.18%, reaching 1188 kWh/m2.
- •
- The maximum annual reduction in operational greenhouse gas emissions is found to be 92.2%. For scenario 1, the embodied emissions of the installed technologies are offset within 7.37 years, while the specific total emissions decrease to 253.2 kgCO2-eq, indicating a 56.6% reduction compared to the baseline.
- •
- None of the investigated renovation strategies achieves economic payback, indicating that holistic renovation of the school unit is an inviable economic project. However, scenario 1 demonstrates the lowest marginal abatement cost of EUR 413.35/tCO2-eq, which corresponds to the greatest cost-effectiveness in achieving life-cycle GHG emission reductions.
The study offers valuable insights into the design of holistic renovations for school units under Mediterranean climatic conditions and can serve as a guideline for future initiatives at the municipality level. In the future, it will be important to validate simulation results against monitoring data of energy consumption and indoor thermal conditions, thereby providing evidence of the positive effect of holistic energy renovation on the quality of the indoor thermal environment.
Author Contributions
Conceptualization, A.K. and E.B.; Methodology, A.K. and E.B.; Software, A.K. and D.G.; Validation, A.K. and D.G.; Investigation, A.K. and D.G.; Resources, G.M.; Writing—original draft, A.K., D.G., E.B., G.M. and N.N.; Visualization, A.K. and G.M.; Supervision, E.B. and N.N.; Project administration, N.N. All authors have read and agreed to the published version of the manuscript.
Funding
This research was carried out in the framework of the project NEW-EPOCH (eNErgy Waste solutions through development of POsitive sChool buildings as sustainable, innovative Hubs for community engagement) co-funded by the European Urban Initiative (Project Number: EUI03-242).
Data Availability Statement
The data presented in this study are available on request from the corresponding author. (the data are not publicly available due to privacy or ethical restrictions.).
Conflicts of Interest
The authors declare no conflict of interest.
Nomenclature
| IGHG | Embodied emissions, kgCO2-eq |
| D | Present value, EUR |
| E | Energy, kWh |
| EC | Annual energy consumption, kWh |
| El | Electricity consumption, kWh |
| IRR | Internal rate of return, % |
| LCC | Life-cycle cost, EUR |
| LGHG | Lifetime emissions, kgCO2-eq |
| MAC | Marginal cost of emissions reduction, EUR/tnCO2-eq |
| NPV | Net present value, EUR |
| OGHG | Operational emissions, kgCO2-eq |
| P | Electrical load, kW |
| PED | Primary energy demand, kWh |
| Q | Thermal load, kW |
| r | Discount rate, % |
| ROI | Return on Investment, % |
| SC | Self-consumption energy, kWh |
| U-value | Thermal transmittance, W/(m2·K) |
| VR | Residual value, EUR |
| WLC | Whole life cost, EUR |
| Subscripts and superscripts | |
| bl | Baseline scenario |
| cons | consumption |
| cool | Cooling |
| el | Electricity |
| heat | Heating |
| k | Type of fuel |
| ren | Renovation scenario |
| Abbreviations | |
| CV(RMSE) | Coefficient of Variation of the Root Mean Square Error |
| EF | Greenhouse gas emission factor |
| EoL | End of life |
| GHG | Greenhouse gas emissions |
| GWP | Global warming potential |
| MVHR | Mechanical ventilation with heat recovery |
| NMBE | Normalized Mean Bias Error |
| PEF | Primary energy factor |
| PMV | Predicted mean vote |
| PPD | Predicted percentage of dissatisfied |
| PV | Photovoltaics |
| SCOP | Seasonal coefficient of performance |
| SEER | Seasonal energy efficiency ratio |
Appendix A
To enhance the transparency of the economic assessment, annual cash-flow tables have been developed for each examined scenario over the 20-year assessment period. These tables provide a detailed breakdown of electricity or natural gas import costs, revenues from electricity exports, maintenance expenditures, equipment replacement costs, and residual values. All future costs and revenues are discounted to their present values using a discount rate of 5%. Table A1 accounts for the baseline scenario, while Table A2, Table A3, Table A4 and Table A5 account for the renovation scenarios 1, 2, 3 and 4, respectively.
Table A1.
Annual discounted cash-flow analysis of the baseline scenario.
Table A2.
Annual discounted cash-flow analysis of renovation scenario 1.
Table A3.
Annual discounted cash-flow analysis of renovation scenario 2.
Table A4.
Annual discounted cash-flow analysis of renovation scenario 3.
Table A5.
Annual discounted cash-flow analysis of renovation scenario 4.
References
- Schwartz, Y.; Godoy-Shimizu, D.; Korolija, I.; Dong, J.; Hong, S.; Mavrogianni, A.; Mumovic, D. Developing a Data-driven school building stock energy and indoor environmental quality modelling method. Energy Build. 2021, 249, 111249. [Google Scholar] [CrossRef] [Scilit]
- Salvia, M.; Simoes, S.G.; Herrando, M.; Čavar, M.; Cosmi, C.; Pietrapertosa, F.; Gouveia, J.P.; Fueyo, N.; Gómez, A.; Papadopoulou, K.; et al. Improving policy making and strategic planning competencies of public authorities in the energy management of municipal public buildings: The PrioritEE toolbox and its application in five mediterranean areas. Renew. Sustain. Energy Rev. 2021, 135, 110106. [Google Scholar] [CrossRef] [Scilit]
- Kanetaki, Z.; Tousi, E.; Proestakis, E.; Jacques, S. Thermal performance modeling of mediterranean school building stock for sustainable urban retrofit strategies. Discov. Appl. Sci. 2025, 7, 1390. [Google Scholar] [CrossRef] [Scilit]
- Pietrapertosa, F.; Tancredi, M.; Salvia, M.; Proto, M.; Pepe, A.; Giordano, M.; Afflitto, N.; Sarricchio, G.; Di Leo, S.; Cosmi, C. An educational awareness program to reduce energy consumption in schools. J. Clean. Prod. 2021, 278, 123949. [Google Scholar] [CrossRef] [Scilit]
- Piredda, G.; Prataviera, E.; Carnieletto, L.; Carli, M.D.; da Porto, F. Strategic framework for sustainable energy renovation policies in educational buildings: A priority-based approach. Energy Build. 2025, 338, 115702. [Google Scholar] [CrossRef] [Scilit]
- Luo, X.; Wang, K.; Fan, Y.; Fan, Y.; Gao, W.; Ge, J. Multi-objective optimization for green retrofitting of existing school buildings considering life cycle carbon emissions, energy use intensity and indoor environment. Energy 2025, 336, 138388. [Google Scholar] [CrossRef] [Scilit]
- Ranđelović, D.; Jovanović, V.; Ignjatović, M.; Marchwiński, J.; Kopyłow, O.; Milošević, V. Improving Energy Efficiency of School Buildings: A Case Study of Thermal Insulation and Window Replacement Using Cost-Benefit Analysis and Energy Simulations. Energies 2024, 17, 6176. [Google Scholar] [CrossRef] [Scilit]
- Crespo Sánchez, E.; Cornadó Bardón, C.; Paris Viviana, O. Architectural and environmental strategies towards a cost optimal deep energy retrofit for mediterranean public high schools. Energy Rep. 2023, 9, 6434–6448. [Google Scholar] [CrossRef] [Scilit]
- Citadini de Oliveira, C.; Catão Martins Vaz, I.; Ghisi, E. Retrofit strategies to improve energy efficiency in buildings: An integrative review. Energy Build. 2024, 321, 114624. [Google Scholar] [CrossRef] [Scilit]
- Kitsopoulou, A.; Bellos, E.; Sammoutos, C.; Gonidaki, D.; Vidalis, E.; Chairopoulos, N.-C.; Mitsopoulos, G.; Tzivanidis, C. Energy and Thermal Comfort Performance of Integrated Retrofit Strategies for Apartment Residential Buildings in Mediterranean Climates. Energies 2026, 19, 582. [Google Scholar] [CrossRef] [Scilit]
- Yuk, H.; Choi, J.Y.; Yang, S.; Kim, S. Balancing preservation and utilization: Window retrofit strategy for energy efficiency in historic modern building. Build. Environ. 2024, 259, 111648. [Google Scholar] [CrossRef] [Scilit]
- Kitsopoulou, A.; Bellos, E.; Vidalis, E.; Mitsopoulos, G.; Tzivanidis, C. Multi-Criteria Evaluation of Cooling-Oriented Envelope Retrofit Technologies for Energy, Thermal Comfort and Cost Performance. Science 2026, 8, 53. [Google Scholar] [CrossRef] [Scilit]
- Gil-Baez, M.; Padura, Á.B.; Huelva, M.M. Passive actions in the building envelope to enhance sustainability of schools in a Mediterranean climate. Energy 2019, 167, 144–158. [Google Scholar] [CrossRef] [Scilit]
- Stabile, L.; Buonanno, G.; Frattolillo, A.; Dell’Isola, M. The effect of the ventilation retrofit in a school on CO2, airborne particles, and energy consumptions. Build. Environ. 2019, 156, 1–11. [Google Scholar] [CrossRef] [Scilit]
- Maiques, M.; Tarragona, J.; Gangolells, M.; Casals, M. Energy implications of meeting indoor air quality and thermal comfort standards in Mediterranean schools using natural and mechanical ventilation strategies. Energy Build. 2025, 328, 115076. [Google Scholar] [CrossRef] [Scilit]
- Beu, D.; Ciugudeanu, C.; Buzdugan, M. Circular Economy Aspects Regarding LED Lighting Retrofit—From Case Studies to Vision. Sustainability 2018, 10, 3674. [Google Scholar] [CrossRef] [Scilit]
- Bernardo, H.; Antunes, C.H.; Gaspar, A.; Pereira, L.D.; da Silva, M.G. An approach for energy performance and indoor climate assessment in a Portuguese school building. Sustain. Cities Soc. 2017, 30, 184–194. [Google Scholar] [CrossRef] [Scilit]
- Booysen, M.J.; Samuels, J.A.; Grobbelaar, S.S. LED there be light: The impact of replacing lights at schools in South Africa. Energy Build. 2021, 235, 110736. [Google Scholar] [CrossRef] [Scilit]
- Pizzuti, I.; Delibra, G.; Corsini, A. Design guidelines for renewable energy communities including end-use electrification scenarios. Energy Convers. Manag. 2025, 342, 120155. [Google Scholar] [CrossRef] [Scilit]
- Michael-Ahile, T.; Samuels, J.A.; Booysen, M.J. A simulation-based assessment of Community-Based Energy Trading for circular energy sharing in low-income communities. Energy Convers. Manag. X 2026, 30, 101665. [Google Scholar] [CrossRef] [Scilit]
- Minelli, F.; Ciriello, I.; Minichiello, F.; D’Agostino, D. From Net Zero Energy Buildings to an energy sharing model—The role of NZEBs in Renewable Energy Communities. Renew. Energy 2024, 223, 120110. [Google Scholar] [CrossRef] [Scilit]
- Efthymiou, E.N.; Yfanti, S.; Kyriakarakos, G.; Zervas, P.L.; Langouranis, P.; Terzis, K.; Stavrakakis, G.M. A Practical Methodology for Building a Municipality-Led Renewable Energy Community: A Photovoltaics-Based Case Study for the Municipality of Hersonissos in Crete, Greece. Sustainability 2022, 14, 12935. [Google Scholar] [CrossRef] [Scilit]
- Kitsopoulou, A.; Bellos, E.; Lykas, P.; Vrachopoulos, M.G.; Tzivanidis, C. Multi-objective evaluation of different retrofitting scenarios for a typical Greek building. Sustain. Energy Technol. Assess. 2023, 57, 103156. [Google Scholar] [CrossRef] [Scilit]
- Llanos-Jiménez, J.; Alonso, A.; Hepf, C.; de-Borja-Torrejon, M. Assessment of Mediterranean schools’ energy consumption and indoor environmental factors evolution through weighted Retrofit Potential Index in climate change scenarios. J. Build. Eng. 2025, 105, 112404. [Google Scholar] [CrossRef] [Scilit]
- TEE. ΤOΤΕΕ 20701-1/2017 (ΚΕΝAΚ). Available online: https://web.tee.gr/kenak/totee/ (accessed on 22 June 2026).
- Ren, J.; Liu, J.; Cao, X.; Hou, Y. Influencing factors and energy-saving control strategies for indoor fine particles in commercial office buildings in six Chinese cities. Energy Build. 2017, 149, 171–179. [Google Scholar] [CrossRef] [Scilit]
- Bastian, Z.; Schnieders, J.; Conner, W.; Kaufmann, B.; Lepp, L.; Norwood, Z.; Simmonds, A.; Theoboldt, T. Retrofit with Passive House components. Energy Effic. 2022, 15, 10. [Google Scholar] [CrossRef] [Scilit]
- Pasos, A.V.; Zheng, X.; Smith, L.; Wood, C. Estimation of the infiltration rate of UK homes with the divide-by-20 rule and its comparison with site measurements. Build. Environ. 2020, 185, 107275. [Google Scholar] [CrossRef] [Scilit]
- Ghosh, D.K.; Bose, S.; Das, G.; Acharyya, S.; Nandi, A.; Mukhopadhyay, S.; Sengupta, A. Fundamentals, present status and future perspective of TOPCon solar cells: A comprehensive review. Surf. Interfaces 2022, 30, 101917. [Google Scholar] [CrossRef] [Scilit]
- Bellos, E.; Gonidaki, D. Multi-Criteria Analysis of Different Renovation Scenarios Applying Energy, Economic, and Thermal Comfort Criteria. Appl. Sci. 2026, 16, 95. [Google Scholar] [CrossRef] [Scilit]
- University of West Attica. Available online: https://www.uniwa.gr/en/homepage/ (accessed on 8 September 2026).
- MATLAB. Available online: https://ch.mathworks.com/products/matlab.html (accessed on 26 August 2025).
- European Commission Joint Research Centre. Photovoltaic Geographical Information System (PVGIS), version 5.1; European Commission: Seville, Spain, 2025.
- ISO 6946:2017; Building Components and Building Elements—Thermal Resistance and Thermal Transmittance—Calculation Methods. International Organization for Standardization: Geneva, Switzerland, 2017.
- EN 15265:2007; Energy Performance of Buildings—Calculation of Energy Needs for Space Heating and Cooling Using Dynamic Methods—General Criteria And Validation Procedures. European Committee for Standardization: Brussels, Belgium, 2007.
- Kitsopoulou, A.; Pallantzas, D.; Sammoutos, C.; Lykas, P.; Bellos, E.; Vrachopoulos, M.G.; Tzivanidis, C. A comparative investigation of building rooftop retrofit actions using an energy and computer fluid dynamics approach. Energy Build. 2024, 315, 114326. [Google Scholar] [CrossRef] [Scilit]
- Eliopoulou, E.; Mantziou, E. Architectural Energy Retrofit (AER): An alternative building’s deep energy retrofit strategy. Energy Build. 2017, 150, 239–252. [Google Scholar] [CrossRef] [Scilit]
- D’Amico, A.; Panno, D.; Ciulla, G.; Messineo, A. Multi-Energy School System for Seasonal Use in the Mediterranean Area. Sustainability 2020, 12, 8458. [Google Scholar] [CrossRef] [Scilit]
- Cai, J.; Li, S.; Hu, D.; Xu, Y.; He, Q. Nationwide assessment of energy costs and policies to limit airborne infection risks in U.S. schools. J. Build. Eng. 2022, 45, 103533. [Google Scholar] [CrossRef] [Scilit]
- VERIFY Web App. Available online: https://verify.cperi.certh.gr/ (accessed on 9 June 2026).
- CPERI—Chemical Process & Energy Resources Institute. Home: CPERI—Chemical Process & Energy Resources Institute. Available online: https://www.cperi.certh.gr/ (accessed on 8 September 2026).
- ISO 14040:2006; Environmental Management—Life Cycle Assessment—Principles and Framework. International Organization for Standardization: Geneva, Switzerland, 2006.
- CORDIS—European Commission. integRatEd Solutions for POsitive eNergy and reSilient CitiEs (RESPONSE) Project Fact Sheet. Available online: https://cordis.europa.eu/project/id/957751 (accessed on 23 June 2026).
- EVELIXIA. EVELIXIA/Turn Buildings into Active Utility Nodes. Available online: https://www.evelixia-project.eu (accessed on 26 June 2026).
- Ren+Homes. Project—Ren + Homes. Available online: https://renplushomes.eu/project/ (accessed on 26 June 2026).
- REHOUSE. REHOUSE—Accelerating the European Renovation Rate. Available online: https://rehouse-project.eu/ (accessed on 26 June 2026).
- CORDIS—European Commission. An Augmented Intelligence-Enabled Stimulating Framework for Deep Energy Renovation Delivering Occupant-Centered Innovations (RINNO) Project Fact Sheet. Available online: https://cordis.europa.eu/project/id/892071 (accessed on 26 June 2026).
- InCUBE. Home-InCUBE. Available online: https://incubeproject.eu/ (accessed on 26 June 2026).
- Angelakoglou, K.; Lampropoulos, I.; Chatzigeorgiou, E.; Giourka, P.; Martinopoulos, G.; Skembris, A.-S.; Seitaridis, A.; Kousovista, G.; Nikolopoulos, N. Advancing Energy-Efficient Renovation Through Dynamic Life Cycle Assessment and Costing: Insights and Experiences from VERIFY Tool Deployment. Energies 2025, 18, 3736. [Google Scholar] [CrossRef] [Scilit]
- Apostolopoulos, V.; Mamounakis, I.; Seitaridis, A.; Tagkoulis, N.; Kourkoumpas, D.-S.; Iliadis, P.; Angelakoglou, K.; Nikolopoulos, N. An integrated life cycle assessment and life cycle costing approach towards sustainable building renovation via a dynamic online tool. Appl. Energy 2023, 334, 120710. [Google Scholar] [CrossRef] [Scilit]
- Bellos, E.; Iliadis, P.; Papalexis, C.; Rotas, R.; Mamounakis, I.; Sougkakis, V.; Nikolopoulos, N.; Kosmatopoulos, E. Holistic renovation of a multi-family building in Greece based on dynamic simulation analysis. J. Clean. Prod. 2022, 381, 135202. [Google Scholar] [CrossRef] [Scilit]
- Kousovista, G.; Iakovides, G.; Petridis, S.; Chairopoulos, N.-C.; Skembris, A.; Fotopoulou, M.; Antipa, D.; Nikolopoulos, N.; Rakopoulos, D. Comparative Lifecycle Assessment of Renewable Energy Investments in Public Buildings: A Case Study of an Austrian Kindergarten Under Atypical Operational Conditions. Appl. Sci. 2025, 15, 2330. [Google Scholar] [CrossRef] [Scilit]
- Skopetou, N.; Zestanakis, P.A.; Rotas, R.; Iliadis, P.; Papadopoulos, C.; Nikolopoulos, N.; Sfakianakis, A.; Koroneos, C. Energy analysis and environmental impact assessment for self-sufficient non-interconnected islands: The case of Nisyros island. J. Clean. Prod. 2024, 447, 141647. [Google Scholar] [CrossRef] [Scilit]
- Seitaridis, A.; Mamounakis, I.; Tagkoulis, N.; Iliadis, P.; Bellos, E.; Papalexis, C.; Sougakis, V.; Nikolopoulos, N. An Innovative Software Platform for Efficient Energy, Environmental and Cost Planning in Buildings Retrofitting. In Artificial Intelligence Applications and Innovations. AIAI 2022 IFIP WG 12.5 International Workshops; Maglogiannis, I., Iliadis, L., Macintyre, J., Cortez, P., Eds.; Springer International Publishing: Cham, Switzerland, 2022; pp. 217–228. [Google Scholar] [CrossRef] [Scilit]
- Grossi, F.; Ge, H.; Zmeureanu, R.; Baba, F. Assessing the effectiveness of building retrofits in reducing GHG emissions: A Canadian school case study. J. Build. Eng. 2024, 91, 109622. [Google Scholar] [CrossRef] [Scilit]
- D’Agostino, D.; Tzeiranaki, S.T.; Zangheri, P.; Bertoldi, P. Data on nearly zero energy buildings (NZEBs) projects and best practices in Europe. Data Brief. 2021, 39, 107641. [Google Scholar] [CrossRef] [Scilit] [PubMed]
- Zacharakis, K. Renewable Energy Sources and Guarantees of Origin Operator S.A. (DAPEEP S.A.). Available online: https://www.dapeep.gr/eidiki-tmii-agoras-e-t-a-texnologiwn-a/ (accessed on 23 June 2026).
- Statistics | Eurostat. Available online: https://ec.europa.eu/eurostat/databrowser/product/page/NRG_PC_204 (accessed on 16 October 2026).
- Sustainability Insights for Informed Changemakers. Available online: https://simapro.com/ (accessed on 2 July 2026).
- Wang, F.; You, T. Comparative analysis on the life cycle climate performance of ground source heat pump using alternative refrigerants. Case Stud. Therm. Eng. 2023, 42, 102761. [Google Scholar] [CrossRef] [Scilit]
- EPD Turkey. Ode Yalıtım - Starflex & Evomineral 032 Glasswool Insulation Materials (Registration No: S-P-03932). Available online: https://www.epdturkey.org/service/detail/s-p-03932/cd (accessed on 13 June 2026).
- Solar, J.A. JAM72D30 MB. Available online: https://www.jasolar.eu/en/products/jam72d30-mb (accessed on 13 June 2026).
- Solar-Go.com. Fronius Symo GEN24 10.0. Available online: https://www.solar-go.com/products/fronius-symo-gen24-10-0 (accessed on 13 June 2026).
- Passive House Institute. ValloPlus 850 MV in the Passive House Portal Component Database. Available online: https://database.passivehouse.com/el/components/details/ventilationsmall/vallox-gmbh-valloplus-850-mv-0883vs03 (accessed on 13 June 2026).
- Galletti, S.p.A. VLS Air-Water Chillers and Heat Pumps. Available online: https://www.galletti.com/en/products/chillers_and_heat_pumps_564/dissipation-with-air/vls-en/ (accessed on 13 June 2026).
- Albu, H.; Beu, D.; Rus, T.; Moldovan, R.; Domniţa, F.; Vilčeková, S. Life cycle assessment of LED luminaire and impact on lighting installation—A case study. Alex. Eng. J. 2023, 80, 282–293. [Google Scholar] [CrossRef] [Scilit]
- Kitsopoulou, A.; Pallantzas, D.; Bellos, E.; Tzivanidis, C. Mapping the Potential of Zero-Energy Building in Greece Using Roof Photovoltaics. Designs 2024, 8, 68. [Google Scholar] [CrossRef] [Scilit]
- Zhao, Q.; Lian, Z.; Lai, D. Thermal comfort models and their developments: A review. Energy Built Environ. 2021, 2, 21–33. [Google Scholar] [CrossRef] [Scilit]
- Kennedy, H.E. Description 2021 ASHRAE Handbook—Fundamentals; ASHRAE: Peachtree Corners, GA, USA, 2021. [Google Scholar]
- Big Ladder Software LLC. Table of Contents: Engineering Reference—EnergyPlus 22.1; Big Ladder Software LLC: Denver, CO, USA, 2022. [Google Scholar]
- ISO 7730:2005; Ergonomics of the Thermal Environment—Analytical Determination and Interpretation of Thermal Comfort Using Calculation of the PMV and PPD Indices and Local Thermal Comfort Criteria. International Organization for Standardization: Geneva, Switzerland, 2005.
- Standard 55 – Thermal Environmental Conditions for Human Occupancy. Available online: https://www.ashrae.org/technical-resources/bookstore/standard-55-thermal-environmental-conditions-for-human-occupancy (accessed on 29 January 2024).
- de la Hoz-Torres, M.L.; Aguilar, A.J.; Costa, N.; Arezes, P.; Ruiz, D.P.; Martínez-Aires, M.D. Predictive Model of Clothing Insulation in Naturally Ventilated Educational Buildings. Buildings 2023, 13, 1002. [Google Scholar] [CrossRef] [Scilit]
- Izaola, B.; Akizu-Gardoki, O.; Oregi, X. Setting baselines of the embodied, operational and whole life carbon emissions of the average Spanish residential building. Sustain. Prod. Consum. 2023, 40, 252–264. [Google Scholar] [CrossRef] [Scilit]
- Hegarty, R.O.; Kinnane, O. A whole life carbon analysis of the Irish residential sector—Past, present and future. Energy Clim. Change 2023, 4, 100101. [Google Scholar] [CrossRef] [Scilit]
- Bastos, J.; Monforti-Ferrario, F.; Melica, G. Covenant of Mayors for Climate and Energy: Greenhouse Gas Emission Factors For Local Emission Inventories; EUR 31825 EN, JRC136272; Publications Office of the European Union: Luxembourg, 2024. [Google Scholar]
- Tawalbeh, M.; Al-Othman, A.; Kafiah, F.; Abdelsalam, E.; Almomani, F.; Alkasrawi, M. Environmental impacts of solar photovoltaic systems: A critical review of recent progress and future outlook. Sci. Total Environ. 2021, 759, 143528. [Google Scholar] [CrossRef] [Scilit] [PubMed]
- Shadram, F.; Mukkavaara, J. An integrated BIM-based framework for the optimization of the trade-off between embodied and operational energy. Energy Build. 2018, 158, 1189–1205. [Google Scholar] [CrossRef] [Scilit]
- Mourão, J.; Gomes, R.; Matias, L.; Niza, S. Combining embodied and operational energy in buildings refurbishment assessment. Energy Build. 2019, 197, 34–46. [Google Scholar] [CrossRef] [Scilit]
- Amann, C.; Torres, P.; Boldizsár, G.; Hofer, G.; Stumpf, W.; Leutgöb, K.; Van Nuffel, L. Support to Primary Energy Factors Review (PEF): Final Report; Catalogue No. MJ-02-23-133-EN-N; Publications Office of the European Union: Luxembourg, 2023. [Google Scholar]
- Electricity Maps. Map/Electricity Maps (Live 15-Minute Data Portal). Available online: https://app.electricitymaps.com/map/live/fifteen_minutes (accessed on 23 May 2026).
- Balaras, C.A.; Dascalaki, E.G.; Psarra, I.; Cholewa, T. Primary Energy Factors for Electricity Production in Europe. Energies 2023, 16, 93. [Google Scholar] [CrossRef] [Scilit]
- Bogdanov, D.; Ram, M.; Aghahosseini, A.; Gulagi, A.; Oyewo, A.S.; Child, M.; Caldera, U.; Sadovskaia, K.; Farfan, J.; Barbosa, L.D.S.N.S.; et al. Low-cost renewable electricity as the key driver of the global energy transition towards sustainability. Energy 2021, 227, 120467. [Google Scholar] [CrossRef] [Scilit]
- Luthander, R.; Widén, J.; Nilsson, D.; Palm, J. Photovoltaic self-consumption in buildings: A review. Appl. Energy 2015, 142, 80–94. [Google Scholar] [CrossRef] [Scilit]
- Martín-Chivelet, N.; Montero-Gómez, D. Optimizing photovoltaic self-consumption in office buildings. Energy Build. 2017, 150, 71–80. [Google Scholar] [CrossRef] [Scilit]
- Suppa, A.R.; Bottero, M.C.; Corrado, V.; Dell’Anna, F. District-scale life cycle costing of climate-neutral retrofits, based on automatic envelope detection workflows and LOD3 3D city model. Energy Build. 2026, 359, 117289. [Google Scholar] [CrossRef] [Scilit]
- Ruparathna, R.; Hewage, K.; Sadiq, R. Economic evaluation of building energy retrofits: A fuzzy based approach. Energy Build. 2017, 139, 395–406. [Google Scholar] [CrossRef] [Scilit]
- Baldoni, E.; Coderoni, S.; D’Orazio, M.; Di Giuseppe, E.; Esposti, R. From cost-optimal to nearly Zero Energy Buildings’ renovation: Life Cycle Cost comparisons under alternative macroeconomic scenarios. J. Clean. Prod. 2021, 288, 125606. [Google Scholar] [CrossRef] [Scilit]
- ISO 15686-5:2017; Buildings and Constructed Assets—Service Life Planning—Part 5: Life-Cycle Costing. International Organization for Standardization: Geneva, Switzerland, 2017.
- Krarti, M.; Aldubyan, M.; Williams, E. Residential building stock model for evaluating energy retrofit programs in Saudi Arabia. Energy 2020, 195, 116980. [Google Scholar] [CrossRef] [Scilit]
- Colli, C.; Bataille, A.; Antczak, E. Investigating eco-efficiency procedure to compare refurbishment scenarios with different insulating materials. Procedia CIRP 2020, 90, 322–327. [Google Scholar] [CrossRef] [Scilit]
- Scarpa, F.; Tagliafico, L.A.; Bianco, V. Financial and energy performance analysis of efficiency measures in residential buildings. A probabilistic approach. Energy 2021, 236, 121491. [Google Scholar] [CrossRef] [Scilit]
- Ebaid, M.A.; Mohamed, T.A.; Safwat, H. A case study on optimizing industrial air conditioning with thermal solar energy in Egypt. Heliyon 2024, 10, e34774. [Google Scholar] [CrossRef] [Scilit] [PubMed]
- Lu, K.; Deng, X. OpenBIM driven marginal abatement cost of low-carbon measures in building design. Appl. Energy 2025, 377, 124477. [Google Scholar] [CrossRef] [Scilit]
- Vogt, M.; Remmen, P.; Lauster, M.; Fuchs, M.; Müller, D. Selecting statistical indices for calibrating building energy models. Build. Environ. 2018, 144, 94–107. [Google Scholar] [CrossRef] [Scilit]
- Jacobson, H.; Carlson, A.; Lindahl, M. Legal, environmental and economic issues with functional sales—A case of indoor lighting. J. Clean. Prod. 2021, 298, 126713. [Google Scholar] [CrossRef] [Scilit]
- Lee, J.-H.; Kim, D.-G.; Jeong, S.-K.; Song, Y. Analysis of Heat Source System Degradation Due to Aging and Evaluation of Its Effect on Energy Consumption. Energies 2022, 15, 9217. [Google Scholar] [CrossRef] [Scilit]
- Kitsopoulou, A.; Bellos, E.; Tzivanidis, C. An Up-to-Date Review of Passive Building Envelope Technologies for Sustainable Design. Energies 2024, 17, 4039. [Google Scholar] [CrossRef] [Scilit]
- Kilis, V.; Ploskas, N.; Panaras, G. Investigation of multi-objective decision making approaches for the optimization in building envelope thermal design. Sustain. Energy Technol. Assess. 2025, 82, 104506. [Google Scholar] [CrossRef] [Scilit]
- ASTM E136-22; Standard Test Method for Assessing Combustibility of Materials Using a Vertical Tube Furnace at 750 °C. ASTM International: West Conshohocken, PA, USA, 2022.
- ELOT EN 13501-1:2019; Fire Classification of Construction Products and Building Elements—Part 1: Classification Using Data from Reaction to Fire Tests. Hellenic Organization for Standardization: Peristeri, Greece, 2019.
- Asdrubali, F.; D’Alessandro, F.; Schiavoni, S. A review of unconventional sustainable building insulation materials. Sustain. Mater. Technol. 2015, 4, 1–17. [Google Scholar] [CrossRef] [Scilit]
- Bruno, R.; Bevilacqua, P.; Cuconati, T.; Arcuri, N. Energy evaluations of an innovative multi-storey wooden near Zero Energy Building designed for Mediterranean areas. Appl. Energy 2019, 238, 929–941. [Google Scholar] [CrossRef] [Scilit]
- Zhu, C.; Tian, Y.; Yang, Y.; Xie, J.; Jiang, X. The insulation thickness paradox in cooling efficiency: Experimental and simulation study on high internal heat gain buildings. Energy 2026, 361, 142083. [Google Scholar] [CrossRef] [Scilit]
- Shuailing, L.; Guoyuan, M.; Xiaoya, J.; Shuxue, X.; Guoqiang, W.; Yumei, Z. The thermal performance and applicability analysis of the composite ventilation system with heat recovery in ultra-low energy buildings. Energy 2023, 263, 125942. [Google Scholar] [CrossRef] [Scilit]
- Monge-Barrio, A.; Bes-Rastrollo, M.; Dorregaray-Oyaregui, S.; González-Martínez, P.; Martin-Calvo, N.; López-Hernández, D.; Arriazu-Ramos, A.; Sánchez-Ostiz, A. Encouraging natural ventilation to improve indoor environmental conditions at schools. Case studies in the north of Spain before and during COVID. Energy Build. 2022, 254, 111567. [Google Scholar] [CrossRef] [Scilit]
- Stavrakakis, G.M.; Zervas, P.L.; Terzis, K.; Langouranis, P.; Saranti, P.; Stephanedes, Y.J. Exploitation of Mediterranean Cooperation Projects’ Tools for the Development of Public Buildings’ Energy Efficiency Plans at Local Level: A Case Study in Greece. Energies 2023, 16, 3352. [Google Scholar] [CrossRef] [Scilit]
- Michalak, P.; Szczotka, K.; Szymiczek, J. Energy Effectiveness or Economic Profitability? A Case Study of Thermal Modernization of a School Building. Energies 2021, 14, 1973. [Google Scholar] [CrossRef] [Scilit]
- Karakosta, C.; Vryzidis, I. Cost-Effective Energy Retrofit Pathways for Buildings: A Case Study in Greece. Energies 2025, 18, 4014. [Google Scholar] [CrossRef] [Scilit]
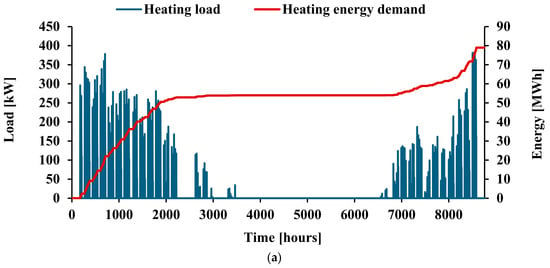
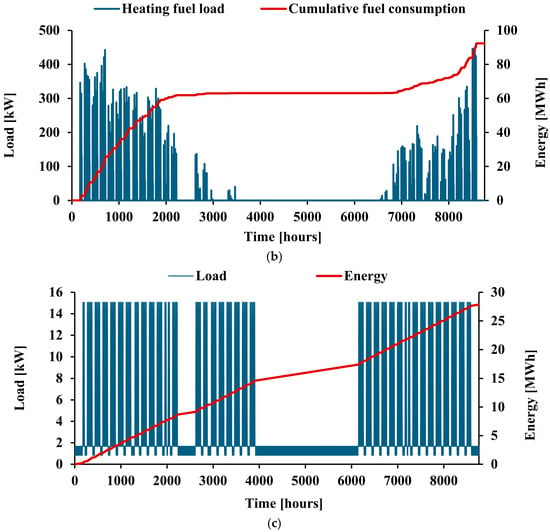
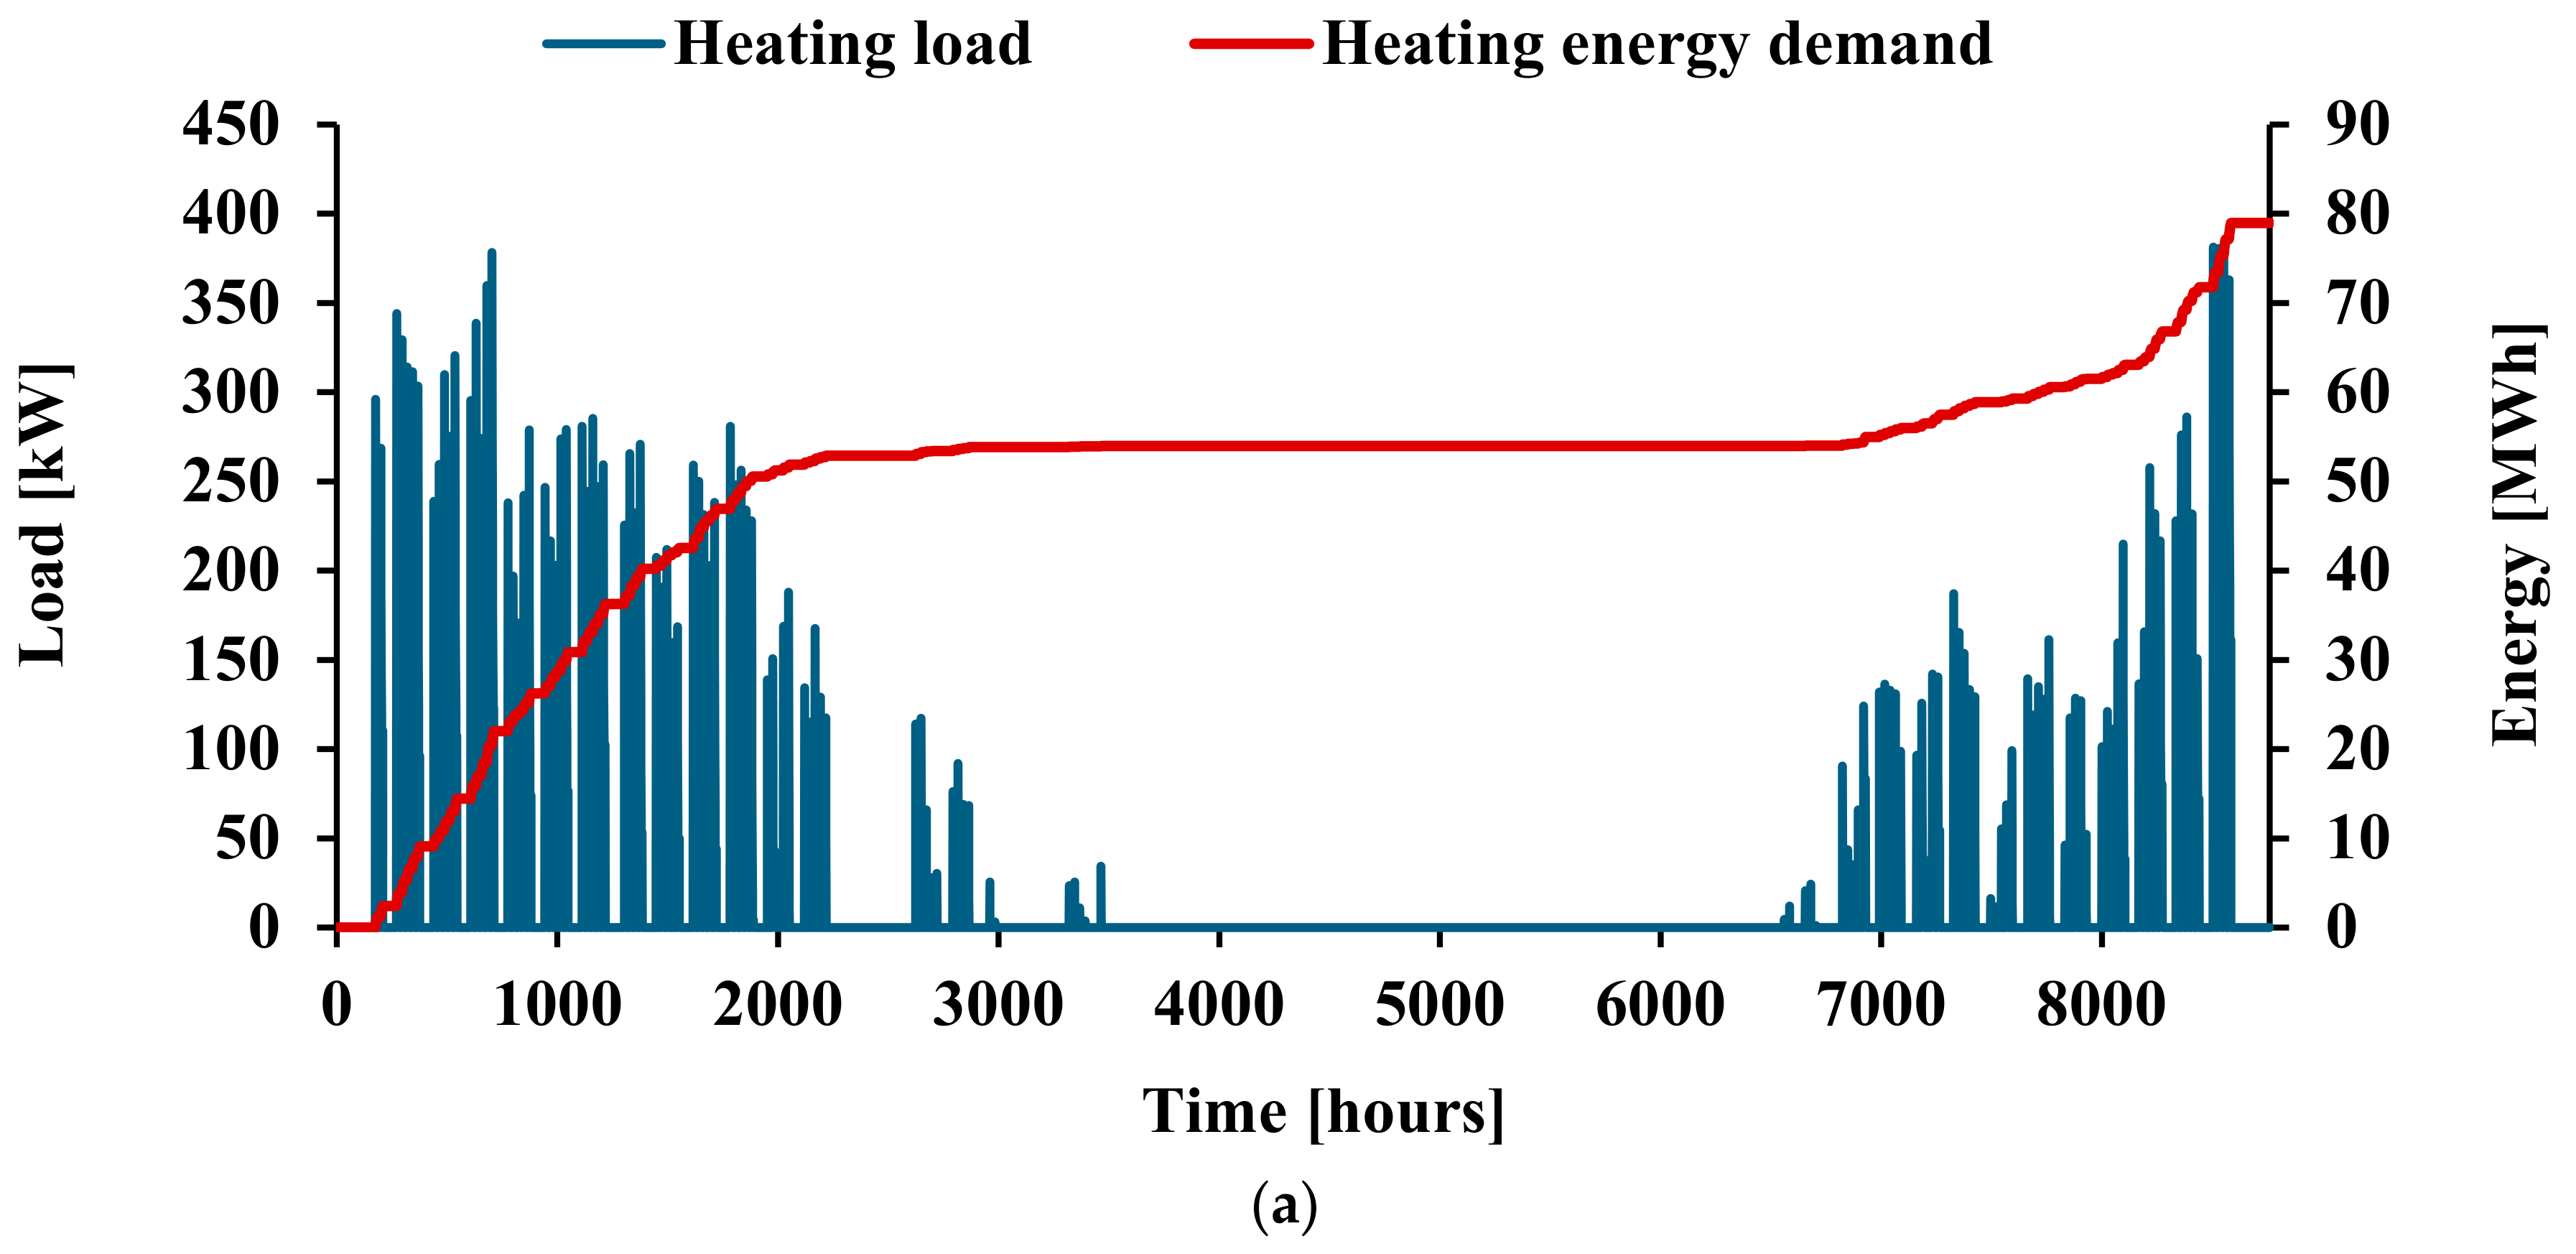
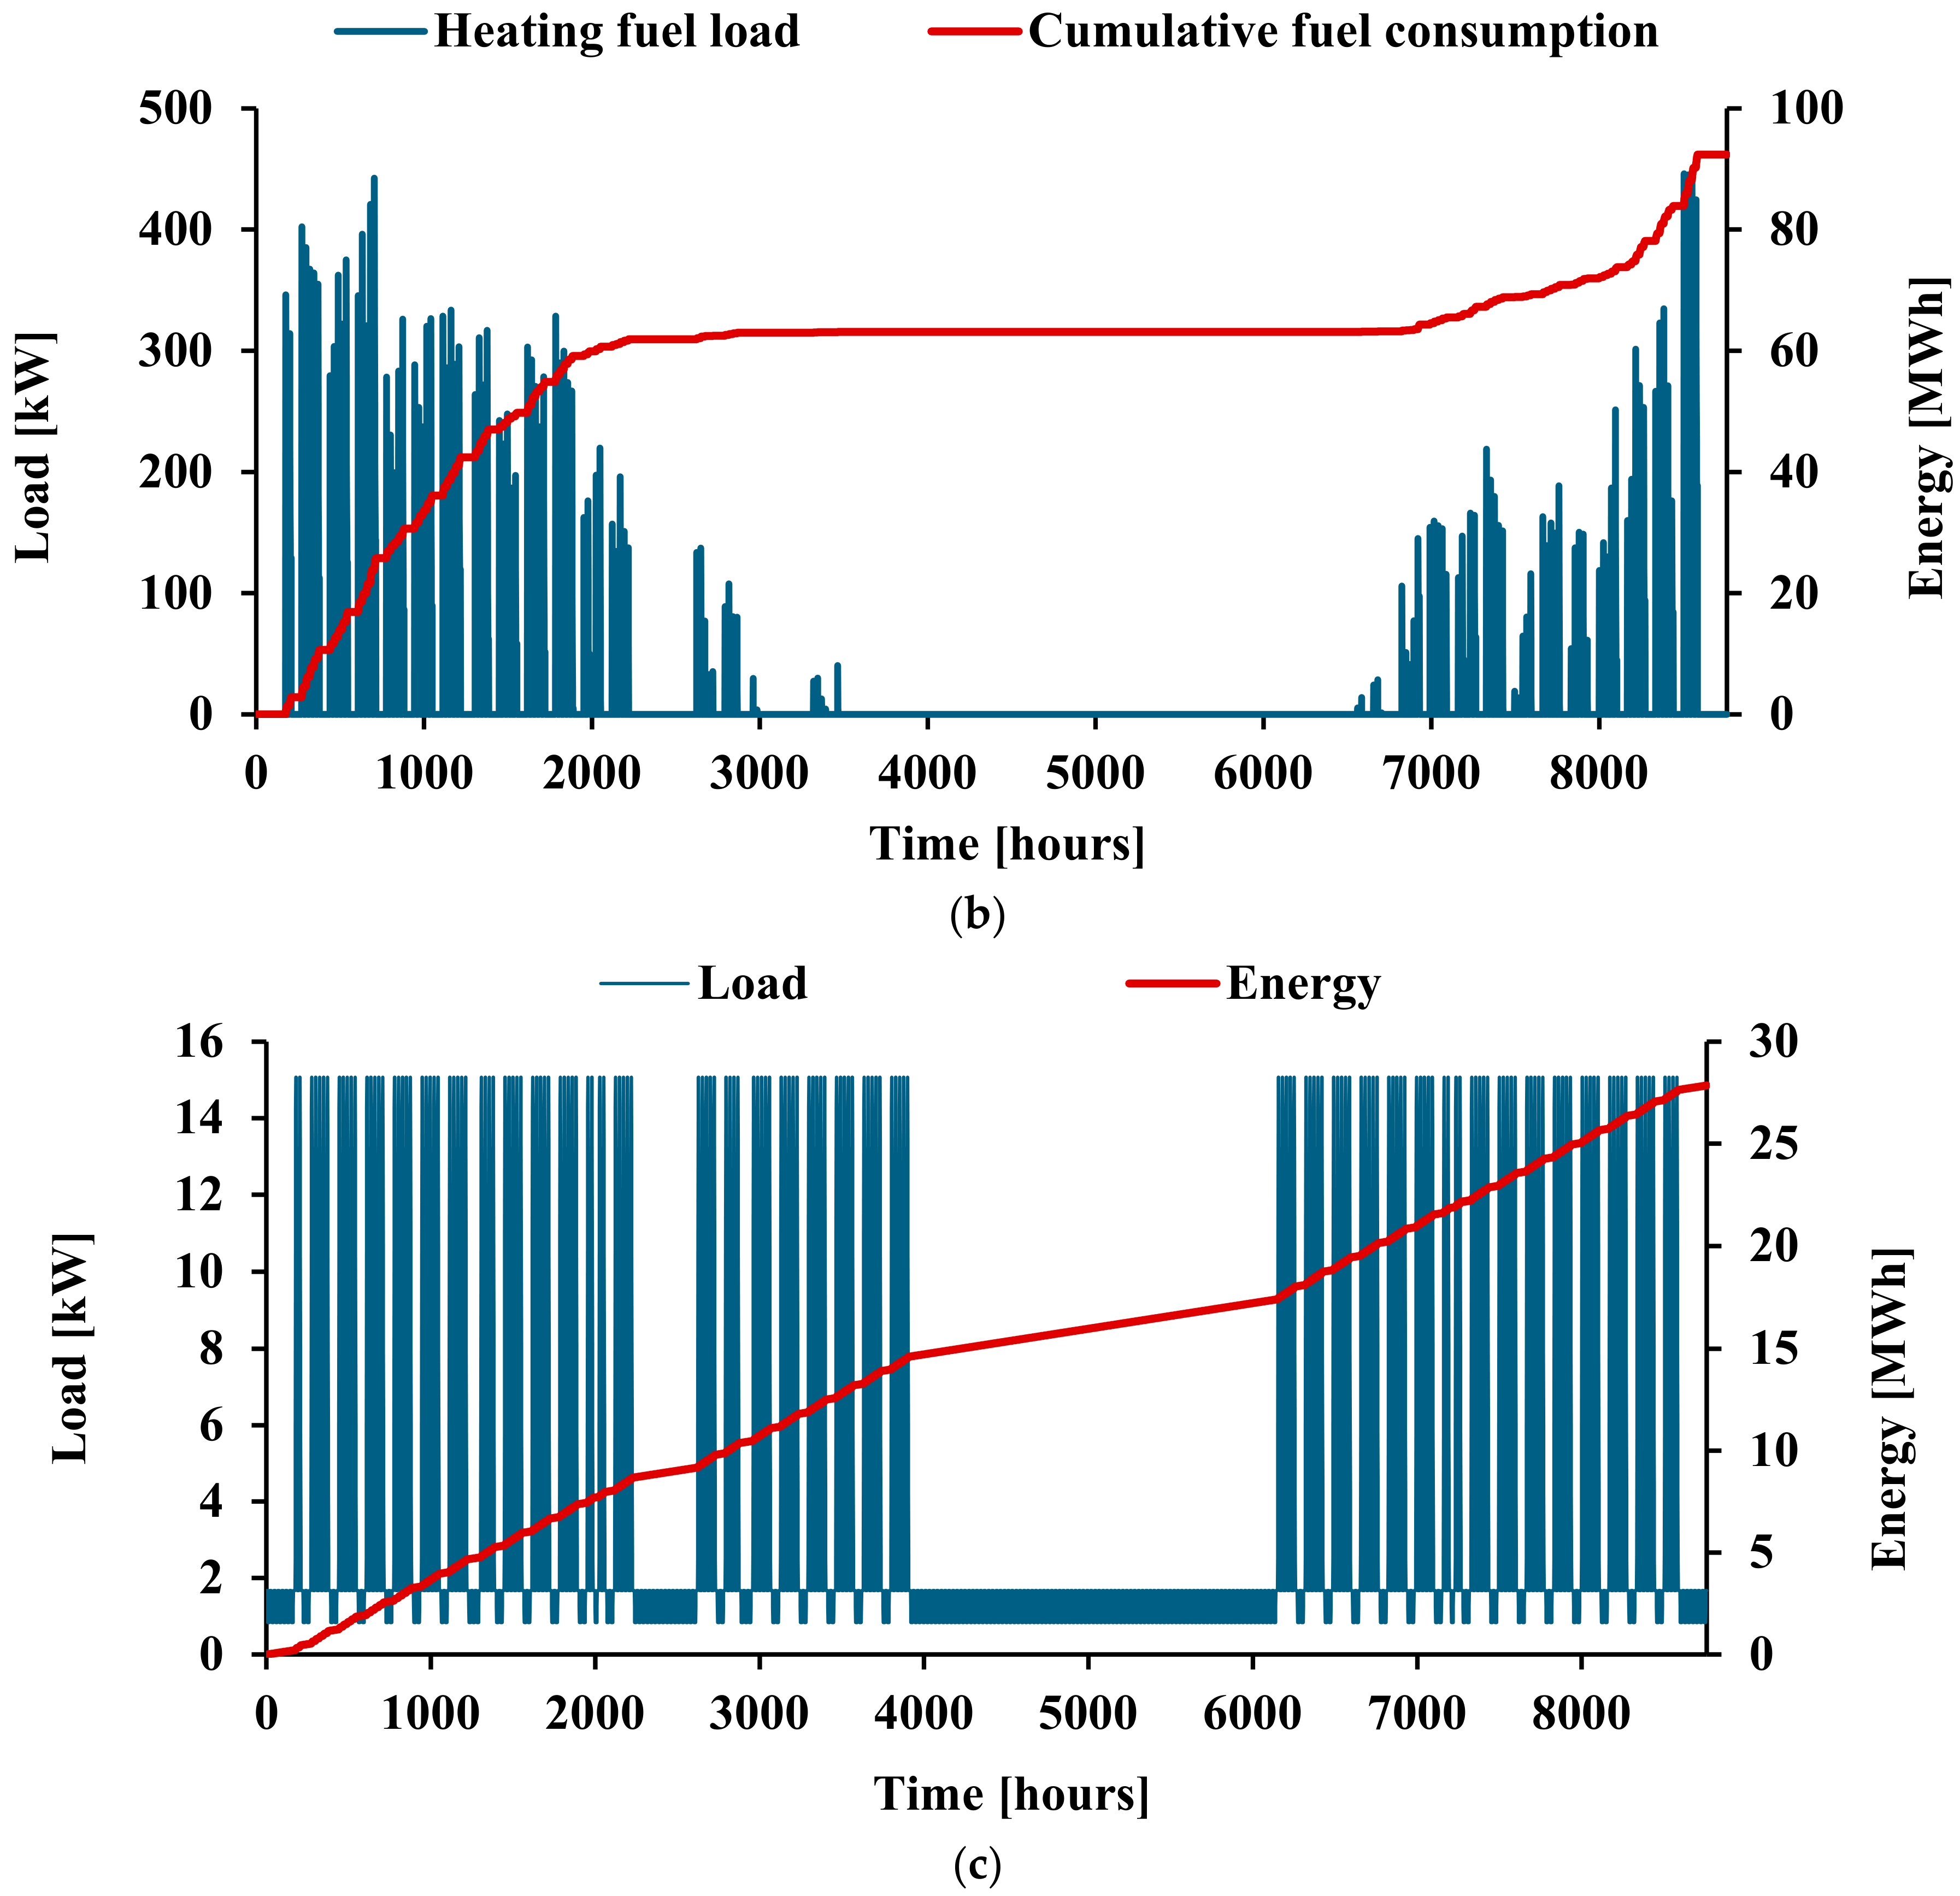
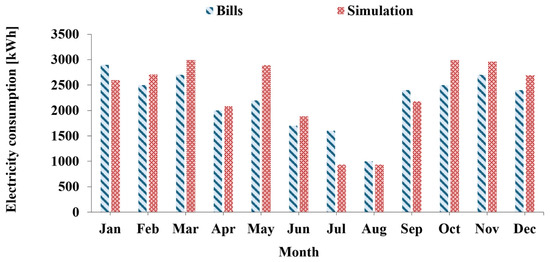
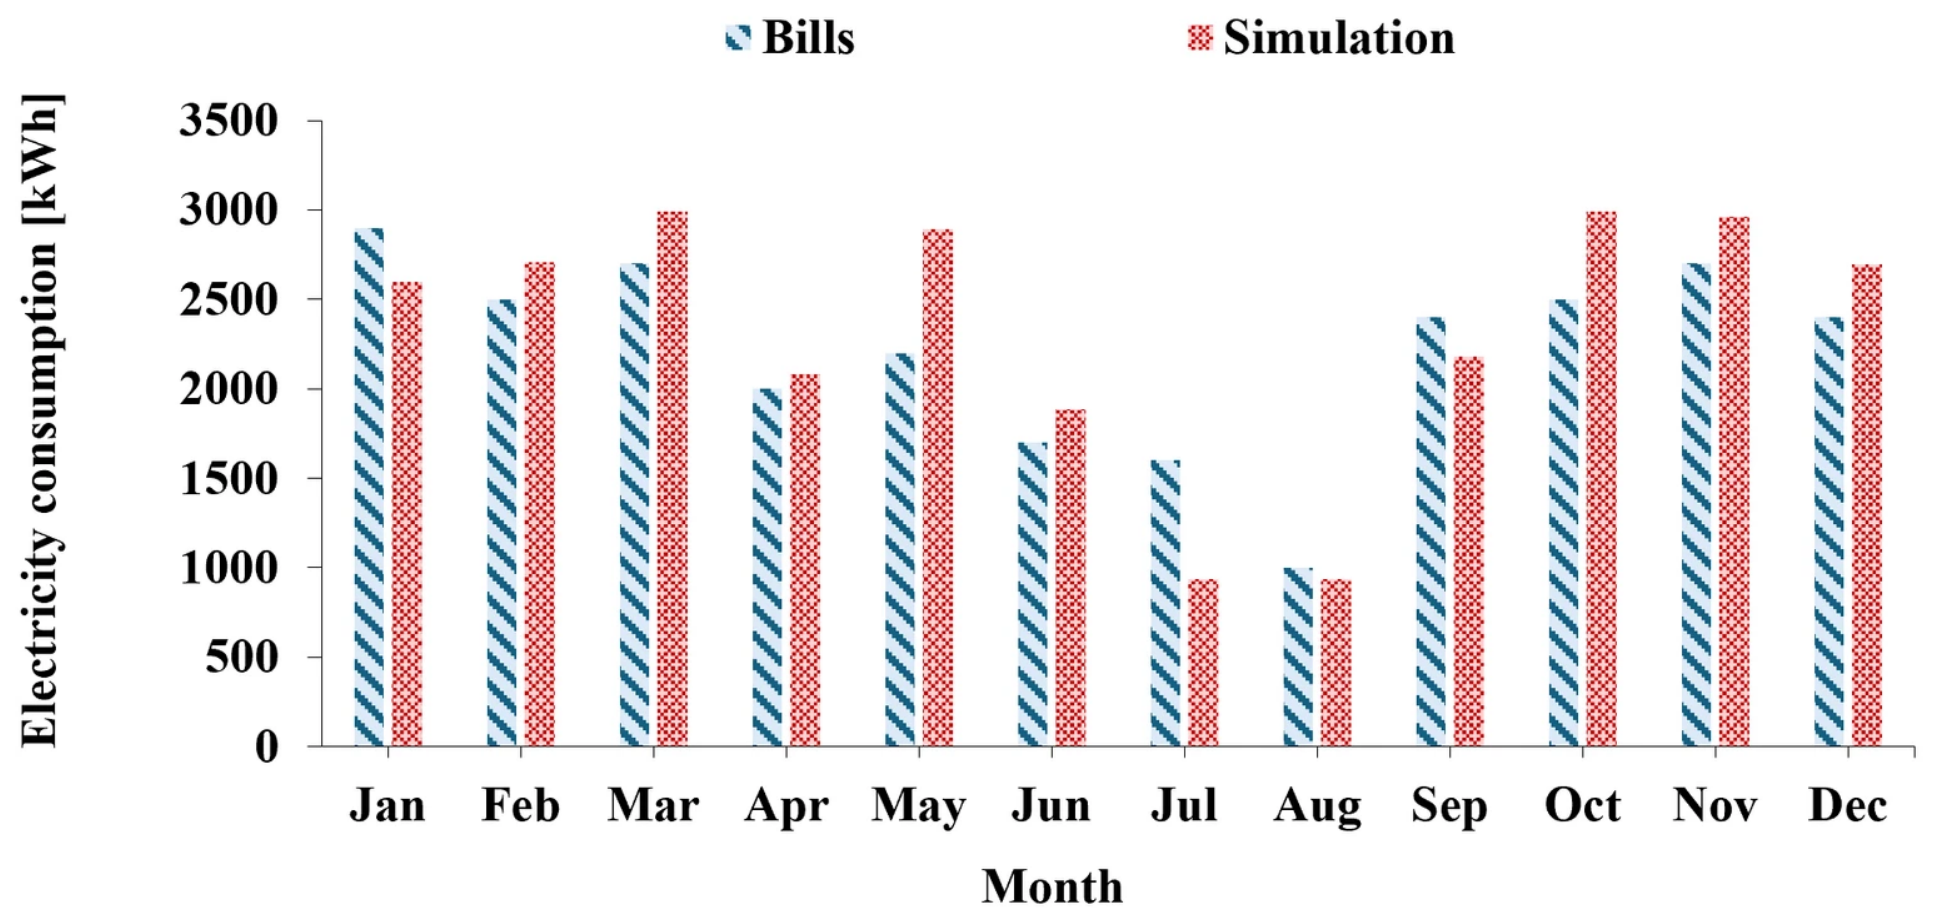
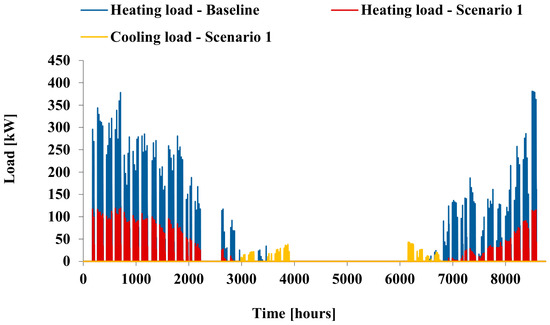
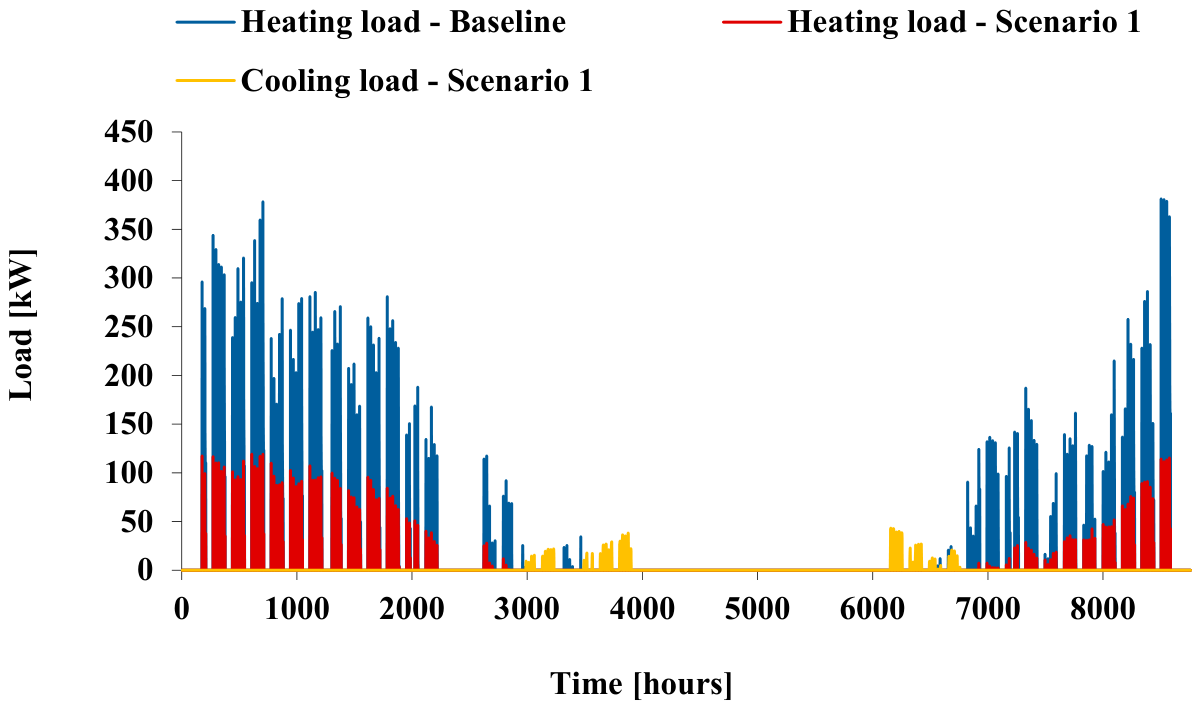
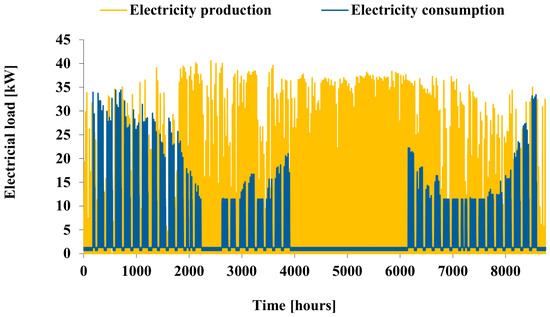
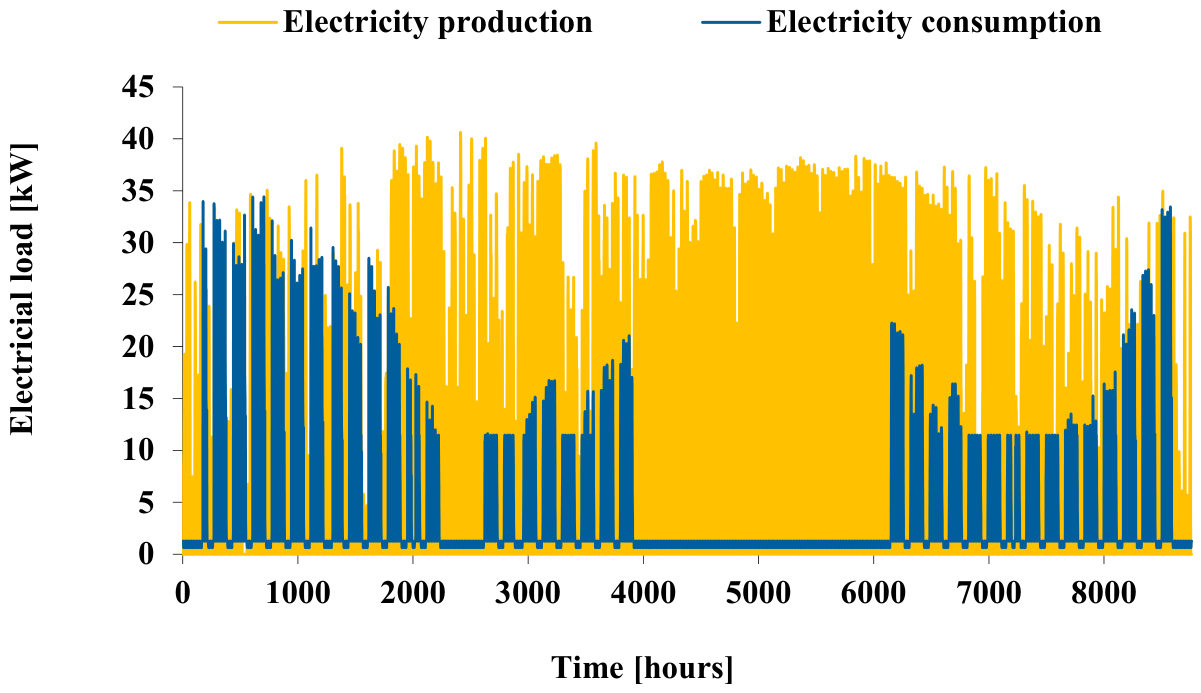
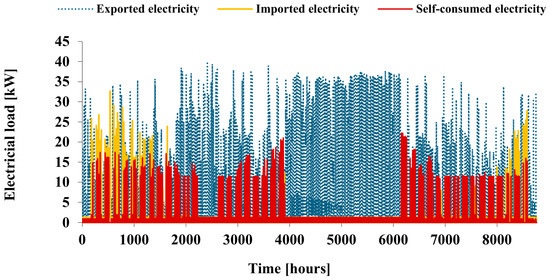
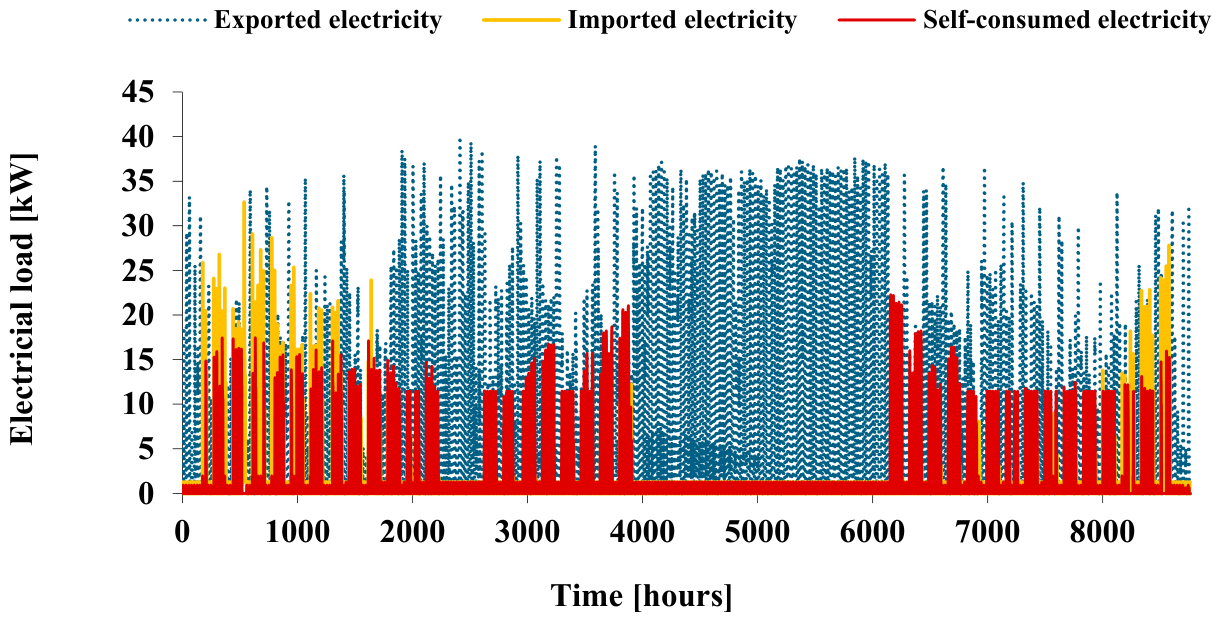
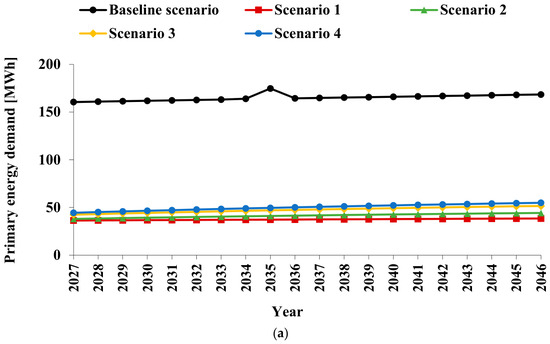
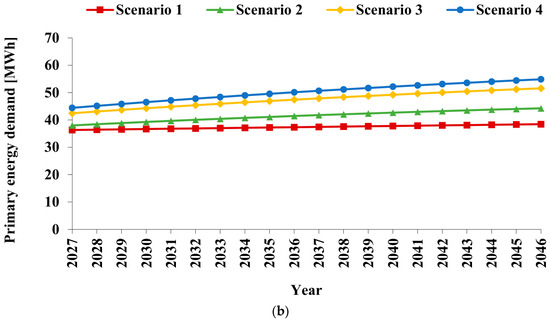
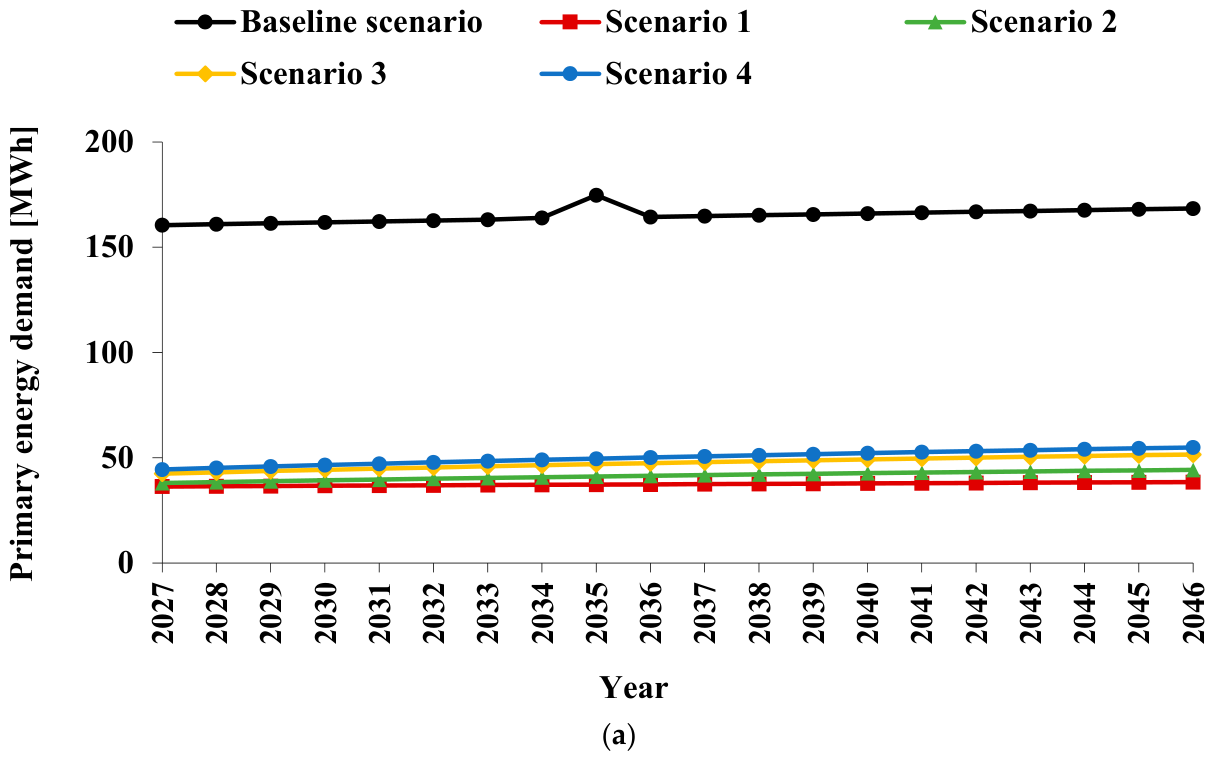
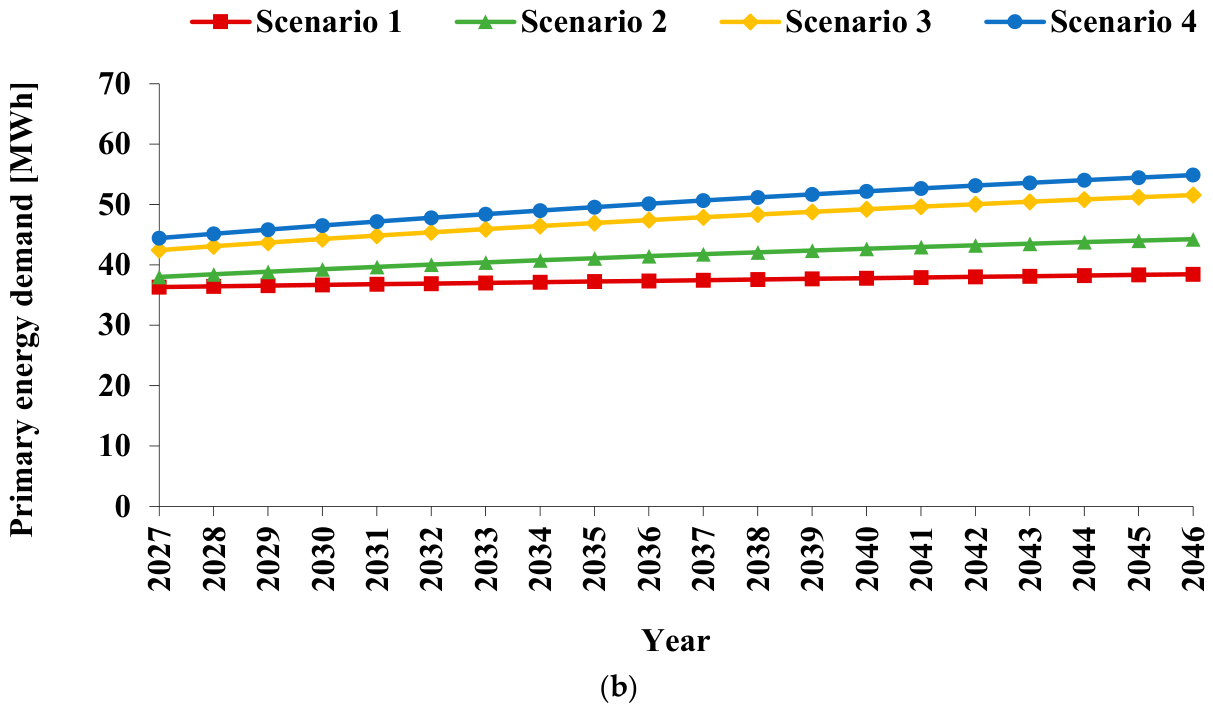
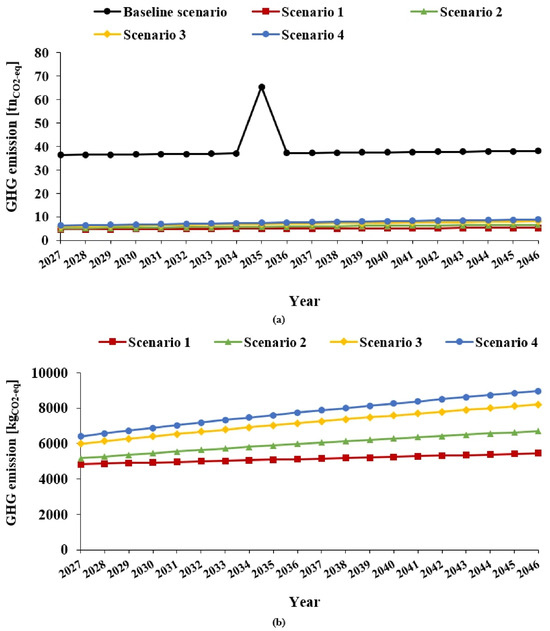
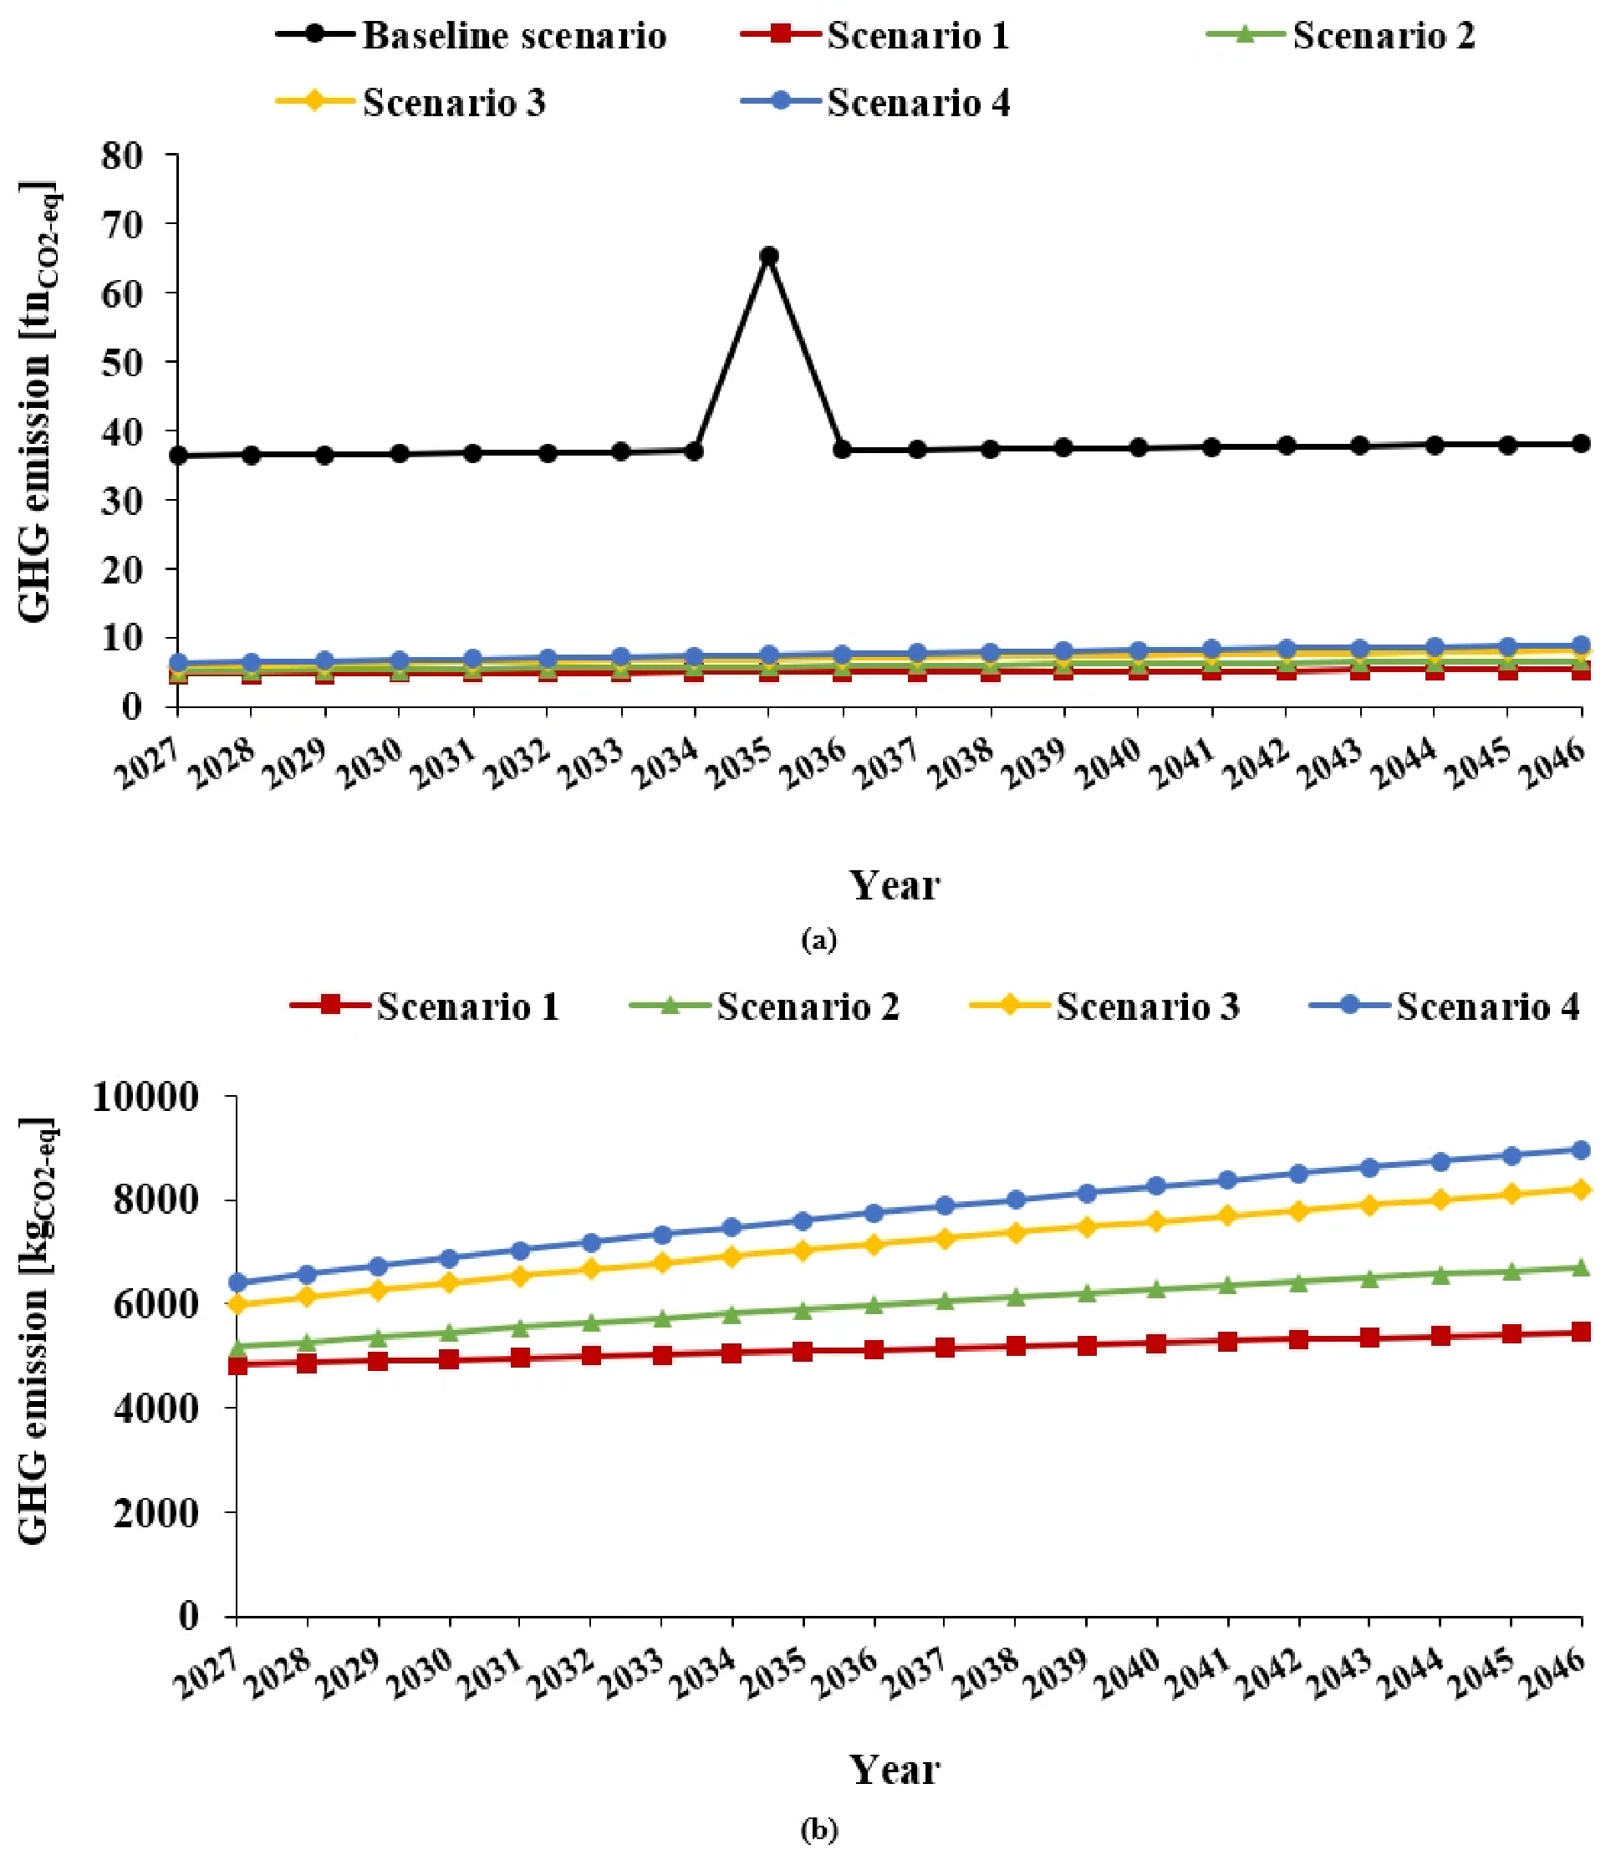
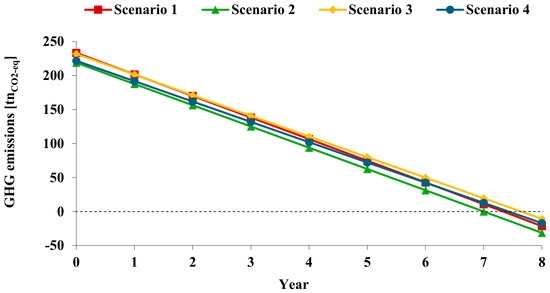
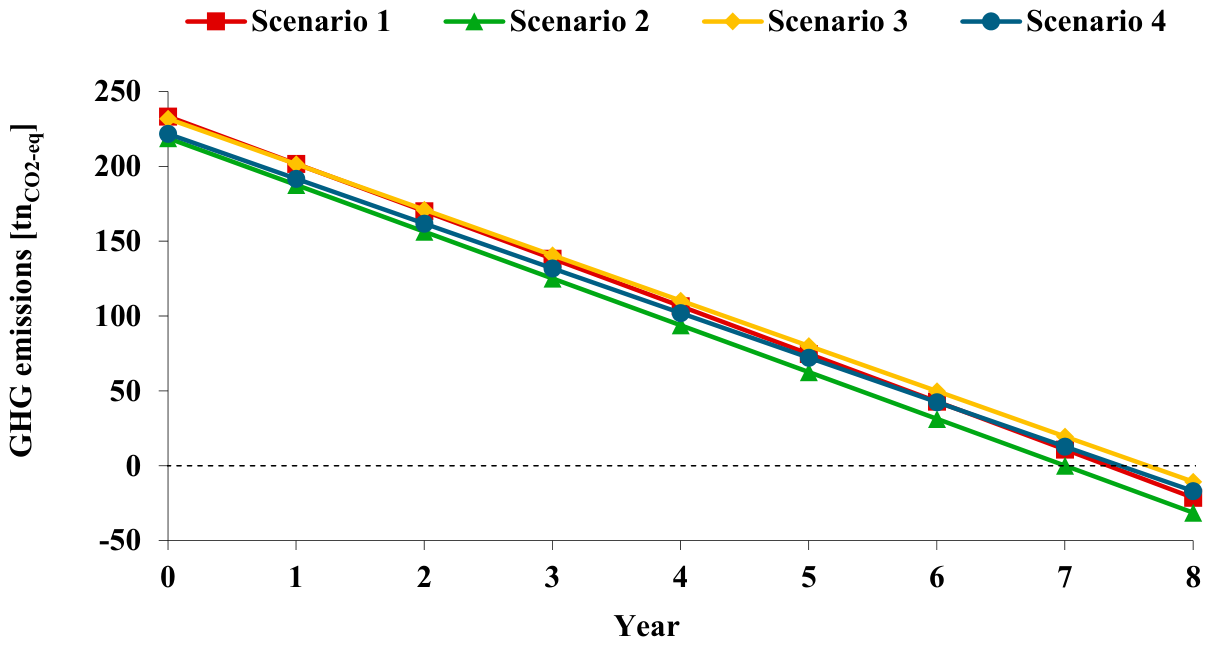
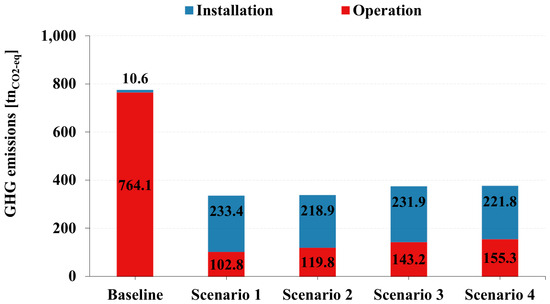
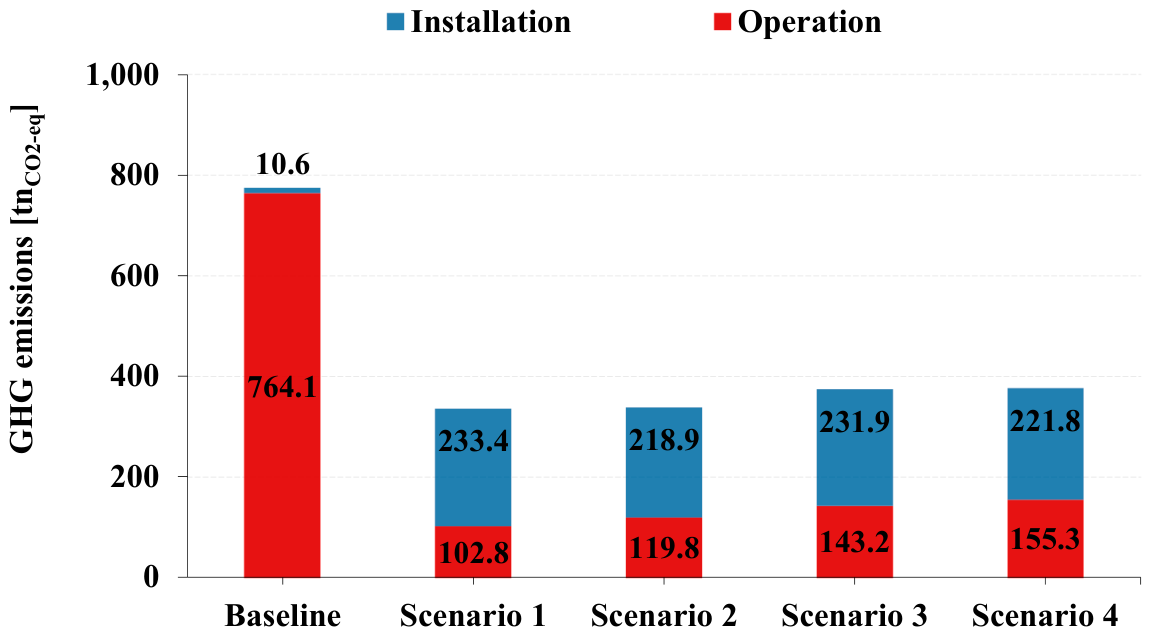
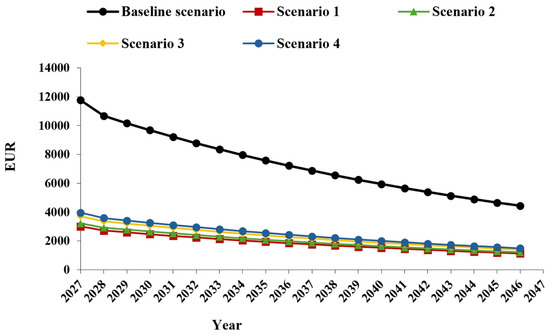
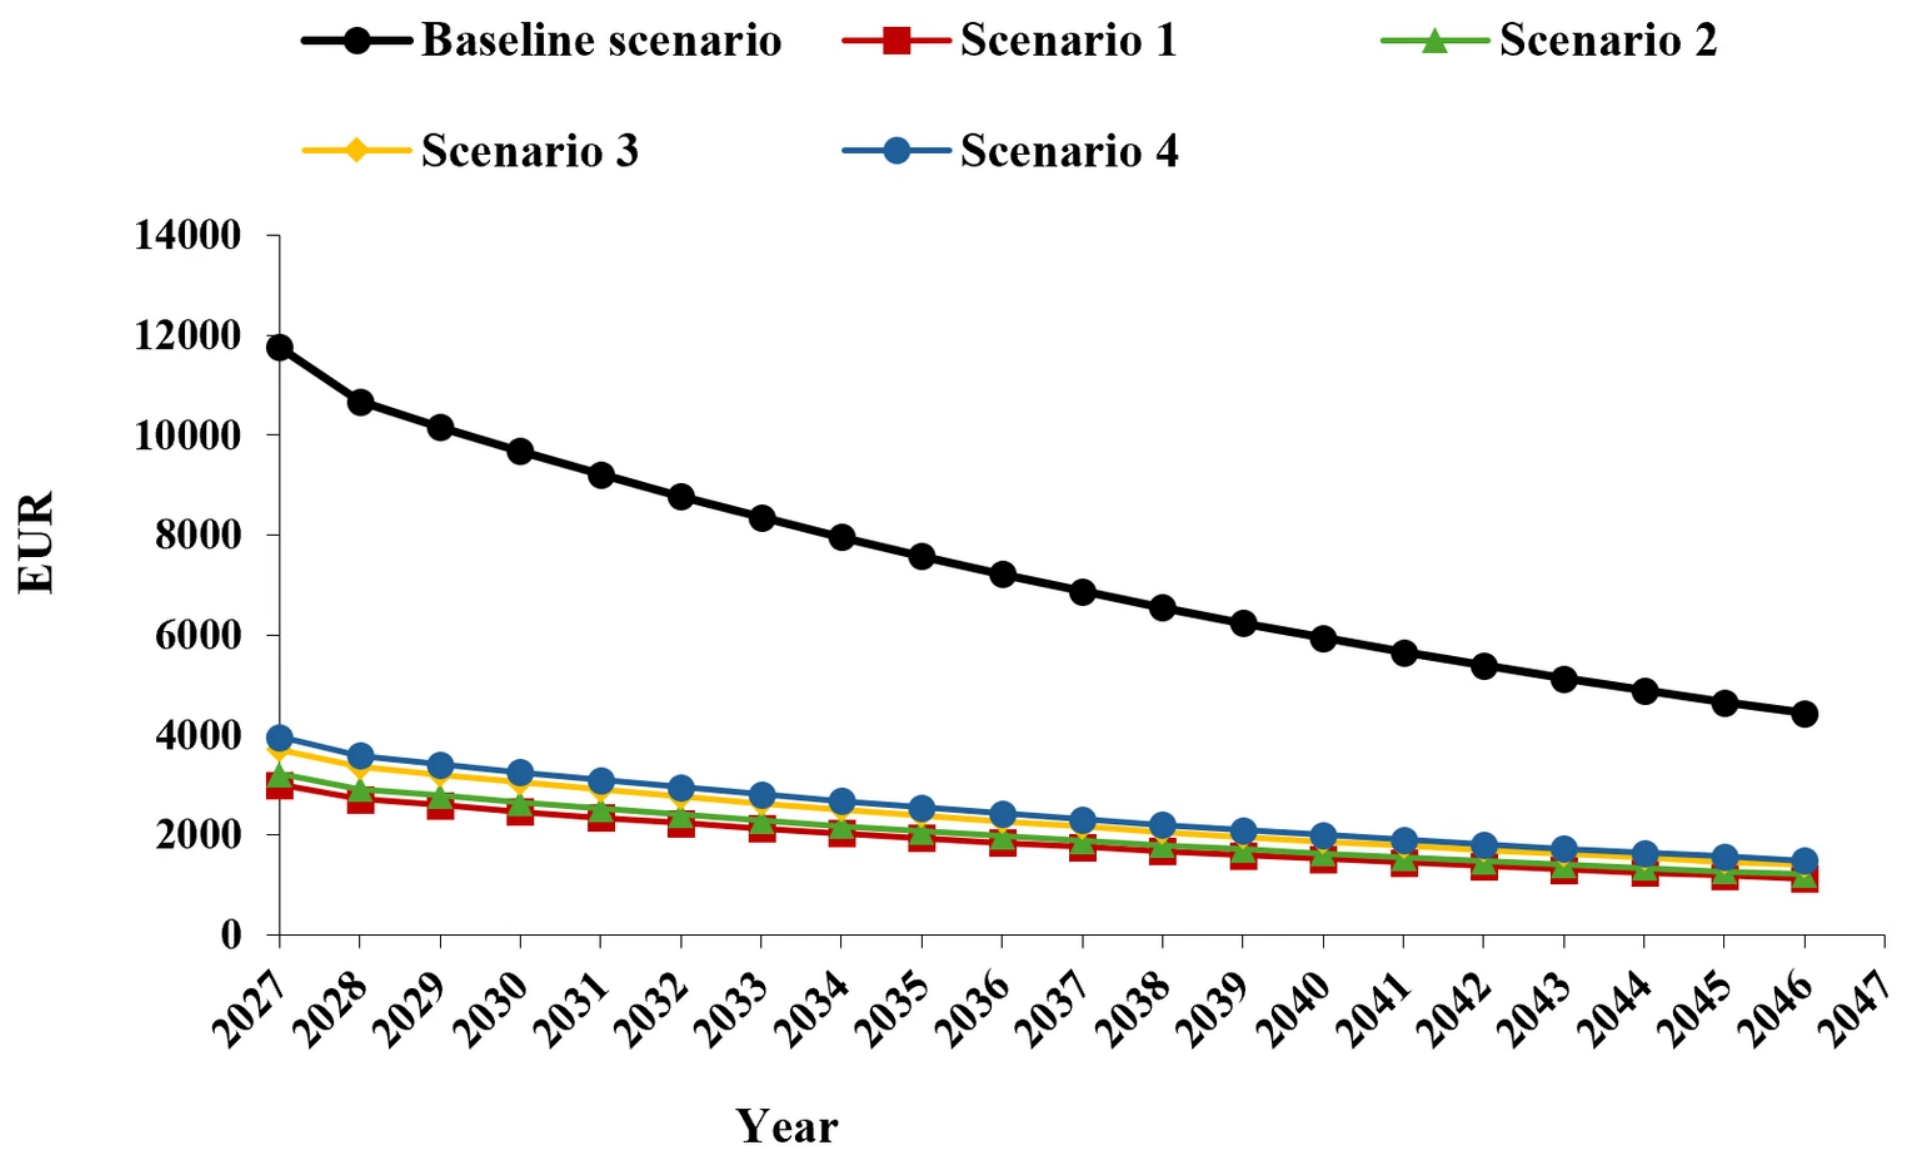

Disclaimer/Publisher’s Note: The statements, opinions and data contained in all publications are solely those of the individual author(s) and contributor(s) and not of MDPI and/or the editor(s). MDPI and/or the editor(s) disclaim responsibility for any injury to people or property resulting from any ideas, methods, instructions or products referred to in the content. |
© 2026 by the authors. Licensee MDPI, Basel, Switzerland. This article is an open access article distributed under the terms and conditions of the Creative Commons Attribution (CC BY) license.