


Abstract
Heritage managers must decide where detailed building inspections should begin as environmental pressures change across large and diverse portfolios. This study develops a digital twin-ready regional screening framework linking official heritage inventories, dated climate and vegetation observations, and transparent inspection priorities. In Fujian, China, 917 traditional-village records and 64 protected ancient-building records were compiled, of which 914 and 62, respectively, matched 75 county-level areas. The analysis uses 9900 matched county-month environmental observations from 2014 to 2024. Four environmental domains are combined with recorded heritage concentration and tourism pressure. Alternative decision weights, six input and indicator tests, and 10,000 Monte Carlo weight draws assess ranking consistency. Xiapu (0.722), Wuyishan (0.689), and Yongtai (0.655) lead the baseline inspection list. Alternative weighting scenarios yield Spearman correlations of 0.845–0.970, while a recent-state update yields 0.944. Environmental-domain exclusions produce correlations of 0.922–0.980. The framework connects province-wide prioritization with county verification, targeted digital surveys, and subsequent Heritage Building Information Modeling (HBIM). Its dated records and repeatable update rules provide a practical basis for scheduling conservation inspections as new evidence becomes available.
1. Introduction
Historic buildings and traditional settlements face environmental pressures that vary in intensity, timing, and location. Strong winds, intense rainfall, heat, persistent moisture, and vegetation changes can affect the same heritage landscape, while conservation teams must allocate a finite capacity for field inspection. Choosing where to investigate first is therefore a recurring management decision. Research has documented climate threats to cultural heritage and the growing importance of coordinated adaptation [1,2]. Studies of compound events also show why simultaneous environmental pressures need to be considered together rather than as isolated variables [3,4,5].
Digital documentation has transformed the way individual historic structures are recorded and assessed. Heritage Building Information Modeling (HBIM) connects measured geometry with historical and technical information [6,7], while scan-to-BIM and three-dimensional GIS extend that information into spatially referenced models [8]. Digital twins add a continuing relationship between physical observations, model updates, and decisions [9,10]. These advances invite a further question for conservation authorities responsible for hundreds of dispersed sites: which locations should receive detailed digital acquisition first?
Recent research in Buildings has advanced the use of digital twins throughout building operation and maintenance [11] and mapped their growing relationship with heritage documentation [12]. HBIM-based conservation workflows increasingly incorporate structured expert and stakeholder information [13,14]. Repeat photogrammetry, knowledge graphs, multilevel models, vulnerability-oriented HBIM, federated data systems, and simulation tools enrich the assessment of individual heritage assets [15,16,17,18,19,20]. Regional inspection planning can build on these capabilities by identifying locations selected for subsequent detailed investigation.
That decision emerges before a new laser scan or condition survey is commissioned. Provincial administrations coordinate protection records and inspection priorities, while county departments and site managers hold much of the local information needed to act. A useful regional screening framework must therefore combine environmental change with registered heritage locations, preserve the date and origin of each observation, and translate the resulting ranking into a clear request for on-site verification. A repeatable screening layer can link the regional allocation of surveys to the detailed work that follows.
The Fujian application develops a digital twin-ready regional screening record that connects official heritage inventories to dated environmental observations through persistent county identifiers. Keeping environmental conditions, heritage concentration, and tourism pressure separate makes the source of each inspection-priority score clear and explains why the inspection order differs from a map of environmental hotspots. Alternative weighting scenarios and Monte Carlo draws describe how the leading candidates respond to changes in planning preferences. The resulting records provide a traceable connection from provincial screening to county verification, targeted digital capture, and asset-level HBIM diagnosis. This repeatable link between regional evidence and building-specific assessment constitutes the central contribution of the study.
2. Materials and Methods
2.1. Study Area and Heritage Evidence Base
Fujian Province combines a typhoon-exposed coastline with mountainous inland settlements and a substantial stock of recorded built heritage. The heritage inventory combines the first four provincial traditional-village lists issued by the Fujian Provincial Department of Housing and Urban-Rural Development and other responsible provincial authorities, together with the Eleventh Batch of Fujian Provincial Cultural Relics Protection Units and Protection Scopes issued by the People’s Government of Fujian Province in 2026. The compiled source records contain 917 traditional-village entries and 64 protected ancient-building entries. Spatial studies have described the uneven distribution of traditional villages in Fujian and elsewhere in China, including the roles of terrain, accessibility, and settlement history [21,22,23,24]. Tourism adds a further dimension to the management of historic settlements [25].
The official inventories were harmonized to six-digit county-level administrative identifiers and joined to dated environmental observations. After geographic matching, the analytical portfolio comprises 75 counties or county-level districts, 914 village records, and 62 ancient-building entries. Table A1 reports the full matched inventory. Wind, precipitation, and temperature observations derive from the European Centre for Medium-Range Weather Forecasts ERA5-Land monthly reanalysis, distributed through the Copernicus Climate Change Service Climate Data Store. Vegetation observations derive from NASA LP DAAC’s MODIS/Terra Vegetation Indices Monthly L3 Global 1 km SIN Grid, Version 6.1 (MOD13A3). The harmonized environmental series covers 2014–2024 and contains 10,824 Fujian county-month observations, including 9900 observations for the 75 matched heritage areas. Table 1 summarizes the data sources, temporal and spatial coverage, and analytical roles of the principal datasets.
Table 1.
Data sources, analytical support, and roles.
2.2. Data Architecture and Institutional Update Responsibilities
Each county in the regional screening register has a persistent identifier and a dated record of its heritage inventory, environmental indicators, tourism pressure, and inspection-priority score. Equation (1) defines the updateable state vector, while Table 2 specifies the source, refresh cycle, and conservation use of each field. Retaining these linked records makes it possible to compare successive screening rounds and transfer a selected county to more detailed site and building assessments.
Table 2.
Regional screening fields and update rules.
In Equation (1), county i at update window w has a state vector composed of wind stress HW, heavy-rain stress HR, heat–wet stress HHW, environmental stress HE, heritage exposure E, and tourism pressure T. ERA5-Land and MOD13A3 supply dated environmental refreshes; new provincial heritage lists revise E, and new officially reported tourism statistics revise T. Each refresh is linked to its source, date, geographic unit, and generated ranking, allowing a later inspection record to be related to the screening state that prompted it.
The framework follows the administrative responsibilities through which heritage information is collected and used. National authorities establish the principal conservation rules; the Fujian provincial government and its cultural-heritage administration coordinate provincial protection records; prefecture-level departments consolidate information across counties; and county-level offices and site managers verify conditions and prepare site-specific actions. A county-level district is treated as an equivalent administrative unit in the analysis. The provincial cultural-heritage administration is the proposed steward of the shared screening register. Heritage and housing authorities would provide inventory updates, climate and vegetation products would refresh the environmental fields, and county offices would link inspection records to individual assets. The revised Law of the People’s Republic of China on the Protection of Cultural Relics, effective in March 2025, provides the legal context for these responsibilities. This sequence places province-wide prioritization and building-level assessment at clearly defined stages of conservation management.
2.3. Environmental Screening States and Compound Events
The environmental component uses four monthly measures: wind, precipitation, air temperature, and vegetation condition. Wind, rainfall, and temperature are drawn from the ERA5 reanalysis framework [26] and its land-focused ERA5-Land implementation [27]. Vegetation is measured with MOD13A3 NDVI, following the established interpretation of MODIS vegetation indices [28]. These four inputs describe complementary aspects of the environment surrounding recorded heritage and can be updated on a common monthly schedule.
Extreme monthly observations are defined relative to the pooled Fujian county-month distribution. Wind, precipitation, and temperature extremes occur above the corresponding 90th percentile; low vegetation condition occurs below the 10th percentile of scaled NDVI. The resulting thresholds are 2.999 m s−1, 294.085 mm, 26.926 °C, and 0.496, respectively. MOD13A3 NDVI values are multiplied by the published 0.0001 scale factor before analysis. A consistent empirical-quantile rule is used throughout [29]. Equation (2) defines the indicators, and Table A2 reports their thresholds and interpretation.
Equation (2) uses the indicator function 𝟙(·). Equation (3) then converts monthly extreme states into county-level event frequencies, where ni is the number of valid monthly observations for county i.
Equation (4) captures compound occurrence through the monthly intersection of relevant states. Wind–rain concurrence identifies months with simultaneous extreme wind and heavy rainfall, while heat–rain concurrence identifies simultaneous extreme heat and heavy rainfall.
Equation (5) converts each county-level frequency or trend to an empirical percentile rank across the 75 matched heritage counties. This common 0–1 support preserves ordering while preventing indicators with long-tailed physical units from dominating the composite state. Rank agreement in the sensitivity analysis is evaluated with Spearman’s coefficient [30].
Equations (6)–(9) combine normalized observations into four environmental domains. Wind stress includes extreme-wind occurrence and its coincidence with heavy rainfall. Rainfall stress combines extreme precipitation with the observed rainfall trend. Heat–wet stress captures extreme temperature and its coincidence with rainfall, while environmental stress incorporates low NDVI and vegetation change. Equation (10) averages these four domains. The separate component scores remain available alongside the aggregate, allowing readers and managers to identify the pressures responsible for a county’s position.
The mean in Equation (10) describes the environmental screening state. Heritage concentration and human-use pressure enter only at the subsequent prioritization stage, retaining separate interpretations for hazard, exposure, and decision context.
2.4. Heritage Exposure and Tourism Pressure
Heritage exposure is represented by a composite of official traditional-village and ancient-building record counts. Equation (11) applies a logarithmic transformation to the two count variables, reducing the effect of strongly concentrated registries, and places a coefficient of 0.45 on the more narrowly covered building inventory. This coefficient is a declared design choice that is assessed through alternative prioritization scenarios. The measure identifies the concentration of recorded heritage assets available for regional inspection planning.
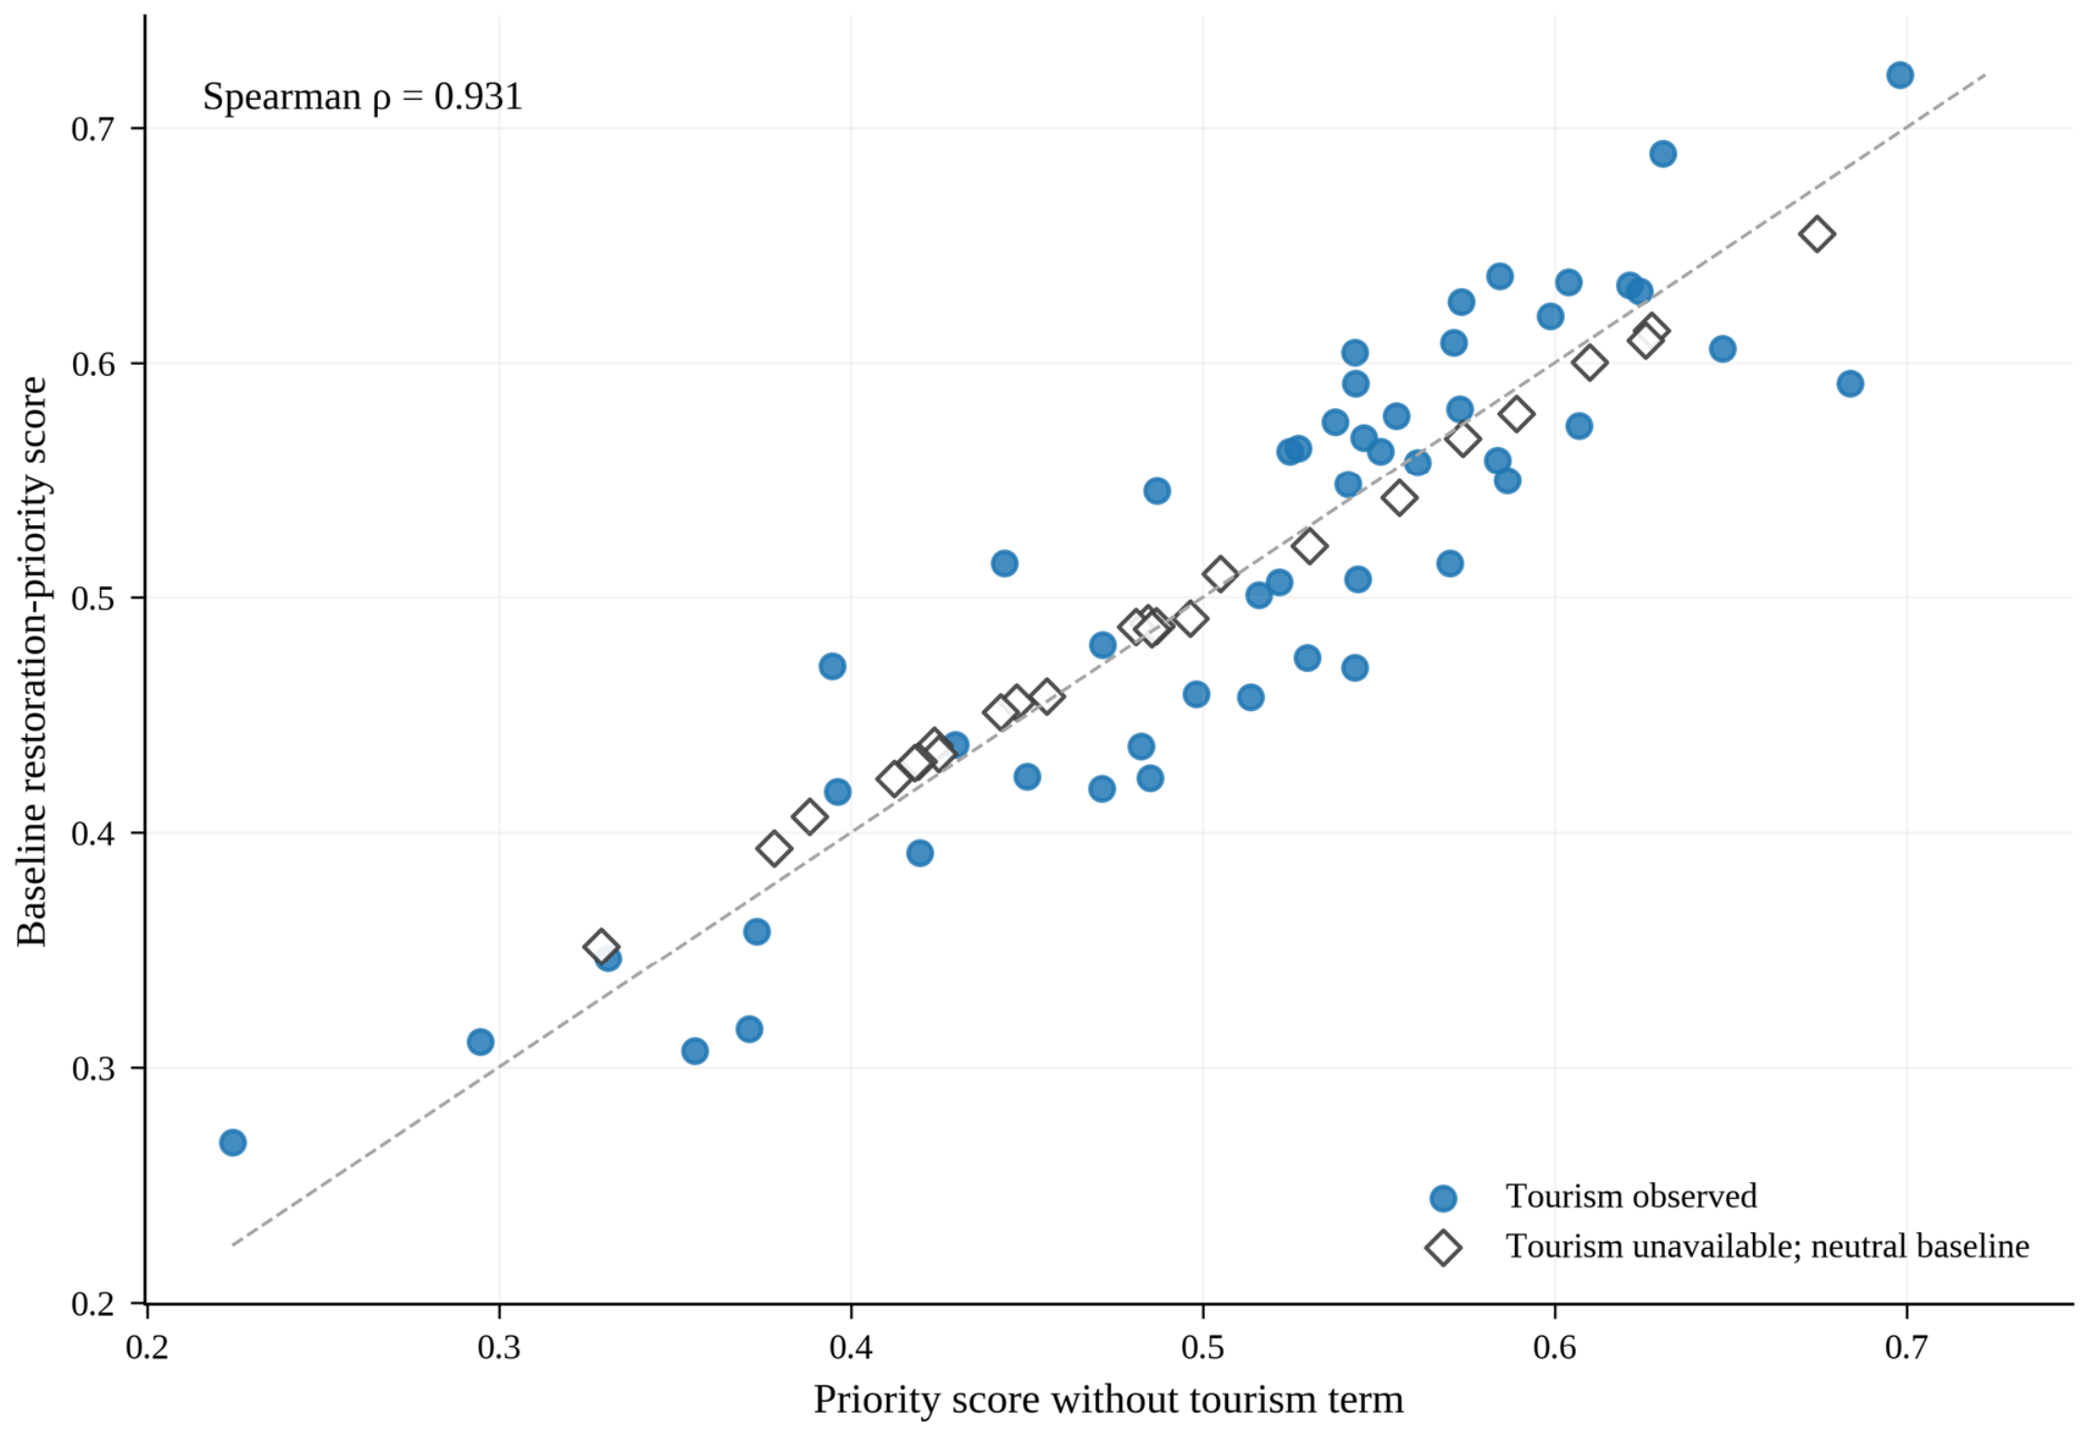
In Equation (11), Vi denotes traditional-village records in the first four provincial lists and Bi denotes ancient buildings in the eleventh provincial protection batch. Equation (12) uses the most recent tourism-revenue figures reported in county statistical yearbooks and annual statistical communiqués. Observed tourism revenue is available for 50 of the 75 matched counties. Values are log-transformed and percentile-ranked; the remaining counties receive the portfolio median in the baseline. Additional assignments and an exclusion of tourism from the score are examined in Table A6 and Figure A2.
2.5. Multi-Criteria Inspection-Priority Score and Decision Scenarios
Equation (13) combines the environmental state, recorded heritage concentration, and tourism pressure into an inspection-priority score. The baseline weights of 0.50, 0.35, and 0.15 are specified planning assumptions, not empirically calibrated conservation preferences. They place the greatest emphasis on environmental screening, followed by recorded heritage concentration and tourism-related use. A higher score indicates an earlier place in the schedule for verification, inspection, and detailed digital documentation. Research on composite indicators motivates explicit examination of weighting and aggregation decisions [31].
We compare the baseline ranking with balanced weights (0.40, 0.40, 0.20), hazard-heavy weights (0.65, 0.25, 0.10), heritage-heavy weights (0.35, 0.50, 0.15), and a tourism-free score (0.60, 0.40, 0.00). Six further scenarios test lower and upper tourism assignments for counties without observations and remove each environmental domain in turn. Rank correlation, top-ten overlap, and median absolute rank displacement are assessed together. This combination distinguishes broad portfolio agreement from shifts among the counties most likely to receive inspections first.
2.6. Weight Uncertainty, Inspection-Rank Stability, and State Updating
The Monte Carlo analysis evaluates how the ranking responds to variation in the three outer decision weights. The design uses 10,000 reproducible draws, following established uncertainty-sampling methods [32] and sensitivity-analysis principles [33]. Equation (14) draws weight vectors from a Dirichlet distribution centered on (0.50, 0.35, 0.15), with concentration 40. Equation (15) recomputes each county’s score for every draw.
For every county, the simulated scores yield a median rank, a central 90% rank interval, and the probability of appearing in the leading 10 or 20 positions. We present these measures alongside the deterministic scenarios, consistent with recommendations to examine the robustness of composite indicators across assumptions [34].
The dynamic component is illustrated by updating the environmental domains with observations from 2022 to 2024 while holding heritage records, latest reported tourism states, and outer weights fixed. The revised scores can then be compared with the 2014–2024 baseline. The same procedure can be repeated when a new monitoring period or an updated administrative inventory becomes available.
3. Results
3.1. Heritage Inventory and Environmental Screening States
The matched portfolio covers 75 county-level areas, with 914 registered traditional-village records and 62 ancient buildings. The average county has 12.19 village records (interquartile range 5–19; maximum 47) and 0.83 protected ancient buildings (maximum eight). Of the 9900 matched county-month observations, the average county frequency is 0.096 for extreme rainfall and 0.085 for both high wind and high temperature. Table 3 reports the distribution of the main inputs and scores.
Table 3.
Descriptive statistics for the heritage-county screening indicators.
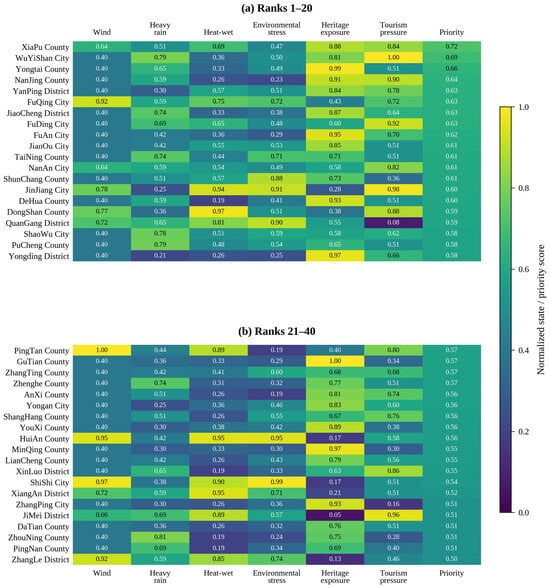
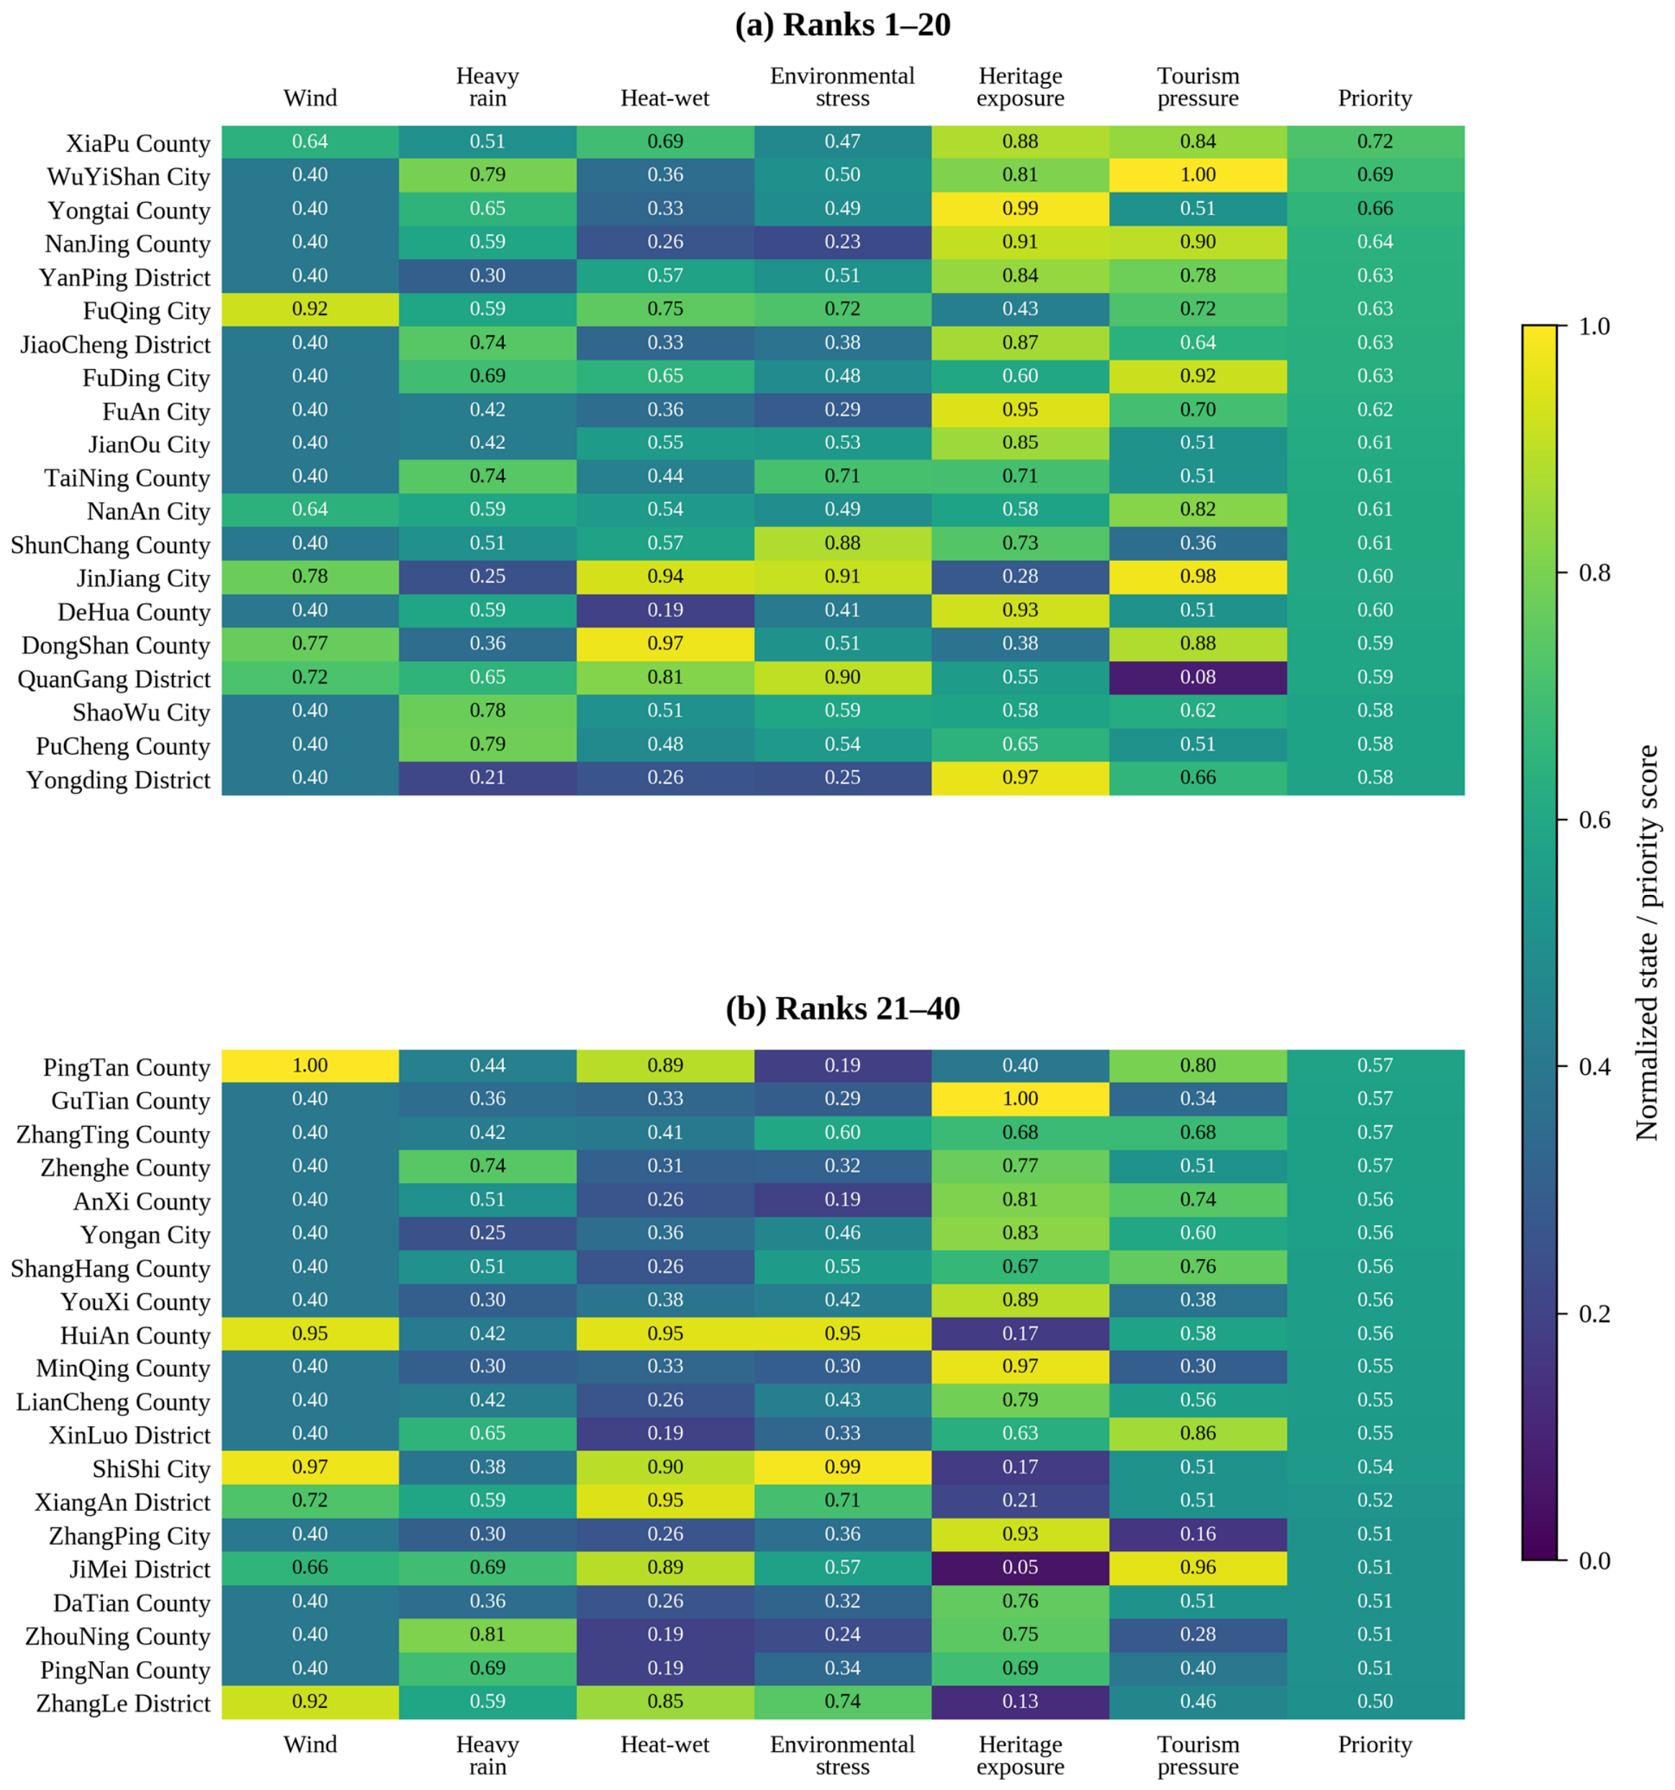
Environmental conditions and heritage concentration follow different geographic patterns. Coastal counties more often receive high wind or rainfall scores, whereas several inland counties contain larger concentrations of recorded heritage. Figure 1 displays the four environmental domains, heritage exposure, tourism pressure, and resulting inspection score for the 40 highest-ranked counties. The labeled cells make it possible to see which component raises a location’s priority.
Figure 1.
Component signatures for the 40 highest baseline inspection priorities. Panels (a,b) report ranks 1–20 and 21–40. All values are provided on a common 0–1 scale, with each cell labeled numerically; the full 75-county matched inventory is presented in Table A1.
3.2. Inspection Priorities Versus Hazard Concentration
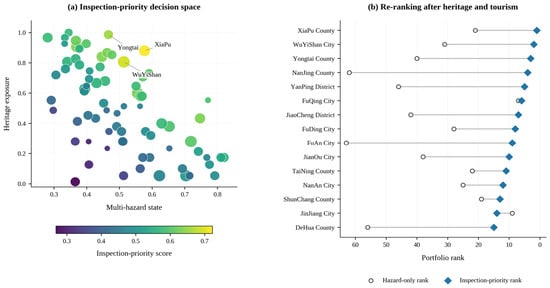
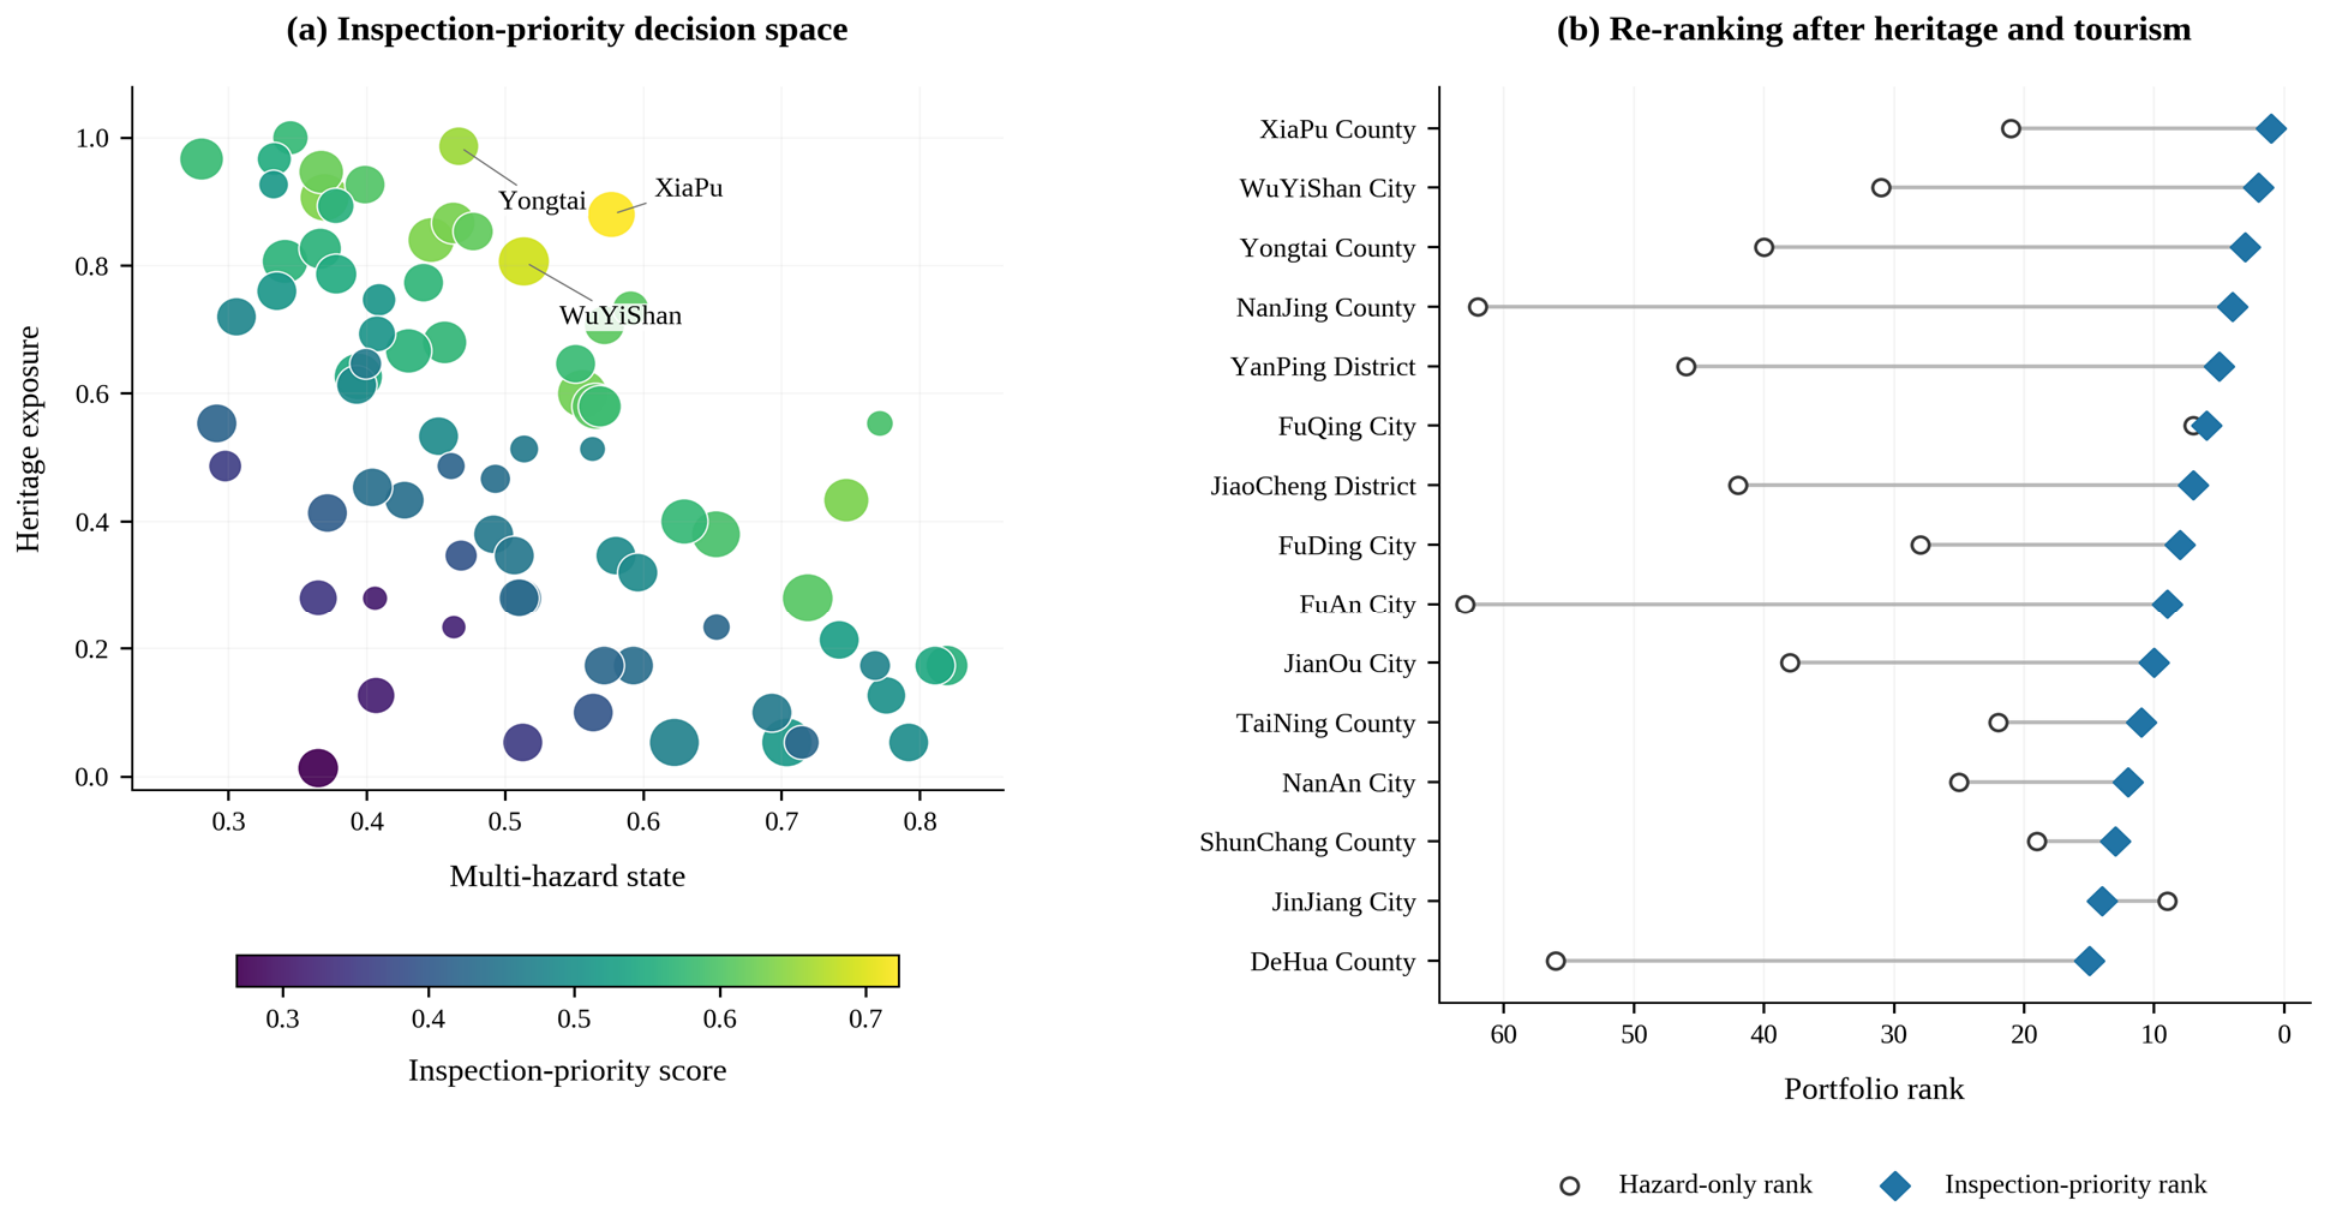
Huian has the highest composite environmental-state score (0.820), followed by Shishi (0.811), Xiuyu (0.792), Changle (0.776), Quangang (0.771), and Licheng (0.767). The inspection ranking differs because it also accounts for registered heritage concentration and tourism pressure. Xiapu ranks first (0.722), followed by Wuyishan (0.689) and Yongtai (0.655); Nanjing and Yanping complete the leading five. Figure 2a locates counties by environmental state and heritage concentration. Figure 2b compares the final inspection order with the hazard-only ranking, while Table 4 reports the 20 highest-ranked counties.
Figure 2.
Multi-criteria inspection decisions across the heritage portfolio. (a) Joint environmental and heritage exposure states for the 75 counties, with marker size representing tourism pressure and color indicating inspection priority. (b) Changes from hazard-only ranks to multi-criteria inspection-priority ranks for the leading 15 counties.
Table 4.
The 20 highest-ranked counties under the baseline inspection-priority score.
3.3. Weight-Induced Rank Stability Among Leading Inspection Candidates
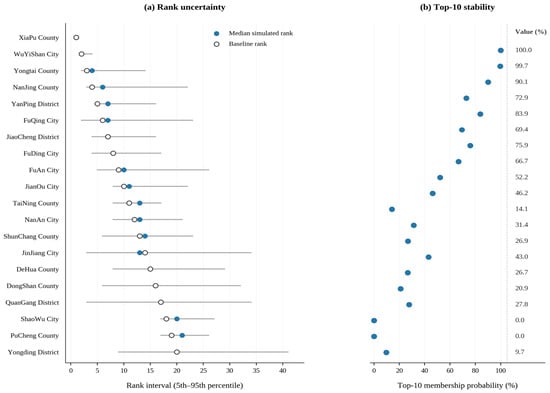
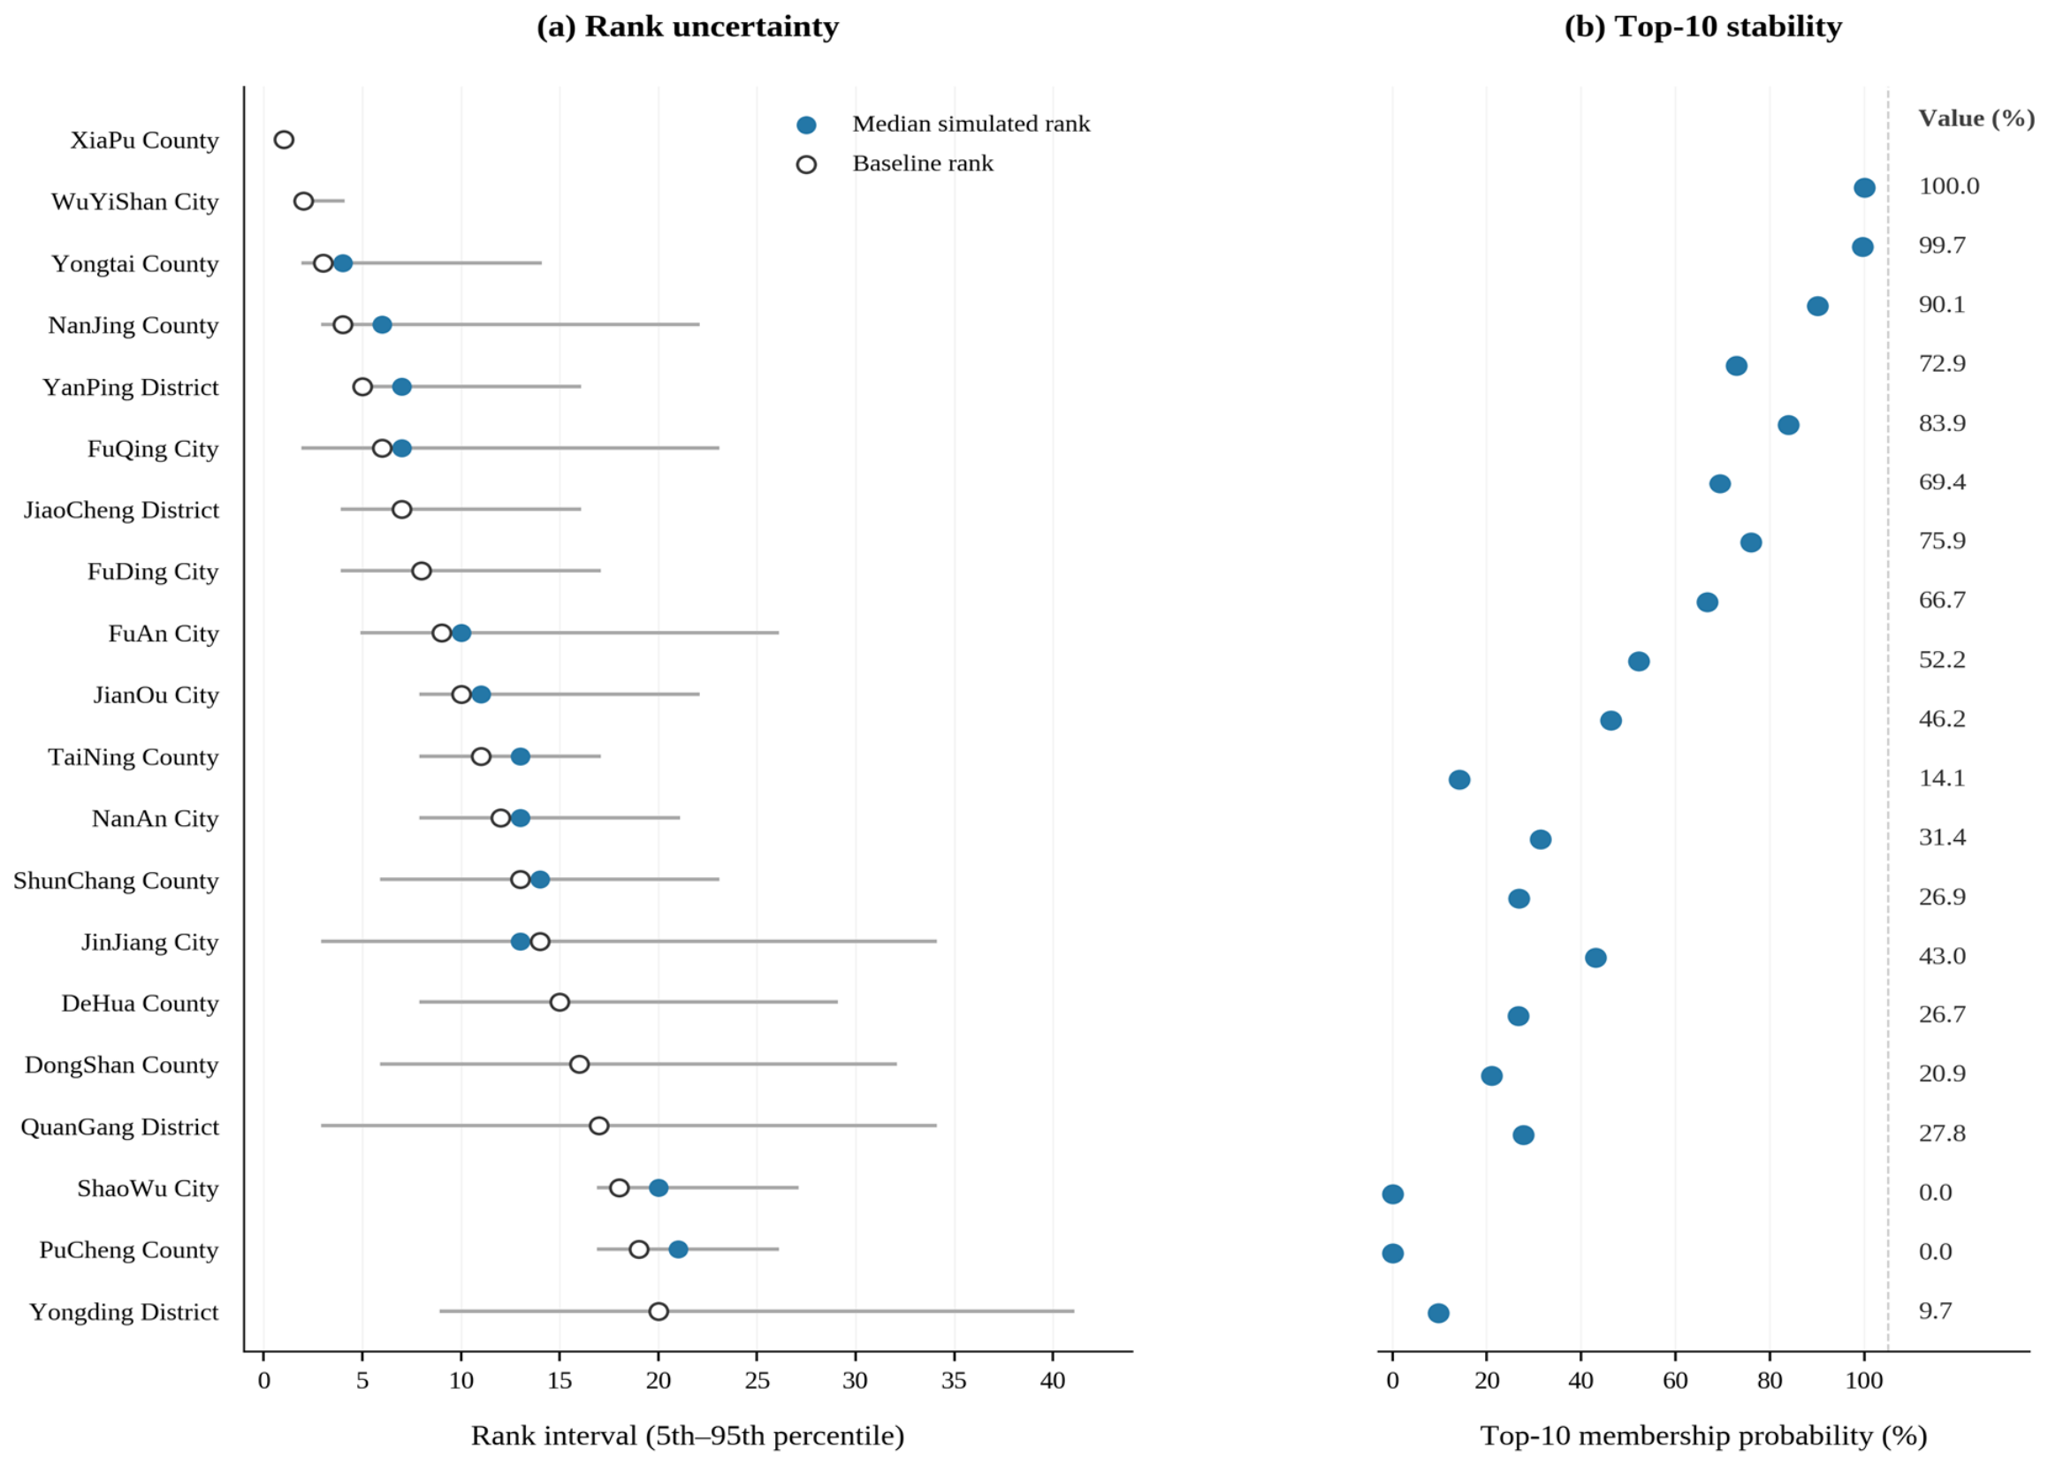
The Monte Carlo experiment identifies leading candidates whose inspection rank remains stable across alternative decision weights. Xiapu appears in the top ten in every draw, with a central 90% rank interval of 1–1. Wuyishan remains in ranks 2–4 and appears in the top ten in 99.7% of draws. Yongtai has a wider rank interval of 2–14 and a 90.1% top-ten probability. Figure 3 presents the intervals beside the corresponding top-ten probabilities; Table A4 reports these statistics for 25 counties.
Figure 3.
Stability of the 20 leading inspection priorities under 10,000 Monte Carlo weight draws. (a) Baseline and simulated median ranks with the 5th–95th percentile interval. (b) Top-10 membership probability, with all numerical percentages aligned in a separate value column.
3.4. Alternative Criteria and Data Treatments Preserve Substantial Ranking Concordance
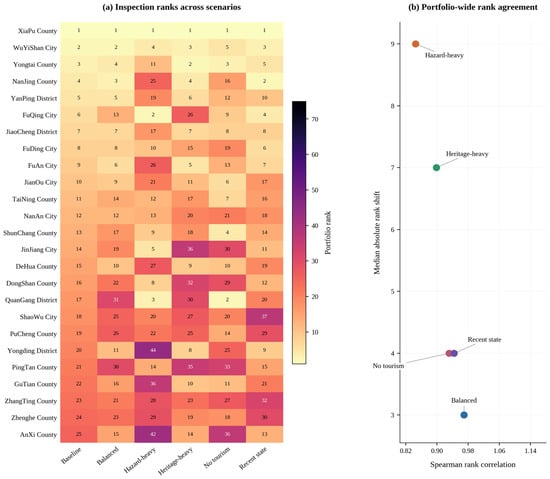
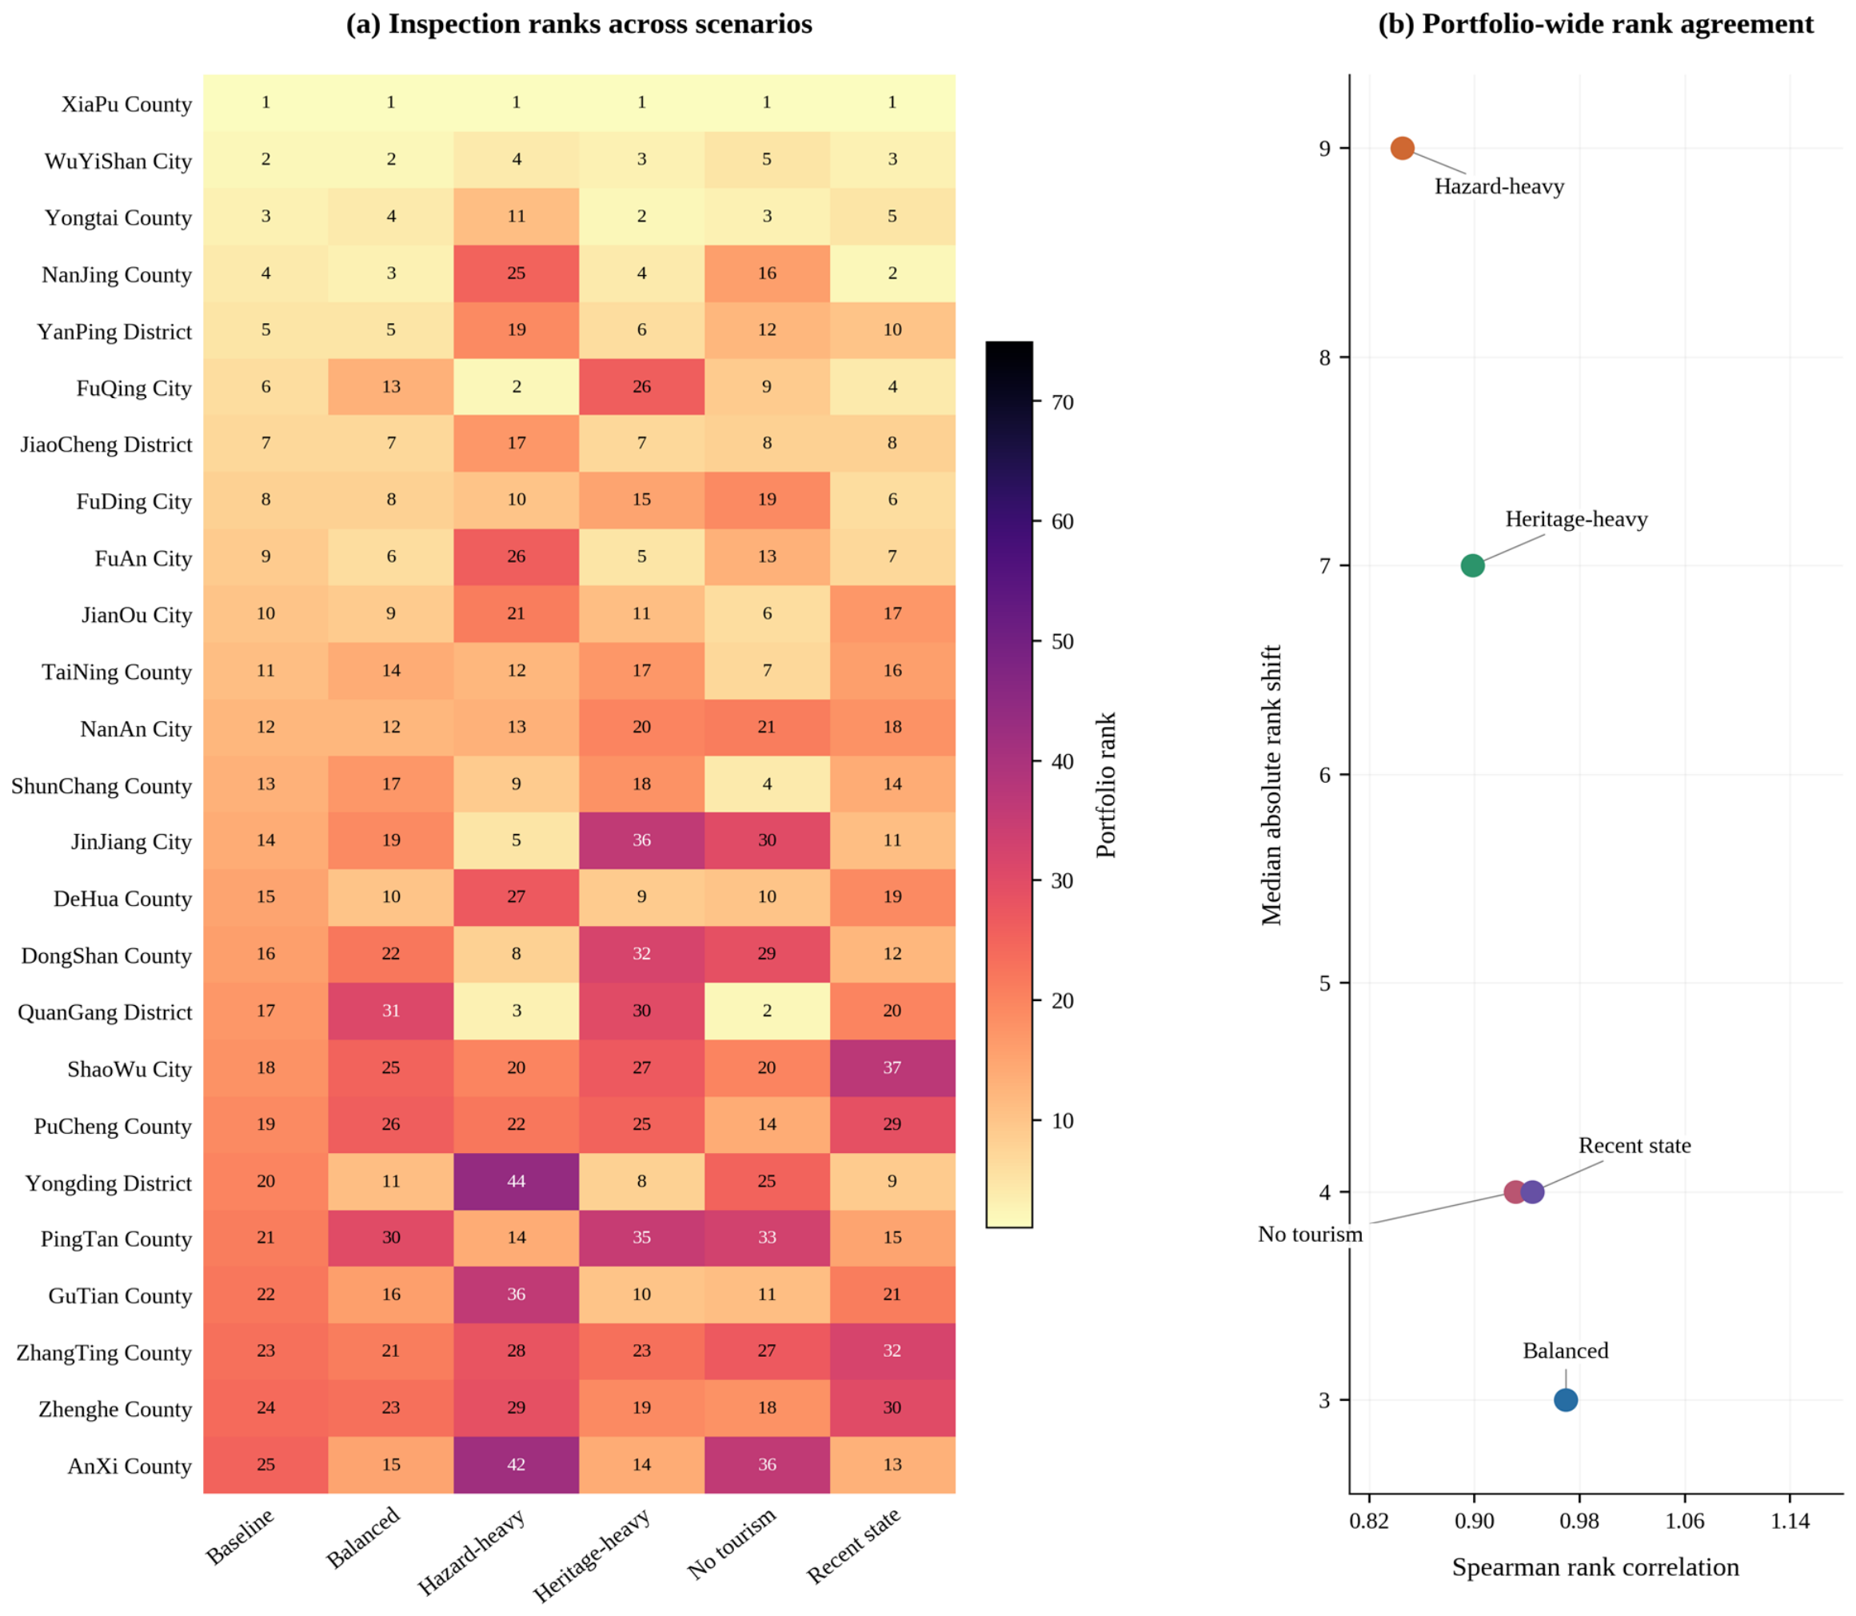
The alternative weights preserve substantial agreement across the full 75-county ranking. Spearman correlations are 0.970 under balanced weights, 0.845 with greater environmental emphasis, 0.899 with greater heritage emphasis, and 0.931 when tourism is omitted. Updating the environmental state to 2022–2024 produces a correlation of 0.944. Figure 4 shows the complete scenario ranks for the baseline top 25, while Table 5 reports the five main comparisons. Table A6 extends the analysis to tourism-data assignments and environmental-domain exclusions, reporting both rank agreement and top-ten overlap.
Figure 4.
Sensitivity of inspection-priority order. (a) Rank of each baseline top-25 county under alternative weights, tourism treatment, and recent-state updating; all cells contain exact rank values. (b) Portfolio-wide Spearman agreement and median absolute rank displacement, with separated scenario labels.
Table 5.
Rank sensitivity relative to the baseline model.
3.5. Recent-State Updates to Inspection Priorities
Updating the environmental layer with observations from 2022 to 2024 gives a Spearman rank correlation of 0.944 relative to the 2014–2024 baseline. Xiapu remains first, while Nanjing moves from fourth to second and Wuyishan from second to third. Yongding rises from twentieth to ninth and Anxi from twenty-fifth to thirteenth; Shaowu moves from eighteenth to thirty-seventh and Jianyang from forty-fifth to sixty-fourth. The county-specific changes show how dated environmental information can revise the order of candidates considered for detailed inspections while preserving substantial agreement across the wider portfolio.
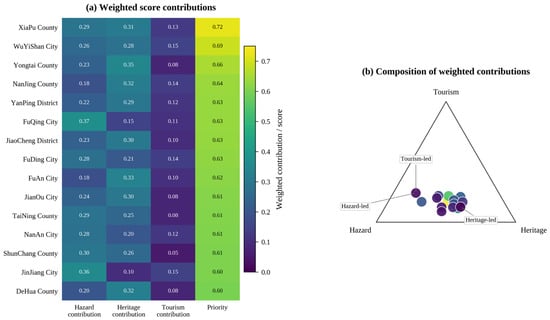
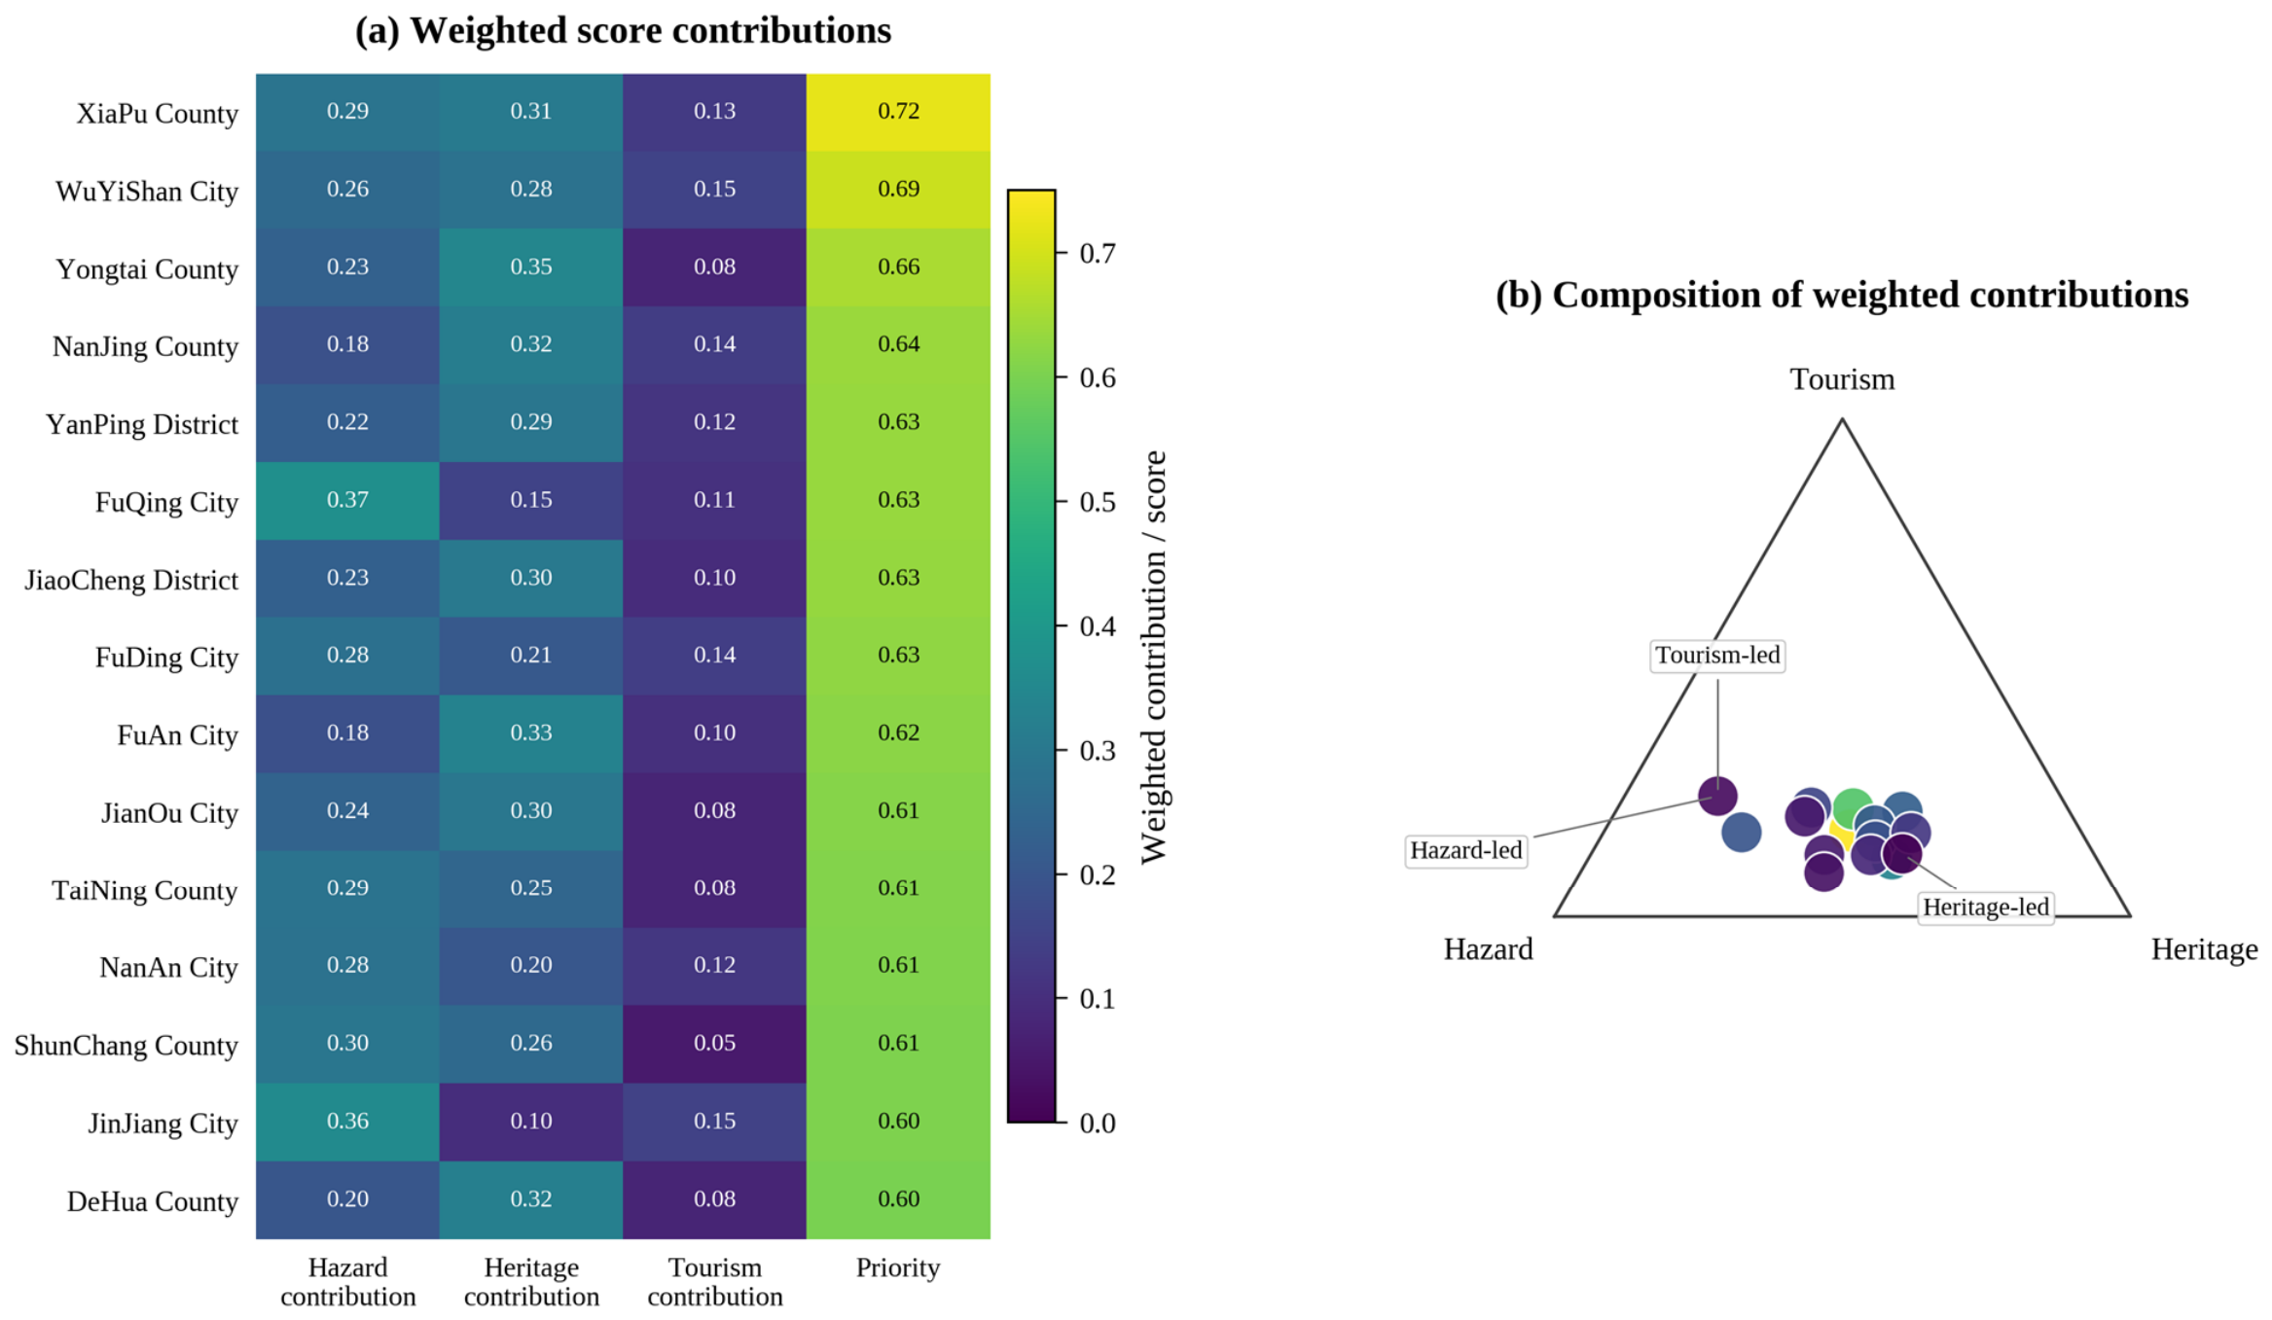
Counties with similar total scores can reach them through different combinations of evidence. Xiapu has high recorded heritage concentration and tourism pressure alongside above-median environmental stress. Wuyishan combines strong tourism pressure with very high heritage concentration; Yongtai ranks highly mainly because it contains the largest number of traditional-village records. Figure 5 decomposes the scores into labeled weighted contributions and plots their relative composition, supporting a more informative interpretation than the final rank alone.
Figure 5.
Contributions to the baseline top-15 inspection priorities. (a) Hazard, heritage, and tourism contributions to the composite inspection score, with all cells numerically labeled. (b) Relative composition of the three contributions; marker size and color represent total inspection priority.
The Appendix A provides the underlying details in the order cited here. Table A1 lists the matched heritage inventory, Table A2 the environmental thresholds, Table A3 the leading component scores, Table A4 the Monte Carlo rank distributions, Table A5 the largest rank changes after the recent-state update, and Table A6 the additional sensitivity scenarios. Figure A1 presents monthly environmental conditions, and Figure A2 compares inspection scores with and without tourism. Equations (A1) and (A2) define rank change and rank concordance, respectively.
4. Discussion
4.1. The Scientific Contribution of Regional Screening
The main contribution is a province-wide screening layer that joins official heritage inventories to dated environmental evidence and then identifies locations for detailed surveys. Building-scale research demonstrates the value of laser scanning and BIM for heritage documentation [35] and uses HBIM to connect asset information with engineering evaluation [36]. The present framework addresses the earlier portfolio decision: where should time-consuming survey and digital acquisition begin? Persistent county identifiers, known source dates, and repeatable update rules make that decision traceable across successive monitoring periods.
A review involving Xekalakis and colleagues [37] connects crowdsourced records, laser scanning, and HBIM to progressively more detailed heritage assessment. Regional screening adds a complementary first stage. Environmental records identify changing pressures, administrative registers locate the heritage requiring attention, and rank diagnostics explain how planning preferences affect the inspection schedule. These dated screening records can then accompany site-specific survey and modeling activities.
4.2. Why Environmental Hotspots and Heritage Inspection Priorities Differ
Environmental hotspots and inspection priorities need not coincide. Research on large infrastructure portfolios shows the importance of combining environmental stress with asset exposure [38]; studies of flood-related heritage vulnerability likewise distinguish physical threats from the properties of exposed buildings [39]. In Fujian, the highest environmental-state scores occur in several coastal districts, whereas the combined inspection score places Xiapu, Wuyishan, and Yongtai at the top for different reasons. This distinction is consequential when deciding where to deploy specialist survey teams.
National-scale analyses of climate threats to Chinese cultural heritage underline the value of connecting environmental observations to conservation decisions [40]. The Fujian results provide that connection through a dated screening record, a transparent county ranking, and a defined route to asset-level investigation. The framework is designed for heritage portfolios where sites are widely dispersed and survey effort must be sequenced.
4.3. Governance and Practical Conservation Pathways
Effective heritage adaptation depends on sound information, institutional coordination, and the ability to turn observations into conservation activity [41]. Assessments of World Heritage exposed to climate pressures also show why local circumstances matter [42]. For Fujian, the results suggest a differentiated inspection program: coastal locations with high wind and rainfall states can be reviewed after relevant events, while inland heritage concentrations can be considered for planned condition surveys and inventory updates. This makes the regional ranking useful to both provincial coordinators and local conservation offices.
The proposed handoff follows three stages. The provincial cultural-heritage administration maintains the common screening record and circulates ranked candidates for technical review. Prefecture and county offices verify inventory information, arrange site visits, and identify buildings requiring digital capture. Site managers and conservation professionals then undertake HBIM documentation, structural diagnosis, and intervention planning as appropriate. Inspection outcomes can be linked back to the regional record and used in subsequent screening rounds. Research on heritage disaster management and adaptation supports this coordinated approach [43,44].
4.4. Connecting Regional Screening with Asset-Level Heritage Digital Twins
The register also provides a common identifier structure for adding finer information as it becomes available. Sentinel-1 can inform surface-change monitoring [45], and Dynamic World supplies frequently updated land-cover probabilities [46]. Scalable geospatial processing [47] and mapped surface-water histories [48] can enrich the environmental context around individual heritage locations. Such extensions would retain a link to the same county and asset identifiers used in the screening record.
Coastal hazard screening can be developed further with storm-track information from the International Best Track Archive for Climate Stewardship [49]. For buildings selected for detailed study, heritage-science research emphasizes bringing together geometry, construction history, material properties, and condition surveys within HBIM [50]. The proposed information structure gives these higher-resolution studies a clear administrative entry point and keeps inspection decisions connected to their supporting regional evidence.
4.5. Positioning the Framework Within the State of the Art
Sevieri et al. [51] developed a multi-level framework in which progressively detailed surveys improve the prioritization of cultural-heritage assets. Sugiyama et al. [52] examined how the information content and functions of a Heritage Digital Twin can be assessed. This study connects these approaches at the provincial scale: a time-stamped regional screening record identifies inspection candidates, describes the evidence behind their rankings, and connects them to subsequent asset documentation. The resulting contribution lies in this repeatable connection between regional selection and building-level investigation.
The rankings retain broad agreement under the principal alternatives. Removing tourism yields Spearman ρ = 0.931, and the recent-state update yields 0.944. Environmental-domain exclusions yield 0.922–0.980 (Table A6), while the baseline first-ranked county remains in the top two in the six supplementary scenarios. Figure A2 compares the tourism-free and baseline scores. Together, these results support an inspection sequence that can be revisited transparently as new information becomes available.
4.6. Limitations
The county-scale screening combines monthly environmental observations, official heritage inventories, and tourism statistics available for 50 of the 75 matched counties. Condition surveys, construction materials, measured deterioration, prospective damage, intervention costs, and restoration feasibility are addressed in subsequent site-level assessments. Alternative tourism assignments change some positions in the leading inspection tier, and the weight simulations assess the three specified planning coefficients. The recent-state exercise illustrates retrospective updating. The ranking has not been independently validated against observed deterioration, documented intervention urgency, or expert conservation priorities. Linking future screening rounds with field-inspection results and expert evaluations will provide the evidence for further calibration.
5. Conclusions
We present a digital twin-ready screening framework that combines official heritage records with dated environmental observations to establish repeatable inspection priorities. The Fujian application matches 914 traditional-village entries and 62 protected ancient buildings to 75 county-level areas, with 9900 county-month environmental observations spanning 2014–2024. Separate records of environmental pressure, heritage concentration, and tourism use make the screening score interpretable and suitable for subsequent updates.
Xiapu, Wuyishan, and Yongtai occupy the first three baseline positions for different combinations of the three screening components. The ranking is substantially concordant under alternative weights, environmental-domain tests, and the recent-state update; Monte Carlo draws describe the stability of the leading inspection candidates. The different component profiles provide a practical reason to examine both overall rank and its supporting evidence when planning field visits.
The framework connects provincial screening with county verification and specialist digital surveys, allowing selected locations to proceed to detailed HBIM-based diagnosis. Persistent identifiers and dated source records retain the evidence behind each inspection priority and support a repeatable, accountable sequence of conservation assessments across dispersed heritage portfolios.
Author Contributions
Conceptualization, H.T. and J.Z.; methodology, H.T. and J.Z.; software and formal analysis, H.T.; data curation, H.T.; investigation, H.T. and J.Z.; writing—original draft preparation, H.T.; writing—review and editing, H.T. and J.Z.; visualization, H.T.; supervision, J.Z.; project administration, H.T.; funding acquisition, H.T. All authors have read and agreed to the published version of the manuscript.
Funding
This research was funded by the 2025 Young and Middle-Aged Teacher Education Research Project (Science and Technology) of the Fujian Provincial Department of Education, “Theoretical Framework and Engineering Practice of Precision Restoration of Ancient Buildings Enabled by Digital Twin Technology”, grant number JAT251281 (Min Jiao Ke (2025) No. 18).
Data Availability Statement
Analysis code and derived data used in this study are available from the author on reasonable request.
Acknowledgments
The authors acknowledge the public agencies and scientific data services whose published records underpin the heritage inventory and environmental indicators.
Conflicts of Interest
The authors declare no conflicts of interest.
Appendix A
Table A1.
Heritage inventory and exposure score for the 75 matched counties.
Table A2.
Environmental-state thresholds and compound indicators.
Table A3.
Component diagnostics for the baseline top 25 counties.
Table A4.
Monte Carlo rank uncertainty for the baseline top 25.
Table A5.
Largest rank changes after updating the environmental state to 2022–2024.
Table A6.
Inspection-rank concordance under additional source and indicator sensitivity scenarios.
Figure A1.
Standardized monthly climatology of ERA5-Land wind, precipitation, and temperature and MOD13A3 NDVI across Fujian, 2014–2024. Every heatmap cell reports the standardized monthly value.
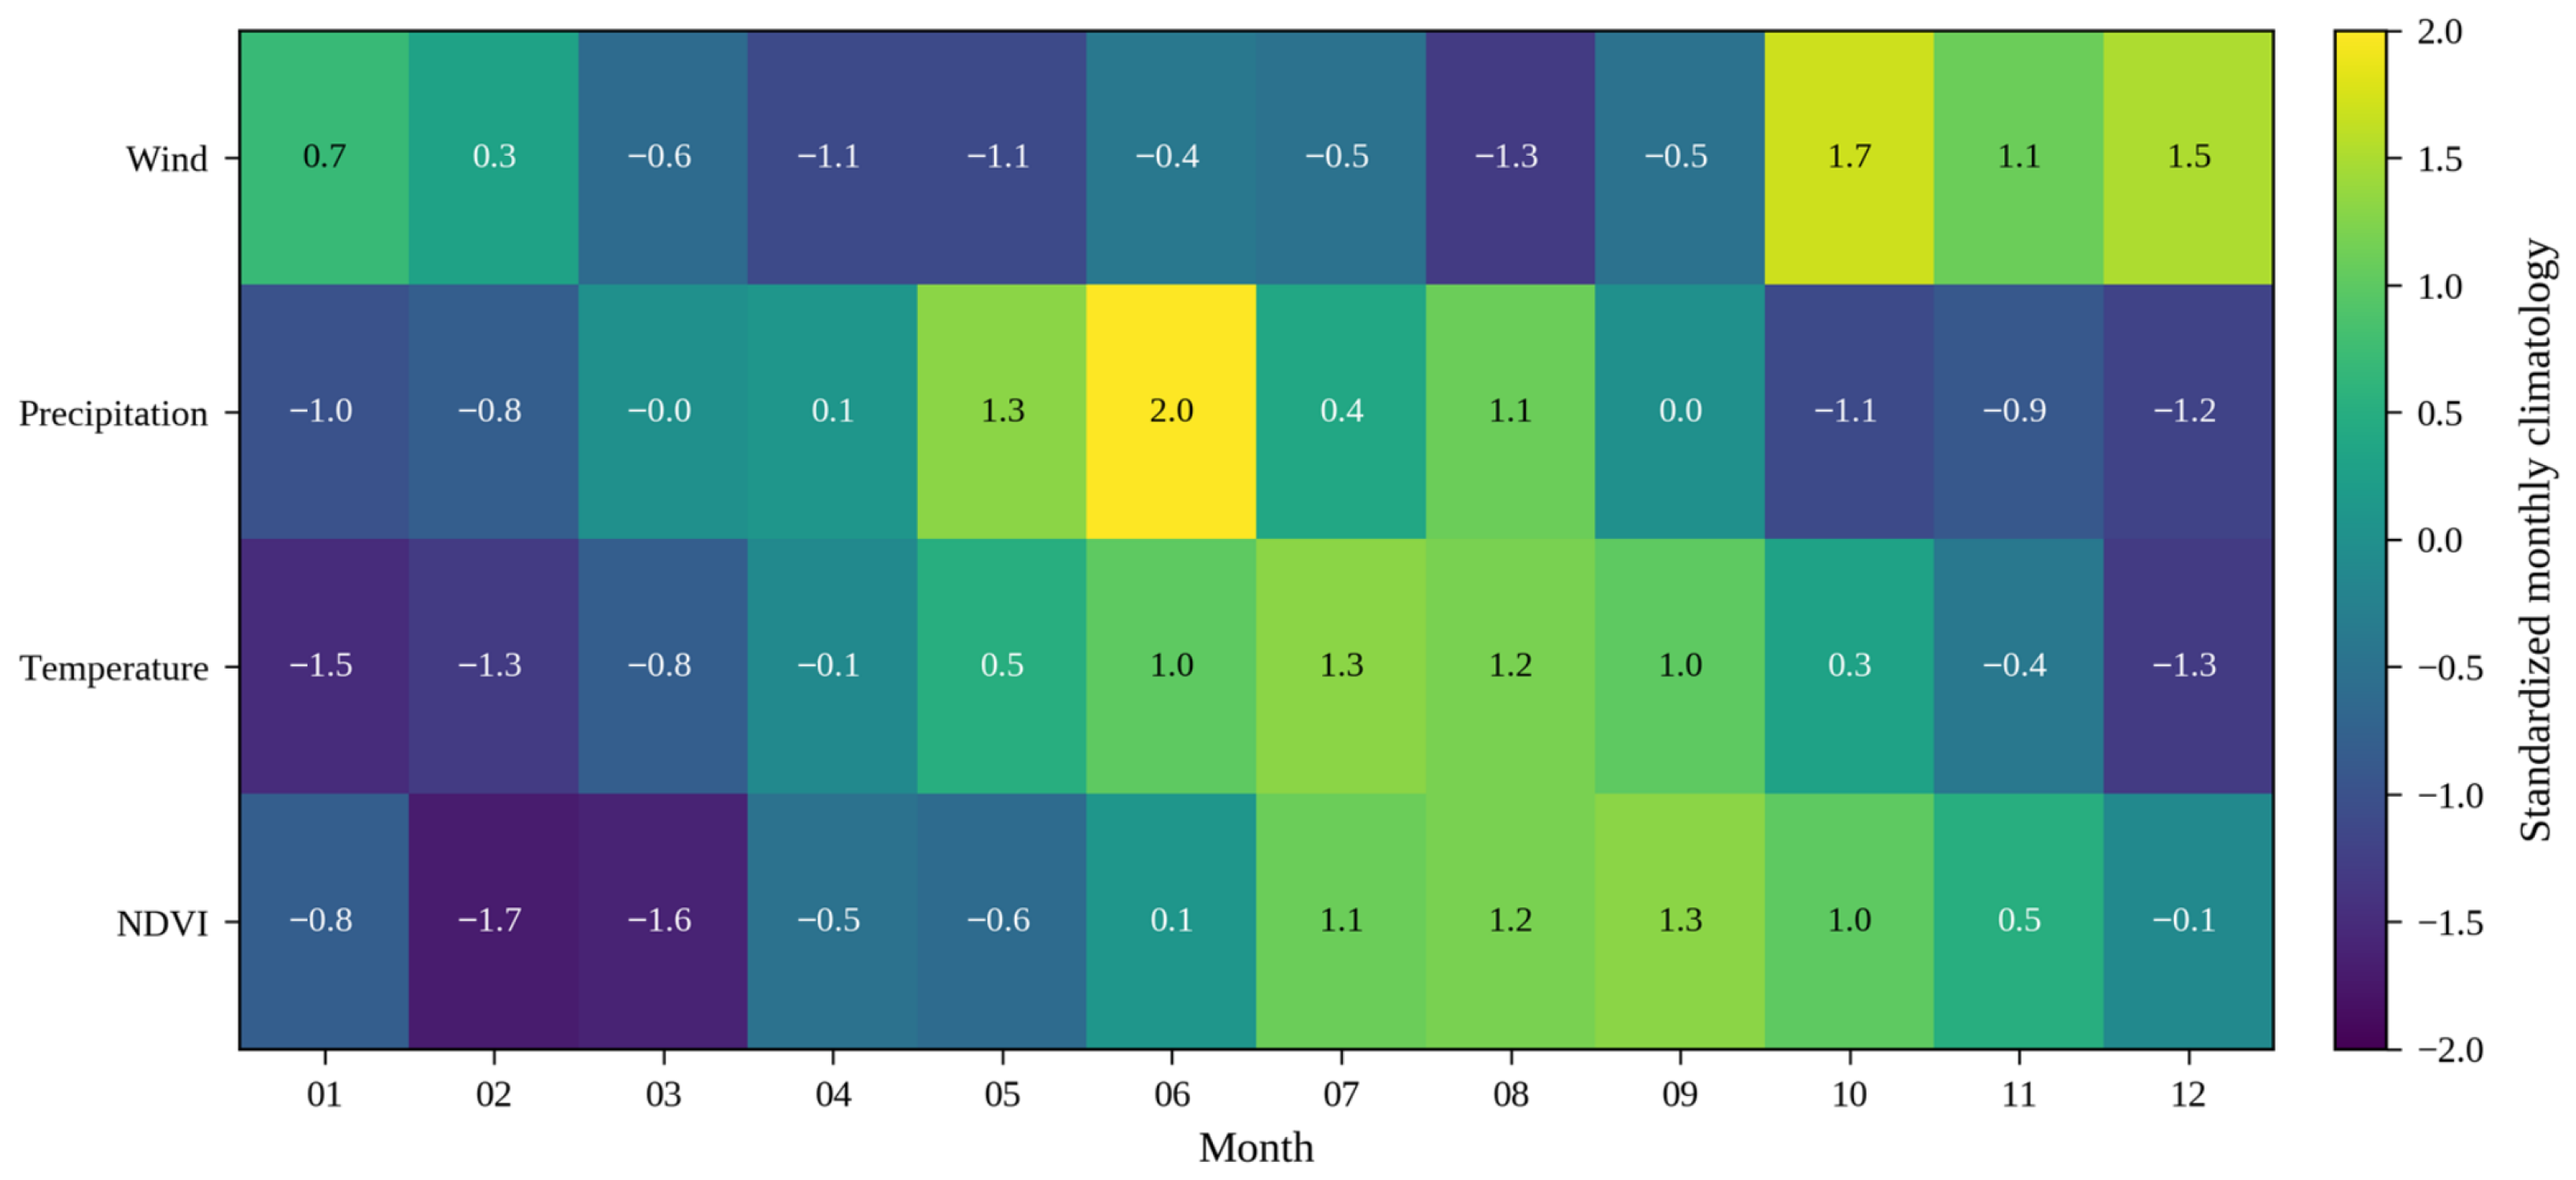
Figure A2.
Baseline priority compared with a specification that omits tourism pressure. Marker type distinguishes counties with an observed tourism value from counties receiving the neutral median tourism state in the baseline.
References
- Fatorić, S.; Seekamp, E. Are cultural heritage and resources threatened by climate change? A systematic literature review. Clim. Change 2017, 142, 227–254. [Google Scholar] [CrossRef] [Scilit]
- Sesana, E.; Gagnon, A.S.; Ciantelli, C.; Cassar, J.A.; Hughes, J.J. Climate change impacts on cultural heritage: A literature review. WIREs Clim. Change 2021, 12, e710. [Google Scholar] [CrossRef] [Scilit]
- Zscheischler, J.; Westra, S.; van den Hurk, B.J.J.M.; Seneviratne, S.I.; Ward, P.J.; Pitman, A.; AghaKouchak, A.; Bresch, D.N.; Leonard, M.; Wahl, T.; et al. Future climate risk from compound events. Nat. Clim. Change 2018, 8, 469–477. [Google Scholar] [CrossRef] [Scilit]
- Gill, J.C.; Malamud, B.D. Reviewing and visualizing the interactions of natural hazards. Rev. Geophys. 2014, 52, 680–722. [Google Scholar] [CrossRef] [Scilit]
- Tilloy, A.; Malamud, B.D.; Winter, H.; Joly-Laugel, A. A review of quantification methodologies for multi-hazard interrelationships. Earth-Sci. Rev. 2019, 196, 102881. [Google Scholar] [CrossRef] [Scilit]
- Murphy, M.; McGovern, E.; Pavia, S. Historic building information modelling (HBIM). Struct. Surv. 2009, 27, 311–327. [Google Scholar] [CrossRef] [Scilit]
- Murphy, M.; McGovern, E.; Pavia, S. Historic Building Information Modelling—Adding intelligence to laser and image based surveys of European classical architecture. ISPRS J. Photogramm. Remote Sens. 2013, 76, 89–102. [Google Scholar] [CrossRef] [Scilit]
- Pepe, M.; Costantino, D.; Alfio, V.S.; Garofalo Restuccia, A.; Papalino, N.M. Scan to BIM for the digital management and representation in 3D GIS environment of cultural heritage site. J. Cult. Herit. 2021, 50, 115–125. [Google Scholar] [CrossRef] [Scilit]
- Boje, C.; Guerriero, A.; Kubicki, S.; Rezgui, Y. Towards a semantic Construction Digital Twin: Directions for future research. Autom. Constr. 2020, 114, 103179. [Google Scholar] [CrossRef] [Scilit]
- AlBalkhy, W.; Karmaoui, D.; Ducoulombier, L.; Lafhaj, Z.; Linner, T. Digital twins in the built environment: Definition, applications, and challenges. Autom. Constr. 2024, 162, 105368. [Google Scholar] [CrossRef] [Scilit]
- Lauria, M.; Azzalin, M. Digital Twin Approach in Buildings: Future Challenges via a Critical Literature Review. Buildings 2024, 14, 376. [Google Scholar] [CrossRef] [Scilit]
- Wang, Y.; García Valldecabres, J.L.; Escudero, P.A. HBIM and Digital Twin in Architectural Heritage: A Bibliometric Analysis and Future Research Directions. Buildings 2026, 16, 2762. [Google Scholar] [CrossRef] [Scilit]
- Khan, M.S.; Khan, M.; Bughio, M.; Talpur, B.D.; Kim, I.S.; Seo, J. An Integrated HBIM Framework for the Management of Heritage Buildings. Buildings 2022, 12, 964. [Google Scholar] [CrossRef] [Scilit]
- Liu, J.; Foreman, G.; Sattineni, A.; Li, B. Integrating Stakeholders’ Priorities into Level of Development Supplemental Guidelines for HBIM Implementation. Buildings 2023, 13, 530. [Google Scholar] [CrossRef] [Scilit]
- Kong, X.; Hucks, R.G. Preserving our heritage: A photogrammetry-based digital twin framework for monitoring deteriorations of historic structures. Autom. Constr. 2023, 152, 104928. [Google Scholar] [CrossRef]
- Hosamo, H.; Mazzetto, S. Integrating Knowledge Graphs and Digital Twins for Heritage Building Conservation. Buildings 2025, 15, 16. [Google Scholar] [CrossRef] [Scilit]
- Wang, G.; Wang, Y.; Guo, M.; Liang, X.; Fu, Y.; Li, H. Research on Value-Chain-Driven Multi-Level Digital Twin Models for Architectural Heritage. Buildings 2025, 15, 2984. [Google Scholar] [CrossRef] [Scilit]
- Meriggi, P.; Bianchini Ciampoli, L. V-HBIM: A Vulnerability-Oriented Heritage BIM Workflow for Cultural Heritage Conservation. Buildings 2026, 16, 2570. [Google Scholar] [CrossRef] [Scilit]
- Massafra, A.; Coraglia, U.M.; Di Turi, S.; Palladino, D. Federated Data Modelling for Heritage Building Performance Management. Buildings 2026, 16, 27. [Google Scholar] [CrossRef] [Scilit]
- Zhao, Y.; Li, K.; Zhang, W. Digital Twin–Based Simulation and Decision-Making Framework for the Renewal Design of Urban Industrial Heritage Buildings and Environments: A Case Study of the Xi’an Old Steel Plant Industrial Park. Buildings 2025, 15, 4367. [Google Scholar] [CrossRef] [Scilit]
- Ma, Y.; Zhang, Q.; Huang, L. Spatial distribution characteristics and influencing factors of traditional villages in Fujian Province, China. Humanit. Soc. Sci. Commun. 2023, 10, 883. [Google Scholar] [CrossRef] [Scilit]
- Chen, W.; Yang, Z.; Yang, L.; Wu, J.; Bian, J.; Zeng, J.; Liu, Z. Identifying the spatial differentiation factors of traditional villages in China. Herit. Sci. 2023, 11, 149. [Google Scholar] [CrossRef] [Scilit]
- Liu, W.; Xue, Y.; Shang, C. Spatial distribution analysis and driving factors of traditional villages in Henan province: A comprehensive approach via geospatial techniques and statistical models. Herit. Sci. 2023, 11, 185. [Google Scholar] [CrossRef] [Scilit]
- Ma, H.; Tong, Y. Spatial differentiation of traditional villages using ArcGIS and GeoDa: A case study of Southwest China. Ecol. Inform. 2022, 68, 101416. [Google Scholar] [CrossRef] [Scilit]
- Gao, J.; Wu, B. Revitalizing traditional villages through rural tourism: A case study of Yuanjia Village, Shaanxi Province, China. Tour. Manag. 2017, 63, 223–233. [Google Scholar] [CrossRef] [Scilit]
- Hersbach, H.; Bell, B.; Berrisford, P.; Hirahara, S.; Horányi, A.; Muñoz-Sabater, J.; Nicolas, J.; Peubey, C.; Radu, R.; Schepers, D.; et al. The ERA5 global reanalysis. Q. J. R. Meteorol. Soc. 2020, 146, 1999–2049. [Google Scholar] [CrossRef] [Scilit]
- Muñoz-Sabater, J.; Dutra, E.; Agustí-Panareda, A.; Albergel, C.; Arduini, G.; Balsamo, G.; Boussetta, S.; Choulga, M.; Harrigan, S.; Hersbach, H.; et al. ERA5-Land: A state-of-the-art global reanalysis dataset for land applications. Earth Syst. Sci. Data 2021, 13, 4349–4383. [Google Scholar] [CrossRef] [Scilit]
- Huete, A.; Didan, K.; Miura, T.; Rodriguez, E.P.; Gao, X.; Ferreira, L.G. Overview of the radiometric and biophysical performance of the MODIS vegetation indices. Remote Sens. Environ. 2002, 83, 195–213. [Google Scholar] [CrossRef] [Scilit]
- Hyndman, R.J.; Fan, Y. Sample quantiles in statistical packages. Am. Stat. 1996, 50, 361–365. [Google Scholar] [CrossRef] [Scilit]
- Spearman, C. The proof and measurement of association between two things. Am. J. Psychol. 1904, 15, 72–101. [Google Scholar] [CrossRef] [Scilit]
- Greco, S.; Ishizaka, A.; Tasiou, M.; Torrisi, G. On the methodological framework of composite indices: A review of the issues of weighting, aggregation, and robustness. Soc. Indic. Res. 2019, 141, 61–94. [Google Scholar] [CrossRef] [Scilit]
- Helton, J.C.; Davis, F.J. Latin hypercube sampling and the propagation of uncertainty in analyses of complex systems. Reliab. Eng. Syst. Saf. 2003, 81, 23–69. [Google Scholar] [CrossRef] [Scilit]
- Saltelli, A.; Annoni, P.; Azzini, I.; Campolongo, F.; Ratto, M.; Tarantola, S. Variance based sensitivity analysis of model output. Design and estimator for the total sensitivity index. Comput. Phys. Commun. 2010, 181, 259–270. [Google Scholar] [CrossRef] [Scilit]
- Saisana, M.; Saltelli, A.; Tarantola, S. Uncertainty and sensitivity analysis techniques as tools for the quality assessment of composite indicators. J. R. Stat. Soc. Ser. A Stat. Soc. 2005, 168, 307–323. [Google Scholar] [CrossRef] [Scilit]
- Willkens, D.S.; Liu, J.; Alathamneh, S. A Case Study of Integrating Terrestrial Laser Scanning (TLS) and Building Information Modeling (BIM) in Heritage Bridge Documentation: The Edmund Pettus Bridge. Buildings 2024, 14, 1940. [Google Scholar] [CrossRef] [Scilit]
- Bonaguidi, L.; Sebastiani, C.; Santini, S. Sustainable Seismic Energy Assessment of Italian Residential Heritage in Reinforced Concrete with Masonry Infills: An HBIM Evaluation Tool. Buildings 2024, 14, 4050. [Google Scholar] [CrossRef] [Scilit]
- Christoforou, E.; Klitou, T.; Douni, O.; Apostolidou, E.; Afxentiou, N.; Schetakis, N.; Xekalakis, G.; Christou, P.; Di Iorio, A.; Stavroulakis, G.; et al. From Crowdsourcing to TLS–BIM/HBIM Workflows for Cultural Heritage Documentation and Structural Assessment: A Review. Buildings 2026, 16, 3066. [Google Scholar] [CrossRef] [Scilit]
- Koks, E.E.; Rozenberg, J.; Zorn, C.; Tariverdi, M.; Vousdoukas, M.; Fraser, S.A.; Hall, J.W.; Hallegatte, S. A global multi-hazard risk analysis of road and railway infrastructure assets. Nat. Commun. 2019, 10, 2677. [Google Scholar] [CrossRef] [Scilit]
- Salazar, L.G.F.; Figueiredo, R.; Romão, X. Flood vulnerability assessment of built cultural heritage: Literature review and identification of indicators. Int. J. Disaster Risk Reduct. 2024, 111, 104666. [Google Scholar] [CrossRef] [Scilit]
- Lei, T.; Wang, J.; Jiang, Y.; Sun, S.; Simpson, N.P.; Pang, X.; Shen, B.; Wu, Y.; Wu, Y.; Wang, Q.; et al. Climate risk assessment of China’s Cultural World Heritage highlights urgent need for adaptation. npj Herit. Sci. 2026, 14, 257. [Google Scholar] [CrossRef] [Scilit]
- Phillips, H. The capacity to adapt to climate change at heritage sites—The development of a conceptual framework. Environ. Sci. Policy 2015, 47, 118–125. [Google Scholar] [CrossRef] [Scilit]
- Reimann, L.; Vafeidis, A.T.; Brown, S.; Hinkel, J.; Tol, R.S.J. Mediterranean UNESCO World Heritage at risk from coastal flooding and erosion due to sea-level rise. Nat. Commun. 2018, 9, 4161. [Google Scholar] [CrossRef] [Scilit]
- Durrant, L.J.; Vadher, A.N.; Teller, J. Disaster risk management and cultural heritage: The perceptions of European world heritage site managers on disaster risk management. Int. J. Disaster Risk Reduct. 2023, 89, 103625. [Google Scholar] [CrossRef] [Scilit]
- Aktürk, G.; Hauser, S.J. Integrated understanding of climate change and disaster risk for building resilience of cultural heritage sites. Nat. Hazards 2025, 121, 4309–4334. [Google Scholar] [CrossRef] [Scilit]
- Torres, R.; Snoeij, P.; Geudtner, D.; Bibby, D.; Davidson, M.; Attema, E.; Potin, P.; Rommen, B.; Floury, N.; Brown, M.; et al. GMES Sentinel-1 mission. Remote Sens. Environ. 2012, 120, 9–24. [Google Scholar] [CrossRef] [Scilit]
- Brown, C.F.; Brumby, S.P.; Guzder-Williams, B.; Birch, T.; Hyde, S.B.; Mazzariello, J.; Czerwinski, W.; Pasquarella, V.J.; Haertel, R.; Ilyushchenko, S.; et al. Dynamic World, Near real-time global 10 m land use land cover mapping. Sci. Data 2022, 9, 251. [Google Scholar] [CrossRef] [Scilit]
- Gorelick, N.; Hancher, M.; Dixon, M.; Ilyushchenko, S.; Thau, D.; Moore, R. Google Earth Engine: Planetary-scale geospatial analysis for everyone. Remote Sens. Environ. 2017, 202, 18–27. [Google Scholar] [CrossRef] [Scilit]
- Pekel, J.-F.; Cottam, A.; Gorelick, N.; Belward, A.S. High-resolution mapping of global surface water and its long-term changes. Nature 2016, 540, 418–422. [Google Scholar] [CrossRef] [Scilit] [PubMed]
- Knapp, K.R.; Kruk, M.C.; Levinson, D.H.; Diamond, H.J.; Neumann, C.J. The International Best Track Archive for Climate Stewardship (IBTrACS): Unifying tropical cyclone best track data. Bull. Am. Meteorol. Soc. 2010, 91, 363–376. [Google Scholar] [CrossRef] [Scilit]
- Pocobelli, D.P.; Boehm, J.; Bryan, P.; Still, J.; Grau-Bové, J. BIM for heritage science: A review. Herit. Sci. 2018, 6, 30. [Google Scholar] [CrossRef] [Scilit]
- Sevieri, G.; Galasso, C.; D’Ayala, D.; De Jesus, R.; Oreta, A.; Grio, M.E.D.A.; Ibabao, R. A Multi-Hazard Risk Prioritisation Framework for Cultural Heritage Assets. Nat. Hazards Earth Syst. Sci. 2020, 20, 1391–1414. [Google Scholar] [CrossRef] [Scilit]
- Sugiyama, G.; Bourgeois, I.; Rodrigues, H. A Holistic Methodology for the Assessment of Heritage Digital Twin Applied to Portuguese Case Studies. Digit. Appl. Archaeol. Cult. Herit. 2025, 36, e00390. [Google Scholar] [CrossRef] [Scilit]

Disclaimer/Publisher’s Note: The statements, opinions and data contained in all publications are solely those of the individual author(s) and contributor(s) and not of MDPI and/or the editor(s). MDPI and/or the editor(s) disclaim responsibility for any injury to people or property resulting from any ideas, methods, instructions or products referred to in the content. |
© 2026 by the authors. Licensee MDPI, Basel, Switzerland. This article is an open access article distributed under the terms and conditions of the Creative Commons Attribution (CC BY) license.