


Abstract
Existing studies on embodied carbon in buildings have mainly focused on total accounting or single intensity indicators, with limited attention to long-term material accumulation, annual incremental embodied carbon, and inter-city differences in carbon lock-in risk. This study examines the Guangdong–Hong Kong–Macao region, comprising 21 prefecture-level cities in Guangdong Province together with Hong Kong and Macao. Based on 1 km gridded building material stock data from 2010 to 2020, we combined stock-difference and embodied carbon accounting, spatial autocorrelation and hotspot analysis, population- and economy-based intensity assessment, and urban typology identification to reveal the spatiotemporal differences in material accumulation, annual incremental embodied carbon, and carbon lock-in risk. The results show that cumulative building material stocks increased by 19.41% from 2010 to 2020, while annual incremental embodied carbon declined from 100.60 Mt CO2 in 2011 to 24.34 Mt CO2 in 2020, a decrease of 75.81%. This indicates that continued long-term material accumulation coexisted with a substantial decline in current incremental carbon pressure. Spatially, annual incremental embodied carbon contracted from continuous high-value belts to a small number of localized growth nodes, forming a clear “contraction–concentration” pattern. Clear mismatches were also observed among population-based intensity, economy-based intensity, and local hotspots, indicating that lower citywide average intensity does not necessarily imply lower carbon lock-in risk. By further integrating existing stocks, lock-in formation pressure, and efficiency burden, the 23 cities were classified into five combinations of carbon lock-in risk. These findings suggest that regional low-carbon governance of buildings should move beyond a singular focus on new construction and toward lifecycle-based differentiated management that jointly addresses existing stock renewal, remaining incremental pressure, and local hotspots.
1. Introduction
The building sector is a major area of global resource consumption and greenhouse gas mitigation. As operational energy efficiency and energy systems continue to improve, the relative importance of embodied greenhouse gas emissions from material production, transportation, construction, maintenance, and end-of-life processes is increasing across the building life cycle. A large share of these emissions occurs before buildings are put into use [1,2,3,4]. Materials such as cement, steel, brick, and aluminum involve high energy consumption and process emissions. Differences in structural systems, material combinations, prefabrication methods, system boundaries, and emission factors can all substantially affect embodied carbon estimates [5,6,7,8,9,10,11]. Future building expansion will continue to create considerable pressure on material demand and emissions. Extending building lifetimes, improving material efficiency, promoting material reuse, and decarbonizing material production therefore need to be pursued in parallel [12,13,14,15]. At the same time, building materials remain in the built environment for long periods. Their continued accumulation, as well as subsequent maintenance and renewal, will continue to affect future resource demand and the available space for emissions [16,17,18]. Embodied carbon in buildings is therefore not only a one-time emission associated with construction. It is also closely linked to the continuous inflow of materials into urban stocks. From the perspective of research scale, existing studies on building embodied carbon have broadly developed along two complementary pathways. One focuses on individual buildings, structural systems, or specific materials, comparing the effects of material selection, design schemes, and construction methods on embodied carbon [6,10]. The other evaluates medium- and long-term emission reduction potential from the perspectives of material efficiency, building lifespan, recycling, and production-side decarbonization [13,14]. The former helps identify emission reduction opportunities at the structural and material levels, while the latter reveals the long-term effects of technological and material transitions. However, both have paid relatively limited attention to how existing building stocks continue to influence regional material demand and subsequent carbon constraints. Building and infrastructure stocks are characterized by long-term accumulation and intertemporal constraints, and their expansion can continue to affect future resource demand and the scope for emission reduction [13,19]. Therefore, regional-scale research on building embodied carbon should focus not only on the emission level of individual buildings, but also on linking new material demand with the long-term accumulation and turnover processes of existing stocks.
Research on building material stocks has developed multiple approaches, ranging from regional-scale accounting to high-resolution spatial analysis. Top-down material flow analysis can establish long-term stock baselines, but provides relatively limited information on spatial patterns and building types [20,21,22]. Dynamic stock models further link population, building demand, service life, demolition, and new construction [23,24,25,26,27]. Geographically referenced dynamic material flow analysis has also begun to reveal local differences among neighborhoods, infrastructure, and individual buildings [28,29,30]. In recent years, the integration of remote sensing, building footprints and heights, land use, building age, and material intensity databases has advanced material stock mapping at both building and grid scales [31,32,33,34,35,36]. However, the resulting estimates remain sensitive to building attributes, material intensities, and life-cycle boundaries [37,38,39,40,41]. Long-term datasets for Chinese cities and multi-city comparisons have further expanded research on material accumulation, spatial concentration, and stock–flow relationships [42,43,44,45,46,47]. Urban mining studies have also highlighted the importance of material quantity, location, and renewal timing for circular use [48]. Nevertheless, it remains difficult to achieve both long temporal coverage and high spatial resolution. Accumulated stocks, annual material additions, and annual incremental embodied carbon are also rarely distinguished continuously within a unified framework. As a result, there is still limited evidence on how local hotspots shrink, shift, or remain concentrated as overall growth slows. Existing methods have increasingly progressed from macro-level aggregate accounting toward spatially explicit analysis, while also reflecting a trade-off between temporal continuity and spatial detail. Statistical accounting and dynamic stock models are well suited to constructing long-term time series, but are relatively limited in capturing intra-urban spatial differences [20,23]. In contrast, geographically referenced material flow analysis, remote sensing, and building-level mapping substantially improve spatial resolution, but their accuracy depends more heavily on the completeness of attribute information such as building age, use, structural type, and material intensity [31,32,33]. For rapidly urbanizing regions, this temporal–spatial scale trade-off is particularly important, because changes in regional totals may mask heterogeneity in material flows and local construction activities within cities [28,30,49,50]. Therefore, continuous annual and fine-scale material stock series can not only characterize the scale of accumulation, but also provide a basis for identifying the migration, contraction, and persistent clustering of incremental pressures within cities.
In addition to the size of material stocks, the pressure associated with urban building materials also depends on how efficiently they support population and economic activity. Previous studies have used per capita stocks, stock density, and population and economic variables to explain differences among cities. Recent global comparisons at the building scale have also revealed substantial inequalities between material ownership and service efficiency [51]. Population-based carbon intensity and economic carbon intensity reflect different dimensions of construction-related pressure. A single indicator is therefore insufficient to fully identify differences among cities. Meanwhile, carbon lock-in theory suggests that high-carbon technologies, infrastructure, and institutions can reinforce persistent carbon-intensive pathways through lifetime constraints and path dependence [52,53]. Related studies have extended the concept of lock-in to future emissions from existing and planned capital stocks. However, empirical research remains concentrated mainly in the energy and transport sectors, while the conceptual boundaries and indicator systems are still not unified [54,55]. Studies of urban heating, path dependence, and energy transitions show that lock-in risks are also affected by new investment, asset lifetimes, local institutions, and alternative technologies [56,57,58]. Population density, spatial expansion, consumption patterns, and supply-chain linkages can also alter urban emission responsibilities [59,60]. Research on building material flows and long-term stocks further indicates that the timing of planning, construction, and demolition, as well as the continued inflow of carbon-intensive materials into stocks, may create different forms of future constraints [61,62,63,64]. It is therefore necessary to integrate long-term stocks, annual incremental embodied carbon, and population- and economy-based carbon intensities within a unified framework for diagnosing urban carbon lock-in. Urban comparisons also face clear mismatches between scale and indicators. Per capita or per unit GDP indicators can reflect the intensity of material and carbon pressures relative to population supported and economic output, but they cannot substitute for information on absolute stocks, continued additions, and spatial clustering. Significant differences may also exist between the amount of materials held and urban service efficiency [51]. Likewise, a large existing stock does not necessarily mean that current incremental pressure remains high. Research on carbon lock-in further shows that long asset lifetimes, existing capital, and path dependence can jointly affect future emission reduction potential [53,55,65,66]. Therefore, carbon lock-in in the building sector is better identified through the combined relationships among the long-term asset base, continued formation processes, and service efficiency, rather than being judged solely on the basis of a single aggregate or intensity indicator.
The Guangdong–Hong Kong–Macao Greater Bay Area, in its commonly accepted definition, consists of the nine cities in the Pearl River Delta together with Hong Kong and Macao. To simultaneously examine differences between the core Greater Bay Area and the peripheral cities of Guangdong Province in material accumulation, annual incremental embodied carbon, and lock-in characteristics, this study expands the study area to include all 21 prefecture-level cities in Guangdong Province together with Hong Kong and Macao, for a total of 23 cities, hereafter collectively referred to as the “Guangdong–Hong Kong–Macao region.” This study area covers both the core cities of the Guangdong–Hong Kong–Macao Greater Bay Area and other cities in Guangdong Province, enabling comparisons of building material accumulation and carbon pressure across a more complete regional development gradient. Previous studies have reconstructed the spatiotemporal evolution of building material stocks in the Guangdong–Hong Kong–Macao region. Comparable gridded datasets of material stocks and embodied carbon have also been developed for comparison with the Yangtze River Delta urban agglomeration. These studies show that core and peripheral cities follow different material accumulation trajectories [67,68]. Life-cycle policy studies further indicate that differences in urban development stages and building structures can change the priorities for embodied carbon mitigation [69,70,71]. Research on the Yangtze River Delta urban agglomeration has also identified pronounced local differences in material stocks and life-cycle emissions within urban agglomerations [70]. In addition, the consumption-based carbon footprints of Hong Kong and Macao are strongly affected by cross-border trade and supply chains [72]. The region therefore provides a suitable case for examining differences in material accumulation, annual carbon pressure, and carbon lock-in within an urban agglomeration. Existing regional studies on the Guangdong–Hong Kong–Macao region have already provided a relatively detailed characterization of the scale and spatiotemporal differentiation of building material stocks and have begun to discuss pathways for reducing building embodied carbon from a life-cycle perspective [67,68,69]. These studies provide an important basis for understanding regional material accumulation and differences in embodied carbon. However, systematic comparisons are still lacking on whether long-term accumulation, remaining incremental pressure, and local high growth change synchronously between core and peripheral cities. Similar studies of urban agglomerations have also shown clear heterogeneity among cities within the same region in terms of material stocks and life-cycle emissions [70]. Particularly in regions with substantial differences in stages of urban development, citywide totals or average intensity indicators alone are insufficient to distinguish cities that have entered a stage dominated by stock renewal from those that still experience continued additions or local high growth. Comparing stocks, additions, spatial clustering, and efficiency within a unified framework can help further identify different combinations of carbon lock-in risk within the region.
Based on the above research gaps, this study focuses on the Guangdong–Hong Kong–Macao region, comprising 21 prefecture-level cities in Guangdong Province together with Hong Kong and Macao. It aims to reveal the relationship between long-term building material accumulation and changes in annual incremental embodied carbon, identify the spatial clustering characteristics of annual incremental embodied carbon and differences in urban carbon lock-in risk, and provide a basis for low-carbon governance of buildings in cities at different stages of development. Using 1 km grid-based building material stock data from 2010 to 2020, this study first analyzes the temporal evolution of cumulative material stocks, annual incremental embodied carbon, and material composition through material stock differencing and embodied carbon accounting. Second, spatial change analysis, Global Moran’s I, and Getis–Ord Gi* are combined to reveal the spatial evolution of annual incremental embodied carbon and the characteristics of local cold spots and hotspots. Third, population and GDP data are used to construct urban material and embodied carbon intensity indicators and to compare differences among cities in population-based and economy-based intensities. Finally, the three dimensions of existing stocks, lock-in formation pressure, and efficiency burden are integrated, and urban carbon lock-in risk types are identified through robust standardization and rule-based classification. Sensitivity analyses are further conducted to test the robustness of the main results. On this basis, differentiated governance recommendations covering the full building life cycle are proposed for different risk types. The abbreviations and key terms used throughout this study are summarized in the Abbreviations and Key Terms section at the end of the manuscript (Table 1). The overall research framework and technical roadmap of this study are shown in Figure 1.
Table 1.
Abbreviations and Key Terms.
Figure 1.
Research framework for assessing the spatiotemporal evolution of building material stocks, annual incremental embodied carbon, and urban carbon lock-in risk. The framework consists of four steps: (1) data preparation and building material stock and embodied carbon accounting; (2) temporal and spatial analyses, including urban carbon intensity assessment and hotspot identification; (3) urban carbon lock-in risk assessment and classification based on existing stocks, lock-in formation pressure, and efficiency burden, supported by robustness and sensitivity analyses; and (4) development of differentiated building life-cycle governance strategies for the five urban risk types.
2. Materials and Methods
2.1. Study Area and Data
The study area comprises 21 prefecture-level cities in Guangdong Province, together with Hong Kong and Macao, for a total of 23 cities. The basic spatial analysis unit is a 1 km grid. The main datasets used in this study include building material stocks, embodied carbon emission factors for materials, population, GDP, and urban administrative boundaries.
Building material stock data are the core dataset of this study. The data were obtained from the high-spatial-resolution building material stock dataset developed in Ref. [63]. The dataset covers 2010–2020 at a spatial resolution of 1 km. The original data provide grid-level stocks of nine building materials: aggregate, brick, cement, steel, glass, wood, asphalt, ceramics, and aluminum. To ensure comparability across years and materials, material names, spatial grids, and mass units were first standardized, and all material stocks were converted to tonnes (t). The nine material categories were then summed annually within each 1 km grid to obtain the total building material stock of each grid. Material stocks at the regional and city scales were obtained by aggregating the grid-level results according to administrative boundaries. The 2010–2020 stock series was used directly to analyze long-term material accumulation. Differences in material stocks between adjacent years were further used to calculate annual net additions for 2011–2020, as described in Section 2.2.
GDP and population data were obtained from two independent data sources. GDP data were obtained from the Resource and Environmental Science Data Platform [73] and are reported in units of RMB 10,000. After coordinate-system harmonization and spatial matching, the GDP data were aggregated to the 23 cities. They were used to calculate annual net material stock additions per unit of GDP and annual incremental embodied carbon per unit of GDP. Population data were obtained from LandScan [74]. The 2020 spatial population distribution data were matched to the 1 km building material analysis grid and then aggregated to the city scale. These data were used to calculate per capita annual net material stock additions and per capita annual incremental embodied carbon.
Embodied carbon emission factors for materials were obtained from the China Association of Building Energy Efficiency [75] and ref. [63]. Annual emission factors were used for steel, cement, and aluminum, while fixed emission factors were applied to the other six materials. To maintain consistency with the mass units of material stocks, all emission factors were converted to CO2 emissions per unit mass of material. The emission factors were then matched with the annual net additions of the nine material categories to calculate annual incremental embodied carbon, as described in Section 2.2.
2.2. Building Material Stocks and Embodied Carbon Accounting
Because annual material additions were calculated as the difference in material stocks between two consecutive years, the 2011 additions were derived using the 2010 stock as the baseline. Therefore, the material stock analysis covers 2010–2020, whereas the analyses of annual material additions and annual incremental embodied carbon begin in 2011. In addition, the original dataset provides long-term, high-resolution, material-specific building material stock data for 2010–2020. Accordingly, the total building material stock in each year was calculated as the sum of the stocks of the nine material categories:
where St denotes the total building material stock in year t, and Mi,t denotes the stock of material category i.
To characterize annual changes in building material stocks, annual net material stock additions were calculated as the difference in material stocks between two consecutive years:
This indicator reflects the net change in building material stocks between two consecutive years, rather than the gross material inputs generated by new construction, renovation, and replacement activities in that year. Because material inflows may occur simultaneously with material outflows caused by demolition, renewal, and other processes, annual stock differences alone cannot further distinguish between these two components.
On this basis, the annual net stock addition of each material category was multiplied by its corresponding embodied carbon emission factor and then summed to estimate the embodied carbon associated with annual net growth in material stocks [63]. It should be noted that the term “annual incremental embodied carbon” in this study specifically refers to the estimated embodied carbon associated with net additions to material stocks. It does not represent the total embodied carbon emissions generated by all new construction, renovation, maintenance, and replacement activities in a given year. The calculation is as follows:
where Di,t denotes the annual net addition of material category i in year t, and EFi,t denotes the corresponding embodied carbon emission factor. Annual emission factors were used for steel, cement, and aluminum, while fixed emission factors were applied to the other materials. Material stocks and embodied carbon at the regional and city scales were obtained by aggregating the grid-level results.
In this study, cumulative material stocks were used to represent the existing material base formed through long-term urban construction. Annual net additions to material stocks and the corresponding annual incremental embodied carbon were used to characterize the current carbon pressure associated with the expansion of material stocks.
2.3. Spatiotemporal Changes and Urban Carbon Intensity Assessment
This study analyzed changes in building material stocks, material composition, and annual incremental embodied carbon from 2010 to 2020 at both the regional and city scales. Temporal evolution was characterized using annual changes, growth rates, and city contribution rates.
The spatial analysis was conducted at the 1 km grid scale. Annual net material stock additions and annual incremental embodied carbon in 2011, 2015, and 2020 were compared, and changes and compound annual growth rates from 2011 to 2020 were calculated. The change in annual incremental embodied carbon between 2011 and 2020 ΔEC was then used as the analysis variable. Global Moran’s I was applied to test its overall spatial autocorrelation. Global Moran’s I was used to determine whether high or low values were spatially clustered across the study area. Values closer to 1 indicate stronger clustering of similar values, values close to 0 indicate a spatially random pattern, and negative values indicate a greater tendency for neighboring grids to show alternating high and low values.
Based on the assessment of overall spatial clustering, Getis–Ord Gi* was further applied to identify significant local clusters of high and low values. The Gi* statistic compares ΔEC within a target grid and its neighborhood with the overall distribution across the study area. A significantly positive Gi* Z-score indicates a local cluster of high values, defined as a hotspot, whereas a significantly negative Gi* Z-score indicates a local cluster of low values, defined as a cold spot. In this study, hotspots represent areas with significantly high local concentrations of changes in annual incremental embodied carbon, whereas cold spots represent areas with significantly low local concentrations. A fixed-distance binary neighborhood of 1.5 km based on grid-centroid distance was used. All valid grids were included in the analysis, including grids with ΔEC = 0 and negative values. Statistical significance was classified into three levels, 90%, 95%, and 99%, based on two-sided normal tests. Statistics involving the numbers of hotspots and cold spots, as well as the proportion of hotspot grids within each city, were consistently calculated using a significance threshold of 95% or above. Full details of the spatial weights, neighborhood settings, and significance criteria are provided in Supplementary Methods S1.
At the city scale, the intensities of annual material additions and incremental embodied carbon were further evaluated from two dimensions: population supported and economic output. The four indicators can be expressed using two general equations:
where Dc,t and ECc,t denote annual net material stock additions and annual incremental embodied carbon, respectively, for city c in year t. Xc,t represents either urban population or GDP. When population is used as the denominator, the equations yield per capita material and embodied carbon intensities; when GDP is used, they yield material and embodied carbon intensities per unit of economic output.
2.4. Carbon Lock-In Risk Assessment and Identification of Urban Types
Based on the preceding analyses of material stocks, annual incremental embodied carbon, and urban intensity, this study further assessed building material carbon lock-in risk from three dimensions: existing stocks, lock-in formation pressure, and efficiency burden. Here, carbon lock-in risk refers mainly to the resource and carbon constraints that may arise from long-term accumulated material stocks and their continued growth through future maintenance, renewal, demolition, and material replacement. It does not represent a direct prediction of future locked-in carbon emissions.
Existing stocks were represented by cumulative building material stocks in 2020 and were used to characterize the material base formed through long-term urban construction. Lock-in formation pressure integrated four aspects: net material stock additions in 2020, annual incremental embodied carbon in 2020, the persistence of annual incremental embodied carbon from 2011 to 2020, and the concentration of hotspot grids significant at the 95% confidence level or above. This dimension was used to assess whether new material and carbon pressures were still being formed. Efficiency burden combined material and embodied carbon intensities in both the population and GDP dimensions. It was used to measure the pressure of additional material demand relative to population and economic scale.
All indicators were robustly standardized across the 23 cities using the median and interquartile range. This removed differences in units and reduced the influence of extreme values. When multiple indicators were included within the same dimension, their standardized values were averaged to obtain the corresponding dimension score. All indicators were oriented so that higher values represented greater stock burden, lock-in formation pressure, or efficiency burden. Detailed indicators and processing procedures are provided in Supplementary Methods S2.
Based on these three dimensions, cities were identified using a hierarchical rule-based classification according to their relative positions among the 23 cities. First, the 75th percentile of existing stocks was used to identify high-stock cities. These cities were then divided according to the median efficiency burden into the high-stock high-efficiency transition type and the high-stock efficiency-constrained lock-in type. The remaining cities were further classified using the medians of lock-in formation pressure and efficiency burden into the incremental-flow–hotspot lock-in type, structural efficiency-constrained lock-in type, and low-intensity transition reserve type.
2.5. Robustness and Sensitivity Analyses
To test the sensitivity of the main results to parameter settings, robustness analyses were conducted for emission factors, the overall scale of material stocks, and the thresholds used for urban classification. First, scenarios with simultaneous ±20% changes in the emission factors of all nine materials were examined. Each material-specific emission factor was also perturbed individually by ±20% to test the sensitivity of annual incremental embodied carbon trends and city rankings to emission factor assumptions.
Second, cumulative material stocks for all cities were uniformly adjusted by ±15% to examine whether the classification based on relative stock levels was affected by changes in the overall stock scale (Supplementary Methods S3).
Finally, to assess the sensitivity of the classification results to threshold selection, the three classification thresholds were varied around their baseline values while keeping the indicator system and aggregation method unchanged. The detailed classification rules and the 27 threshold scenarios are provided in Supplementary Methods S2.
3. Results
3.1. Temporal Evolution of Building Material Stocks and Embodied Carbon
From 2010 to 2020, cumulative building material stocks across the 23 cities in the Guangdong–Hong Kong–Macao region increased from 10642.40 Mt to 12708.60 Mt. This represented a net increase of 2066.10 Mt over the decade, corresponding to an overall growth of 19.41% and a compound annual growth rate of 1.79% (Figure 2a). The stock growth rate reached a period high of 2.72% in 2012, then generally declined to 0.57% in 2020. This indicates that building materials continued to accumulate during the study period, but the pace of stock expansion slowed markedly. From 2011 to 2020, cumulative annual incremental embodied carbon reached 733.20 Mt CO2. It declined from 100.60 Mt CO2 in 2011 to 24.34 Mt CO2 in 2020, a reduction of 76.26 Mt CO2 or 75.81% (Figure 2b). Annual incremental embodied carbon peaked at 107.40 Mt CO2 in 2012 and generally declined thereafter, reaching its lowest level in 2020. From 2019 to 2020 alone, it decreased by 8.20 Mt CO2, or 25.24%. These results show that while cumulative material stocks continued to increase, the annual embodied carbon pressure associated with net material stock growth weakened substantially. This downward trend is also consistent with the national-scale findings reported by Zhang et al. [63], which showed that embodied carbon associated with building material use peaked in 2013 and generally declined thereafter, reaching a relatively low level by 2020. Further sensitivity analyses showed that under scenarios in which cumulative material stocks were uniformly adjusted by ±15%, the relative stock rankings of the 23 cities, existing-stock scores, and five urban types remained unchanged. Under the emission-factor perturbation scenarios, the declining trend in annual incremental embodied carbon and the main group of high-pressure cities also remained stable (Supplementary Results S6).
Figure 2.
Temporal evolution of building material stocks and annual incremental embodied carbon in the Guangdong–Hong Kong–Macao region. (a) Total building material stock from 2010 to 2020. (b) Annual incremental embodied carbon associated with net material additions from 2011 to 2020. (c) Changes in the composition of cumulative building material stocks across nine material categories from 2010 to 2020. (d) City-level annual incremental embodied carbon in 2011 and 2020 across the 23 cities; open circles represent 2011 values, filled circles represent 2020 values, and connecting lines indicate the changes between the two years. Building material stocks and embodied carbon are expressed in Mt and Mt CO2, respectively.
At the city scale, annual incremental embodied carbon in 2020 showed a clear concentration pattern (Figure 2d). Jiangmen had the highest value, reaching 3.7 Mt CO2 and accounting for 15.40% of the total across the 23 cities. Jiangmen, Guangzhou, Foshan, Dongguan, and Huizhou formed the main group of cities with relatively high annual incremental embodied carbon. Across 20 emission-factor perturbation scenarios, including simultaneous ±20% changes in the emission factors of all nine materials and individual ±20% perturbations for each material, this five-city group remained unchanged, and the relative ranking of all 23 cities was also stable (Supplementary Results S6). From 2011 to 2020, annual incremental embodied carbon declined overall across the region. Guangzhou, Dongguan, Huizhou, Jieyang, Foshan, and Shenzhen together accounted for 62.00% of the absolute magnitude of all negative changes across cities. Over the same period, only Hong Kong SAR had a higher annual incremental embodied carbon value in 2020 than in 2011. Overall, although annual incremental embodied carbon decreased markedly in most cities compared with 2011, the higher values in 2020 remained concentrated in a small number of cities. This indicates that the overall regional decline coexisted with an increasing concentration of carbon pressure across cities.
3.2. Spatial Evolution and Growth Hotspots
Figure 3 shows that both annual building material additions and their associated embodied carbon decreased substantially across the study area from 2011 to 2020. Material additions declined from 279.03 Mt to 71.61 Mt, representing a decrease of 74.34%. Incremental embodied carbon fell from 100.60 Mt CO2 to 24.34 Mt CO2, a reduction of 75.81%. Over the same period, the number of grids with positive material additions decreased by 37.46%, while the average material addition per active grid declined by approximately 59.00%. These results indicate that building growth contracted not only spatially, but also in terms of construction intensity.
Figure 3.
Spatial distribution and evolution of annual net material stock additions and annual incremental embodied carbon in the Guangdong–Hong Kong–Macao region in 2011, 2015, and 2020. (a–c), spatial distribution of annual net material stock additions in 2011, 2015, and 2020, respectively; (d–f), spatial distribution of annual incremental embodied carbon in the corresponding years. The data were aggregated to 1-km grid cells. Darker colors indicate higher values. The color scales are expressed in kt per 1-km grid cell for annual net material stock additions and kt CO2 per 1-km grid cell for annual incremental embodied carbon. Gray lines indicate administrative boundaries.
Net material stock additions and annual incremental embodied carbon showed highly consistent spatial patterns (Figure 3). In 2020, the Pearson correlation coefficient between the two reached 0.994. More importantly, in terms of temporal change, net material stock additions decreased from 279.03 Mt in 2011 to 71.61 Mt in 2020, a decline of 74.34%. Over the same period, annual incremental embodied carbon decreased by 75.81%, while the average embodied carbon per unit of net material stock addition declined by only 5.72%. These differences in the magnitude of change indicate that the substantial decline in annual incremental embodied carbon was closely associated with the contraction in net material stock growth, whereas the change in embodied carbon per unit of material was relatively small. At the same time, the composition of major materials in cumulative material stocks remained generally stable throughout the study period (Figure 2c), indicating limited changes in the material structure of existing stocks. The emission-factor sensitivity analysis further showed that the overall declining trend in annual incremental embodied carbon remained stable under both the simultaneous ±20% perturbation of all emission factors and the individual ±20% perturbation of each material-specific emission factor (Supplementary Results S6).
Figure 4 further shows that the declines in net material stock additions and the corresponding annual incremental embodied carbon exhibited clear spatial clustering. From 2011 to 2020, the two decreased by 207.42 Mt and 76.26 Mt CO2, respectively, and the number of grids with negative changes exceeded 32,000 in both cases. The median CAGR of annual incremental embodied carbon was −10.22% yr−1, and only 33.54% of grids showed positive growth (Figure 4a–c). The Global Moran’s I value was 0.321, indicating a relatively strong positive spatial autocorrelation in changes in annual incremental embodied carbon. Further Getis–Ord Gi* analysis identified 9169 cold spots and 794 hotspots at the 95% significance level or above, with the number of cold spots being 11.55 times that of hotspots (Supplementary Results S4). Cold spots were mainly concentrated in the core Pearl River Estuary area and the eastern coastal belt, indicating that the decline in annual incremental embodied carbon in these early major growth areas was strongly spatially clustered. In contrast, hotspots were mainly distributed in Hong Kong, Jiangmen, and a few local nodes, suggesting that the remaining growth had shifted from the earlier continuous urban belts to localized nodes.
Figure 4.
Spatial changes in annual net material stock additions and annual incremental embodied carbon in the Guangdong–Hong Kong–Macao region from 2011 to 2020. (a) Change in annual net material stock additions. (b) Change in annual incremental embodied carbon. Both changes are calculated as the 2020 value minus the 2011 value, with red and blue indicating positive and negative changes, respectively. (c) Compound annual growth rate (CAGR) of annual incremental embodied carbon between 2011 and 2020, with positive and negative values indicating growth and decline, respectively. (d) Getis–Ord Gi* hotspots and cold spots based on ΔEC = EC(2020) − EC(2011), where EC denotes annual incremental embodied carbon. Hotspots and cold spots represent statistically significant local clusters of relatively high and low ΔEC values, respectively, rather than areas with high or low absolute embodied carbon emissions. Significance is displayed at the 90%, 95%, and 99% confidence levels, and gray grids indicate nonsignificant areas. All spatial analyses were conducted at the 1 km grid scale.
A similar pattern of contraction and concentration was also observed at the city scale. Except for Hong Kong, the annual incremental embodied carbon in 2020 was lower than that in 2011 for the other 22 cities. Guangzhou, Dongguan, Huizhou, Jieyang, Foshan, and Shenzhen together accounted for 62.00% of the absolute magnitude of the regional negative change. At the same time, Jiangmen, Guangzhou, Foshan, Dongguan, and Huizhou still contributed 53.37% of the region’s annual incremental embodied carbon in 2020, indicating that the overall regional decline did not eliminate the concentration of pressure across cities. Overall, annual incremental embodied carbon in the Guangdong–Hong Kong–Macao region showed a clear “contraction–concentration” pattern: both the overall level and the spatial extent of expansion continued to decline, while the remaining high values became increasingly concentrated in a small number of cities and local nodes.
3.3. Low-Carbon Efficiency and Inter-City Differences
In 2020, the annual net addition of building materials across the 23 cities was 71.61 Mt, corresponding to 24.34 Mt CO2 of incremental embodied carbon. Figure 5a shows substantial differences among cities across the four intensity indicators. The highest-to-lowest ratios for material additions per unit of GDP and incremental embodied carbon per unit of GDP reached 45.09 and 47.76, respectively. These values were much higher than those for the two per capita indicators, which were 15.77 and 15.29. This indicates stronger inter-city differentiation in the economic dimension.
Figure 5.
Inter-city differences in annual net material stock addition and annual incremental embodied carbon intensities across the 23 cities in the Guangdong–Hong Kong–Macao region in 2020. (a) Heatmap of four urban intensity indicators expressed relative to their respective city-level medians: annual net material stock additions per capita, annual incremental embodied carbon per capita, annual net material stock additions per unit GDP, and annual incremental embodied carbon per unit GDP. (b) Relationship between the two population-based intensity indicators. (c) Relationship between the two economy-based intensity indicators. (d) Cross-classification of population-based and economy-based intensities, illustrating differences between the two dimensions. (e) Ranking of composite urban intensity based on the four indicators, with the dashed line indicating a standardized value of zero. In panels (b–e), blue, cyan-green, orange, and red identify cities with low intensities in both dimensions, low economic but high population-based intensity, low population-based but high economic intensity, and high intensities in both dimensions, respectively.
Different correlation coefficients were used according to the characteristics of the variable relationships. Pearson’s correlation coefficient was applied to assess linear relationships between continuous variables, such as net material stock additions and annual incremental embodied carbon. For relationships among urban intensity indicators, composite assessment indicators, and hotspot characteristics, Spearman’s rank correlation coefficient was used. This choice was made because the indicator distributions varied substantially across the 23 cities, and the analysis focused more on relative city rankings and monotonic relationships.
In the population-based dimension (Figure 5b), Jiangmen had the highest per capita material additions and incremental embodied carbon, whereas Shantou, Macao, and Jieyang were at the lower end. The Spearman correlation coefficient between the two indicators reached 0.993, indicating a very strong consistency between material additions and incremental embodied carbon. In the economic-output dimension (Figure 5c), Jiangmen again showed the highest intensity, while Macao, Shenzhen, and Hong Kong had the lowest values. The correlation coefficient between the two economic intensity indicators reached 0.998. However, a low intensity per unit of GDP does not necessarily indicate a smaller cumulative stock or better whole-life-cycle carbon performance. Rather, it is more closely related to higher economic output.
The correlation between population-based and economy-based intensities was only 0.511, showing a clear mismatch between the two dimensions (Figure 5d). The seven cities with low intensities in both dimensions accounted for only 13.67% of incremental embodied carbon but contributed 43.50% of GDP. In contrast, the eight cities with high intensities in both dimensions contributed only 15.14% of GDP but accounted for 44.58% of incremental embodied carbon. Guangzhou, Dongguan, Zhuhai, and Foshan showed low economic intensity but high population intensity, whereas Meizhou, Shanwei, Maoming, and Heyuan showed the opposite pattern. This indicates that a single per capita or per-GDP indicator cannot fully capture urban construction pressure.
The integrated assessment further shows that current urban intensity is not consistent with long-term changes or local hotspots (Figure 5e). The correlation coefficients between the composite intensity and the 2011–2020 endpoint change in embodied carbon and the share of hotspot grids significant at the 95% confidence level or above were only 0.197 and 0.345, respectively. Although Hong Kong was classified as a city with low composite intensity, it had the highest share of hotspot grids. This indicates that a low citywide average intensity can coexist with strong localized growth. After removing each of the four indicators in turn, the Spearman correlation coefficients between the resulting composite rankings and the baseline ranking remained no lower than 0.968, indicating good robustness. Overall, the inter-city differences shown in Figure 5 mainly reflect differences in the match between annual construction scale and population or economic scale, rather than substantial differences in material emission factors.
3.4. Urban Carbon Lock-In Risk Types and Spatial Distribution
Figure 6a shows that existing material stocks, current net additions, trajectory persistence, hotspot concentration, and population–economic efficiency were not synchronized across cities. The Spearman correlation coefficients between lock-in formation pressure and current net addition scale, trajectory persistence, and the hotspot concentration index were 0.896, 0.819, and 0.833, respectively. This indicates that the three groups of indicators were generally consistent in direction, but captured different risk characteristics, including the scale of net material stock growth, the persistence of annual incremental embodied carbon, and the local concentration of high values.
Figure 6.
Carbon lock-in risk types of the 23 cities in the Guangdong–Hong Kong–Macao region. (a) Robust standardized city-level carbon lock-in risk indicators. (b) Spatial distribution of the five urban carbon lock-in risk types. Cyan-green, orange, purple, magenta, and green represent High-stock high-efficiency transition, High-stock efficiency-constrained lock-in, Incremental-flow–hotspot lock-in, Structural efficiency-constrained lock-in, and Low-intensity transition reserve, respectively. (c) Relationship between lock-in formation pressure index and efficiency burden index.
Based on the relative levels of existing stocks, lock-in formation pressure, and efficiency burden, the 23 cities were classified into five carbon lock-in risk types (Figure 6b,c). Guangzhou, Dongguan, and Shenzhen were classified as the high-stock high-efficiency transition type. Together, they accounted for 34.37% of cumulative material stocks, while their efficiency burden remained relatively low. Their risk profile was therefore mainly associated with large existing stocks and future renewal demand. Jiangmen, Foshan, and Huizhou belonged to the high-stock efficiency-constrained lock-in type. These three cities together contributed 33.07% of annual incremental embodied carbon and 40.91% of hotspot grids significant at the 95% confidence level or above. They therefore exhibited a combined pattern of high existing stocks, high annual incremental embodied carbon, and high efficiency burden. Zhanjiang, Zhongshan, Zhaoqing, Yunfu, Yangjiang, Maoming, and Hong Kong were classified as the incremental-flow–hotspot lock-in type. Together, they contributed 27.25% of annual incremental embodied carbon and 35.86% of significant hotspot grids. This indicates that although existing stocks were relatively low in some of these cities, net material stock growth and local hotspots remained pronounced.
Qingyuan, Zhuhai, and Heyuan were classified as the structural efficiency-constrained lock-in type. Their net material stock additions were relatively low, but their material–carbon efficiency burdens in the population and economic dimensions were relatively high. Meizhou, Shaoguan, Jieyang, Chaozhou, Shanwei, Shantou, and Macao belonged to the low-intensity transition reserve type, characterized overall by relatively low existing stock burden, lock-in formation pressure, and efficiency burden. Further threshold robustness analysis showed that the mean agreement between the 27 neighboring-threshold scenarios and the baseline classification was 90.82%, ranging from 82.61% to 100.00%. Among the 23 cities, 18 retained their original type under all scenarios. Dongguan, Huizhou, and Zhaoqing retained their original type in 18 of 27 scenarios, while Zhongshan and Zhuhai did so in 12 of 27 scenarios. This indicates that these five cities were closer to the classification boundaries between adjacent risk types (Supplementary Results S5).
Spatially, the Pearl River Estuary and adjacent manufacturing cities did not form a single risk type (Figure 6b). Guangzhou and Shenzhen consistently remained in the high-stock high-efficiency transition type, whereas Jiangmen and Foshan showed a combination of high existing stocks and efficiency constraints. Dongguan and Huizhou were also part of the high-stock city group, but their type classifications were less stable. In western Guangdong, Zhanjiang, Yunfu, Yangjiang, and Maoming consistently showed incremental-flow–hotspot characteristics, and Hong Kong also remained in this type across different threshold scenarios. By contrast, the classifications of Zhongshan, Zhaoqing, and Zhuhai were more sensitive to threshold changes, indicating that their risk profiles lay between adjacent types. Overall, urban carbon lock-in risk in the Guangdong–Hong Kong–Macao region did not follow a simple core–periphery gradient. Instead, it was jointly shaped by different combinations of existing stocks, continued net additions, local hotspots, and population–economic efficiency.
4. Discussion and Policy Implications
4.1. Discussion of the Main Findings
This study first reveals the coexistence of continued growth in cumulative building material stocks and a substantial decline in annual incremental embodied carbon. From 2010 to 2020, cumulative building material stocks in the Guangdong–Hong Kong–Macao region increased by 19.41%, whereas annual incremental embodied carbon decreased by 75.81% from 2011 to 2020. These two indicators reflect different processes: the long-term physical accumulation of the built environment and the annual carbon pressure associated with net material stock growth. Previous studies have shown that buildings and infrastructure have long service lives, and that continuously accumulated material stocks affect future maintenance, renewal, demolition, and material cycling [16,17,23,24]. The decline in annual incremental embodied carbon therefore indicates that the current pace of material stock expansion and its associated carbon pressure have weakened markedly. However, the growing existing stock may still generate new resource and carbon constraints through future renewal and replacement. The building sector in the Guangdong–Hong Kong–Macao region is therefore gradually shifting from a phase of rapid incremental expansion toward one in which management of existing stocks and control of remaining additions are both important.
The decline in annual incremental embodied carbon was closely associated with the contraction in net material stock growth. From 2011 to 2020, net material stock additions decreased by 74.34%, which was very close to the 75.81% decline in annual incremental embodied carbon. By contrast, the average embodied carbon per unit of net material stock addition decreased by only 5.72%. Thus, compared with changes in embodied carbon intensity per unit of material, the substantial decline in annual incremental embodied carbon was more strongly associated with the reduction in net material stock growth. At the same time, aggregate, brick, cement, and steel consistently accounted for approximately 98.00% of cumulative material stocks, indicating that the major material structure of existing stocks remained broadly stable. This result suggests that emission reductions achieved mainly through slower construction growth may be partly stage-dependent. If material demand increases again in the future while material efficiency and production-side emission intensity do not improve accordingly, annual incremental embodied carbon may rebound. Therefore, in addition to reducing unnecessary material demand, improving material efficiency, extending building lifetimes, expanding reuse, and decarbonizing the production of carbon-intensive materials such as cement and steel remain important long-term mitigation pathways [1,12,13,14].
The spatial analysis further shows that the overall decline did not result in a uniform regional transition. Instead, a clear “contraction–concentration” pattern emerged. At the 95% significance level or above, the number of cold spots was 11.55 times the number of hotspots. Cold spots were mainly distributed in the core Pearl River Estuary area and along the eastern coastal belt, indicating widespread clustered declines in annual incremental embodied carbon within areas that had previously experienced rapid material stock growth. Meanwhile, hotspots remained only in Hong Kong, Jiangmen, and a small number of local nodes. In 2020, Jiangmen, Guangzhou, Foshan, Dongguan, and Huizhou still accounted for a relatively high share of annual incremental embodied carbon. This shows that a regional slowdown does not imply synchronous decline at the city or grid scale. The remaining carbon pressure is becoming increasingly concentrated in fewer cities and local growth nodes. Previous geographically referenced material flow studies have also shown that city-level totals and averages may obscure local heterogeneity in building material flows [28,29]. Our findings further demonstrate that, under an overall contraction in regional additions, high-resolution spatial identification is particularly important for detecting local areas where growth persists.
Differences at the city scale further demonstrate that a single intensity indicator cannot fully characterize building material carbon lock-in risk. The Spearman correlation coefficient between population-based and economy-based intensities was only 0.511. Composite intensity also showed weak correlations with long-term change trajectories and hotspot concentration. This indicates that population support, economic output, long-term material accumulation, and local growth represent different dimensions of urban pressure. A low intensity per unit of GDP may be associated with high economic output and does not necessarily imply a small absolute scale of net material additions. Similarly, low per capita intensity does not exclude the presence of significant local growth hotspots. Therefore, this study further combined existing stocks, lock-in formation pressure, and efficiency burden to identify urban carbon lock-in risk types. The classification robustness analysis showed that 18 of the 23 cities retained their original type under all 27 threshold scenarios, while only a small number of cities lay near the boundaries between adjacent risk types (Supplementary Results S5). These findings indicate that urban carbon lock-in risk in the Guangdong–Hong Kong–Macao region does not simply follow a core–periphery or high–low intensity gradient. Instead, it is jointly shaped by different combinations of existing stock size, continued net additions, local hotspots, and population–economic efficiency.
4.2. Differentiated Governance Strategies
Based on the five urban carbon lock-in risk types identified above, we propose a differentiated lifecycle-oriented management framework that prioritizes governance measures across five stages: planning and decision-making, design and material selection, construction, use and maintenance, and renewal and demolition (Figure 7).
Figure 7.
Life-cycle management framework for the five urban carbon lock-in risk types.
For high-stock high-efficiency transition cities such as Guangzhou and Shenzhen, the main constraint lies in their large existing building stocks and future renewal demand. Governance should therefore gradually shift from controlling the scale of new construction toward extending the service life of existing buildings and reducing material demand and embodied carbon during concentrated renewal. At the planning and decision-making stage, priority should be given to assessing the feasibility of continued use, functional conversion, and adaptive reuse of existing buildings, rather than treating demolition and reconstruction as the default option. At the design and renovation stage, maintainable, replaceable, and adaptable solutions should be adopted to extend the service life of buildings and major components. At the renewal and demolition stage, material demand and embodied carbon should be compared between renovation and demolition–reconstruction options. Selective demolition, component reuse, and material recycling should also be promoted to improve the circular use of existing stock resources. Although Dongguan generally belongs to this type, it is closer to the efficiency-constrained boundary. In addition to managing existing-stock renewal, it should therefore improve the spatial and material efficiency of new construction.
For high-stock efficiency-constrained lock-in cities such as Jiangmen, Foshan, and Huizhou, governance should cover both existing-stock renewal and the entire process of new construction. At the project decision stage, the scale of new construction should be matched with population, industrial, and actual functional demand. Projects with high material demand should also be subject to material-use and annual incremental embodied carbon control requirements. At the design stage, material-efficient, low-embodied-carbon, and long-term adaptable structural and material solutions should be prioritized to reduce unnecessary material inputs. During construction, project management can be strengthened through material inventories, embodied carbon accounting, and requirements for recycled material use. During the use stage, functional adjustment and space reuse should be promoted to improve the utilization efficiency of existing buildings. During renewal and demolition, life-extension renovation, component reuse, and high-value material recovery should be prioritized to reduce carbon lock-in risk arising from the combined effects of existing-stock renewal and continued net growth. Huizhou also shows the possibility of shifting toward the incremental-flow–hotspot type. Local project control in high-growth areas should therefore be strengthened.
For incremental-flow–hotspot lock-in cities such as Zhanjiang, Yunfu, Yangjiang, Maoming, and Hong Kong, whole-life-cycle management should place greater emphasis on the planning, design, and construction stages to prevent persistent growth nodes from creating new long-term material lock-in. The 1 km hotspot grids can be linked with construction land, major construction projects, and urban renewal units. Persistently high-growth areas should be identified early during project approval and planning, followed by prior assessment of construction scale and material demand. At the design stage, structural optimization, material reduction, and substitution with low-embodied-carbon materials should be used to reduce unit material demand. During construction, project-level material inventories and embodied carbon accounting should be implemented in hotspot areas, together with dynamic monitoring of projects with high material demand. New buildings should also be designed with greater adaptability to future renovation and improved disassembly potential, thereby creating favorable conditions for later maintenance, renewal, and material circulation. Zhongshan and Zhaoqing lie between adjacent risk types. Their governance should therefore address both local incremental growth and efficiency improvement rather than follow measures designed for only one type.
For structural efficiency-constrained lock-in cities such as Qingyuan and Heyuan, governance should focus on controlling construction demand and improving whole-life utilization efficiency. At the planning stage, stronger coordination is needed between population, industrial development, public service demand, and construction scale. Vacant and underused building spaces should be activated first, and new construction should be considered only after existing stocks have been fully utilized. At the design stage, mixed-use potential and functional adaptability should be improved so that buildings can respond to changes in population and industrial demand. During the use stage, space utilization, functional suitability, and long-term use efficiency should be incorporated into building operation and renewal assessments. During renewal, renovation and functional reorganization should be prioritized to improve the use of existing buildings and reduce additional material demand caused by low utilization and repetitive construction. Zhuhai lies near the boundaries of multiple risk types. Particular attention should therefore be paid to its persistent efficiency constraints, while construction scale and renewal strategies should be dynamically adjusted according to changes in net material growth and hotspots.
For low-intensity transition reserve cities such as Meizhou, Shaoguan, Jieyang, Chaozhou, Shanwei, Shantou, and Macao, the current low levels of net material stock growth and hotspot intensity provide a window to avoid high-carbon lock-in throughout the building life cycle at an early stage. During planning and construction decision-making, the scale of new construction should be determined cautiously according to population and actual functional demand to avoid premature or low-utilization development. At the design stage, material reduction, durable design, flexible-use design, and design for disassembly can be adopted in advance to improve future adaptability. During material selection and construction, the use of low-embodied-carbon and recycled materials should be gradually increased, together with the establishment of material inventories and building material information records. During the use stage, maintenance, repair, and functional adjustment should be used to extend building lifetimes. During demolition and renewal, systems for component reuse and material recycling should be established so that the current low carbon lock-in risk can be transformed into a long-term advantage for material circularity.
5. Conclusions and Outlook
5.1. Conclusions
Based on 1 km gridded data from 2010 to 2020, this study systematically analyzed the spatiotemporal differences in building material stocks, annual incremental embodied carbon, spatial patterns, urban intensity, and carbon lock-in risk types across the Guangdong–Hong Kong–Macao region. On this basis, differentiated priorities for low-carbon governance were identified. The main conclusions are as follows:
First, cumulative building material stocks and annual incremental embodied carbon showed a clear temporal divergence, indicating that declining annual incremental pressure does not imply the simultaneous disappearance of long-term stock constraints. From 2010 to 2020, cumulative building material stocks increased from 10,642.40 Mt to 12,708.60 Mt, an increase of 19.41%. Meanwhile, from 2011 to 2020, net material stock additions declined by 74.34%, broadly consistent with the 75.81% decline in annual incremental embodied carbon, whereas the average embodied carbon per unit of net material stock addition decreased by only 5.72%. This indicates that the substantial decline in annual incremental embodied carbon was mainly associated with the contraction in net material stock growth, while changes in material composition and embodied carbon per unit of material were relatively limited. Therefore, the decline in annual incremental embodied carbon reflects a weakening of current stock expansion pressure, while the continuously accumulated existing material stock may still create long-term resource and carbon constraints through future maintenance, renewal, demolition, and replacement.
Second, the decline in annual incremental embodied carbon showed a pattern of “spatial contraction–pressure concentration,” rather than a synchronous low-carbon transition across all cities and grids. From 2011 to 2020, the number of grids with positive net material stock additions decreased from 37,290 to 23,321, while the average net addition per active grid fell from approximately 7.48 kt to 3.07 kt. At the 95% significance level or above, 9169 cold spots and 794 hotspots were identified. Cold spots were mainly concentrated in the core Pearl River Estuary area and the eastern coastal belt, whereas hotspots remained in Hong Kong, Jiangmen, and a small number of local growth nodes. At the same time, Jiangmen, Guangzhou, Foshan, Dongguan, and Huizhou still accounted for a relatively high share of annual incremental embodied carbon in 2020. These results demonstrate that a decline in the regional total does not imply a synchronous decline in spatial risk. As overall construction activity slows, the remaining incremental carbon pressure becomes increasingly concentrated in a small number of cities and local nodes.
Third, low citywide average intensity does not necessarily imply low carbon lock-in risk. Population support, economic output, long-term net growth, and local hotspots represent different dimensions of urban pressure. In 2020, the Spearman correlation coefficient between population-based and economy-based intensities was only 0.511, while composite intensity also showed weak correlations with long-term change trajectories and hotspot concentration. This indicates that a single per capita or per-GDP indicator cannot fully characterize urban building material–embodied carbon pressure. Some cities may have low average intensity but still exhibit continued net growth or significant local hotspots, whereas others may have large existing stocks but relatively low current efficiency burden. Therefore, urban carbon lock-in risk cannot be judged solely by stock size or a single efficiency indicator. Long-term accumulation, continued additions, and spatial concentration need to be considered together.
Fourth, urban carbon lock-in risk in the Guangdong–Hong Kong–Macao region does not follow a simple core–periphery gradient, but is jointly shaped by different combinations of existing stocks, lock-in formation pressure, and efficiency burden. Based on these three dimensions, the 23 cities were classified into five risk types: high-stock high-efficiency transition, high-stock efficiency-constrained lock-in, incremental-flow–hotspot lock-in, structural efficiency-constrained lock-in, and low-intensity transition reserve. Across 27 neighboring-threshold scenarios, 18 cities consistently retained their original types, and the mean classification agreement was 90.82%, indicating good stability for most cities. Governance priorities also differ across types. High-stock cities should place greater emphasis on extending the service life of existing buildings and managing future renewal. Incremental-flow–hotspot cities should strengthen early-stage control during planning, design, and construction. Efficiency-constrained cities need to improve the match between new construction and population and economic demand. Low-intensity cities have an opportunity to avoid material- and carbon-intensive development pathways before they become locked in.
5.2. Research Limitations and Future Research
This study still has several limitations. First, annual material additions were calculated from differences in material stocks between adjacent years and therefore represent annual net changes. They cannot fully separate material inputs from new construction, building demolition, maintenance and renewal, and changes caused by data adjustments. Second, although annual emission factors were used for steel, cement, and aluminum, fixed factors were applied to the other materials. Differences among cities in production technologies, energy structures, recycled material shares, transportation distances, and procurement sources were therefore not fully captured. The uniform scaling, material-by-material perturbation, and stock scaling analyses conducted in this study quantify structural sensitivity under transparent scenarios, but cannot replace probabilistic uncertainty propagation that incorporates inter-city heterogeneity and covariance structures. Therefore, absolute quantities, exact percentages, and rankings between closely positioned cities should be interpreted as baseline estimates rather than confidence intervals. Third, although the 1 km grid can identify regional hotspots, it cannot further distinguish building functions, construction ages, structural types, utilization rates, or specific project-level decisions. Correlation and hotspot analyses mainly reveal spatial associations and cannot directly establish the causal mechanisms underlying inter-city differences. In addition, the five lock-in risk types were derived from the relative distributions and rule-based classification of 23 cities during 2010–2020. Their applicability to other urban agglomerations and different development stages remains to be tested. Future research could develop gross building material flow models that distinguish new construction, renovation, and demolition, incorporate building-level attributes, dynamic life-cycle emission factors, and interregional supply-chain data, and combine these with construction-demand and material-decarbonization scenarios to evaluate the effects of different governance measures on future carbon lock-in risks.
Supplementary Materials
The following supporting information can be downloaded at: https://www.mdpi.com/article/10.3390/buildings16204157/s1, Supplementary Methods S1: Getis–Ord Gi* Hotspot Analysis; Supplementary Methods S2: Urban Carbon Lock-in Risk Typology and Classification Rules; Supplementary Methods S3: Sensitivity Analysis of Material Stocks and Emission Factors; Supplementary Results S4: Spatial Distribution of Gi* Significance Classes; Supplementary Results S5: Robustness of the Urban Carbon Lock-in Risk Typology; Supplementary Results S6: Sensitivity of Material Stocks and Emission Factors.
Author Contributions
S.C.: Methodology, Software, Writing—review & editing, Writing—original draft; D.H.: Writing—original draft, Formal analysis; Y.D.: Funding acquisition, Project administration, Supervision; W.C.: Funding acquisition, Supervision and Formal analysis. All authors have read and agreed to the published version of the manuscript.
Funding
Fund Project: Chongqing College of Architecture and Technology, University-level Scientific Research Project (Project No. 2025003). Fund Project: Youth Project of Science and Technology Research Program of Chongqing Municipal Education Commission (Project No. KJQN202605209).
Data Availability Statement
The original contributions presented in this study are included in the article. Further inquiries can be directed to the corresponding author.
Conflicts of Interest
Author Daiheng He was employed by the company Chongqing Transportation Construction Management Co., Ltd. Author Yongjie Du was employed by the company Chongqing Expressway Group Co., Ltd. The remaining authors declare that the research was conducted in the absence of any commercial or financial relationships that could be construed as a potential conflict of interest.
Correction Statement
This article has been republished with a minor correction to the correspondence contact information. This change does not affect the scientific content of the article.
References
- Röck, M.; Saade, M.R.M.; Balouktsi, M.; Rasmussen, F.N.; Birgisdottir, H.; Frischknecht, R.; Habert, G.; Lützkendorf, T.; Passer, A. Embodied GHG emissions of buildings—The hidden challenge for effective climate change mitigation. Appl. Energy 2020, 258, 114107. [Google Scholar] [CrossRef] [Scilit]
- Pomponi, F.; Moncaster, A. Embodied carbon mitigation and reduction in the built environment—What does the evidence say? J. Environ. Manag. 2016, 181, 687–700. [Google Scholar] [CrossRef] [Scilit] [PubMed]
- De Wolf, C.; Pomponi, F.; Moncaster, A. Measuring embodied carbon dioxide equivalent of buildings: A review and critique of current industry practice. Energy Build. 2017, 140, 68–80. [Google Scholar] [CrossRef] [Scilit]
- Amiri, A.; Emami, N.; Ottelin, J.; Sorvari, J.; Marteinsson, B.; Heinonen, J.; Junnila, S. Embodied emissions of buildings—A forgotten factor in green building certificates. Energy Build. 2021, 241, 110962. [Google Scholar] [CrossRef] [Scilit]
- Chen, W.; Yang, S.; Zhang, X.; Jordan, N.D.; Huang, J. Embodied energy and carbon emissions of building materials in China. Build. Environ. 2022, 207, 108434. [Google Scholar] [CrossRef] [Scilit]
- Luo, Z.; Yang, L.; Liu, J. Embodied carbon emissions of office building: A case study of China’s 78 office buildings. Build. Environ. 2016, 95, 365–371. [Google Scholar] [CrossRef] [Scilit]
- Su, X.; Zhang, X. A detailed analysis of the embodied energy and carbon emissions of steel-construction residential buildings in China. Energy Build. 2016, 119, 323–330. [Google Scholar] [CrossRef] [Scilit]
- Teng, Y.; Pan, W. Systematic embodied carbon assessment and reduction of prefabricated high-rise public residential buildings in Hong Kong. J. Clean. Prod. 2019, 238, 117791. [Google Scholar] [CrossRef] [Scilit]
- Teng, Y.; Pan, W. Estimating and minimizing embodied carbon of prefabricated high-rise residential buildings considering parameter, scenario and model uncertainties. Build. Environ. 2020, 180, 106951. [Google Scholar] [CrossRef] [Scilit]
- Hart, J.; D’Amico, B.; Pomponi, F. Whole-life embodied carbon in multistory buildings: Steel, concrete and timber structures. J. Ind. Ecol. 2021, 25, 403–418. [Google Scholar] [CrossRef] [Scilit]
- Lu, J.T.; Wang, C.Y.; Zhang, C.; Guan, H.L.; Skare, M.; Streimikisv, J. Avoided external energy costs due to penetration of renewables: Evidence form Baltic States. J. Environ. Manag. 2021, 296, 113247. [Google Scholar] [CrossRef] [Scilit] [PubMed]
- Zhong, X.; Hu, M.; Deetman, S.; Steubing, B.; Lin, H.X.; Hernandez, G.A.; Harpprecht, C.; Zhang, C.; Tukker, A.; Behrens, P. Global greenhouse gas emissions from residential and commercial building materials and mitigation strategies to 2060. Nat. Commun. 2021, 12, 6126. [Google Scholar] [CrossRef] [Scilit] [PubMed]
- Pauliuk, S.; Heeren, N.; Berrill, P.; Fishman, T.; Nistad, A.; Tu, Q.; Wolfram, P.; Hertwich, E.G. Global scenarios of resource and emission savings from material efficiency in residential buildings and cars. Nat. Commun. 2021, 12, 5097. [Google Scholar] [CrossRef] [Scilit] [PubMed]
- Hertwich, E.G.; Ali, S.; Ciacci, L.; Fishman, T.; Heeren, N.; Masanet, E.; Asghari, F.N.; Olivetti, E.; Pauliuk, S.; Tu, Q.; et al. Material efficiency strategies to reducing greenhouse gas emissions associated with buildings, vehicles, and electronics—A review. Environ. Res. Lett. 2019, 14, 043004. [Google Scholar] [CrossRef] [Scilit]
- Lu, H.; You, K.; Feng, W.; Zhou, N.; Fridley, D.; Price, L.; de la Rue du Can, S. Reducing China’s building material embodied emissions: Opportunities and challenges to achieve carbon neutrality in building materials. iScience 2024, 27, 109028. [Google Scholar] [CrossRef] [Scilit] [PubMed]
- Krausmann, F.; Wiedenhofer, D.; Lauk, C.; Haas, W.; Tanikawa, H.; Fishman, T.; Miatto, A.; Schandl, H.; Haberl, H. Global socioeconomic material stocks rise 23-fold over the 20th century and require half of annual resource use. Proc. Natl. Acad. Sci. USA 2017, 114, 1880–1885. [Google Scholar] [CrossRef] [Scilit] [PubMed]
- Krausmann, F.; Wiedenhofer, D.; Haberl, H. Growing stocks of buildings, infrastructures and machinery as key challenge for compliance with climate targets. Glob. Environ. Change 2020, 61, 102034. [Google Scholar] [CrossRef] [Scilit]
- Fu, Y.J.; Zhang, Y.J. From Growth-Oriented to Sustainability-Oriented: How Does the Transformation of Development Goals Reshape Urban Land Supply? An Analysis Based on a Spatial General Equilibrium Model. Sustainability 2026, 18, 1568. [Google Scholar] [CrossRef] [Scilit]
- Guo, D.P.; Zhao, J.R.; Zhang, Z.H.; Yang, G.Q.; Li, Y.P.; Zhang, J.F.; Wang, X.F. Large eddy simulation of flow field and pollutant diffusion around buildings with different thermal stratifications. Process Saf. Environ. Prot. 2024, 190, 885–901. [Google Scholar] [CrossRef] [Scilit]
- Lanau, M.; Liu, G.; Kral, U.; Wiedenhofer, D.; Keijzer, E.; Yu, C.; Ehlert, C. Taking Stock of Built Environment Stock Studies: Progress and Prospects. Environ. Sci. Technol. 2019, 53, 8499–8515. [Google Scholar] [CrossRef] [Scilit] [PubMed]
- Fishman, T.; Schandl, H.; Tanikawa, H.; Walker, P.; Krausmann, F. Accounting for the Material Stock of Nations. J. Ind. Ecol. 2014, 18, 407–420. [Google Scholar] [CrossRef] [Scilit] [PubMed]
- Wiedenhofer, D.; Fishman, T.; Lauk, C.; Haas, W.; Krausmann, F. Integrating Material Stock Dynamics Into Economy-Wide Material Flow Accounting: Concepts, Modelling, and Global Application for 1900–2050. Ecol. Econ. 2019, 156, 121–133. [Google Scholar] [CrossRef] [Scilit]
- Deetman, S.; Marinova, S.; van der Voet, E.; van Vuuren, D.P.; Edelenbosch, O.; Heijungs, R. Modelling global material stocks and flows for residential and service sector buildings towards 2050. J. Clean. Prod. 2020, 245, 118658. [Google Scholar] [CrossRef] [Scilit]
- Hong, L.; Zhou, N.; Feng, W.; Khanna, N.; Fridley, D.; Zhao, Y.; Sandholt, K. Building stock dynamics and its impacts on materials and energy demand in China. Energy Policy 2016, 94, 47–55. [Google Scholar] [CrossRef] [Scilit]
- Huo, T.; Cai, W.; Ren, H.; Feng, W.; Zhu, M.; Lang, N.; Gao, J. China’s building stock estimation and energy intensity analysis. J. Clean. Prod. 2019, 207, 801–813. [Google Scholar] [CrossRef] [Scilit]
- Guo, J.; Li, J. Efficiency evaluation and influencing factors of energy saving and emission reduction: An empirical study of China’s three major urban agglomerations from the perspective of environmental benefits. Ecol. Indic. 2021, 133, 108410. [Google Scholar] [CrossRef] [Scilit]
- Wei, T.; Zhu, Q.L.; Liu, W.L. The Effect of Market-Based Environmental Regulations on Green Technology Innovation-The Regulatory Effect Based on Corporate Social Responsibility. Sustainability 2024, 16, 4719. [Google Scholar] [CrossRef] [Scilit]
- Han, J.; Chen, W.-Q.; Zhang, L.; Liu, G. Uncovering the Spatiotemporal Dynamics of Urban Infrastructure Development: A High Spatial Resolution Material Stock and Flow Analysis. Environ. Sci. Technol. 2018, 52, 12122–12132. [Google Scholar] [CrossRef] [Scilit] [PubMed]
- Heeren, N.; Hellweg, S. Tracking Construction Material over Space and Time: Prospective and Geo-referenced Modeling of Building Stocks and Construction Material Flows. J. Ind. Ecol. 2019, 23, 253–267. [Google Scholar] [CrossRef] [Scilit]
- Lausselet, C.; Urrego, J.P.F.; Resch, E.; Brattebø, H. Temporal analysis of the material flows and embodied greenhouse gas emissions of a neighborhood building stock. J. Ind. Ecol. 2021, 25, 419–434. [Google Scholar] [CrossRef] [Scilit]
- Haberl, H.; Wiedenhofer, D.; Schug, F.; Frantz, D.; Virág, D.; Plutzar, C.; Gruhler, K.; Lederer, J.; Schiller, G.; Fishman, T.; et al. High-Resolution Maps of Material Stocks in Buildings and Infrastructures in Austria and Germany. Environ. Sci. Technol. 2021, 55, 3368–3379. [Google Scholar] [CrossRef] [Scilit] [PubMed]
- Schug, F.; Frantz, D.; Wiedenhofer, D.; Haberl, H.; Virág, D.; van der Linden, S.; Hostert, P. High-resolution mapping of 33 years of material stock and population growth in Germany using Earth Observation data. J. Ind. Ecol. 2023, 27, 110–124. [Google Scholar] [CrossRef] [Scilit] [PubMed]
- Bao, Y.; Huang, Z.; Wang, H.; Yin, G.; Zhou, X.; Gao, Y. High-resolution quantification of building stock using multi-source remote sensing imagery and deep learning. J. Ind. Ecol. 2023, 27, 350–361. [Google Scholar] [CrossRef] [Scilit]
- Herfort, B.; Lautenbach, S.; Porto de Albuquerque, J.; Anderson, J.; Zipf, A. A spatio-temporal analysis investigating completeness and inequalities of global urban building data in OpenStreetMap. Nat. Commun. 2023, 14, 3985. [Google Scholar] [CrossRef] [Scilit] [PubMed]
- Mao, T.; Liu, Y.; Chen, W.-Q.; Li, N.; Dong, N.; Shi, Y. Quantifying spatiotemporal dynamics of urban building and material metabolism by combining a random forest model and GIS-based material flow analysis. Front. Earth Sci. 2022, 10, 944865. [Google Scholar] [CrossRef] [Scilit]
- Lin, W.F.; Wang, Y.F.; Zhang, Q.; Peron, M.; Lu, J.T. Emerging opportunities or paradoxes: Assessing the effect of digital technology adoption on corporate carbon performance. J. Environ. Manag. 2025, 391, 126399. [Google Scholar] [CrossRef] [Scilit] [PubMed]
- Guo, J.; Miatto, A.; Shi, F.; Tanikawa, H. Spatially explicit material stock analysis of buildings in Eastern China metropoles. Resour. Conserv. Recycl. 2019, 146, 45–54. [Google Scholar] [CrossRef] [Scilit]
- Stephan, A.; Athanassiadis, A. Quantifying and mapping embodied environmental requirements of urban building stocks. Build. Environ. 2017, 114, 187–202. [Google Scholar] [CrossRef] [Scilit]
- Miatto, A.; Schandl, H.; Forlin, L.; Ronzani, F.; Borin, P.; Giordano, A.; Tanikawa, H. A spatial analysis of material stock accumulation and demolition waste potential of buildings: A case study of Padua. Resour. Conserv. Recycl. 2019, 142, 245–256. [Google Scholar] [CrossRef] [Scilit]
- Ajayebi, A.; Hopkinson, P.; Zhou, K.; Lam, D.; Chen, H.-M.; Wang, Y. Spatiotemporal model to quantify stocks of building structural products for a prospective circular economy. Resour. Conserv. Recycl. 2020, 162, 105026. [Google Scholar] [CrossRef] [Scilit]
- Sprecher, B.; Verhagen, T.J.; Sauer, M.L.; Baars, M.; Heintz, J.; Fishman, T. Material intensity database for the Dutch building stock: Towards Big Data in material stock analysis. J. Ind. Ecol. 2022, 26, 272–280. [Google Scholar] [CrossRef] [Scilit]
- Li, X.; Song, L.; Liu, Q.; Ouyang, X.; Mao, T.; Lu, H.; Liu, L.; Liu, X.; Chen, W.; Liu, G. Product, building, and infrastructure material stocks dataset for 337 Chinese cities between 1978 and 2020. Sci. Data 2023, 10, 228. [Google Scholar] [CrossRef] [Scilit] [PubMed]
- Liu, T.; Zhao, R.; Xie, Z.; Xiao, L.; Chen, A.; Feng, W.; You, Z.; Feng, M.; Li, R. Carbon emissions from accumulated stock of building materials in China. Build. Environ. 2023, 240, 110451. [Google Scholar] [CrossRef] [Scilit]
- Fu, C.; Deng, T.; Zhang, Y. Urban metabolic flow in China’s megacities doubled by material stock accumulation since the 21st century. npj Urban Sustain. 2023, 3, 52. [Google Scholar] [CrossRef] [Scilit]
- Soonsawad, N.; Marcos-Martinez, R.; Schandl, H. City-scale assessment of the material and environmental footprint of buildings using an advanced building information model: A case study from Canberra, Australia. J. Ind. Ecol. 2024, 28, 247–261. [Google Scholar] [CrossRef] [Scilit]
- Mihkelson, W.; Arbabi, H.; Hincks, S.; Tingley, D.D. Built-environment stocks in the context of a master-planned city: A case study of Chandigarh, India. J. Ind. Ecol. 2024, 28, 573–588. [Google Scholar] [CrossRef] [Scilit] [PubMed]
- Mao, R.; Bao, Y.; Duan, H.; Liu, G. Global urban subway development, construction material stocks, and embodied carbon emissions. Humanit. Soc. Sci. Commun. 2021, 8, 83. [Google Scholar] [CrossRef] [Scilit]
- Koutamanis, A.; van Reijn, B.; van Bueren, E. Urban mining and buildings: A review of possibilities and limitations. Resour. Conserv. Recycl. 2018, 138, 32–39. [Google Scholar] [CrossRef] [Scilit]
- Zhang, Z.Q.; Huo, L.J.; Su, Y.X.; Shen, H.; Yang, G.Q. Estimation of Corn Net Primary Productivity and Carbon Sequestration Based on the CASA Model: A Case Study of the Fen River Basin. Sustainability 2024, 16, 2942. [Google Scholar] [CrossRef] [Scilit]
- Zhang, Y.J.; Zhang, G.M.; Liang, J.S.; Chang, J.N.; Zhang, P.Y.; Fang, W.; Wang, Q. Regulation of greenhouse gas emissions and carbon sequestration in wetland by submerged plant mowing time and potential mechanisms. Environ. Res. 2026, 302, 124621. [Google Scholar] [CrossRef] [Scilit] [PubMed]
- Song, J.; Sun, K.; Goldstein, B.P.; Tong, X.; Wang, L.; Helbich, M.; Liu, Q.; Dai, M.; Li, X.; Liu, G. Weighing 600 million buildings reveals global urban material inequality and efficiency paths. Nat. Cities 2026, 3. [Google Scholar] [CrossRef] [Scilit]
- Unruh, G.C. Understanding carbon lock-in. Energy Policy 2000, 28, 817–830. [Google Scholar] [CrossRef] [Scilit]
- Seto, K.C.; Davis, S.J.; Mitchell, R.B.; Stokes, E.C.; Unruh, G.; Ürge-Vorsatz, D. Carbon Lock-In: Types, Causes, and Policy Implications. Annu. Rev. Environ. Resour. 2016, 41, 425–452. [Google Scholar] [CrossRef] [Scilit]
- Erickson, P.; Kartha, S.; Lazarus, M.; Tempest, K. Assessing carbon lock-in. Environ. Res. Lett. 2015, 10, 084023. [Google Scholar] [CrossRef] [Scilit]
- Fisch-Romito, V.; Guivarch, C.; Creutzig, F.; Minx, J.C.; Callaghan, M.W. Systematic map of the literature on carbon lock-in induced by long-lived capital. Environ. Res. Lett. 2021, 16, 053004. [Google Scholar] [CrossRef] [Scilit]
- Liu, S.; Guo, Y.; Wagner, F.; Liu, H.; Cui, R.Y.; Mauzerall, D.L. Diversifying heat sources in China’s urban district heating systems will reduce risk of carbon lock-in. Nat. Energy 2024, 9, 1021–1031. [Google Scholar] [CrossRef] [Scilit]
- Goldstein, J.E.; Neimark, B.; Garvey, B.; Phelps, J. Unlocking “lock-in” and path dependency: A review across disciplines and socio-environmental contexts. World Dev. 2023, 161, 106116. [Google Scholar] [CrossRef] [Scilit]
- Bridge, G.; Bouzarovski, S.; Bradshaw, M.; Eyre, N. Geographies of energy transition: Space, place and the low-carbon economy. Energy Policy 2013, 53, 331–340. [Google Scholar] [CrossRef] [Scilit]
- Lee, J.; Taherzadeh, O.; Kanemoto, K. The scale and drivers of carbon footprints in households, cities and regions across India. Glob. Environ. Change 2021, 66, 102205. [Google Scholar] [CrossRef] [Scilit]
- Mahtta, R.; Mahendra, A.; Seto, K.C. Building up or spreading out? Typologies of urban growth across 478 cities of 1 million+. Environ. Res. Lett. 2019, 14, 124077. [Google Scholar] [CrossRef] [Scilit]
- Ghorbany, S.; Hu, M. A systematic framework to reduce urban embodied carbon emissions using urban scale simulation. npj Urban Sustain. 2025, 5, 7. [Google Scholar] [CrossRef] [Scilit]
- Tang, S.; Zhang, L.; Hao, Y.; Chang, Y.; Liu, G.; Liu, Q.; Li, X. System dynamics modeling for construction material flows of urban residential building: A case study of Beijing, China. Resour. Conserv. Recycl. 2021, 168, 105298. [Google Scholar] [CrossRef] [Scilit]
- Zhang, C.; Yang, L.; Wiedenhofer, D.; Guo, J.; Chen, Z.; Li, S.; Wang, Z.; Kwan, M.-p.; Zhou, Y.; Lin, L.; et al. Building material stock drives embodied carbon emissions and risks future climate goals in China. Nat. Clim. Change 2026, 16, 164–171. [Google Scholar] [CrossRef] [Scilit]
- Liang, P.R.; Guo, Y.L.; Chauhdary, S.T.; Agrawal, M.K.; Ahmad, S.F.; Ahmad, A.; Ifseisi, A.A.; Ji, T.C. Sustainable development and multi-aspect analysis of a novel polygeneration system using biogas upgrading and LNG regasification processes, producing power, heating, fresh water and liquid CO2. Process Saf. Environ. Prot. 2024, 183, 417–436. [Google Scholar] [CrossRef] [Scilit]
- Xie, C.J.; Cui, B.S.; Xie, T.; Yu, S.L.; Ning, Z.H. Evolution of a tidal channel network in the Yellow River Delta, China, and simulation of optimization scenarios. J. Environ. Manag. 2024, 353, 120215. [Google Scholar] [CrossRef] [Scilit] [PubMed]
- Nerilli, F.; Ahmadi, H.M.; Imperatore, S.; Vairo, G. Experimental Investigation of Bond-Slip Response of GFRP Bars in Concrete Exposed to High Temperature in Alkaline Solution. In Proceedings of the 4th International Conference of Steel and Composite for Engineering Structures, Piacenza, Italy, 9–12 July 2025. [Google Scholar]
- Yuan, L.; Lu, W.; Wu, Y. Characterizing the spatiotemporal evolution of building material stock in China’s Greater Bay Area: A statistical regression method. J. Ind. Ecol. 2023, 27, 1553–1566. [Google Scholar] [CrossRef] [Scilit]
- Liang, H.; Zhang, B.; Qian, X.; Chen, Y.; Luo, Y.; Huang, Y.; Sun, L.; Zhou, C.; Long, J.; Dong, L. Building material stocks and embodied carbon dataset for two urban agglomerations in China from 2000 to 2020. Sci. Data 2025, 12, 930. [Google Scholar] [CrossRef] [Scilit] [PubMed]
- Liang, H.; Bian, X.; Dong, L. Towards net zero carbon buildings: Accounting the building embodied carbon and life cycle-based policy design for Greater Bay Area, China. Geosci. Front. 2024, 15, 101760. [Google Scholar] [CrossRef] [Scilit]
- Liang, H.; Zhang, B.; Bian, X.; Shen, J.; Wang, Y.; Dong, L. Unveiling the building embodied carbon dynamics in Yangtze River Delta: Spatial and life cycle perspectives. J. Urban Manag. 2025, 14, 160–180. [Google Scholar] [CrossRef] [Scilit]
- Nerilli, F.; Ahmadi, H.M.; Imperatore, S.; Vairo, G. Bond-Slip Performance of GFRP Rebars in Concrete Under Alkaline and Thermal Conditioning. J. Compos. Sci. 2026, 10, 131. [Google Scholar] [CrossRef] [Scilit]
- Dou, X.; Deng, Z.; Sun, T.; Ke, P.; Zhu, B.; Shan, Y.; Liu, Z. Global and local carbon footprints of city of Hong Kong and Macao from 2000 to 2015. Resour. Conserv. Recycl. 2021, 164, 105167. [Google Scholar] [CrossRef] [Scilit]
- Xinliang, X. China GDP Spatial Distribution Kilometer Grid Dataset. 2017. Available online: https://www.resdc.cn/DOI/DOI.aspx?DOIID=33 (accessed on 11 August 2026).
- Rose, A.; McKee, J.; Sims, K.; Reith, A.; Urban, M. LandScan Global 2024, Version 2024; Oak Ridge National Laboratory: Oak Ridge, TN, USA, 2024. [CrossRef]
- CABEE. Research Report on Carbon Emissions in China’s Urban-Rural Construction Sector (2025); CABEE: Oxfordshire, UK, 2025. [Google Scholar]
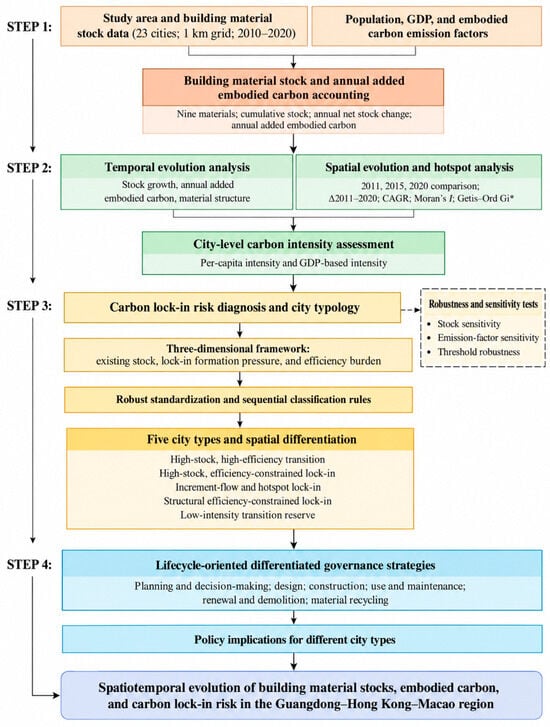
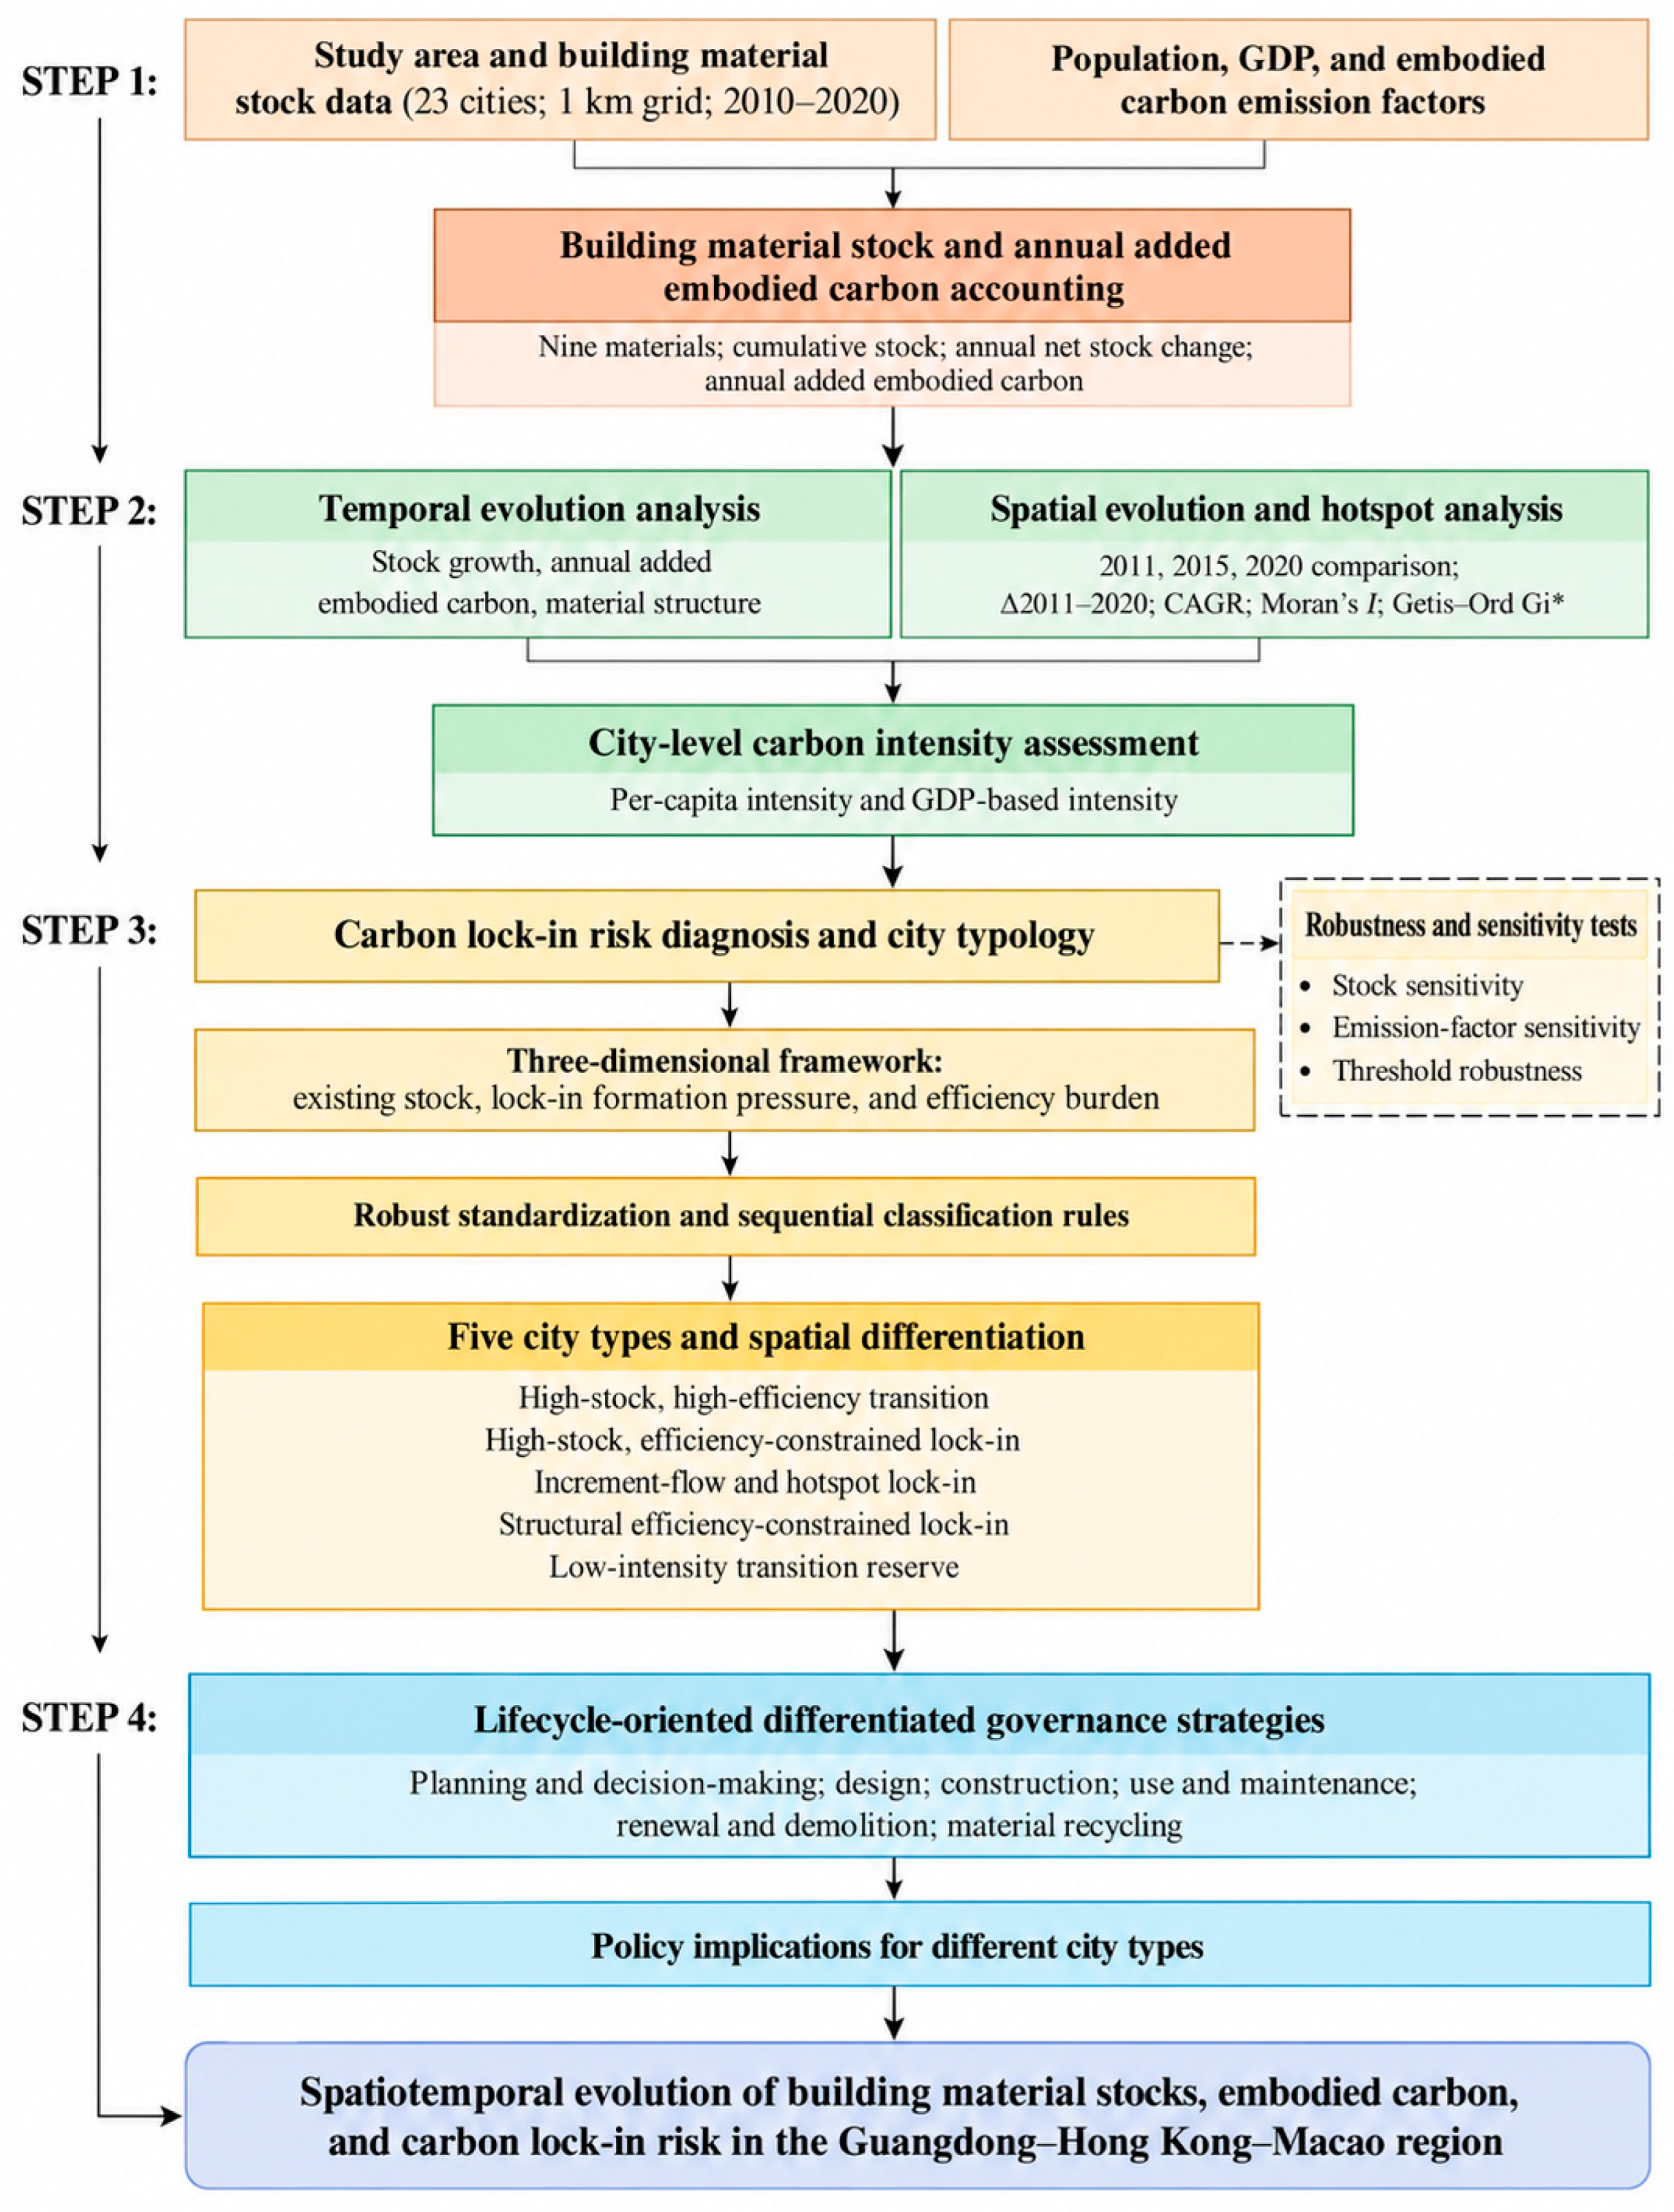
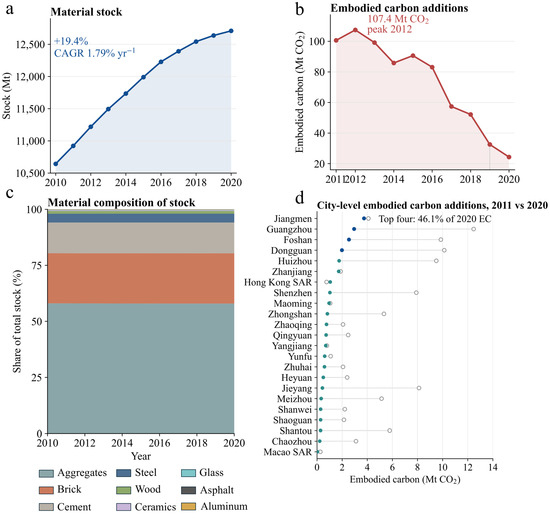
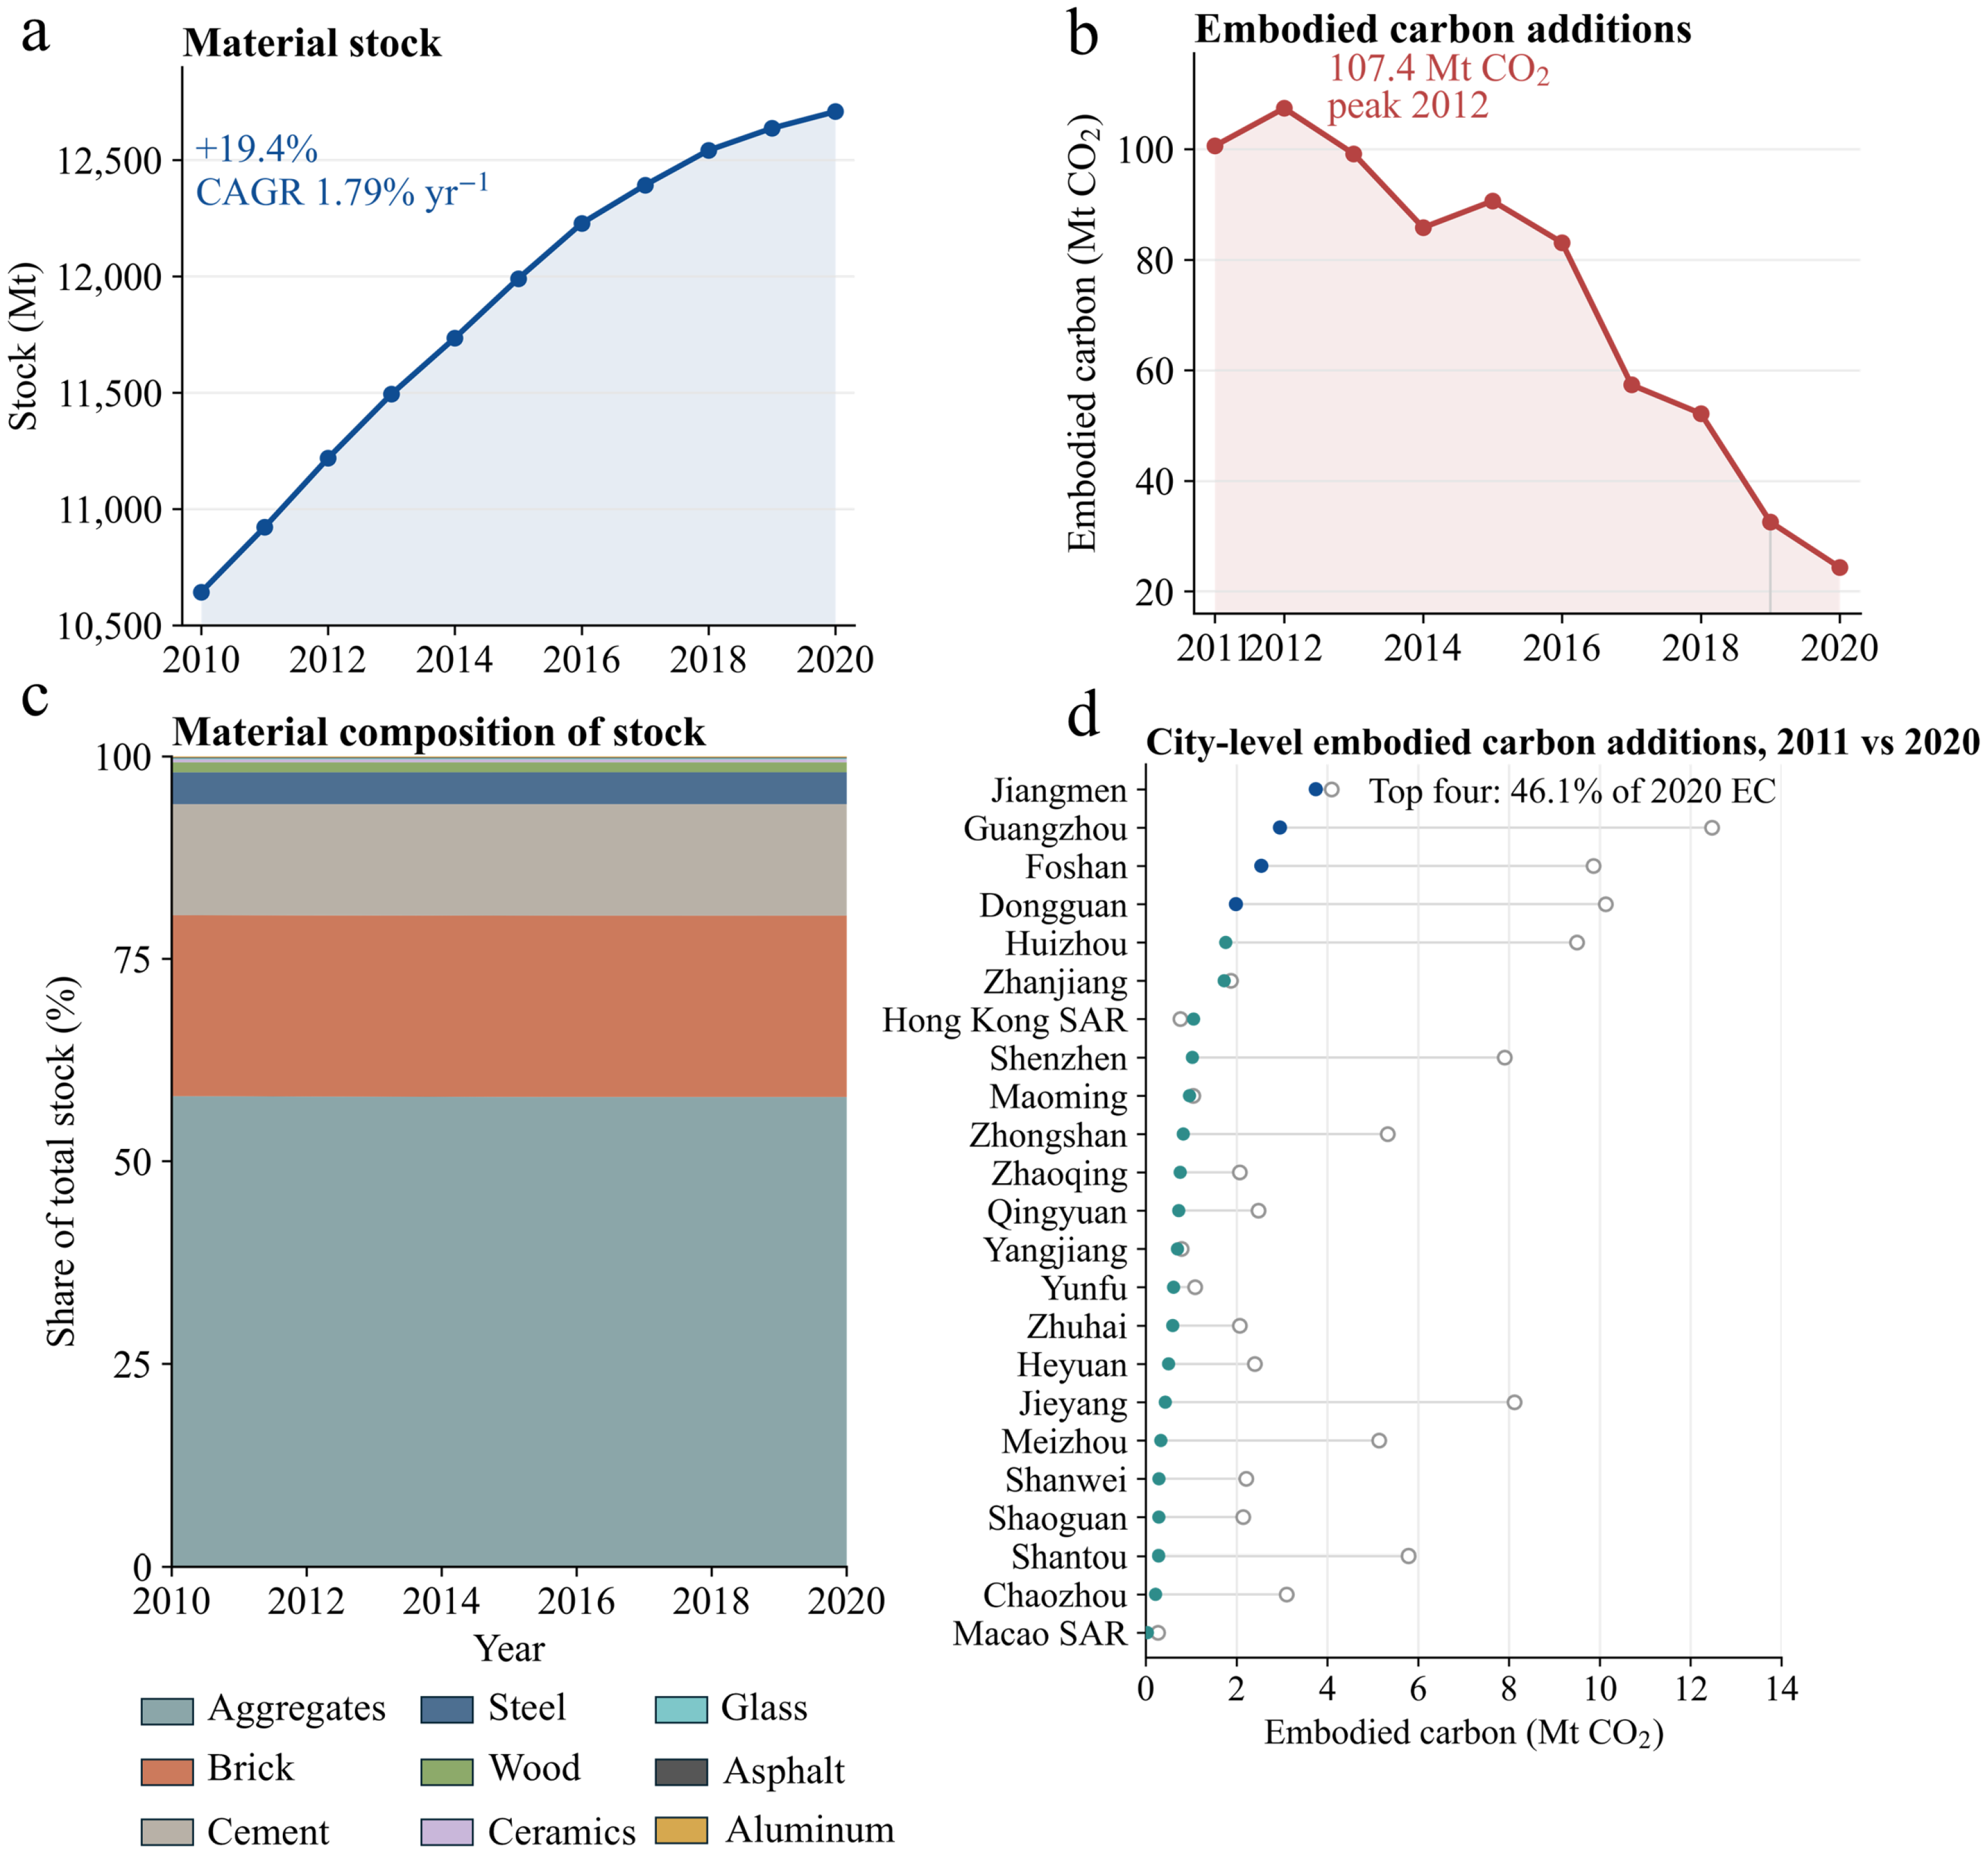
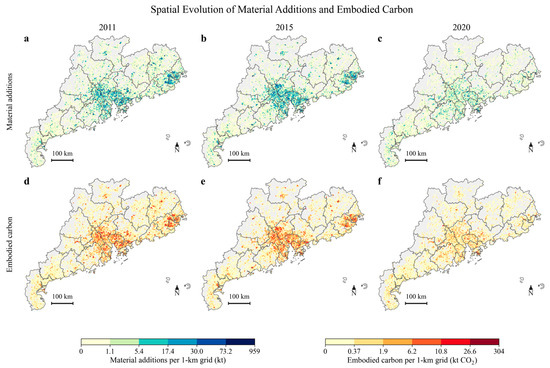
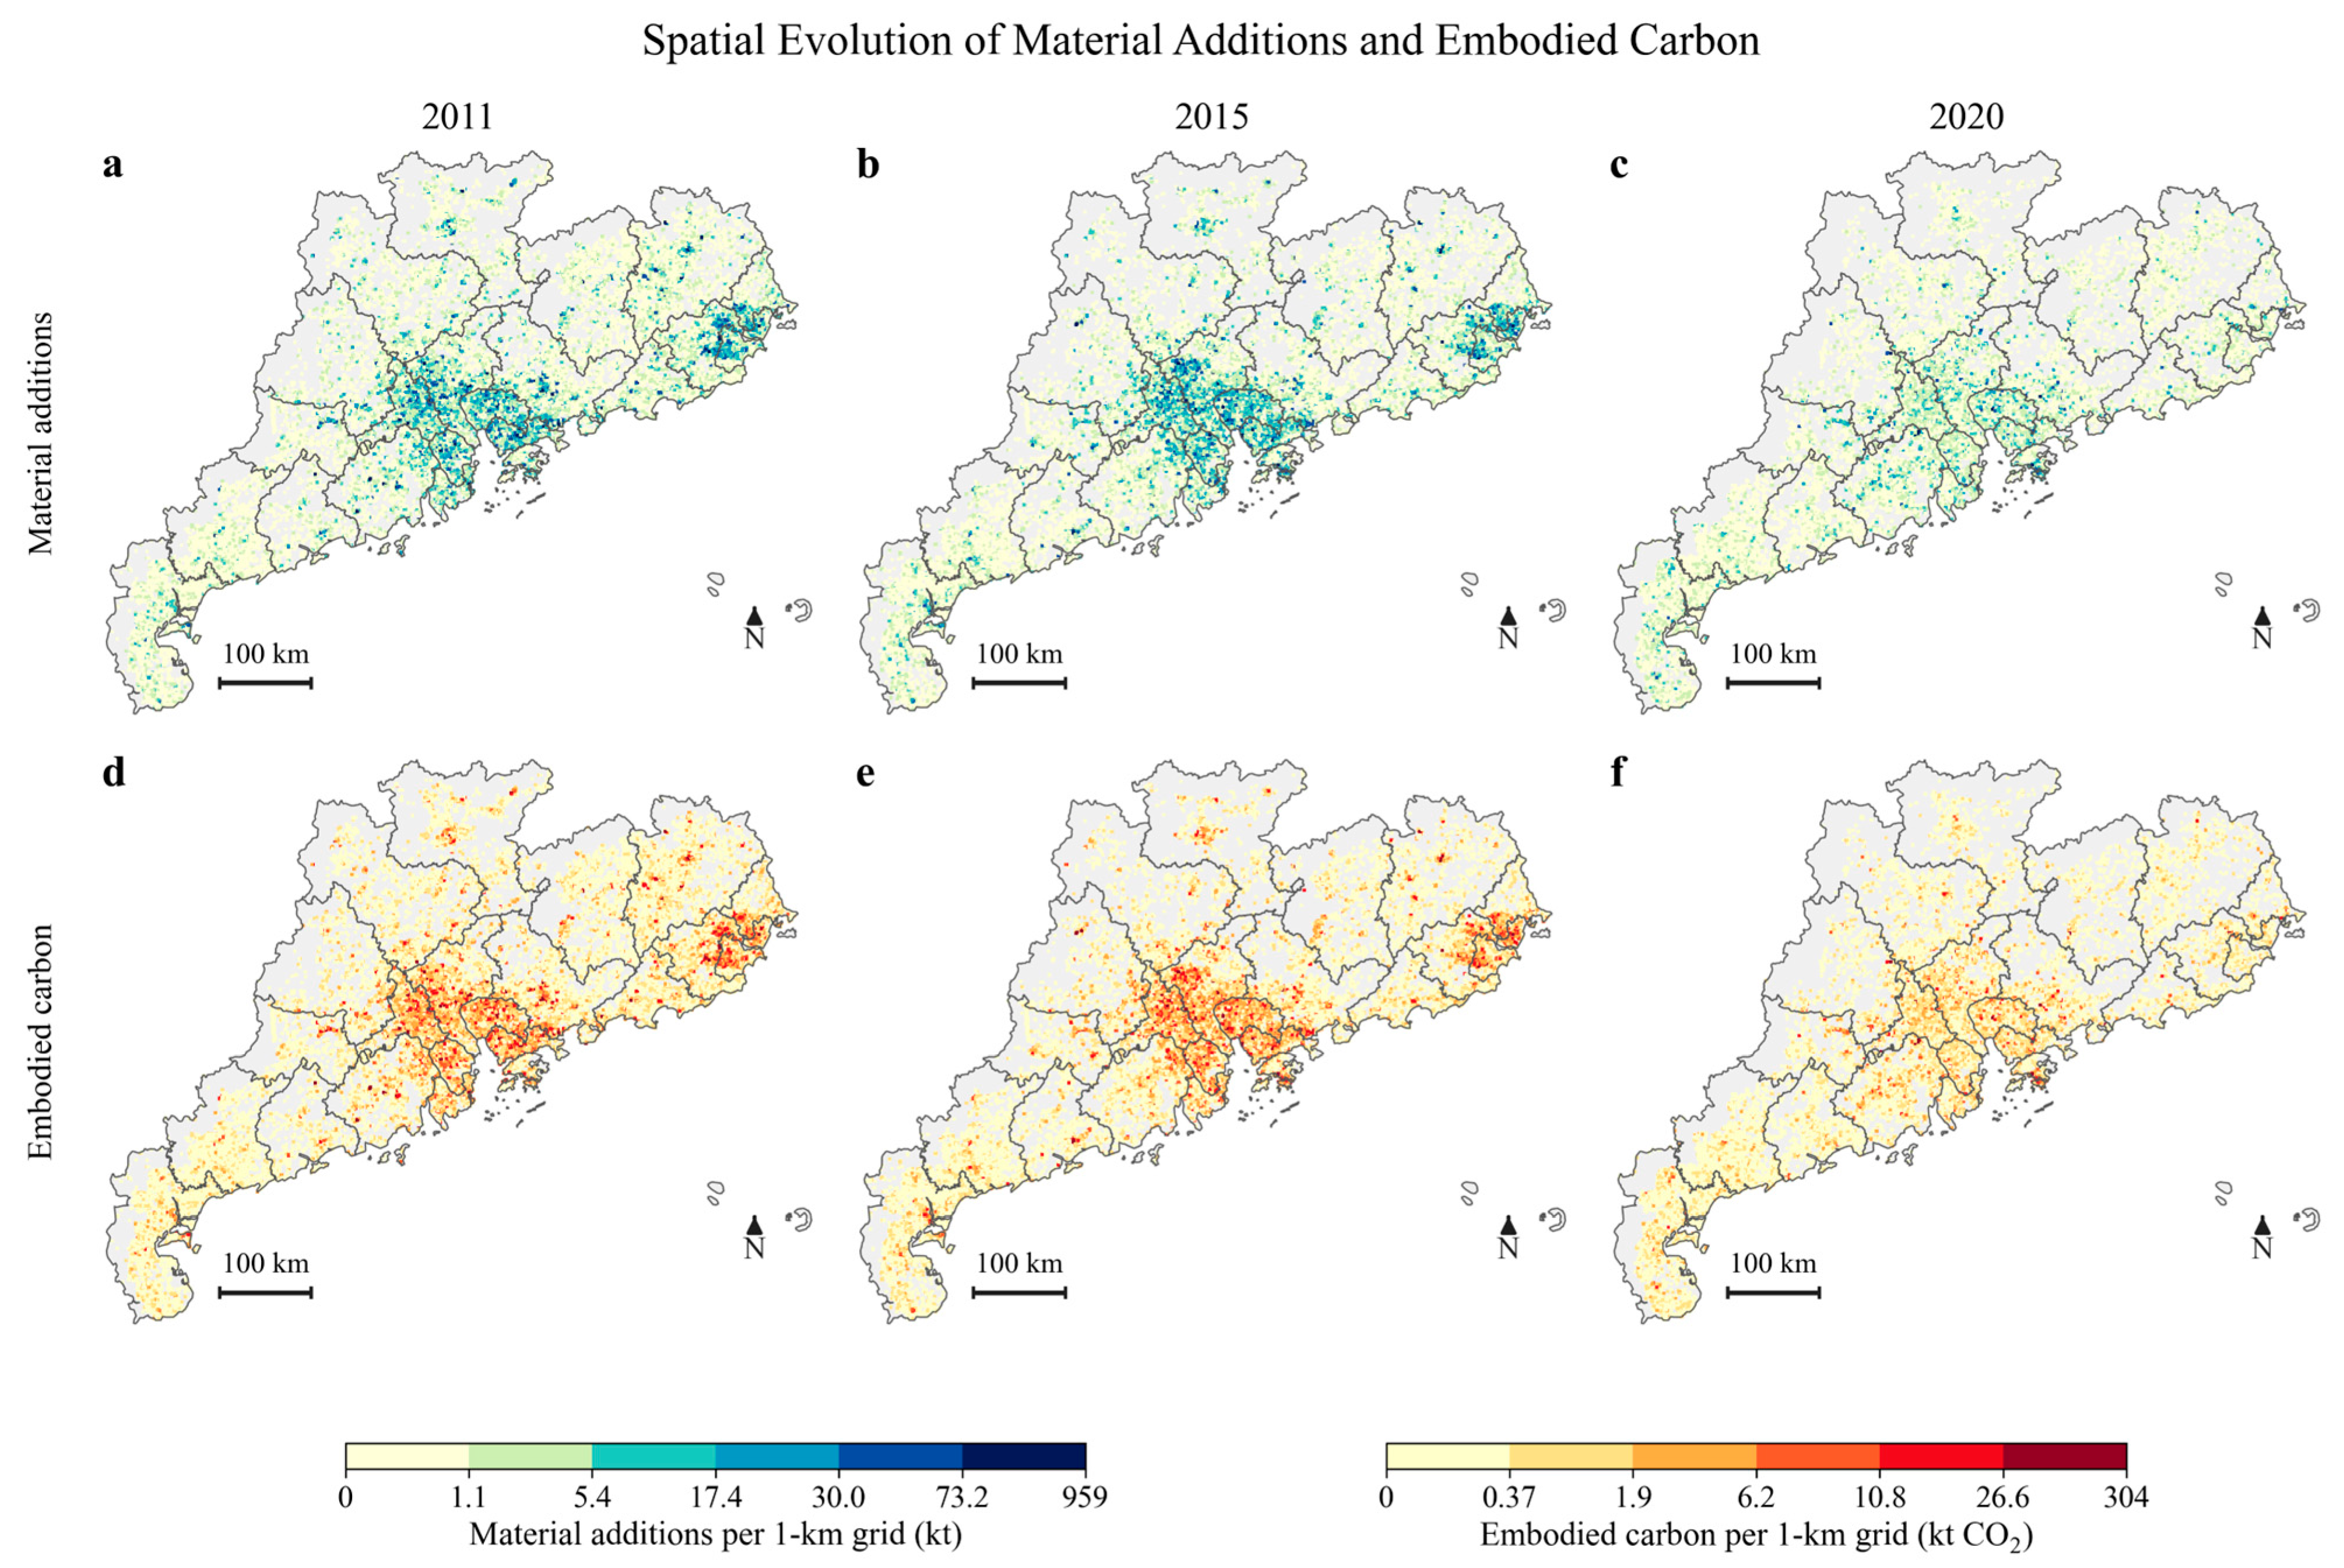
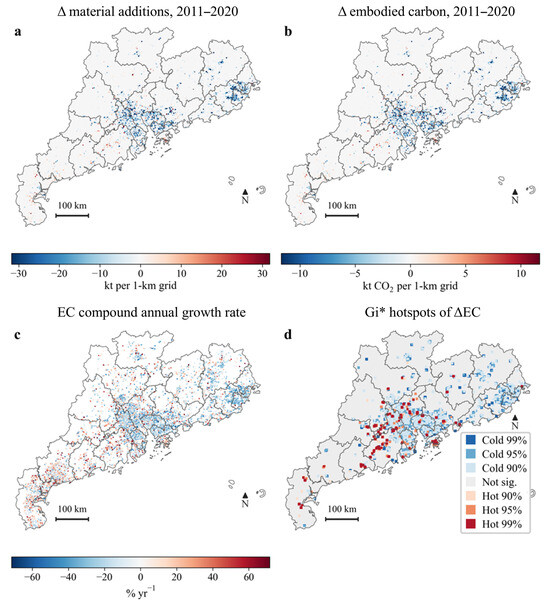
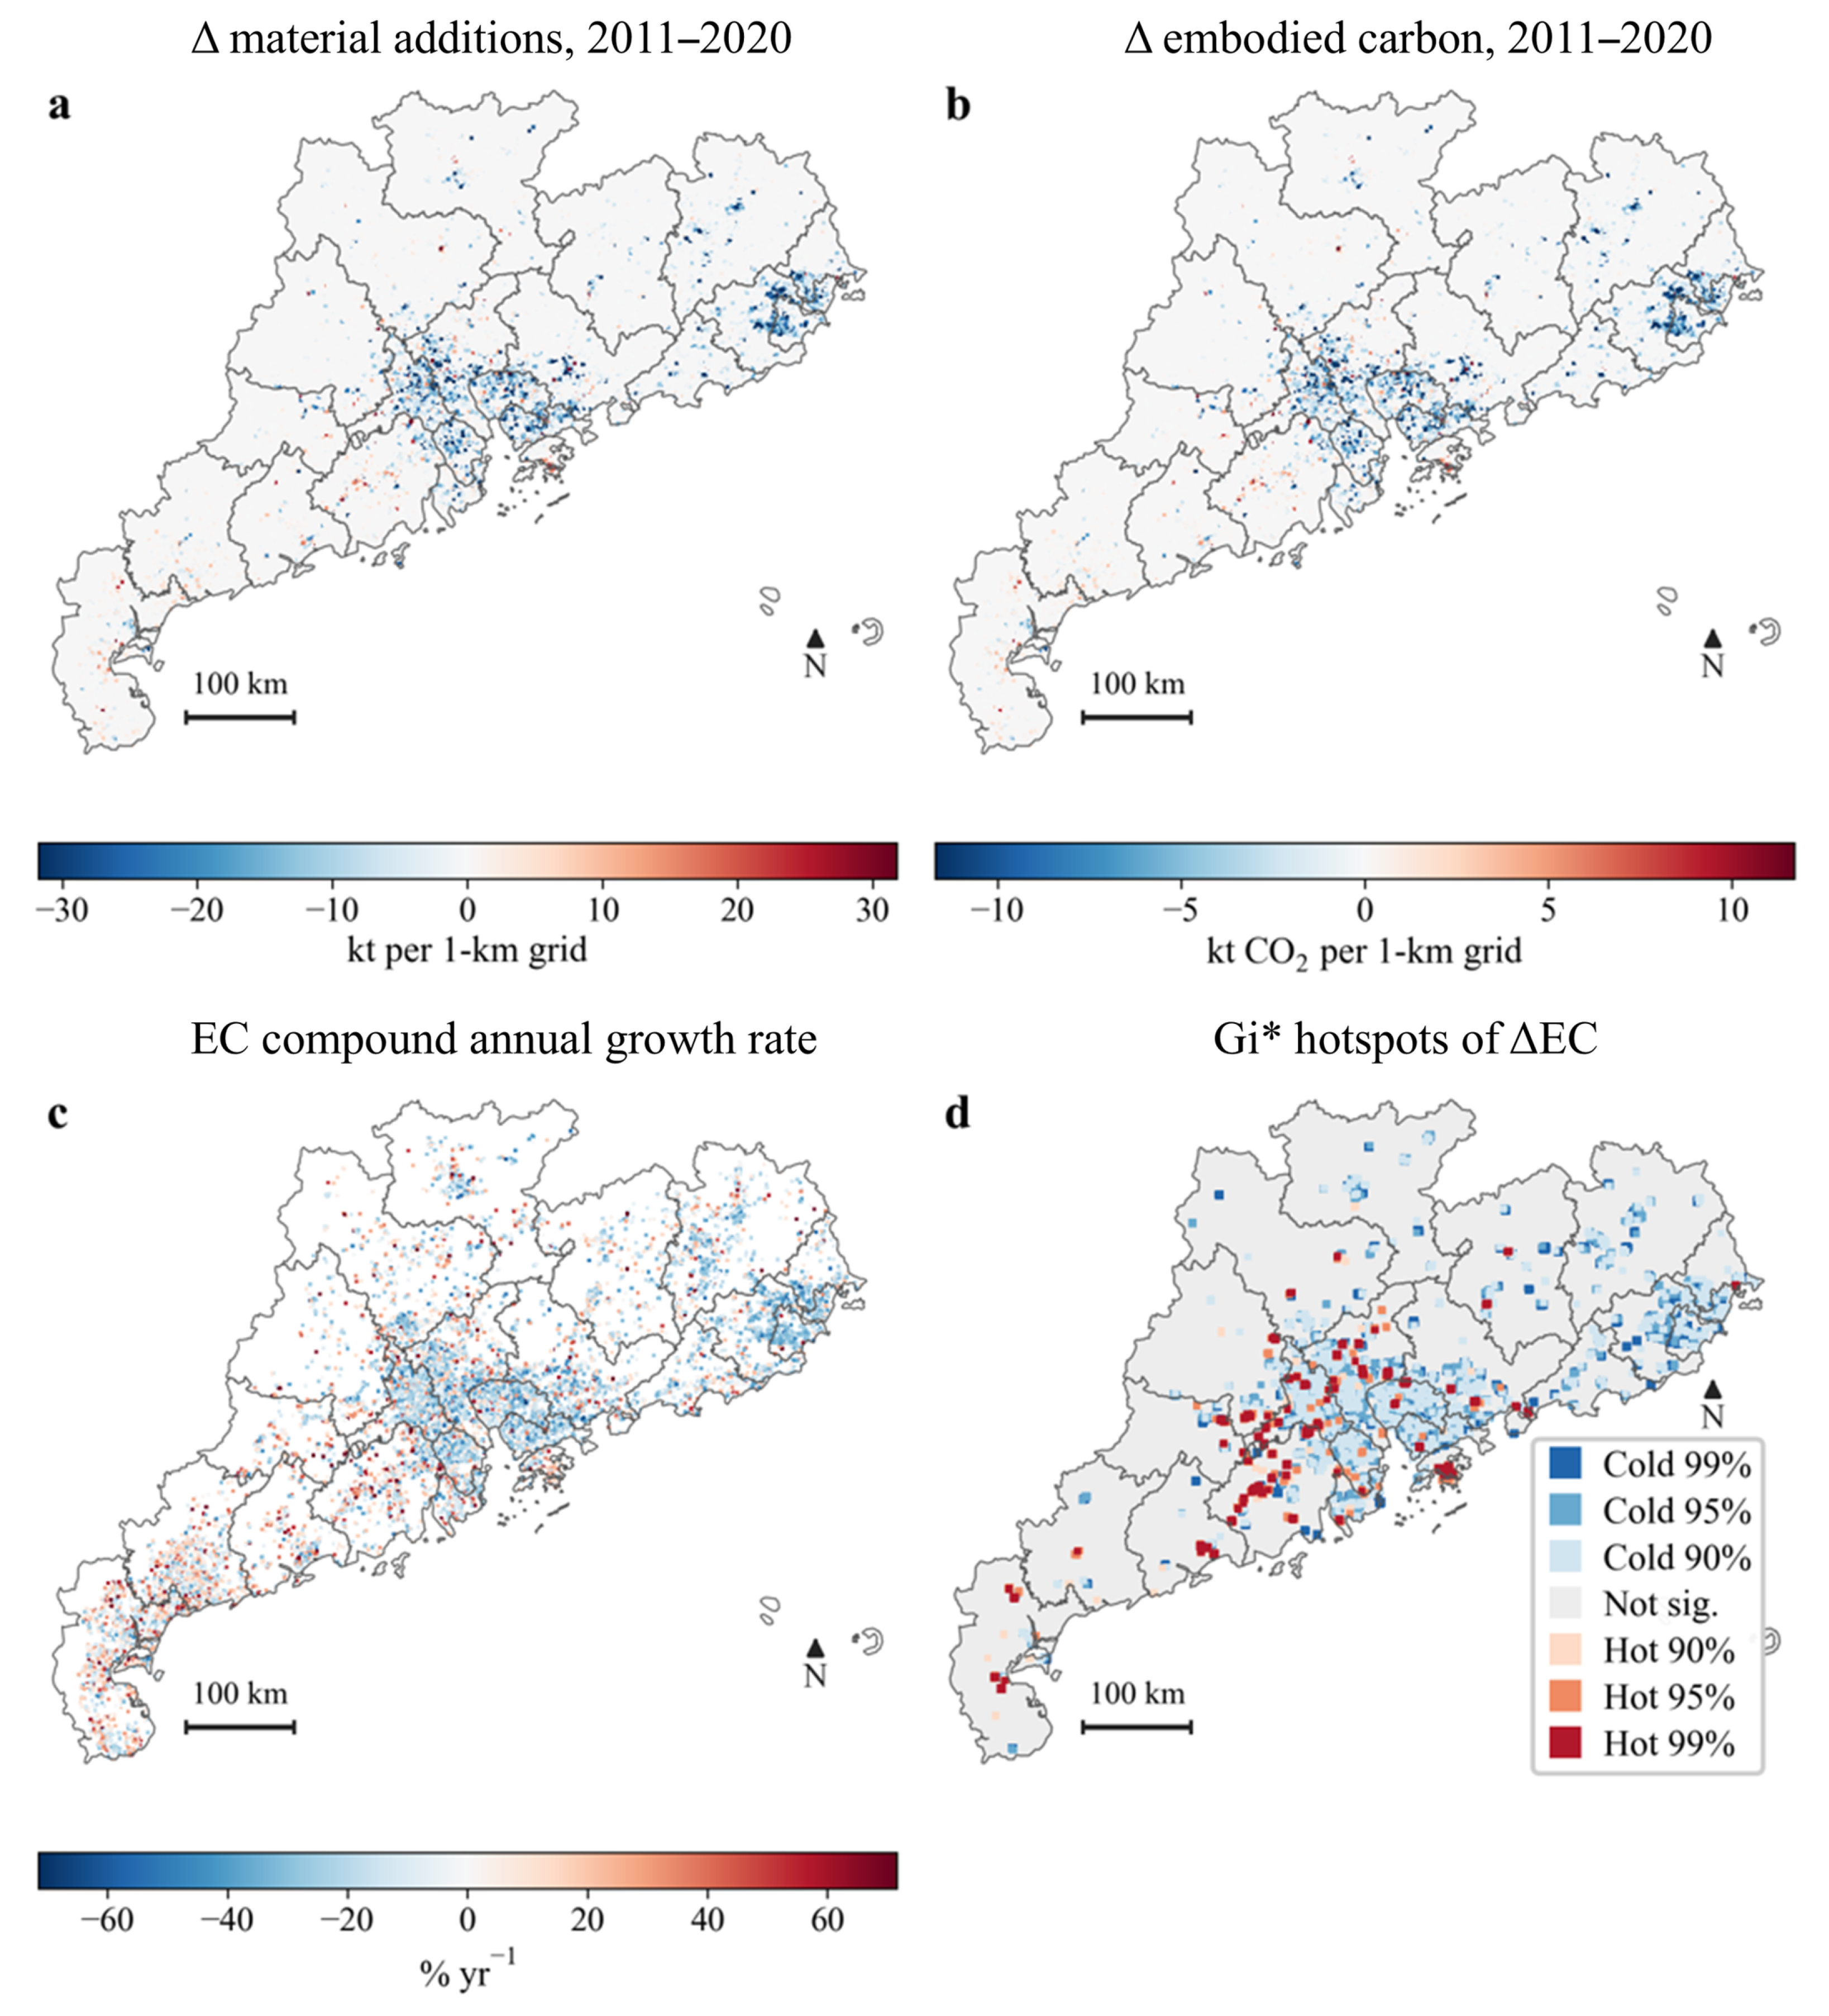
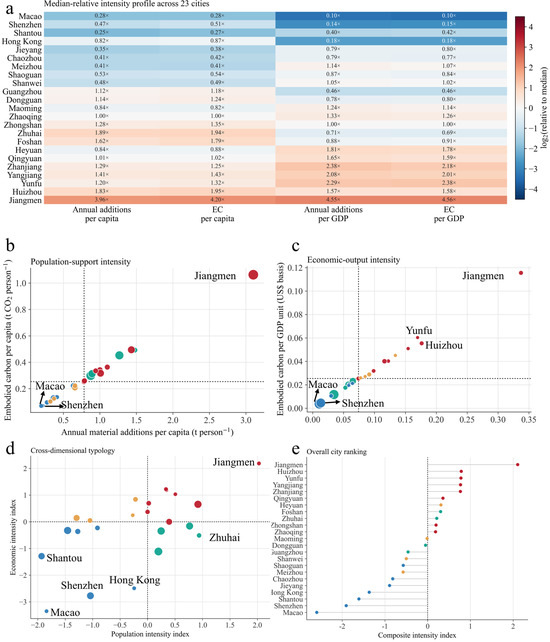
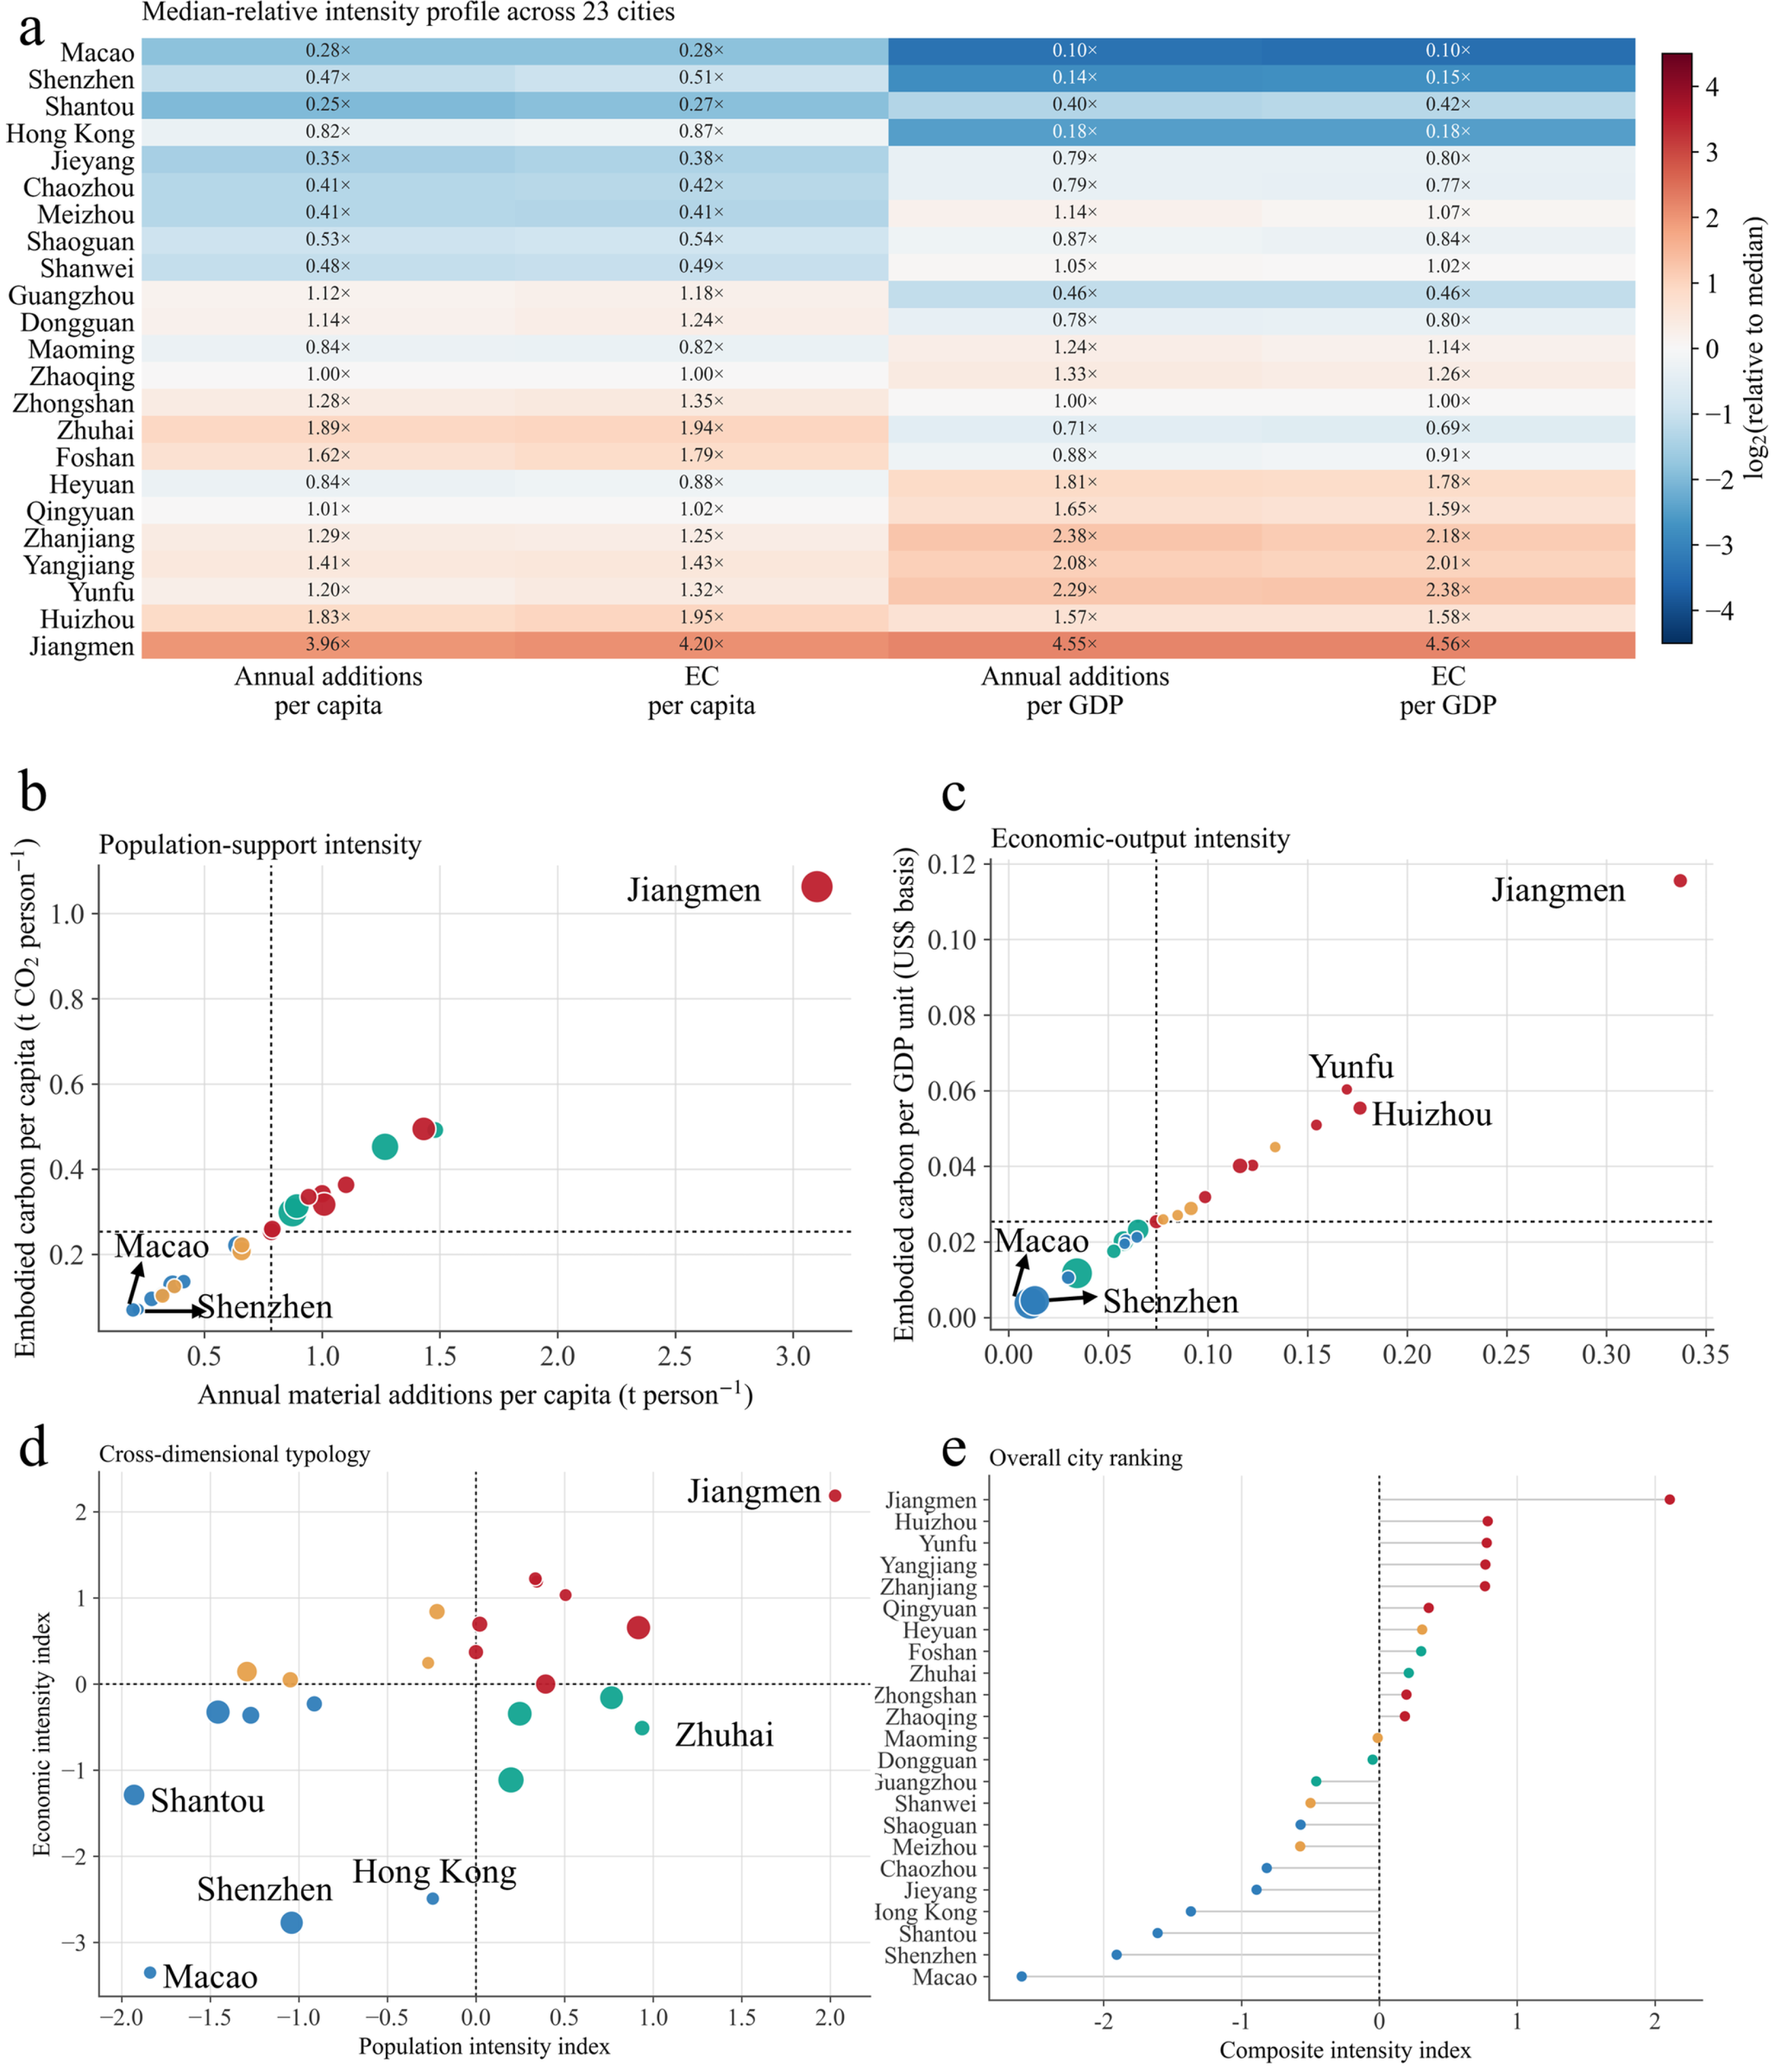
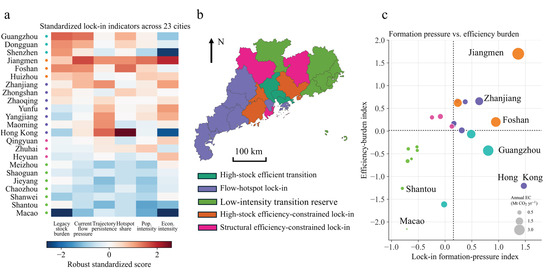
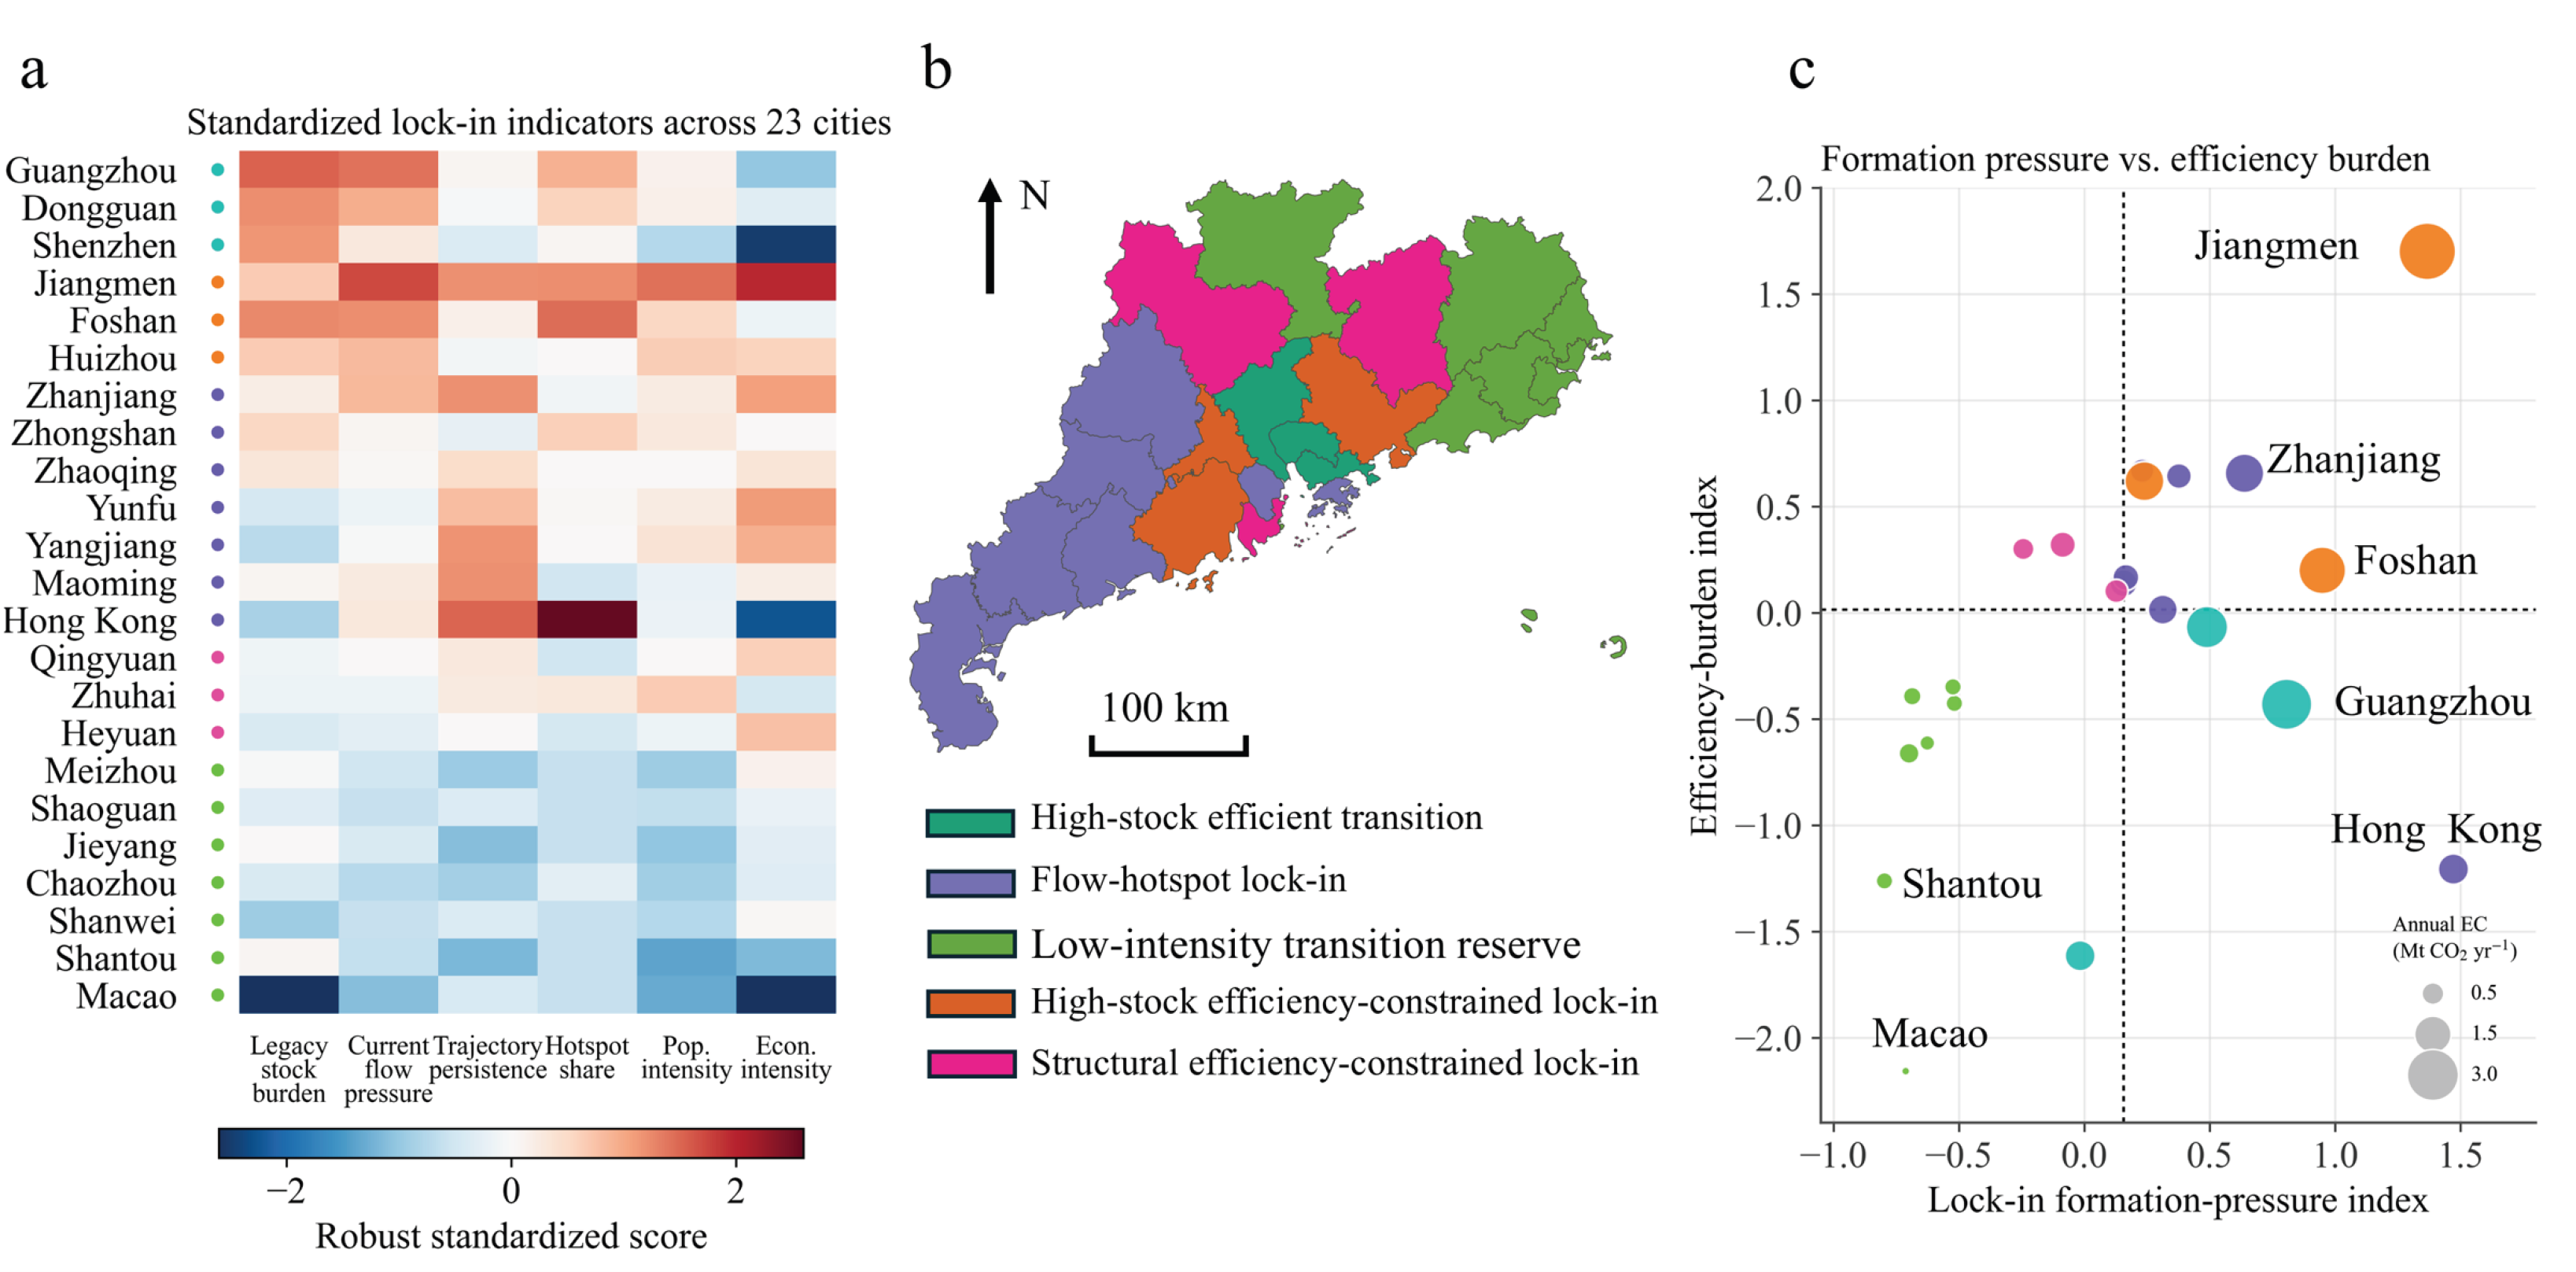
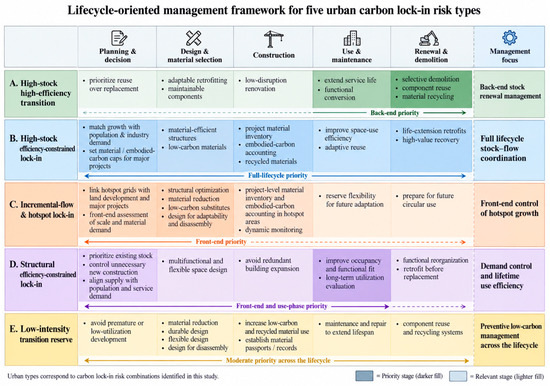
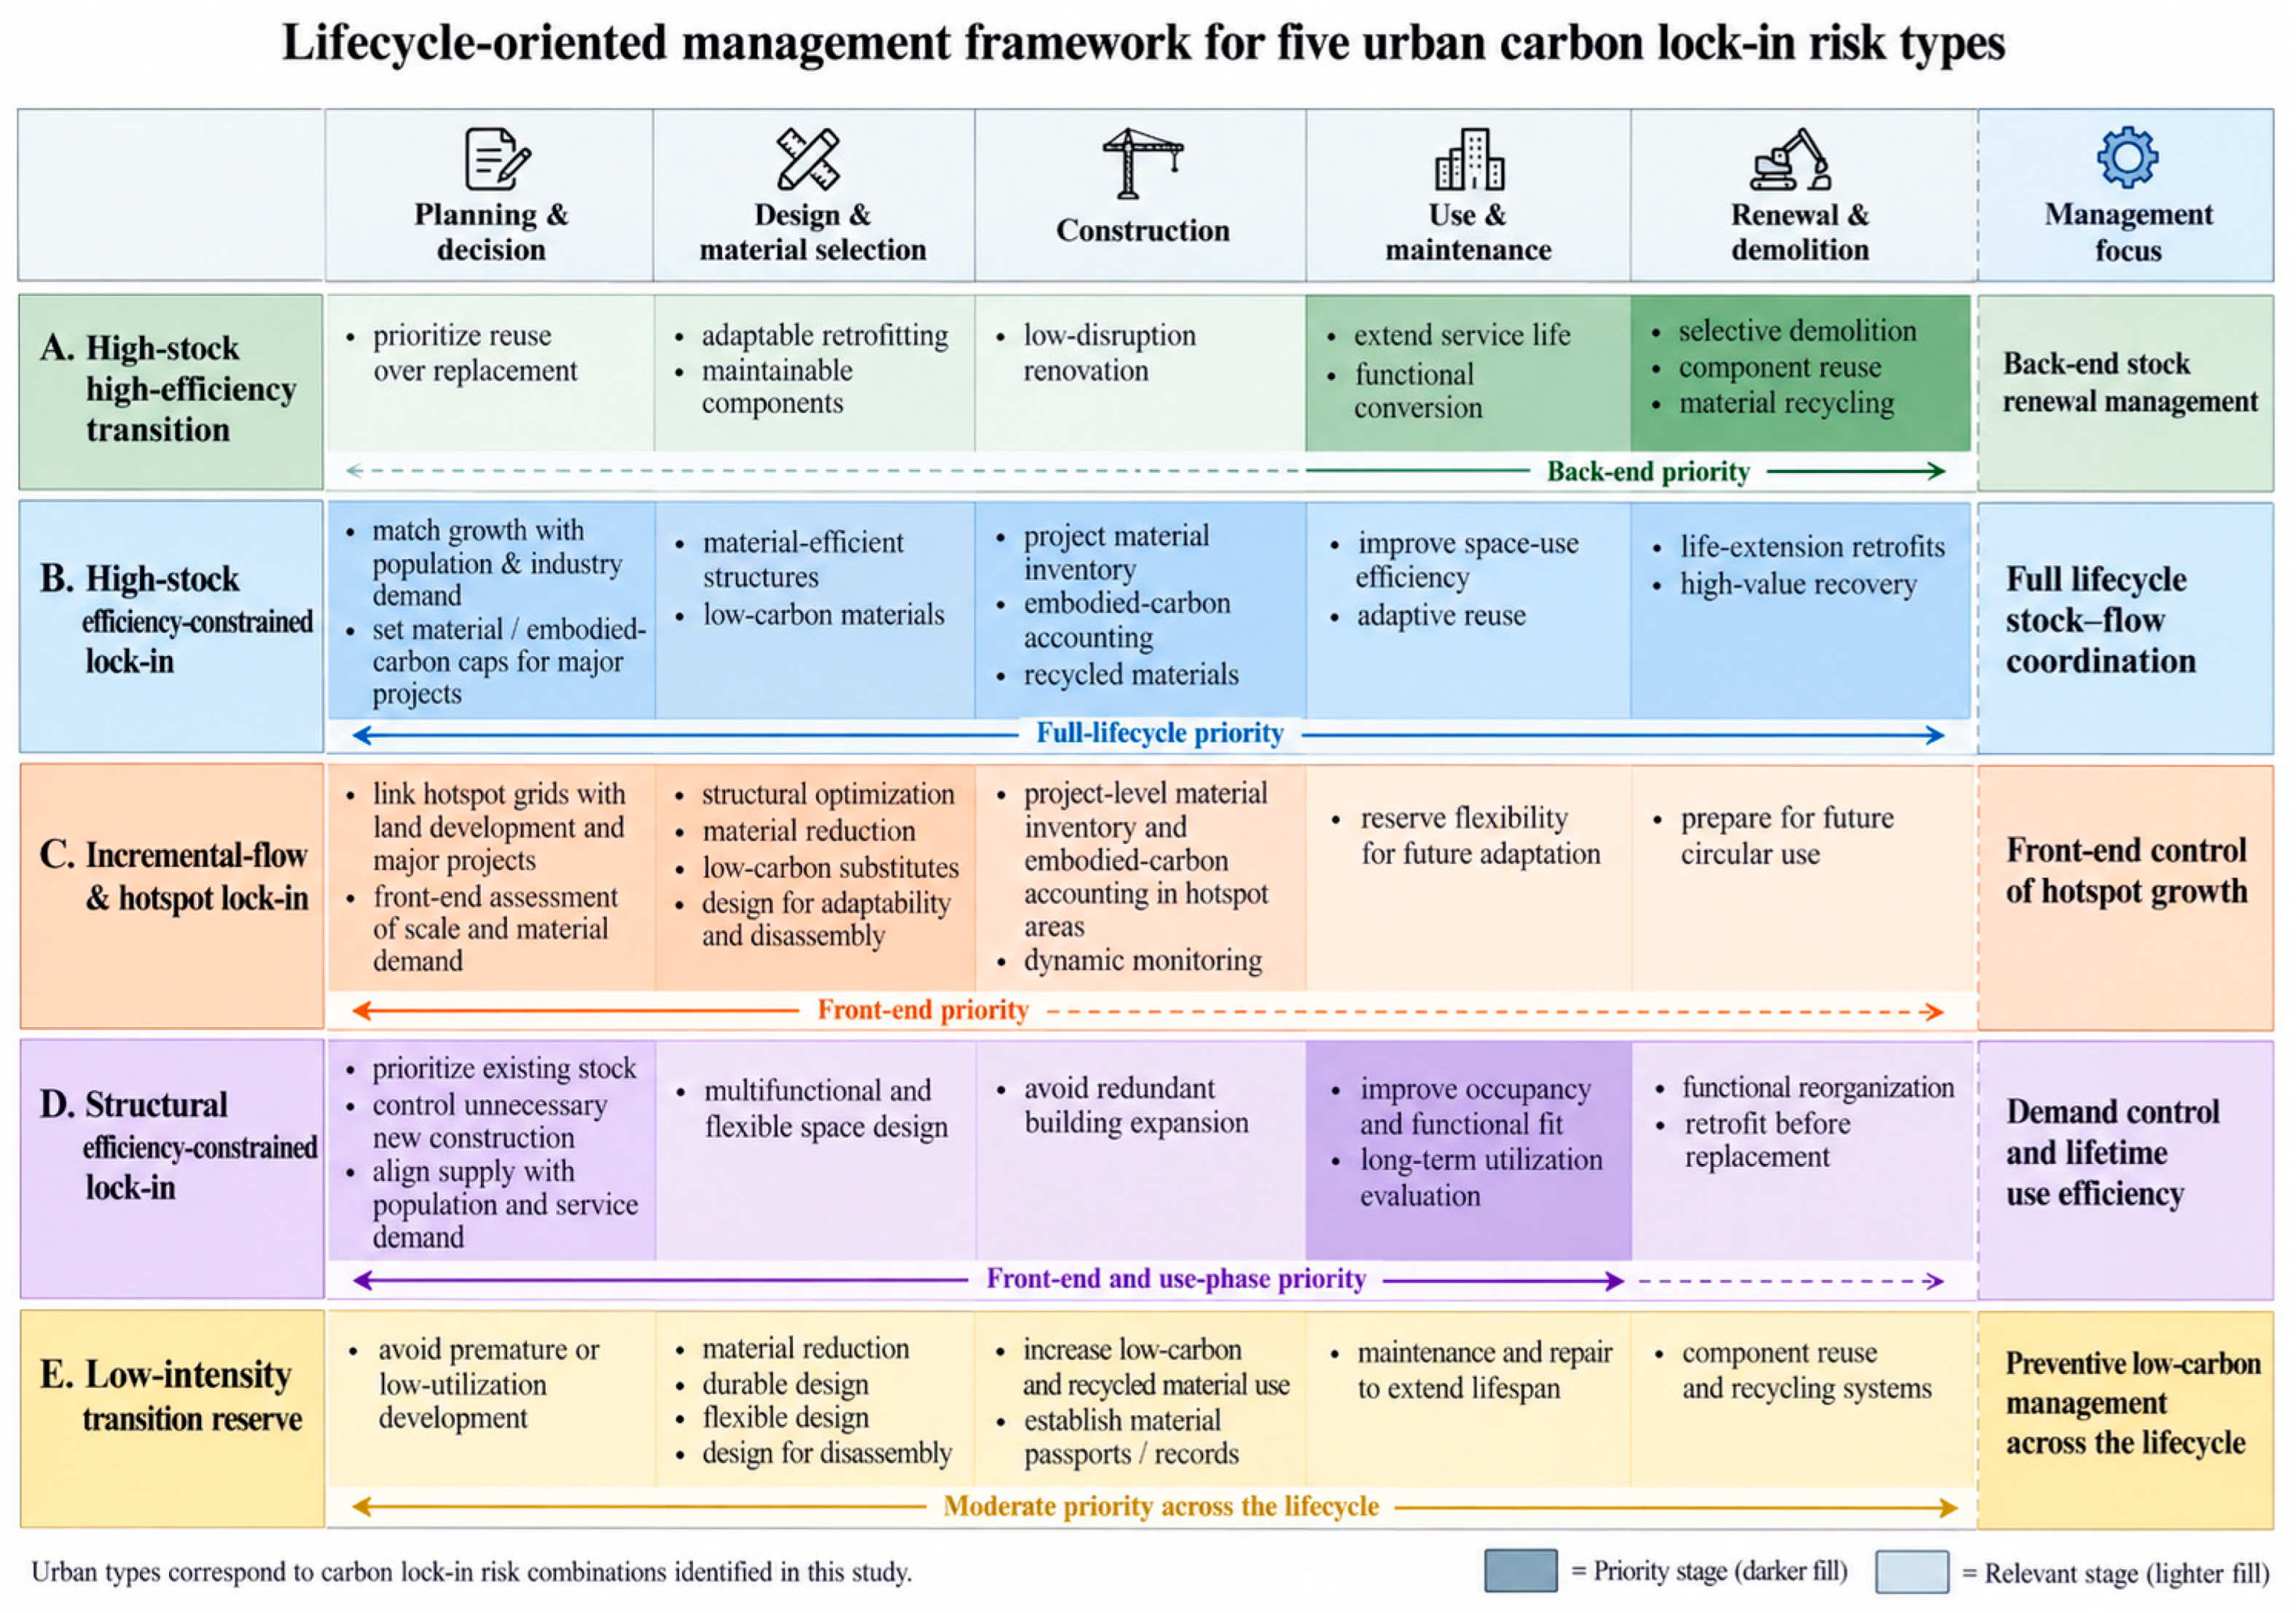

Disclaimer/Publisher’s Note: The statements, opinions and data contained in all publications are solely those of the individual author(s) and contributor(s) and not of MDPI and/or the editor(s). MDPI and/or the editor(s) disclaim responsibility for any injury to people or property resulting from any ideas, methods, instructions or products referred to in the content. |
© 2026 by the authors. Licensee MDPI, Basel, Switzerland. This article is an open access article distributed under the terms and conditions of the Creative Commons Attribution (CC BY) license.