


Abstract
Against the backdrop of rural energy transitions and the large-scale implementation of Building-Integrated Photovoltaics (BIPV), the photovoltaic (PV) design for rural office buildings in hot summer and cold winter regions faces a conflict between maximizing power generation and minimizing net energy consumption, along with a lack of refined multi-objective optimization frameworks. Taking a typical rural double-sloped-roof office building in the Jianghan Plain as the research subject, this study establishes a multi-objective optimization framework that integrates parametric modeling and a multi-objective genetic algorithm to obtain a Pareto-optimal solution set. Three scenarios—no PV, the original design, and the optimized design—were simulated and compared. The results indicate that: (1) The optimal installation parameters are a 27° tilt angle and an 18° east-of-south azimuth. Compared to the original design, the optimized system increases the average annual power generation by 56% (from 8.9 × 10⁴ kWh to 13.7 × 10⁴ kWh). (2) The optimized design reduces the building’s net energy consumption to −9.86 × 10⁴ kWh, achieving a comprehensive energy-saving rate of 288.11%, significantly outperforming the original design’s 179.76%. (3) This synergistic design enables the building to completely eliminate grid dependence, achieving energy self-sufficiency and a net energy surplus. This study provides a scientific reference for the refined BIPV design and low-carbon retrofitting of rural public buildings in similar climatic zones.
1. Introduction
As global climate change and the energy crisis grow increasingly severe, promoting a low-carbon transition in the energy structure has become an international consensus. As a key sector in global energy consumption and carbon emissions, the green and low-carbon development of the building industry is crucial to achieving the “dual carbon” goals. Building-Integrated Photovoltaics (BIPV) technology, as an innovative approach to integrating renewable energy with buildings, serves as a key pillar for achieving this goal. However, current photovoltaic designs for rural office buildings in regions with hot summers and cold winters still lack a refined multi-objective optimization system. Therefore, this study uses rural office buildings on the Jianghan Plain as a case study, integrating parametric modeling with genetic algorithms to conduct research on photovoltaic layout optimization, with the aim of laying the foundation for subsequent method development and case validation.
1.1. Background
As reported by World Energy Outlook, global energy consumption from 2010 to 2040 will increase by 56%. By then, the construction industry will become the greatest energy consumption sector [1]. Against this background, China explicitly announced its Dual Carbon goals in September 2020, specifically striving to achieve carbon peaking before 2030 and carbon neutrality before 2060 [2], marking China entry into a new stage of green and low-carbon transformation [3]. In fact, 36% of global energy consumption is attributed to construction activities and the carbon dioxide emissions of construction activities account for 39% of global carbon dioxide emissions [4]. The high carbon emissions from the construction industry constrain the achievement of the Dual Carbon goals [5,6].
As an innovative path deeply combining renewable energy and buildings, BIPV has become the key to promoting green building and energy low-carbon transformation [7]. BIPV is an advanced way of photovoltaic application, which seamlessly integrates solar panels into building exteriors, roofs, windows, and shading devices, showing dual functions of architectural elements and energy [8]. As a significant photovoltaic application in the construction sector in 1990, it has received increasing attention since 1990 [9,10]. According to estimates, the global installed capacity for photovoltaic panels has reached 444 GW, and approximately 20 × 108 kW of solar photovoltaic capacity is installable on various rural building roofs, and therefore rural areas will become the crucial production base for zero-carbon energy. The building density and electrical load density in rural areas are relatively lower, matching the features of distributed photovoltaic systems [11].
With the further implementation of Whole-County Promotion of Distributed Photovoltaics, distributed photovoltaics is gradually becoming the main part of clean energy in rural areas, which can promote energy transformation, effectively consolidate the achievements of poverty alleviation through photovoltaics, and contribute to the achievement of the national Dual Carbon goals in multiple perspectives [12]. Nevertheless, there are still issues during development, such as lack of standards, varying device quality, and insufficient load-bearing capacity of the distribution network [13]. However, with continuous technological advances, the mode of Photovoltaics + Energy Storage will effectively address the intermittency and instability issues of photovoltaic power generation, and improve the reliability and flexibility of energy supply. Driven by both policy support and market demands, the photovoltaic power generation of rural buildings in the Jianghan Plain, especially that of office buildings, is expected to achieve scaled, intelligent, and diversified development, providing robust support for rural revitalization and energy transformation. At the same time, distributed photovoltaic systems connected under the “self-consumption with surplus power fed into the grid” model also have a positive impact on distribution grids. For example, since air conditioning loads in summer largely coincide with peak photovoltaic output periods, on-site consumption in office buildings during the day can naturally reduce midday peaks and alleviate pressure on the upstream grid [14]; excess power fed back to nearby facilities, combined with multi-point support, helps address issues of low voltage at the distribution network’s end points and line overloading, thereby enhancing they enhance the resilience of the power supply [15]. In extreme situations, PV systems combined with energy storage can also provide short-term emergency support [16]. Therefore, the refined optimization of rooftop PV layout in this study not only benefits the power generation and energy-saving performance of individual buildings but also makes practical contributions to the safe and economical operation of distribution grids and the achievement of the Dual Carbon goals.
1.2. Research Review
Since the early 1990s, photovoltaic technology has been integrated with building envelopes to reduce peak power loads and meet building energy demands [17]. Through achieving energy self-sufficiency, it is expected that photovoltaic components in buildings can be utilized in response to the energy-saving and emission reduction policy [18]. Research on rooftop photovoltaics (RPV) covers a wide range of topics, from micro-level module layout to macro-level energy planning, and comprehensively integrates multiple objectives such as economic viability, policy constraints, grid interaction, and environmental impact [19].
In the areas of system modeling and layout optimization, researchers have focused on developing high-precision algorithms capable of handling complex roof geometries and dynamic shading; however, most of these efforts have targeted urban buildings or ground-mounted power plants, and there is a lack of refined adaptations for the north-facing slopes of rural gable roofs. Miao et al. [20] proposed a model for generating and optimizing rooftop PV layouts for large-scale building complexes. This model can automatically handle irregular roof shapes and accurately calculate shading losses caused by surrounding buildings and the array itself, thereby maximizing annual power generation. Barbón et al. [21] developed a general-purpose algorithm specifically designed to optimize the layout of PV modules on irregular roofs, effectively addressing the accuracy issues caused by simplifying assumptions in traditional methods. Regarding economic considerations, numerous scholars have integrated mathematical optimization methods, such as integer programming, to jointly optimize the scale, orientation, and tilt angle of rooftop PV systems, aiming to minimize users’ electricity costs or the system’s energy costs. Awwad et al. [22] generated roof areas from satellite imagery and employed mixed-integer nonlinear programming (MINLP) to independently optimize panel location, azimuth, and tilt, thereby quantifying the power generation potential of rooftop PV systems while accounting for shading effects.
When evaluating the economic viability of photovoltaic systems, most scholars consider the multifunctionality of BIPV systems and their long-term advantages over traditional building components. Some scholars argue that incorporating photovoltaic and building quality factors from the outset, along with life-cycle cost analysis methods, can help architects optimize BIPV solutions; however, these approaches often rely heavily on static parameters or subjective weightings and fail to combine intelligent optimization with calibration based on actual measurements. According to researchers, the comprehensive assessment of BIPV in the past attached more importance to cost–benefit analysis [23], energy efficiency [24], feasibility analysis [25], sustainable performance assessment [26], techno-economic assessment, and environmental assessment. Mori et al. [27] developed a comprehensive method with Hyogo Prefecture in Japan as an example to assess the environmental costs and benefits of building photovoltaic solar power plants and protecting natural ecosystems. To avoid the impact of subjective factors on the comprehensive benefit assessment of photovoltaic power generation, Chu et al. [28] employed the Analytic Hierarchy Process (AHP) to modify the relative importance of the indicator system, and then conducted a comprehensive assessment from four aspects, namely economic benefits, technical benefits, social benefits, and environmental benefits. However, the development of BIPV is still faced with challenges, such as lack of government support, high demands for funds and low efficiency. Though a series of corresponding policies and measures have been taken in many countries and regions to mitigate the challenges, comprehensively identifying risk factors and conducting scientific assessments are crucial for the development of BIPV [29].
In terms of grid interaction, centralized or shared energy storage models effectively mitigate the intermittency of solar power, but research has focused primarily on the grid side rather than the buildings themselves. Xiao et al. [30] concluded that Battery Energy Storage Systems (BESS) can effectively address the issue of photovoltaic supply–demand imbalance. It is feasible to use an Energy Storage System (ESS) to store energy from photovoltaics and grids during low-demand periods and then supply it back to grids during high-demand periods. Schoen [31] studied the application models of Photovoltaic Energy Storage System (PESS) in rural low-voltage distribution networks from grid investment, user investment, third-party investment, sharing investment, and other aspects [31]. Because the intermittency of solar power limits its application in power generation, a centralized battery energy storage model for distributed photovoltaic systems was proposed to enhance the utilization of the storage system and reduce grid dependency [32].
From the perspective of the simulation and optimization of photovoltaic power generation, the operating conditions of photovoltaic arrays, one of the key device parts for photovoltaic modules to perform photoelectric conversion, directly impact the power generation efficiency and economic benefits of photovoltaic power generation [33]. And consequently, to improve the power generation efficiency of photovoltaic modules, the model prediction and optimization of photovoltaic module arrays appear to be extraordinarily significant. Liu et al. [34] proposed an optimization method for photovoltaic module tilt angle based on regional clustering and cost assessment as they realized that the influencing factors for power generation of photovoltaic modules exhibit distinct geographical variation and coupling characteristics. An Artificial Neural Network (ANN) based on the backpropagation algorithm was proposed for performance prediction of photovoltaic modules. Dong et al. [35] proposed a feature fusion method based on LightGBM, XGBoost, and LSTM algorithmic models for prediction of photovoltaic power generation. With a library in Changsha as a case, Xian et al. proposed renovation strategies for facade shading PV panels and rooftop PV panels suitable for public buildings in hot summer and cold winter regions, during which they found that the annual electricity consumption after renovation was reduced by 35.4% compared to the initial state through a comparative simulation analysis of the azimuth angle, length, tilt angle, and installation spacing of the PV panels before and after the renovation [36]. Previous studies focusing on the differences between the simulated data and the actual data of photovoltaic systems, quantified the differences by comparing the data obtained from the PVsyst tool with the actual data in 2021. Ahirwar et al. [37] proposed a simulation-based design and sizing method for a 50 kWp grid-connected photovoltaic (PV) system using PVsyst software to supply power for 100 residential communities. Using PVsyst software (7.4.7), Li [38] simulated the impact of roof tilt angle, system output, and installation configuration on photovoltaic system performance, and conducted a comprehensive analysis of the carbon reduction benefits in eco-roof construction. Concentrated scellsation will cause the temperature of solar batteries within photovoltaic modules to rise [39], thereby lowering the efficiency of solar batteries and shortening the service life of photovoltaic modules [40]. Therefore, it is required to reckon on this fact during design and installation. In addition, some researchers have sought to improve photovoltaic power performance by employing hybrid systems that incorporate passive cooling strategies for thermal management. Sajjad et al. [41] analyzed the power efficiency and performance ratio of modules by controlling variables in the cooling system.
A review of the above literature reveals that existing BIPV research has yielded substantial results in areas such as module layout optimization, economic feasibility assessments, and grid interaction; however, significant gaps remain in terms of research subjects, methodologies, and evaluation dimensions. In terms of research scenarios, most past studies have focused on urban buildings or ground-mounted power plants, while detailed research on photovoltaic integration for the typical double-pitched roofs of rural office buildings in regions with hot summers and cold winters remains scarce. Methodologically, previous studies have largely relied on static empirical formulas or single-theory simulations, lacking a systematic framework that combines intelligent optimization algorithms with calibration using actual measurement data, resulting in discrepancies between theoretical predictions and engineering practice. In terms of evaluation dimensions, existing studies often examine either PV power generation or building energy consumption in isolation, with few efforts to comprehensively quantify synergistic benefits by placing both within a single framework. These research gaps constitute the core motivation for this study, which targets rural office buildings on the Jianghan Plain and employs genetic algorithms combined with field-measured correction coefficients to conduct dual-objective optimization of PV power generation and building energy consumption.
1.3. Innovation
Accordingly, an integrated optimization and assessment method was proposed and implemented in this research, with its innovation primarily reflected in the following aspects: (1) This study quantitatively identified systematic deviations between theoretical simulations and actual operation and derived power generation correction factors tailored to local climate and building environment characteristics, providing a more practical reference for evaluating power generation in subsequent similar projects. (2) This study introduced parametric modeling and genetic algorithms, applying this established technical approach systematically for the first time to the specific scenario of double-sloped roofs on rural office buildings in the Jianghan Plain. The focus was on addressing the underutilization of power generation potential on north-facing slopes in PV layout optimization for this region, as well as the discrepancies between theoretical simulations and actual field measurements. (3) Through applied research on a diverse range of typical rural building cases in the Jianghan Plain, this study not only validated the effectiveness of this methodological approach in specific cases but also provided a scientific basis for the large-scale promotion and application of photovoltaic technology in public buildings in regions with hot summers and cold winters.
1.4. Research Objectives
This study focuses on rural office buildings in the Jianghan Plain and conducts a systematic investigation into the optimization of photovoltaic integration on double-sloped roofs. The specific research objectives are as follows: (1) By integrating parametric modeling with genetic algorithms, this study intelligently and iteratively optimizes the pitch and orientation of photovoltaic roofs, overcoming the limitations of traditional empirical installation methods. It fully taps into the power generation potential of north–south double-sloped roofs to achieve balanced and efficient utilization of rooftop photovoltaic resources. (2) By leveraging the synergistic effects of active PV power generation and passive thermal insulation of building envelopes, this study effectively reduces energy consumption for heating, cooling, and lighting. It promotes the transformation of buildings from traditional energy consumers to net energy producers, quantifies the comprehensive energy-saving benefits under different integration scenarios, and thereby enhances the energy efficiency of buildings. (3) This study establishes a replicable and scalable optimization system for rooftop photovoltaics in rural buildings, enhancing the region’s capacity for on-site renewable energy consumption and reducing carbon emissions from building operations. It provides both theoretical foundations and engineering support for the low-carbon retrofitting of public buildings in villages and towns located in regions with hot summers and cold winters.
The remainder of this paper is organized as follows. Section 2 details the research methodology, including the research object, calculation of photovoltaic efficiency, boundary condition settings, and the simulation-based multi-objective optimization framework. Section 3 presents the case study, analyzing the simulated power output, verifying the data, and correcting the simulation results based on measured data. Section 4 evaluates the comprehensive energy efficiency of the BIPV system under different scenarios and analyzes the economic feasibility. Section 5 discusses the findings, limitations, and future research directions. Finally, Section 6 concludes the study.
2. Research Methods
As stated in the preceding study, this research aims to achieve the dual objectives of maximizing power generation and minimizing net energy consumption through the optimization of photovoltaic array layout. To systematically support these research objectives, this chapter details the technical approach and experimental design framework adopted. First, it introduces the geographical and climatic conditions as well as the architectural characteristics of the Jianghan Plain, where the study subject is located; second, it explains the calculation principles for photovoltaic power generation efficiency and the basis for setting simulation boundary conditions; the chapter focuses on the process of constructing an optimization framework based on parametric modeling and multi-objective genetic algorithms, and introduces methods for calibrating theoretical simulation results using field data collected from June through August; finally, a technical roadmap summarizes the overall research process to ensure methodological rigor and reproducibility, thereby providing reliable analytical tools for the case studies (Figure 1).
Figure 1.
Research Methodology Framework. (a) Field photograph of the research object; (b) Dimensions of the research object; (c) Meteorological data; (d) Solar radiation diagram.
2.1. Research Object
Depending on the unique geographical advantages and policy support, the photovoltaic power generation technology in rural areas in the Jianghan Plain has formed a coordinated development pattern characterized by aquaculture–photovoltaic complementarity, agriculture–photovoltaic complementarity, and rooftop distributed photovoltaics. Liuheyuan Administrative Area, located in the core area of the Four Lake Region of the Jianghan Plain, subordinate to Jingzhou City, Hubei Province, is a typical area with a hot summer and cold winter subtropical monsoon climate [40,41]. Most houses there are detached houses with brick-concrete structures and relatively sufficient rooftop space. Meanwhile, the annual sunshine duration in this area is 1800–2000 h with an average solar radiation intensity of 4000–4500 MJ/m2, making it the area with the medium-to-high solar energy resources. With relatively longer annual utilization period for photovoltaic power generation, this area shows relatively great power generation potential. With an average annual temperature of approximately 16.5 °C (Figure 2), this area is suitable for operation of photovoltaic devices. It can be inferred from the monthly meteorological data that values for extraterrestrial solar radiation, clear-sky index, and ambient temperature are relatively high in June to August, while those in January are lower. The villages are predominantly distributed in linear or clustered patterns, which facilitates grid connection and centralized dispatching, showing an organizational foundation for developing distributed photovoltaics.
Figure 2.
Climatic and solar characteristics.
With the office building in the Liuheyuan Administrative Area as the architectural example (Figure 3), in this research, the site selection is shown in Figure 3b. According to practical project investigation, as for the model parameter setting, the 2–3 story office buildings with a sloped roof, featuring a south-facing slope of 27.300 m × 4.650 m and a north-facing slope of 27.300 m × 3.629 m was selected. In the project, the bifacial photovoltaic arrays installed on the two buildings’ flat rooftops not only serve as power generation facilities for office buildings, but also function for building shading. The optimal integration method for photovoltaic modules with building roofs proposed in this paper achieves maximum efficiency through ideal tilt and azimuth angles. By comparing the energy consumption data of the new plan and the original design, the architectural energy-saving potential of the new plan was assessed.
Figure 3.
Site and case-study building. The red frame highlights the specific location of the case-study building and its rooftop PV panels.
2.2. Calculation of Photovoltaic Power Generation Efficiency
The installation tilt and azimuth angles of photovoltaic arrays are the main influencing factors for system power generation efficiency [42] (Figure 4). And thus, this research mainly focuses on the impact of tilt and azimuth angles of photovoltaic arrays on system power output and their optimization. The solar altitude angle α is the angle between the solar rays and the X-Y plane (Formula (1)), while the solar azimuth angle θ is the angle between the projection of the solar rays onto the X-Y plane and the Y-axis (Formula (2)).
Figure 4.
Diagram of solar altitude angle and azimuth angle.
Generally, the calculation formulas for solar altitude angle and azimuth angle are shown below:
sinα = sinδsinϕ + cosδcosϕcosω
The calculation formulas for total power output are shown below (Formulas (3) and (4)):
Em = WHn
In the formulas, Em refers to the power output (unit: kW·h/m2) of the nth month; W refers to the total capacity of the photovoltaic system; H refers to the total operating hours of the photovoltaic system of the current month; and Ey refers to the total annual power output of the system.
2.3. Boundary Condition Setting
In this research, the optimized photovoltaic modules and rooftop integration methods were compared to the photovoltaic arrays in the original case (located at Liuheyuan, Jiangling County, Jingzhou, Hubei). The multi-story office buildings were selected as the geometric prototype of photovoltaic power generation and energy consumption simulationon, as well as the comparison example. The dimensions of photovoltaics on the building roof are set as 27.300 m × 4.650 m of the south-facing slope and 27.300 m × 3.629 m of the north-facing slope (Figure 5). Additionally, based on the comparison example, the photovoltaic tilt and azimuth angles and other array modes were optimized to improve photovoltaic power generation efficiency. The buildings used in architectural photovoltaic simulation assessment are characterized by flat roofs. See Table 1 and Table 2 for detailed parameter settings for the specific building envelope structure.
Figure 5.
Geometry and model information. The red frame indicates the research object, and the symbol "#" indicates the building number 1.
Table 1.
Detailed parameter settings of buildings used in photovoltaic power generation and energy consumption simulation.
Table 2.
Boundary conditions of building envelope structure used in photovoltaic power generation and energy consumption simulation.
2.4. Simulation Process
In this research, the parametric modeling platform Grasshopper (a visual programming environment for Rhino3D) was employed as the primary simulation environment. Within this platform, two widely recognized environmental analysis plug-ins, Ladybug and Honeybee, were integrated [43]. Ladybug was used for climate and solar data analysis, while Honeybee served as the simulation engine to invoke EnergyPlus for calculating hourly photovoltaic power generation and building energy consumption (Table 3). It should be noted that Grasshopper and these plug-ins serve as the simulation platform, whereas the actual optimization algorithm adopted in this study is the multi-objective genetic algorithm. The numerical simulation results generated by EnergyPlus have been proven to be of high accuracy by numerous theoretical and empirical studies [44].
Table 3.
Key model input parameters used in photovoltaic power generation simulation.
In addition, in this research, the genetic algorithm was embedded into the tool chain above deeply. In this integrated framework, Grasshopper defines the optimized variables (tilt and azimuth angles) and their actual restraint scopes, and controls the process. As an optimization engine, the genetic algorithm automatically generates candidate solutions (i.e., different combinations of tilt and azimuth angles). Honeybee/Ladybug drives the update of underlying models according to the parameters of each candidate solution and invokes EnergyPlus to execute the corresponding power output and energy consumption simulation calculations. Unlike traditional single-objective genetic algorithms (SOGA), which focus solely on a single performance metric, this study employs a multi-objective optimization strategy. It simultaneously incorporates the maximization of annual photovoltaic power generation and the minimization of net building energy consumption into the fitness function. By comparing and screening design solutions using Pareto dominance, this approach avoids the subjectivity associated with manually setting weight coefficients in single-objective optimization.
Regarding the coupling between the optimization engine and the parametric module, this study achieves a true “generate-simulate-evaluate-evolve” closed-loop: the parametric model in Grasshopper automatically converts each set of pitch and azimuth angles generated by the genetic algorithm into geometric information and updates the simulation inputs, while Ladybug/Honeybee invokes EnergyPlus to calculate power generation and energy consumption under hourly meteorological conditions. The simulation results are then systematically corrected for bias using correction coefficients (calibrated based on actual June to August operational data), and the resulting corrected fitness values are fed back into the genetic algorithm to drive evolutionary operations such as selection, crossover, and mutation, thereby generating a new generation of optimized populations. This mechanism, which tightly integrates “parametric modeling—multi-objective optimization algorithms—physical simulation engines—calibration with measured data,” ensures both the efficiency and accuracy of global search while bridging the gap between theoretical simulation and engineering practice through the calibration process. It provides reliable technical support for subsequent scenario comparisons and synergy benefit analyses.
To standardize the optimization, the tilt angle (β) and azimuth angle (γ) are set as the decision variables, denoted as X = [β,γ]. Considering the actual roof geometry and the trade-offs of the optimization, their search ranges are limited toβ ∈ [10°, 45°] and γ ∈ [−45°, 45°]. Here, negative values mean eastward and positive values mean westward. For the encoding, we use a continuous real-number scheme rather than binary or discrete coding. The chromosome is simply the vector X = [β,γ]. This matches the slider inputs in Grasshopper, which directly controls the rotation of PV panels in the 3D model (as shown in Figure 6a). The GA parameters were chosen based on common practices in similar building performance studies and our preliminary trials. We set the population size to N = 100 to maintain diversity without making the EnergyPlus simulations too time-consuming. The maximum generation is G = 100 to ensure convergence. The crossover probability (Pc = 0.9) and mutation probability (Pm = 0.1) follow standard settings for multi-objective algorithms like NSGA-II. To make the algorithm easily reproducible, a simplified one-generation example is provided. Suppose Parent A is (20° tilt, −10° azimuth) and Parent B is (30° tilt, 10° azimuth). Through crossover and mutation, they generate an offspring, C, at (27° tilt, −18° azimuth). Grasshopper then turns these angles into physical panel coordinates, and the EPW weather data (Figure 6b) drives the EnergyPlus simulation. The grid-based radiation analysis (Figure 6c) calculates the annual power generation f 1(X) and net energy consumption f2(X). If Offspring C performs better than both parents on both objectives, it enters the Pareto front. After 100 generations, the final Pareto front is obtained, and the knee point criterion is used to objectively select the final 27°/18° solution. This process aligns with the flowchart in Figure 7. To avoid reintroducing subjective weighting at the final decision stage of multi-objective optimization, study adopts a knee-point criterion based on the geometric characteristics of the Pareto front to identify a representative final design from the set of non-dominated solutions. First, the optimization directions of the objective functions are unified, and min-max normalization is applied to map objective functions with different dimensions to the interval from 0 to 1. For benefit-type indicators, the normalized value is calculated as follows (Formula (5)):
Figure 6.
Encoding, environmental data input, and fitness evaluation process of the multi-objective genetic algorithm in Grasshopper. The red boxes highlight the key analysis areas.
Figure 7.
Flowchart of genetic algorithms.
For cost-type indicators, the following transformation is applied so that all normalized objectives follow the same direction, with larger values indicating better performance (Formula (6)):
Next, the two extreme solutions at the ends of the Pareto front, A(xA, yA) and B(xB, yB), representing the extreme performance of the two objectives, are selected and connected to form a reference line. For any Pareto-optimal solution Pi(xi, yi), the perpendicular distance di from the solution to the reference line AB is determined. The reference line is expressed as follows (Formula (7)):
(yB − yA)x − (xB − xA)y + xByA − yBxA = 0
The di values of all non-dominated solutions are then compared, and the solution with the largest perpendicular distance is defined as the knee point of the Pareto front; that is, the solution with the maximum di is selected as the final representative solution. This point indicates where the marginal trade-off between the two objectives changes markedly: further improvement in one objective generally requires a relatively large deterioration in the other. Therefore, this method provides a clear and reproducible basis for selecting the final solution without assigning subjective weights in advance.
At the data calibration level, correction coefficients based on actual operational data from June through August were introduced to bridge the systematic discrepancy between theoretical simulations and engineering reality. Compared to traditional evaluation methods that rely solely on theoretical models, this approach enhances the engineering credibility and practical value of the results. The simulation results in subsequent chapters are all based on this decision scheme.
2.5. Verification of Simulation Data Based on the Real Data from June to August
To verify the accuracy of photovoltaic power generation simulation results and adjust them to be closer to actual project operating levels, the actual operation data was introduced in this research for verification. The actual total power output of the building’s photovoltaic system in the example from June to August was selected as the benchmark and compared to the simulated power output during the same period to determine the correction coefficient of power output. The actual power output in June–August is 42,600 kW·h. Meanwhile, based on Grasshopper and Ladybug platforms, as well as local meteorological data, through simulation, the theoretical power output in June–August is 46,703.54 kW·h. On this basis, the correction coefficient λ for power output was calculated (Formula (8)):
where a refers to the actual photovoltaic power output (kW·h) and b refers to the simulated photovoltaic power output (kW·h).
λ = a/b = 42600/46703.54 ≈ 0.912
These results indicate that the system’s actual power generation during operation is approximately 91.2% of the theoretical simulation value. Given that the summer climate conditions in the Jianghan Plain are relatively stable—with ample sunshine and complete meteorological data from June through August, making this period highly representative—this study will apply the correction factor λ = 0.912, determined based on data from these months, to adjust the annual power generation estimates, thereby enhancing the engineering reliability of power generation forecasts. The correction factor is essentially based on the most unfavorable estimate of the system’s performance ratio (PR) under high-temperature and high-humidity conditions during the summer months of June through August. Since photovoltaic modules have a negative power temperature coefficient, their actual operating efficiency in low-temperature winter environments is often higher than in summer. Therefore, applying the summer worst-case condition factor to the entire year is a conservative assessment strategy that results in a slight underestimation of winter power generation; this constitutes a “safety-first” approximation in engineering decision-making. Furthermore, since both the original design and the optimized design scheme apply exactly the same correction factor in their calculations, this proportional scaling does not alter the relative efficiency improvement ratio between the two schemes. This ensures that the optimization results from the genetic algorithm remain unbiased and fair, unaffected by this correction logic. However, due to the lack of actual annual measurement data, a single static coefficient cannot accurately reflect the nonlinear losses caused by dynamic fluctuations in ambient temperature, dust deposition rates, and differences in the solar radiation spectrum throughout the year. Consequently, this correction method contains objective prediction biases and should be regarded solely as an engineering approximation acceptable under current constraints.
2.6. Technical Route
With the optimization and application of photovoltaic layout as research contents, this project mainly consists of the following three parts. (1) In terms of optimization methods for angles of photovoltaic panels, the optimal solution for maximizing power output was automatically found within the Pareto Front using the genetic algorithm with the altitude and azimuth angles of photovoltaic modules as variables. (2) Unmanned Aerial Vehicle (UAV) 3D modeling was used for 3D scanning of buildings. The actual buildings were converted into 3D digital models. (3) The photovoltaic system was integrated into the target buildings, and the optimized photovoltaic layout was applied to the target buildings. In addition, the comparative method was employed to study the energy consumptions of the buildings without photovoltaics, the actual buildings with photovoltaics and the buildings with optimized photovoltaic layout and to calculate their energy-saving efficiency. See Figure 8 for the specific research route of this project.
Figure 8.
Technical route.
3. Case Study
The aforementioned study has established a framework for optimizing photovoltaic layout based on genetic algorithms. To verify the applicability of this optimization framework in real-world engineering scenarios, this chapter conducts an empirical analysis using the office building in the Liuheyan Management Area of the Jianghan Plain as a specific case study. The analysis examines the benefits of the optimization through a multidimensional comparison of theoretical and measured power generation, providing data support for subsequent comprehensive performance evaluations.
3.1. Overview of Liuheyuan
Liuheyuan (112°33′~112°46′ E, 33°36′~33°41′ N) is located in the heart of the Four Lake Region of the Jianghan Plain with a maximum east–west distance of 9.5 × 10³ m and a maximum north–south distance of 6.6 × 10³ m. In this research, with one office building in Liuheyuan as the research object, the optimal power generation efficiency and strategic plan were determined by analyzing it under scenarios without photovoltaic panels, with existing photovoltaic panels installed at a 5° tilt angle, and with simulated optimal photovoltaic panels installed at the optimal angle. The majority of the permanent residents in Liuheyuan are middle-aged and elderly, with energy utilization primarily in electricity and liquefied gas, resulting in problems such as thermal efficiency of traditional cookers only ranging in 30–40% and coal heating leading to indoor PM2.5 concentrations that are 3 to 5 times higher than the national standard. Most office buildings feature sloped roofs, and some of them are installed with photovoltaic panels on roofs on account of the sufficient unobstructed roof space, providing basic conditions for installing 5–10 kWp photovoltaic systems. According to the sample survey, the average annual electricity consumption per household is approximately 1800–2500 kWh, where the energy consumption of AC systems in summer accounts for 35–40% with their daily operating hours of 4–8 h. At present, about 10% of rural households have installed rooftop photovoltaic (PV) systems, with installed capacities typically ranging from 5 kW to 10 kW and annual power output of approximately 6000–12,000 kWh, and most systems adopt the Self-use + Grid Connection mode. The photovoltaic renovation can effectively reduce household pressure in electricity expenditure, demonstrating significant benefits, especially during peak summer periods. During the promotion process, there are still challenges, such as high initial investment costs, unfamiliarity with grid connection procedures, and unclear benefit expectations, and consequently, it is required to enhance policy guidance and technical services. Based on the current survey conditions, the awareness and acceptance of local villagers of photovoltaic buildings are compositely featured by primary economic motivation, gradually increasing environmental awareness, and persisting technical concerns.
3.2. Simulated Statistical Power Output
3.2.1. Overview of Simulation
Based on the parametric model and boundary conditions set above, using Ladybug in Grasshopper, power generation simulation was conducted on the sloped-rooftop photovoltaic system on the office building in Liuheyuan in this research combined with the meteorological data of Jiangling County, Jingzhou, Hubei. The simulation aims at quantitatively comparing the annual total power output under the original design conditions and the optimized conditions to verify the efficiency potential of the optimal tilt angle strategy. The simulated statistical results are shown in the following Figure 9, clearly reflecting the performance differences before and after tilt angle optimization of photovoltaic arrays.
Figure 9.
Comparison chart of original and simulated optimized design plans for rooftop photovoltaic panels.
3.2.2. Analysis of Simulation Results
Firstly, the benefits increased after optimizing the tilt angle of photovoltaic panels. After optimizing both the south-facing and north-facing tilt angles to 27° with an azimuth of 18° east of south, the system’s total annual power output was improved from approximately 9.8 × 10⁴ kW·h to 15.0 × 10⁴ kW·h with an extremely significant increase of 56%. Secondly, the performance on the north-facing slope experienced a breakthrough improvement. After simulated optimization, the increase in the system’s total annual power output was mainly attributed to the north-facing slope. In the original design plan, due to the excessive tilt angle (−24.4°), the north-facing slope received limited solar radiation, resulting in very low power generation efficiency. After optimizing the tilt angle to 27°, its incident radiation and power output, each more than doubling, activated the power generation potential of the north-facing slope and achieved the efficient utilization of the entire rooftop area. Meanwhile, the performance of the south-facing slope remained stable and efficient. After slightly adjusting the tilt angle of the south-facing slope from 21.1° to 27°, both its incident radiation and power output achieved a slight increase. Based on the Knee Point Criterion defined in Section 2.4, the solution with a tilt angle of 27° and an azimuth of 18° (east of south) was objectively identified as having the maximum perpendicular distance to the reference line. Therefore, it was selected as the final optimal scheme (Figure 10).
Figure 10.
Model diagrams of rooftop photovoltaic panels before and after simulated optimization. The red frame highlights the research object (experimental subject).
The simulation results above, as theoretical ideal values, have fully demonstrated the immense advantages of the optimal tilt angle of 27° and azimuth of 18° east of south determined by the genetic algorithm in improving the system’s total annual power output, especially in activating the power generation ability of the north-facing slope. The results have provided a clear direction for the design of photovoltaic systems on rural sloped roofs. Nevertheless, there are various efficiency losses in actual operation. The theoretical power output will be corrected below to acquire the prediction values closer to practical engineering (Figure 11).
Figure 11.
Optimization process and Pareto front exploration of the multi-objective genetic algorithm. The black dots represent the evaluated solutions generated during the optimization process, the red dots indicate the non-dominated solutions (Pareto front), and the green background in the data list highlights the selected optimal parameter combinations.
3.2.3. Partial Data Comparison
To further assess the performance of the optimization plan (a tilt angle of 27° and an azimuth of 18° east of south) compared to the original design (21.1° on the south-facing slope/−24.4° on the north-facing slope), a comparative data analysis (Figure 12) from two perspectives, including the seasonal power generation distribution and efficiency difference between south-facing and north-facing slopes, was conducted in this research.
Figure 12.
Comparative analysis of power generation performance before and after optimization. (up) Comparison of seasonal power output before and after optimization (Unit: kWh), (down) Changes in contribution rates of south-facing and north-facing slopes to power output before and after optimization.
- (1)
- Comparison of Seasonal Power Output
The optimization plan not only improved the annual total power output, but also improved the system performance in winters, balanced the annual power generation distribution, and reduced the seasonal fluctuations, facilitating the stable supply of energy.
- (2)
- Comparison of Power Generation Contribution Rates of South-facing and North-facing Slopes
The comparison results showed that the optimization strategies thoroughly changed the power generation structure of rooftop photovoltaics. Under the original design plan, the power generation was almost entirely attributed to the south-facing slope, while the north-facing slope contributed little, resulting in imbalanced rooftop resource utilization. After optimizing, the power generation contribution rate of the north-facing slope increased from 0.5% to 32.6%, balancing the power output of the south-facing and north-facing slopes. This proved that a tilt angle of 27° with an azimuth of 18° east of south successfully activated the power generation potential of the north-facing slope and achieved the efficient and balanced utilization of the entire rooftop area, which is also the root cause for the increase of 56% in total power output.
In conclusion, by comparing the seasonal and spatial data, the advantages of the optimization plan (a uniform tilt angle of 27° with an azimuth of 18° east of south) have been quantified. It not only achieved a substantial leap in annual power output, but also optimized the temporal distribution of power output, especially the performance in winter. Additionally, through deep digging into the power generation potential of the north-facing slope, it realized the balanced utilization of building rooftop resources. The comparison results proved that the optimization plan is a highly referential example for sloped-roof photovoltaic designs with similar orientations in the Jianghan Plain region.
3.3. Correction of Simulation Results
3.3.1. Data Correction
After correction, the calculations of expected actual annual power output are shown below (Formulas (9) and (10)):
where c refers to the corrected annual power output (kW·h) under the original design plan, while d refers to the corrected annual power output (kW·h) under the optimized design plan.
c = 9.8 × 10⁴ kW·h × 0.912 ≈ 8.9 × 10⁴ kW·h
d =15 × 104 kW·h × 0.912 ≈ 13.7 × 10⁴ kW·h
3.3.2. Meanings and Discussions of Correction
Firstly, the reliability of simulation can be verified. The correction coefficient is very close to 1, proving the relatively high accuracy and reliability of the parametric simulation method based on Grasshopper and Ladybug, and the simulation results can reflect the system’s actual power generation potential well. Secondly, more practical prediction data can be provided. After correction, the annual power output of the optimization plan was downregulated from 15 × 104 kW·h to approximately 13.7 × 10⁴ kW·h. The data is of more practical significance for combined considerations of local environment and system operation losses.
On the whole, through the empirical correction of data in June–August, the theoretical power output of the optimization plan was converted to a prediction value closer to the practical operation conditions in rural areas in the Jianghan Plain, thereby improving the engineering guiding significance of the research conclusions. Based on the corrected power output, the comprehensive energy efficiency of BIPV will be further discussed below combined with building energy consumption simulation.
4. Analysis of Comprehensive Energy Efficiency of Photovoltaic Building Integration System
In the aforementioned research, the significant improvement of photovoltaic array layout optimization on system power output has been verified through simulation. However, the values of BIPV system not only lie in the mere increase in power output, but also lie in the comprehensive reduction in energy consumption of buildings themselves. To comprehensively assess the overall benefits of photovoltaic buildings, the energy use demands of buildings under different scenarios were compared and analyzed and the overall energy-saving efficiency of system was calculated from the perspective of net energy consumption in this research based on the building energy consumption model constructed using Honeybee.
4.1. Simulation and Scenario Setting of Building Energy Consumption
Based on the practical building information of the office building in Liuheyuan (Table 4), including window-to-wall ratio, indoor occupant density, equipment power, and AC operation schedule, a building energy consumption model was built in Honeybee in this research. Three scenarios were set in simulation for comparison (Table 5). Scenario 1, known as the Benchmark Scenario, shows the energy consumption of the building without a photovoltaic system. The scenario reflects the office building’s original energy consumption without any photovoltaic measures. Scenario 2, known as the Original Design Scenario, shows the building energy consumption with the original (21.1% of the south-facing slope/−24.4° of the north-facing slope) photovoltaic system. Under this scenario, photovoltaic panels only serve as power generation equipment, with their influence on building thermal engineering performance taken into account. Scenario 3, known as the Optimization Scenario, shows the building energy consumption with the optimized (a tilt angle of 27° and an azimuthof 18° east of south) photovoltaic system.
Table 4.
Building-integrated photovoltaic models for three scenarios.
Table 5.
Key parameter settings for the PV system.
4.2. Simulation Results and Comparative Analysis
To quantitatively assess the impact of photovoltaic integration and layout optimization on a building’s total energy consumption, this study established three comparative scenarios. These scenarios are identical in terms of building envelope, HVAC, and lighting systems, differing only in the presence or absence of a photovoltaic system and the layout of the array, thereby isolating the net benefits derived from photovoltaic optimization. Using Scenario 1 as a common baseline for comparison, Scenario 2 achieved an energy savings rate of 179.76%, while Scenario 3 achieved 288.11%, a difference of approximately 108.35 percentage points. This gap stems directly from the surge in power generation resulting from the transition from the original design to the optimized layout of the PV modules—the annual power generation after optimization increased by approximately 56% compared to the original design, reducing net energy consumption from −4.23 × 10⁴ kWh to −9.86 × 10⁴ kWh (as shown in Figure 13), thereby amplifying the overall energy-saving benefits. The step-by-step comparison of the three scenarios clearly reveals the stepwise improvement in building energy performance under the “no PV—PV installation—PV optimization” technical pathway, confirming the core efficiency-enhancing role of PV array layout optimization in BIPV systems. The simulation results of annual building energy consumption are shown in the following figures.
Figure 13.
Cooling, heating, and lighting energy-consumption results.
The following conclusions can be drawn from the analysis of simulation results. Firstly, it can be seen from the comparison of Total Annual Building Energy Consumption among Scenario 1, Scenario 2, and Scenario 3 that the building’s energy consumption decreased slightly after installing the photovoltaic system, which mainly benefited from the additional thermal insulation layer formed by photovoltaic modules on the roof that effectively reduced the heat from solar radiation in summer and lowered the AC cooling load. This is the passive energy-saving benefit of the photovoltaic building. Secondly, under the Original Design Scenario, the system’s annual power output already far exceeded the building’s annual energy consumption, resulting in a net energy consumption of −4.23 × 10⁴ kW·h and an energy-saving rate of 179.76%, indicating that the building has achieved an energy surplus. Under the Optimization Scenario, with the substantial increase in power output, the system’s energy surplus is even more considerable, with a net energy consumption of −9.86 × 10⁴ kW·h and a high comprehensive energy-saving rate of 288.11%, indicating that the office building not only achieves 100% energy self-sufficiency but also can feed approximately twice its annual electricity consumption in clean power back into the grid.
4.3. Calculation of Comprehensive Energy-Saving Efficiency
The comprehensive energy-saving efficiency defined in this research is used for quantifying the overall improvement of BIPV in energy performance compared to traditional buildings, and its calculation formulas are shown as below (Formulas (11)–(13)):
where e refers to the energy-saving efficiency of the original design plan and f refers to the energy-saving efficiency of the optimized plan.
Overall energy-saving efficiency = (energy consumption in Benchmark Scenario-net energy consumption in this scenario)/energy consumption in Benchmark Scenario × 100%
e = (5.30 × 10⁴ − (−4.23 × 10⁴))/5.30 × 104 × 100% ≈ 179.76%
F = (5.30 × 10⁴ − (−9.86 × 10⁴))/5.30 × 104 × 100% ≈ 288.11%
Through the collaborative simulation and analysis of power generation and energy consumption, it was found in this research that BIPV systems combine dual benefits in active power generation and passive energy-saving. As for the optimized design plan for the office building in rural areas in the Jianghan Plain (a tilt angle of 27° with an azimuth of 18°east of south), the building’s comprehensive energy-saving efficiency can be improved to 288.11%, far higher than 179.76% in the original design. The plan enables the building to transform from an energy consumer to a clean energy producer and provides a reliable technical route for rural buildings to achieve the goal of zero energy consumption or even energy-positive, aligning with the Dual Carbon strategic objective.
4.4. Payback Period Analysis
To further evaluate the economic feasibility of the optimization plan, this study conducted simplified static payback period estimates for the two PV scenarios. The DC-side installed capacity of the office building’s PV system is approximately 75.6 kW. Referring to the 2024 bidding prices for distributed PV projects in Hubei Province (3.131–3.7 yuan/W), the unit cost is set at 3.5 yuan/W, resulting in an initial investment of approximately 265,000 yuan. The system operates under a “self-generation for self-consumption with surplus power fed into the grid” model. The feed-in tariff is calculated based on Hubei Province’s desulfurized benchmark electricity price of 0.4161 yuan/kWh, while the self-consumption electricity price is estimated at 0.80 yuan/kWh, the midpoint of the local general industrial and commercial electricity price range of approximately 0.75–0.85 yuan/kWh. The office building’s daytime electricity consumption closely aligns with the PV system’s output period; the self-consumption ratio is estimated at 70%. Scenario 2 (Original Design): The adjusted annual power generation is 89,000 kWh. Annual revenue is the sum of the self-consumption portion (89,000 × 0.7 × 0.80) and the grid-fed portion (89,000 × 0.3 × 0.4161), totaling approximately 49,800 + 11,100 = 60,900 yuan. The static payback period is approximately 4.4 years. Scenario 3 (Optimized Plan): The adjusted annual electricity generation is 13.7 × 10⁴ kWh. The annual revenue is the sum of the self-consumed portion (13.7 × 104 × 0.7 × 0.80) and the grid-fed portion (13.7 × 104 × 0.3 × 0.4161), totaling approximately 7.67 + 1.71 = 9.38 ten thousand yuan, with a static payback period of approximately 2.8 years. Compared to the original design, the payback period is shortened by approximately 1.6 years. Over the 25-year design life of the PV system, the remaining 22.2 years will be a period of net profit, demonstrating a clear economic advantage. It should be noted that the above is a simplified static estimate that does not account for annual power degradation of the modules, costs associated with replacing the inverter in the middle to late stages, O&M costs, or potential one-time electrical retrofitting expenses. Therefore, the actual dynamic payback period will be slightly longer than the estimated value above.
5. Discussion
The aforementioned study has quantified the dual benefits of power generation efficiency improvements and building energy conservation resulting from optimized photovoltaic layout through case simulations and energy consumption analysis. To further elucidate the mechanisms underlying the optimization results and enhance the study’s contribution, this research summarizes the significance of energy-saving retrofits, the simulation framework, and data correction, while objectively analyzing the study’s limitations and future directions for improvement to strengthen the academic rigor of the research conclusions.
5.1. Building Energy-Saving Renovation
In this study, the Building-Integrated Photovoltaic (BIPV) system was optimized to improve energy efficiency in two key areas—photovoltaic power generation and building energy consumption—by modifying the array configuration of the photovoltaic modules (27° tilt, an azimuth of 18° east of south). In the original design, the photovoltaic modules on the north-facing slope were parallel to the roof, causing their orientation to deviate from the path of direct sunlight; the optimized array configuration, however, increased the total radiation received by the modules on the north-facing slope. Furthermore, the Jianghan Plain, where the case study is located, is a region with hot summers and cold winters. The solar altitude angle is high in summer and low in winter, and the PV tilt angle effectively balances the differences in incident angles between the two seasons. Simulation results show that, compared to the annual average power generation of 8.9 × 10⁴ kWh for the existing building’s PV system, the optimized PV system achieves an annual average power generation of 13.7 × 10⁴ kWh, representing a 56% improvement in energy efficiency. At the same time, regarding building energy retrofits, this study simulated three scenarios. The simulations showed that the net energy consumption in Scenario 1 reached 5.30 × 10⁴ kWh, while in Scenario 2, it decreased to −4.23 × 10⁴ kWh, representing an energy savings rate of 179.76% compared to Scenario 1. In Scenario 3, the net energy consumption was −9.86 × 10⁴ kWh, representing an energy savings rate of 288.11% compared to Scenario 1 (Figure 14).
Figure 14.
Comparison of building energy consumption and photovoltaic power output under different scenarios (Unit: kWh). Notes: if the net energy consumption is negative, it means that the photovoltaic system’s power output far exceeds the building’s own energy consumption and achieves energy output. The calculation formula for the energy-saving rate is: (energy consumption in the Benchmark Scenario-net energy consumption in this Scenario) / energy consumption in the Benchmark Scenario × 100%. When the net energy consumption is negative, the energy-saving rate may exceed 100%, indicating that the building has become an energy producer.
5.2. Photovoltaic Power Generation Performance Simulation Framework Driven by Genetic Algorithm
Current research on PV array optimization largely relies on simple engineering algorithms. When faced with the complex and variable climatic conditions of specific regions, the actual geometry of rooftops, and various design constraints, these algorithms often struggle to identify a globally optimal solution. Traditional analytical methods are not only inefficient but also struggle to handle the highly nonlinear relationships between variables such as tilt angle and orientation and power generation, resulting in an inability to fully realize the power generation potential of PV systems. To address these limitations, the genetic algorithm was proposed in this research to acquire regional climate conditions online. Combined with factors, such as existing tilt and azimuth angles of photovoltaics, the optimized photovoltaic array was generated after iterations and elimination.
5.3. Simulation Calibration and Correction Coefficient Setting Based on Practical Cases
In the field of evaluating the power generation performance of photovoltaic systems, most studies rely solely on software for theoretical simulations and use idealized output values directly as the basis for evaluation, rarely incorporating actual operational data for systematic validation. This approach overlooks the systemic losses that are inevitable in real-world engineering applications, resulting in significant discrepancies between theoretical predictions and actual power generation, thereby diminishing the practical value of simulation results for real-world engineering projects. Given this shortcoming, in this research, the optimization simulation was conducted based on the photovoltaic roofs of existing buildings. After photovoltaic simulation, the data was compared to the practical case’s data in June to August for correction, thereby acquiring the correction coefficient. In this research, the theoretical power output of the optimization plan was converted into a prediction value more closely aligned with the practical operating conditions in rural areas in the Jianghan Plain, enhancing the engineering guiding significance of the research conclusions.
5.4. Limitations
There are several limitations in this research: (1) The research attaches more importance to the energy-saving renovation of photovoltaic power generation of the office building in Jiangling, Jingzhou, Hubei. Due to the specific building type, local climate characteristics, and use mode, the universality of its photovoltaic renovation plan remains to be verified. (2) When applying the genetic algorithm for optimization, this study only considered the tilt and azimuth angles of the photovoltaic array, while the impacts of other equipment parameters and economic factors on system performance were not included in the optimization model, which could be further investigated in future work. Further studies can be extended to other building types, such as residential buildings. (3) The adoption of solar tracking technology for improving the photoelectric conversion efficiency of photovoltaic modules was not taken into account in this research. (4) The assessment of photovoltaic power generation efficiency merely relies on software simulation at present without the introduction of Artificial Intelligence (AI) technology that may improve the assessment efficiency.
To address these shortcomings, future research could focus on the following areas: (1) The methodology could be applied to a wider range of building types and geographic regions to develop optimized design guidelines for rooftop PV systems tailored to specific climatic zones and building types. (2) Future studies could expand the optimization variables of the genetic algorithm to include parameters such as module spacing, array density, and inverter capacity allocation, while also considering the impact of economic indicators—such as investment costs and payback periods—on PV energy-saving efficiency. (3) Future research could incorporate tracking technology as an independent optimization variable within the existing genetic algorithm framework, treating tracking axis type (fixed/single-axis/dual-axis), tracking angle range, and control strategies as new decision variables. Additionally, incremental investment costs and maintenance expenses could be incorporated into the fitness function to establish a multi-objective Pareto analysis that balances “power generation gains—incremental costs—maintenance feasibility.” (4) Future research could explore replacing some physical simulations with machine learning surrogate models (such as neural networks or random forests). This would improve optimization efficiency while maintaining accuracy, making global optimization for larger-scale and more complex scenarios feasible.
6. Conclusions
The rooftop space of rural buildings has access to a large quantity of solar energy, and green building design can improve energy utilization efficiency. The improvement in building energy efficiency can efficiently reduce the energy consumption caused by building operations and increase the photovoltaic power output. However, the existing integration methods of photovoltaics and building roofs have not fully activated the photovoltaic potential. The optimal integration method of building roof and photovoltaics was concluded through simulation, and the building energy-saving efficiency was improved by simulating factors like the tilt angle in this research. The innovative design can not only improve the rooftop energy efficiency, but can also promote the sustainable development of buildings, facilitating the reduction in electricity costs of rural buildings and carbon emissions of the architectural industry. The specific research achievements are described below:
- (1)
- This study employed a genetic algorithm to search for a Pareto-optimal solution for the spatial parameters of the array. Under the given constraints (including local climate conditions, structural limitations, and local solar radiation characteristics), the algorithm converged to a selected Pareto-optimal solution through iterative calculations: an optimal tilt angle of 27° and an azimuth of 18°east of south. Experimental data confirm that this configuration increases the average annual photovoltaic conversion efficiency of the array by 56%, outperforming the original photovoltaic array design. More importantly, the optimized solution effectively mitigates seasonal fluctuations in power generation, enhancing the stability of energy supply.
- (2)
- Regarding building energy retrofits, this study simulated three different scenarios (see Figure 14). The simulation results show that the net energy consumption in Scenario 1 was 52,972.35 kWh; in Scenario 2, net energy consumption decreased to −42,252.37 kWh, representing an energy savings rate of 179.76% compared to Scenario 1; Scenario 3 had a net energy consumption of −98,565.54 kWh, representing an energy savings rate of 133.28% compared to Scenario 2 and as high as 288.11% compared to Scenario 1.
- (3)
- This study validated the feasibility of rural office buildings with double-sloped roofs achieving energy self-sufficiency or even net energy production in specific climate zones. This conclusion directly addresses the practical issues of underutilized resources and the lack of coordinated optimization between power generation and building energy consumption in the promotion of distributed photovoltaic systems in rural areas. It also provides a replicable and scalable technical pathway and decision-making basis for the low-carbon retrofitting of public buildings in villages and towns located in regions with hot summers and cold winters, offering clear practical engineering reference value for advancing the transformation of the rural energy structure and the implementation of the “dual carbon” goals.
Author Contributions
Conceptualization, X.C., Z.Y. and F.C.; methodology, J.Z. and F.C.; software, J.Z. and Z.Y.; validation, J.Z.; formal analysis, Z.Y.; investigation, X.C. and Z.Y.; resources, X.C.; data curation, J.Z.; writing—original draft preparation, X.C. and J.Z.; writing—review and editing, F.C.; visualization, Z.Y.; supervision, X.C. and F.C.; project administration, X.C.; funding acquisition, X.C. All authors have read and agreed to the published version of the manuscript.
Funding
This research was funded by the National Engineering Research Center for Prefabrication and Assembly of Civil Engineering Structures Open Research Fund, grant number 2023CPCCE-K02; and the 2025 Yangtze University Graduate Teaching Reform Project.
Data Availability Statement
The data presented in this study are available on request from the corresponding author. The data are not publicly available due to privacy restrictions.
Acknowledgments
The authors would like to express their gratitude to the Liuheyuan Administrative Area for providing the practical project data and field investigation support. The authors also thank the reviewers for their constructive comments, which greatly improved the quality of this manuscript.
Conflicts of Interest
The authors declare no conflicts of interest.
Abbreviations
The following abbreviations are used in this manuscript:
| Abbreviation/Symbol | Full Name | Definition |
| BIPV | Building-Integrated Photovoltaics | Building-integrated photovoltaics: PV modules that serve as integral parts of the building envelope, performing both electricity generation and building enclosure functions. |
| BAPV | Building-Attached Photovoltaics | Building-attached photovoltaics: PV modules retrofitted onto the surfaces of existing buildings without replacing the original building components. |
| BESS | Battery Energy Storage System | Battery energy storage system used to store surplus PV electricity and discharge it during peak demand. |
| SOGA | Single-Objective Genetic Algorithm | Single-objective genetic algorithm: an evolutionary algorithm that optimizes only a single performance indicator. |
| MOGA | Multi-Objective Genetic Algorithm | Multi-objective genetic algorithm: an evolutionary algorithm that simultaneously optimizes multiple conflicting performance indicators and yields a set of Pareto-front solutions. |
| EPW | EnergyPlus Weather File | EnergyPlus weather file format, containing hourly meteorological parameters such as temperature, humidity, solar radiation, and wind speed. |
| PR | Performance Ratio | Performance ratio: the ratio of the actual energy output of a PV system to its theoretical energy output, reflecting the overall system efficiency. |
| Cfa | Humid Subtropical Climate | Humid subtropical climate with hot summers and cold winters, one of the Köppen–Geiger climate classifications. |
| λ | Correction Factor | Correction factor: a coefficient calibrated in this study based on measured data to account for the deviation between simulation and actual performance, taken as 0.912. |
| α | Solar Altitude Angle | Solar altitude angle: the angle between the sun’s rays and the horizontal plane. |
| θ | Solar Azimuth Angle | Solar azimuth angle: the angle between the projection of the sun’s rays on the horizontal plane and the due south direction. |
| β | Tilt Angle | Tilt angle: the angle between the surface of the PV module and the horizontal plane. |
| γ | Azimuth Angle of PV Array | Azimuth angle of the PV array: the angle by which the projection of the module surface normal on the horizontal plane deviates from due south. |
References
- Ran, L.; Ran, S.; Meng, C. Green city logistics path planning and design based on genetic algorithm. PeerJ Comput. Sci. 2023, 9, e1347. [Google Scholar] [CrossRef] [Scilit]
- Xu, L.; Yu, D.; Zhou, J.; Jin, C. A Review of Key Technologies for Green and Low-Carbon Future Buildings in China. Processes 2025, 13, 574. [Google Scholar] [CrossRef] [Scilit]
- Zhang, D.; Sun, L.; Zhang, Y.; Liu, T.; Gao, L.; Wang, F.; Qiao, X.; Liu, Y.; Zuo, J.; Wang, Y. The Effect of Low-Carbon Technology on Carbon Emissions Reduction in the Building Sector: A Case Study of Xi’an, China. Buildings 2025, 15, 1989. [Google Scholar] [CrossRef] [Scilit]
- Yin, Q.; Li, A.; Han, C. The Role of Solar Photovoltaic Roofs in Energy-Saving Buildings: Research Progress and Future Development Trends. Buildings 2024, 14, 3091. [Google Scholar] [CrossRef] [Scilit]
- Lei, H.; Yang, W.; Zhang, K.; Li, C.-Q. Anatomy of methods for measuring life cycle carbon emission of built environment. J. Build. Eng. 2025, 105, 112506. [Google Scholar] [CrossRef] [Scilit]
- Stamenic, L.S.; Erban, C. Building Integrated Photovoltaics Technology Status. Therm. Sci. 2021, 25, 1523–1543. [Google Scholar] [CrossRef] [Scilit]
- Temby, O.; Kapsis, K.; Berton, H.; Rosenbloom, D.; Gibson, G.; Athienitis, A.; Meadowcroft, J. Building-Integrated Photovoltaics: Distributed Energy Development for Urban Sustainability. Environment 2014, 56, 4–17. [Google Scholar] [CrossRef] [Scilit]
- Yang, R.; Zang, Y.; Yang, J.; Wakefield, R.; Nguyen, K.; Shi, L.; Trigunarsyah, B.; Parolini, F.; Bonomo, P.; Frontini, F.; et al. Fire safety requirements for building integrated photovoltaics (BIPV): A cross-country comparison. Renew. Sustain. Energy Rev. 2023, 173, 113112. [Google Scholar] [CrossRef] [Scilit]
- Shahverdian, M.H.; Najaftomaraei, M.; Chimeh, A.F.; Yavarzadeh, N.; Sohani, A.; Javadijam, R.; Sayyaadi, H. Towards Zero-Energy Buildings: A Comparative Techno-Economic and Environmental Analysis of Rooftop PV and BIPV Systems. Buildings 2025, 15, 999. [Google Scholar] [CrossRef] [Scilit]
- Ju, T.; Li, Z.; Xu, Z.; Xu, Z.; Sun, B. Performance evaluation of photovoltaic-thermal module with luminescent down-shifting layer. Case Stud. Therm. Eng. 2025, 74. [Google Scholar] [CrossRef] [Scilit]
- Sun, H.; Zhu, B.; Yin, J.; Zhong, M.; Wang, K. Photovoltaic technology in rural residential buildings in China: A comprehensive review on applications, development and its benefits. J. Asian Archit. Build. Eng. 2025, 24, 851–865. [Google Scholar] [CrossRef] [Scilit]
- Qiu, J.; Su, X.; Mei, Y.; Luo, Y. The alleviating effect of household distributed photovoltaics on multidimensional relative poverty in rural areas. J. Build. Eng. 2024, 96, 110489. [Google Scholar] [CrossRef] [Scilit]
- Zhi, Y.; Yang, X. Scenario-based multi-objective optimization strategy for rural PV-battery systems. Appl. Energy 2023, 345, 121314. [Google Scholar] [CrossRef] [Scilit]
- Filho, G.L.; Corrêa, H.P.; Vieira, F.H.T. Analytical distributed PV inverter reactive power support strategy for reduction of grid losses and voltage deviations. Energy Syst. 2024. [Google Scholar] [CrossRef] [Scilit]
- Mei, Y.; Jin, Y.; Ju, P.; Li, J. Acceptance Capability of Distributed Photovoltaic Generation in Distribution Networks Considering Different Loads. In Proceedings of the 2023 3rd Power System and Green Energy Conference (PSGEC), Shanghai, China, 24–26 August 2023; pp. 121–126. [Google Scholar]
- Zhao, J.; Xie, B.; Wang, D.; Yan, L.; Liu, W. Feature extraction and source–load collaborative analysis method for distribution network. Energy Rep. 2023, 9, 547–555. [Google Scholar] [CrossRef] [Scilit]
- Liu, Y.; Liu, D.; Kang, K.; Wang, G.; Rong, Y.; Wang, W.; Liu, S. Research on Two-Stage Energy Storage Optimization Configurations of Rural Distributed Photovoltaic Clusters Considering the Local Consumption of New Energy. Energies 2024, 17, 6272. [Google Scholar] [CrossRef] [Scilit]
- Chel, A.; Tiwari, G.N.; Chandra, A. Simplified method of sizing and life cycle cost assessment of building integrated photovoltaic system. Energy Build. 2009, 41, 1172–1180. [Google Scholar] [CrossRef] [Scilit]
- Luo, T.; Xuan, A.; Wang, Y.; Li, G.; Fang, J.; Liu, Z. Energy efficiency evaluation and optimization of active distribution networks with building integrated photovoltaic systems. Renew. Energy 2023, 219, 119447. [Google Scholar] [CrossRef] [Scilit]
- Miao, R.; Zhu, H.; Zhang, Y.; Li, K.; Yuan, Y.; Shen, P.; Qi, H. Rooftop PV layout generation and optimization model for large-scale building cluster. Sustain. Cities Soc. 2026, 137, 107129. [Google Scholar] [CrossRef] [Scilit]
- Barbon, A.; Ghodbane, M.; Bayon, L.; Said, Z. A general algorithm for the optimization of photovoltaic modules layout on irregular rooftop shapes. J. Clean. Prod. 2022, 365. [Google Scholar] [CrossRef] [Scilit]
- Awwad, Z.; Alharbi, A.; Habib, A.H.; de Weck, O.L. Site Assessment and Layout Optimization for Rooftop Solar Energy Generation in Worldview-3 Imagery. Remote Sens. 2023, 15, 1356. [Google Scholar] [CrossRef] [Scilit]
- Lopez, C.S.P.; Troia, F.; Nocera, F. Photovoltaic BIPV Systems and Architectural Heritage: New Balance between Conservation and Transformation. An Assessment Method for Heritage Values Compatibility and Energy Benefits of Interventions. Sustainability 2021, 13, 5107. [Google Scholar] [CrossRef] [Scilit]
- Yaqub, M.; Sarkani, S.; Mazzuchi, T.A. Feasibility analysis of solar photovoltaic commercial power generation in California. Eng. Manag. J. 2012, 24, 36–49. [Google Scholar] [CrossRef] [Scilit]
- Akata, A.M.E.A.; Njomo, D.; Agrawal, B. Assessment of Building Integrated Photovoltaic (BIPV) for sustainable energy performance in tropical regions of Cameroon. Renew. Sustain. Energy Rev. 2017, 80, 1138–1152. [Google Scholar] [CrossRef] [Scilit]
- Asaee, S.R.; Nikoofard, S.; Ugursal, V.I.; Beausoleil-Morrison, I. Techno-economic assessment of photovoltaic (PV) and building integrated photovoltaic/thermal (BIPV/T) system retrofits in the Canadian housing stock. Energy Build. 2017, 152, 667–679. [Google Scholar] [CrossRef] [Scilit]
- Mori, K.; Tabata, T. Comprehensive Evaluation of Photovoltaic Solar Plants vs. Natural Ecosystems in Green Conflict Situations. Energies 2020, 13, 6224. [Google Scholar] [CrossRef] [Scilit]
- Chu, B.; Lin, L.; Ye, Y.; Ruan, D.; Zhu, Y.; Han, Y.; Ye, N. Research on comprehensive benefit evaluation of photovoltaic power generation based on matter element extension model. In Proceedings of the International Conference on Optoelectronic Materials and Devices (ICOMD 2021), Guangzhou, China, 10–12 December 2021; p. 7. [Google Scholar]
- Rahdan, P.; Zeyen, E.; Gallego-Castillo, C.; Victoria, M. Distributed photovoltaics provides key benefits for a highly renewable European energy system. Appl. Energy 2024, 360, 122721. [Google Scholar] [CrossRef] [Scilit]
- Xiao, H.; Lai, W.; Chen, A.; Lai, S.; He, W.; Deng, X.; Zhang, C.; Ren, H. Application of Photovoltaic and Solar Thermal Technologies in Buildings: A Mini-Review. Coatings 2024, 14, 257. [Google Scholar] [CrossRef] [Scilit]
- Schoen, T. Building-integrated PV installations in The Netherlands: Examples and operational experiences. Sol. Energy 2001, 70, 467–477. [Google Scholar] [CrossRef] [Scilit]
- Yang, T.; Athienitis, A.K. A review of research and developments of building-integrated photovoltaic/thermal (BIPV/T) systems. Renew. Sustain. Energy Rev. 2016, 66, 886–912. [Google Scholar] [CrossRef] [Scilit]
- Wu, H.; Yuan, Y.; Zhang, X.; Miao, A.; Zhu, J. Robust comprehensive PV hosting capacity assessment model for active distribution networks with spatiotemporal correlation. Appl. Energy 2022, 323, 119558. [Google Scholar] [CrossRef] [Scilit]
- Liu, Z.; Zhang, Y.; Yuan, X.; Liu, Y.; Xu, J.; Zhang, S.; He, B.-J. A comprehensive study of feasibility and applicability of building integrated photovoltaic (BIPV) systems in regions with high solar irradiance. J. Clean. Prod. 2021, 307, 127240. [Google Scholar] [CrossRef] [Scilit]
- Dong, H.; Yang, Y. Photovoltaic Power Generation Prediction Based on Machine Learning Model Fusion. In Proceedings of the 2024 9th International Conference on Intelligent Computing and Signal Processing (ICSP), Xi’an, China, 19–21 April 2024; pp. 1144–1149. [Google Scholar]
- Xian, G.; Duan, Z.; Shan, K.; Dong, X. Energy-Saving Potential of Building-Integrated Photovoltaic Technology Applied to a Library in Changsha, China. Sustainability 2024, 16, 9565. [Google Scholar] [CrossRef] [Scilit]
- Ahirwar, A.; Kori, A.K.; Kapoor, S. Pre-Installation Analysis via “PVsyst” & “HOMER Pro” to Design & Simulate a 50kWp Solar Grid-Tied PV System for Rural Area Electrification, India. In Proceedings of the 2021 5th International Conference on Electrical, Electronics, Communication, Computer Technologies and Optimization Techniques (ICEECCOT), Mysuru, India, 10–11 December 2021; pp. 388–394. [Google Scholar]
- Li, Z.; Wang, Y.; Wang, Y.; Wei, Y. Ecological Benefit Optimization and Design of Rural Residential Roofs Based on the “Dual Carbon” Goal. Buildings 2024, 14, 3715. [Google Scholar] [CrossRef] [Scilit]
- Kazem, H.A.; Al-Waeli, A.; Chaichan, M.T.; Sopian, K.; Ahmed, A.-A.; Roslam, W.I.W.N. Enhancement of photovoltaic module performance using passive cooling (Fins): A comprehensive review. Case Stud. Therm. Eng. 2023, 49, 103316. [Google Scholar] [CrossRef] [Scilit]
- Hamed, M.M.; Salem, M.R.; Aldabesh, A.D.; Abdel-Moneim, S.A.; Elmohlawy, A.E. A hybrid finned-PCM and nanoparticle strategy for high-efficiency passive cooling of photovoltaic modules: Experimental study. Case Stud. Therm. Eng. 2026, 82, 108145. [Google Scholar] [CrossRef] [Scilit]
- Sajjad, U.; Amer, M.; Ali, H.M.; Dahiya, A.; Abbas, N. Cost effective cooling of photovoltaic modules to improve efficiency. Case Stud. Therm. Eng. 2019, 14. [Google Scholar] [CrossRef] [Scilit]
- Yadav, A.K.; Chandel, S.S. Tilt angle optimization to maximize incident solar radiation: A review. Renew. Sustain. Energy Rev. 2013, 23, 503–513. [Google Scholar] [CrossRef] [Scilit]
- El Gendy, M.A. Interactive Eco-Cell Parametric Shading Structure Simulation (Hexagonal Shell of Light) by using Parametric Environmental Tool. IOP Conf. Ser. Earth Environ. Sci. 2019, 397, 12001. [Google Scholar] [CrossRef] [Scilit]
- Katoch, S.; Chauhan, S.S.; Kumar, V. A review on genetic algorithm: Past, present, and future. Multimed. Tools Appl. 2021, 80, 8091–8126. [Google Scholar] [CrossRef] [Scilit]
- IEC 61215-1:2021; Terrestrial Photovoltaic (PV) Modules–Design Qualification and Type Approval–Part 1: Test Requirements. International Electrotechnical Commission (IEC): Geneva, Switzerland, 2021.
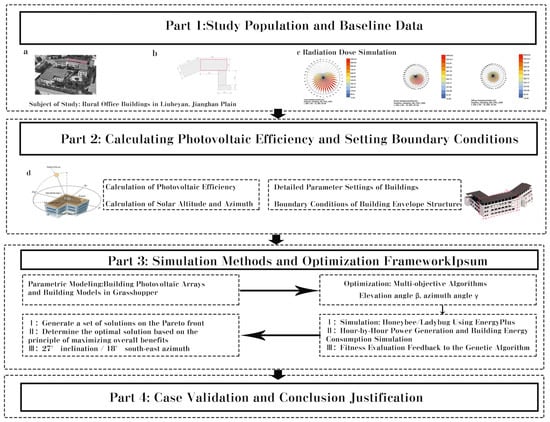
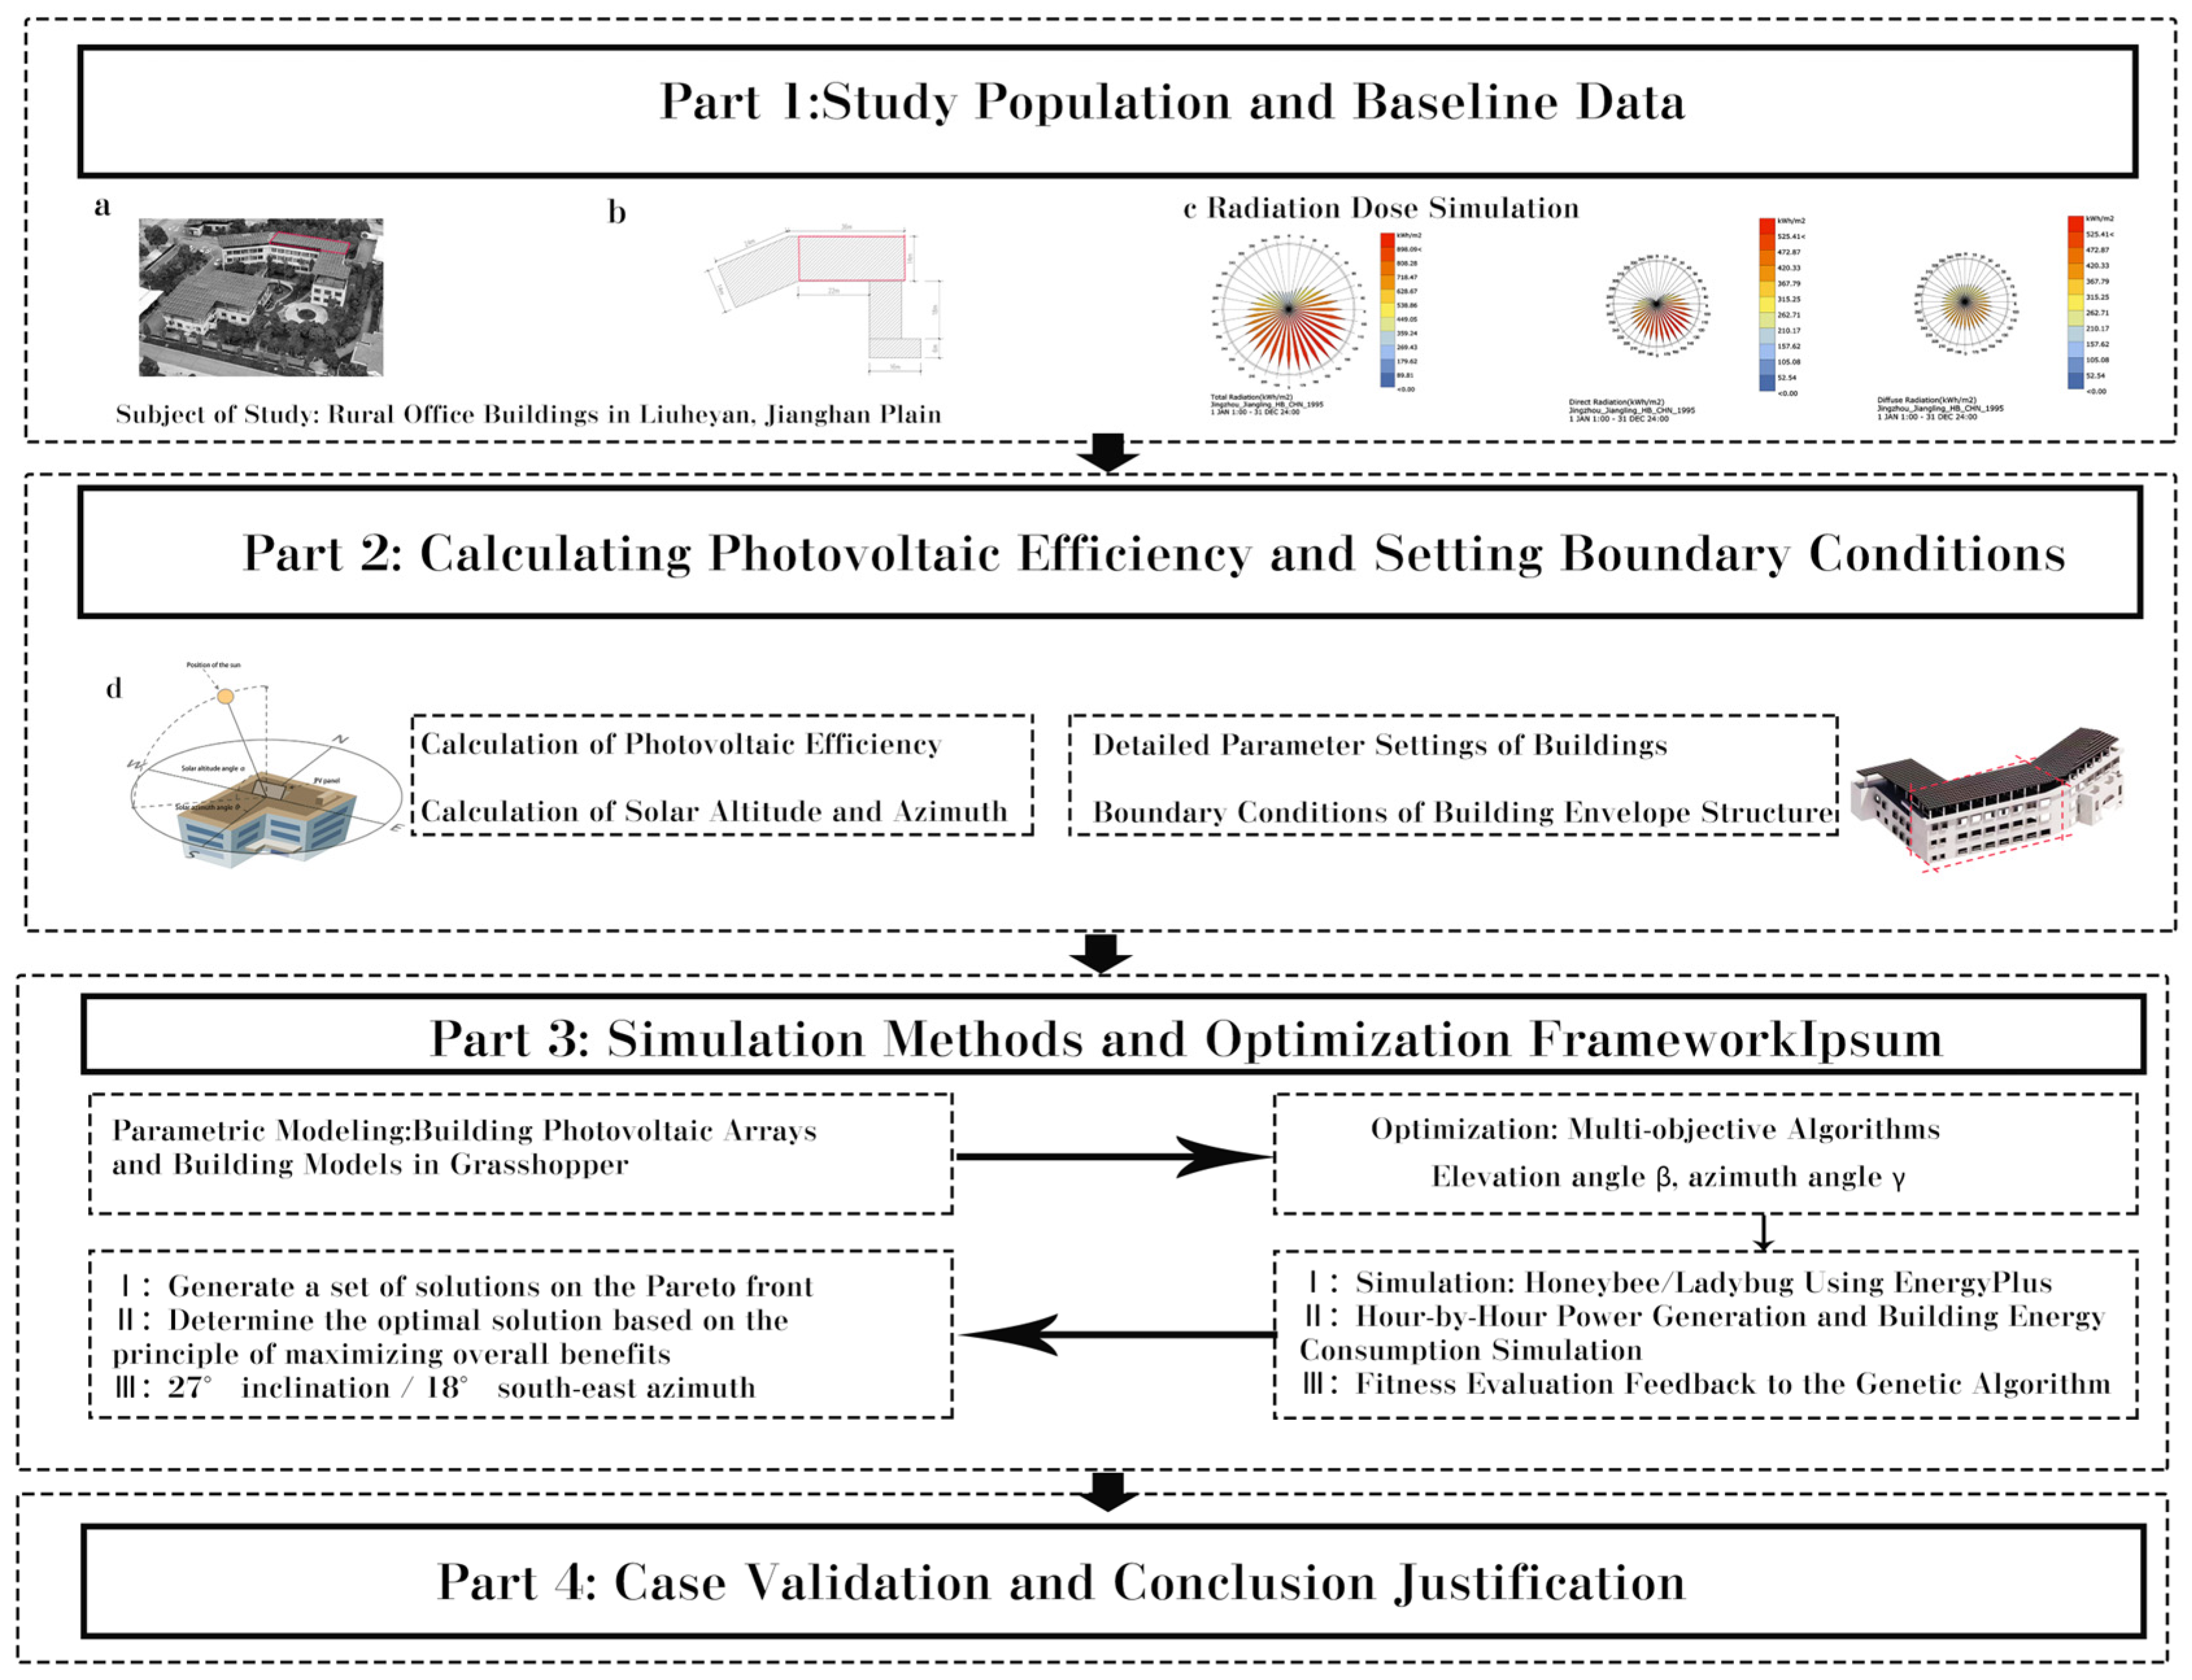
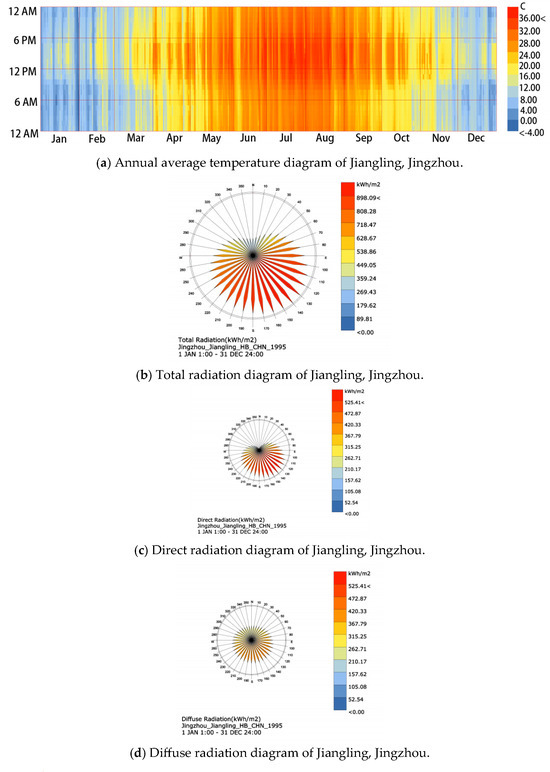
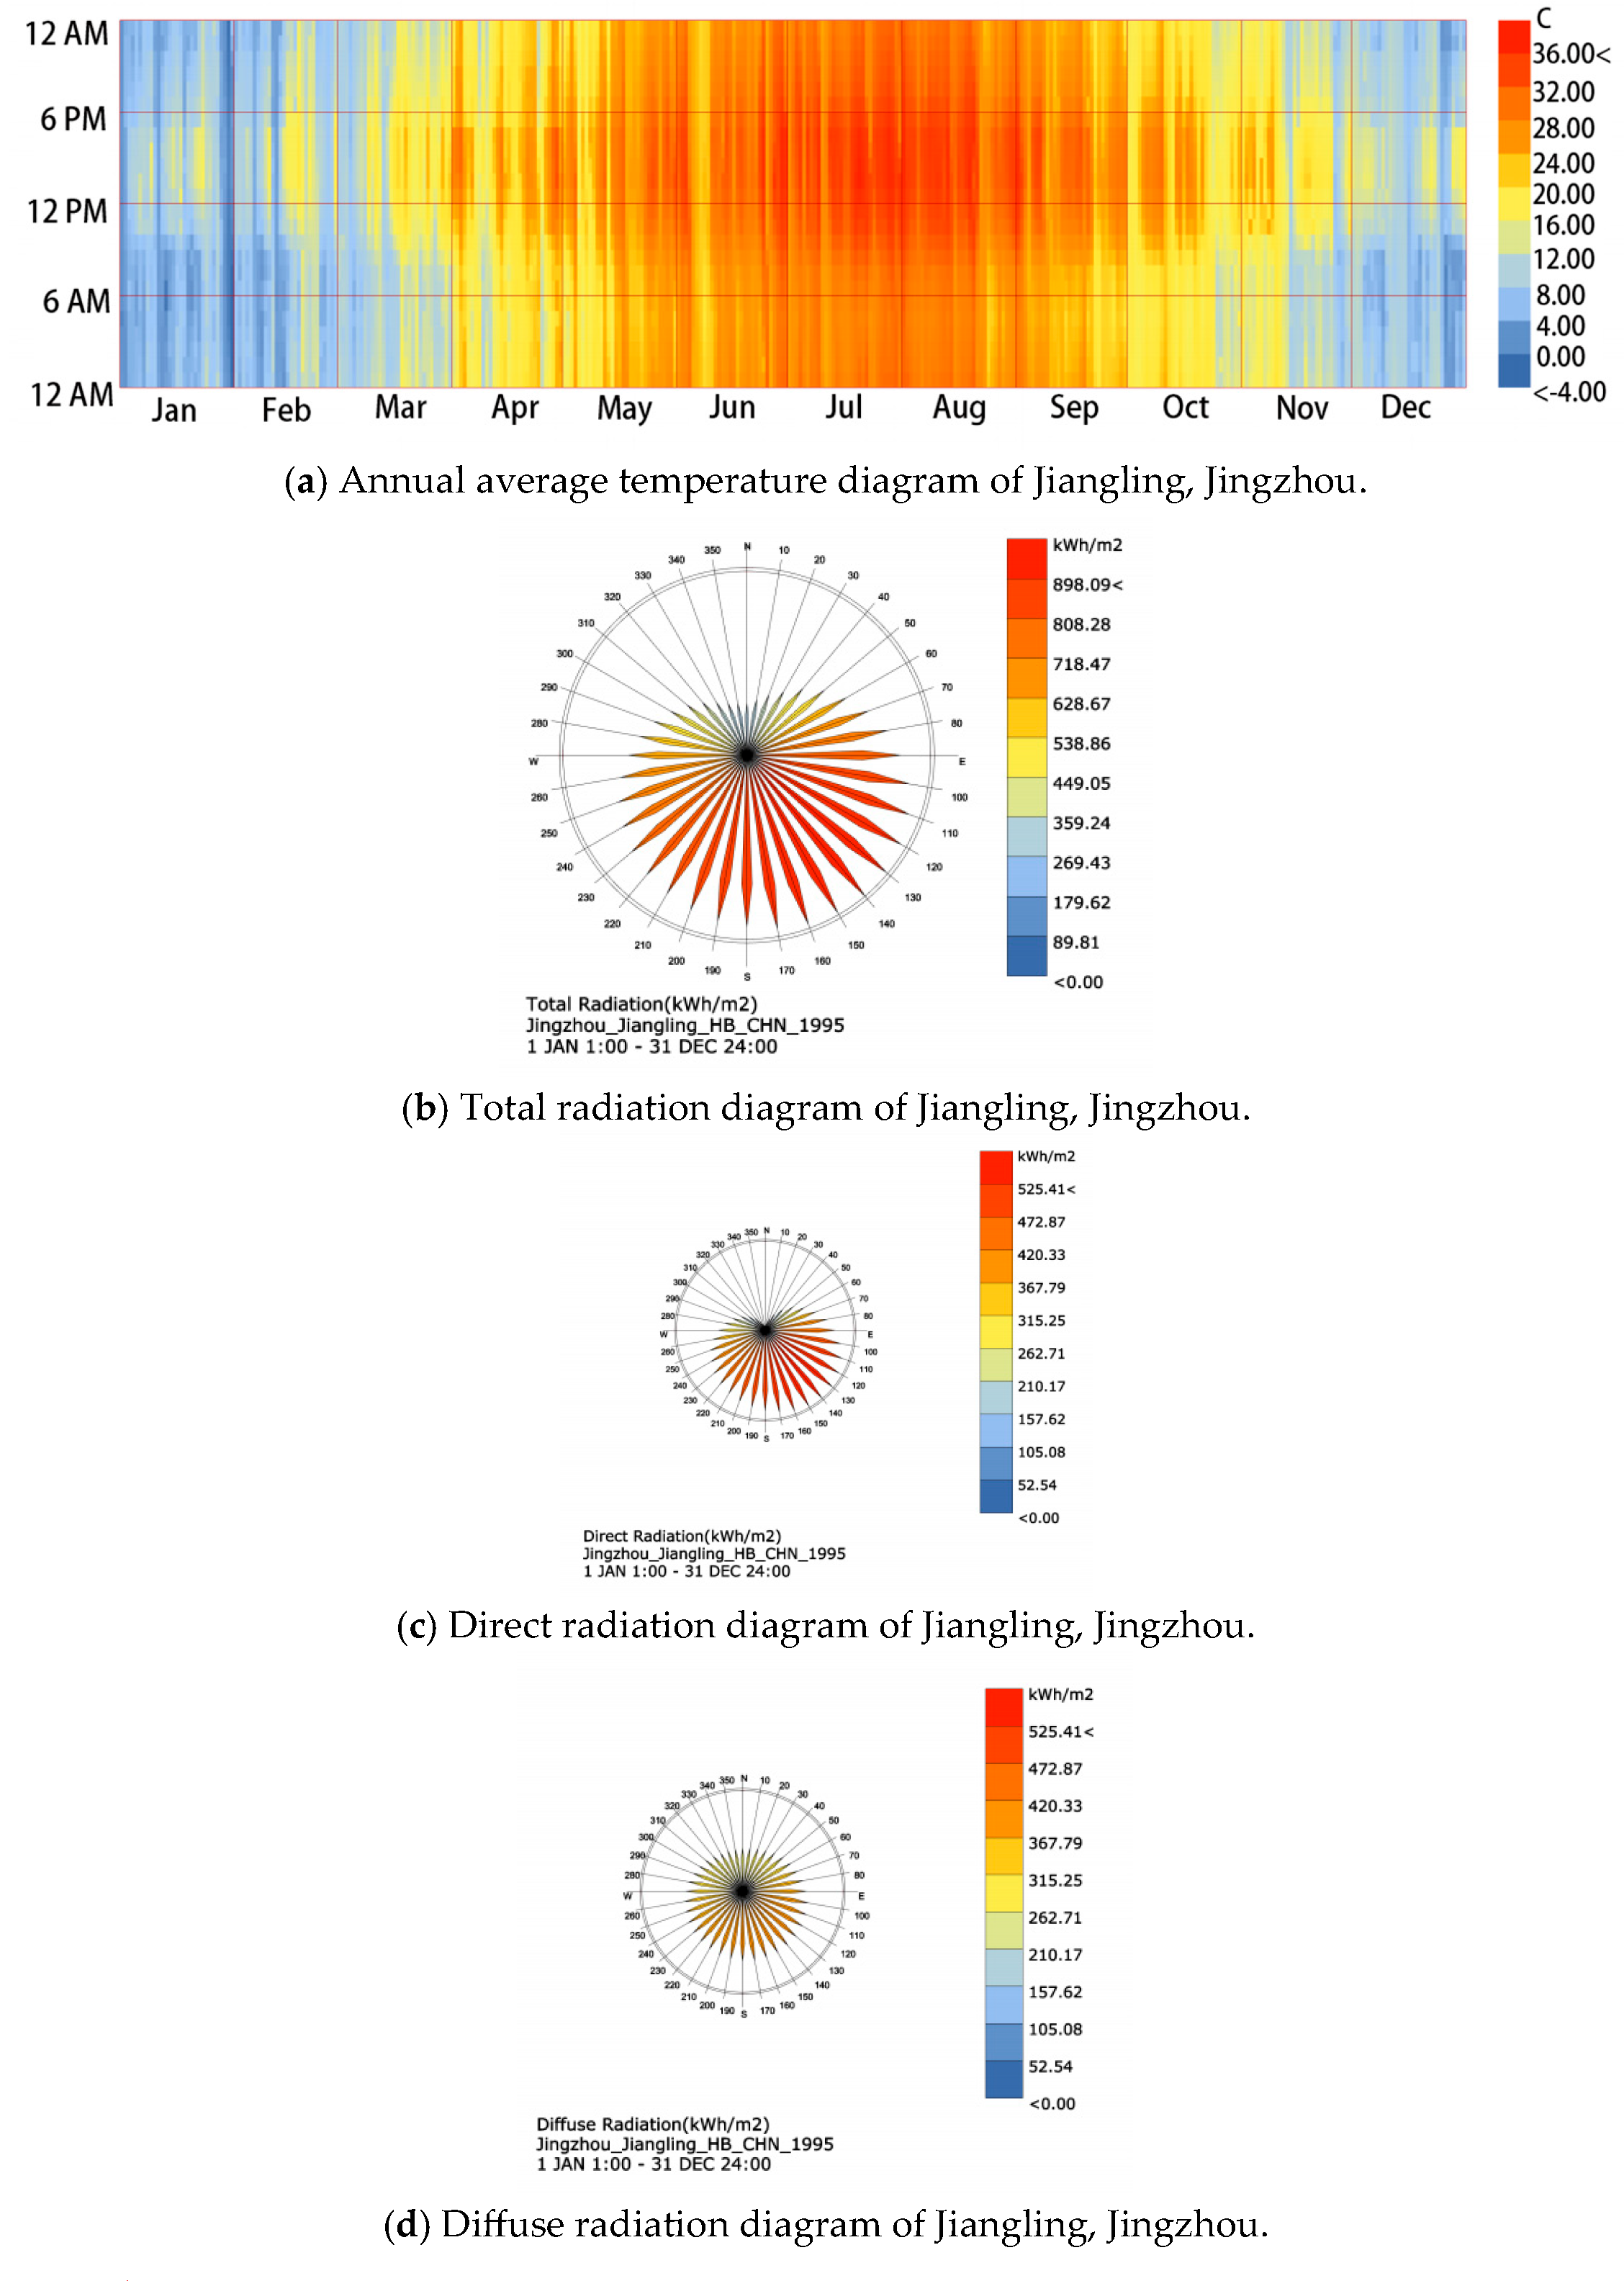
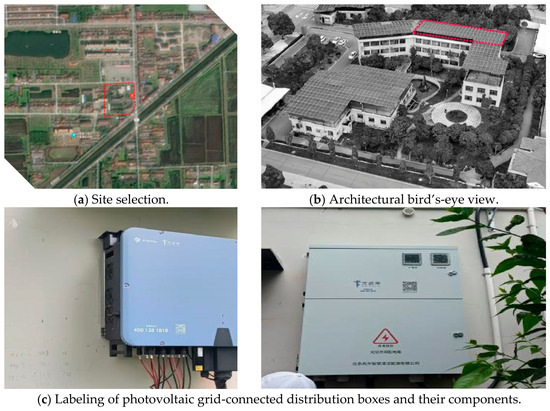
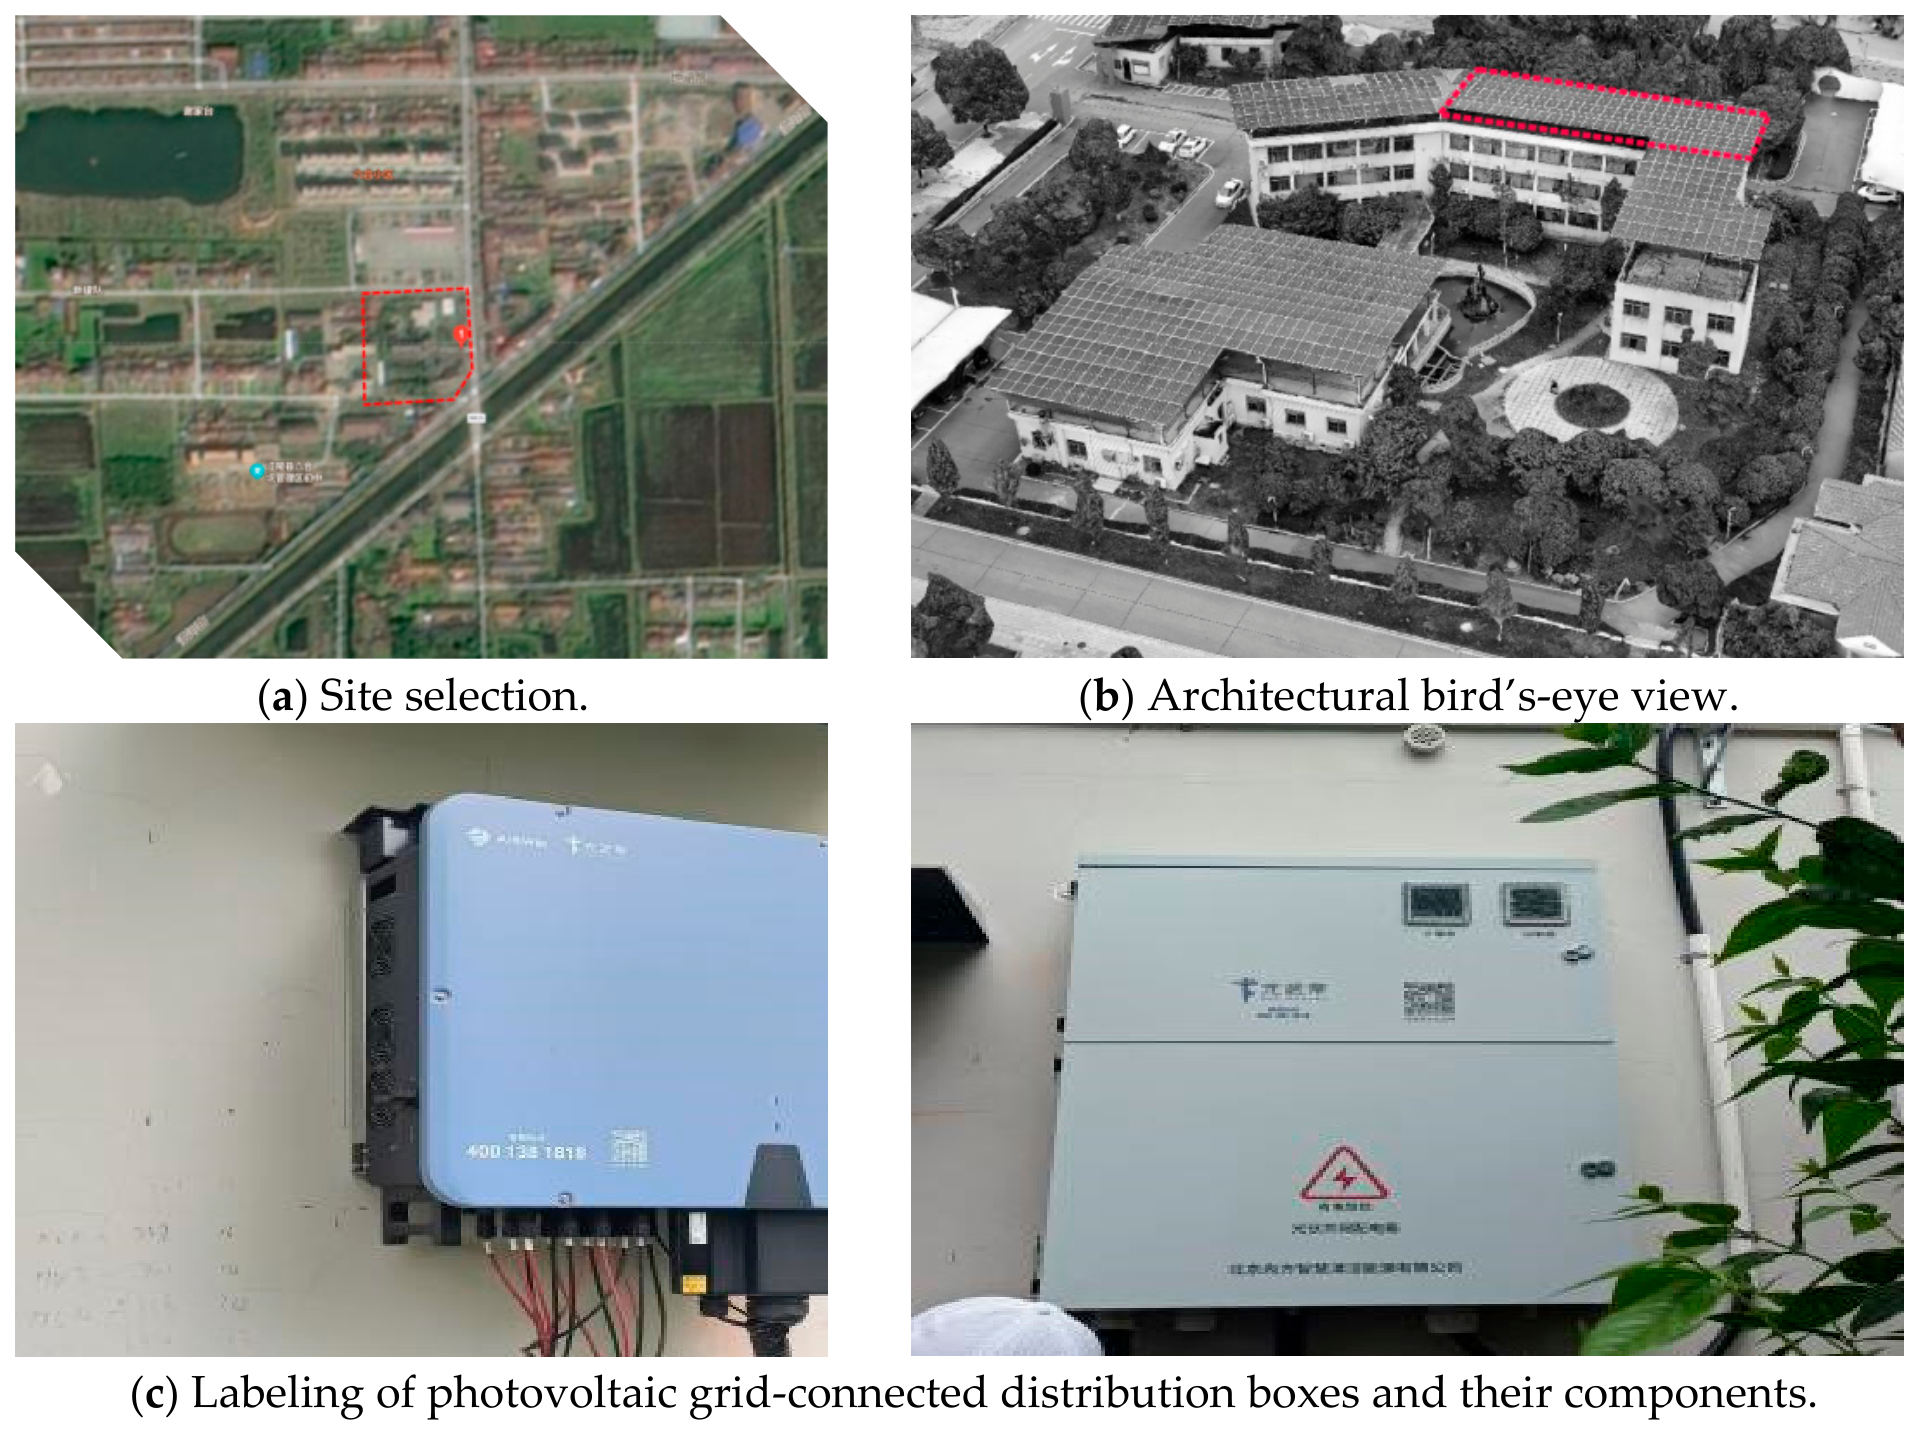
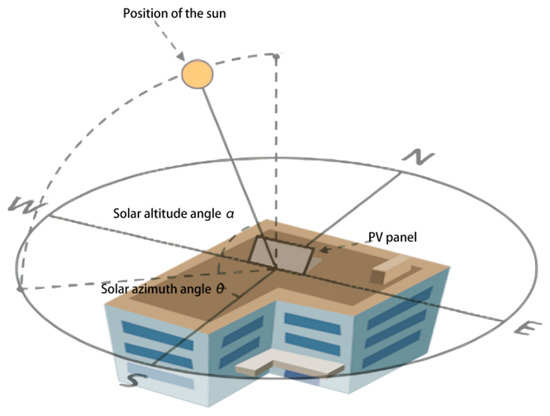
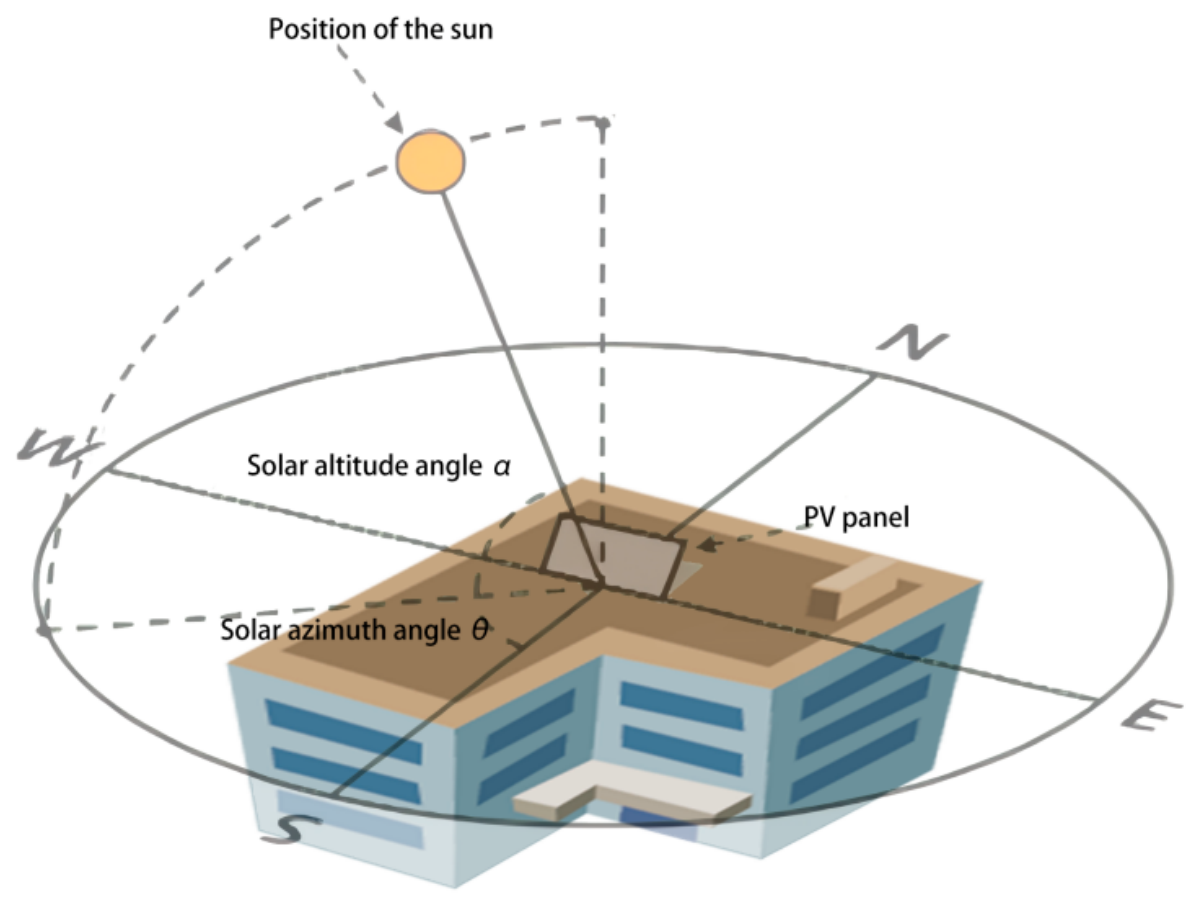
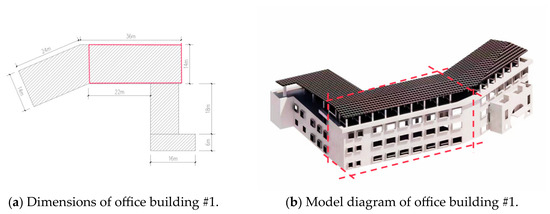
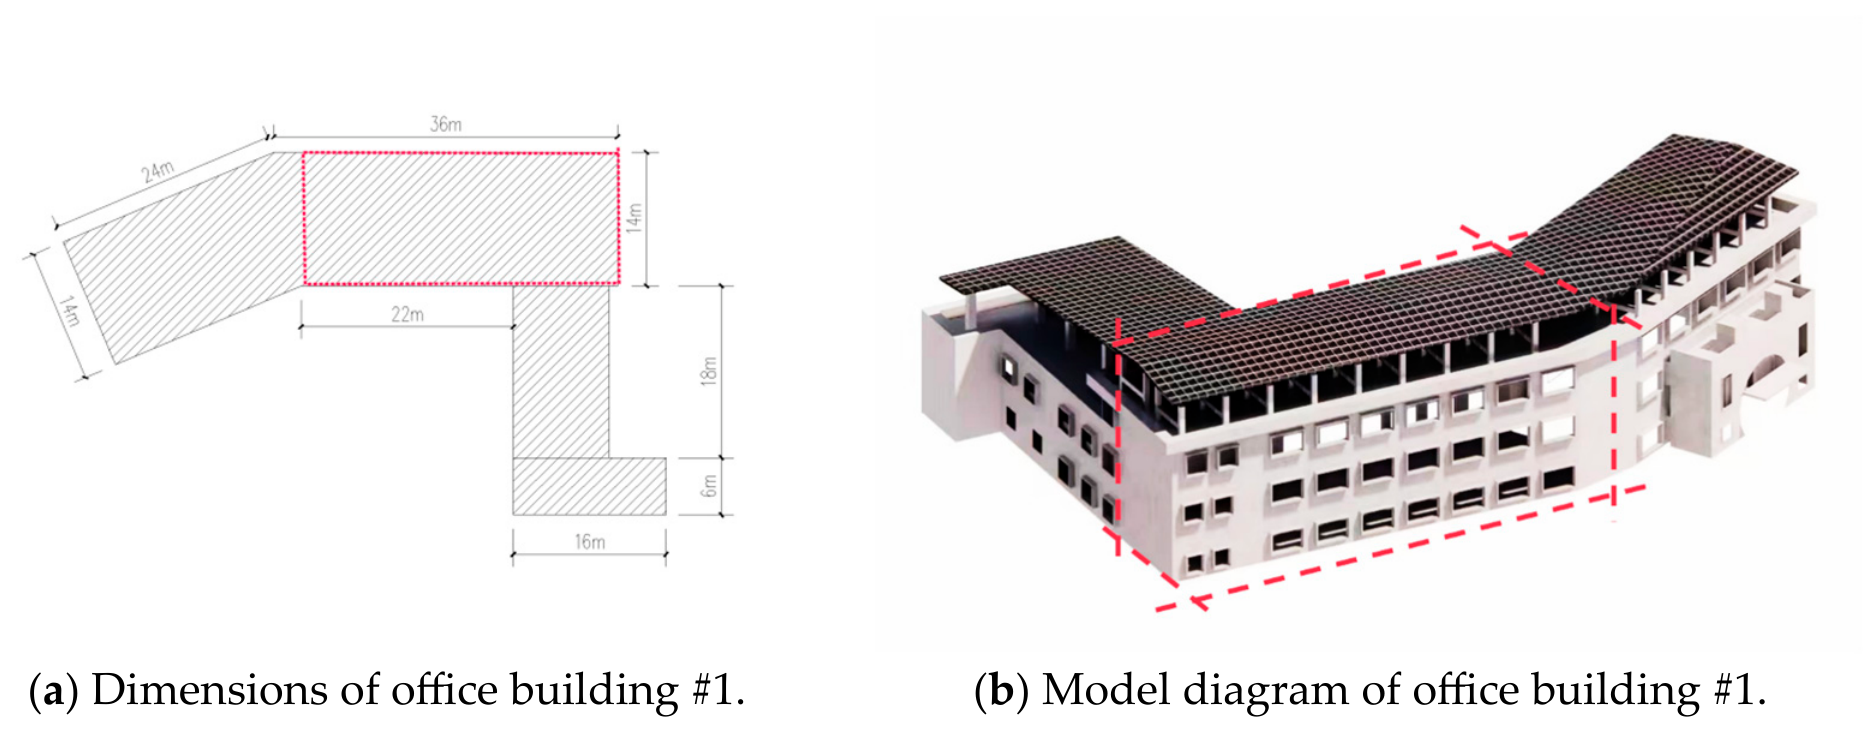
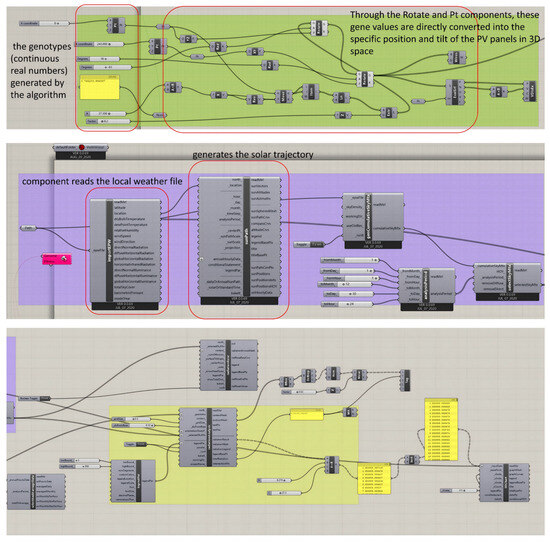
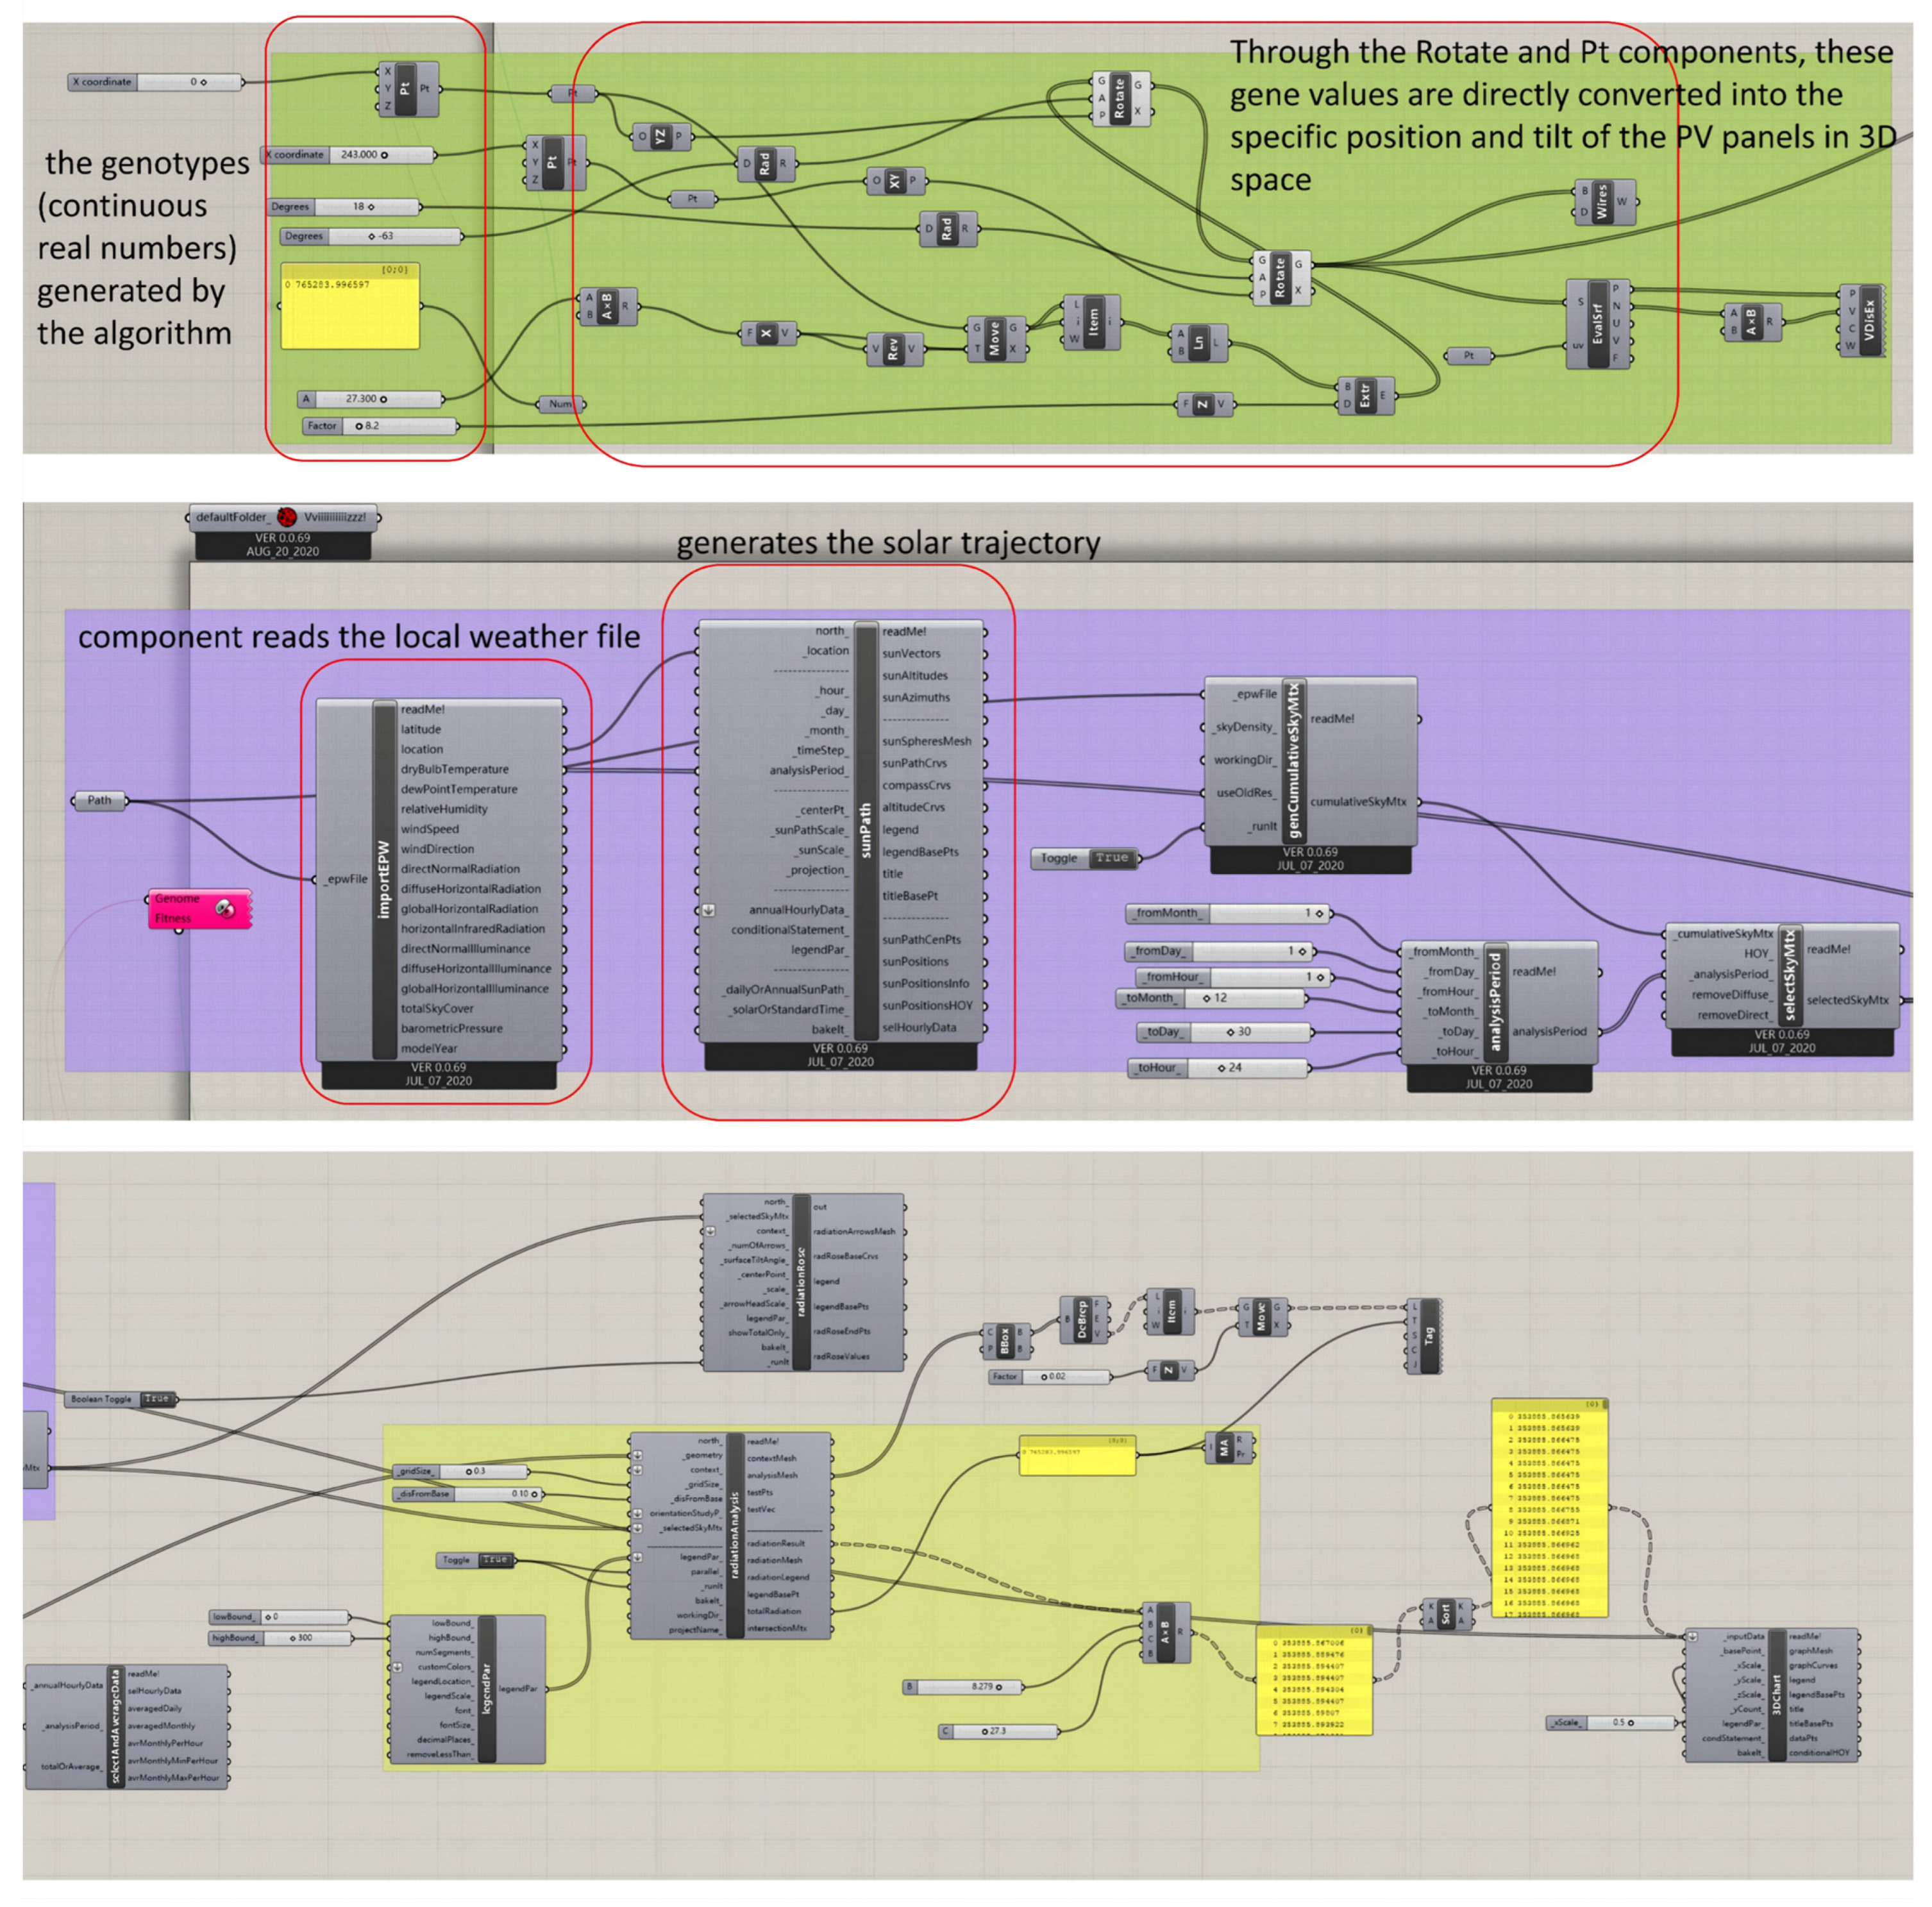
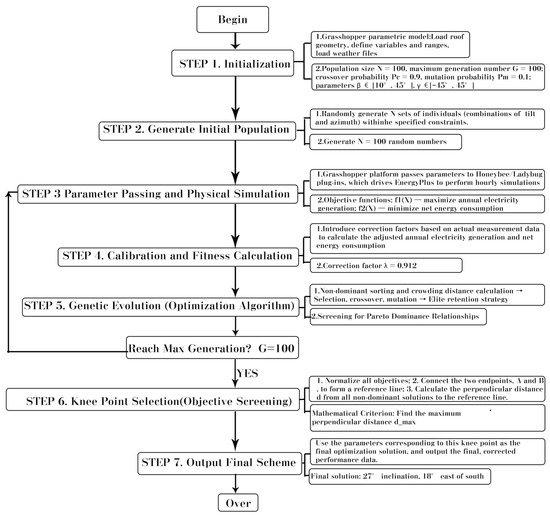
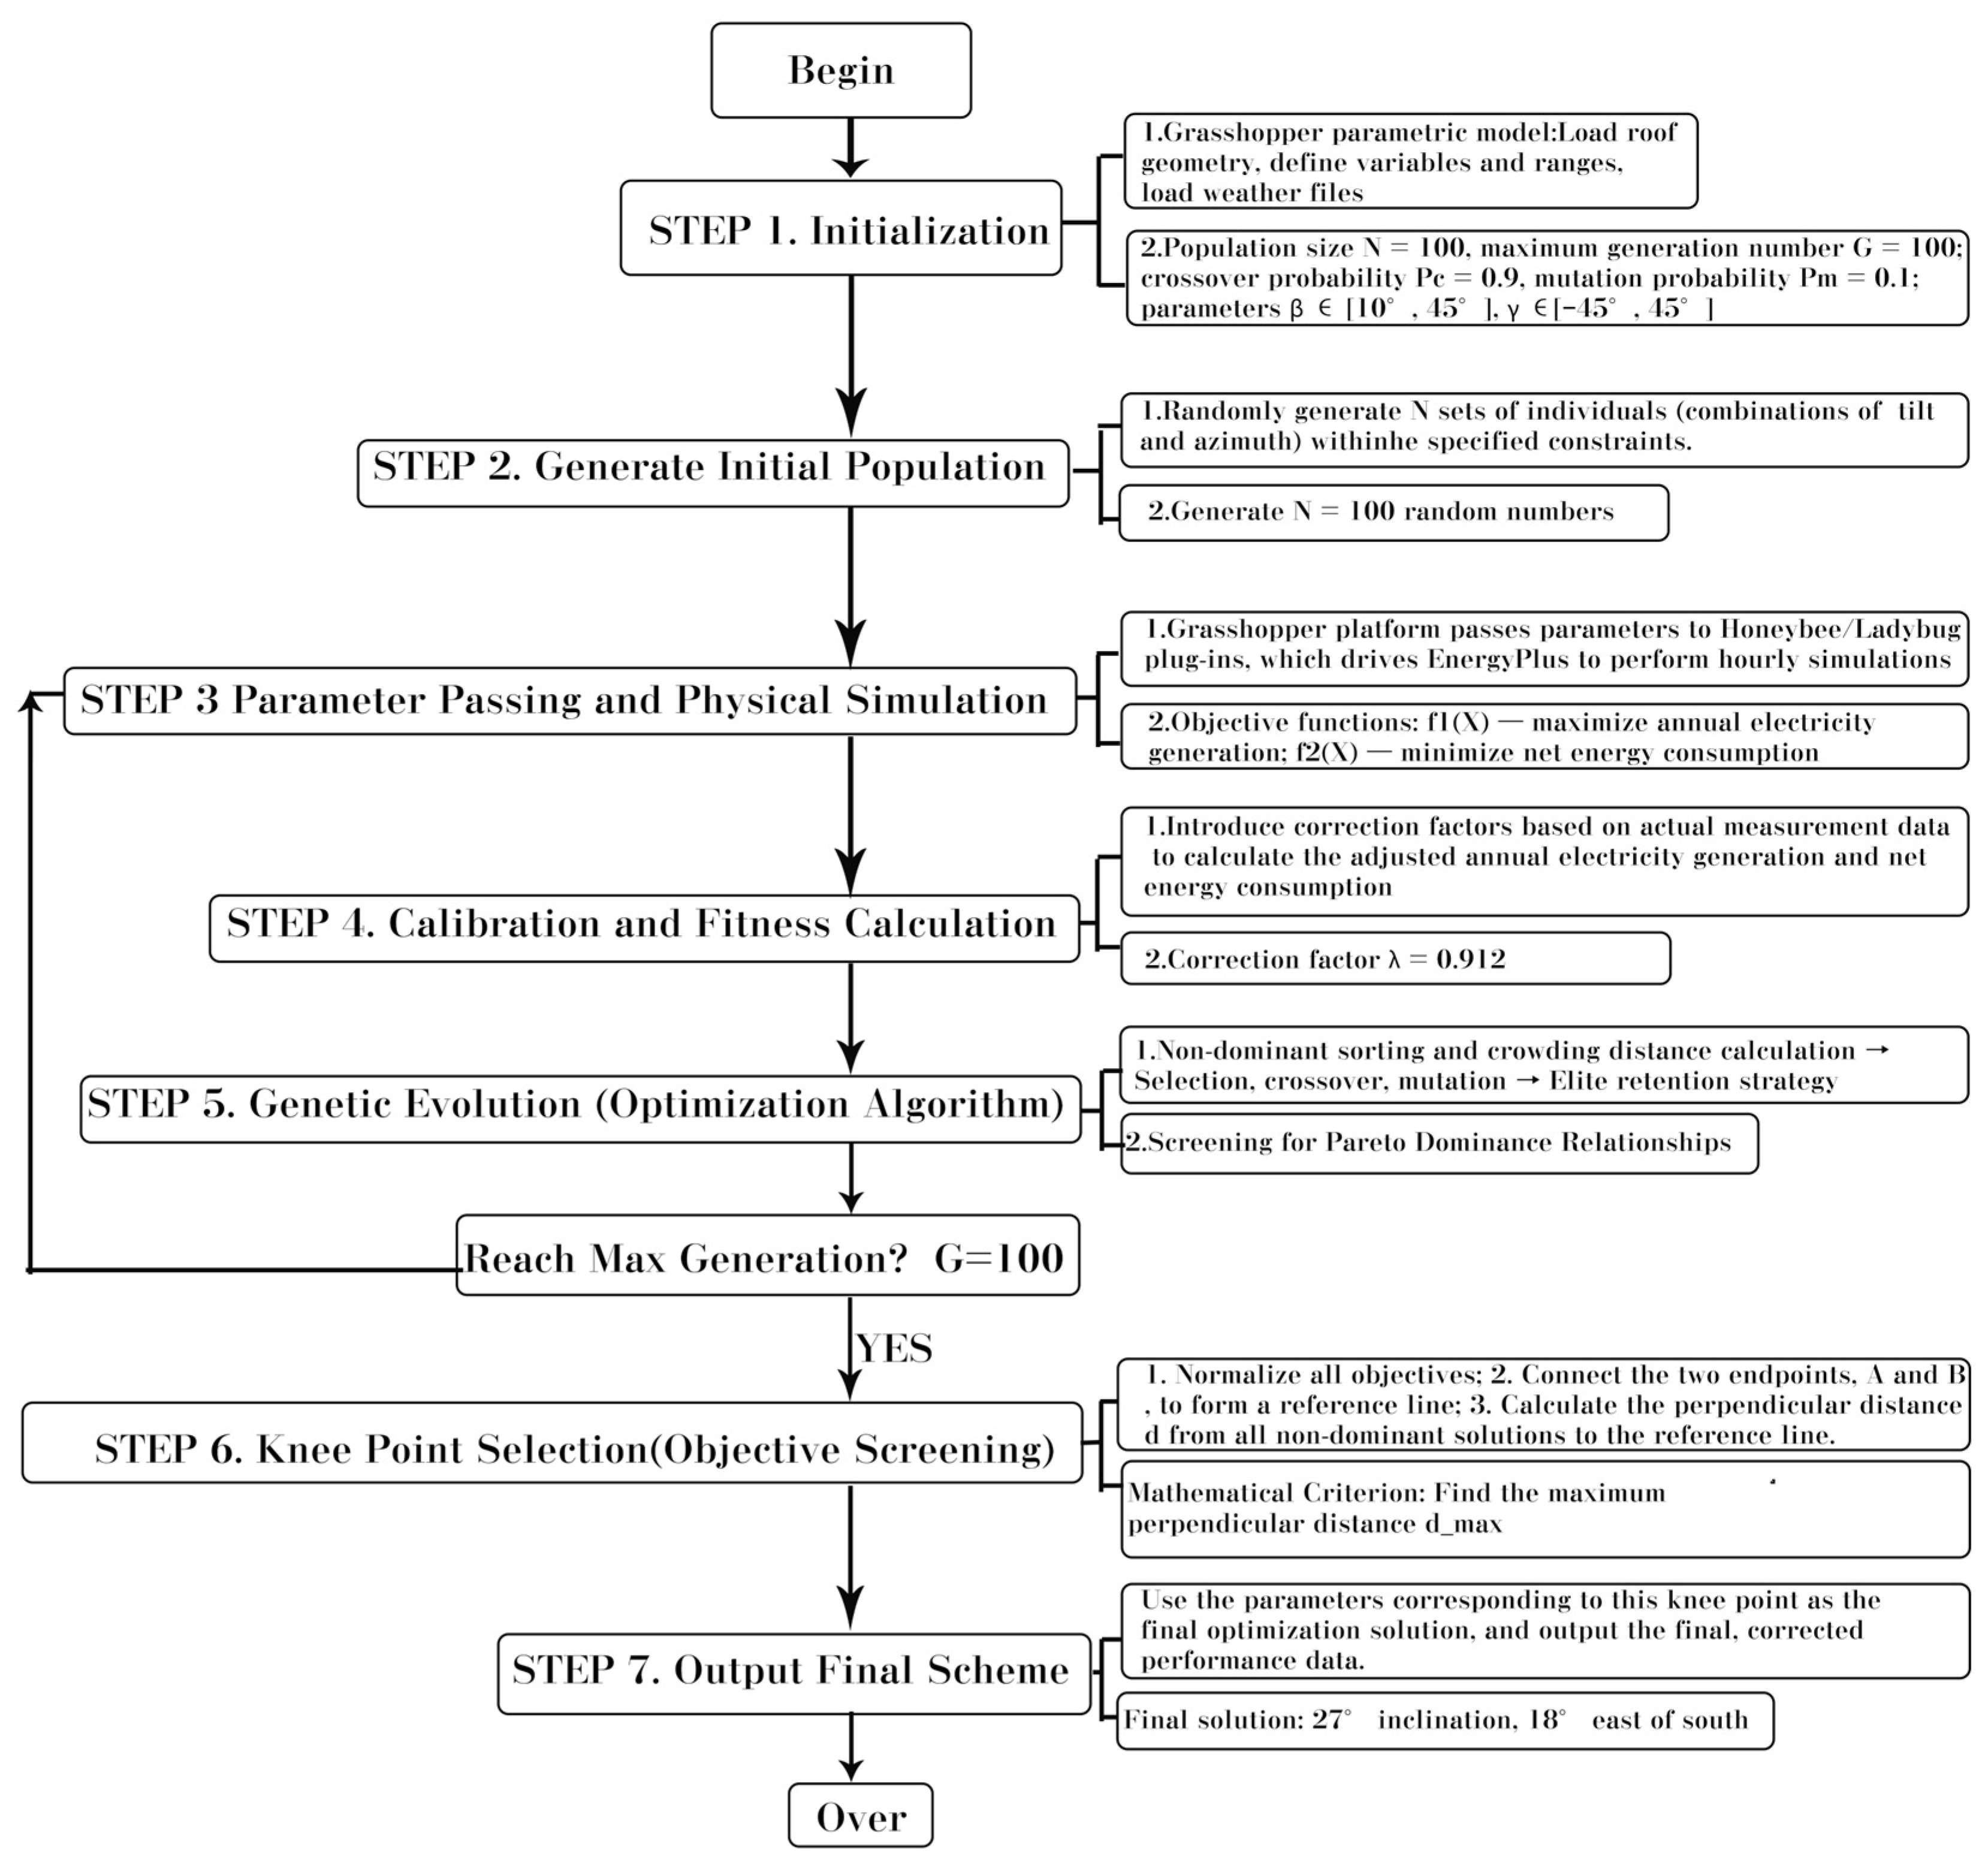
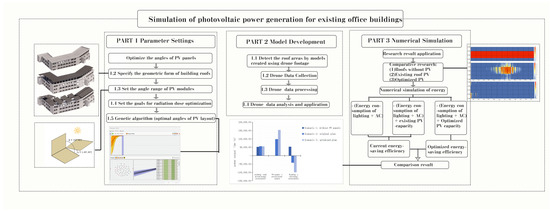
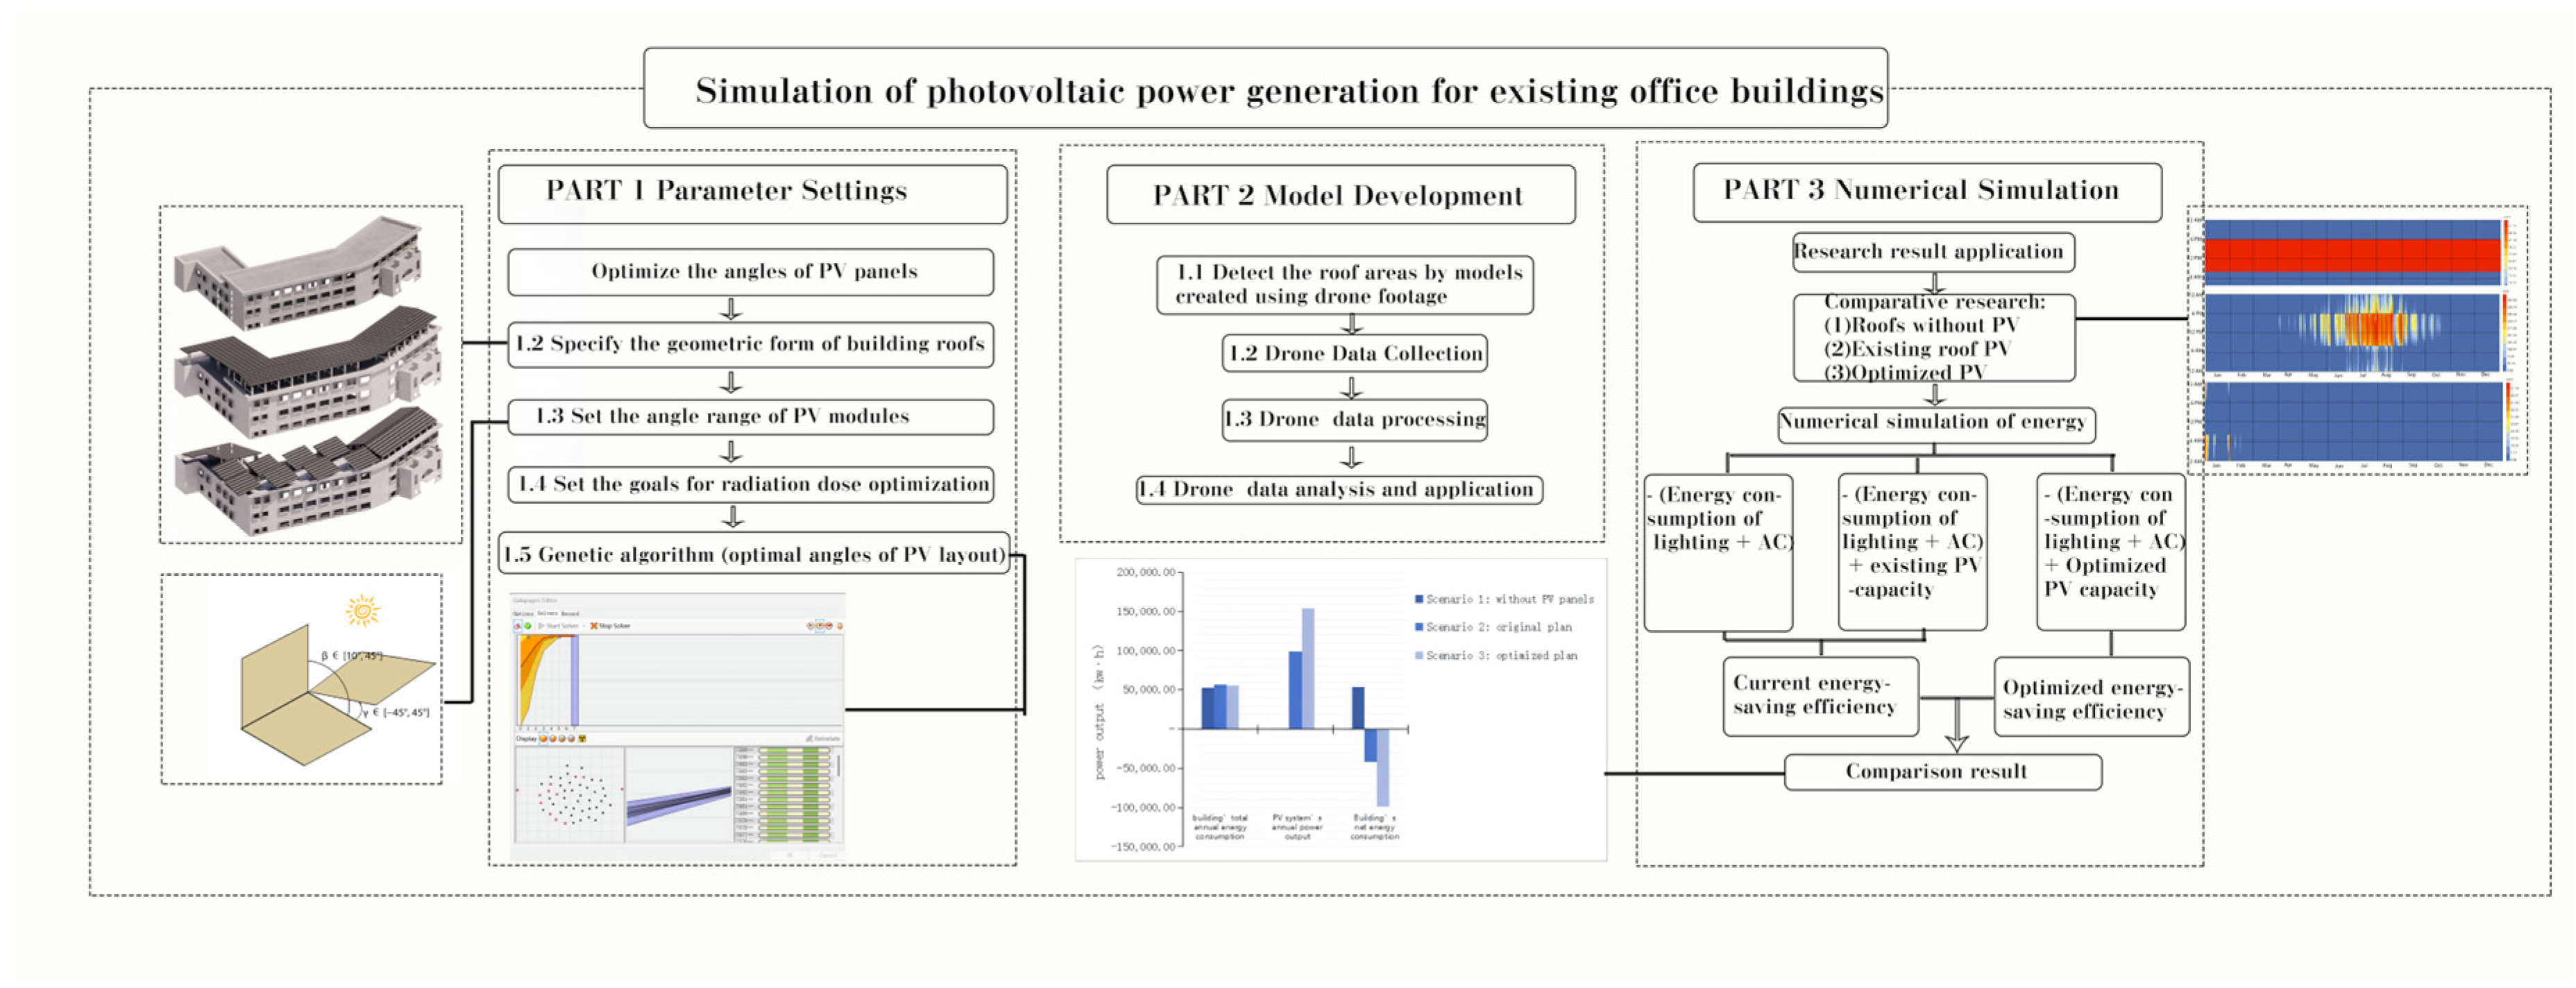
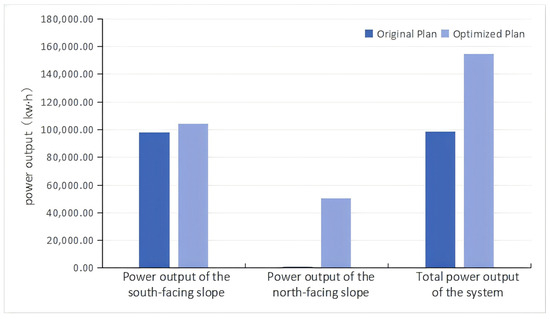
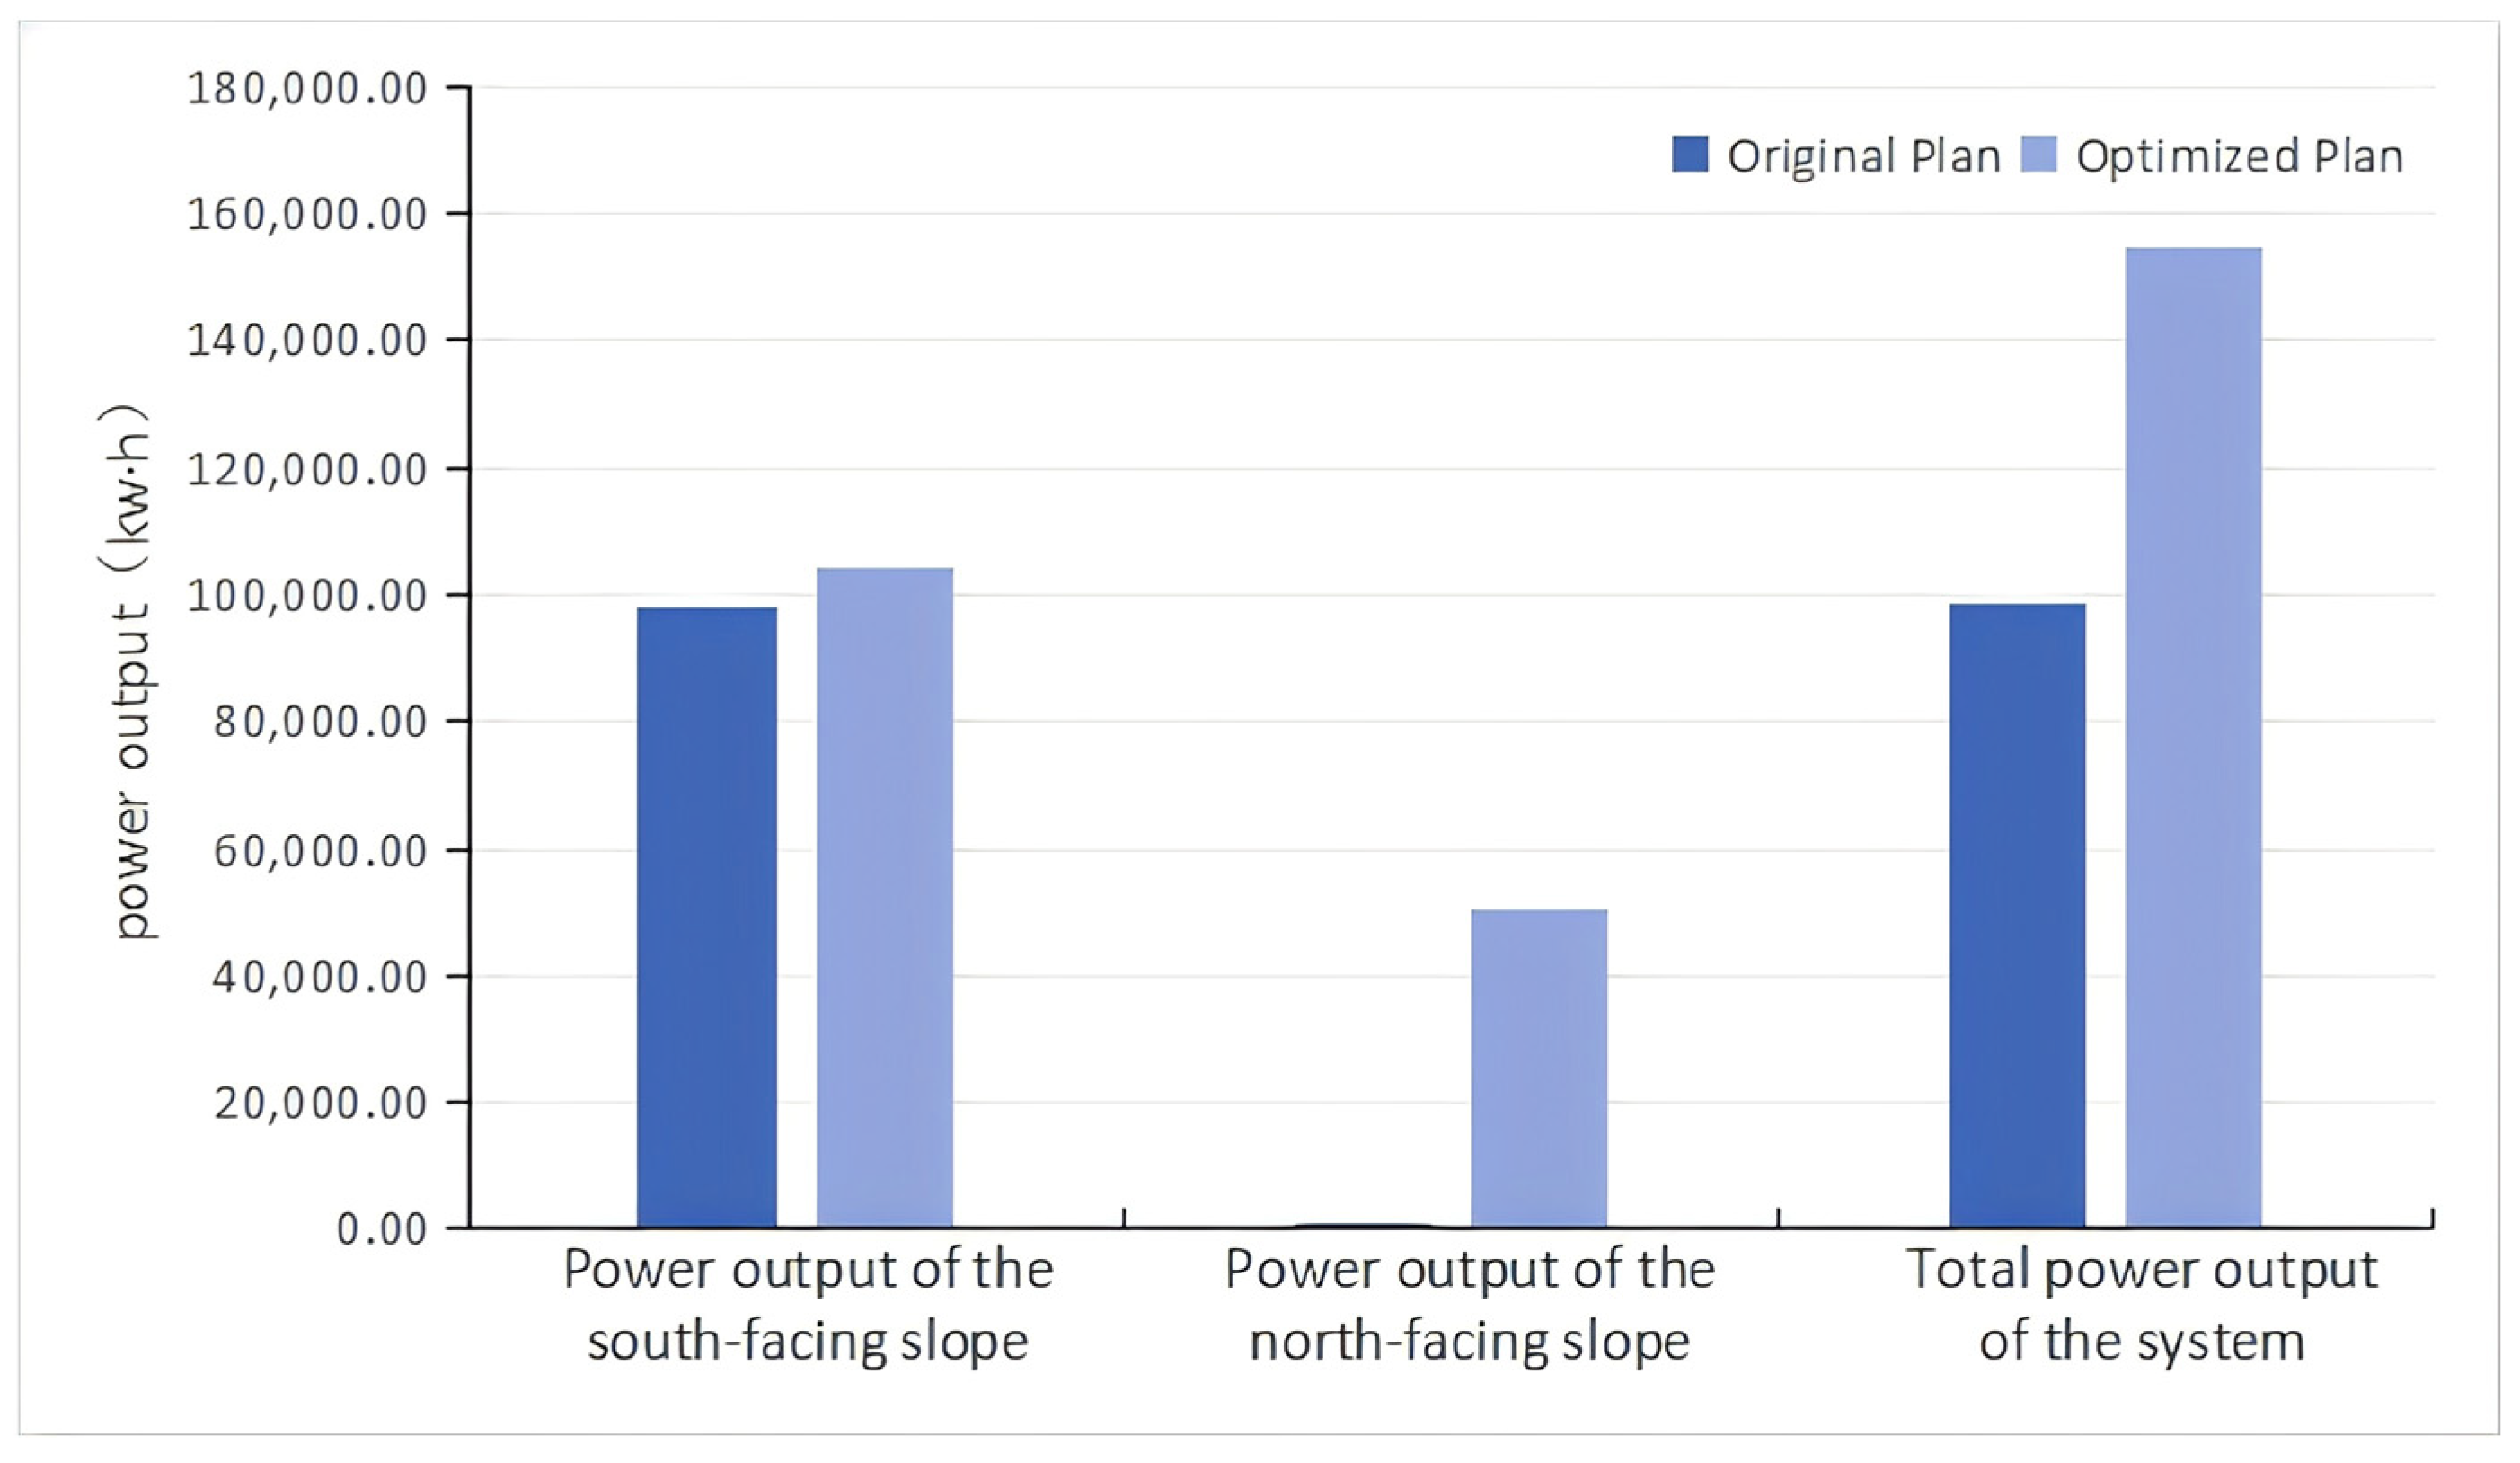
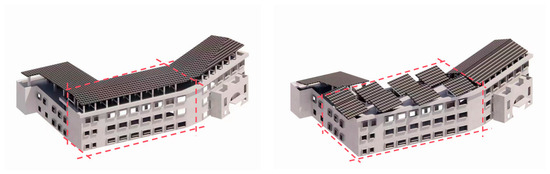
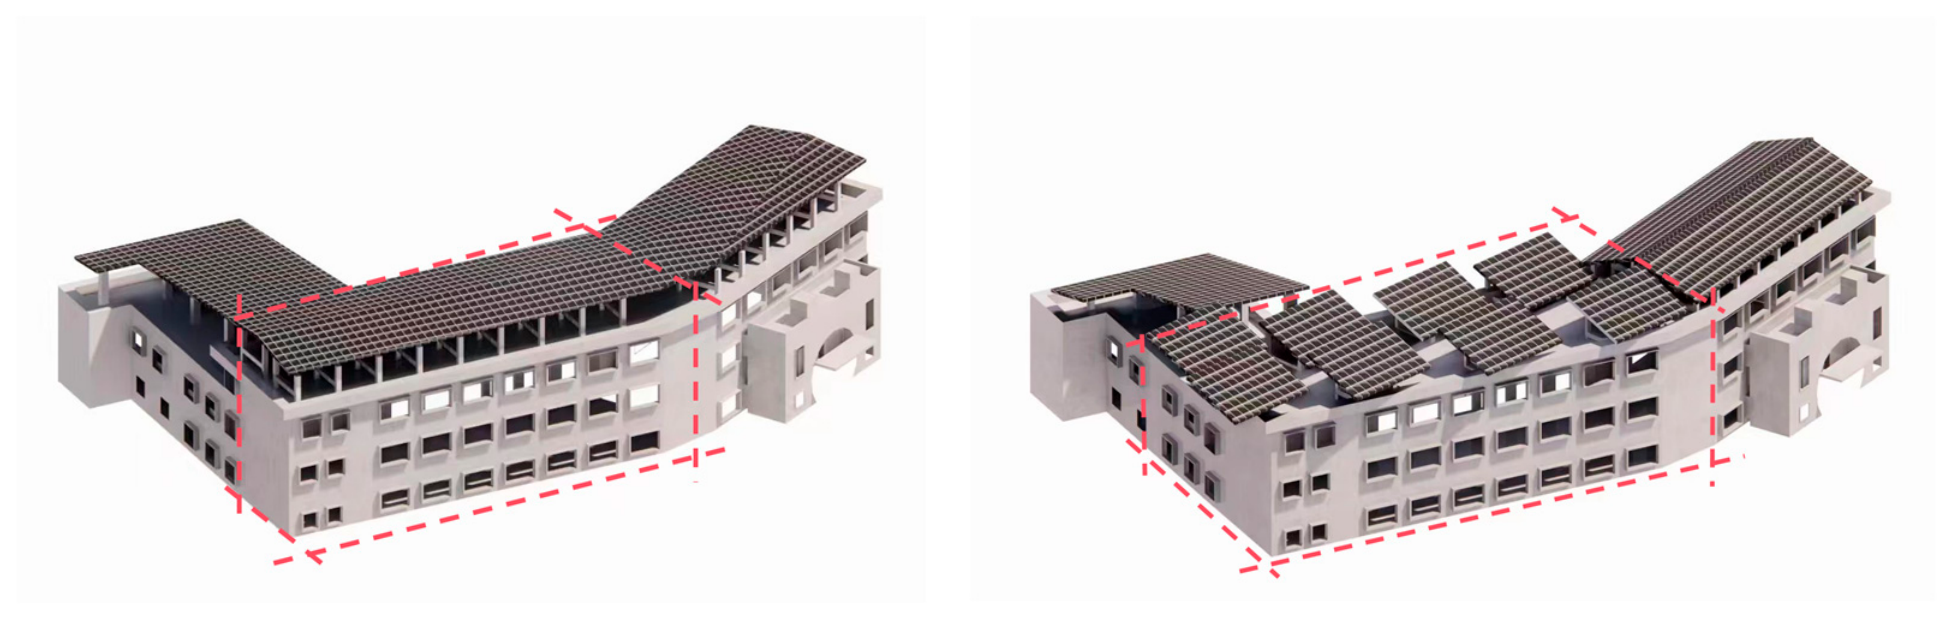
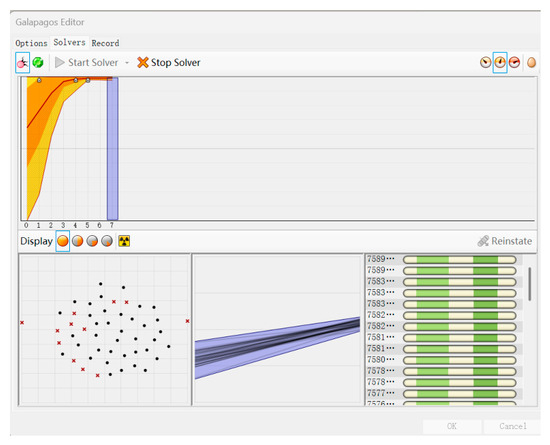
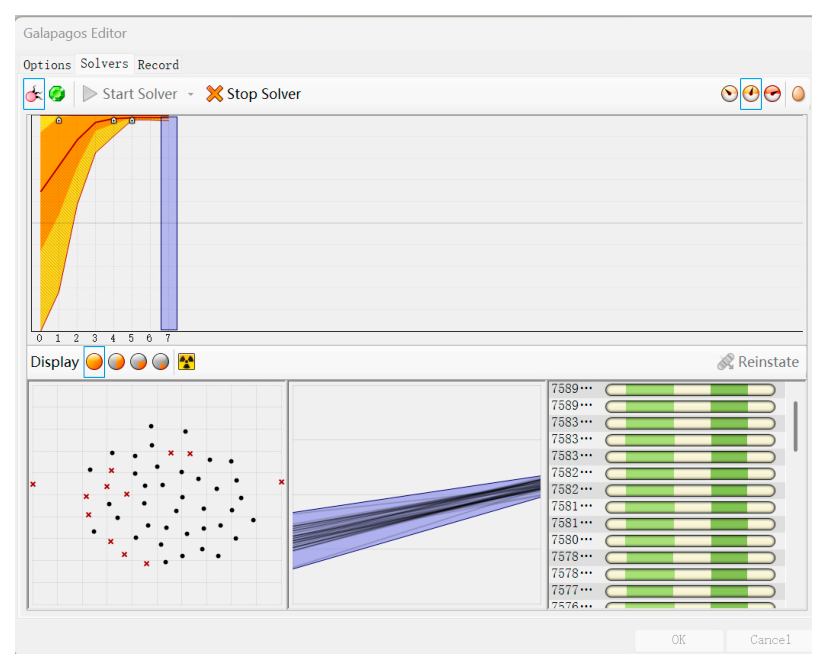
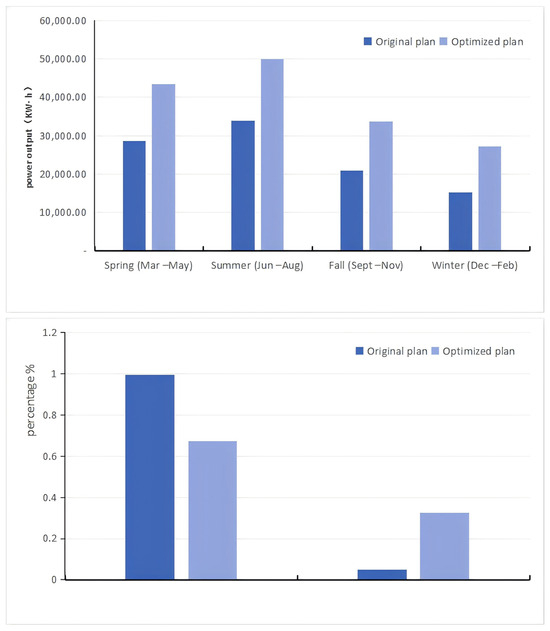
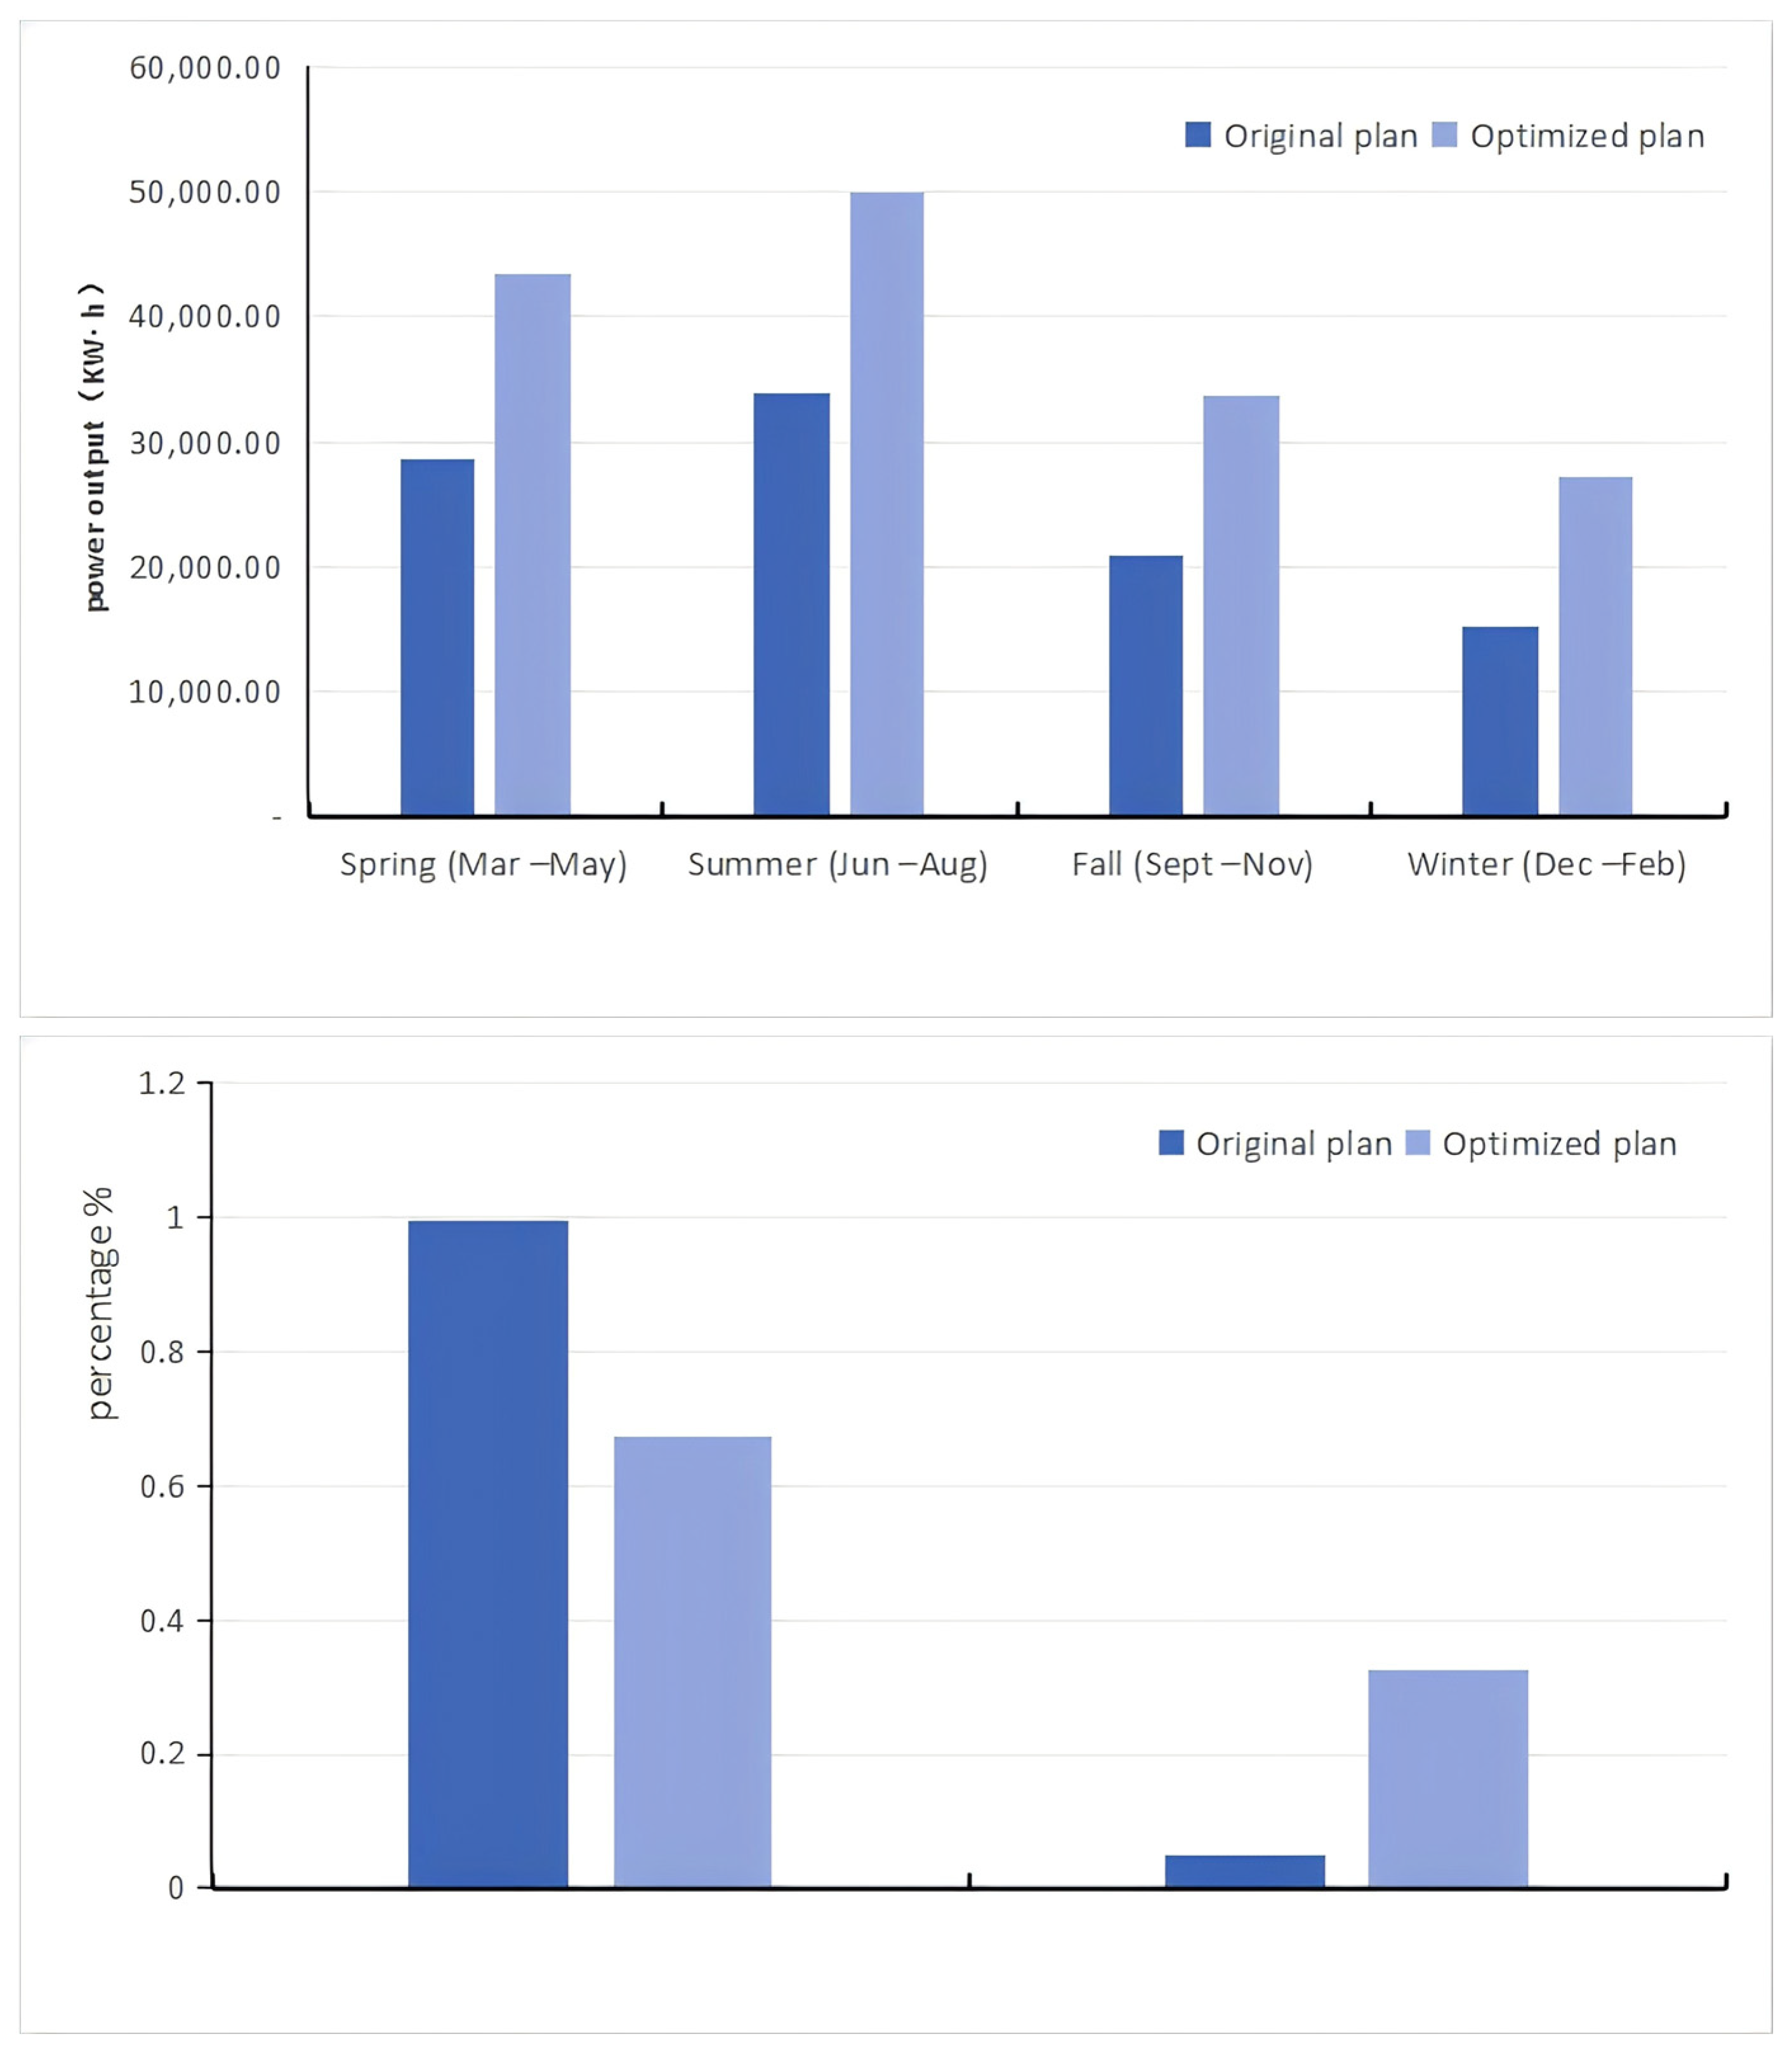
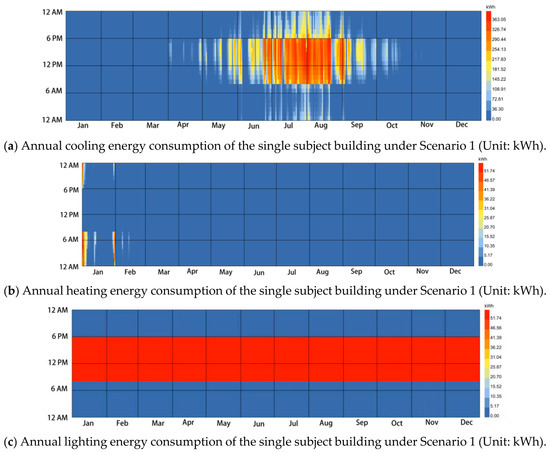
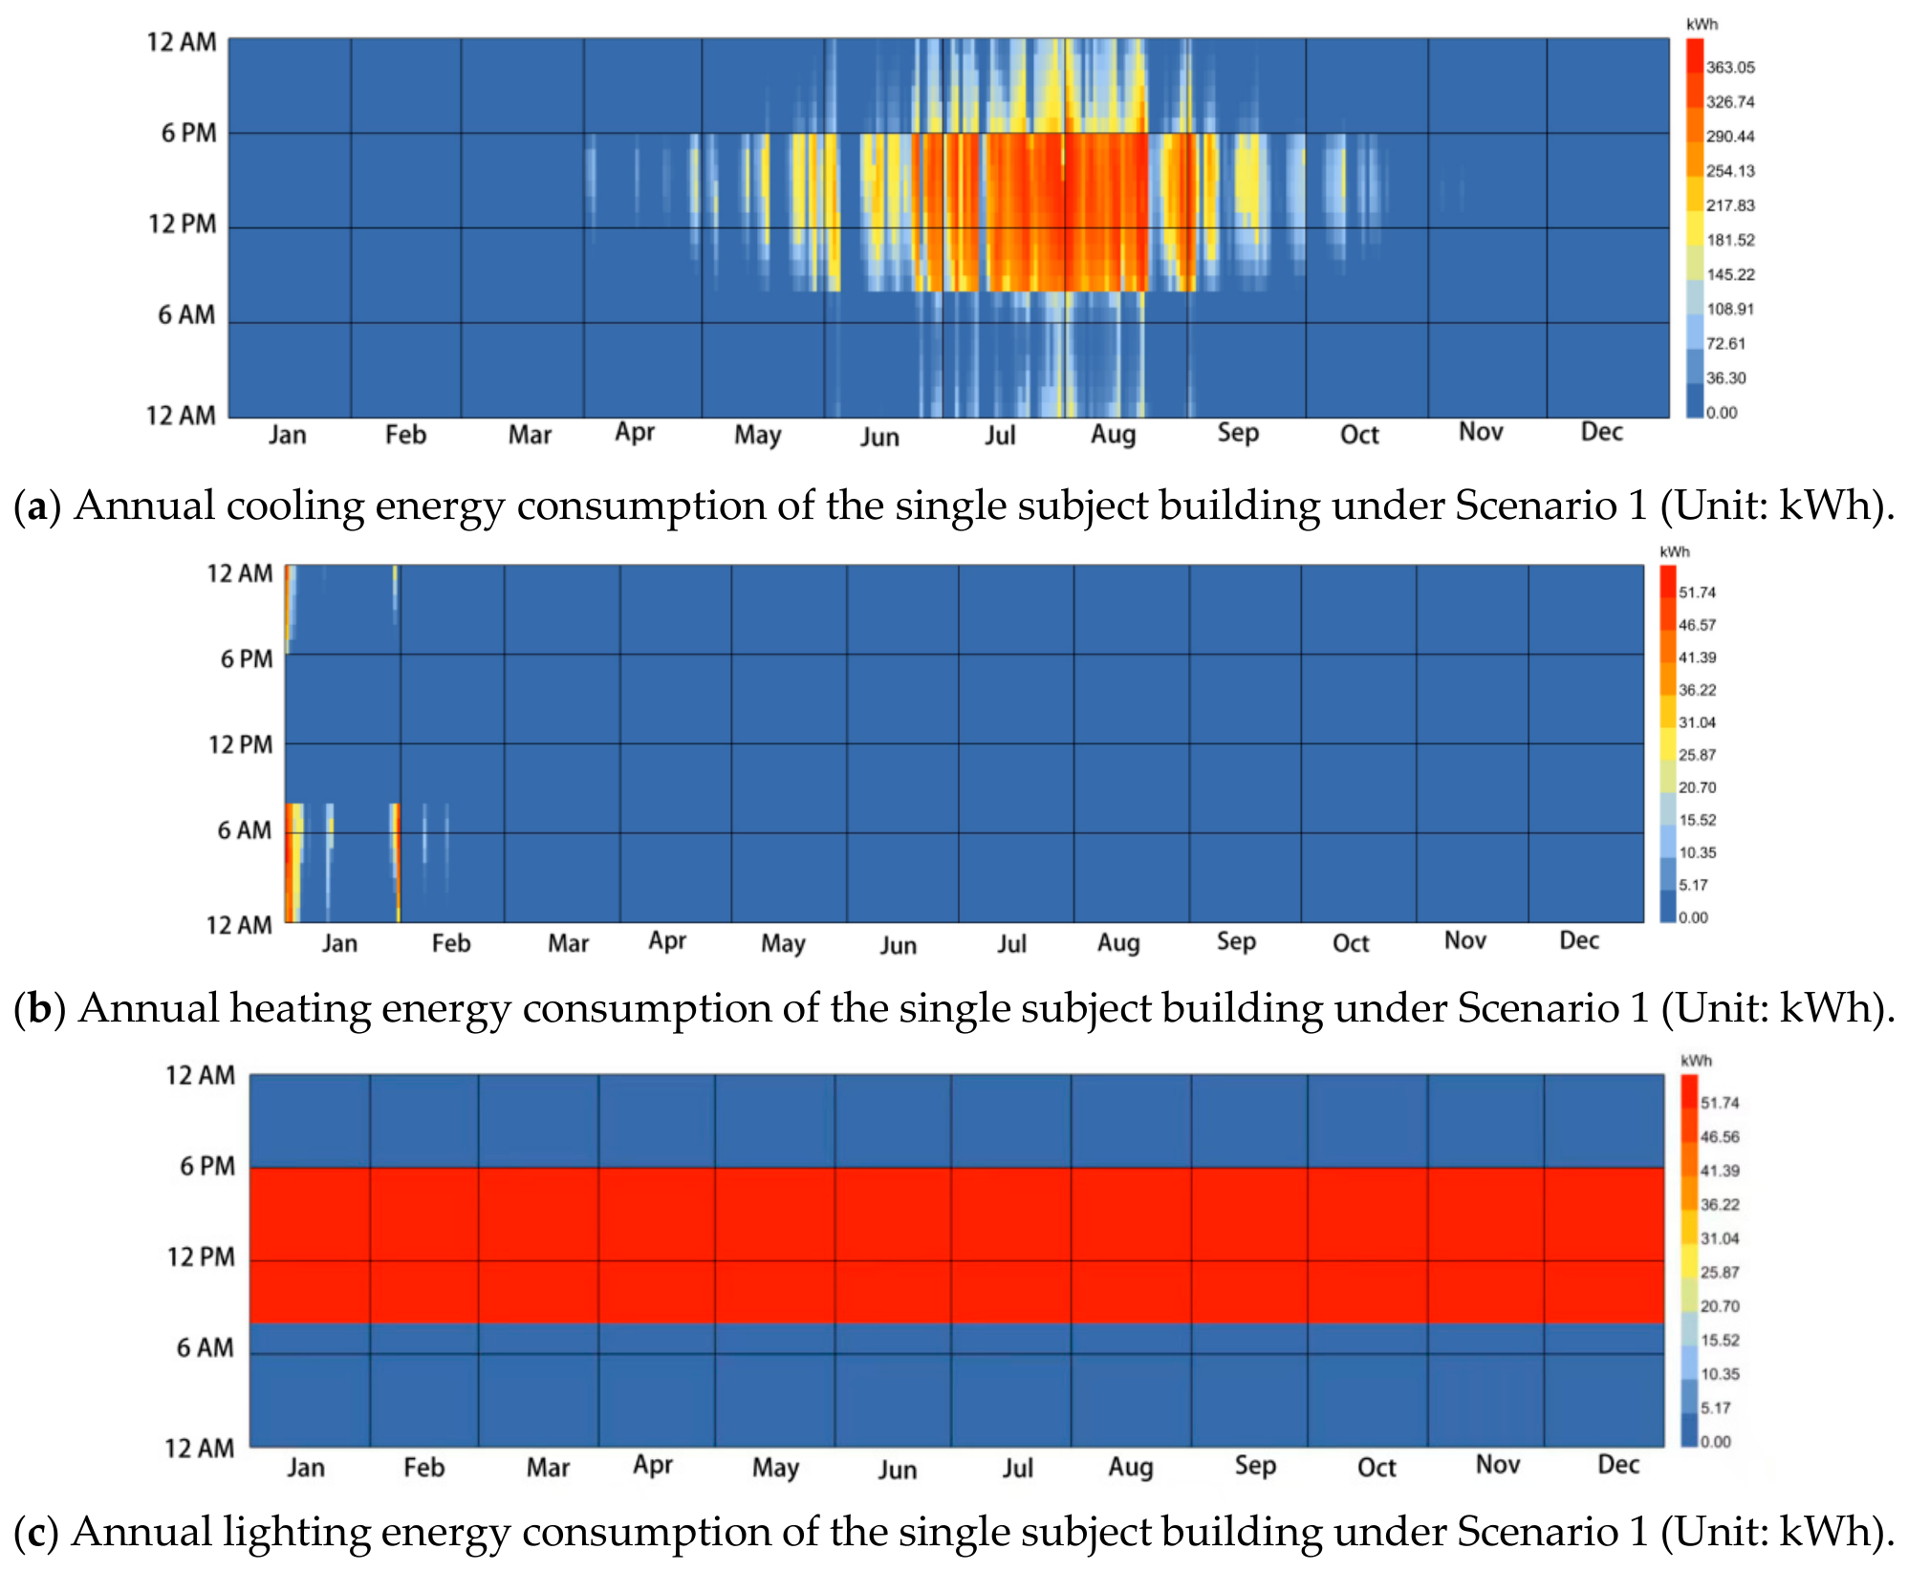
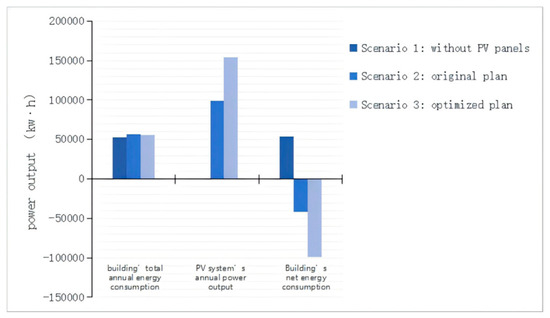
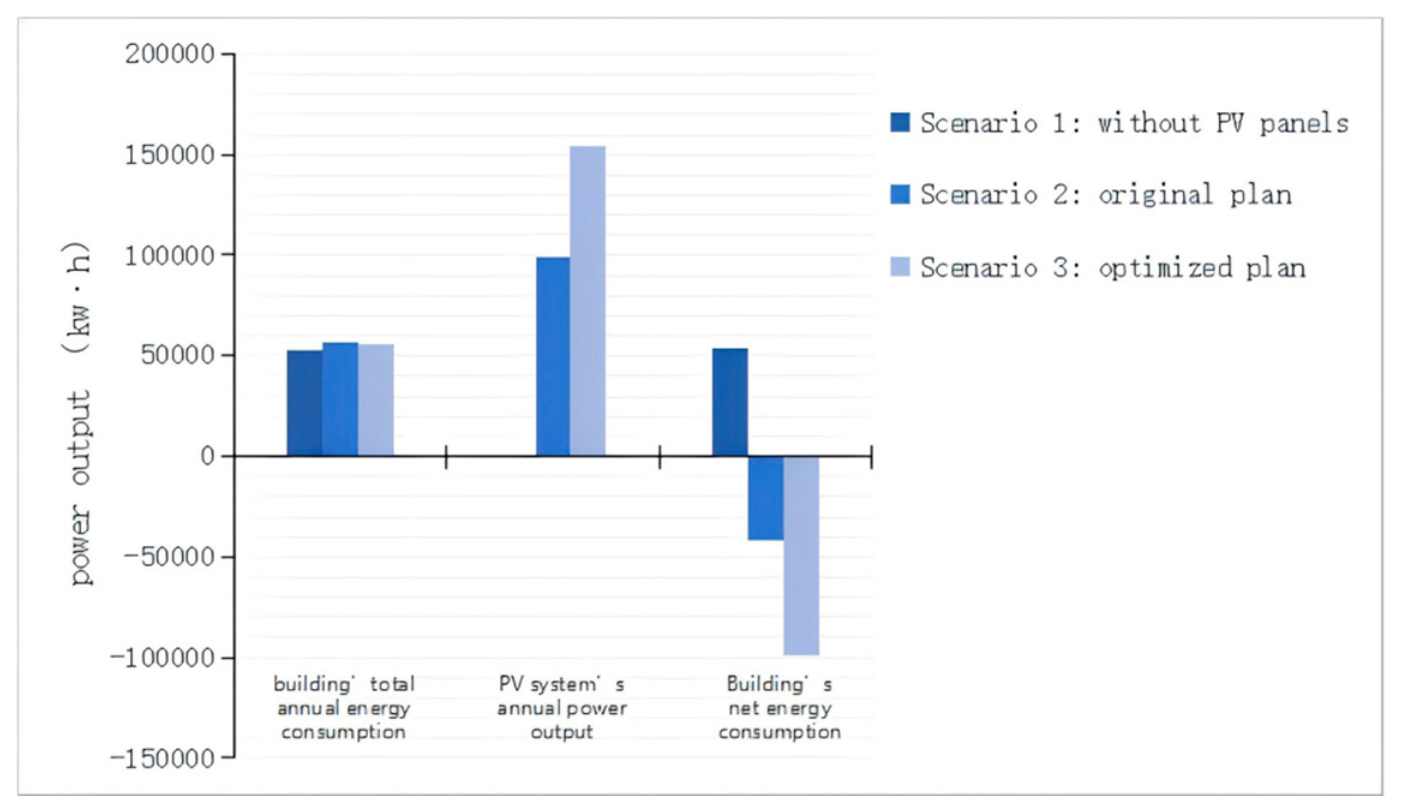

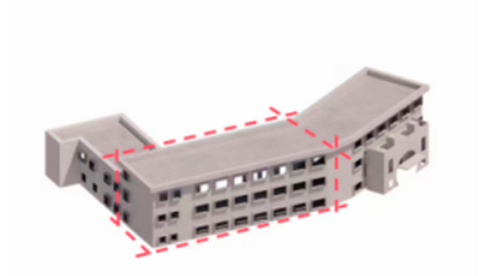
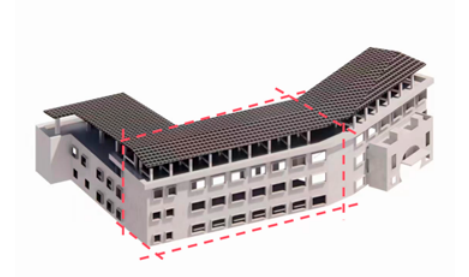
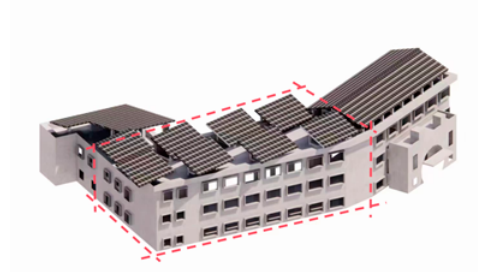
Disclaimer/Publisher’s Note: The statements, opinions and data contained in all publications are solely those of the individual author(s) and contributor(s) and not of MDPI and/or the editor(s). MDPI and/or the editor(s) disclaim responsibility for any injury to people or property resulting from any ideas, methods, instructions or products referred to in the content. |
© 2026 by the authors. Licensee MDPI, Basel, Switzerland. This article is an open access article distributed under the terms and conditions of the Creative Commons Attribution (CC BY) license.