


Abstract
Building energy efficiency is critical for achieving sustainable development goals, particularly in low- and middle-income countries where rapid urbanization drives energy demand growth. This study presents a parametric analysis of baffle external shading for a west-facing educational building in Xianyang, a cold climate region of China, integrating daylighting performance and indoor thermal regulation. Using Ladybug and Honeybee plugins in Grasshopper, three key shading parameters—shading characteristic value (x), baffle angle (δ), and baffle arc (θ)—were systematically varied to evaluate their effects on solar radiation distribution, useful daylight illuminance (UDI), and indoor temperature. Results indicate that vertical louvers with x ≥ 0.50 and δ = 45° in the west orientation reduce ground radiation by up to 47% and lower average indoor temperature by approximately 2 °C under free-running conditions, while UDI reaches 81.3% of occupied hours (6.5 h/d) with optimized shading in cold regions. The baffle arc (θ) has negligible impact. These findings provide actionable design guidelines for cost-effective passive cooling, requiring less than 2% of total building investment with simulated annual energy savings of 10.5% for the case-study classroom (cooling and heating terms only), supporting China’s “Dual Carbon” goals and broader sustainable urban development targets.
1. Introduction
The building sector is one of the largest energy consumers worldwide, accounting for approximately 36% of global final energy use and nearly 40% of energy-related carbon dioxide emissions [1]. In low- and middle-income countries, where urbanization rates continue to rise rapidly, the energy demand for heating, cooling, and lighting in buildings is projected to grow substantially in the coming decades [2]. Addressing this growth through energy-efficient building design is essential for achieving the United Nations Sustainable Development Goals (SDGs), particularly SDG 7 (Affordable and Clean Energy), SDG 11 (Sustainable Cities and Communities), and SDG 13 (Climate Action). Passive design strategies—including building orientation, natural ventilation, thermal mass, and solar shading—offer cost-effective pathways to reduce building energy consumption without relying on energy-intensive mechanical systems, making them especially relevant for low- and middle-income countries where access to advanced technologies may be limited [3,4]. In such contexts, the spread of energy-intensive mechanical cooling (air-conditioning) is often constrained by cost and infrastructure. Passive strategies that reduce the cooling load at source, by limiting solar gain before it enters the building, are therefore particularly relevant, since they lower the demand that any cooling equipment would otherwise have to meet.
China, as the world’s largest energy consumer and an upper-middle-income country, has set ambitious “Dual Carbon” goals to achieve peak carbon emissions by 2030 and carbon neutrality by 2060. The building sector is responsible for approximately 22% of China’s total energy consumption, with building operation accounting for significant carbon emissions [5,6]. In response, the Chinese government has implemented a series of policies, including the “14th Five-Year Plan for Building Energy Efficiency and Green Building Development” [7] and the “Action Plan for Accelerating Energy Conservation and Carbon Reduction in the Building Sector” (2024), which mandate that all new urban buildings meet green building standards by 2025 and promote passive design strategies as a key measure [8].
Among passive design strategies, external shading devices play a particularly important role in reducing solar heat gain and improving daylighting performance. Research has shown that facade shading can contribute 10–24% of total building energy savings with an investment of less than 2% of total building costs [9]. Shading devices such as louvers can reduce direct solar heat gain on building surfaces by up to 80% [10]. It should be noted, however, that shading and view clarity are generally conflicting design considerations for louvers, since increased shading typically reduces view clarity. Increased solar gains raise cooling loads in hot climates, whereas in cold climates they can be beneficial by reducing heating demand—a trade-off that is central to shading design in cold climate regions. Moreover, daylight-linked controls using photosensors, switches and dimmers enable automated artificial lighting that dims or switches off when daylight is sufficient, thereby conserving energy; artificial lighting accounts for 20–40% of total building electricity use [11]. Excessive or insufficient natural light can also lead to visual discomfort and increased cooling loads, underscoring the need for carefully optimized shading designs that balance multiple performance objectives [12,13].
Significant research has been conducted on shading device optimization. Athienitis and Tzempelikos [14] experimentally studied louver inclination angles and found that a 78° angle maximized indoor daylight transmission. Manzan and Padovan [15] optimized fixed shading devices in office buildings through simulation, demonstrating the potential of software-driven design. More recently, Khidmat et al. [11] employed multi-objective optimization (MOO) with genetic algorithms to optimize expanded-metal shading in Japan, achieving 100% reduction in annual sunlight exposure and 50% improvement in useful daylight illuminance (UDI). Taveres-Cachat and Goia [16] validated a parametric model of external louvred shading through full-scale experimental testing, demonstrating accurate thermal and daylighting predictions. In the context of low- and middle-income countries, studies have explored passive cooling and daylighting retrofits in East African dwellings [4], building envelope optimization in Egypt [17], and bioclimatic design strategies across global climate zones [3]. Within China, researchers have investigated shading energy-saving rates for residential buildings [18], BIPV shading louver systems for offices [19], and parametric integrated design methods for external shading [20].
Despite these advances, several research gaps remain. First, most existing studies focus on hot-summer or subtropical climates, with limited attention to cold climate regions where the balance between winter heat gain and summer overheating presents unique design challenges. Second, few studies simultaneously evaluate radiation, daylighting, and thermal performance within a unified parametric framework for baffle-type shading devices. Third, the practical applicability of shading design guidelines for public buildings—where cost-effectiveness and constructibility are paramount—remains underexplored.
To address these gaps, this study presents a systematic parametric analysis of baffle external shading for a west-facing educational building in Xianyang, China (cold climate zone). Three key design parameters—shading characteristic value (x), baffle angle (δ), and baffle arc (θ)—are evaluated for their effects on solar radiation distribution, UDI, and indoor temperature. The study aims to: (1) identify the optimal range of baffle shading parameters for balancing daylighting and thermal performance; (2) quantify the energy-saving potential of the recommended configuration; and (3) discuss the implications for sustainable building design in low- and middle-income countries. The findings provide actionable design guidelines that align with China’s building energy policies and contribute to the broader discourse on passive design for sustainable development.
2. Materials and Methods
2.1. Climate Context and Meteorological Parameters
Xianyang is located in Shaanxi Province, northwestern China (34°19′ N, 108°05′ E), classified as a cold climate zone according to the Chinese building climate zoning standard (GB 50176-2016 [21]). This region is characterized by hot summers with intense western solar exposure and cold winters requiring significant heating. The climate context is representative of many rapidly urbanizing regions in low- and middle-income countries that face dual challenges of summer overheating and winter energy demand [3].
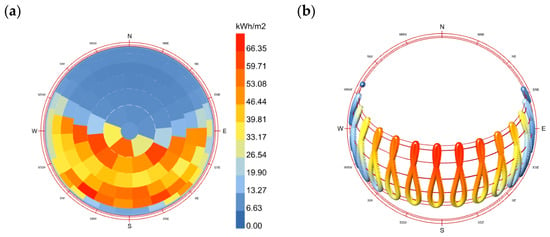
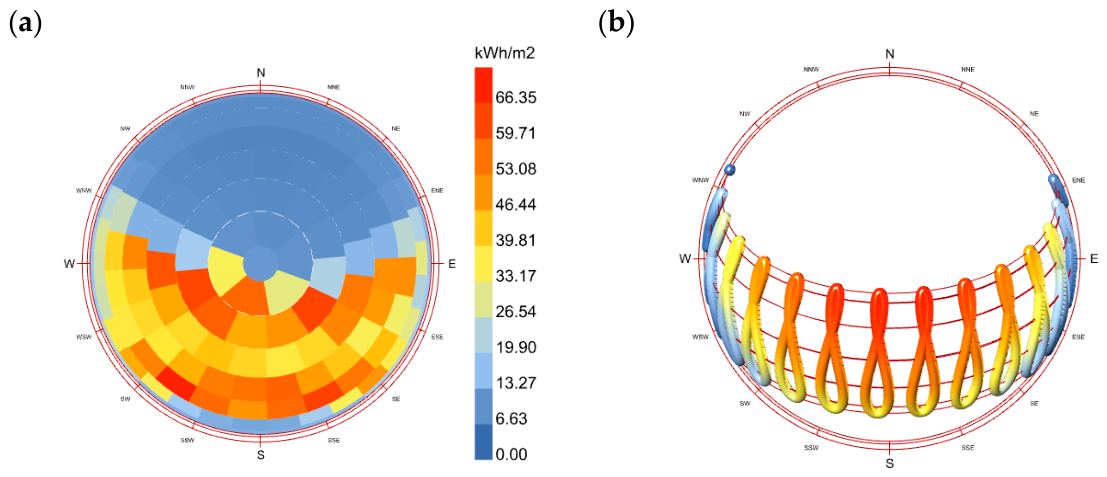
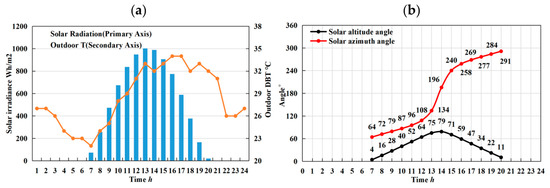
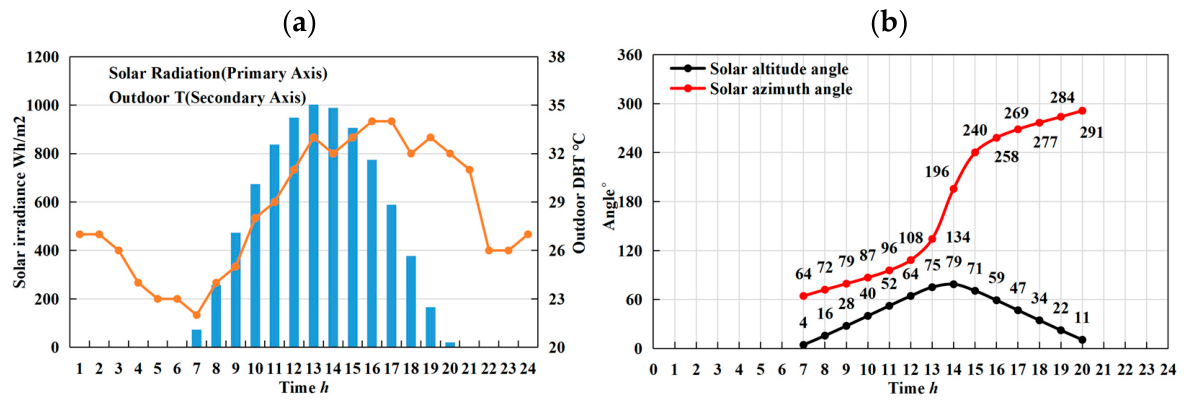
Figure 1a,b shows the distribution of total cumulative solar radiation throughout the year, revealing that west-facing solar radiation is significantly higher than south-facing, indicating a potential risk of visual discomfort due to western exposure; a quantitative glare assessment (e.g., Daylight Glare Probability) was not performed in this study and is identified as a direction for future work. To emphasize the shading device’s cooling and daylighting effects during summer, the daylighting analysis was performed for the entire year, while cumulative solar radiation on the ground (kWh), sunshine hours, and indoor temperature variations were examined specifically on the summer solstice day (21 June). On this day, the solar path is closest to the building, and the solar altitude angle reaches its maximum for the entire year. Figure 2a shows the solar radiation and outdoor dry-bulb temperature on the summer solstice day, with temperature increasing as solar radiation intensifies, reaching the highest point around 16:00. Figure 2b illustrates the solar path diagram and solar altitude and azimuth angles for the summer solstice, respectively.
Figure 1.
(a,b) Annual cumulative solar radiation (kWh/m2); sun paths throughout the year. In both panels, azimuth is measured clockwise from north and the radius denotes solar altitude (0° at the rim, 90° at the centre).
Figure 2.
(a,b) Solar radiation and outdoor dry-bulb temperature; solar altitude and azimuth.
2.2. Parametric Modeling and Simulation Tools
The parametric model was built in Rhinoceros 7.1 (Robert McNeel & Associates, Seattle, WA, USA) with the Grasshopper visual programming plugin (integrated in Rhinoceros 7.1). Ladybug 1.9.0 and Honeybee 1.9.0 (Ladybug Tools LLC, Boston, MA, USA), which interface with Radiance 5.4 and EnergyPlus 25.1.0 (U.S. Department of Energy, Washington, DC, USA) simulation engines, were used for daylighting and thermal simulations, respectively. Radiance was configured with a ray bounce depth of 5 and ambient divisions of 512 for daylighting calculations, following recommendations by Reinhart et al. [22]. The analysis grid was set at 0.25 m × 0.25 m resolution at a reference plane height of 0.75 m above the floor, corresponding to the standard working plane height and giving 768 sensor points over the 48 m2 classroom floor. Zhou and Dong [23] validated the simulation accuracy of Ladybug for daylight performance through comparative analysis of measured and simulated data, confirming its reliability for this type of study. The weather data used was the EnergyPlus Weather (EPW) file for Xianyang, obtained from the CSWD database as the 15-year average of the 2007–2021 record.
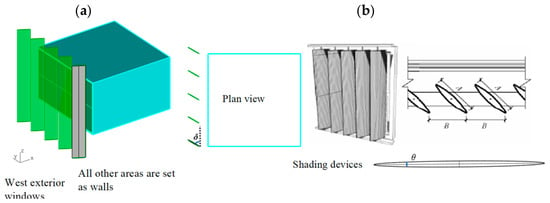
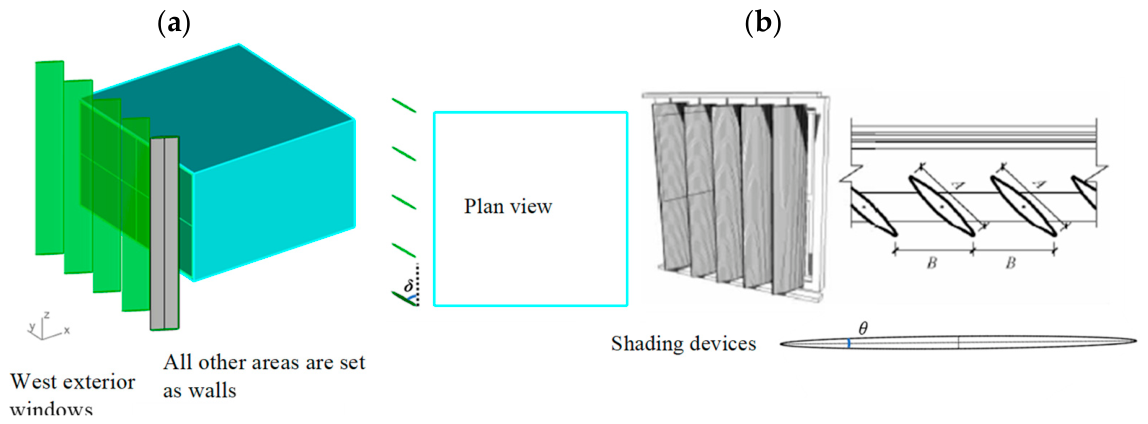
The building model represents a typical west-facing classroom in an educational facility in Xianyang, with interior dimensions of 8.0 m (width) × 6.0 m (depth) × 3.6 m (height). The window-to-wall ratio (WWR) of the west facade is 0.70, with double-glazed windows (U-value = 2.2 W/m2·K, solar heat gain coefficient [SHGC] = 0.62). The thermal transmittance of the envelope follows GB 50189-2015 [24]: exterior wall 0.30 W/(m2·K), roof 0.30 W/(m2·K) and glazing 2.20 W/(m2·K). The baffle shading device consists of vertical louvers mounted externally on the west facade. Three design parameters were systematically varied, as summarized in Table 1, and the Radiance surface optical properties summarized in Table 2. Figure 3 shows the building model and the baffle shading configuration.
Table 1.
Range of baffle shading design parameters.
Table 2.
Radiance surface optical properties.
Figure 3.
(a,b) Diagram of the building model: (a) axonometric view; (b) model plan view and component detail. A denotes the baffle length (m) and B the baffle spacing (m), both defined in Section 2.2.
The shading characteristic value x is defined as x = A/B, where A is the baffle length (m) and B is the spacing between baffles (m). A fixed baffle length of A = 1.2 m was used. The baffle angle δ represents the rotation of the louver from the vertical plane, and the baffle arc θ represents the curvature of the louver surface. Each parameter was varied independently while holding the others at baseline values (x = 0.80, δ = 60°, θ = 6°), enabling the isolation of individual parameter effects on building performance.
Table 3 lists the simulation inputs. The indoor temperatures reported in Section 3 are obtained under free-running conditions, with the heating and cooling equipment switched off, so that the effect of the shading device is isolated from the capacity, operation and schedule of any mechanical system; the setpoints in Table 3 are required as model inputs, apply to the heated and cooled runs only, and do not affect the free-running temperatures. Because all configurations are simulated with identical thermal boundary conditions, the differences reported in Section 3 are attributable to the shading geometry alone.
Table 3.
Simulation assumptions and input parameters.
2.3. Evaluation Indicators
The performance of the baffle shading was evaluated using three categories of indicators: solar radiation, daylighting, and indoor thermal environment. Solar radiation was quantified by the cumulative solar radiation on the indoor ground (kWh) and the sunshine duration (h) on the summer solstice day. Daylighting was assessed by two metrics: (1) the standard daylighting duration, defined as the percentage of occupied hours during which illuminance at the working plane exceeds 450 lx, i.e., a daylight-autonomy-type metric evaluated against a single minimum threshold; and (2) the useful daylight illuminance (UDI), defined as the annual fraction of occupied hours (%) with illuminance within 450–2000 lx [22]. The lower bound follows GB 50033-2013 [25] for educational buildings and the upper bound the conventional UDI definition. Mardaljevic and subsequent studies commonly adopt 300–3000 lx, whereas the present choice reflects the applicable national standard. Both metrics are reported as the annual fraction of occupied hours (%) and as the equivalent average duration (h/d). The occupancy schedule is 09:00–17:00, 7 d/week (8 h/d, 365 days per year, i.e., 2920 occupied hours); since occupied and calendar days coincide, UDI (h/d) = UDI(%) × 8 h. Indoor thermal performance was evaluated by the average and maximum indoor air temperatures on the summer solstice under free-running conditions (no HVAC), with natural ventilation not considered.
2.4. Model Validation
The workflow was validated against on-site measurements in the west-facing classroom, with the shading elements set to the baseline configuration (x = 0.80, δ = 60°, θ = 6°, A = 1.2 m). The room was not in operation during the test and the windows were closed. The surface temperature of the shaded west-facing wall was recorded continuously over three consecutive clear days, 27–29 August 2026, using a TT20R-EX dual-channel temperature recorder (Miaoxin, Wenzhou, China; range −40 to 85 °C, accuracy ±0.2 °C) at 10 min intervals at two positions on the shaded wall, the two readings being averaged; the outdoor dry-bulb temperature, relative humidity, global horizontal solar radiation and wind speed were recorded over the same period. For the validation runs the measured values were substituted into the CSWD-derived EPW file using Dragonfly, with the direct and diffuse radiation components derived by the Erbs decomposition, and two days were appended before and after the test period for thermal equilibrium.
The exterior surface temperature was chosen as the validation variable rather than the indoor air temperature reported in Section 3, because it responds directly to the radiation intercepted by the shading device and has a diurnal range several times larger, whereas the indoor air temperature is attenuated and delayed by the thermal mass of the envelope; it is therefore the more demanding test. Agreement was quantified by the root mean square error (RMSE), expressed both in °C and as its coefficient of variation with respect to the measured mean (CV(RMSE)), and by the mean bias error (MBE), reported as simulated minus measured. The three indicators—RMSE, CV(RMSE) and MBE—are used here to evaluate the error between the measured and the simulated values. All three are evaluated on the hourly values, which the 10 min measurements were averaged to; because the ASHRAE Guideline 14 thresholds are defined for energy use rather than for surface temperature, RMSE in °C is used here as the primary criterion.
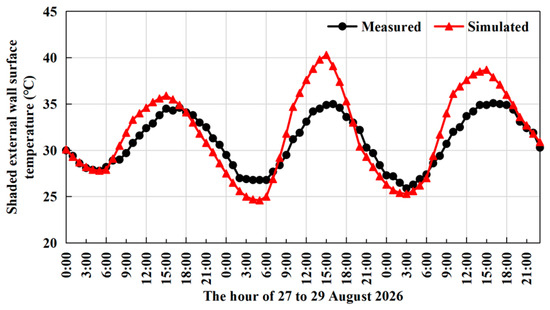
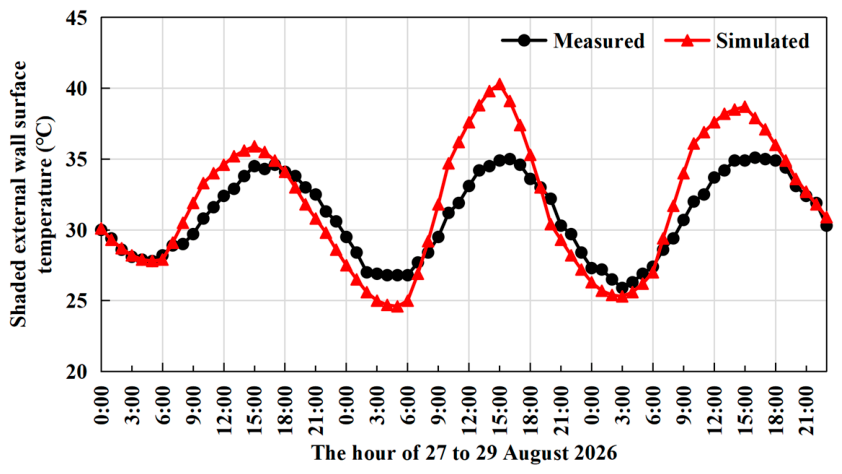
The simulated and measured surface temperatures follow the same diurnal pattern throughout the three days, both peaking between 15:00 and 16:00, although the simulated peak on the second day exceeds the measured peak by about 5 °C. Over the 72 hourly values the MBE is +0.87 °C (+2.8% of the measured mean, the measured mean being 30.94 °C) and the RMSE is 2.29 °C, i.e., CV(RMSE) = 7.4%, indicating no pronounced systematic bias. The comparison is shown in Figure 4.
Figure 4.
Validation against on-site measurements: measured and simulated exterior surface temperature of the shaded west-facing wall over three consecutive clear days, from 27 to 29 August 2026 (hourly values).
The simulated and measured temperatures agree in both time phase and magnitude, which indicates that the model is reliable for the parametric runs reported in Section 3. Since the indoor air temperature is computed by the same model with the same weather input, envelope properties and solver, this validation extends to the indoor results; the additional uncertainty is confined to the indoor boundary conditions, which are identical for all configurations compared in Section 3. The daylight calculations were not compared with measurements, their accuracy having been established independently [23]; this is noted as a limitation in Section 4.5.
3. Results
To quantitatively analyze the energy-saving and daylighting effects of vertical baffle shading on west-facing windows, the building model was used to investigate changes in cumulative solar radiation on the ground (kWh), sunshine hours, indoor temperature variations, and daylighting performance under different shading parameters (x, δ, θ) on the summer solstice day. Additionally, the study evaluates the achievement of standard daylight illuminance and UDI duration throughout the year. The objective is to provide technical parameter support for similar educational projects in terms of planning, design, and implementation under energy-efficient, low-carbon, and economic conditions. As validated in Section 2.4, the parametric results reported below rest on a validated model.
3.1. Influence of Shading Characteristic Value x on Radiation, Daylighting, and Indoor Temperature
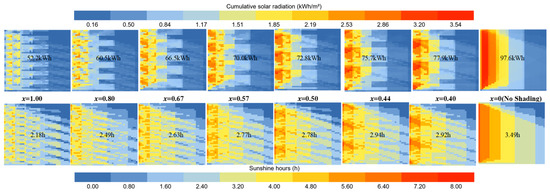
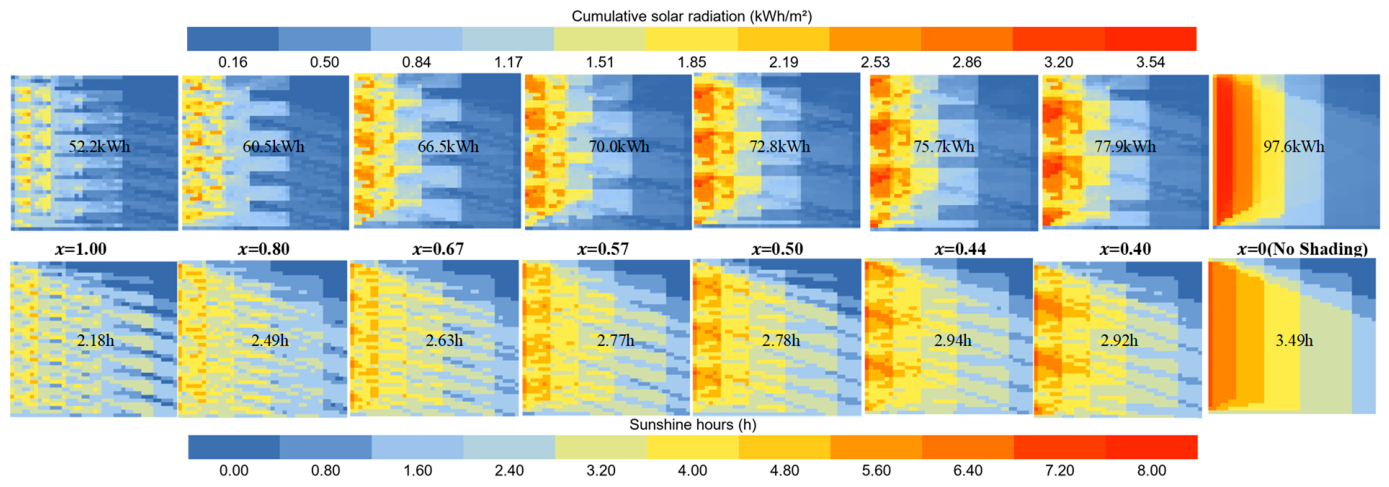
The baffle length A was set to 1.2 m, and the spacing B was adjusted from 1.2 m to 3.0 m to vary the shading characteristic value x from 0.40 to 1.00. The baffle angle δ was set to 60°, and the baffle arc θ was set to 6°. Figure 5 shows the distribution of cumulative solar radiation on the ground (kWh) and sunshine hours on the summer solstice day. As the shading characteristic value x increases, the cumulative solar radiation on the ground decreases almost linearly. Without shading, the total solar radiation on the ground from the west-facing sun on the summer solstice amounts to 97.6 kWh, with an average of nearly 3.5 h/d of sunshine. Within 2 m of the window, the radiation is too strong and the sunshine duration exceeds 5 h, which may result in local glare and overheating. When x = 1.00, the cumulative solar radiation on the ground decreases to 52.2 kWh, a 47% reduction compared to the no-shading condition, and the sunshine duration decreases by 38%. At x values of 0.50 and above, the baffle shading significantly reduces the ground radiation and improves its uniformity.
Figure 5.
Distribution of cumulative solar radiation on the ground (kWh) and sunshine hours on the summer solstice day. (numbers indicate the cumulative values over the study period (kWh)).
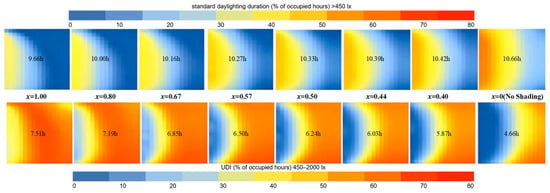
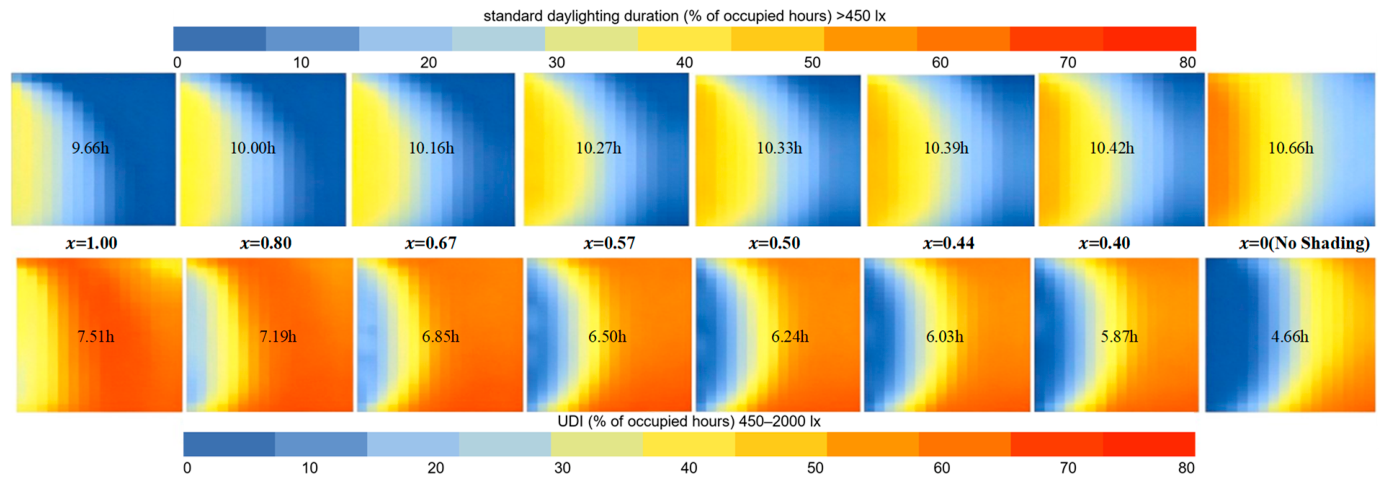
Figure 6 (top row) shows the distribution of the proportion of time when daylight illuminance exceeds the standard value of 450 lx throughout the year, while the bottom row shows the distribution of the proportion of time within the acceptable UDI range (450–2000 lx). The numbers represent the average hours at a reference height of 0.75 m. The two metrics exhibit opposite trends with respect to x: the standard daylighting duration decreases as x increases (by a maximum of 10%), whereas the UDI duration increases as x increases (by up to 40%). The implementation of baffle shading increases the proportion of UDI within the total daylighting duration, particularly improving the lighting conditions in deeper spaces.
Figure 6.
Distribution of the standard daylighting duration (top) and UDI duration (bottom) throughout the year. (numbers indicate the average hours).
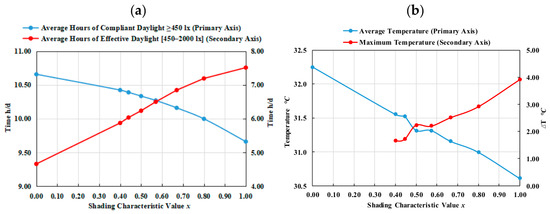
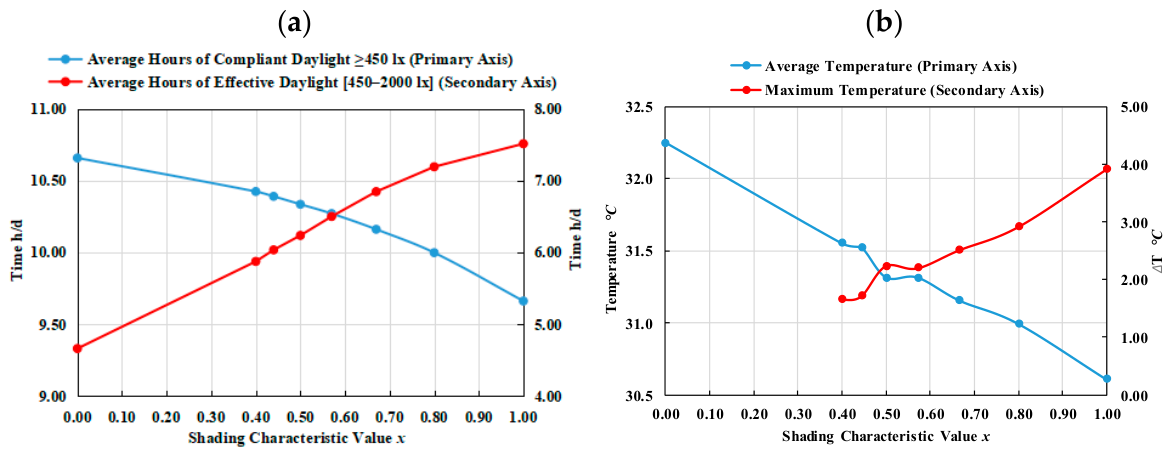
Figure 7a shows the changes in the standard daylighting duration and UDI duration as x varies. All shading configurations meet the requirements for standard daylighting (≥4 h/d). However, the standard daylighting duration decreases linearly with x, with the most significant decrease being 10%. On the other hand, the UDI duration increases linearly, with the maximum increase reaching 40%. The UDI duration accounts for a larger proportion of the total daylighting duration, improving the lighting conditions for indoor activities. Additionally, the shading device effectively mitigates excessive lighting near the window area, resulting in a more ideal indoor lighting environment.
Figure 7.
(a,b) Standard daylighting duration and UDI duration as x varies; indoor temperature and maximum temperature difference on the summer solstice as x varies.
Figure 7b depicts the changes in the average indoor temperature (main axis) and the maximum temperature difference (secondary axis) on the summer solstice day as x varies. Under free-running conditions (no HVAC operation), increasing x leads to a temperature decrease of approximately 2 °C in the average indoor temperature and a significant reduction of 4 °C in the maximum temperature. Considering the overall analysis, when x is set between 0.50 and 1.00, the cumulative solar radiation on the ground decreases and its uniformity improves. The UDI duration (450–2000 lx) exceeds 6.5 h, and the indoor average temperature decreases by 1–2 °C, while the highest temperature reduces by 2–4 °C. The use of shading devices reduces direct solar radiation but increases scattering and diffused reflection, increasing the proportion of usable light, leading to a more comfortable working environment. The baffle shading effectively mitigates excessive radiation near the window area, reducing the potential for visual discomfort associated with western exposure, thus achieving a more desirable indoor lighting environment.
3.2. Influence of Baffle Angle δ on Radiation, Daylighting, and Indoor Temperature
Considering aesthetics and practicality, the baffle is usually rotated to present a streamlined appearance and partially block direct sunlight depending on the solar azimuth angle. The baffle characteristic value x was set to 1.00 (baffle size and spacing of 1.2 m), and the baffle angle δ was adjusted from 0° to 165° with an interval of 15°, creating 12 different configurations.
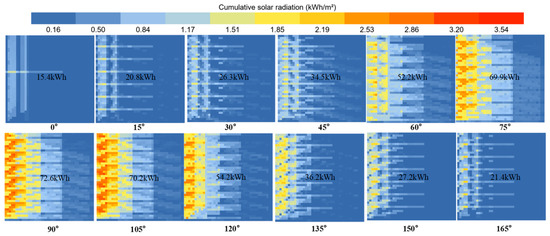
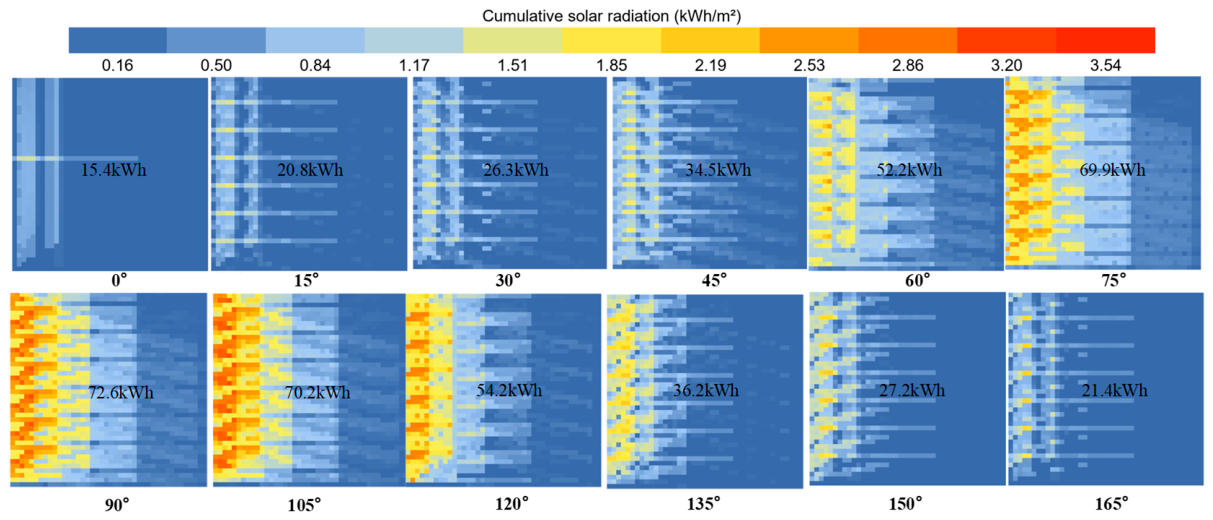
Figure 8 displays the changes in cumulative solar radiation on the ground (kWh) on the summer solstice day as the baffle angle δ varies. The cumulative solar radiation on the ground reaches its maximum value at δ = 90°, with the distribution being relatively symmetric on both sides. Symmetrically positioned at the angle range of 0–90°, the shading baffle blocks more radiation than at 90–165°, indicating that the shading capability is stronger and the sunshine hours are longer for angles less than 90°.
Figure 8.
Distribution of cumulative solar radiation on the ground (kWh) on the summer solstice day. (numbers indicate the cumulative values over the study period (kWh)).
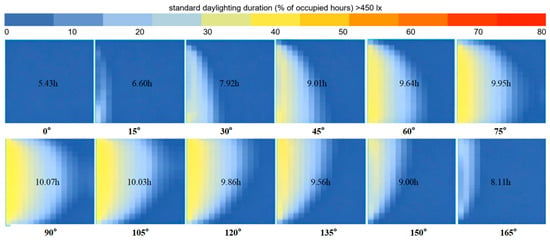
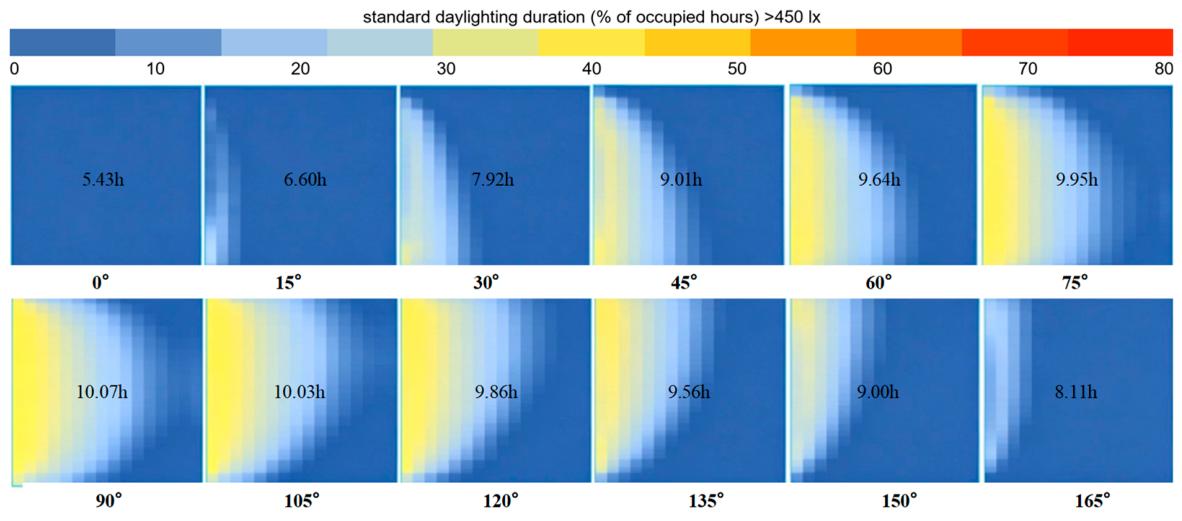
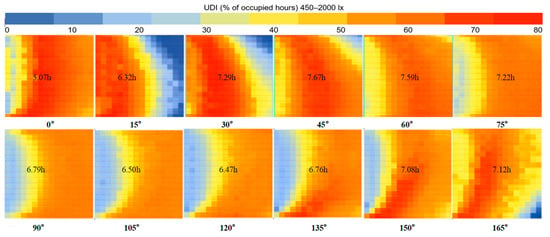
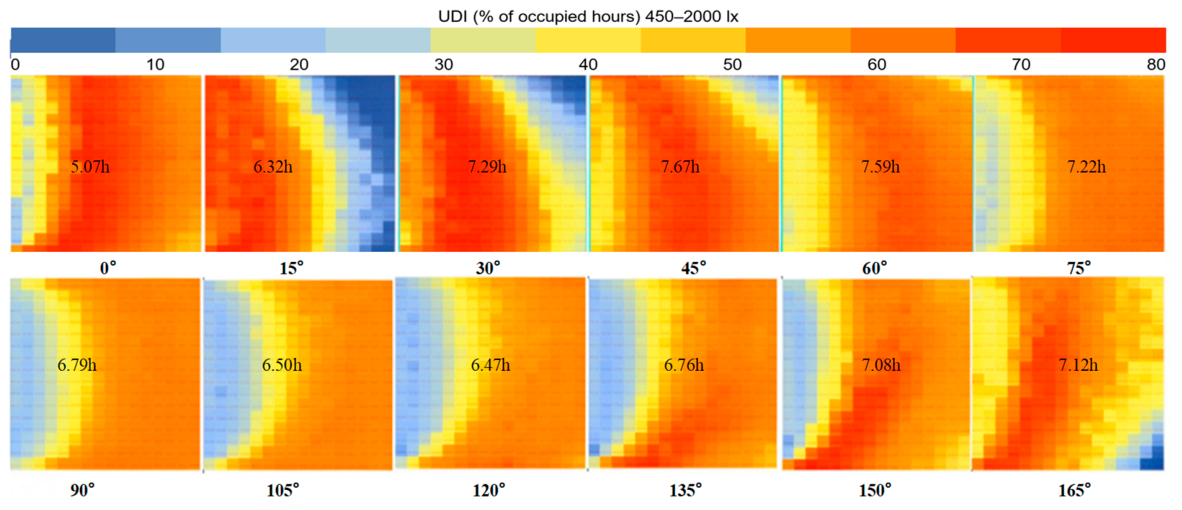
Figure 9 and Figure 10 show the annual distribution of standard daylighting and UDI throughout the year. At δ = 90°, the average hours of standard daylighting reach their maximum value, while rotating the baffle to the north and south reduces the standard daylighting duration, with similar durations observed. However, in the UDI range (450–2000 lx), the average hours increase significantly for angles from 0° to 90° compared to 90° to 180°, with the highest value appearing at δ = 45° and the lowest at 105–120°, indicating that smaller angles are more conducive to indoor activities.
Figure 9.
Annual distribution of daylight illuminance duration meeting the standard. (numbers indicate the average hours).
Figure 10.
Annual distribution of UDI, defined as the percentage of occupied hours with work-plane illuminance within the range 450–2000 lx. The equivalent mean duration (h/d) is given in the text. (numbers indicate the average hours).
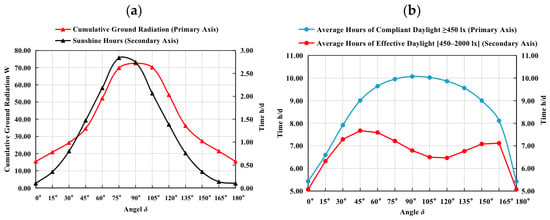
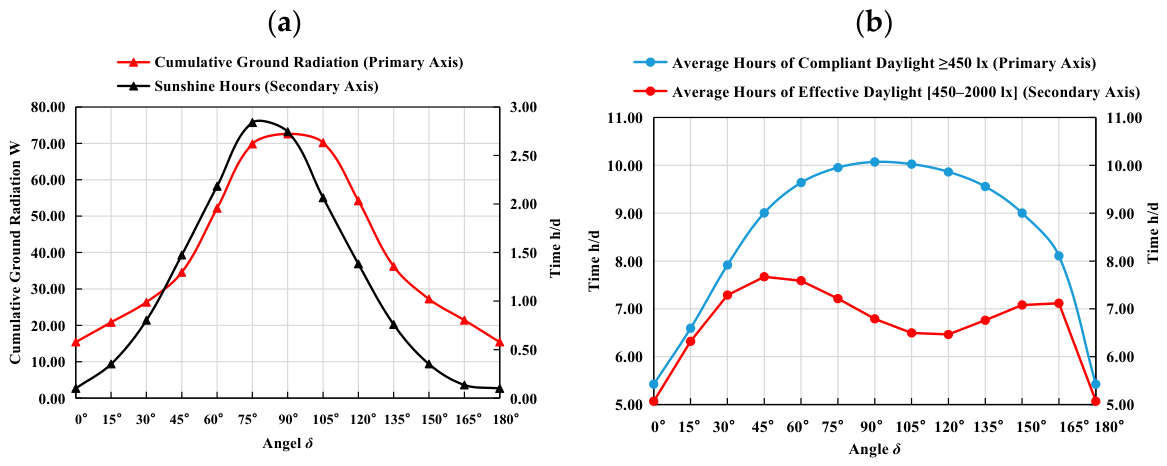
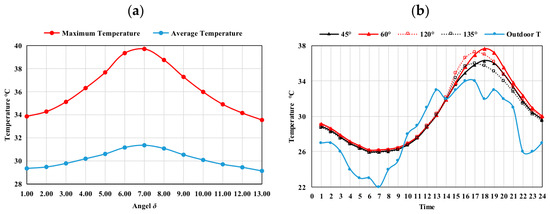
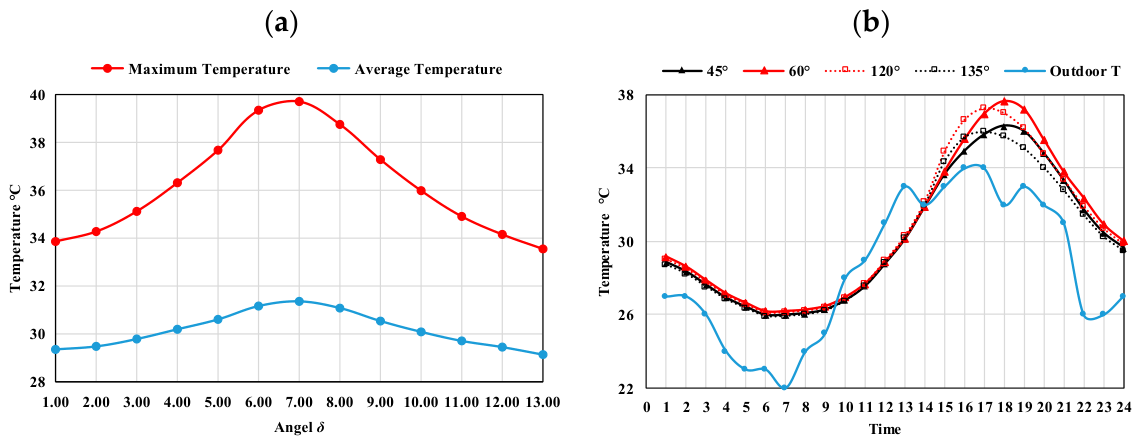
Figure 11a illustrates the variations in cumulative solar radiation and sunshine hours on the summer solstice day as δ varies, confirming the trends observed in Figure 8. Figure 12a shows the variations in indoor air temperature on the summer solstice day as δ changes. On this day, the average indoor air temperature and the highest temperature reach their maximum values at δ = 90°. At this angle, the highest temperature approaches 40 °C, while the variation in average temperature is relatively small for angles between 0° and 90°. Figure 12b compares the temperatures at angles of 60° and 120°, and 45° and 135° throughout the day. It can be observed that angles greater than 90° lead to stronger ground radiation, causing the highest temperature to be reached one hour earlier than the <90° configurations. This indicates that radiation has a rapid impact on indoor air temperature.
Figure 11.
(a,b) Changes in cumulative solar radiation and sunshine hours as the baffle angle δ varies; indoor air temperature on the summer solstice as a function of baffle angle δ.
Figure 12.
(a,b) Diurnal variation in indoor air temperature throughout the summer solstice day; standard daylighting duration and UDI duration as the baffle angle δ varies.
This finding can be explained by the solar radiation distribution on the summer solstice day (Figure 2a) and the changes in solar azimuth angle (Figure 2b). Between 14:00 and 16:00, the west-facing solar radiation is strongest, with the solar azimuth angle ranging from 196° to 258° and an average value of 231°. At this time, the baffle, when perpendicular to the incident sunlight, blocks most of the direct sunlight, with an angle δ of approximately 39°. Based on the above analysis, a baffle angle of 45° is recommended. At this angle, the cumulative solar radiation on the ground is low, the indoor temperature rises slowly, the UDI duration is longer, and the working environment indoors is more comfortable.
3.3. Influence of Baffle Arc θ on Radiation, Daylighting, and Indoor Temperature
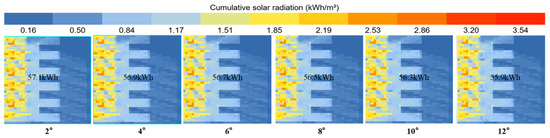
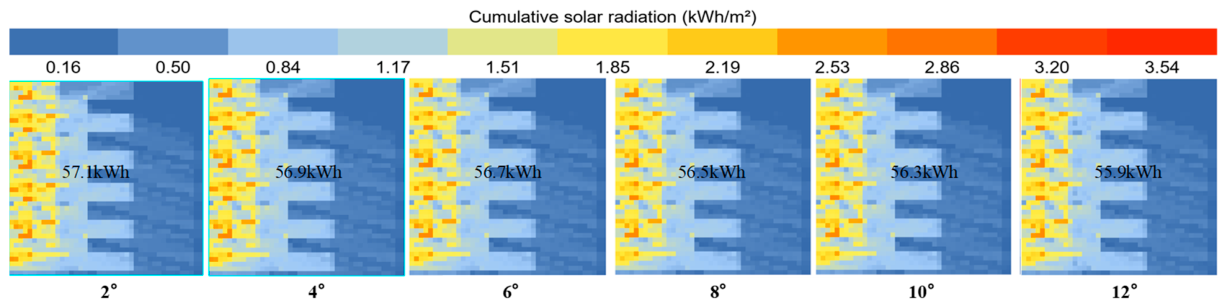
Apart from the baffle characteristic value x and baffle angle δ, the baffle arc θ is also a design parameter for baffle shading devices. By altering θ, the curvature of the shading device’s surface changes, indirectly affecting the reflection of sunlight on the surface, which influences radiation and daylighting performance. For this analysis, the baffle size A was set to 1.2 m, the baffle spacing was 1.5 m (x = 0.80), and the baffle angle was 60°. The baffle arc θ was adjusted to 2°, 4°, 6°, 8°, 10°, and 12° for a total of six configurations.
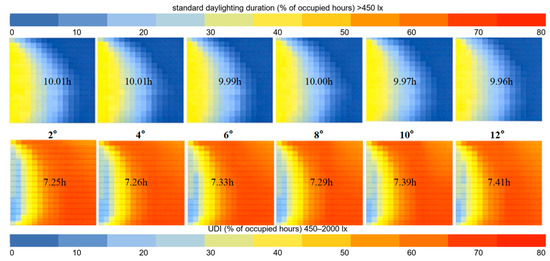
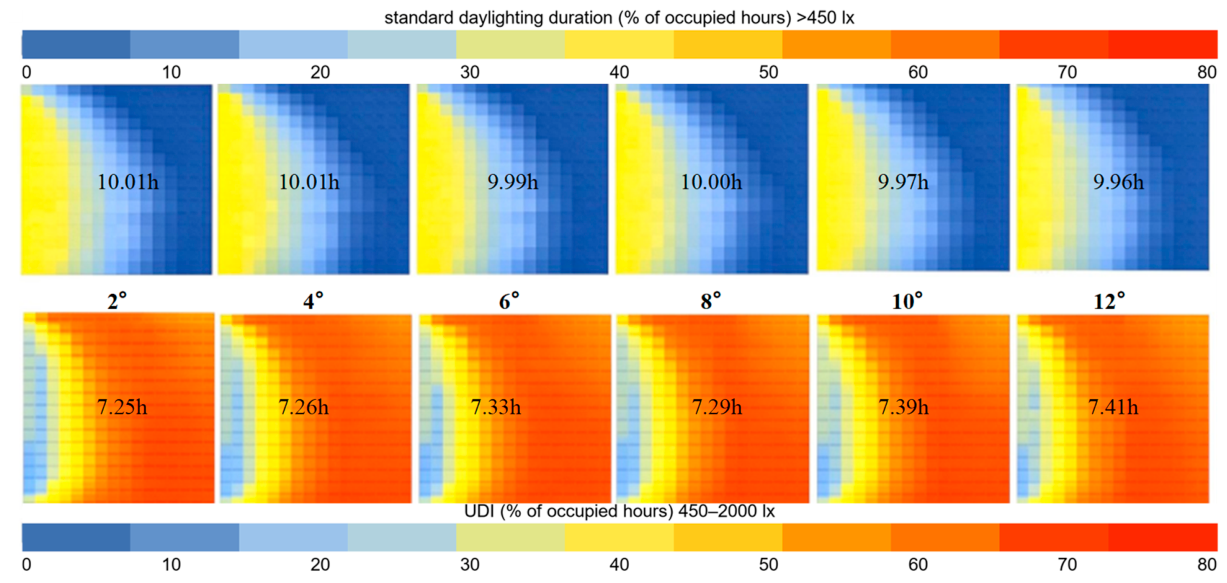
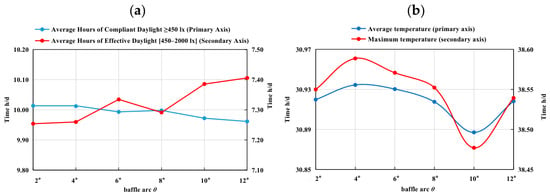
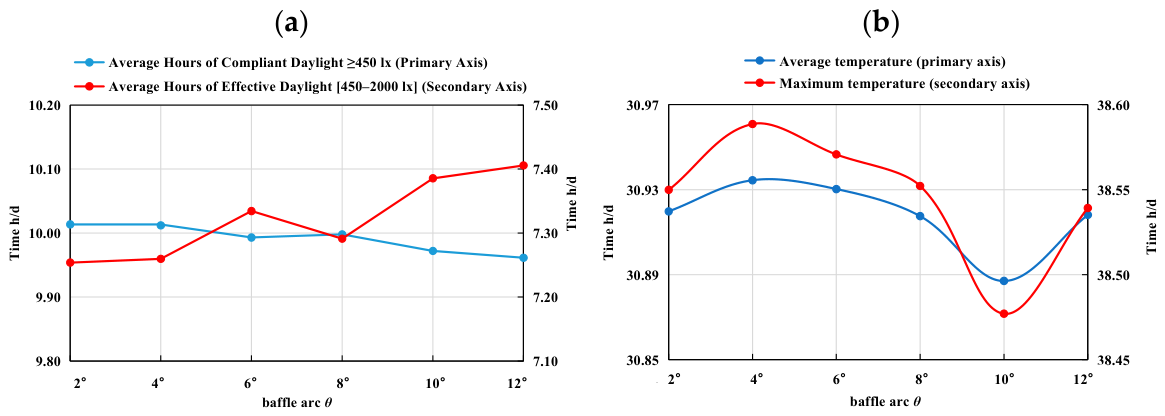
Figure 13 illustrates the variations in cumulative solar radiation on the ground (kWh) on the summer solstice day as θ changes. As θ increases, the cumulative solar radiation on the ground gradually decreases, but the reduction is less than 2%. Combined with Figure 14 and Figure 15a, which display the standard daylighting duration and UDI duration throughout the year, the average hours of standard daylighting (450 lx) decrease slightly, by only 0.5%, as θ increases. In contrast, the average hours of UDI (450–2000 lx) increase slightly, by up to 2%. Figure 15b depicts the changes in indoor air temperature on the summer solstice day, which varies little with θ. The average indoor temperature and maximum temperature both reach their highest values at θ = 4°, and the lowest values at 10°. However, the impact of changing the arc on temperature is minimal, with an average temperature difference of only 0.05 °C and a maximum temperature difference of 0.11 °C. Therefore, the baffle arc θ has a negligible influence on indoor radiation, daylighting, and temperature. An optimal value of 10° for the baffle arc provides a comparable daylighting and radiation performance, with a slight decrease in the highest temperature and a longer duration of UDI, leading to a more comfortable indoor working environment.
Figure 13.
Distribution of cumulative solar radiation on the ground (kWh) on the summer solstice. (numbers indicate the cumulative values over the study period (kWh)).
Figure 14.
Annual distribution of daylight illuminance duration meeting the standard (top) and UDI duration (bottom). (numbers indicate the average hours).
Figure 15.
(a,b) Annual duration of standard-compliant daylighting and UDI as a function of baffle arc θ; Indoor air temperature on the summer solstice as a function of baffle arc θ.
3.4. Correlation Analysis
Table 4 reports the Pearson correlation coefficients between the two parameters that dominate the performance and the six indicators. For the shading characteristic value x the correlation is strong and monotonic for every indicator, |r| ≥ 0.98 (p < 0.001), which quantifies the near-linear trends of Section 3.1 and the opposite directions of the standard daylighting duration and UDI. For the baffle angle δ the relationship is not monotonic and peaks at 90°; the coefficients are therefore computed separately over 0–90° and 90–165°, where they are +0.96 to +0.99 and −0.93 to −1.00 respectively (p < 0.01 in both ranges), confirming the maxima at 90° shown in Figure 8, Figure 9 and Figure 11b. UDI is the exception: its maximum occurs at 45° and its correlation with δ is not significant in either range. The baffle arc θ is not included, its influence being smaller than 2% (Section 3.3). The p-values given in Table 4 test whether each coefficient differs significantly from zero, that is, whether a linear association is present between the parameter and the indicator; they do not by themselves indicate the strength of that association or its design relevance, which are read from the magnitude of the coefficient. The sign of each coefficient gives the direction of the association, a negative value denoting a decrease in the indicator as the parameter increases.
Table 4.
Pearson correlation coefficients between the design parameters and the performance indicators.
4. Discussion
4.1. Comparison with Previous Studies
The findings of this study are consistent with and extend previous research on external shading performance. The observed 47% reduction in ground radiation at x = 1.00 aligns with the 10–80% solar heat gain reduction range reported by Yao et al. [10] for louver shading systems. The approximately 2 °C reduction in average indoor temperature under free-running conditions is comparable to the results of Al-Yasiri and Szabó [26], who reported indoor temperature reductions of 1–3 °C through building envelope modifications in a harsh summer climate. The UDI improvement of up to 40% through shading implementation is consistent with the findings of Khidmat et al. [11], who achieved approximately 50% UDI improvement using expanded-metal shading with multi-objective optimization in Japan, and with Taveres-Cachat and Goia [16], who validated similar performance gains through experimental testing of louvred shading systems.
However, this study differs from previous work in several important aspects. First, while many studies focus on hot-summer or subtropical climates, this study addresses the cold climate zone of northwestern China, where the seasonal trade-off between summer cooling and winter heating presents distinct design challenges. Second, the identification of δ = 45° as the optimal baffle angle—rather than the perpendicular (90°) orientation commonly recommended—provides a novel insight specific to west-facing facades in cold regions. Third, the finding that the baffle arc (θ) has negligible impact simplifies the design process, allowing architects to prioritize aesthetic considerations for this parameter without compromising performance.
4.2. Physical Mechanisms and Parameter Interactions
The parametric analysis reveals distinct physical mechanisms governing each parameter’s influence. The shading characteristic value x directly controls the ratio of baffle length to spacing, determining the fraction of direct solar radiation intercepted. The near-linear relationship between x and ground radiation confirms that the primary mechanism is geometric occlusion, with minimal complex optical interactions. The baffle angle δ influences performance through two mechanisms: (1) changing the projected area of the baffle relative to incident sunlight, and (2) altering the reflection path of solar rays. The optimal δ = 45° corresponds to the angle at which the baffle is most effective at blocking the predominant western solar radiation between 14:00 and 16:00 (solar azimuth 196–258°), while still allowing sufficient diffuse daylight penetration. The baffle arc θ affects only the reflection characteristics of the louver surface, and its minimal impact suggests that the reflection geometry changes are insufficient to significantly alter the overall energy balance.
It should be noted that the three parameters were analyzed independently in this study. In practice, parameter interactions may exist—for example, the optimal baffle angle may vary with different x values. Future research should employ factorial or orthogonal experimental designs to capture these interaction effects, potentially using multi-objective optimization algorithms such as NSGA-II to identify Pareto-optimal solutions [11].
4.3. Implications for Sustainable Building Design in Low- and Middle-Income Countries
The results of this study have significant implications for sustainable building design in low- and middle-income countries, where rapid urbanization and limited resources necessitate cost-effective, scalable energy-saving solutions. The recommended baffle shading configuration (x ≥ 0.50, δ = 45°) requires only simple vertical louver elements that can be fabricated from locally available materials (aluminum, steel, or even timber) and installed without specialized equipment. This low-technology approach aligns with the principles of appropriate technology for sustainable development [4,17].
In the context of China’s “Dual Carbon” goals and the 2024 Action Plan for Building Energy Conservation, the findings support the policy mandate for passive design integration in public buildings. The 2 °C indoor temperature reduction achieved through shading alone can significantly reduce cooling loads during summer months, contributing to the national target of completing 2 billion m2 of existing building energy retrofits by 2025 [8]. Furthermore, the UDI improvement enhances indoor environmental quality in educational buildings, supporting SDG 4 (Quality Education) through improved learning environments. The methodology presented here—combining freely available parametric tools (Ladybug/Honeybee) with systematic parameter variation—can be readily adopted by designers and policymakers in other low- and middle-income countries with similar climate conditions, supporting the broader SDG 11 agenda for sustainable cities.
4.4. Economic Analysis and Policy Implications
The economic viability of the recommended shading solution is a critical factor for adoption in low- and middle-income countries. Based on Wu and Lei [9], the investment in external shading devices typically accounts for less than 2% of total building construction costs. For a standard classroom with a west-facing facade, the estimated cost of aluminum vertical louvers (including installation) is approximately 300–500 CNY/m2 of window area. Wu and Lei [9] report that facade shading can contribute 10–24% of total building energy savings, a range that depends strongly on shading typology, climate zone and end-use composition. For the case-study classroom, the annual energy simulations conducted in this study yield a project-specific saving of 10.5%, alongside the 2 °C temperature reduction. The literature range refers to total building energy savings, whereas the value obtained here comprises the cooling and heating terms only; the comparison is therefore indicative of magnitude rather than strictly like-for-like. A simple payback period is deliberately not reported here. Its value depends on three inputs that lie outside the scope of this study—the unit cost of the louvers as actually procured, the local electricity tariff, and the coefficient of performance and operating schedule of the heating and cooling plant—so that any figure quoted for a single case-study classroom would be indicative at best and would not survive a change in assumptions. The cost-effectiveness argument is therefore stated in terms of quantities that can be checked directly: the incremental investment intensity (300–500 CNY per m2 of window area, i.e., less than 2% of total construction cost) and the simulated annual saving of 10.5% reported above. A project-specific payback calculation would require sub-metered cooling and heating energy use over at least one full year, which is identified as a task for future work in Section 4.5.
From a policy perspective, these findings support the integration of mandatory shading design requirements into building energy codes for cold climate regions, complementing the existing prescriptive standards in GB 50189-2015 [24]. The parametric analysis approach demonstrated in this study could be adopted as a design verification tool in the building permit approval process, ensuring that new constructions meet minimum daylighting and thermal performance thresholds. Additionally, the results contribute to the evidence base needed for green building certification systems in low- and middle-income countries, where performance-based design verification is increasingly demanded but often lacks region-specific design guidelines.
4.5. Limitations and Future Research
Several limitations qualify these results. The analysis covers a single orientation (west) in one climate zone, and the parameters were varied independently, so interaction effects were not explored. Indoor temperatures were simulated under free-running conditions with infiltration only, without ventilation. The validation of Section 2.4 rests on a three-day campaign at a single facade and covers the shading and thermal branch only; the daylight results were not compared with measurements. Because the radiation and thermal analyses were carried out for the summer solstice, when the shading benefit is greatest, the winter heating penalty is not captured in the parametric results: in a cold climate, shading that reduces beneficial winter solar gains can raise heating demand, and the net annual effect depends on the balance between cooling savings and the heating penalty [9,18]. The annual simulations of Section 4.4 address that balance, but for a single case-study classroom and under the assumptions listed there.
Two aspects of shading design also lie outside the scope of this study. The metrics used here address solar radiation, horizontal work-plane illuminance and air temperature, and therefore do not quantify glare or the quality of the view. A high value of UDI indicates adequate illuminance at the working plane, but says nothing about the vertical luminance distribution that governs glare [27], how legible the outside scene remains through the shading element [28], or the content and aesthetic quality of the view, which view-quality frameworks assess separately from its clarity [29]. A fixed baffle also reduces view clarity permanently, whereas the benefit is confined to the hours of high solar gain, and the privacy requirement that shading serves constrains how open the element may be left [30]. Two features of the configuration do favour the view: the vertical elements intercept the low late-afternoon sun of a west facade, which horizontal elements cannot, and at x ≥ 0.50 the clear gap between adjacent baffles is at least twice the baffle depth. The residual loss of clarity and the visual expression of the shading element as part of the facade were not assessed, and alternatives that restore view clarity when shading is not required, such as movable or perforated elements and switchable blinds [31], remain to be evaluated.
Future work should extend the analysis to other orientations and climate zones, apply factorial designs to capture parameter interactions, and couple the parametric study with multi-objective optimization; illuminance measurements, multi-year sub-metering of cooling and heating energy, and a life-cycle assessment of the shading materials would extend the validation and complete the sustainability evaluation.
5. Conclusions
This study presents a systematic parametric analysis of baffle external shading for a west-facing educational building in Xianyang, China, a cold climate region representative of rapidly urbanizing areas in low- and middle-income countries. Three key shading design parameters—shading characteristic value (x), baffle angle (δ), and baffle arc (θ)—were evaluated for their effects on solar radiation, useful daylight illuminance (UDI), and indoor temperature. The principal findings and their implications for sustainable development are as follows:
(1) The shading characteristic value x is the primary determinant of shading performance. At x ≥ 0.50, ground radiation is reduced by up to 47%, UDI duration exceeds 6.5 h/d, and the average indoor temperature decreases by approximately 2 °C under free-running conditions. This parameter should be prioritized in baffle shading design for west-facing facades in cold climate regions, subject to the summer-condition scope noted below.
(2) The baffle angle δ significantly influences radiation, daylighting, and thermal performance. A recommended angle of 45° provides an optimal balance between solar heat gain reduction and daylight penetration, outperforming the commonly assumed perpendicular (90°) orientation. This finding is specific to west-facing facades where the predominant afternoon solar azimuth aligns with the 45° baffle position.
(3) The baffle arc θ has a negligible impact on all three performance indicators (<2% variation), allowing architects to freely determine this parameter based on aesthetic considerations without compromising energy performance.
(4) The recommended shading configuration (x ≥ 0.50, δ = 45°) achieves simulated annual energy savings of 10.5% for the case-study classroom, comparable in magnitude to the 10–24% reported for total building energy savings from facade shading [9], for an incremental investment of less than 2% of total construction cost. This cost-effectiveness makes it particularly suitable for widespread adoption in low- and middle-income countries where budget constraints often limit the implementation of energy-efficient technologies.
(5) The findings support China’s “Dual Carbon” goals and the 2024 Action Plan for Building Energy Conservation by providing quantitative design guidelines for passive cooling in public buildings. The methodology and results are transferable to other low- and middle-income countries with similar cold climate conditions, contributing to SDG 7 (Affordable and Clean Energy), SDG 11 (Sustainable Cities), and SDG 13 (Climate Action).
The baffle external shading approach demonstrated in this study offers a practical, scalable, and cost-effective passive design strategy for sustainable building development. By integrating parametric modeling with freely available simulation tools, the proposed design methodology can be readily adopted by architects, engineers, and policymakers in low- and middle-income countries to optimize building energy performance without significant financial investment. Future research should extend this framework to multiple climate zones and orientations, incorporate parameter interaction effects through multi-objective optimization, and validate findings through on-site measurements.
Author Contributions
Conceptualization, J.C. (Jie Cai) and X.M.; methodology, J.C. (Jie Cai); software, J.C. (Jie Cai); validation, Y.Z. and J.C. (Jichao Cai); formal analysis, J.C. (Jie Cai); investigation, M.Z.; resources, X.M.; data curation, M.Z.; writing—original draft preparation, J.C. (Jie Cai); writing—review and editing, Y.Z.; visualization, J.C. (Jichao Cai); supervision, X.M.; project administration, X.M.; funding acquisition, X.M. All authors have read and agreed to the published version of the manuscript.
Funding
This research was funded by the Young Elite Scientists Sponsorship Program of Shaanxi Association for Science and Technology (Grant No. 2026clgc28); the Central Guidance for Local Science and Technology Development Fund (Grant No. 2026ZY1-GCZH-33); the Sanqin Talents Special Support Program for Innovation and Entrepreneurship Team Project (Building Sustainable Technology Innovation Team of China Northwest Architecture Design and Research Institute Co., Ltd.); the China State Construction Engineering Corporation Science and Technology Research and Development Project (Grant Nos. CSCEC-2026-Z-53 and CSCEC-2026-Z-45); and the Key Research and Development Program of Shaanxi Province (Grant No. 2024SF-ZDCYL-05-09).
Data Availability Statement
The simulation data and parametric models used in this study are available from the corresponding author upon reasonable request. The weather data (EPW file for Xianyang) was obtained from the Chinese Standard Weather Data (CSWD) database as the 15-year average of the 2007–2021 record.
Acknowledgments
The authors acknowledge the China Northwest Architectural Design and Research Institute Co., Ltd. for providing the computational resources and technical assistance necessary for this study, and thank Zhenhong Zheng and Yingsha Lu of the same institute for their technical support on architectural aesthetics and for providing performance benchmarks and reference cases.
Conflicts of Interest
Author Min Zhao was employed by the company Shaanxi Building Environment and Energy Engineering Technology Research Center, China Northwest Architectural Design and Research Institute Co., Ltd., Xi’an, China. The remaining authors declare that the research was conducted in the absence of any commercial or financial relationships that could be construed as a potential conflict of interest.
References
- United Nations Environment Programme. 2021 Global Status Report for Buildings and Construction: Towards a Zero-Emission, Efficient and Resilient Buildings and Construction Sector; UNEP: Nairobi, Kenya, 2021. [Google Scholar]
- Ma, Z.; Arıcı, M.; Sun, Y.; Singh, S.; Shahsavar, A. Towards net-zero energy/emission buildings for sustainable development. Energy Sustain. Dev. 2024, 80, 101448. [Google Scholar] [CrossRef] [Scilit]
- Elaouzy, Y.; El Fadar, A. Impact of key bioclimatic design strategies on buildings’ performance in dominant climates worldwide. Energy Sustain. Dev. 2022, 68, 532–549. [Google Scholar] [CrossRef] [Scilit]
- Kebir, N.; Miranda, N.D.; Sedki, L.; Hirmer, S.; McCulloch, M. Opportunities stemming from retrofitting low-resource East African dwellings by introducing passive cooling and daylighting measures. Energy Sustain. Dev. 2022, 69, 179–191. [Google Scholar] [CrossRef] [Scilit]
- Wang, S.; Sun, S.; Zhao, E.; Wang, S. Regional variation in the drivers of China’s residential electricity consumption (REC) and policy orientation. Energy Sustain. Dev. 2022, 67, 112–124. [Google Scholar] [CrossRef] [Scilit]
- Gu, M.; Lu, S.; Guo, Q.; Shen, C.; Li, L. A numerical investigation of energy-saving potential of inner solarshade film: A case study of the National Aquatics Center, China. Energy Sustain. Dev. 2022, 67, 54–66. [Google Scholar] [CrossRef] [Scilit]
- Ministry of Housing and Urban-Rural Development of China. 14th Five-Year Plan for Building Energy Efficiency and Green Building Development; MOHURD: Beijing, China, 2022. [Google Scholar]
- State Council of China. Action Plan for Accelerating Energy Conservation and Carbon Reduction in the Building Sector (Guo Ban Han [2024] No. 20); State Council: Beijing, China, 2024. [Google Scholar]
- Wu, W.; Lei, C. Optimization study on heat transfer coefficient and shading coefficient of energy-saving windows in residential buildings in hot-summer and cold-winter regions. Wall Mater. Innov. Build. Energy Sav. 2010, 2, 47–49. [Google Scholar] [CrossRef]
- Yao, L.; Wang, W.; Li, X.; Chao, L.; Bo, Z. Comprehensive analysis of key issues in external window shading design. Chongqing Archit. 2021, 20, 39–41. [Google Scholar]
- Khidmat, R.P.; Fukuda, H.; Kustiani; Paramita, B.; Qingsong, M.; Hariyadi, A. Investigation into the daylight performance of expanded-metal shading through parametric design and multi-objective optimisation in Japan. J. Build. Eng. 2022, 51, 104241. [Google Scholar] [CrossRef] [Scilit]
- Jakubiec, J.A. The Use of Visual Comfort Metrics in the Design of Daylit Spaces. Doctoral Dissertation, Massachusetts Institute of Technology, Cambridge, MA, USA, 2014. [Google Scholar]
- Bian, Y.; Ma, Y. Subjective survey & simulation analysis of time-based visual comfort in daylit spaces. Build. Environ. 2018, 131, 63–73. [Google Scholar] [CrossRef] [Scilit]
- Athienitis, A.K.; Tzempelikos, A. A methodology for simulation of daylight room illuminance distribution and light dimming for a room with a controlled shading device. Sol. Energy 2002, 72, 271–281. [Google Scholar] [CrossRef] [Scilit]
- Manzan, M.; Padovan, R. Multi-criteria energy and daylighting optimization for an office with fixed and moveable shading devices. Adv. Build. Energy Res. 2015, 9, 238–252. [Google Scholar] [CrossRef] [Scilit]
- Taveres-Cachat, E.; Goia, F. Co-simulation and validation of the performance of a highly flexible parametric model of an external shading system. Build. Environ. 2020, 182, 107111. [Google Scholar] [CrossRef] [Scilit]
- Mujeebu, M.A.; Bano, F. Energy-saving potential and cost-effectiveness of active energy-efficiency measures for residential building in warm-humid climate. Energy Sustain. Dev. 2022, 67, 163–176. [Google Scholar] [CrossRef] [Scilit]
- Mao, Y.; Si, Y.; Zhao, L. Research on the influence of shading on energy-saving rate of residential buildings in Guangzhou and its optimal design. City Archit. 2021, 18, 28. [Google Scholar] [CrossRef]
- Liu, J.; Bi, G.; Zhao, L. Simulation study on BIPV shading louver system for office buildings in Guangzhou. Build. Energy Effic. 2022, 50, 9. [Google Scholar]
- Hong, Y.; Lü, Y.; Xiao, Y. Research on parametric integrated design and optimization method of building external shading based on Lingnan regional characteristics. In Proceedings of the 2018 National Conference on Digital Technology in Architecture Education and DADA International Conference on Digital Architecture, Xi’an, China, 15–16 September 2018. [Google Scholar]
- GB 50176-2016; Code for Thermal Design of Civil Building. China Architecture & Building Press: Beijing, China, 2016.
- Reinhart, F.C.; Mardaljevic, J.; Rogers, Z. Dynamic daylight performance metrics for sustainable building design. Leukos 2006, 3, 1–25. [Google Scholar] [CrossRef] [Scilit]
- Zhou, B.; Dong, Y. Verification of simulation accuracy of Ladybug and Honeybee for natural daylighting performance. In Proceedings of the 2017 National Conference on Digital Technology in Architecture Education and DADA 2017 International Conference on Digital Architecture, Nanjing, China, 9–10 September 2017. [Google Scholar]
- GB 50189-2015; Design Standard for Energy Efficiency of Public Buildings. China Architecture & Building Press: Beijing, China, 2015.
- GB 50033-2013; Standard for Daylighting Design of Buildings. China Architecture & Building Press: Beijing, China, 2013.
- Al-Yasiri, Q.; Szabó, M. Building envelope-combined phase change material and thermal insulation for energy-effective buildings during harsh summer: Simulation-based analysis. Energy Sustain. Dev. 2023, 72, 326–339. [Google Scholar] [CrossRef] [Scilit]
- Wienold, J.; Christoffersen, J. Evaluation methods and development of a new glare prediction model for daylight environments with the use of CCD cameras. Energy Build. 2006, 38, 743–757. [Google Scholar] [CrossRef] [Scilit]
- Konstantzos, I.; Chan, Y.-C.; Seibold, J.C.; Tzempelikos, A.; Proctor, R.W.; Protzman, J.B. View clarity index: A new metric to evaluate clarity of view through window shades. Build. Environ. 2015, 90, 206–214. [Google Scholar] [CrossRef] [Scilit]
- Ko, W.H.; Kent, M.G.; Schiavon, S.; Levitt, B.; Betti, G. A window view quality assessment framework. Leukos 2022, 18, 268–293. [Google Scholar] [CrossRef] [Scilit]
- Abdelwahab, S.; Kent, M.G.; Mayhoub, M. Users’ window preferences and motivations of shading control: Influence of cultural characteristics. Build. Environ. 2023, 240, 110455. [Google Scholar] [CrossRef] [Scilit]
- Bian, Y.; Chen, Y.; Sun, Y.; Ma, Y.; Yu, D.; Leng, T. Simulation of daylight availability, visual comfort and view clarity for a novel window system with switchable blinds in classrooms. Build. Environ. 2023, 235, 110243. [Google Scholar] [CrossRef] [Scilit]

Disclaimer/Publisher’s Note: The statements, opinions and data contained in all publications are solely those of the individual author(s) and contributor(s) and not of MDPI and/or the editor(s). MDPI and/or the editor(s) disclaim responsibility for any injury to people or property resulting from any ideas, methods, instructions or products referred to in the content. |
© 2026 by the authors. Licensee MDPI, Basel, Switzerland. This article is an open access article distributed under the terms and conditions of the Creative Commons Attribution (CC BY) license.