


Abstract
To support design-consistent modeling of large-span trusses from field scans, this study aims to develop and evaluate a workflow guided by CAD priors for isolating load-bearing members and completing structural topology in severely occluded regions. A semantic segmentation algorithm based on voxel spatial indexing and two-stage neighborhood matching first uses the CAD model to discretize the search space and isolate main load-bearing trusses from cluttered backgrounds. On a manually labeled subset of 339,075 measured points from 12 representative regions, the segmentation stage achieves an F1-score of 85.65% and an IoU of 74.91%. A point cloud fusion and completion algorithm then combines distance-weighted iterative closest point registration with region-growing hierarchical mapping to reconstruct design-consistent point sets in shadowed node regions. The workflow is evaluated on the Zhongyuan International Convention and Exhibition Center. It achieves a normalized Chamfer distance of 0.53% and a normalized Hausdorff distance of 1.16% relative to the CAD reference. Under a 50 mm evaluation tolerance, the F-Score is 20.02%, more than twice the best traditional baseline, although the modest absolute value indicates limited strict-tolerance agreement. The output provides researchers, engineers, decision-makers, and asset managers with a traceable basis for digital-twin model preparation, inspection planning, and topology-aware documentation; CAD-derived points must nevertheless remain distinguishable from measured data in deformation monitoring and structural assessment.
1. Introduction
Large-span spatial structures play a core role in modern infrastructure and urban development. Ensuring their structural safety during complex construction processes and long-term operation is of paramount importance. As these structures face multiple factors throughout their service life, their performance status often exhibits significant uncertainty [1,2,3]. Therefore, there is an urgent need to acquire real-time structural responses using structural health monitoring (SHM) technologies to provide scientific guidance. In recent years, mobile 3D laser scanning systems integrating simultaneous localization and mapping (SLAM) and Global Navigation Satellite System Real-Time Kinematic (GNSS RTK) positioning have emerged as a cutting-edge method for capturing the as-built spatial geometry of large-scale buildings [4]. This is largely due to their high efficiency, non-contact nature, and large-area coverage. However, rapidly and accurately converting the massive, unstructured point clouds acquired via mobile scanning into traceable structural geometric models remains a fundamental bottleneck in the digital construction and operation and maintenance of large-span spatial structures [5,6].
During the transition from raw point cloud data to structured models, the semantic segmentation of target components [7,8,9] and the design-consistent completion of missing geometry [10,11] are two critical challenges that require urgent resolution. On one hand, the on-site scanning environment for large-span spatial trusses is extremely complex. The raw point clouds contain not only the main trusses and A-shaped columns but are also cluttered with massive redundant data [12,13,14]. Accurately identifying and isolating the main load-bearing skeleton from such massive, unstructured data with complex backgrounds is highly challenging. On the other hand, due to the geometric complexity of spatial trusses, dense occlusion at member intersections, and the limitations of on-site mobile scanning angles, the initially extracted main truss point clouds often suffer from severe sparsity [15] or even large-area data loss [16] in shadowed node regions and elevation transitions. If 3D geometric reconstruction is performed directly based on such incomplete data, it inevitably leads to structural topological connection errors and local geometric boundary distortions, fundamentally undermining the reliability of subsequent structural deformation inversion and performance evaluation [17,18,19].
Existing studies and conventional data-processing methods still exhibit limitations when applied to large, complex spatial structures [20,21,22]. For point cloud semantic segmentation, recent work has emphasized scene-level feature extraction and multimodal guidance. Wei (2024) [23] used cross-modal 2D-3D guidance and region-point semantic consistency and reported 46.9% mean intersection over union (mIoU) on the ScanNet v2 validation set under scene-level supervision, an 8.8 percentage-point improvement over the 38.1% comparison result. Wu (2025) [24] proposed TBGA-Net to capture long-range global information. These benchmark results quantify recent progress, although methods relying mainly on local surface geometry can still misclassify members when periodic structural undulations and overlapping components have similar features [24,25]. For point cloud completion, research has progressed from local geometric interpolation to learning-based structural inference. Wu (2024) [26] introduced HSG-Net with iterative heuristic structure growth, and Xiao (2024) [27] developed Cross-PCC to combine 2D and 3D information under single-view guidance. On the 3D-EPN and PCN object benchmarks, Cross-PCC reported average L2 Chamfer distances of 9.1 × 10⁻⁴ and 9.9 × 10⁻⁴, respectively [27]. These values provide numerical context for current completion research, but they are not directly comparable with field-scale truss results because the datasets, missing-region patterns, normalization, and evaluation tolerances differ. Severe occlusion in spatial trusses can remove entire joints or members; without a reliable global topological constraint, completion boundaries may blur [28] and intersecting members may be geometrically distorted [29].
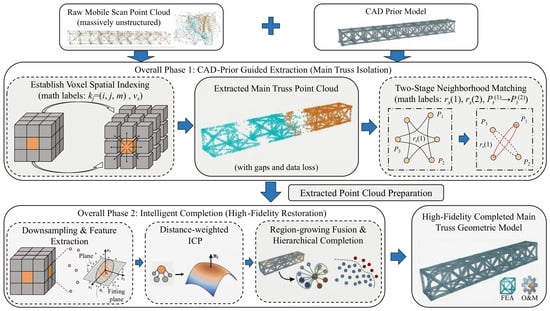
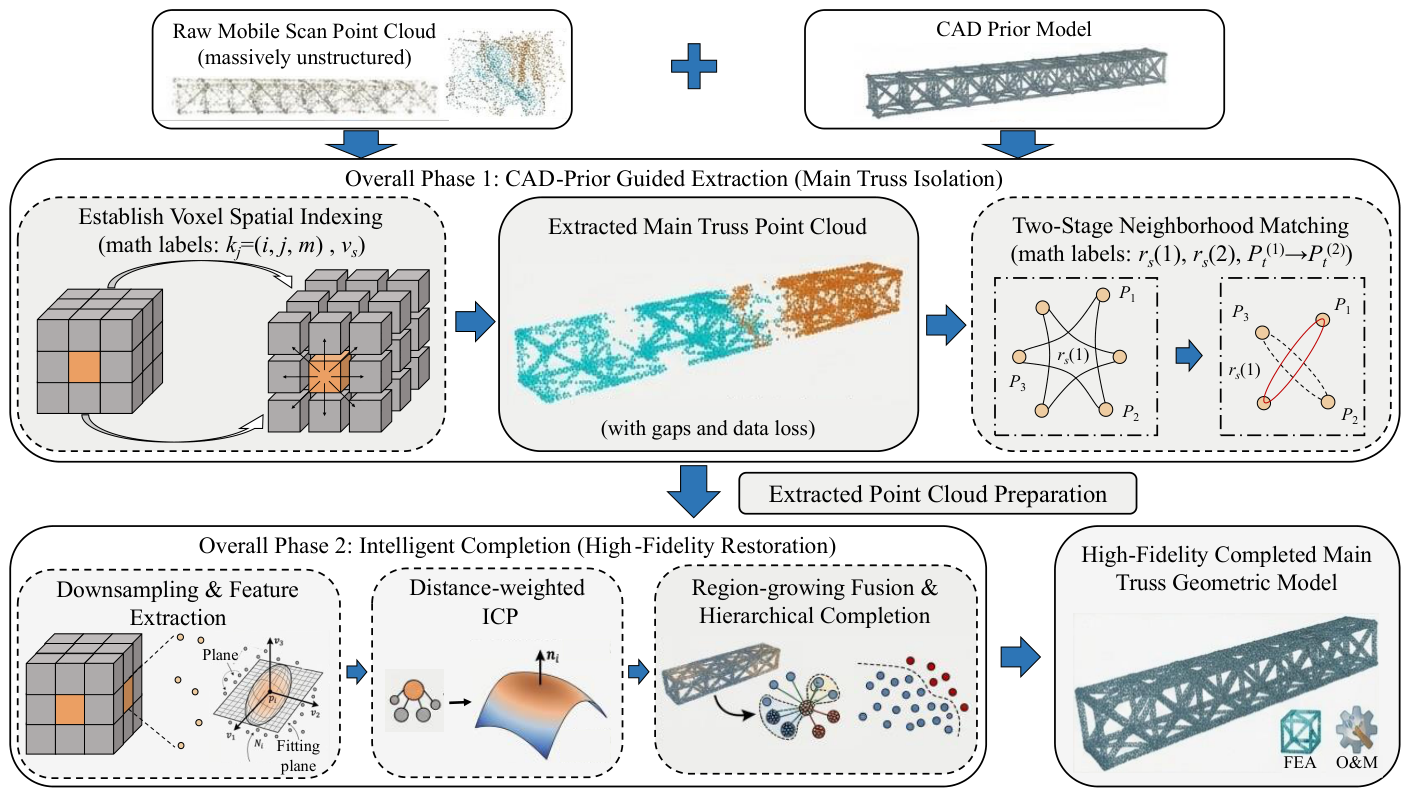
To overcome the data-conversion bottleneck in the digital modeling of complex spatial trusses, this paper proposes a workflow guided by CAD priors for main truss semantic segmentation and point cloud completion. As shown in Figure 1, the workflow contains two linked stages. First, voxel spatial indexing and two-stage neighborhood matching use the CAD model to constrain the search space and isolate the main truss from the field point cloud. Second, distance-weighted registration and region-growing fusion use the member arrangement encoded by the CAD model to generate design-consistent point sets in missing regions. The resulting output is intended to preserve member continuity and topology for model preparation and visualization, rather than to infer unobserved as-built deformation.
Figure 1.
Framework of the CAD-prior-guided point cloud semantic segmentation and completion method.
The completed points should therefore be interpreted as CAD-constrained geometric imputation, not as direct observations of the as-built surface. In shadowed or occluded regions, the procedure restores design-consistent topology and member continuity, but any unknown local deformation or construction deviation may be masked by the CAD prior. For deformation monitoring, only measured points (and independently surveyed control points, where available) should be used for displacement estimation; CAD-derived completed points should be explicitly flagged and excluded or assigned lower confidence. The present method is consequently most appropriate for topology recovery, visualization, and model preparation, rather than for inferring unobserved deformation. Accordingly, this study asks whether CAD geometric priors can improve target-truss isolation and design-consistent completion, relative to conventional feature-based segmentation and geometric completion baselines, for field-scale point clouds with severe occlusion. The working hypothesis is that CAD-guided spatial indexing, registration, and fusion reduce design-reference deviations and preserve structural topology, while CAD-imputed regions cannot recover unknown as-built deformation that was not measured.
2. Semantic Segmentation Algorithm for Point Clouds Based on CAD Priors and Voxel Matching
Due to the massive scanning scale and the extreme geometric complexity of the spatial structure, which encompasses main trusses, herringbone columns, purlins, and secondary trusses, isolating component point clouds from the raw data poses significant challenges [30,31,32]. To achieve target-oriented isolation, this study proposes a novel semantic segmentation algorithm based on voxel spatial indexing and two-stage neighborhood matching.
2.1. Establishment of Voxel Spatial Indexing
Traditional point cloud comparison algorithms typically rely on direct Euclidean distance searches. For massive point clouds containing hundreds of millions of points, this global search method incurs immense computational redundancy, rendering real-time engineering processing unfeasible. To alleviate this, a voxelized spatial indexing mechanism is introduced [33]:
where nc represents the total number of points in the CAD model. The three-dimensional space is then discretized into a voxel grid with a defined voxel size vs, and the voxel index for each point is defined as
Consequently, the subset of points contained within each discrete voxel is expressed as
The voxel size is set to vs = 0.1 m because it is smaller than the characteristic transverse scale of the truss members while remaining large enough to aggregate neighboring scan samples. A maximum of Nv = 5 representative points is retained per occupied voxel so that densely sampled surfaces do not dominate the lookup, while sufficient local samples remain to represent surface variation. Decreasing vs or increasing Nv retains more detail but raises memory and search costs; increasing vs or reducing Nv can merge thin features or underrepresent sparsely sampled surfaces. The adopted values were selected from the member scale and measured point spacing of the present dataset and should be retuned for structures with different member dimensions or scan densities.
Furthermore, to ensure computational concentration and geometric validity, the discretized spatial boundary is defined to exclude non-structural regions (e.g., ground, temporary equipment, or peripheral walls):
2.2. Two-Stage Neighborhood Matching Mechanism
The core principle of the point cloud matching is to determine whether a measured point pj = (xj, yj, zj) geometrically overlaps with the local neighborhood of a CAD model point pi ∈ Pc within a specific distance constraint:
If the constraint is satisfied, pj is classified as belonging to the component. To balance processing speed and semantic segmentation precision, a two-stage screening mechanism is designed:
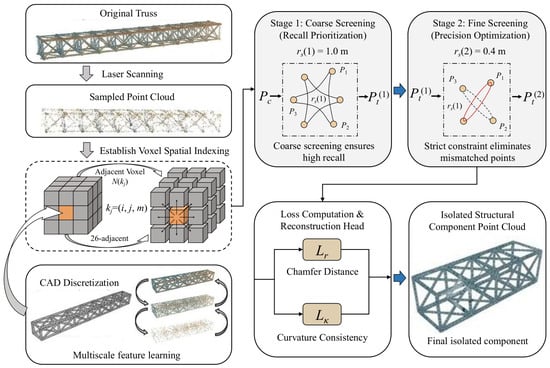
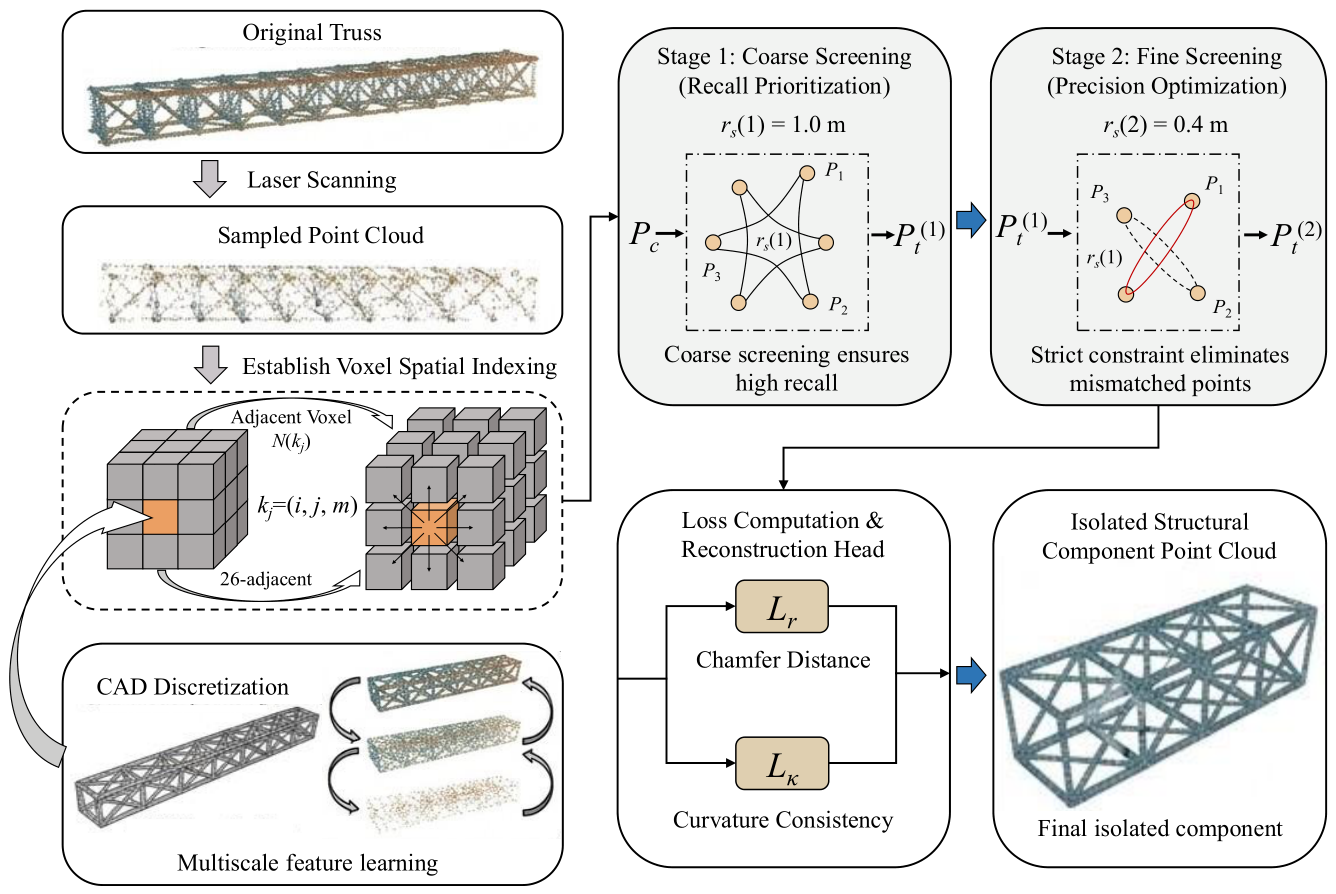
Stage 1: Coarse Screening (Recall Prioritization). In the initial stage, a relatively large search radius, rs(1) = 1.0 m, is applied to capture the entirety of the truss structure. Because the preprocessed point cloud still contains interfering elements like secondary trusses and node connections, the primary objective here is to ensure a high recall rate, guaranteeing that no component points are missed. The result obtained from this coarse screening is formulated as
Stage 2: Fine Screening (Precision Optimization). Building upon the intermediate results, the second stage employs a smaller search radius, rs(2) = 0.4 m, for rigorous re-filtering. This strict constraint eliminates remaining random noise and mismatched points, retaining points within the selected fine CAD-neighborhood envelope. The intermediate fine screening result is expressed as:
The two radii implement an explicit recall–precision trade-off. The coarse radius rs(1) = 1.0 m provides a permissive candidate envelope around the CAD geometry so that residual alignment offsets and geometrically complex joints are retained. The fine radius rs(2) = 0.4 m then rejects neighboring members and clutter within that candidate set. A smaller coarse radius can omit valid truss points, whereas a larger one increases the amount of interference passed to the fine stage. Likewise, reducing rs(2) preserves a stricter boundary but can fragment sparse surfaces, while increasing it improves continuity at the cost of admitting adjacent components. These project-specific values were selected in relation to member scale, residual registration offset, and measured point spacing; they are not universal constants.
Ultimately, the extracted structural component point cloud is represented by
2.3. Local Voxel Neighborhood Search
To further accelerate the computational efficiency during the matching process, the algorithm restricts the search scope strictly to the local voxel space rather than traversing all CAD points. For any given measured point pj, the algorithm first calculates its corresponding voxel kj and then retrieves potential matches exclusively within its adjacent voxel neighborhood, defined as follows [34]:
where the condition limits are defined as
The candidate voxel set for the neighborhood search is represented as
By performing searches solely within this confined subset, the computational complexity scales down to an approximately linear relationship. Additionally, to circumvent floating-point calculation errors and maintain stability across millions of points, distance comparisons are executed using squared distances:
This strategy eliminates computationally expensive square root operations, maintaining algorithm stability at the scale of millions of points.
2.4. Matching Constraints and Algorithm Performance
Robust spatial boundary control is enforced during the matching process. Any measured point exceeding the expanded bounding box of the CAD model is discarded:
This constraint prevents non-structural elements from entering the matching pipeline. To counter local voids and random noise in the measured data, a neighborhood projection is integrated. A point is classified as a valid structural point only if multiple consecutive points within its local vicinity satisfy the matching criteria; isolated points are instantly designated as noise. This mechanism enhances the structural continuity and overall robustness of the semantic segmentation.
Regarding computational cost, voxel neighborhood generation and index retrieval dominate the coarse screening stage, whereas point-to-point distance evaluation dominates the fine stage. Equation (14) therefore describes the expected cost structure, not a measured runtime benchmark.
where C1 and C2 represent the single-point time constants for voxel generation and neighborhood searching, respectively. Reducing the number of retained voxels or narrowing the search radius is expected to lower computational cost, but it also changes the recall–precision trade-off and therefore requires case-specific verification.
Computational reporting: Each exhibition hall contains approximately 100–200 million raw points. Reproducible runtime logs were not retained for the present field campaign; accordingly, the manuscript does not claim an experimentally demonstrated runtime advantage. Future benchmarks will report all stages on fixed hardware together with input and output point counts (Figure 2).
Figure 2.
Schematic of point cloud semantic segmentation algorithm based on CAD priors and voxel matching.
3. Point Cloud Completion Based on Multi-Source Geometric Priors and Data Fusion
3.1. Method Overview
Following the preliminary semantic segmentation of the target component point cloud, the acquired data often exhibits significant incompleteness despite the reasonable accuracy of the aforementioned spatial matching method. This deficiency primarily stems from the inherent geometric complexity of the structures, mutual occlusions among components, and viewing angle limitations inherent in mobile scanning operations. The missing data is predominantly localized at member intersections, shadowed regions of node components, and areas with abrupt elevation changes. Because the laser beam cannot fully cover all structural surfaces during mobile scanning, coupled with weak reflection signals or equipment occlusions in certain areas, the point density in these regions becomes sparse or completely absent. Traditional methods, such as simple interpolation or neighborhood expansion, fail to recover complex spatial morphologies, often resulting in blurred structural boundaries or geometric distortions at member intersections [35,36].
3.2. Adaptive Downsampling and Feature Extraction
In terms of algorithm design, efficient loading and memory optimization are initially applied to the point cloud data. Addressing the large volume and dispersed nature of the field-acquired files, a stream reading mechanism is employed to parse the point cloud files line by line. When a maximum-point threshold is required for memory control, the retained subset must preserve spatial coverage; the threshold is therefore treated as a data-management parameter whose effect requires verification for each dataset. The numerical maximum-point cap used in the original run was not retained.
Subsequently, to reconcile the scale and density disparities between the CAD model and the measured data, an adaptive voxel downsampling method is employed. The original point cloud is partitioned into multiple 3D voxel blocks, where the size of each voxel is jointly determined by the overall bounding box dimensions of the point cloud and a predefined target density coefficient. The average coordinate within each voxel is designated as the representative point. Let the spatial bounding range of the point cloud be defined as follows [37]:
Given the known average boundary scale, the adaptive voxel edge length is defined as
where ρ denotes the target density coefficient. This downsampling approach reduces the number of points and the cost of subsequent processing; preservation of local contours depends on the selected density coefficient and is considered in the parameter-sensitivity discussion below. The numerical value of ρ used in the original run was not retained.
During the point cloud feature extraction phase, to facilitate precise registration and structural recognition, a local geometric feature descriptor based on PCA is introduced. For each point pi, a neighborhood point set Ni within a search radius r is identified, and the covariance matrix is calculated:
where the local neighborhood mean is utilized. By performing eigenvalue decomposition on the covariance matrix, the eigenvectors and their corresponding eigenvalues are derived. Consequently, the normal vector can be accurately extracted, and the local curvature is evaluated using the following equation:
The PCA-derived normals and curvature describe local geometry and can support correspondence screening and diagnostic assessment. In the implementation evaluated here, however, they are not explicit multiplicative factors in the scalar weight of Equation (19); that weight is determined only by Euclidean correspondence distance.
3.3. Distance-Weighted ICP Registration
The registration stage is therefore described as distance-weighted iterative closest point (ICP) registration. KD-tree nearest-neighbor correspondences are established between the source and target point clouds, and larger-distance correspondences are down-weighted in the optimization. Normal and curvature information is not added to the objective in Equation (20).
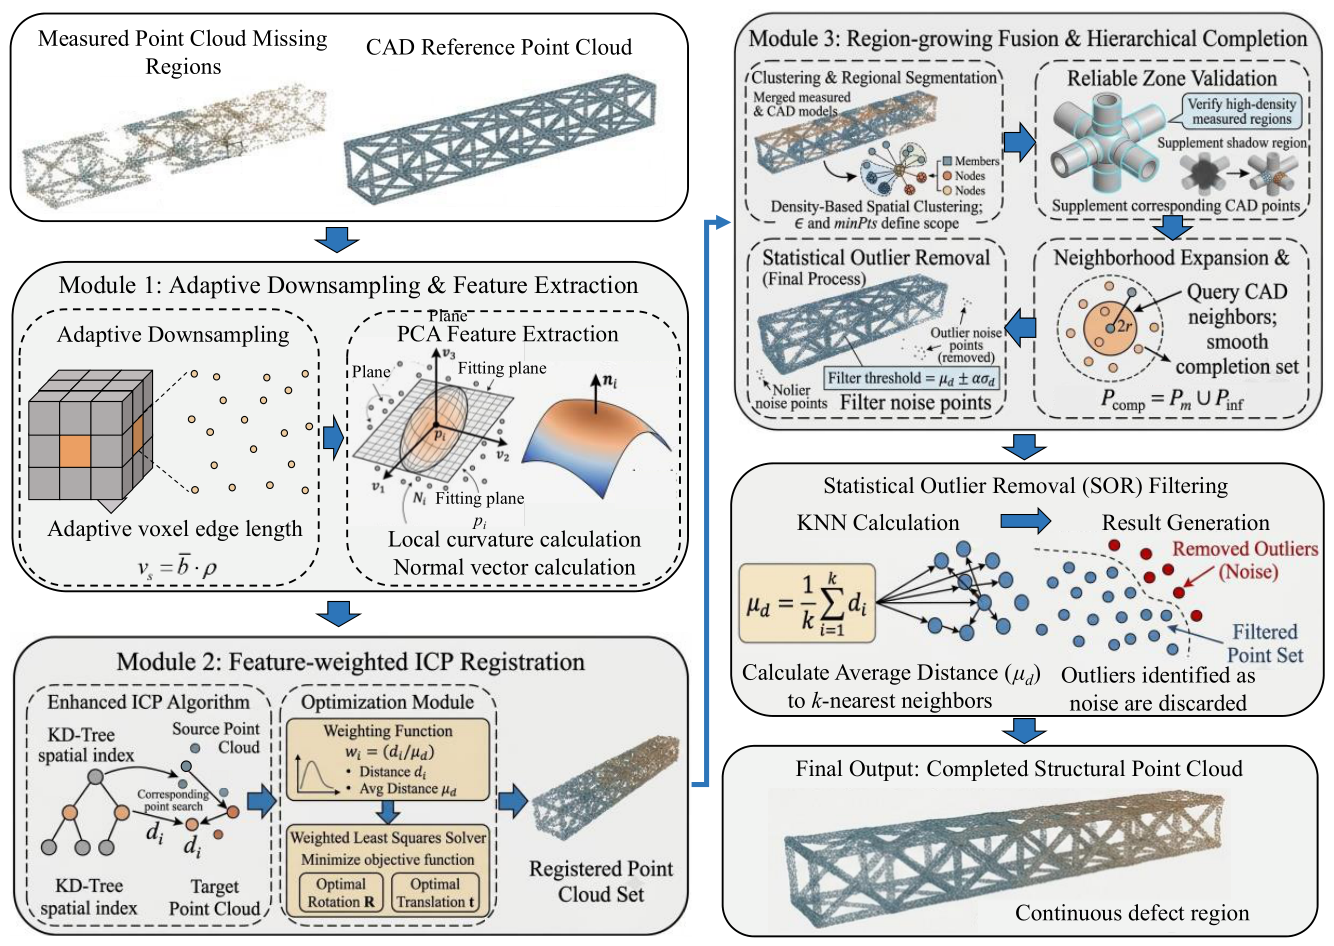
KD-tree spatial indices are established for both the source and target point clouds to compute the Euclidean distance di between corresponding points, utilizing a specific weighting function:
where the average distance is incorporated. Subsequently, a weighted least squares method is applied to solve for the optimal rotation matrix R and translation vector t by minimizing the objective function:
This distance weighting reduces the influence of remote correspondences during registration. For a reproducible reconstruction of the reported case-study workflow, correspondences with di > 0.50 m are rejected, and the maximum iteration count is 50. These reconstructed settings are consistent with the reported processing scale, but the original ICP configuration file was not retained and the exact identity with the historical run cannot be verified.
3.4. Region-Growing Fusion and Hierarchical Mapping
Following registration, a region-growing point cloud fusion algorithm is designed to execute the completion of the missing data. This method first merges the registered measured point cloud with the CAD point cloud and partitions the structural regions via Density-Based Spatial Clustering of Applications with Noise (DBSCAN). During clustering, the Euclidean distance threshold ϵ and the minimum sample number minPts dictate the region-growing scope, facilitating the identification of primary spatial units corresponding to members and nodes.
For DBSCAN, ε controls cluster connectivity and minPts controls the rejection of sparse or noisy points. For the reproducible reconstruction, ε = 0.30 m and minPts = 10. An ε that is too small or a minPts value that is too large fragments valid member and node regions, whereas an ε that is too large or a minPts value that is too small merges neighboring components or retains isolated noise. The reported values are project-specific and should be retuned for a different scanner, sampling density, or structural scale.
For clustered regions exhibiting high density in the measured point cloud, the workflow treats them as measured high-density zones for fusion and supplements them with points extracted from the CAD model belonging to identical or adjacent clusters. To prevent abrupt geometric transitions or boundary discontinuities during completion, a neighborhood expansion strategy is additionally incorporated. For each measured point pi, a CAD neighborhood within 2r = 0.40 m is queried and added to the completion set, where r = 0.20 m is the PCA neighborhood radius in the reconstructed configuration. The expanded completion set is expressed as
where Pm represents the measured point cloud set. The final completed point cloud is a union of the original measured points and the supplementary inferred points:
This procedure ensures continuous transitions and geometric smoothing across structural defect regions, successfully restoring the global spatial characteristics of the components. To further eliminate fusion-induced noise and anomalous points, a Statistical Outlier Removal (SOR) strategy is introduced. By calculating the average distance from each point to its k nearest neighbors, the filtering threshold is determined based on the global average distance μd and standard deviation σd: in the reconstructed completion configuration, k = 50.
where α is a standard deviation multiplier coefficient. Compared to traditional fixed-radius filtering, this robust statistical approach removes isolated points and noise layers while preserving critical local details, thereby refining the smoothness of the point cloud surface. The corresponding completion-stage multiplier is α = 2.0.
Completion quality is most sensitive to the registration neighborhood and correspondence settings, DBSCAN connectivity parameters, region-growing expansion radius, and SOR threshold. An overly small registration neighborhood or correspondence threshold makes the alignment unstable under noise and initial offset, whereas an overly large setting smooths local joint geometry and admits false correspondences. For DBSCAN, a small epsilon or large minPts fragments valid members, while a large epsilon or small minPts merges adjacent members or retains noise. Increasing the 2r expansion improves continuity but also increases the risk of CAD-point leakage across nearby components. Finally, stricter SOR settings may remove legitimate points in sparse node regions, whereas looser settings retain fusion outliers. The parameters are therefore scaled to post-registration point spacing and local density; the present single-case evidence supports qualitative robustness only, and a quantitative multi-case sensitivity study is identified as future work.
Parameter record and reproducibility: The surviving materials verify the segmentation-stage values: voxel size = 0.1 m, a maximum of 5 representative points per occupied voxel, and coarse and fine search radii of 1.0 m and 0.4 m, respectively. They also verify a two-standard-deviation preprocessing SOR rule. The original per-run completion configuration was not preserved. Consequently, the ICP, DBSCAN, r/2r, and completion-stage SOR values stated above are a single reconstructed configuration selected to be consistent with the 0.1 m voxel scale, member dimensions, and final outputs; they are not independently verified historical log values. Numerical records are unavailable for the adaptive density coefficient ρ, the optional maximum-point cap, the measured high-density-zone cutoff, radius-based filter settings, and stage-wise runtime. These distinctions should be retained when reproducing or extending the case study.
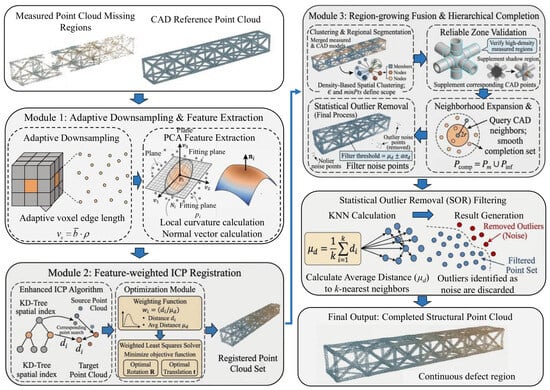
From a workflow perspective, the proposed method is a hierarchical geometric-processing pipeline. Spatial indexing, feature description, distance-weighted registration, region clustering, completion generation, and outlier removal are linked sequentially in the mapping function (Figure 3).
Figure 3.
Point cloud completion workflow based on CAD geometric priors and data fusion.
Terminology note: The registration module is described in the text as distance-weighted ICP because the scalar weighting in Equations (19) and (20) depends on correspondence distance. PCA-derived normals and curvature are retained as local geometric descriptors, not as terms in the reported objective.
4. Engineering Application and Field Validation
4.1. Project Overview and On-Site Data Collection
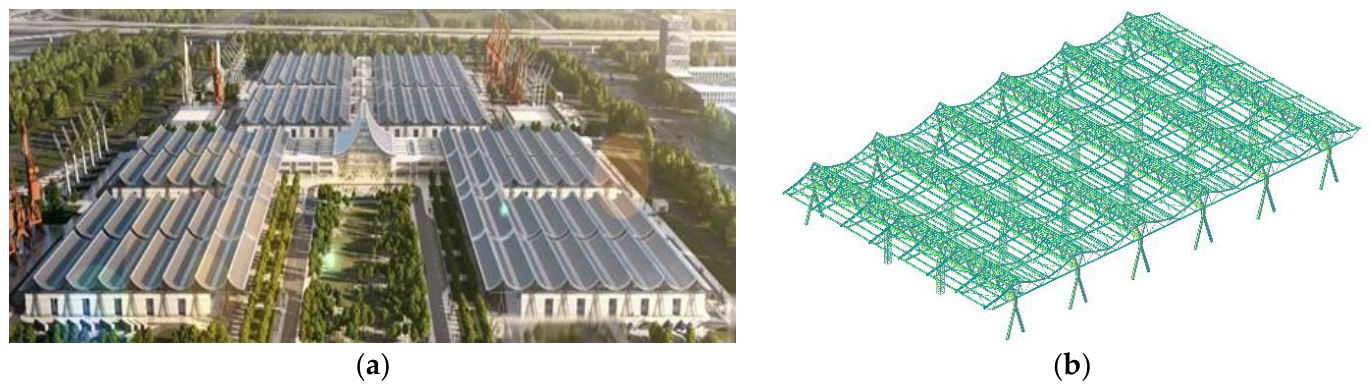
The empirical engineering background of this study is the Zhongyuan International Convention and Exhibition Center project in Zhengzhou, as shown in Figure 4. This investigation specifically targets the full-lifecycle geometric topology and deformation monitoring of exhibition halls 9# to 16#. The primary structure of these exhibition halls utilizes a portal frame structural system combining A-shaped columns and spatial trusses. Each independent exhibition hall features planar dimensions of 144 m × 84 m. The span of the main load-bearing trusses reaches 84 m with an axial spacing of 24 m. Additionally, a secondary truss system with a spacing of 12 m is integrated between adjacent main trusses to enhance the overall stiffness of the roof structure. In terms of elevation and structural height configuration, the total height of exhibition halls 9# to 14# is 19.048 m, whereas that of exhibition halls 15# and 16# reaches 21.298 m. This project is characterized by a large spatial span, high component elevations, and a complex on-site construction environment.
Figure 4.
Project context: (a) aerial rendering of the Zhongyuan International Convention and Exhibition Center; (b) main structural system of exhibition hall 11.
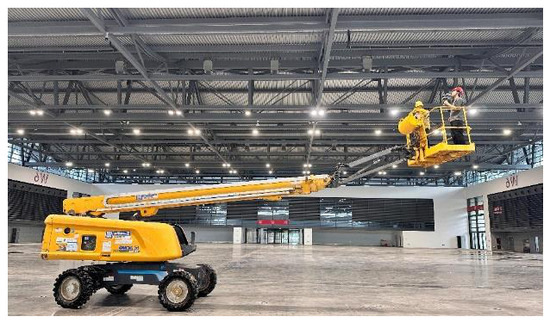
Given the high structural elevations and large spatial volume of this project, as well as the limitations of conventional static terrestrial laser scanning, which is highly susceptible to occlusions and restricted fields of view in complex construction environments, a mobile scanning paradigm was adopted for large-scale, three-dimensional point cloud data collection. To mitigate laser saturation and multiple reflection phenomena on the steel surfaces, scanning was performed under favorable lighting and stable wind conditions. A boom lift was utilized as an elevated mobile platform to comprehensively capture the spatial geometric features of the upper structural components, particularly the main trusses and the terminal joints of the A-shaped columns. The platform was elevated to heights of 7–8 m, while the point cloud stream was monitored in real-time to identify and immediately address any occluded zones.
To ensure the precise capture of structural edges and maintain uniform point density, the translation speed was strictly controlled between 0.5 and 1.0 m/s under stable, vibration-minimized conditions. Multi-path reciprocal scanning at dual heights (7 m and 8 m) ensured a 60–70% spatial overlap between adjacent passes. Ultimately, approximately 100 to 200 million data points were collected per exhibition hall, yielding a high-density, continuous raw point cloud foundation for subsequent truss isolation and geometric reconstruction algorithms (Figure 5).
Figure 5.
Field mobile scanning operation using an elevated platform.
4.2. Point Cloud Data Preprocessing and Structural Isolation
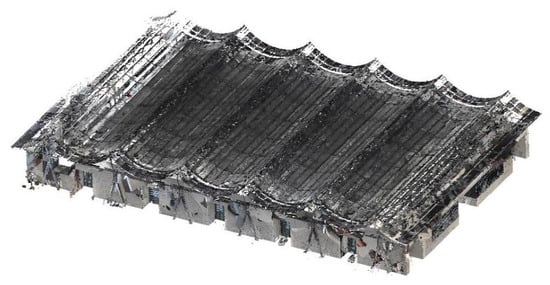
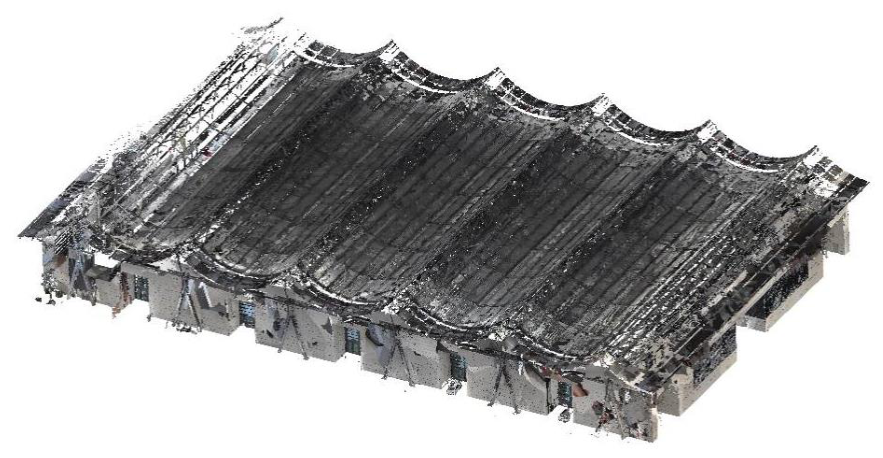
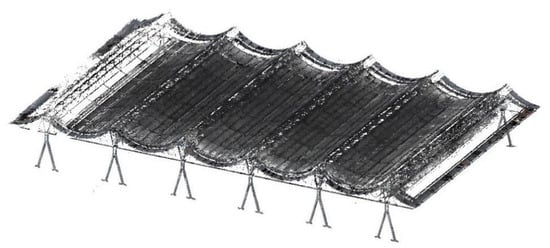
Following data acquisition, preprocessing and structural isolation are conducted. The raw point cloud of the exhibition hall encompasses steel components, concrete walls, roof covers, equipment, and ground noise. This raw data has a large volume, structural complexity, and significant redundancy, as shown in Figure 6. The point density in the roof and steel truss regions is higher than that of the concrete walls and ground, primarily due to optimal laser incidence angles and surface reflectivity.
Figure 6.
Raw point cloud data of the structural system.
The preprocessing preserves structural morphology while filtering irrelevant data. Initially, point clouds are aligned into a geographic coordinate system using GNSS-assisted positioning. Through an automatic registration algorithm based on overlapping regions, the global error is restricted to the centimeter level. Spatial bounding box cropping is then applied to eliminate peripheral areas like background buildings and construction enclosures, reducing the data volume by approximately one-third while maintaining the density of core regions.
To isolate the steel structure, normal vectors and curvatures are calculated to detect flat areas, and the Random Sample Consensus algorithm performs plane-fitting to remove concrete walls. A region-growing algorithm provides supplementary identification at boundary zones overlapping with steel structures to prevent residual wall misjudgments. For remaining non-structural elements, Euclidean distance-based cluster segmentation is applied. Clusters with large slenderness ratios and consistent principal directions are classified as structural members, whereas irregular clusters are removed as noise [38].
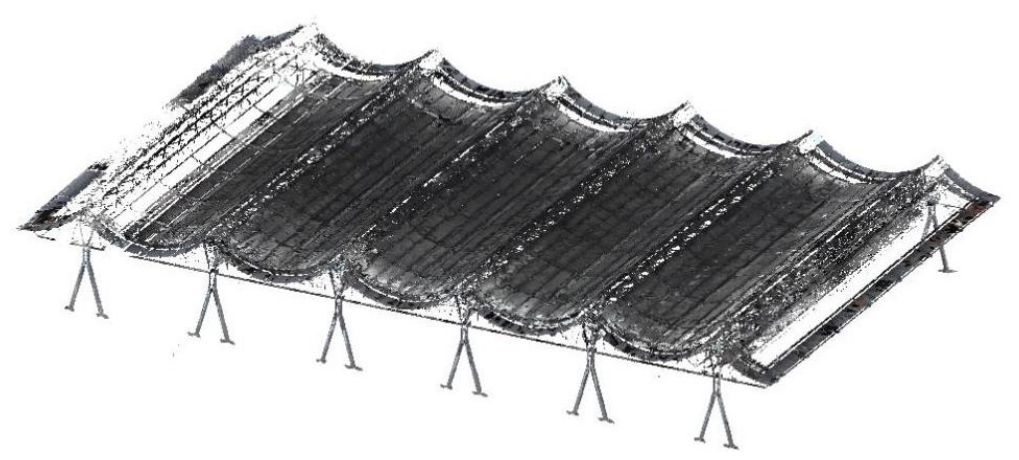
To guarantee geometric accuracy, a multi-stage denoising procedure is conducted. SOR eliminates isolated points exceeding two standard deviations, and radius-based filtering removes suspended noise. A curvature-adaptive filtering method smooths the surfaces of slender truss members without blurring cross-sectional boundaries. Finally, geometric skeleton isolation is performed using local linear fitting and voxelization. Residual analysis shows that fitting residuals in the main truss region are within 10 mm, and nodal position deviations are below 20 mm compared to field measurements, satisfying engineering precision requirements. The preprocessed point cloud is illustrated in Figure 7. These residual and nodal checks apply to preprocessing and visible measured regions only; they do not validate the completed occlusions [39]. For this preprocessing SOR step, α = 2.0 is retained, whereas the neighbor count k and the radius-filter settings were not recorded.
Figure 7.
Preprocessed structural point cloud after filtering and component isolation.
4.3. Main Truss Point Cloud Semantic Segmentation and Completion
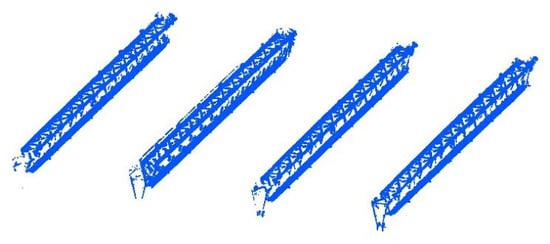
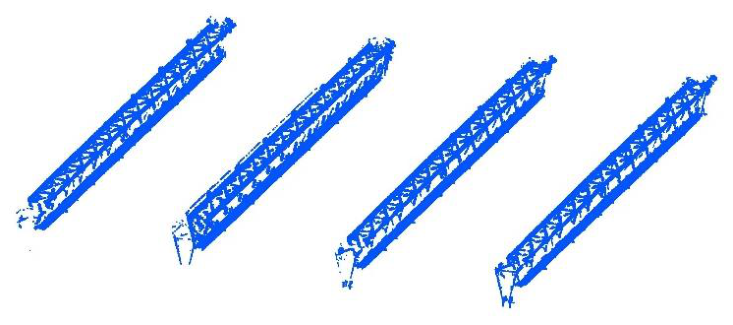
Using voxel spatial indexing and two-stage neighborhood matching, the main truss point clouds are isolated from the preprocessed data. The four relatively intact main trusses in the central region (the second to fifth low-level spans) are used as representative targets. The CAD prior constrains the candidate region and reduces the mixing of adjacent roof components observed with the comparison methods. Figure 8 shows the resulting target point sets.
Figure 8.
Semantic segmentation results of the main trusses using the proposed algorithm.
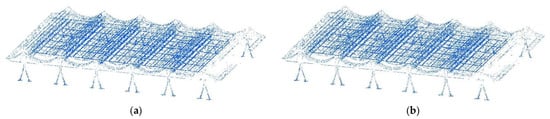
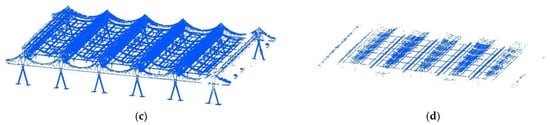
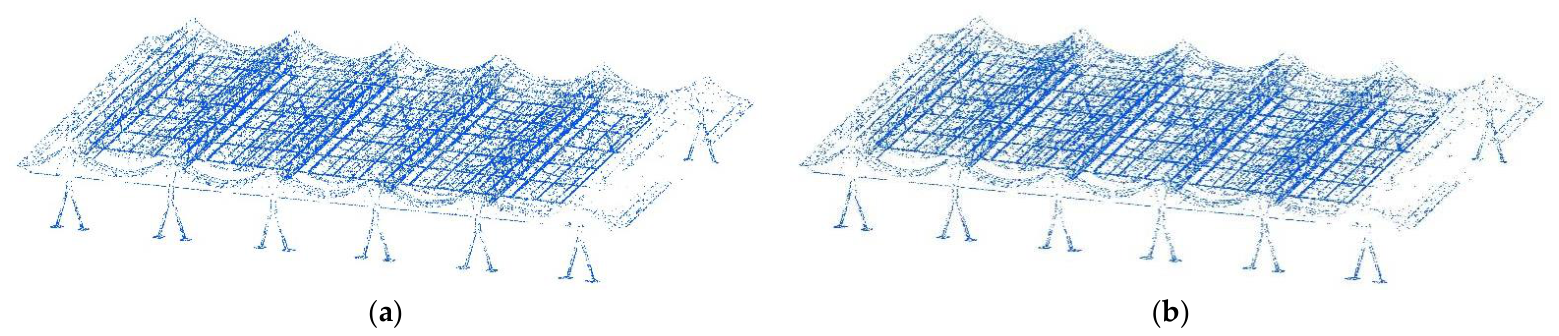
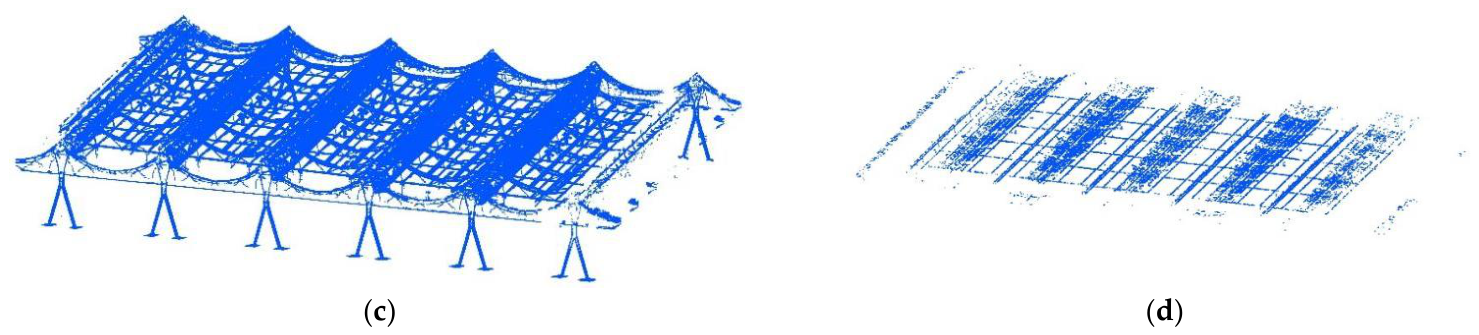
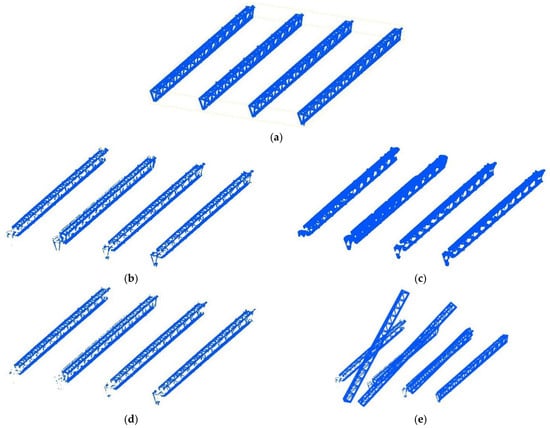
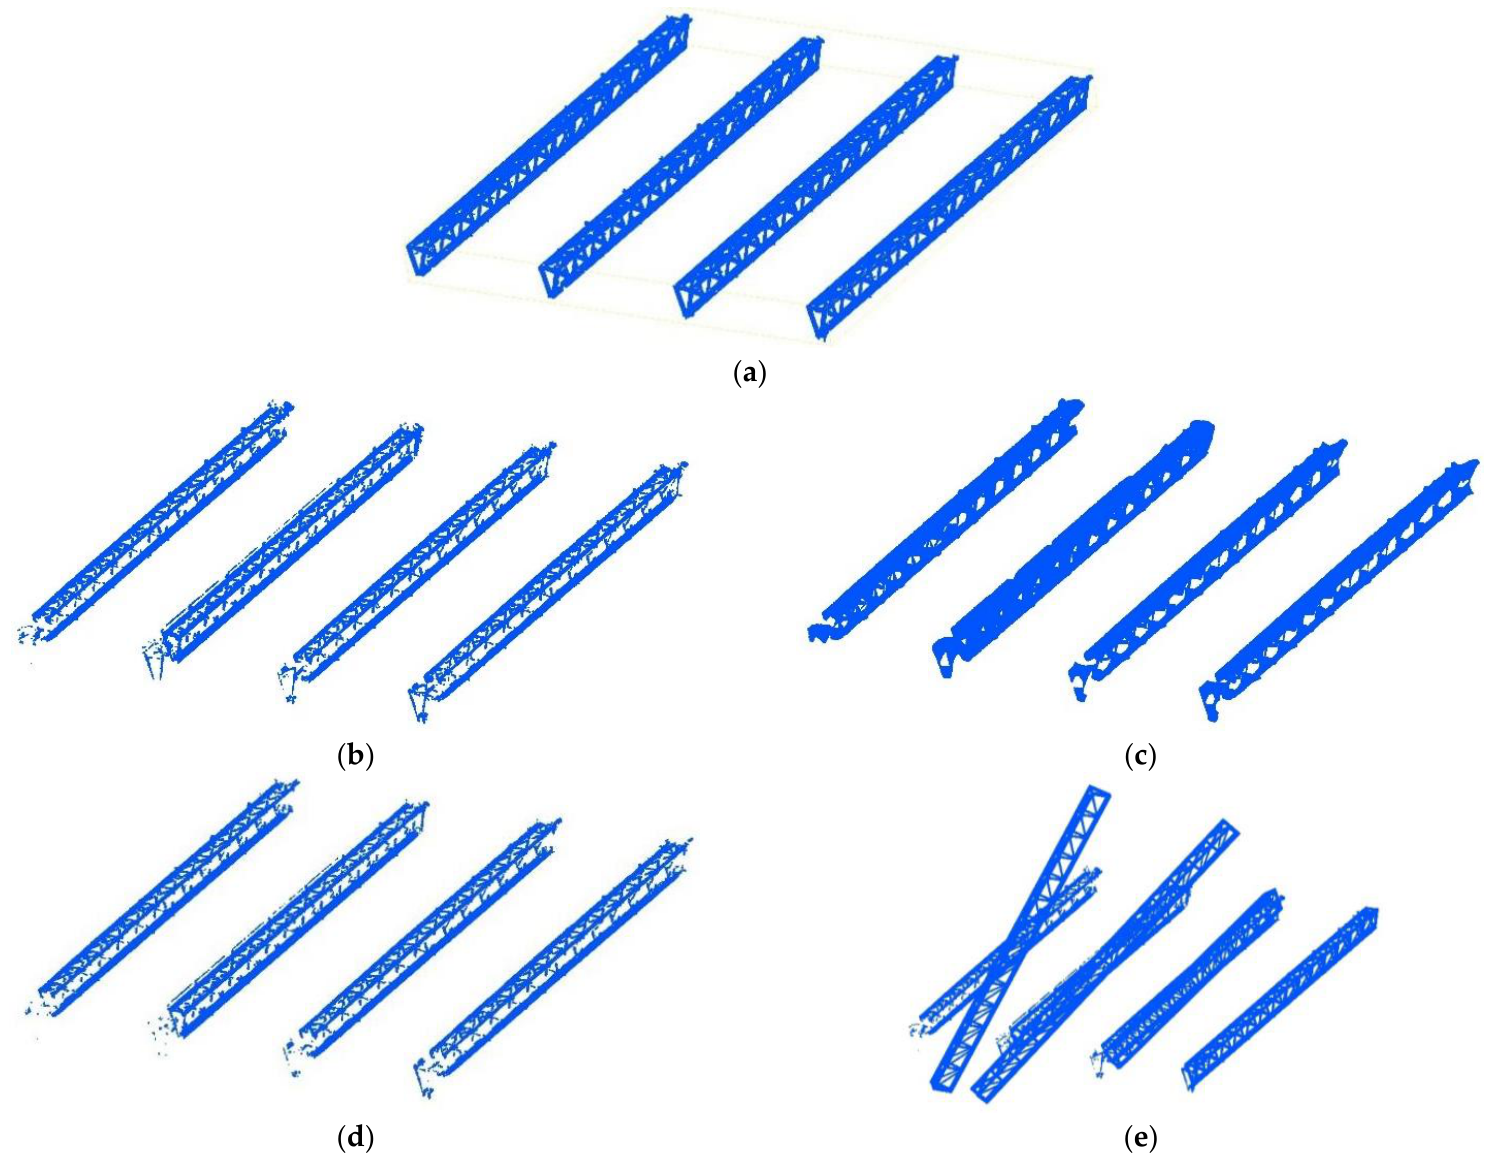
A qualitative comparison was also conducted on the same four central trusses using Principal Component Analysis (PCA) linearity filtering (Figure 9a), iterative multi-plane Random Sample Consensus (RANSAC) (Figure 9b), 2.5D grid elevation variance (Figure 9c), and pass-through filtering combined with Statistical Outlier Removal (SOR) (Figure 9d). In this case, the visual results show loss of member continuity for the local-feature and plane-fitting methods and incomplete separation of overlapping roof components for the elevation and filtering methods. These observations provide contextual evidence for the CAD-constrained search and are considered together with the independent quantitative validation below.
Figure 9.
Point cloud isolation results using traditional segmentation algorithms: (a) PCA linearity filtering; (b) multi-plane RANSAC; (c) 2.5D grid elevation variance; (d) pass-through combined with SOR.
To provide independent quantitative validation of semantic segmentation, 12 regions of interest (ROIs) were selected from the four trusses (three per truss): an isolated-member region, a member-intersection or joint region, and a truss-end region affected by adjacent roof components and the supporting structure. All 339,075 measured points within these ROIs were manually labeled by multi-view inspection of the measured point cloud as either target main truss points or non-target/interference points. CAD-derived and subsequently completed points were excluded from the annotation. The extracted output was mapped back to the corresponding measured input points, and precision, recall, F1-score, and intersection over union (IoU) were calculated for the target main truss class. The values in Table 1 are micro-averaged over the three ROIs for each truss, and the pooled row aggregates all 12 ROIs.
Table 1.
Point-wise segmentation performance on the manually labeled representative subset.
On the pooled manually labeled subset, the proposed method achieves a precision of 88.71%, recall of 82.80%, F1-score of 85.65%, and IoU of 74.91%. Across the four trusses, the F1-score ranges from 84.05% to 87.95%, and the IoU ranges from 72.49% to 78.49%. Inspection of the errors shows that omissions are concentrated near the truss ends adjacent to the supporting structure, where conservative boundary rejection reduces recall. The quantitative evidence therefore supports effective target isolation on the representative subset while also identifying end-region segmentation as a limitation requiring further refinement.
Following main truss isolation, contiguous missing regions remain at member intersections and shadowed areas. The proposed CAD-prior-guided completion workflow is compared qualitatively with four alternatives in Figure 10. Local midpoint interpolation does not bridge the largest gaps; alpha-shape completion introduces web-like surfaces across hollow grid cells; RANSAC primitive fitting fragments some intersecting joints; and FPFH plus fast global registration produces a visible global misalignment in this repetitive truss geometry. These observations explain the relative CAD-reference metrics in Table 2, but they should not be interpreted as independent recovery of the hidden as-built surface.
Figure 10.
Comparison of point cloud completion results on the main trusses: (a) proposed completion algorithms; (b) local midpoint interpolation; (c) alpha-shape contour reconstruction; (d) RANSAC primitive-based completion; (e) FPFH + FGR global registration fusion.
Table 2.
Performance metrics comparison of different completion algorithms.
The proposed completion method (Figure 10a) integrates CAD geometric constraints with region-growing fusion. The distance-weighted registration stage establishes an initial alignment that avoids the visible macroscopic mismatch of the data-driven baselines, and hierarchical mapping restores design-consistent member continuity. The comparison supports topology preservation and closer CAD-reference agreement, but it does not demonstrate direct recovery of the unobserved as-built surface.
The contributions of the two modules can be interpreted separately within the present workflow. The CAD-prior segmentation module determines whether the target truss is isolated from background and adjacent members, as assessed by the extraction comparison in Figure 9. To isolate the CAD prior in the completion stage, the segmented target cloud was held fixed and the CAD-derived completion points were removed; registration and region-growing fusion were then performed using measured-neighborhood information, while the remaining settings were kept unchanged. This CAD-free completion variant produced an NCD of 2.37%, an NHD of 2.68%, and an F-Score of 12.41%, compared with 0.53%, 1.16%, and 20.02%, respectively, for the complete workflow. The comparison indicates that segmentation provides target isolation, whereas the completion-stage CAD prior accounts for the principal improvement in design-reference agreement and continuity across large occlusions. Because the ablation retains CAD-guided segmentation and uses the CAD model as the metric reference, it isolates the completion prior only and should not be interpreted as a full factorial ablation of both modules.
To quantify the design-reference consistency while mitigating the scale effect of the large-span spatial structure, a normalized spatial deviation analysis was conducted using the CAD model as the evaluation reference. The absolute distance metrics were normalized against the main truss span (L = 84 m), yielding the normalized Chamfer distance (NCD) and normalized Hausdorff distance (NHD). Let Pcomp and Pgt denote the completed point cloud and the CAD reference, respectively.
It should be noted that the CAD model is used both as a completion prior and as the reference for these metrics. Consequently, NCD, NHD, and F-Score quantify consistency with the design geometry rather than independent accuracy relative to the unobserved as-built surface. This shared reference can favor CAD-guided completion and must not be interpreted as proof that deformation or construction deviation in occluded regions has been recovered. The available field checks of fitting residuals and visible nodal positions support scanning and preprocessing accuracy, but they do not provide independent ground truth for the completed occlusions.
Independent completed-region ground truth was not available in the present campaign, so no independent as-built accuracy claim is made for the occluded regions. A future controlled-masking assessment will select originally complete measured members and joints, withhold predefined regions before completion, and compare the reconstructed points with the withheld measured data using absolute distance summaries, NCD, NHD, and F-Score. Total-station observations or a denser reference scan will be used where accessible to provide an additional external check. The NCD and NHD are mathematically defined as follows:
Additionally, the F-Score was evaluated to measure practical completeness under a stringent 50 mm engineering tolerance threshold d. Based on the precision P(d) and recall R(d) within this threshold, the F-Score is calculated as their harmonic mean:
As shown in Table 2, the proposed CAD-prior-guided method has the lowest deviations among the evaluated algorithms. It achieves an NCD of 0.53%, compared with 4.92% for FPFH + FGR. Its NHD is 1.16%; the alpha-shape contour and RANSAC primitive methods yield 3.52% and 3.11%, respectively. Reversing the normalization by the 84 m span gives approximate absolute equivalents of 0.445 m for NCD and 0.974 m for NHD. These span-normalized summary distances are not pointwise tolerance pass rates and must be interpreted together with the 50 mm F-Score and the non-independent CAD reference.
Beyond spatial deviation, the F-Score measures agreement with the CAD reference under the 50 mm evaluation tolerance. Traditional algorithms achieve 7.16% to 9.95%, whereas the proposed method reaches 20.02%, more than doubling the best baseline. Nevertheless, the absolute value means that strict-tolerance agreement is achieved for only a limited share of the completed geometry; the majority cannot be assumed to lie within 50 mm. Accordingly, the adopted 50 mm tolerance and the present F-Score are not sufficient, by themselves, for downstream deformation monitoring or structural assessment. The 50 mm value is only a comparative evaluation cutoff; sufficiency for deformation monitoring depends on whether the measurement uncertainty is appreciably smaller than the displacement of interest, while structural assessment requires member- and project-specific acceptance limits. Displacement estimates should therefore be based on measured points and independent control observations. CAD-imputed points may support topology-aware model preparation, visualization, and supplementary inspection planning, but they should be excluded from quantitative deformation or structural-acceptance judgments unless independently verified.
5. Discussion
The proposed workflow differs from feature-only segmentation and local interpolation or primitive-fitting completion approaches because the CAD geometry constrains both the search space and the reconstructed topology. This constraint explains the closer CAD-reference consistency and the relative F-Score improvement in the present case. By contrast, learning-based or data-only frameworks may transfer more readily when a reliable design model is unavailable and may preserve measured as-built deviations, but they require representative training data or sufficiently dense observations. Direct numerical ranking across studies is not appropriate when datasets, missing-region patterns, and tolerance definitions differ.
The manually labeled subset provides an independent point-level check of the segmentation stage. The pooled precision, recall, F1-score, and IoU are 88.71%, 82.80%, 85.65%, and 74.91%, respectively. The higher precision than recall is consistent with the conservative fine screening strategy: it limits interference but can omit valid terminal points near supports. Because the annotations cover only 12 ROIs from one project, the result should be interpreted as representative case-study evidence rather than a multi-project benchmark.
A comparable prior-guided pattern is used outside structural point cloud processing in medical image registration, industrial metrology, and robotics or map alignment: a nominal model or atlas constrains noisy or incomplete observations. Across these fields, the common benefit is a smaller search space and stronger structural plausibility, while the common risk is biased toward the prior when the observed object differs from the reference. The present workflow follows the same pattern and therefore requires explicit provenance labels and independent validation.
The engineering value of the result lies primarily in design-consistent topology recovery rather than survey-grade surface reconstruction. The 20.02% F-Score is meaningful as a relative improvement over the tested baselines, but its modest absolute magnitude limits the use of completed points for precision assessment. In practice, the output can support digital-twin model preparation, member-level visualization, scan-quality review, and the planning of supplementary inspection. For researchers, the study shows how an explicit engineering prior can reduce the search space and constrain topology; for practitioners and decision-makers, it also establishes a clear data-provenance rule: measured points and CAD-imputed points should be labeled separately and assigned different confidence levels.
Accuracy may decrease when the CAD model is missing, outdated, or poorly registered; when actual member positions, cross-sections, or joint details deviate substantially from the design; when point density is low or strongly uneven; or when adjacent members fall within the selected matching and clustering neighborhoods. In these conditions, the CAD prior can pull the completion toward idealized geometry, region-growing can cross component boundaries, and filtering can remove legitimate sparse points. Development and validation are additionally limited by case-specific parameter calibration, the limited size and single-project scope of the manually labeled segmentation subset, the absence of completed-region ground truth, and the lack of reproducible stage-wise runtime logs. Validation on one project and the use of the same CAD model as both completion prior and metric reference further limit generalizability and introduce potential circularity for the completion assessment. Independent measurements, expanded segmentation annotations, controlled-masking, additional structural types, complete runtime reporting, and quantitative parameter studies are required before deformation-sensitive assessment.
6. Conclusions
This study aimed to determine whether a CAD-prior-guided workflow can improve target-truss isolation and design-consistent completion for field-scale point clouds affected by clutter and severe occlusion. The results support the working hypothesis with respect to CAD-reference consistency and structural topology preservation, while they do not validate recovery of unobserved as-built deformation. Based on the field application at the Zhongyuan International Convention and Exhibition Center, the main conclusions are as follows:
(1) The semantic segmentation workflow combines voxel spatial indexing with two-stage neighborhood matching to isolate the target main trusses from large mobile-scan datasets. On the manually labeled representative subset, the method achieves a precision of 88.71%, recall of 82.80%, F1-score of 85.65%, and IoU of 74.91%. These results provide quantitative evidence for the segmentation stage, while the lower recall near truss ends indicates that terminal regions adjacent to supports require further refinement and broader validation.
(2) Missing regions at member intersections and shadowed areas are completed using distance-weighted ICP registration and region-growing fusion. The CAD constraint preserves design-consistent topology relative to the tested baselines, but completed points remain CAD-derived imputations rather than direct observations of the hidden as-built surface.
(3) Relative to the CAD reference, the reconstructed spatial models achieve an NCD of 0.53% and an NHD of 1.16%. Under the 50 mm tolerance, the F-Score is 20.02%, more than twice the best baseline; however, this modest absolute value shows that strict-tolerance agreement remains limited. The result supports the method’s relative advantage for design-consistent topology completion but does not establish survey-grade recovery of occluded as-built geometry.
Limitations and future work: The validation is based on one project, one CAD source, and one scanning campaign. The segmentation metrics are derived from 12 manually labeled ROIs rather than a comprehensive multi-project benchmark. Because the CAD model supplies both the completion prior and the completion metric reference, the completion scores assess design consistency rather than independent ground-truth accuracy. Although Section 3 now separates verified values from a reconstructed completion configuration, original numerical records for the adaptive density coefficient, the optional maximum-point cap, the measured high-density-zone cutoff, radius-filter settings, and stage-wise runtime remain unavailable. The reconstructed DBSCAN, ICP, region-growing, and completion-stage SOR values therefore require confirmation against any subsequently recovered code or project notes. Future work should expand manual segmentation labels to independent structures, scanning conditions, and annotators; use total-station measurements, denser scans, or controlled-masking for completion validation; and report full factorial module ablation, parameter sensitivity, and runtime under fixed hardware.
Overall, the contribution of this work is a field-oriented integration of CAD-constrained spatial indexing, target-truss isolation, distance-weighted registration, and topology-aware completion, together with an explicit distinction between design-consistent imputation and measured as-built geometry. This integration provides a traceable workflow for model preparation and inspection planning while defining the evidence and validation required before deformation-sensitive use.
Author Contributions
Conceptualization, H.Z. and S.W.; Methodology, J.Z., S.W. and K.G.; Software, Z.Z.; Formal analysis, J.Z. and Z.Z.; Resources, C.C.; Data curation, C.C., K.G., Z.Z. and X.W.; Writing—original draft, C.C.; Writing—review and editing, C.C., H.Z., J.Z. and S.W.; Visualization, J.Z. and K.G.; Supervision, H.Z.; Project administration, S.W.; Funding acquisition, X.W. All authors have read and agreed to the published version of the manuscript.
Funding
The National Natural Science Foundation of China (NSFC, contract number: 52538007, 52478314, 52192664), Technology Innovation Plan Project in Hubei Province (Grant No. 2025BCB034 and 2024BCB105), Research Fund of China Construction Science and Industry (CSCEC-PT-004-2022-KT-3.3), and the Research Fund of China Construction Science and Industry CO., LTD. (ZJKG-2024-KT-14).
Institutional Review Board Statement
Not applicable.
Informed Consent Statement
Not applicable.
Data Availability Statement
The original contributions presented in this study are included in the article. Further inquiries can be directed to the corresponding author(s).
Conflicts of Interest
Author Xuan Wang was employed by the company China Railway Steel Structure Co., Ltd., Nanjing, China. The remaining authors declare that the research was conducted in the absence of any commercial or financial relationships that could be construed as potential conflicts of interest.
References
- Ai, D.; Qin, S.; Nie, Z.; Wang, D.; Yuan, H.; Liu, Y. Adaptive local neighborhood search and dual attention convolution network for complex semantic segmentation towards indoor point clouds. Expert Syst. Appl. 2025, 269, 126376. [Google Scholar] [CrossRef] [Scilit]
- Bie, L.; Xiao, G.; Li, Y.; Gao, Y. HyperG-PS: Voxel correlation modeling via hypergraph for LiDAR panoptic segmentation. Fundam. Res. 2026, 6, 1727–1735. [Google Scholar] [CrossRef] [Scilit] [PubMed]
- Cai, E.; Xu, J.; Zhu, H.; Zhang, Y.; Du, C.; Faes, M.G.R. Full-field 3D deformation estimation of large-scale complex geological structures based on realistic stereo photogrammetry. Adv. Eng. Inform. 2026, 76, 104992. [Google Scholar] [CrossRef] [Scilit]
- Cao, Y.; Huang, Y.; Ni, J. A Two-Step Filtering Approach for Indoor LiDAR Point Clouds: Efficient Removal of Jump Points and Misdetected Points. Sensors 2025, 25, 5937. [Google Scholar] [CrossRef] [Scilit] [PubMed]
- Chen, X.; Chen, J.; Liu, Y.; Li, R. HSG-Net: Point Cloud Completion via Heuristic Structure Growing. IEEE Trans. Neural Netw. Learn. Syst. 2026, 37, 661–672. [Google Scholar] [CrossRef] [Scilit] [PubMed]
- Zhou, J.; Hu, Y.Y.; Huang, X.H.; Wang, T.J. Three-Dimensional Object Detection Network Based on Geometric Information Supplement Strategy. Comput. Electr. Eng. 2023, 106, 108577. [Google Scholar] [CrossRef] [Scilit]
- Dong, M.; Li, W.; Sun, X.; Bi, S. A GlobalLocal Network for Human Pose Estimation with Completed mmWave Radar Point Clouds. IEEE Sens. J. 2026, 26, 7152–7164. [Google Scholar] [CrossRef] [Scilit]
- Du, P.; Wang, X.; Wu, Z.; Ru, X.; Granier, X.; He, Y. LaPDA: Latent-Space Point Cloud Denoising with Adaptivity. IEEE Trans. Vis. Comput. Graph. 2026, 32, 1525–1539. [Google Scholar] [CrossRef] [Scilit] [PubMed]
- Duan, L.; Zhao, S.; Weng, X.; Zhang, J.; Xia, G.-S. High-Quality Pseudo-Labeling for Point Cloud Segmentation with Scene-Level Annotation. IEEE Trans. Pattern Anal. Mach. Intell. 2025, 47, 9360–9366. [Google Scholar] [CrossRef] [Scilit] [PubMed]
- Fang, K.; Xu, K.; Wu, Z.; Huang, T.; Yang, Y. Three-Dimensional Point Cloud Segmentation Algorithm Based on Depth Camera for Large Size Model Point Cloud Unsupervised Class Segmentation. Sensors 2024, 24, 112. [Google Scholar] [CrossRef] [Scilit] [PubMed]
- Gao, J.; Zhang, Y.; Zhou, P.; Liu, X.; Yan, L.; Zhou, M.; Geng, G. CMFF: Cross-modal feature fusion network for robust point cloud completion. Neural Netw. 2025, 192, 107930. [Google Scholar] [CrossRef] [Scilit] [PubMed]
- Han, S.; Yu, S.; Zhang, X.; Zhang, L.; Ran, C.; Zhang, Q.; Li, H. Research and application on deep learning-based point cloud completion for marine structures with point coordinate fusion and coordinate-supervised point cloud generator. Measurement 2025, 242, 116246. [Google Scholar] [CrossRef] [Scilit]
- Li, J.; Nguyen, T.-M.; Cao, M.; Yuan, S.; Hung, T.-Y.; Xie, L. Graph Optimality-Aware Stochastic LiDAR Bundle Adjustment with Progressive Spatial Smoothing. IEEE Trans. Intell. Transp. Syst. 2025, 26, 19076–19091. [Google Scholar] [CrossRef] [Scilit]
- Li, J.; Zhang, Y.; Jiang, J.; Lu, Y.; Wang, Y. Research on component-level segmentation and 3D reconstruction method of urban buildings driven by point cloud semantic cognition. J. Build. Eng. 2026, 117, 114838. [Google Scholar] [CrossRef] [Scilit]
- Li, W.; Zhu, H.; Yi, T.; Wang, S.; Huang, H.; Wang, H.; Zha, X. Rapid Inspection of Large-Span Roofs Using Un-Manned Aerial Vehicle Oblique Photography and Point Cloud Data. Buildings 2025, 15, 4166. [Google Scholar] [CrossRef] [Scilit]
- Lian, J.; Du, X.; Liu, J.; Hui, L.; Yang, J. Cross-Modal Driven Object Restoration for 3D Point Cloud Backdoor Defense. IEEE Trans. Inf. Forensic Secur. 2025, 20, 11006–11018. [Google Scholar] [CrossRef] [Scilit]
- Lin, J.; Zhong, K.; Gong, T.; Zhang, X.; Wang, N. Prior Information-Assisted Neural Network for Point Cloud Segmentation in Human-Robot Interaction Scenarios. IEEE Robot. Autom. Lett. 2024, 9, 4186–4193. [Google Scholar] [CrossRef] [Scilit]
- Rist, C.; Emmerichs, D.; Enzweiler, M.; Gavrila, D. Semantic Scene Completion Using Local Deep Implicit Functions on LiDAR Data. IEEE Trans. Pattern Anal. Mach. Intell. 2022, 44, 7205–7218. [Google Scholar] [CrossRef] [Scilit] [PubMed]
- Shi, G.; Liu, Z.; Lu, D.; Wang, Z.; Jiao, Z.; Ji, C.; Zhang, Z. Construction error control method of large-span spatial structures based on digital twin. J. Build. Eng. 2024, 98, 111311. [Google Scholar] [CrossRef] [Scilit]
- Umam, A.; Yang, C.-K.; Chuang, J.-H.; Lin, Y.-Y. Unsupervised Point Cloud Co-Part Segmentation via Co-Attended Superpoint Generation and Aggregation. IEEE Trans. Multimed. 2024, 26, 7775–7786. [Google Scholar] [CrossRef] [Scilit]
- Wang, F.; Li, B.; Xu, Y.; Zhang, J.; Zhang, J. Automated measurement method for cable shapes based on laser scanners and cameras. J. Civ. Struct. Health Monit. 2025, 15, 717–729. [Google Scholar] [CrossRef] [Scilit]
- Wang, J.; Hao, S.; Hua, Z.; Yao, Y.; Xu, Q.; Liu, B.; Gong, M. TBGA-Net: Trigonometric Bilinear Attention and Global-Aware Aggregation Network for Large-Scale 3D Point Cloud Segmentation. IEEE Trans. Circuits Syst. Video Technol. 2025, 35, 12369–12381. [Google Scholar] [CrossRef] [Scilit]
- Wei, G.; Pan, H.; Zhuang, S.; Zhou, Y.; Li, C. iPUNet: Iterative Cross Field Guided Point Cloud Upsampling. IEEE Trans. Vis. Comput. Graph. 2024, 30, 6089–6103. [Google Scholar] [CrossRef] [Scilit] [PubMed]
- Wu, J.; Ma, Z.; Xue, Y.; Qin, J.; You, D.; Sun, G. Displacement monitoring and modal parameter identification of cable net structure based on feature optical flow and binocular stereo vision. Structures 2025, 76, 108914. [Google Scholar] [CrossRef] [Scilit]
- Wu, L.; Zhang, Q.; Hou, J.; Xu, Y. Leveraging Single-View Images for Unsupervised 3D Point Cloud Completion. IEEE Trans. Multimed. 2025, 27, 940–953. [Google Scholar] [CrossRef] [Scilit]
- Wu, T.; Yang, F.; Farooq, U.; Hao, H.; Li, Y.; Diao, G. A new point cloud simplification method for reducing visual distortion. Measurement 2024, 229, 114400. [Google Scholar] [CrossRef] [Scilit]
- Xiao, H.; He, Y.; Liu, H.; Kang, W.; Li, Y. Point Cloud Completion via Self-Projected View Augmentation and Implicit Field Constraint. IEEE Trans. Circuits Syst. Video Technol. 2024, 34, 11564–11578. [Google Scholar] [CrossRef] [Scilit]
- Xie, J.; Zhang, L.; Cheng, L.; Yao, J.; Qian, P.; Zhu, B.; Liu, G. MARNet: Multi-scale adaptive relational network for robust point cloud completion via cross-modal fusion. Inf. Fusion 2026, 126, 103505. [Google Scholar] [CrossRef] [Scilit]
- Xu, J.; Zhang, Y.; Zou, Y.; Liu, P.X. Sequence Generation Completion Method and Resolution Scaling Network for Point Cloud Completion. IEEE Trans. Geosci. Remote Sens. 2024, 62, 5704815. [Google Scholar] [CrossRef] [Scilit]
- Xu, W.; Zheng, X.; Xu, X.; Shen, Y. Multi-dimensional wireless sensor network-based structural health monitoring system for large-span spatial structure. J. Build. Eng. 2026, 126, 116302. [Google Scholar] [CrossRef] [Scilit]
- Yuan, G.; Fu, Q.; Mi, Z.; Luo, Y.; Tao, W. SSRNet: Scalable 3D Surface Reconstruction Network. IEEE Trans. Vis. Comput. Graph. 2023, 29, 4906–4919. [Google Scholar] [CrossRef] [Scilit] [PubMed]
- Yue, H.; Wang, Q.; Huang, L.; Zhang, M. Enhancing point cloud semantic segmentation of building interiors through diffusion-based scene-level synthesis. Autom. Constr. 2025, 178, 106390. [Google Scholar] [CrossRef] [Scilit]
- Yue, H.; Wang, Q.; Yan, Y.; Huang, G. Deep learning-based point cloud completion for MEP components. Autom. Constr. 2025, 175, 106218. [Google Scholar] [CrossRef] [Scilit]
- Zhang, D.; Chen, F.; Qin, Y.; Gao, K.; Peng, Z. Fast point cloud simplification method based on optimized feature sampling and geometric continuity preservation. Meas. Sci. Technol. 2026, 37, 035402. [Google Scholar] [CrossRef] [Scilit]
- Zhang, Z.; Han, X.; Dong, B.; Li, T.; Yin, B.; Yang, X. Point Cloud Scene Completion with Joint Color and Semantic Estimation from Single RGB-D Image. IEEE Trans. Pattern Anal. Mach. Intell. 2023, 45, 11079–11095. [Google Scholar] [CrossRef] [Scilit] [PubMed]
- Zhang, Z.; Liu, H.; Wang, X.; Shu, M.; Chen, G.; Zhang, Q. Lightweight and rotation-invariant place recognition network for large-scale raw point clouds. ISPRS-J. Photogramm. Remote Sens. 2024, 212, 58–72. [Google Scholar] [CrossRef] [Scilit]
- Zhao, F.; Huang, H.; Xiao, N.; Yu, J.; Geng, G. A point cloud segmentation algorithm based on multi-feature training and weighted random forest. Meas. Sci. Technol. 2025, 36, 015407. [Google Scholar] [CrossRef] [Scilit]
- Zhou, Y.; Zhu, S.; Zhou, X.; Zhu, Z.; Yi, F. Spaceborne-InSAR monitoring framework for large-span spatial structures based on temperature-based structural identification theory. Eng. Struct. 2026, 358, 122573. [Google Scholar] [CrossRef] [Scilit]
- Zhu, Z.; Rowlinson, S.; Chen, T.; Patching, A. Exploring the Impact of Different Registration Methods and Noise Removal on the Registration Quality of Point Cloud Models in the Built Environment: A Case Study on Dickabrma Bridge. Buildings 2023, 13, 2365. [Google Scholar] [CrossRef] [Scilit]

Disclaimer/Publisher’s Note: The statements, opinions and data contained in all publications are solely those of the individual author(s) and contributor(s) and not of MDPI and/or the editor(s). MDPI and/or the editor(s) disclaim responsibility for any injury to people or property resulting from any ideas, methods, instructions or products referred to in the content. |
© 2026 by the authors. Licensee MDPI, Basel, Switzerland. This article is an open access article distributed under the terms and conditions of the Creative Commons Attribution (CC BY) license.