


Abstract
Differences in area, orientation, and spatial organization within a residential community alter heat loss, solar heat gain, and daylighting. Uniform retrofit schemes may underperform for some floor plans. This study aims to develop a differentiated retrofit decision-making method at the floor plan scale and relate baseline performance deficiencies to retrofit responses. Three representative prototypes in Tianjin were modeled under consistent conditions to compare baseline deficiencies, retrofit responses, and strategies. Multi-objective optimization (MOO) used energy use intensity (EUI), total thermal discomfort hours (TDH), and useful daylight illuminance (UDI). The NSGA-II algorithm generated Pareto and Near-Pareto candidate solutions, which were screened against baseline performance deficiencies and ranked by entropy-weighted TOPSIS with initial investment; highly ranked solutions were checked for seasonal performance. EUI decreased by 5.64%, 5.35%, and 4.56%; TDH by decreased 2.02%, 0.95%, and 0.47%; and UDI increased by 6.66%, 17.27%, and 6.76%. Exterior wall insulation and improved balcony exterior windows were common measures. North–south two-bedroom units balanced energy, thermal comfort, and daylighting; east–west units emphasized thermal comfort and daylighting; compact south-facing one-bedroom units prioritized energy reduction while maintaining daylighting and controlling summer thermal risk. The method shows potential for differentiated retrofit decision making under similar climate and construction conditions.
1. Introduction
In the context of global improvements in energy efficiency and the low-carbon transition of the building sector, urban development in China is shifting from large-scale new construction to improving the quality and efficiency of the existing stock [1,2]. Many early urban residential buildings have inadequate thermal performance of the building envelope and relatively high heating and cooling demand. Retrofitting these buildings can reduce operational energy use and improve living quality [3]. Residential buildings in cold climate regions are dominated by winter heating demand. Poor envelope performance increases heat loss, while summer cooling and overheating must also be addressed [4]. Passive measures such as insulation, improved window performance, better airtightness, and shading can improve building energy and indoor thermal performance [5]. Therefore, existing residential buildings in cold climate regions have a clear need for passive retrofit.
Differences in area, orientation, and spatial organization among floor plans within the same residential community can alter building envelope exposure, solar heat gain, and daylighting conditions, resulting in different energy, thermal comfort, and daylighting performance [6,7]. The same retrofit measures may produce different performance benefits under different residential conditions [6,8].
Energy saving, thermal comfort, and daylighting are not always aligned, and different performance objectives can exhibit both synergies and trade-offs [9]. Retrofit effects in cold climate regions also differ between winter and summer, and improved annual performance does not necessarily imply improvements in both periods [4]. Candidate solutions generated by multi-objective optimization (MOO) cannot be directly regarded as final engineering solutions and require further selection based on actual performance needs and implementation conditions [10,11,12]. Therefore, retrofit strategies for different floor plans need to coordinate multiple performance objectives while considering winter and summer performance and the feasibility of implementation. This study examines three representative floor plans in an existing residential community in Tianjin to compare their baseline performance and retrofit responses, then combines MOO, winter and summer performance checks, and solution evaluation to develop differentiated retrofit strategies that match the performance deficiencies of different floor plans.
2. Related Works
2.1. Floor Plan Differences and Adaptability of Retrofit Measures in Existing Residential Buildings
Retrofit effectiveness in existing residential buildings in cold climate regions depends on factors such as construction period, building type, and existing envelope conditions, so the same retrofit measures do not necessarily produce the same results. Studies of residential buildings in cold European regions have reported clear differences in energy-saving effects among housing types [13]. Research on multifamily housing in cold regions of the United States and Finland has also shown that envelope characteristics and housing conditions lead to different energy use and retrofit performance [14]. Studies by Cao et al. and Wang et al. on existing residential buildings in severe cold and cold climate regions indicate that baseline building performance and climate conditions affect retrofit effectiveness [4,15]. From the perspectives of winter heating retrofit and wall insulation optimization, Xi et al. and Bai et al. showed that retrofit parameters also need to reflect the existing thermal conditions of residential buildings [16,17]. Therefore, existing residential buildings in cold climate regions do not share a uniform retrofit response. Previous studies have identified differences related to construction period, building type, and baseline envelope conditions, providing a basis for examining floor plan differences at a finer scale.
Floor plans and their spatial characteristics also affect residential building performance. Differences in orientation, spatial geometry, and balcony configuration change building envelope exposure, incoming solar radiation, and indoor environmental conditions. Ning et al. found that balcony configuration affects energy use and thermal comfort in residential buildings in cold climate regions [18]. Zhu et al. showed that the effects of spatial geometry and orientation on the thermal environment vary over the year [19]. Wen et al. also found that spatial configuration affects several aspects of building performance, including spatial form, daylighting, and microclimate performance [20,21]. Most related studies, however, focus on individual residential buildings or specific residential spaces. Direct comparisons of baseline performance and retrofit responses among floor plans with different areas, orientations, and spatial organizations within the same existing residential community have received less attention.
Residential retrofit in cold climate regions also differs between winter and summer. Wang et al. noted that high levels of insulation can reduce winter heat loss but may increase summer heat accumulation when adequate shading and ventilation are absent [4]. The performance of external shading and fixed horizontal overhangs is also affected by climate conditions and changes in solar radiation [22,23]. Zhu et al. examined thermal environment objectives in winter and summer separately and found that the influence of the same spatial parameter differed between the two periods [19]. Therefore, relying solely on annual aggregate results may obscure variations during winter or summer; it is necessary to further verify performance during these seasons to ensure that the solutions derived from annual optimization are representative.
2.2. Performance Trade-Offs and Decision-Making Methods for Multi-Objective Retrofit Solutions
Retrofitting existing residential buildings involves trade-offs among multiple performance requirements. A single objective cannot fully represent the overall performance of a retrofit solution, because different performance aspects may support or conflict with one another. Multi-objective optimization (MOO) provides a way to address these trade-offs. For residential buildings in cold climate regions, Liu et al. considered energy use, thermal comfort, daylighting, and economic performance, while Han et al. focused on energy use, indoor comfort, and economic performance [24,25]. Fan et al. considered annual energy use, thermal discomfort hours, and retrofit cost for an elderly apartment building in Beijing [26]. Other studies have further incorporated carbon emissions, as well as energy, economic, and daylighting indicators [27,28]. Although these studies have developed relatively complete multi-performance evaluation frameworks, most focus on a single building or a specific design object. Performance trade-offs and retrofit priorities among different floor plans within the same existing residential community have rarely been compared directly under a consistent evaluation framework.
Several approaches have been developed for multi-objective optimization and subsequent decision making. Shen used non-dominated sorting differential evolution for multi-objective search and hierarchical clustering to support Pareto solution selection, while Khare et al. used methods such as the non-dominated sorting genetic algorithm III (NSGA-III) for multi-objective optimization [29,30]. A systematic review showed that the non-dominated sorting genetic algorithm II (NSGA-II) remains the most widely used genetic algorithm in building retrofit and has a relatively mature basis for coupling with building performance simulation [31]. A related review indicated that the analytic hierarchy process is commonly used for judgment-based indicator weighting, whereas the technique for order preference by similarity to ideal solution (TOPSIS) is widely used to rank building retrofit solutions [32]. Therefore, this study uses NSGA-II for Pareto search, applies the entropy weighting method to determine weights based on differences among candidate-solution indicators, and combines it with TOPSIS for overall ranking to reduce the influence of preset subjective weights. However, post-processing of existing Pareto solution sets mainly focuses on solution classification, ranking, and selection, while relatively limited attention has been paid to the relationship between candidate solutions and the baseline performance deficiencies of different building prototypes.
The range of candidate solutions can also affect the final selection. Thrampoulidis et al. showed that solutions with performance close to the optimum remain useful for comparison even when they are not strictly optimal [12]. Gao et al. identified a selection gap between technically feasible optimization solutions and practical retrofit options, indicating that actual use requirements also need to be considered when selecting retrofit strategies [33]. Therefore, post optimization decision making should retain a sufficiently broad candidate space for engineering selection rather than stop at a single mathematical optimum. Few studies have jointly considered Pareto and Near-Pareto solutions in subsequent analysis and further connected them with variable effects, solution classification, and multi-criteria decision making (MCDM) to derive specific retrofit measures.
2.3. Contributions and Objectives
Existing research has three main limitations: (1) Residential prototypes are defined at a broad scale. Most studies classify prototypes by construction period or building type, with limited attention to differences in area, orientation, and spatial organization among floor plans within the same residential community. This limits performance diagnosis and the matching of retrofit measures at the floor plan scale. (2) Annual comprehensive evaluation does not fully capture winter and summer performance differences. Although energy use, thermal comfort, and daylighting have been included in multi-objective evaluation, annual optimization results are not adequately connected with performance in winter and summer. (3) Optimization results are difficult to translate into practical retrofit strategies. Candidate solution expansion, analysis of variable effects, solution classification, overall ranking, and comparison of initial investment are often handled separately, resulting in a weak connection between optimization results and practical retrofit strategies.
To address these issues, this study focuses on differentiated retrofit for different floor plans in existing residential buildings in cold climate regions and proposes a framework integrating MOO and decision making. The framework consists of three main components: baseline performance diagnosis, annual optimization with winter and summer performance checks, and candidate solution decision making. The main contributions are as follows:
- Diagnosing performance deficiencies at the floor plan scale. Representative floor plans with different areas, orientations, and spatial organizations within the same existing residential community are compared to identify the relationship between floor plan characteristics and performance deficiencies, providing a basis for detailed diagnosis and retrofit of existing residential buildings.
- Combining annual optimization with winter and summer performance checks for multi-performance evaluation. Energy use, thermal comfort, and daylighting are considered together, and separate winter and summer checks are added to annual MOO to identify performance changes that may be masked by improvements in annual overall performance. This makes the retrofit evaluation more complete and better suited to the climate characteristics of cold climate regions.
- Deriving retrofit strategies that match floor plan performance deficiencies from the candidate solution set. Pareto and Near-Pareto solutions are included in the candidate range and examined together with retrofit variable effects, solution classification, overall evaluation, and initial investment. This process produces specific retrofit strategies for the performance deficiencies of different floor plans and converts optimization results into engineering decisions.
3. Methodology
This study develops a multidimensional evaluation and MOO framework for the passive retrofitting of existing residential buildings in cold climate regions. The framework considers energy consumption, thermal comfort, daylighting, and initial investment to develop differentiated retrofit strategies that respond to the performance deficiencies of different floor plans.
Figure 1 presents the research framework, which consists of five steps. Step 1: conduct a field survey, extract three representative floor plan prototypes, and construct the corresponding models (Section 3.1). Step 2: perform operational-data calibration and baseline performance diagnosis for the three prototypes (Section 3.2). Step 3: determine the retrofit variables and performance evaluation indicators, conduct MOO, and construct the Pareto and Near-Pareto candidate solution sets (Section 3.3). Step 4: conduct correlation analysis on the independent solutions and K-means clustering on the candidate solution set, perform pre-ranking feasibility screening based on baseline performance diagnosis, and apply entropy-weighted TOPSIS to rank the feasible candidate solutions (Section 3.4). Step 5: conduct winter and summer performance checks for the highly ranked solutions, compare the combinations of retrofit variables in the top-ranked representative solution for each prototype, and develop differentiated retrofit strategies (Section 3.4).
Figure 1.
Research framework.
3.1. Case Study
3.1.1. Case Study Project Information
According to the thermal design classification specified in the Code for Thermal Design of Civil Building GB 50176-2016 [34], Tianjin is located in a cold climate region, with mean temperatures of −3.2 °C and 27.1 °C in the coldest and hottest months, respectively. The annual total solar radiation is approximately 5.0–5.6 GJ/m2 [35]. Figure 2c shows lower dry-bulb temperatures in winter and higher values in summer, seasonal variations in relative humidity, and solar radiation concentrated during daytime and stronger in spring and summer. These climatic conditions indicate that residential buildings are dominated by winter heating demand, while summer shading and daylighting also need to be considered. The study site is the Xue Huli Residential Community in Nankai District, Tianjin (Figure 2a). Constructed in 1987, the community is representative of multi-story residential buildings with brick masonry construction built in Tianjin during the 1980s. After prolonged use, the airtightness of exterior doors and windows has deteriorated, and the thermal performance of the building envelope has become inadequate, adversely affecting heating performance, indoor thermal comfort, and daylighting (Figure 2b).
Figure 2.
Research area and current situation.
The residential community consists of 28 residential buildings, each with five or six stories. North–south S-shaped slab-type residential buildings predominate, together with east–west curved residential buildings and staggered buildings, resulting in a variety of orientations and floor plans (Figure 3a). To obtain the basic information required for model development, the field survey recorded building layouts, floor plans, spatial dimensions, wall thicknesses, and exterior window types. In addition, 58 household survey records were collected, mainly covering household composition, annual occupancy, major electrical appliances, air-conditioning use, and monthly electricity-use information. These records were further screened according to floor plan type and data completeness for subsequent calibration. The questionnaire form used in this study is provided in Appendix A.1. The typical story height was approximately 2.80 m, and the net height of the main indoor spaces was approximately 2.65 m. For wall assemblies that could not be directly identified on site, the internal construction was inferred from measured wall thicknesses together with historical standards and construction information from the same period [36,37]. Based on the field survey and retrofit documentation for existing residential buildings in Tianjin [38,39], both direct exterior windows and balcony exterior windows were modeled as unplasticized polyvinyl chloride (uPVC)-framed insulating-glass windows. The main building information and thermal parameters of the envelope are summarized in Table 1.
Figure 3.
Distribution and classification of floor plan types.
Table 1.
Baseline model parameters of the existing residential building.
3.1.2. Selection of Representative Floor Plan Prototypes
A total of 324 residential units were counted on the standard floors of the 28 residential buildings shown in Figure 3b, covering nine floor plan types. By number of bedrooms, the units were classified into one-bedroom (A), two-bedroom (B), and three-bedroom (C) categories, and further divided into A1–A2, B1–B5, and C1–C2 (Figure 3c). The representative prototypes were selected considering both floor plan proportion and comparability. Two-bedroom units accounted for the largest proportion (67.9%), with B1 being the most common and selected as M1. B3 had a floor plan similar to B1 but a different orientation and was selected as M2 to compare the effect of orientation. A1 accounted for the largest proportion among one-bedroom units and, with its smaller area and compact spatial organization, was selected as M3. The three prototypes thus represent a common two-bedroom type, an orientation comparison type, and a compact one-bedroom type, respectively. Their floor plan characteristics are summarized in Table 2. The three prototypes cover the main floor plan types in the residential community while providing the necessary conditions for comparison, forming the basis for subsequent performance diagnosis and differentiated retrofitting.
Table 2.
Identification of representative prototypes.
3.2. Baseline Model Development and Calibration Using Operational Data
Baseline models of the three representative floor plans, M1, M2, and M3, were developed using Rhino and Grasshopper [40]. All three models represent units on intermediate floors. M1 and M3 are located in the middle section of Building 9, which is oriented north–south, while M2 is located in the middle section of Building 4, which is oriented east–west. Both buildings belong to the S-shaped residential cluster (Figure 3a). The indoor net height was set to 2.65 m, with individual rooms treated as the basic thermal zones. Exterior windows, balconies, stairwells, adjacent residential units, and shading from surrounding buildings were also considered. Annual energy consumption, thermal comfort, and daylighting simulations were performed using EnergyPlus (version 25.1.0) and Radiance (version 5.4) through Honeybee [41,42,43].
Model inputs were determined from the field survey and relevant reference materials. Geometric dimensions and envelope parameters were based on the survey results and supporting information described in Section 3.1.1. The initial 24 h occupancy, lighting, and equipment schedules were established with reference to relevant residential building standards and used as the initial operating settings for M1 calibration [44]. The schedules are provided in Appendix A.2. The heating and cooling setpoint temperatures were 18 °C and 26 °C, respectively [44,45]. Because window opening behavior is highly stochastic and varies among households, and complete hourly window opening data were unavailable, no dynamic window opening schedule was prescribed in the model. Weather data were obtained from the Tianjin typical meteorological year EnergyPlus weather file provided on the official EnergyPlus website [46]. The main performance simulation and evaluation parameters are summarized in Table 3.
Table 3.
Simulation parameter settings.
Among the 58 household survey records, calibration samples were selected according to floor plan type and the completeness of monthly electricity records for the full year. M1 was the most common floor plan in the community and had the largest number of complete operational records. Accordingly, 24 M1 households with complete monthly electricity data from January to December 2025 were retained for direct energy calibration. Monthly electricity consumption was averaged across the 24 households and normalized by the actual modeled floor area to obtain electricity EUI. The questionnaire also recorded the use of auxiliary electric heating devices in winter. Therefore, measured electricity consumption during the heating period already included possible supplementary electric heating. An equivalent EUI for central heating, converted according to the Tianjin residential heating tariff standard, was then added to obtain the monthly operational EUI. Because measured heat consumption was unavailable, the heating component was treated only as an equivalent energy estimate and was not independently calibrated against measured heating data. Starting from the initial M1 model, operating parameters were adjusted within reasonable ranges to reduce the deviation between monthly simulated energy use and operational EUI. Agreement between monthly simulated and operational energy consumption was evaluated using the normalized mean bias error (NMBE), coefficient of determination (R2), and coefficient of variation of the root mean square error (CV(RMSE)). NMBE reflects systematic bias, R2 reflects agreement in monthly variation trends, CV(RMSE) reflects relative dispersion error [47,48]. The equations are as follows:
where and are the operational EUI and simulated EUI for month , respectively; and are their corresponding mean values; and . Values of NMBE closer to 0, closer to 1, and lower CV(RMSE) indicate better agreement between the simulated results and operational data [49].
Following M1 calibration, the common operating settings adopted in the calibrated M1 model, including the 24 h occupancy, lighting, and equipment schedules and the heating and cooling setpoints, were applied to M2 and M3, whereas occupant density, geometry, orientation, and spatial organization remained prototype specific. Because the three prototypes are located within the same residential community and were evaluated under the same climatic and operational framework, the use of common operational settings reduces household-operation variability as a confounding factor and allows the comparison to focus on differences in floor-plan characteristics and retrofit responses. Because comparable complete full-year operational datasets were unavailable, M2 and M3 were not independently calibrated against full-year energy data. This assumption may underrepresent actual differences in household operation; therefore, the cross-prototype comparisons should be interpreted primarily as relative comparisons under a common operating basis informed by the M1 calibration, rather than as a complete representation of actual household operation.
3.3. Evaluation Framework and Multi-Objective Optimization Settings
3.3.1. Variable Selection
All three prototypes were selected from intermediate floors to control differences in thermal boundary conditions caused by floor position. Ground-floor units are directly exposed to the ground, while top-floor units are additionally affected by heat transfer through the roof and solar radiation, resulting in thermal boundary conditions that differ from those of intermediate-floor units. Therefore, this study focuses on residential units on intermediate floors. Exterior wall insulation thickness and material type were selected as the main variables for envelope optimization [16]. According to the Classification for Burning Behavior of Building Materials and Products GB 8624-2012 (XPS), and rock wool with a reaction-to-fire classification of at least B1 [50]. Insulation thickness ranged from 0 to 110 mm with a step of 10 mm. Candidate exterior window options included the existing window and four types of high-performance insulating-glass windows. Their performance was characterized by U-value, solar heat gain coefficient (SHGC), and visible transmittance (Tvis) [51,52]. Because enclosed balconies provide a thermal buffer, the exterior window variables were divided into direct exterior windows and balcony exterior windows [18]. External shading was represented by fixed horizontal overhangs with depths ranging from 0 to 600 mm at 100 mm intervals. Only interior wall and ceiling materials were considered for interior surface retrofits. Floor finishes were excluded from the unified optimization because they vary considerably among households. Wall and ceiling reflectance were included as low-cost interior surface retrofit parameters to evaluate their potential effects on daylighting and overall performance. A total of seven retrofit variables were defined. Their value ranges, calculation steps, material performance parameters, and unit prices are provided in Table 4. Prices were determined from publicly available construction cost information and market surveys in Tianjin and were used to calculate initial investment [53,54].
Table 4.
Measures for retrofits.
3.3.2. Evaluation Indicators
Passive retrofitting of existing residential buildings affects heat transfer, solar heat gain, and indoor daylighting conditions simultaneously, so a single energy-use indicator cannot fully capture retrofit performance. Therefore, considering retrofit variables such as envelope insulation, exterior windows, shading, and interior surface reflectance, this study establishes an evaluation framework covering energy performance, thermal environment, and daylighting. The evaluation uses annual energy use intensity (EUI), total thermal discomfort hours (TDH), and useful daylight illuminance (UDI) as indicators. These indicators, respectively, reflect overall operational energy use, thermal discomfort in winter and summer, and daylighting performance in the main living spaces, and also capture potential synergies and trade-offs among energy saving, thermal comfort, and daylighting. Initial investment and winter and summer indicators are used in subsequent decision making among the candidate solutions.
Objective 1 is to minimize EUI. EUI is defined as the annual building energy use per unit floor area and is widely used for comparing the energy performance of buildings with different floor areas [55]. According to the scope of building operational energy use specified in GB/T 51161-2016 and the end-use energy statistics from EnergyPlus/Honeybee, the EUI in this study includes heating, cooling, interior lighting, electric equipment, and domestic hot water [56]. It is calculated as follows:
where EUIheating, EUIcooling, EUIlight, EUIelectric, and EUIwater represent annual energy use for heating, cooling, interior lighting, electric equipment, and domestic hot water, respectively, and is the residential floor area. EUI is expressed in kWh/(m2·a). Electric equipment and domestic hot water remain unchanged among the retrofit solutions but are retained in EUI to maintain a consistent basis for evaluating total annual operational energy use.
Objective 2 is to minimize TDH. The household questionnaire indicated insufficient envelope insulation and reduced airtightness of doors and windows in the residential community, with excessively cold indoor conditions in winter being a common problem. Combinations of insulation, window types, and shading may also affect overheating in summer. Therefore, TDH considers both cold discomfort in winter and heat discomfort in summer. TDH is composed of cold discomfort hours (CDH) in winter and heat discomfort hours (HDH) in summer. It is calculated as follows:
TDH consists of cold discomfort hours (CDH) in winter and heat discomfort hours (HDH) in summer. The winter evaluation period follows the central heating period specified for Tianjin, from 15 November to 15 March of the following year [57], while the summer evaluation period is from 1 June to 31 August. A predicted mean vote (PMV) range of −0.5 to +0.5 is used as the thermal comfort range [58]. Thermal discomfort hours were further weighted according to the occupancy schedule. When PMV was below −0.5 in winter, the corresponding hourly occupancy fraction was accumulated into CDH; when PMV was above +0.5 in summer, the corresponding hourly occupancy fraction was accumulated into HDH. TDH was calculated as the sum of CDH and HDH.
Objective 3 is to maximize UDI. UDI represents the proportion of time during the specified evaluation period when illuminance on the work plane falls within the useful range and reflects annual dynamic daylighting performance [59]. A useful illuminance range of 100–2000 lx was adopted, with sensor points located on a reference plane 0.75 m above the floor [60]. Illuminance below 100 lx was considered insufficient for daylighting, while values above 2000 lx may cause visual discomfort or increase the risk of overheating [61]. UDI was calculated using all sensor points in the living room and bedrooms as follows:
where is the daylight illuminance at sensor point in room at time , is the number of sensor points in the corresponding room, is the daily evaluation period from 08:00 to 18:00 throughout the year, and is an indicator function.
In addition to the three optimization objectives, initial investment was calculated for each candidate solution. EUIheating, EUIcooling, CDH, and HDH were calculated for separate winter and summer performance checks. Initial investment was not included in MOO but was used as an evaluation indicator in the entropy-weighted TOPSIS ranking. The four winter and summer indicators were used only for separate performance checks to avoid double weighting with EUI and TDH. Initial investment included only the incremental costs of materials and components and was calculated as follows:
where qj(x) is the material quantity or retrofit area associated with measure in a given solution, and cj is the corresponding unit price. The investment associated with the existing-condition option was set to 0.
To facilitate economic comparison among floor plans with different areas, initial investment was further normalized by the floor area of each floor plan to calculate the initial investment per unit floor area:
where CA is the initial investment per unit floor area (CNY/m2), C is the total initial investment of the solution (CNY/apartment), and A is the floor area of the corresponding floor plan (m2).
In addition, annual operational energy cost savings were estimated for the representative solutions to supplement the evaluation of their economic performance. Because the retrofit variables mainly affect heating and cooling loads, annual cost savings were calculated from the changes in EUIheating and EUIcooling before and after retrofit:
where Ph and Pe are the residential heat tariff and electricity price, taken as 0.13 CNY/kWh and 0.49 CNY/kWh, respectively [62]. COP c is the coefficient of performance of the cooling equipment and is set to 2.5 [63,64]. A is the floor area of the corresponding floor plan; EUIh,b and EUIh,r are the baseline and post-retrofit EUIheating, respectively; and EUIc,b and EUIc,r are the baseline and post-retrofit EUIcooling, respectively. Because data on the contributions of different heating modes were unavailable, supplementary electric heating in winter was not converted separately.
3.3.3. Multi-Objective Optimization Algorithm
Based on the mature application of NSGA-II in multi-objective optimization for building retrofit and its compatibility with the Grasshopper–Wallacei performance simulation workflow used in this study, NSGA-II in Wallacei X was adopted for the Pareto search [31,65]. A configuration of 50 individuals over 50 generations has been adopted in previous simulation-driven building performance optimization studies involving existing residential building retrofits, shading–daylighting optimization, and daylight–thermal performance optimization in severe cold regions [66,67,68]. With reference to these studies and considering the computational cost of solution-by-solution simulations using EnergyPlus and Radiance, the population size and number of generations were both set to 50, with crossover and mutation probabilities of 0.9 and 0.1, respectively, resulting in 2500 raw evaluation records for each floor plan type.
All calculations were performed on the same workstation equipped with an Intel Core i7-12700F processor, 16 GB RAM, and Windows 10. The main software environment comprised Rhino 8.28, Grasshopper, and Wallacei X 2.7, with EnergyPlus and Radiance accessed through Ladybug Tools 1.10. Convergence was considered to have been reached when the magnitude of objective improvement, the number of non-dominated solutions, and the position of the Pareto front became stable during the later generations. The checks showed that solutions with the same X1–X7 combination produced identical EUI and TDH values. The differences were mainly limited to small fluctuations in UDI caused by stochastic sampling in Radiance [69]. Therefore, repeated solutions with the same variable combination were merged, and the mean of their simulated results was used as the performance value of the corresponding independent solution before non-dominated sorting. To retain candidate solutions with performance close to the Pareto front, Near-Pareto distance was defined based on the relative performance loss of EUI, TDH, and UDI:
where Px is the set of Pareto solutions that dominate solution x, and dNP(x) represents the minimum relative maximum performance loss of solution x with respect to the dominating Pareto solutions. In this study, 1% was used as the Near-Pareto threshold. Solutions satisfying 0 < dNP(x) ≤ 0.01 were classified as Near-Pareto solutions. This definition allows EUI, TDH, and UDI to be compared on the same relative scale, while retaining a moderate candidate space for subsequent strategy development [12]. In addition, sensitivity tests were conducted using thresholds of 0.5%, 1%, and 2% to examine the influence of threshold selection on the candidate solution set. The Pareto solutions and the Near-Pareto solutions under the 1% threshold together formed the candidate solution set for subsequent decision making.
3.4. Data Processing
3.4.1. Correlation Analysis
Spearman’s rank correlation coefficient was used to identify the direction and strength of monotonic relationships between retrofit parameters and performance objectives [70,71,72]. For any two variables, the Spearman correlation coefficient is calculated as follows:
where Ri and Si are the ranks of the two variables, respectively, and is the number of valid samples. The value of ranges from [−1, 1]. Its sign indicates the direction of the correlation, while a larger absolute value indicates a stronger correlation. The analysis was conducted separately using all independent solutions obtained after duplicate retrofit variable combinations were merged for M1, M2, and M3. The input variables included exterior wall insulation thickness; the thermal conductivity λ, density ρ, and specific heat capacity cp of the insulation material; the U-value, SHGC, and Tvis of the two exterior window categories; fixed horizontal overhang depth; interior wall material reflectance; and ceiling material reflectance.
3.4.2. Candidate Solution Post-Processing and Clustering
The candidate solution set consisted of Pareto and Near-Pareto solutions. The K-means algorithm from the scikit-learn library was implemented in Python (version 3.13.7) to cluster the candidate solution sets of M1, M2, and M3 separately [73]. EUI, TDH, and UDI were used as the clustering indicators. Before clustering, each indicator was normalized using min–max normalization:
where is the original value of indicator or solution , and is the corresponding normalized value. K-means measures similarity between solutions using Euclidean distance and forms clusters by minimizing the within-cluster sum of squares (WCSS):
where is cluster , is its cluster centroid, and is the number of clusters. The optimal number of clusters was determined using the elbow method. WCSS values were calculated sequentially for = 1 to 12, and the value corresponding to the elbow point of the curve was selected as the final number of clusters [74].
3.4.3. Entropy-Weighted TOPSIS for Multi-Criteria Decision Making
To keep the overall decision-making process consistent with the baseline performance diagnosis, candidate solutions were screened for feasibility against the baseline before entropy-weighted TOPSIS ranking. For indicators identified as requiring improvement or preservation, cost-type indicators were not allowed to exceed their baseline values, while benefit-type indicators were not allowed to fall below their baseline values. No additional thresholds were imposed on the other indicators, which were still balanced through the subsequent overall ranking. The feasible candidate solutions were then ranked using entropy-weighted TOPSIS. The entropy weighting method determines indicator weights from their dispersion within the feasible candidate solution set, reducing the influence of preset subjective weights. TOPSIS evaluates the overall performance of each solution by comparing its distances from the positive and negative ideal solutions [75]. The evaluation indicators include EUI, TDH, UDI, and initial investment. First, the indicators were converted to a consistent preference direction and normalized using min–max normalization:
After normalization, a larger value indicates better performance for all indicators. The proportion of solution i under indicator j was then calculated as:
The information entropy, difference coefficient, and objective weight of indicator j were calculated as:
where a smaller indicates greater differentiation of that indicator among the candidate solutions, corresponding to larger and The entropy weight reflects the information variation of an indicator within the current candidate solution set and does not represent the physical influence of a retrofit variable.
The weighted normalized decision matrix was then constructed using the entropy weights:
Because all indicators had already been transformed to the same preference direction, the positive and negative ideal solutions were defined as:
The Euclidean distances between each candidate solution and the positive and negative ideal solutions were calculated as:
The relative closeness of each solution was finally calculated as:
The value of ranges from 0 to 1. A larger value indicates that the solution is closer to the positive ideal solution and receives a higher overall ranking [26]. The feasible candidate solutions were ranked according to their closeness coefficients, and the top five solutions were selected for comparison of retrofit variables and performance. The first-ranked solution was used as the representative solution for each floor plan. To further examine winter and summer differences that may be masked by the annual overall indicators, the EUIheating, EUIcooling, CDH, and HDH of the top five solutions were compared. These winter and summer indicators were not included in the TOPSIS decision matrix and were used only to characterize the winter and summer performance of the highly ranked solutions. The change in each seasonal indicator was calculated as follows:
where is the corresponding winter or summer performance indicator of a candidate solution and is the corresponding value of the baseline model for that floor plan. Lower values are preferred for all four indicators. Therefore, indicates performance improvement, whereas indicates performance deterioration.
4. Results
4.1. Model Calibration and Baseline Performance Diagnosis
Figure 4 compares the monthly operational EUI and simulated EUI of M1. The NMBE, R2, and CV(RMSE) values are 0.90%, 0.9697, and 25.93%, respectively. The two datasets show similar seasonal variation trends, but the CV(RMSE) exceeds the recommended calibration value for monthly data in ASHRAE Guideline 14, indicating noticeable monthly dispersion. Therefore, the simulation framework is used primarily to compare the relative performance of retrofit alternatives within each prototype under consistent operating conditions. On this basis, the baseline performance differences among M1, M2, and M3 should be interpreted primarily as floor-plan differences under consistent operating conditions rather than as a complete representation of differences in actual household operation.
Figure 4.
Comparison of monthly operational and simulated EUI for M1 model calibration.
Under the consistent simulation conditions described above, the three prototypes showed different baseline performance characteristics (see Table 5). Heating dominated energy use in all three, and TDH exceeded 3000 h, but their main performance deficiencies differed. M1 had relatively low EUI and TDH, at 199.14 kWh/(m2·a) and 3071.00 h, respectively, but its UDI was only 34.72% and CDH reached 1876.67 h, indicating that although its energy use was relatively low, winter thermal discomfort and daylighting still had room for improvement. Therefore, subsequent optimization should balance all three objectives. M2 had an EUI similar to M1, but the highest TDH (3128.67 h), the lowest UDI (34.19%), and an HDH of 1241.07 h, indicating more pronounced thermal comfort and daylighting deficiencies. Therefore, TDH and UDI should be prioritized. M3 had the highest UDI (45.50%) but also the highest EUI (223.16 kWh/(m2·a)); its EUIheating and EUIcooling were both higher than those of M1 and M2, while its TDH was 3076.65 h. This indicates that the higher energy use per unit area did not substantially improve thermal comfort performance. Therefore, M3 should prioritize energy reduction while maintaining its daylighting advantage. Overall, M1 requires coordinated improvement across multiple performance aspects, M2 mainly requires improvements in thermal comfort and daylighting, and M3 is primarily constrained by high energy use per unit floor area. These differences provide the basis for subsequent feasibility screening and differentiated retrofit strategies.
Table 5.
Baseline performance comparison of the three prototypes.
4.2. Results of Multi-Objective Optimization
4.2.1. Pareto and Near-Pareto Optimization Results
Based on the baseline performance deficiencies of the three floor plans, this section compares their optimization potential and trade-offs among EUI, TDH, and UDI and constructs the candidate solution sets. Each floor plan produced 2500 valid records, and the extreme objective values stabilized in the later stages of optimization. After merging solutions with identical retrofit variable settings, 457, 432, and 351 independent solutions remained for M1, M2, and M3, respectively. After reapplying non-dominated sorting, M1, M2, and M3 yielded 193, 159, and 78 Pareto solutions, respectively. With a 1% performance tolerance, 194, 194, and 214 Near-Pareto solutions were further identified, giving final candidate sets of 387, 353, and 292 solutions. Threshold sensitivity analysis showed that under tolerances of 0.5%, 1%, and 2%, the candidate-set sizes were 334, 387, and 417 for M1; 299, 353, and 404 for M2; and 230, 292, and 336 for M3, respectively. The 2% tolerance included more than 90% of the independent solutions for all three prototypes, whereas the 0.5% tolerance markedly narrowed the candidate range. Therefore, 1% was adopted as a compromise threshold.
The minimum EUI values for M1, M2, and M3 were 185.61, 185.29, and 209.81 kWh/(m2·a), representing reductions of 6.79%, 7.75%, and 5.98% from the corresponding baselines. The largest reductions in TDH were 2.97%, 2.22%, and 2.34%, while the largest increases in UDI were 18.90%, 26.14%, and 10.24%. The three floor plans differ in their optimization potential. M2 has greater potential for energy saving and daylighting improvement, whereas M1 shows relatively greater potential for thermal comfort improvement. These extreme values come from different solutions, however. Some low-EUI solutions are still accompanied by higher TDH or lower UDI, indicating that all three objectives cannot reach their optimum values in the same solution.
All three floor plans have some potential for improvement, but the optimum value of each objective occurs in a different solution. Figure 5 shows the distribution of the solutions in the three-objective performance space and allows the relationships among the objectives to be compared. In M1, the overall relationship between EUI and TDH is relatively weak, although some low-EUI solutions still correspond to relatively high TDH, indicating a certain trade-off between energy use and thermal comfort. UDI also varies widely among solutions with similar EUI. For M2, EUI and TDH can decrease together in part of the solution space, but improvements in UDI are usually accompanied by increases in both indicators, placing a stronger constraint on daylighting improvement. In M3, relatively low EUI can still occur together with high UDI, showing some synergy between the two objectives, whereas solutions with low TDH have greater difficulty maintaining high UDI. Most Near-Pareto solutions are distributed close to the Pareto front, providing additional options for subsequent solution selection.
Figure 5.
Distribution of independent, Pareto, and Near-Pareto solutions in the three-objective performance space for the three prototypes.
4.2.2. Relationships Between Retrofit Variables and Performance Indicators
Figure 6 shows clear differences in the responses of the three floor plans to the retrofit variables. Insulation thickness is negatively correlated with EUI for all three floor plans, but the correlation is weaker for M3 (−0.52) than for M1 (−0.92) and M2 (−0.74). The correlations between insulation thickness and TDH are considerably weaker. M1 shows almost no monotonic relationship (0.01), while M2 and M3 show weak negative correlations (−0.23 and −0.16, respectively). After separating TDH into CDH and HDH, the correlations of both CDH and HDH with insulation thickness are close to zero for M1. For M2 and M3, CDH changes little, and the decrease in TDH with increasing insulation thickness is mainly associated with lower HDH. These results indicate different thermal-comfort responses to insulation thickness among the three floor plans. The M3 solutions are also more concentrated along the EUI dimension in Figure 5. Its smaller floor area, south-facing orientation, and EUI response being more concentrated on parameters such as the direct exterior window may limit differences among candidate solutions. Increasing overhang depth generally reduces TDH but also lowers UDI. M1 and M2 are mainly affected by the balcony exterior window, whereas M3 is more strongly controlled by the direct exterior window. Interior wall and ceiling reflectance have relatively weak overall effects.
Figure 6.
Spearman correlation heatmaps between design variables and performance objectives for the three prototypes.
4.3. Results of Clustering
Section 4.2 shows that the candidate solutions for the three floor plans differ in their objective trade-offs and responses to the retrofit variables. To identify groups with similar performance, K-means clustering was conducted separately for the three floor plans. The elbow method identified four clusters for each floor plan (Figure 7). The four clusters contain 109, 163, 90, and 25 solutions for M1; 96, 105, 103, and 49 for M2; and 63, 86, 100, and 43 for M3. As shown in Figure 8 and Figure 9, the clusters exhibit distinguishable performance distributions and represent the main trade-offs within each candidate set. Cluster 4 is relatively small for all three floor plans, representing less common performance patterns.
Figure 7.
Elbow method for determining the optimal number of clusters.
Figure 8.
K-means clustering results in the three-objective performance space.
Figure 9.
Cluster-wise performance boxplots.
In M1 and M2, solutions with better daylighting generally have more thermal discomfort hours, whereas those with better thermal comfort tend to have poorer daylighting. M3 differs from this pattern: low-energy solutions can still maintain good daylighting, and its solution differences are more strongly reflected in the trade-off between thermal comfort improvement and daylighting retention. In M1, Clusters 1 and 2 are both in the low-energy range, with median EUI values of 188.67 and 188.20 kWh/(m2·a); Cluster 1 has a higher UDI of 39.48%, while Cluster 2 has a lower TDH. Cluster 4 has the lowest TDH (2983.60 h) but a lower UDI of 31.09%. For M2, Cluster 1 has the lowest EUI and TDH, at 187.78 kWh/(m2·a) and 3075.77 h, whereas Cluster 3 reaches a UDI of 41.58% with a TDH of 3149.80 h. M3 shows a different pattern: Cluster 1 combines the lowest EUI with the highest UDI, at 211.98 kWh/(m2·a) and 48.44%, while Cluster 3 has the lowest TDH (3018.45 h) but a lower UDI of 42.51%. These results indicate that lower-energy M3 solutions can retain good daylighting, while further thermal comfort improvement may reduce daylighting. Clustering was used only to interpret performance patterns and was not involved in the TOPSIS ranking.
4.4. Results of Entropy-Weighted TOPSIS Decision-Making
Entropy-weighted TOPSIS was used to prioritize solutions within the feasible candidate solution set. Based on the baseline performance diagnosis in Section 4.1, Pareto and Near-Pareto solutions were first screened for feasibility and then evaluated using EUI, TDH, UDI, and initial investment.
4.4.1. Feasibility Screening, Entropy Weighting, and Overall Ranking
Different feasibility criteria were applied to the three prototypes according to their baseline performance deficiencies. M1 required balanced improvement across multiple performance aspects, so no additional single-indicator threshold was imposed, and all 387 candidates entered the overall evaluation. For M2, thermal comfort and daylighting were the main deficiencies. Therefore, TDH was required to remain at or below the baseline value of 3128.67 h and UDI at or above 34.19%, leaving 177 feasible solutions. For M3, high EUI was the main deficiency while its daylighting advantage needed to be maintained. Therefore, EUI was limited to 223.16 kWh/(m2·a) or less and UDI to 45.50% or more, leaving 122 feasible solutions. Entropy weights for EUI, TDH, UDI, and initial investment were then calculated from each feasible candidate set (Table 6). The EUI weight for M3 was only 0.110 because its EUI values were relatively concentrated within the feasible set. Entropy weights reflect the dispersion of an indicator within the current solution set rather than its importance as a retrofit objective.
Table 6.
Entropy-weighting results.
The TOPSIS ranking is shown in Figure 10. All top five solutions for M1 are Pareto solutions; the top five for M2 include four Pareto and one Near-Pareto solution; and those for M3 include one Pareto and four Near-Pareto solutions. The first-ranked solutions are RP166, RP110, and NP088 for M1, M2, and M3, respectively. Figure 11 shows the parameters and performance of the top five solutions, while Figure 12 compares their changes from the baseline. The M1 solutions use 70–110 mm exterior wall insulation, all adopt bw2 balcony exterior windows, mainly use dw2 direct exterior windows, and apply 0–200 mm fixed horizontal overhangs. M2 mainly uses 100–110 mm exterior wall insulation, dw2/bw2 windows, and 100–200 mm fixed horizontal overhangs. All M3 solutions use dw4 direct exterior windows, bw2 balcony exterior windows, and 100–200 mm fixed horizontal overhangs. For M1, EUI decreases by 4.64–5.64%, UDI increases by 4.75–10.91%, and TDH decreases by 1.79–2.33%. For M2, EUI and TDH decrease by 5.35–5.88% and 0.95–1.26%, respectively, while UDI increases by 13.74–17.27%. For M3, EUI decreases by 3.89–4.65%, TDH by 0.34–0.78%, and UDI increases by 4.26–7.04%.
Figure 10.
Ranking curves of TOPSIS relative closeness for feasible candidate solutions of the three prototypes.
Figure 11.
Parameter-performance profiles of the top five solutions.
Figure 12.
Performance comparison of the top five solutions with the baselines.
4.4.2. Representative Solutions and Winter and Summer Performance Checks
To examine winter and summer differences that may be masked by the annual evaluation, EUIheating, EUIcooling, CDH and HDH were compared for the top five TOPSIS solutions of each prototype (detailed results are provided in Appendix B). These indicators were used only to characterize the winter and summer performance of highly ranked solutions. Based on the ranking in Section 4.4.1, RP166, RP110, and NP088 were selected as the representative solutions for M1, M2, and M3, respectively.
The results are shown in Table 7. For M1-RP166, EUIheating and EUIcooling decrease by 8.21% and 6.56%, respectively; CDH increases slightly by 0.58%, while HDH decreases by 6.11%. For M2-RP110, EUIheating and EUIcooling decrease by 7.69% and 6.47%, CDH remains unchanged, and HDH decreases by 2.40%. For M3-NP088, EUIheating and EUIcooling decrease by 4.27% and 10.88%, while CDH increases slightly by 1.34% and HDH decreases by 3.24%. The occupancy-weighted winter CDH upper limit is 1887.60 h under the adopted occupancy schedule, which is reached by all top-five M1 and M2 solutions, indicating little reduction in winter cold-discomfort periods. Overall, heating and cooling energy use and summer HDH improve in all three representative solutions, whereas the slight CDH increases in M1 and M3 indicate that the TDH reductions mainly result from lower summer heat discomfort, with some winter–summer trade-offs remaining.
Table 7.
Winter and Summer Performance Checks of the TOPSIS Rank-1 Representative Solutions for the Three Prototypes.
4.5. Combined Retrofit Strategies for Different Floor Plans
After identifying the first-ranked TOPSIS solution for each prototype, their retrofit-variable combinations were compared (Table 8). M1 uses 110 mm XPS exterior wall insulation, dw3/bw2 windows, a 100 mm fixed horizontal overhang, wm1 wall material, and cm2 ceiling material. M2 uses 100 mm EPS, dw2/bw2 windows, a 100 mm fixed horizontal overhang, and retains wm1 and cm1. M3 uses 100 mm XPS, dw4/bw2 windows, a 100 mm fixed horizontal overhang, wm1 wall material, and cm2 ceiling material. M1 balances energy use, thermal comfort, and daylighting through thicker XPS insulation and a dw3 direct exterior window. M2 combines EPS insulation, dw2/bw2 windows, and shallow shading to improve daylighting while maintaining thermal comfort. M3 uses XPS insulation, a dw4 direct exterior window, and shallow shading to reduce energy use while maintaining its daylighting advantage.
Table 8.
Strategy summary table.
The initial investments per unit floor area are 146.12, 112.32, and 116.22 CNY/m2 for M1, M2, and M3, respectively, while annual operational energy cost savings are 113.6, 109.4, and 68.6 CNY/(apartment·a). M1 achieves the highest annual savings; M2 has the lowest unit-area initial investment with savings close to M1; and M3 provides relatively lower direct economic benefits.
5. Discussion
5.1. Performance Effects of Key Variables and Trade-Offs Between Winter and Summer Indicators
Envelope-related variables show clear effects in all three prototypes, but their influence varies with floor plan and seasonal conditions. Insulation thickness is negatively correlated with EUI in M1, M2, and M3 (−0.92, −0.74, and −0.52), while its correlations with TDH are much weaker (0.01, −0.23, and −0.16). Thus, increased insulation is consistently associated with lower EUI, whereas its thermal comfort effect depends more on floor plan and season. CDH and HDH decomposition shows weak seasonal responses in M1, while the TDH reductions in M2 and M3 are mainly associated with lower HDH. Xie et al. used 76.93 mm XPS insulation and reported a 15.1% reduction in EUI [76]. Liu et al. also found diminishing energy-saving benefits with increasing insulation thickness [77], consistent with this study. The representative solutions reduce total EUI by 4.56–5.64%, with differences in magnitude also related to baseline conditions and energy-accounting boundaries. Window and shading effects are more floor-plan dependent: M1 and M2 are mainly affected by the balcony exterior window, whereas M3 is more strongly affected by the direct exterior window. Overhang depth is negatively correlated with TDH but more strongly with UDI, and all three representative solutions adopt a 100 mm fixed horizontal overhang, reflecting a thermal comfort–daylighting trade-off. This agrees with previous studies showing that shading performance depends on climate and orientation [78,79]. Interior wall and ceiling reflectance show relatively low sensitivity; however, because these measures are low-cost, easy to implement, and their effects were uncertain before optimization, they were retained, while future studies may streamline such low-impact variables.
These floor-plan differences are also reflected in annual and seasonal performance. Total EUI decreases by 5.64%, 5.35%, and 4.56% for M1, M2, and M3, respectively, with both EUIheating and EUIcooling decreasing in all three cases. HDH decreases by 6.11%, 2.40%, and 3.24%, whereas CDH changes by +0.58%, approximately 0, and +1.34%. Thus, annual EUI and TDH improvements do not necessarily imply simultaneous winter and summer improvements. The TDH reductions in M1 and M3 mainly result from lower summer HDH, supporting the need for seasonal checks in cold climate regions [4]. Electric equipment and domestic hot water remain unchanged among retrofit solutions. Including them in EUI does not affect relative comparisons within the same prototype but reduces the apparent percentage of energy savings attributable to envelope retrofit measures. This study focuses on intermediate-floor units to control thermal boundary differences. If ground- and top-floor units are included, ground and roof heat transfer and roof solar gains would become additional factors, potentially increasing the priority of insulation and shading measures.
5.2. Economic Benefits and Cross-Regional Transferability of Differentiated Strategies
The three prototypes ultimately require different retrofit priorities. M1 emphasizes the balance among energy use, thermal comfort, and daylighting, M2 focuses on thermal comfort and daylighting, and M3 prioritizes energy reduction while maintaining its existing daylighting advantage. This indicates that retrofit measures within the same residential community should respond to the baseline deficiencies of different floor plans. The initial investments per unit floor area for M1, M2, and M3 are 146.12, 112.32, and 116.22 CNY/m2, respectively, while annual operational energy cost savings are 113.6, 109.4, and 68.6 CNY/(apartment·a). M1 achieves the highest annual savings; M2 has the lowest unit-area initial investment with savings close to M1; and M3 has the lowest total investment per apartment but slightly higher unit-area investment than M2 and lower annual savings. Thus, economic comparisons among floor plans of different sizes should consider both total and unit-area investment, while practical selection still requires trade-offs among initial investment, energy savings, thermal comfort, and daylighting.
The retrofit parameters identified here are derived from three prototypes in a 1980s brick-masonry residential community in Tianjin and should not be treated as general parameters for residential buildings in cold climate regions. The results indicate the potential value of performance diagnosis at the floor plan scale and differentiated matching of retrofit measures. M2 and M3 use the common operating settings adopted in the calibrated M1 model. For M2, which is similar to M1 in floor area and spatial organization, these settings help isolate the effect of orientation. In contrast, M3 differs more from M1 in floor area and floor-plan characteristics, so its EUI and TDH results may be more affected by actual household operation. When this approach is applied to other cities, construction periods, or residential building types, the key parameters and economic performance should be reassessed according to local climate, envelope conditions, occupant behavior, and energy prices.
5.3. Limitations
Despite the contributions of this study, several limitations remain. (1) Uncertainty remains in model calibration. For M1, the NMBE and R2 are 0.90% and 0.9697, respectively, while the CV(RMSE) of 25.93% exceeds the recommended monthly calibration value in ASHRAE Guideline 14. Central heating was represented by an equivalent energy estimate because measured heat-use data were unavailable. M2 and M3 were not independently calibrated against full-year operational data; instead, common operational settings consistent with M1 were applied to maintain comparability under uniform conditions. Accordingly, the study focuses primarily on relative retrofit performance within each prototype. (2) In addition to central heating, air conditioners and electric heaters are used for supplementary winter heating. Because equipment-level operating hours and heat outputs were unavailable, the contributions of different heating modes could not be separated, and supplementary electric heating was not separately accounted for in annual operational energy cost savings. (3) The study considers three representative intermediate-floor prototypes from a 1980s brick-masonry residential community in Tianjin. Therefore, the specific retrofit parameters should not be interpreted as universal recommendations; rather, the results demonstrate the methodological potential of floor-plan-scale performance diagnosis and differentiated retrofit decision making under comparable conditions.
6. Conclusions
This study examined three representative intermediate-floor prototypes in a 1980s existing residential community in Tianjin, China, and developed a differentiated retrofit framework linking floor-plan performance diagnosis, multi-objective optimization, and retrofit decision making. Annual EUI, winter and summer thermal discomfort hours, and UDI in the main rooms were used as the optimization objectives, with seasonal performance checks and economic evaluation to better address cold-climate seasonal characteristics and practical decision-making needs. The main conclusions are as follows:
- Within the three prototypes studied, differences in floor area, orientation, and spatial organization lead to different baseline performance deficiencies. The north–south two-bedroom prototype requires a balance among energy use, thermal comfort, and daylighting; the east–west two-bedroom prototype requires greater improvement in thermal comfort and daylighting; and the compact south-facing one-bedroom prototype should prioritize energy reduction while maintaining its existing daylighting advantage.
- For the three representative solutions, EUI decreases by 5.64%, 5.35%, and 4.56%, TDH decreases by 2.02%, 0.95%, and 0.47%, and UDI increases by 6.66%, 17.27%, and 6.76%, respectively. Seasonal checks show reductions in both EUIheating and EUIcooling and improvements in HDH for all three prototypes. However, CDH increases slightly by 0.58% and 1.34% for M1 and M3, respectively, while remaining nearly unchanged for M2. Thus, the TDH reductions mainly result from lower summer heat discomfort, indicating that annual improvements do not necessarily imply simultaneous winter and summer improvements. Annual evaluation should therefore be supplemented by seasonal performance checks.
- Pareto and Near-Pareto candidate solutions were evaluated to convert optimization results into practical retrofit strategies. In this case, exterior wall insulation, bw2 balcony exterior windows, and a 100 mm fixed horizontal overhang are common measures across the three representative solutions, while insulation material and thickness, direct exterior windows, and interior surface materials vary with floor plan performance deficiencies. These results indicate that the proposed decision process has potential for supporting differentiated retrofit at the floor plan scale, but the specific parameters require further validation in other residential buildings and climate conditions.
Future work should further expand both the operational dataset and the range of case studies. First, independent full-year operational data and measured heating use should be collected for different floor plans to strengthen model calibration and assess the influence of shared operational settings. Second, equipment-level operating hours and heat-output data for supplementary heating should be collected to better distinguish the contributions and operational costs of different heating modes. Third, the framework should be applied to more residential communities, construction periods, floor positions, and climatic conditions to test its transferability and further evaluate the application potential of floor-plan-scale differentiated retrofit decision making.
Author Contributions
Conceptualization, J.L.; methodology, J.L. and H.Z.; software, J.L.; validation, J.L.; formal analysis, J.L.; investigation, J.L.; resources, J.G.; data curation, J.L.; writing—original draft preparation, J.L.; writing—review and editing, J.G. and J.L.; visualization, J.L. and H.Z.; supervision, J.G. and H.Z.; project administration, J.G. All authors have read and agreed to the published version of the manuscript.
Funding
This research received no external funding.
Institutional Review Board Statement
The questionnaire was non-interventional and focused on housing characteristics, occupancy conditions, appliance use, indoor environmental conditions, and household energy use. No names, contact details, or other directly identifiable sensitive personal information were collected. Participation was voluntary, and the data were processed anonymously and used in aggregated form for the research. Therefore, no formal ethics review was undertaken for this study.
Informed Consent Statement
Before the questionnaire survey was conducted, the residents were informed of the purpose of the study, the intended use of the information collected, and the anonymous treatment of the data. Participation was voluntary, and the residents agreed to participate and to allow the information they provided to be used for this research. All related data were processed anonymously, without directly identifiable personal information.
Data Availability Statement
The simulation and optimization data supporting the findings of this study are available from the corresponding author upon reasonable request. The questionnaire instrument and normalized residential schedules are provided in Appendix A. Household-level questionnaire responses and operational energy-use data are not publicly available due to privacy considerations.
Acknowledgments
The authors would like to thank the residents of Xue Huli Residential Community for their participation in the field survey and household questionnaire, and for providing household information and operational energy use data that supported the model calibration and case study analysis.
Conflicts of Interest
The authors declare no conflicts of interest.
Abbreviations
The following abbreviations are used in this manuscript:
| MOO | multi-objective optimization |
| EUI | energy use intensity |
| TDH | total thermal discomfort hours |
| UDI | useful daylight illuminance |
| MCDM | multi-criteria decision making |
| NSGA-III | non-dominated sorting genetic algorithm III |
| NSGA-II | non-dominated sorting genetic algorithm II |
| TOPSIS | technique for order preference by similarity to ideal solution |
| NMBE | normalized mean bias error |
| CV(RMSE) | coefficient of variation of the root mean square error |
| HDH | heat discomfort hours |
| PMV | predicted mean vote |
| CDH | cold discomfort hours |
| EPS | expanded polystyrene |
| XPS | extruded polystyrene |
| SHGC | solar heat gain coefficient |
| Tvis | visible transmittance |
| COP | coefficient of performance |
| WCSS | within-cluster sum of squares |
Appendix A
Appendix A.1. Household Questionnaire
Xue Huli Residential Community: Questionnaire On Household Energy Use And Indoor Environmental Conditions For Typical Floor Plan Types
1. Which of the following floor plan categories best describes your home?
◯ One-bedroom apartment, approximately 40 m2 (Please answer Question 2)
◯ Two-bedroom apartment, approximately 70 m2 (Please answer Question 3)
◯ Three-bedroom apartment, approximately 90 m2 (Please answer Question 4)
◯ None of the above (Please end the questionnaire.)
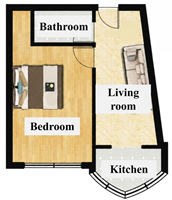
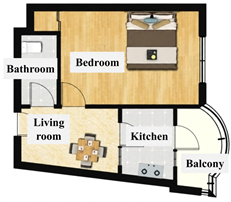
2. Based on the floor plan diagrams, please select the one-bedroom floor plan that most closely matches your home.
| ◯ T1: Approx. 40 m2, south orientation | ◯ T2: Approx. 40 m2, east orientation |
 |  |
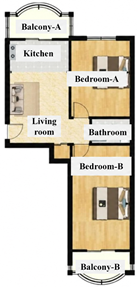
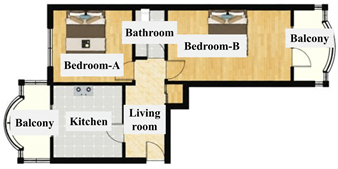
3. Based on the floor plan diagrams, please select the two-bedroom floor plan that most closely matches your home.
| ◯ T1: Approx. 70 m2, north–south orientation | ◯T2: Approx. 70 m2, east–west orientation |
 |  |
| ◯ T3: Approx. 60 m2, north–south orientation | ◯ T4: Approx. 64 m2, north–south orientation |
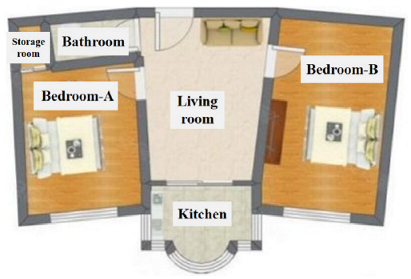 | 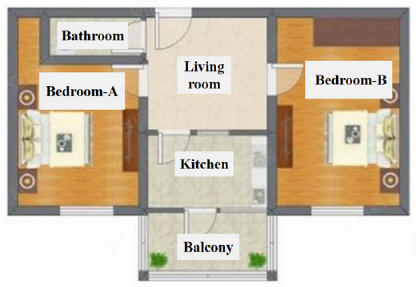 |
| ◯ T5: Approx. 50 m2, north–south orientation | |
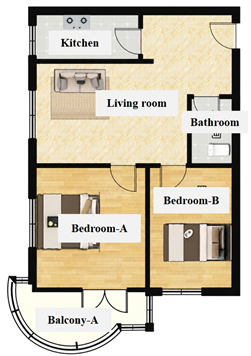 |
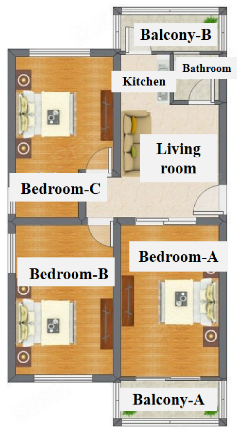
4. Based on the floor plan diagrams, please select the three-bedroom floor plan that most closely matches your home.
| ◯ T1: Approx. 95 m2, north–south orientation | ◯ T2: Approx. 90 m2, north–south orientation |
 | 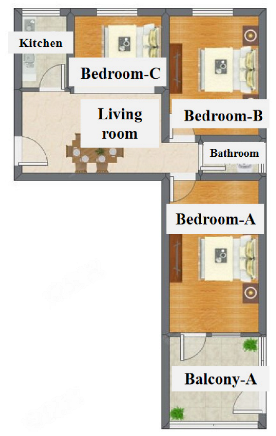 |
5. Which floor is your apartment on?
◯ Ground floor ◯ Intermediate floor ◯ Top floor
6. 2025 Residential Occupancy Pattern
◯ Occupied throughout the year ◯ Total absence/vacancy: <1 month
◯ Total absence/vacancy: 1–3 months ◯ Total absence/vacancy: >3 months
7. Typical household size in 2025
Adults aged 18–64: ____ Persons aged 65 or above: ____ Children under 18: ____
8. Which of the following electricity-consuming appliances or usage patterns apply to your household? (Select all that apply.)
◯ Electric water heater
◯ Frequent air conditioning use in summer
◯ Air conditioning used for heating in winter
◯ Electric space heater or portable radiant heater
◯ Induction cooktop as the primary cooking appliance
◯ Electric bicycle or scooter charged at home
◯ Electric fan
◯ Washing machine
◯ None of the above
9. Monthly Electricity Consumption, January–December 2025
| Month | Electricity Consumption (kWh) | Electricity Cost (CNY) |
| January 2025 | ||
| February 2025 | ||
| March 2025 | ||
| April 2025 | ||
| May 2025 | ||
| June 2025 | ||
| July 2025 | ||
| August 2025 | ||
| September 2025 | ||
| October 2025 | ||
| November 2025 | ||
| December 2025 | ||
| Note: If electricity consumption is provided, the electricity-cost column does not need to be completed. | ||
10. Do you frequently use air conditioning for supplementary heating in winter?
◯ Yes ◯ No (skip to Question 12)
11. Winter air conditioning setpoint temperature
◯ 20–23 °C; ◯24–27 °C; ◯ 28–30 °C ◯ 30 °C or above
12. Cooling equipment used in summer (select all that apply)
◯ Air conditioner ◯ Electric fan ◯ Other
13. What is the typical cooling setpoint temperature in summer?
◯ <18°C ◯ 18–21 °C ◯ 22–25 °C ◯ 26 °C or above
14. Typical periods of air conditioning use in summer (Select all that apply)
◯ 00:00–06:00 ◯ 06:00–09:00 ◯ 09:00–17:00
◯ 17:00–22:00 ◯ 22:00–24:00
15. Exterior window frame material
◯ Steel ◯ Aluminum ◯ uPVC ◯ Timber
◯ Thermally broken aluminum ◯ Other
16. Which of the following indoor environmental problems are noticeable in your home? (Select all that apply)
◯ Too cold in winter ◯ Overheating in summer
◯ Insufficient daylighting ◯ Window drafts ◯ No obvious problems
17. Household gas use (select all that apply)
◯ No gas use ◯ Gas used for cooking
◯ Gas used for water heating ◯ Other uses
Appendix A.2. Normalized Residential 24 h Schedules
Table A1.
Normalized residential 24 h fractional schedules adopted in the calibrated M1 model and subsequently applied to M2 and M3.
Appendix B
Annual, Winter, and Summer Performance of the Top Five Solutions Ranked by TOPSIS for the Three Prototypes
Table A2.
M1 Floor Plan Type.
Table A3.
M2 Floor Plan Type.
Table A4.
M3 Floor Plan Type.
References
- International Energy Agency (IEA). Energy Efficiency 2025; IEA: Paris, France, 2025. [Google Scholar]
- Central Committee of the Communist Party of China; State Council of the People’s Republic of China. Opinions of the CPC Central Committee and the State Council on Promoting High-Quality Urban Development, Chinese Government Website. 2025. Available online: https://www.gov.cn/zhengce/202508/content_7038148.htm (accessed on 6 August 2026).
- Ji, Q.; Shu, X.; Zhang, P.; Li, C. Low-Carbon Retrofitting for Existing Urban Residential Buildings in China: A Systematic Review of Policies, Measures and Performance. Buildings 2026, 16, 2792. [Google Scholar] [CrossRef] [Scilit]
- Wang, D.; Dong, Q.; Sun, C. Evaluating the adaptation potential and retrofitting effectiveness of existing residential buildings in severe cold regions of China under climate change. Build. Environ. 2025, 278, 112982. [Google Scholar] [CrossRef] [Scilit]
- Ganaie, I.A.; Gulzar, O.; Ali, M.N.; Afzal, M. Energy efficiency in cold-climate houses: A comprehensive review of insulation materials, passive architecture, and heating systems. Sustain. Energy Technol. Assess. 2026, 91, 105033. [Google Scholar] [CrossRef] [Scilit]
- Li, Y.; Zhang, H.; Shen, X. Multi-objective optimization of spatial morphology for highrise residential buildings in cold-climate regions of China. Front. Archit. Res. 2026, 15, 985–1013. [Google Scholar] [CrossRef] [Scilit]
- Chi, F.; Zhu, G. Computational generation of energy-efficient rural residential floor plans under hot summer and cold winter climates based on segmentation algorithm model. Appl. Therm. Eng. 2025, 278, 127227. [Google Scholar] [CrossRef] [Scilit]
- Deng, K.; Cui, Y.; Deng, Q.; Liu, R.; Chen, Z.; Wang, S. Multi-Objective Optimization of Urban Residential Envelope Structures in Cold Regions of China Based on Performance and Economic Efficiency. Buildings 2025, 15, 2365. [Google Scholar] [CrossRef] [Scilit]
- Wu, C.; Pan, H.; Luo, Z.; Liu, C.; Huang, H. Multi-objective optimization of residential building energy consumption, daylighting, and thermal comfort based on BO-XGBoost-NSGA-II. Build. Environ. 2024, 254, 111386. [Google Scholar] [CrossRef] [Scilit]
- Saad, M.M.; Eicker, U. Developing surrogate models for holistic building retrofit optimization with multi-criteria decision-making support. Energy Build. 2025, 348, 116358. [Google Scholar] [CrossRef] [Scilit]
- Wei, Y.; Zhou, L.; Duan, Y.; Wang, H.; Dewancker, B.J.; Jiang, Z. Enabling implementable energy retrofit for rural residential buildings in China: A menu-style package solution based on a multi-objective optimization framework. Therm. Sci. Eng. Prog. 2025, 68, 104336. [Google Scholar] [CrossRef] [Scilit]
- Thrampoulidis, E.; Hug, G.; Orehounig, K. Approximating optimal building retrofit solutions for large-scale retrofit analysis. Appl. Energy 2023, 333, 120566. [Google Scholar] [CrossRef] [Scilit]
- Felius, L.C.; Dessen, F.; Hrynyszyn, B.D. Retrofitting towards energy-efficient homes in European cold climates: A review. Energy Effic. 2020, 13, 101–125, Correction in Energy Effic. 2020, 13, 127–128. [Google Scholar] [CrossRef] [Scilit]
- Hu, M.; Pelsmakers, S.; Vainio, T.; Ala-Kotila, P. Multifamily building energy retrofit comparison between the United States and Finland. Energy Build. 2022, 256, 111685. [Google Scholar] [CrossRef] [Scilit]
- Cao, H.; Liu, X.; Feng, G.; Wang, C.; Huang, K.; Hou, X.; Chen, J. Research on the evaluation of the renovation effect of existing energy-inefficient residential buildings in a severe cold region of China. Energy Build. 2024, 312, 114184. [Google Scholar] [CrossRef] [Scilit]
- Xi, H.; Gao, H.; Hou, W.; Yin, B.; Zuo, J.; Zhao, H. Multi-Objective Optimization for Winter Heating Retrofit in Rural Houses of Cold Regions: A Case Study in the Wusu Area. Appl. Sci. 2024, 14, 3760. [Google Scholar] [CrossRef] [Scilit]
- Bai, X.; Yang, D.; Zhang, G. Experimentally Calibrated Thermal and Economic Optimization of Wall Insulation Systems for Residential Buildings in Cold Regions of Northwest China. Buildings 2026, 16, 470. [Google Scholar] [CrossRef] [Scilit]
- Ning, Q.; Wang, Y.; Zhang, X.; Li, Z. Optimization of glazed balconies to enhance energy performance and thermal comfort for college dormitories in cold region of China. J. Hous. Built Environ. 2026, 41, 57–80. [Google Scholar] [CrossRef] [Scilit]
- Zhu, J.; Zi, H.; Lian, P.; Liu, C.; Zhao, J.R.; Chen, W.; Ning, B.; Ma, M.; Feng, Y.; Gao, J. Parametric optimization of sunken courtyard geometry in cold region based on year-round microclimate. Energy Build. 2025, 347, 116262. [Google Scholar] [CrossRef] [Scilit]
- Wen, F.; Zhang, L.; Jiang, L.; Sun, W.; Jin, T.; Zhang, B. A Multi-Objective Optimization and Decision Support Framework for Natural Daylight and Building Areas in Community Elderly Care Facilities in Land-Scarce Cities. ISPRS Int. J. Geo-Inf. 2025, 14, 272. [Google Scholar] [CrossRef] [Scilit]
- Wen, F.; Zhang, L.; Jiang, L.; Tang, R.; Zhang, B. Synergistic Mechanisms Between Elderly Oriented Community Activity Space Morphology and Microclimate Performance: An Integrated Learning and Multi-Objective Optimization Approach. ISPRS Int. J. Geo-Inf. 2025, 14, 211. [Google Scholar] [CrossRef] [Scilit]
- Kowalik, R.; Nešović, A.; Cvetković, D.; Janaszek, A.; Kozłowski, T. Numerical Simulation of Climate Change Impact on Energy, Environmental and Economic Performances of Small Single-Family Houses Equipped with Trombe Walls and Fixed Horizontal Overhangs. Energies 2024, 17, 6275. [Google Scholar] [CrossRef] [Scilit]
- Wang, S.; Tang, W.; Fang, R.; Chen, Z. Climate-Adaptive External Shading Retrofits for Existing Residential Buildings Across Chinese Climates: Multi-Objective Optimization and Carbon Payback Screening. Buildings 2026, 16, 2716. [Google Scholar] [CrossRef] [Scilit]
- Liu, R.; Wang, G.; Deng, Q. Multi-objective optimization of rural residential envelopes in cold regions of China based on performance and economic efficiency. Case Stud. Therm. Eng. 2024, 61, 104937. [Google Scholar] [CrossRef] [Scilit]
- Han, X.; Fang, T.; Wang, Y.; Wang, Z.; Xu, J. Multi-objective optimization of passive design parameters for rural residences based on GA-BP-NSGA-II: A case study of cold regions in China. J. Build. Eng. 2025, 112, 113624. [Google Scholar] [CrossRef] [Scilit]
- Fan, L.; Li, M.; Shi, Y. Data-Driven Multi-Objective Optimization of Building Envelope Retrofits for Senior Apartments in Beijing. Buildings 2026, 16, 1682. [Google Scholar] [CrossRef] [Scilit]
- Duan, Z.; Li, B.; Zi, Y.; Yao, G. Building retrofit multiobjective optimization using neural networks and genetic algorithm three for energy carbon and comfort. Sci. Rep. 2025, 15, 38076. [Google Scholar] [CrossRef] [Scilit] [PubMed]
- Yu, S.; An, Y.; Shi, C.; Wang, A. Multi-objective hierarchical strategy for university dorm renovation in severe cold areas. J. Build. Eng. 2024, 91, 109660. [Google Scholar] [CrossRef] [Scilit]
- Shen, P. Building retrofit optimization considering future climate and decision-making under various mindsets. J. Build. Eng. 2024, 96, 110422. [Google Scholar] [CrossRef] [Scilit]
- Khare, S.K.; Gupta, A.; Vashist, D. Hybrid NSGA-III and multi-objective TLBO for post-Pareto optimization of energy, cost, and carbon in modular steel buildings toward net-zero compliance. Asian J. Civ. Eng. 2026, 27, 649–667. [Google Scholar] [CrossRef] [Scilit]
- Alexakis, K.; Benekis, V.; Kokkinakos, P.; Askounis, D. Genetic algorithm-based multi-objective optimisation for energy-efficient building retrofitting: A systematic review. Energy Build. 2025, 328, 115216. [Google Scholar] [CrossRef] [Scilit]
- Villalba, P.; Sánchez-Garrido, A.J.; Yepes, V. A review of multi-criteria decision-making methods for building assessment, selection, and retrofit. J. Civ. Eng. Manag. 2024, 30, 465–480. [Google Scholar] [CrossRef] [Scilit]
- Gao, P.; Nor, M.F.I.M.; Sulaiman, M.K.A.M. Closing the selection gap in passive retrofit optimization: A pathway-based framework for resident-informed selection in old residential buildings in cold-region China. Energy Build. 2026, 368, 117807. [Google Scholar] [CrossRef] [Scilit]
- GB 50176-2016; Code for Thermal Design of Civil Building. China Planning Press: Beijing, China, 2016. Available online: https://www.gongbiaoku.com/book/7aj17742ow6 (accessed on 8 August 2026).
- Notice on Issuing the Tianjin Municipal Plan for Addressing Climate Change. Available online: https://www.tj.gov.cn/zwgk/szfgb/xqk/2010/7/szfwj/202512/t20251229_7210105.html (accessed on 18 August 2026).
- JGJ 24-86; Code for Thermal Design of Civil Building. Ministry of Construction: Beijing, China, 1986. Available online: https://img.antpedia.com/standard/files/pdfs_ora/CN-JG/5b2/JGJ24-1986.pdf (accessed on 31 July 2026).
- JGJ 26-1986; Standard for Energy Conservation Design of New Heating Residential Buildings. Ministry of Urban and Rural Construction and Environmental Protection: Beijing, China, 1986. Available online: https://www.antpedia.com/standard/1029268-1.html (accessed on 31 July 2026).
- Upgrading and Renovation of Scattered Old Buildings in Nankai District, Tianjin. Available online: http://news.big5.enorth.com.cn/system/2015/12/04/030672746.shtml (accessed on 31 July 2026).
- Tianjin Housing and Urban-Rural Construction Commission. Tianjin Municipal Housing and Urban-Rural Development Commission’s Response to Proposal No. 0631 of the 15th Second Session of the Municipal CPPCC. Available online: https://zfcxjs.tj.gov.cn/xxgk_70/jytabl/bljggk/202405/t20240524_6633920.html (accessed on 8 August 2026).
- Grasshopper. Available online: https://docs.mcneel.com/rhino/8/help/en-us/commands/grasshopper.htm (accessed on 7 August 2026).
- Radiance. Available online: https://www.radiance-online.org/ (accessed on 1 August 2026).
- EnergyPlus. Available online: https://energyplus.net/ (accessed on 1 August 2026).
- Ladybug Tools. Available online: https://www.ladybug.tools/ (accessed on 1 August 2026).
- GB 55015-2021; General Code for Energy Efficiency and Renewable Energy Application in Buildings. Ministry of Housing and Urban–Rural Development: Beijing, China, 2021. Available online: https://www.kscecs.com/standard-10974 (accessed on 8 August 2026).
- GB 50736-2012; Design Code for Heating Ventilation and Air Conditioning of Civil Buildings. Ministry of Housing and Urban–Rural Development: Beijing, China, 2012. Available online: https://www.soujianzhu.cn/NormAndRules/NormContent.aspx?id=275 (accessed on 7 August 2026).
- EPW Files for the Tianjin Typical Meteorological Year (TMY) from the Official EnergyPlus Website. Available online: https://energyplus.net/weather-location/asia_wmo_region_2/CHN/CHN_Tianjin.Tianjin.545270_CSWD (accessed on 31 July 2026).
- Pachano, J.E.; Bandera, C.F. Multi-step building energy model calibration process based on measured data. Energy Build. 2021, 252, 111380. [Google Scholar] [CrossRef] [Scilit]
- Vogt, M.; Remmen, P.; Lauster, M.; Fuchs, M.; Müller, D. Selecting statistical indices for calibrating building energy models. Build. Environ. 2018, 144, 94–107. [Google Scholar] [CrossRef] [Scilit]
- ASHRAE Guideline 14-2023. Available online: https://www.ashrae.org/technical-resources/standards-and-guidelines/titles-purposes-and-scopes (accessed on 8 August 2026).
- National Fire and Rescue Administration. Classification for Burning Behavior of Building Materials and Products. 2012. Available online: https://openstd.samr.gov.cn/bzgk/std/newGbInfo?hcno=EA060DF73D92A5AA9F63C1743DDB75DB (accessed on 8 August 2026).
- Zhang, S.; Xu, Q.; Riffat, S. Multi-objective optimization on sustainable retrofit of historical buildings using NSGA-II Algorithm: A case study of Suzhou. Green Technol. Innov. 2025, 1, 7658. [Google Scholar] [CrossRef] [Scilit]
- JGJ/T129-2012; Technical Specification for Energy Efficiency Retrofitting of Existing Residential Buildings. Ministry of Housing and Urban–Rural Development: Beijing, China, 2012. Available online: https://www.soujianzhu.cn/NormAndRules/NormContent.aspx?id=1723 (accessed on 31 July 2026).
- Material Price Inquiry Platform for the Construction Cost Industry. Available online: https://www.gldjc.com/ (accessed on 31 July 2026).
- Tianjin Housing and Urban-Rural Construction Commission. Available online: https://zfcxjs.tj.gov.cn/ (accessed on 14 August 2026).
- ASHRAE. Energy Use Intensity. Available online: https://terminology.ashrae.org/ (accessed on 5 August 2026).
- GB/T 51161-2016; Standards for Energy Consumption of Building. Ministry of Housing and Urban–Rural Development: Beijing, China, 2016. Available online: https://www.gb-gbt.com/PDF/Chinese.aspx/GBT51161-2016 (accessed on 5 September 2026).
- Tianjin Municipal Regulations on Heating Supply and Use. Available online: https://lawtext.github.io/regulations/%E5%A4%A9%E6%B4%A5/ff8080816eb1afb8016ec02b8e586f64/ (accessed on 5 September 2026).
- ISO 7730:2025; Ergonomics of the Thermal Environment—Analytical Determination and Interpretation of Thermal Comfort Using Calculation of the PMV and PPD Indices and Local Thermal Comfort Criteria. ISO: Geneva, Switzerland, 2025. Available online: https://www.iso.org/standard/85803.html (accessed on 8 August 2026).
- Zhou, Y.; Fukuda, T.; Yabuki, N. Automatic evaluation and analysis of indoor visual comfort for sustainable building design using interpretable ensemble learning. Autom. Constr. 2026, 181, 106582. [Google Scholar] [CrossRef] [Scilit]
- Mo, H.; Zhou, Y.; Song, Y. Parametric Design and Spatial Optimization of East–West-Oriented Teaching Spaces in Shanghai. Buildings 2022, 12, 1333. [Google Scholar] [CrossRef] [Scilit]
- Nabil, A.; Mardaljevic, J. Useful daylight illuminances: A replacement for daylight factors. Energy Build. 2006, 38, 905–913. [Google Scholar] [CrossRef] [Scilit]
- Tianjin Municipal Commission of Urban Management. Notice on the Settlement of Heat-Metered Users for the 2025–2026 Heating Season, 16 April 2026. Available online: https://tidenews.com.cn/tmh_news.html?id=69e205655944a20001e242af (accessed on 9 September 2026).
- Huang, W.; Xu, Q. Sustainable-Driven Renovation of Existing Residential Buildings in China: A Systematic Exploration Based on Review and Solution Approaches. Sustainability 2024, 16, 3895. [Google Scholar] [CrossRef] [Scilit]
- He, Q.; Ng, S.T.; Hossain, M.U.; Augenbroe, G.L. A Data-driven Approach for Sustainable Building Retrofit—A Case Study of Different Climate Zones in China. Sustainability 2020, 12, 4726. [Google Scholar] [CrossRef] [Scilit]
- Wallacei | Research. Available online: https://www.wallacei.com/research (accessed on 1 August 2026).
- Yang, X.; Chen, Z.; Zou, Y.; Wan, F. Improving the Energy Performance and Economic Benefits of Aged Residential Buildings by Retrofitting in Hot–Humid Regions of China. Energies 2023, 16, 4981. [Google Scholar] [CrossRef] [Scilit]
- Yan, J.; Gu, X.; Wu, G.; Wang, L.; Si, N.; Zhao, Y.; Han, D. Rapid Evaluation of University Classrooms Using an MLP Classification Model Based on Daylight–Thermal Performance. Buildings 2026, 16, 1566. [Google Scholar] [CrossRef] [Scilit]
- Chen, T.; Tan, L. Multiobjective optimization of external shading for west facing university dormitories in Kunming considering solar radiation and daylighting. Sci. Rep. 2025, 15, 21876. [Google Scholar] [CrossRef] [Scilit] [PubMed]
- Ward, G.J. The RADIANCE lighting simulation and rendering system. In Proceedings of the 21st annual conference on Computer Graphics and Interactive Techniques—SIGGRAPH ’94; ACM Press: New York, NY, USA, 1994; pp. 459–472. [Google Scholar]
- Liu, C.; Liu, F.; Zhao, Q. Driver–Pathway Analysis of EUI in Historic Buildings: Rank Fusion and Rolling Validation. Energies 2026, 19, 1795. [Google Scholar] [CrossRef] [Scilit]
- Rodrigues, C.; Freire, F. Environmental impacts and costs of residential building retrofits—What matters? Sustain. Cities Soc. 2021, 67, 102733. [Google Scholar] [CrossRef] [Scilit]
- Wang, B.; Li, J. Global sensitivity analysis based on multi-objective optimization of rural tourism building performance. J. Clean. Prod. 2023, 417, 137917. [Google Scholar] [CrossRef] [Scilit]
- sklearn.cluster. Available online: https://scikit-learn.org/stable/api/sklearn.cluster.html (accessed on 8 August 2026).
- Mizrak, F.; Mizrak, K.C.; Karakaya, T. Optimizing net-zero energy strategies in airports through a hybrid multi-method framework. Sci. Rep. 2025, 15, 27732. [Google Scholar] [CrossRef] [Scilit] [PubMed]
- Aganović, A.; Hansen, E.A.; Hemmingsen, C.B.; Kadrić, D.; Rabani, M.; Vatreš, A.; Kadrić, E. Target-based multi-objective retrofit design of nZEB school buildings using room-specific indoor environmental quality requirements. Build. Environ. 2026, 296, 114546. [Google Scholar] [CrossRef] [Scilit]
- Xie, L.; Chen, T.; Joshi, N.; Li, Z. Climate-responsive retrofitting strategy of elderly housing: Health impacts based on data-driven multi-objective optimization of building envelopes. Build. Environ. 2025, 285, 113554. [Google Scholar] [CrossRef] [Scilit]
- Liu, P.; Li, M.; Zhu, J.; Yuan, W. Study on energy retrofits for rural residential envelopes in Northwest China. Sci. Rep. 2025, 15, 14799. [Google Scholar] [CrossRef] [Scilit] [PubMed]
- Caro, R.; Cruz, L.; Martínez, A.; Naharro, P.S.; Muelas, S.; King Sancho, K.; Cuerda, E.; Barbero-Barrera, M.D.M.; LaTorre, A. Prescriptive tool for zero-emissions building fenestration design using hybrid metaheuristic algorithms. Energy Build. 2025, 336, 115594. [Google Scholar] [CrossRef] [Scilit]
- Alsukkar, M.; Ibrahim, A.; Eltaweel, A. Multi-objective optimization of daylighting systems for energy efficiency and thermal-visual comfort in buildings: A review. Build. Environ. 2026, 288, 113921. [Google Scholar] [CrossRef] [Scilit]
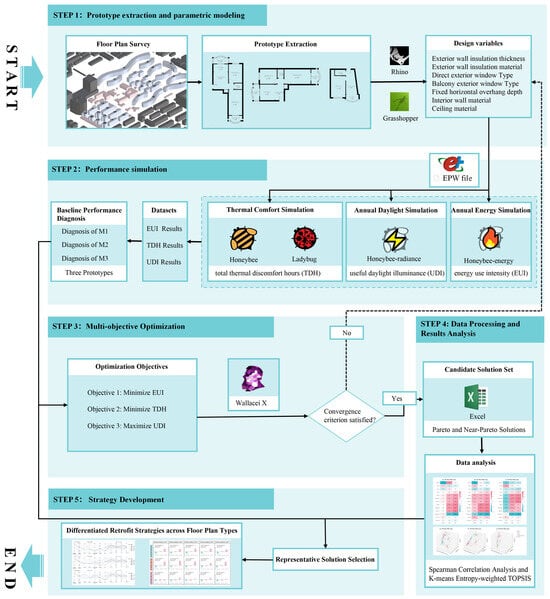
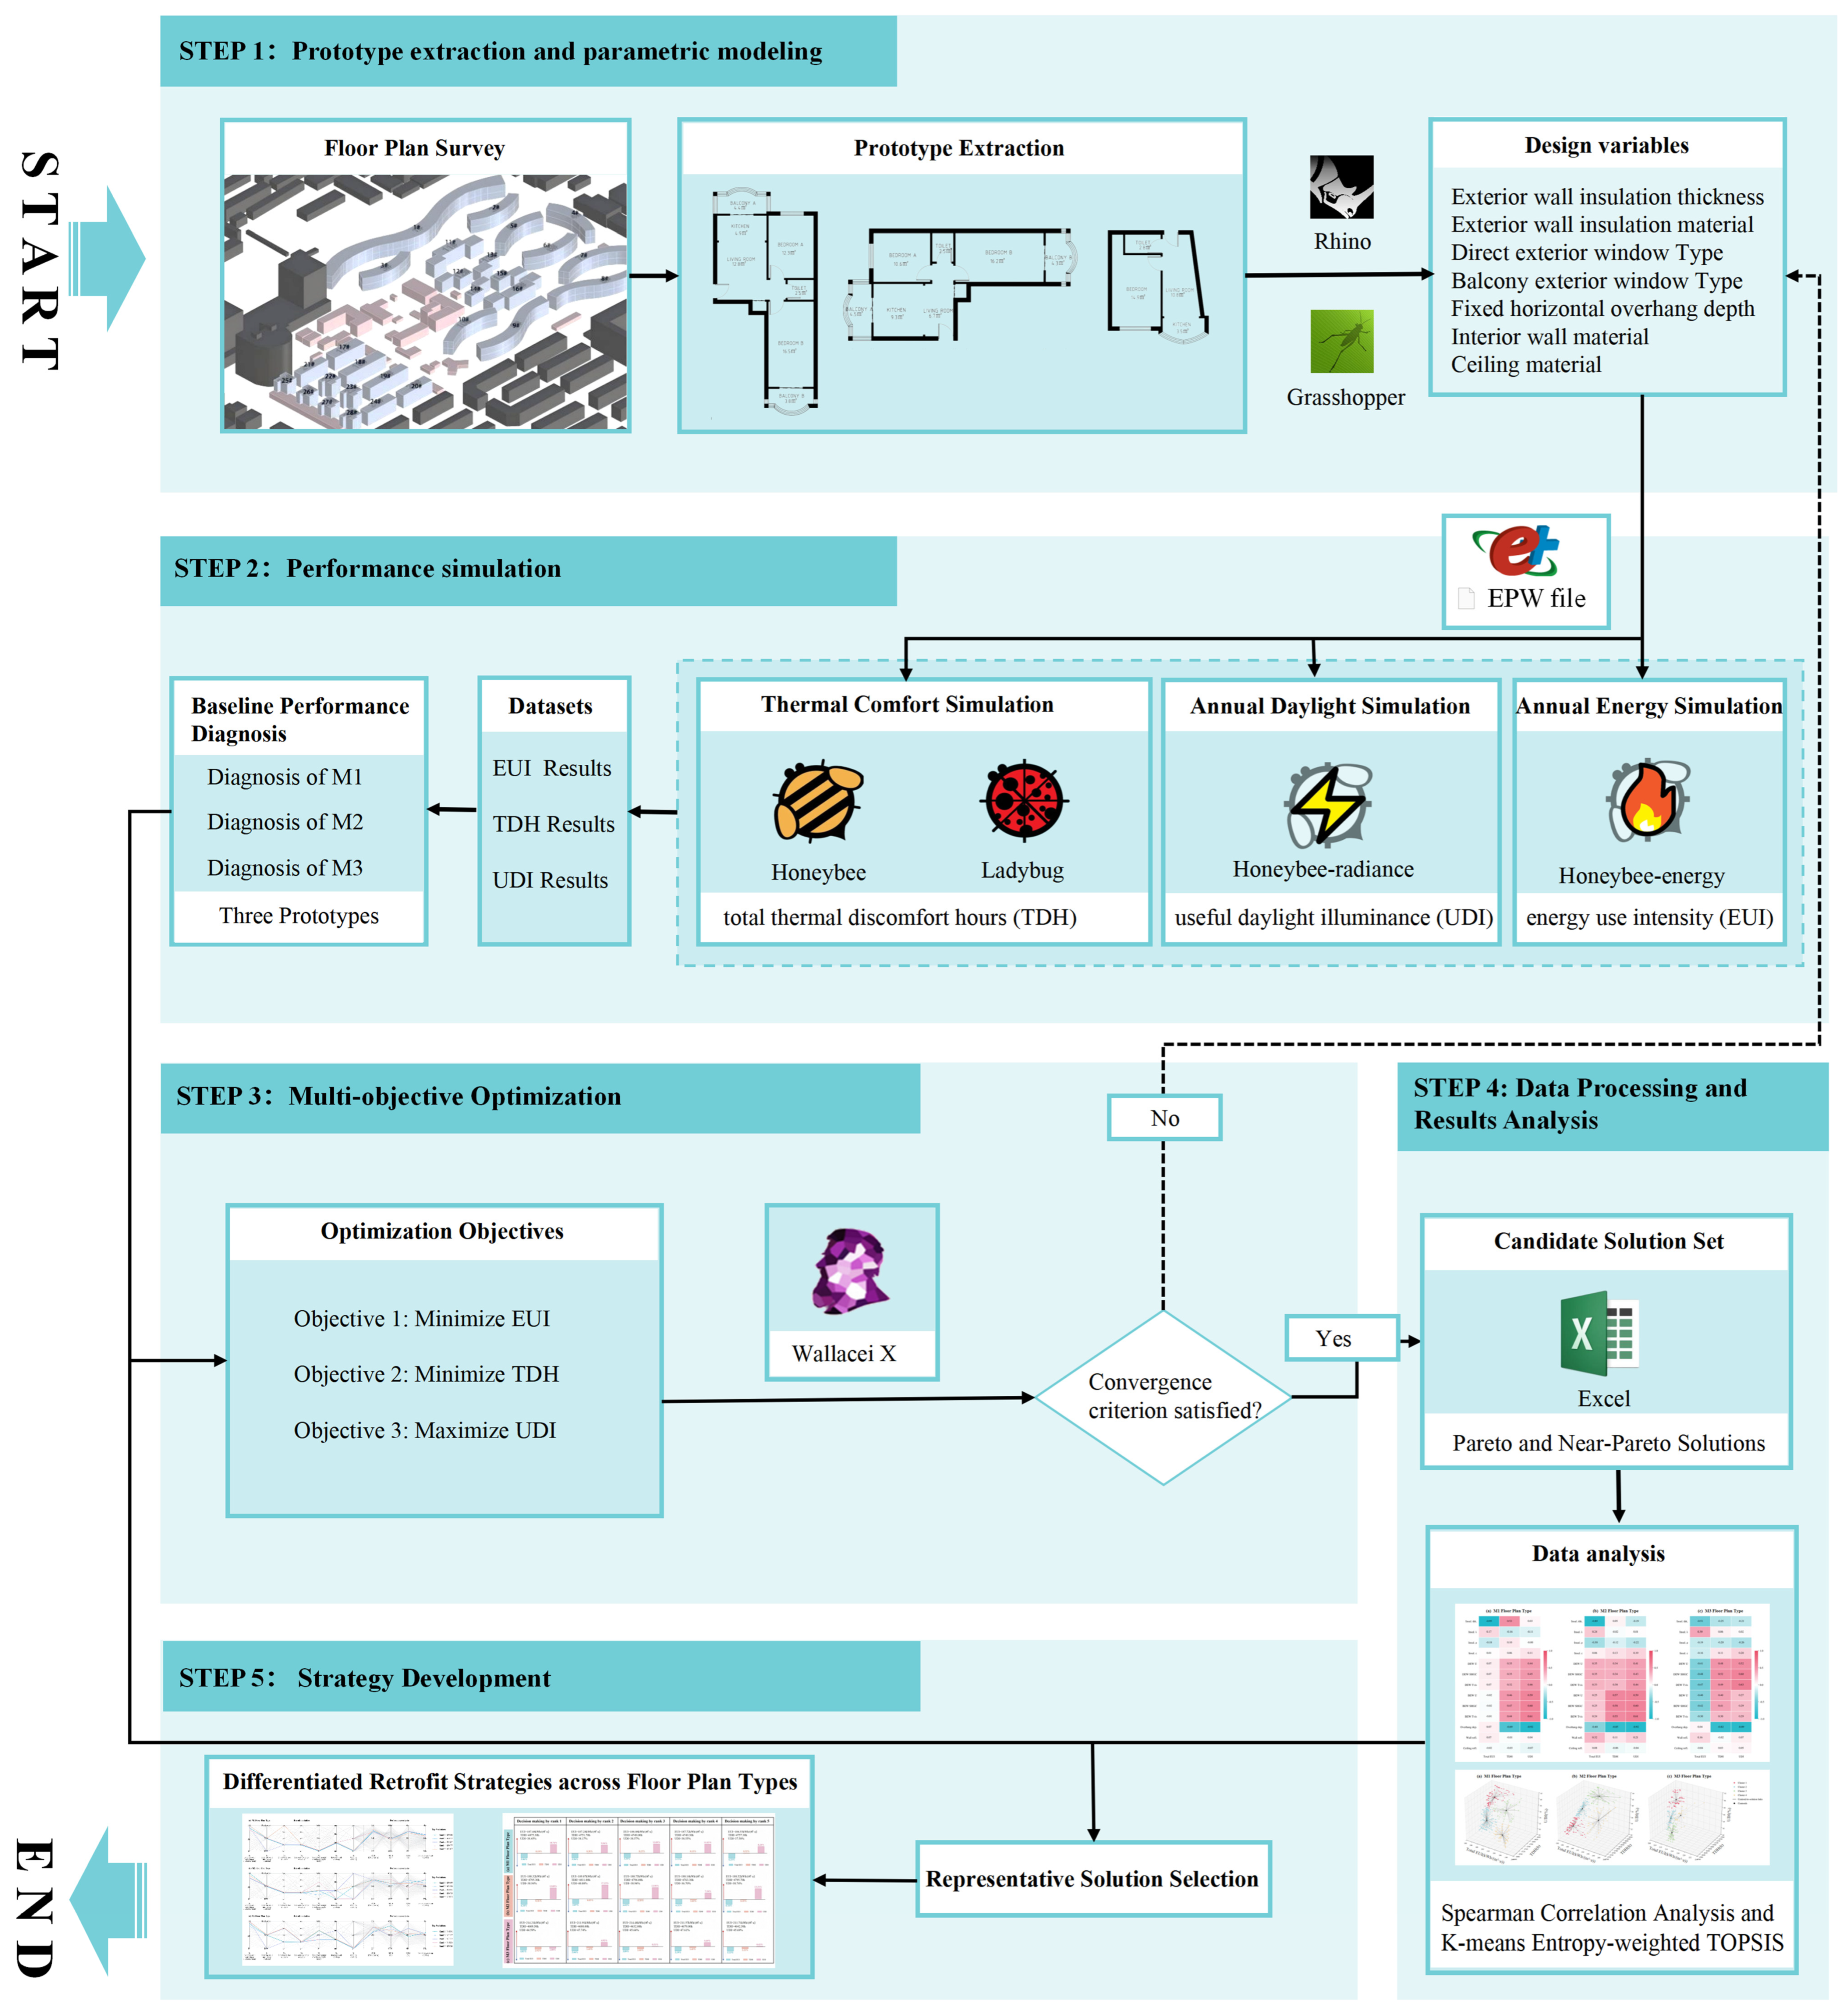
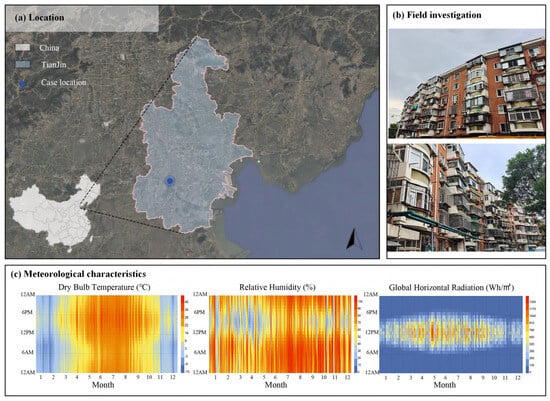
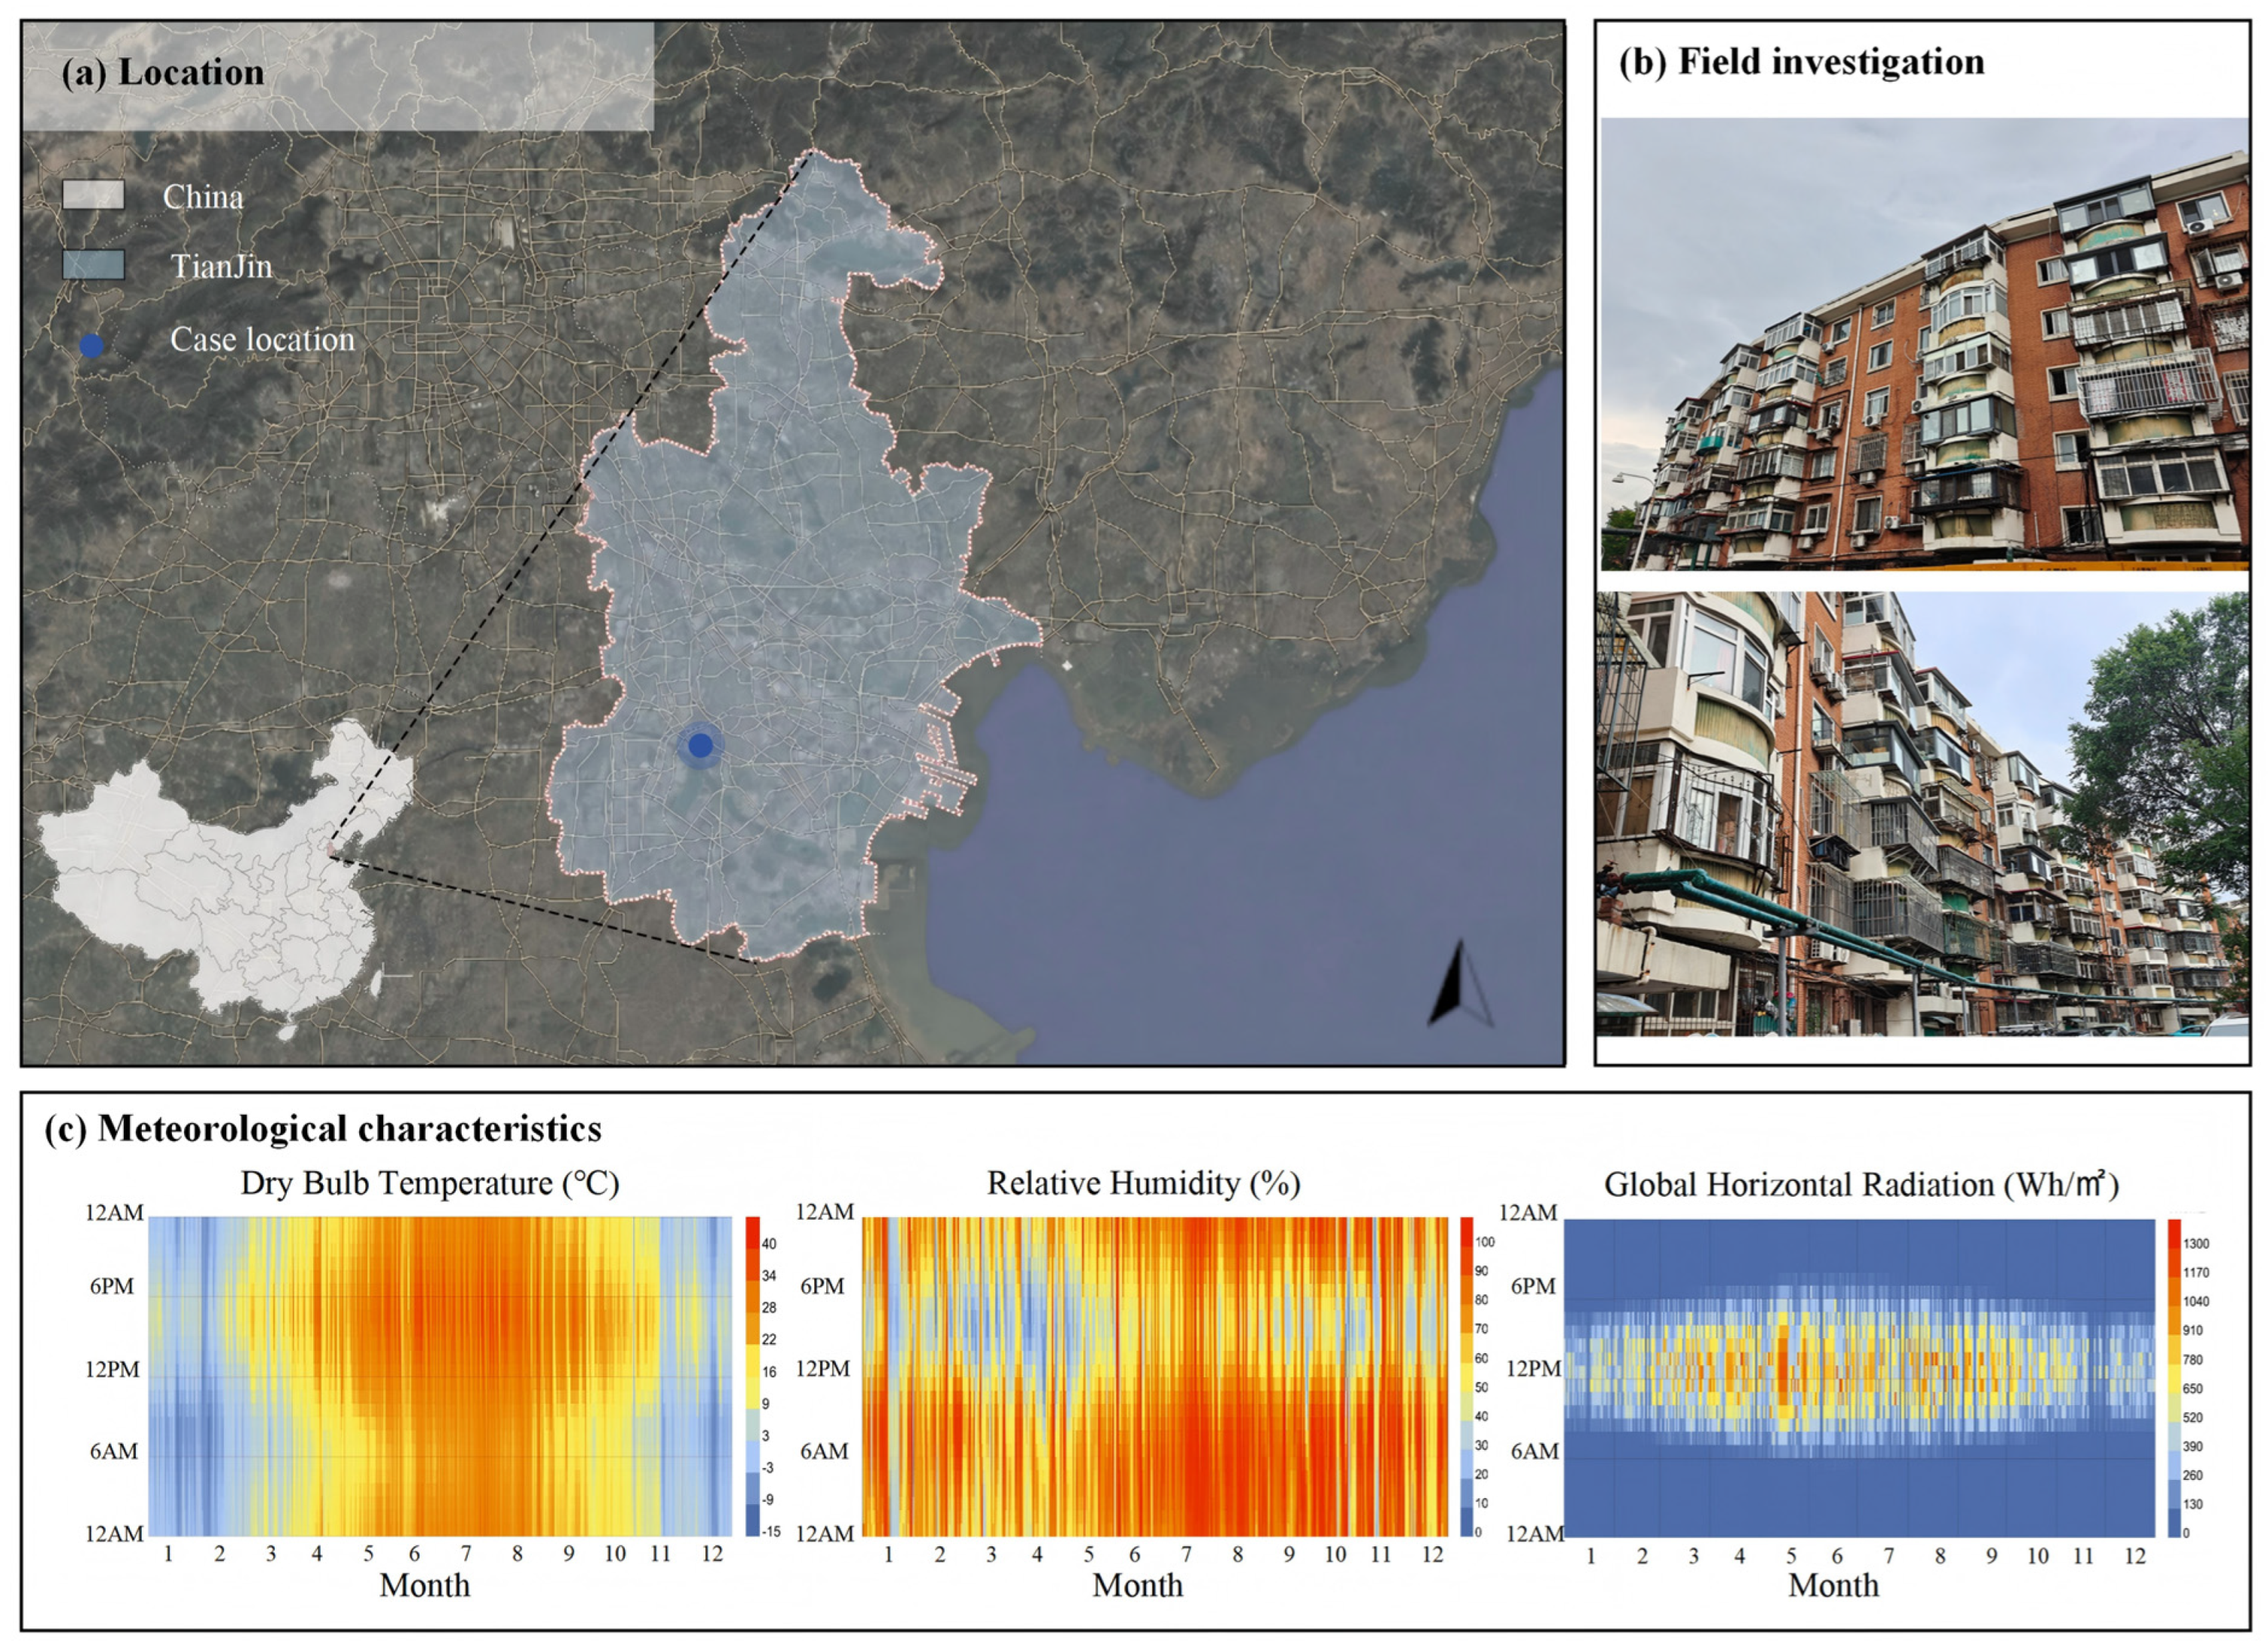
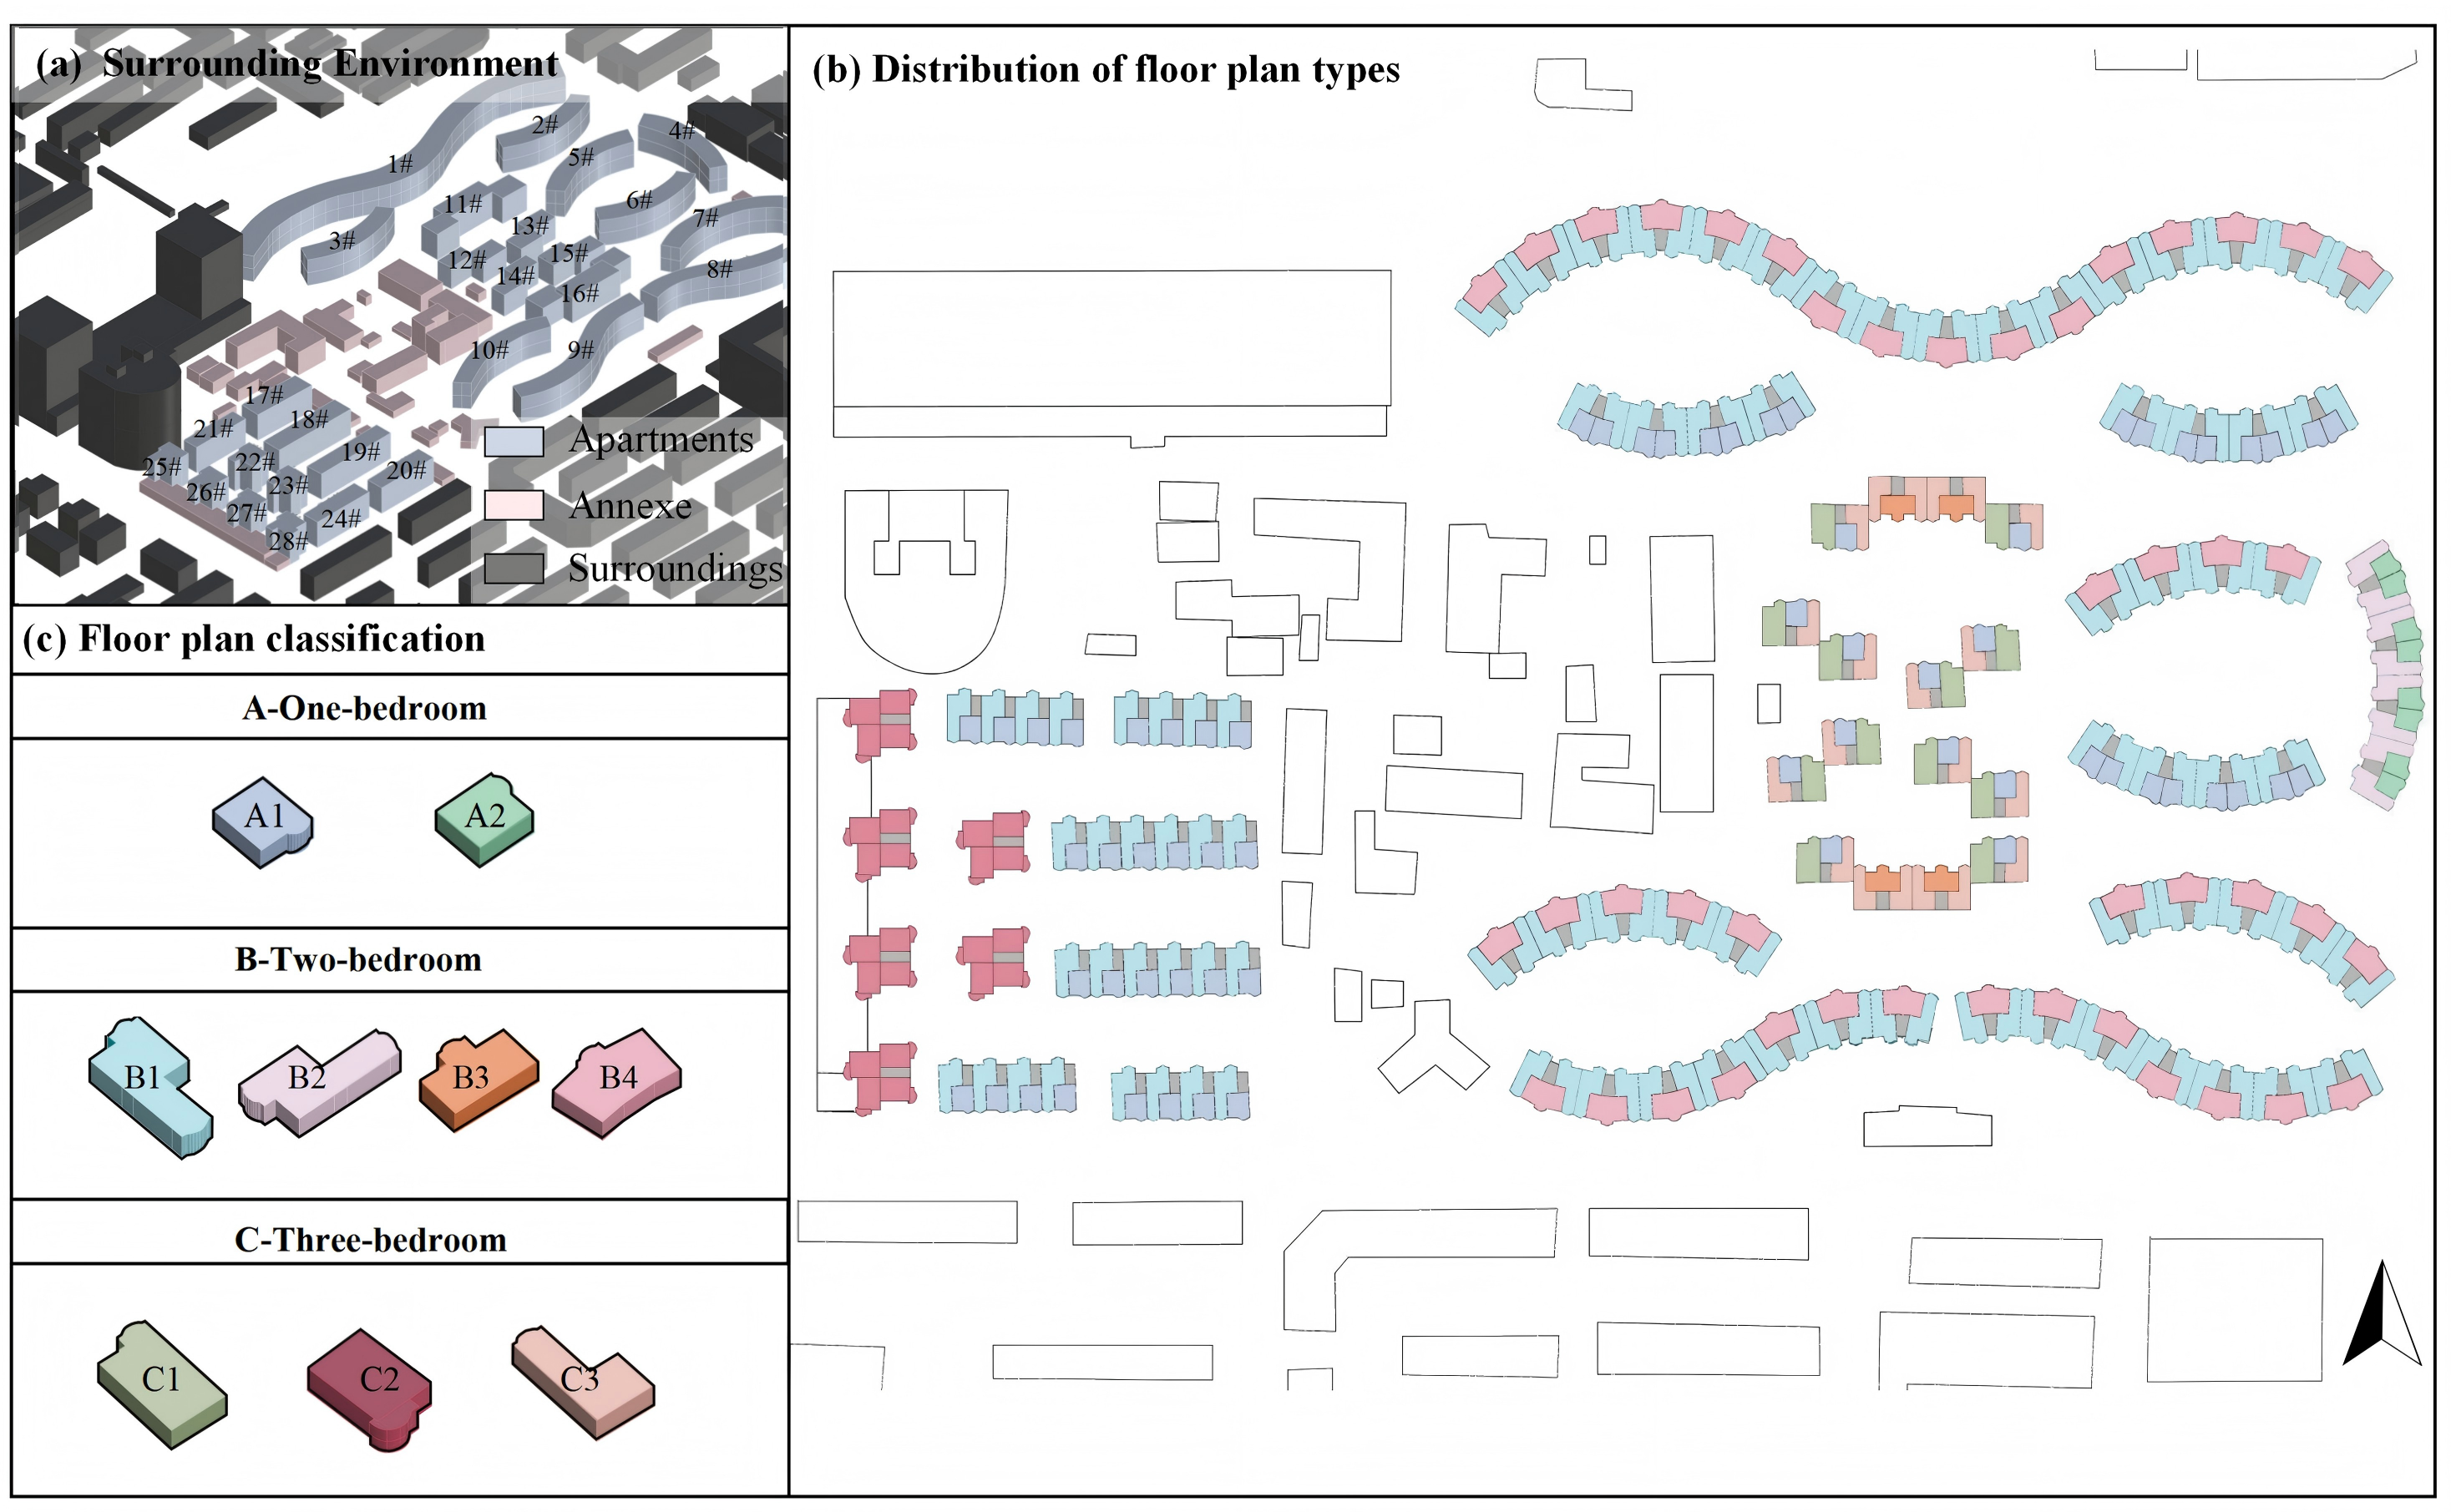
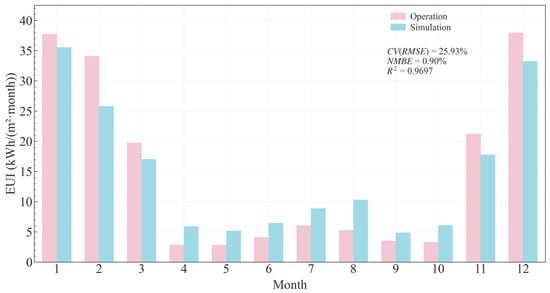
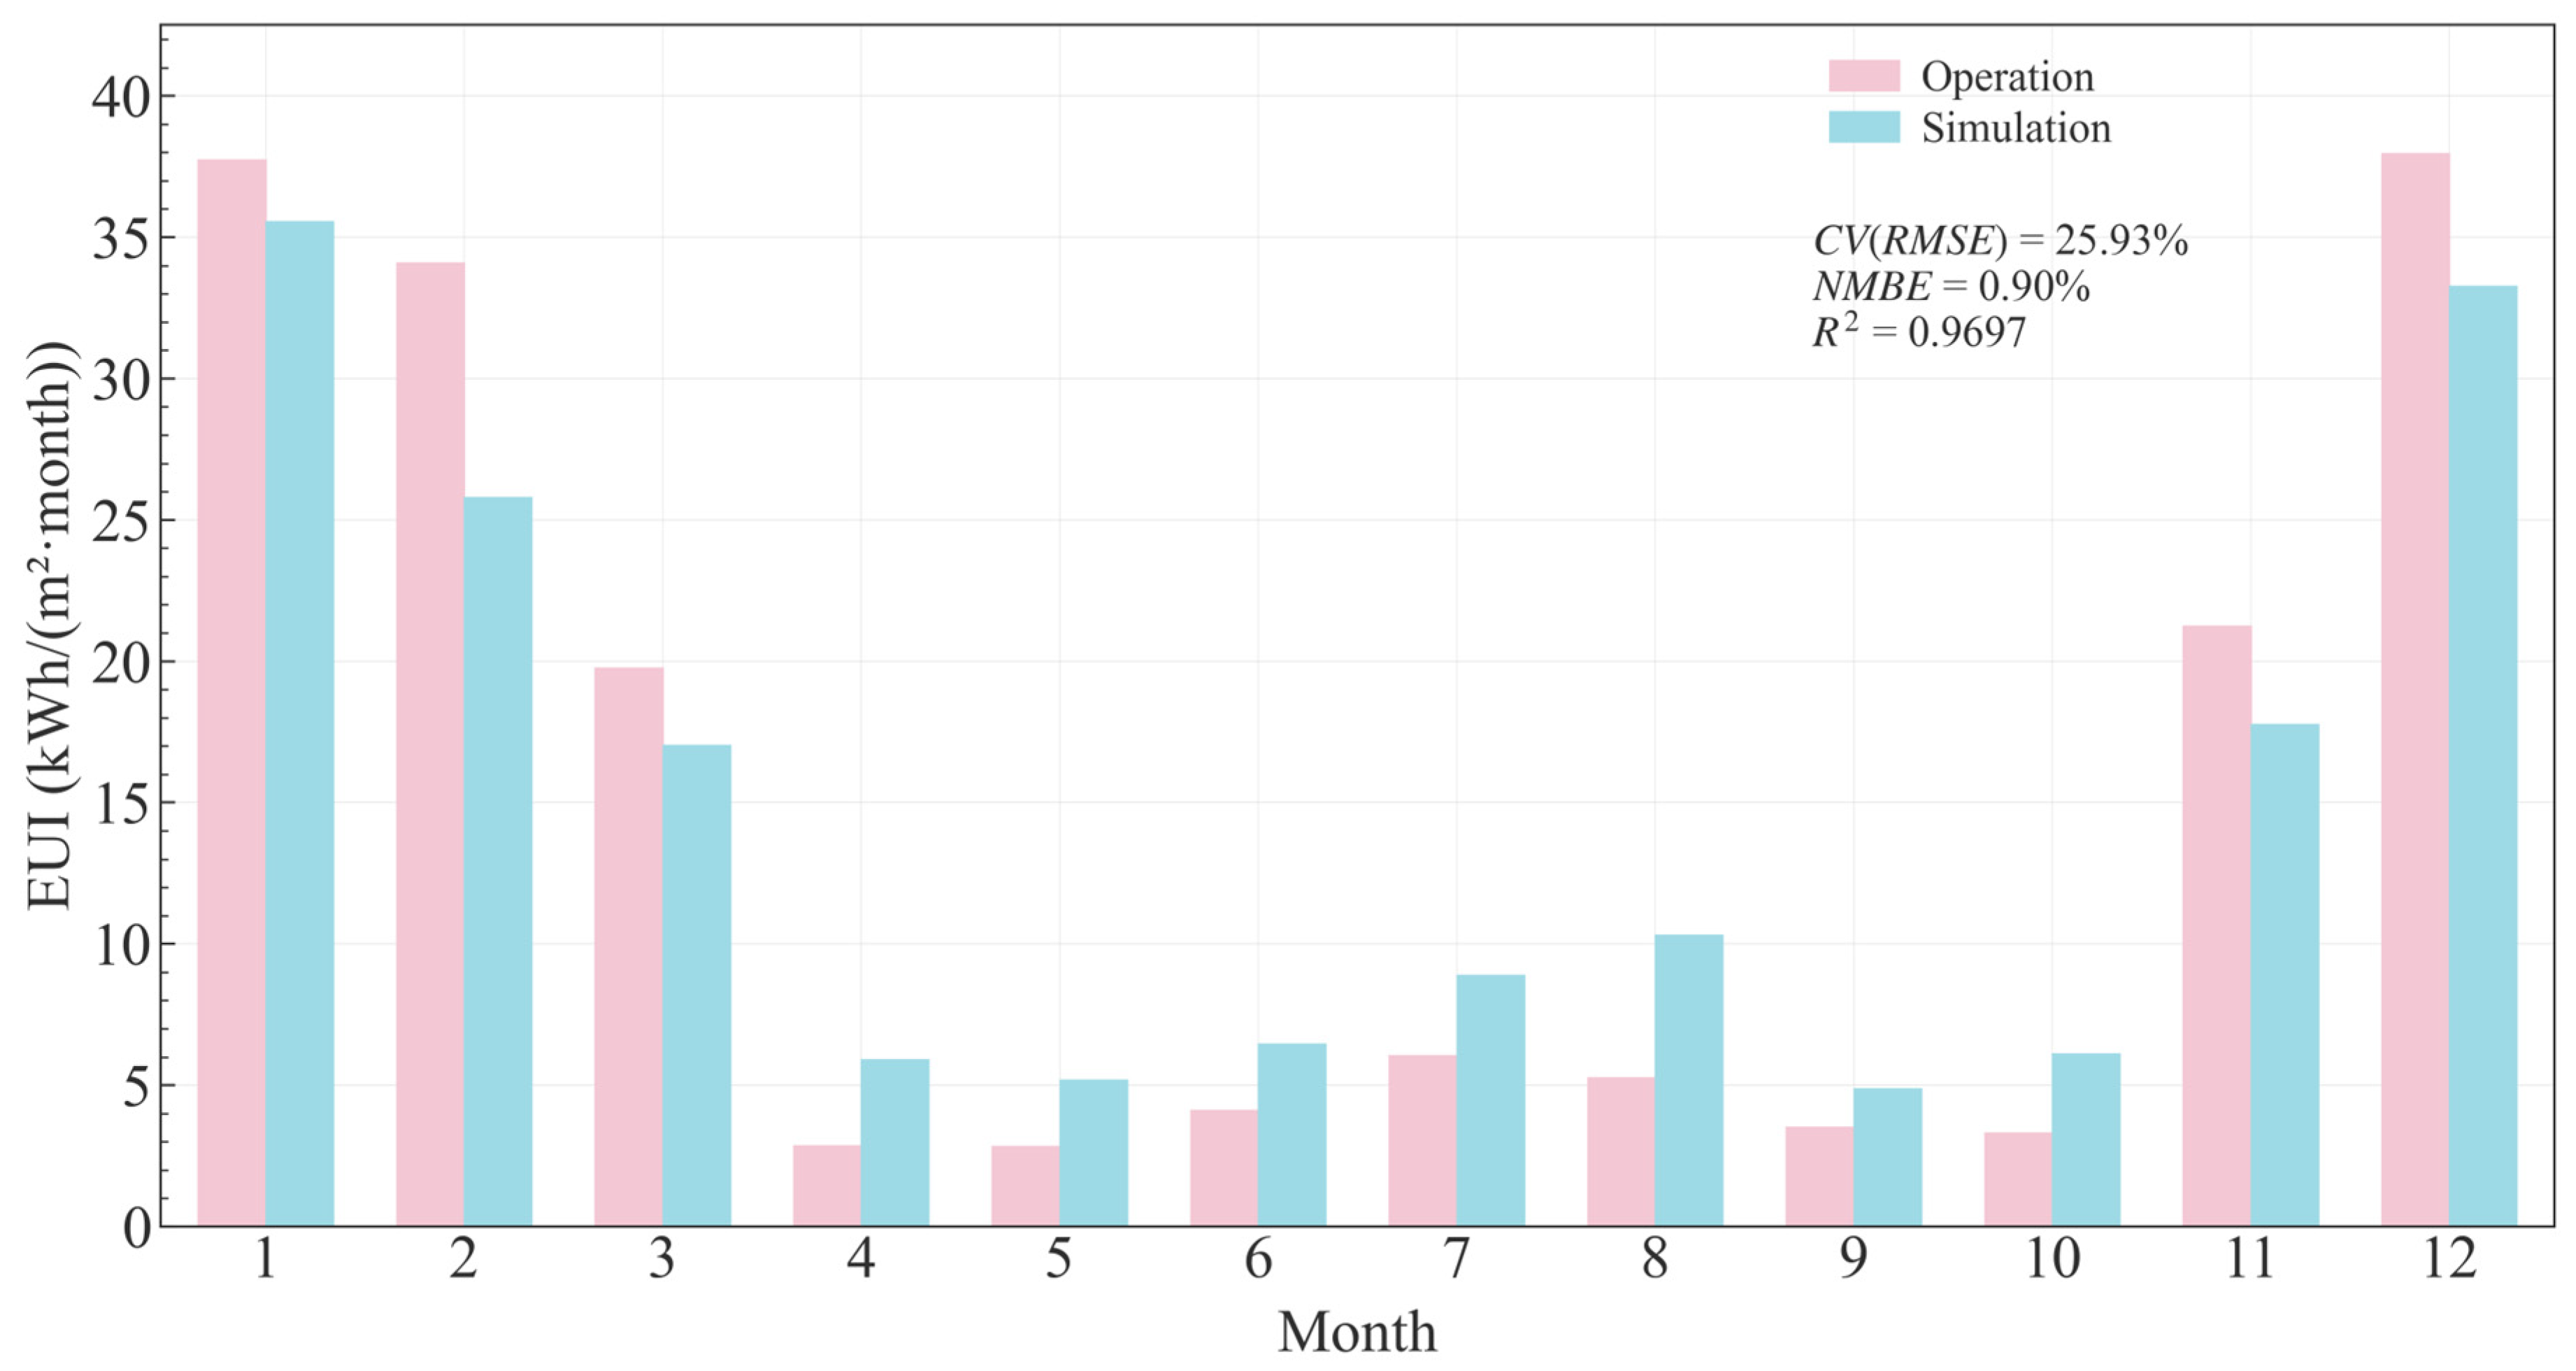
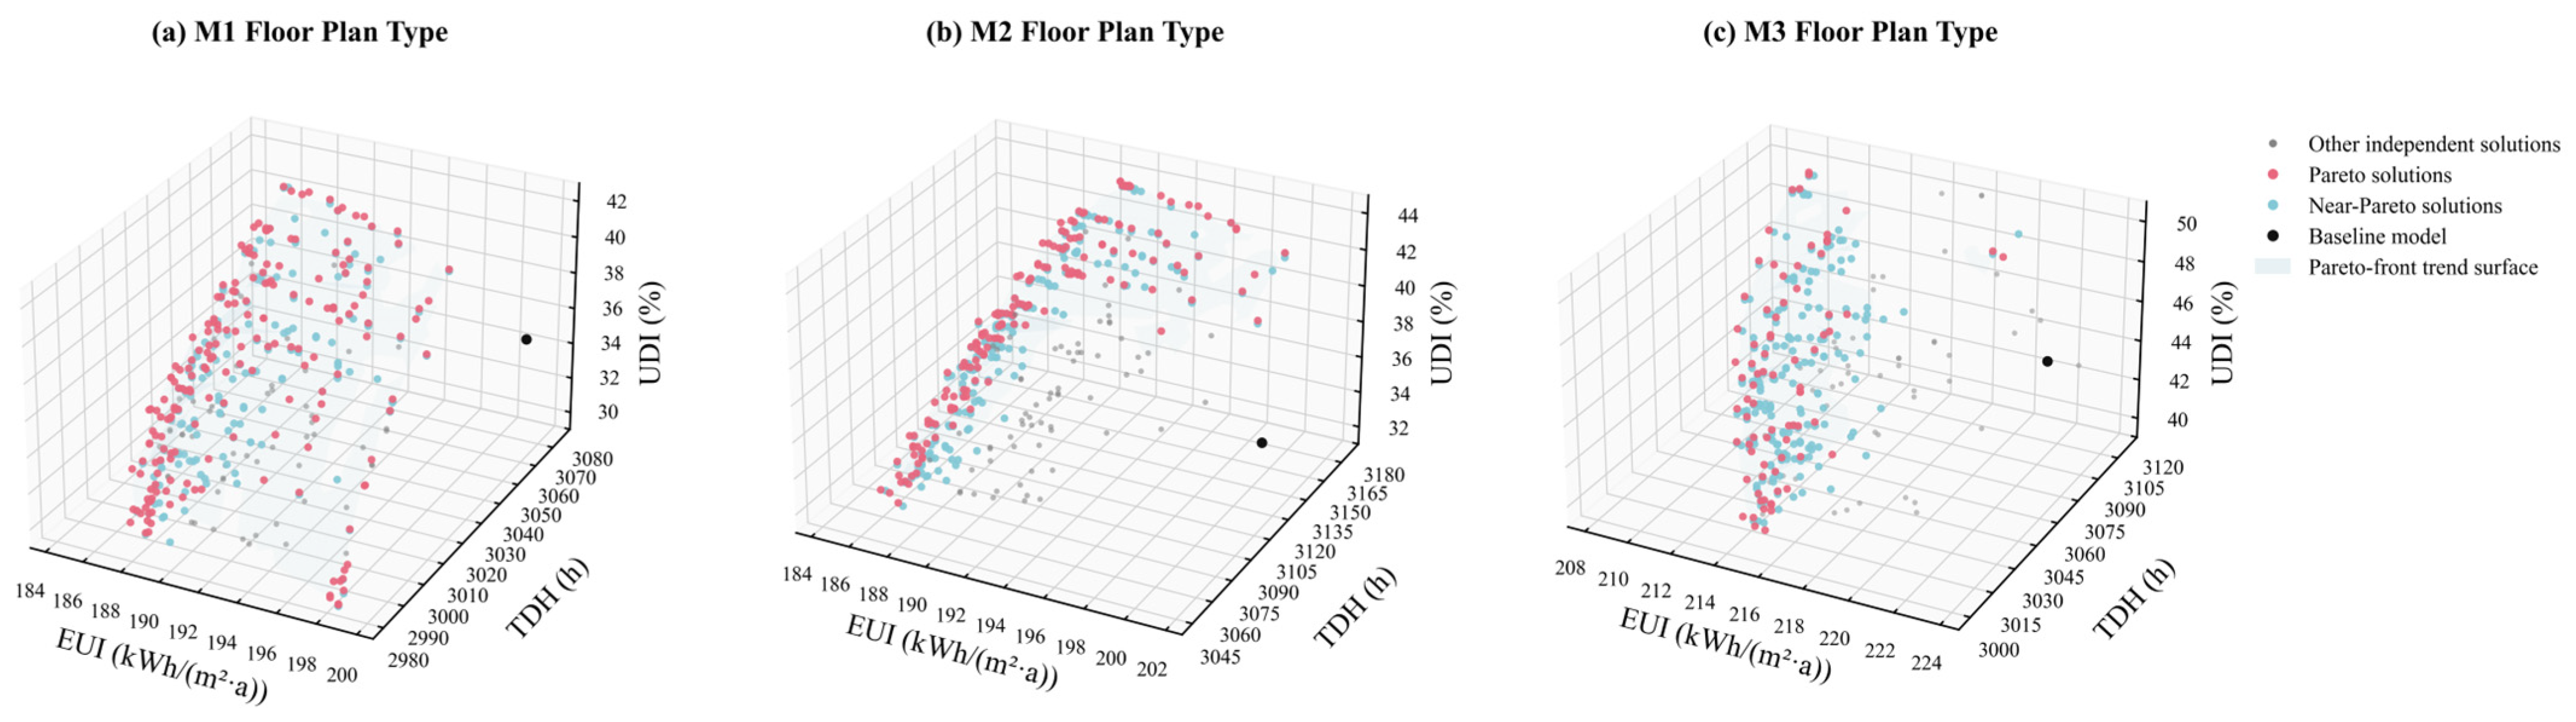
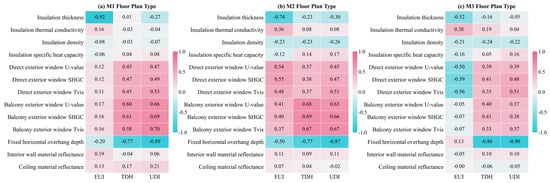
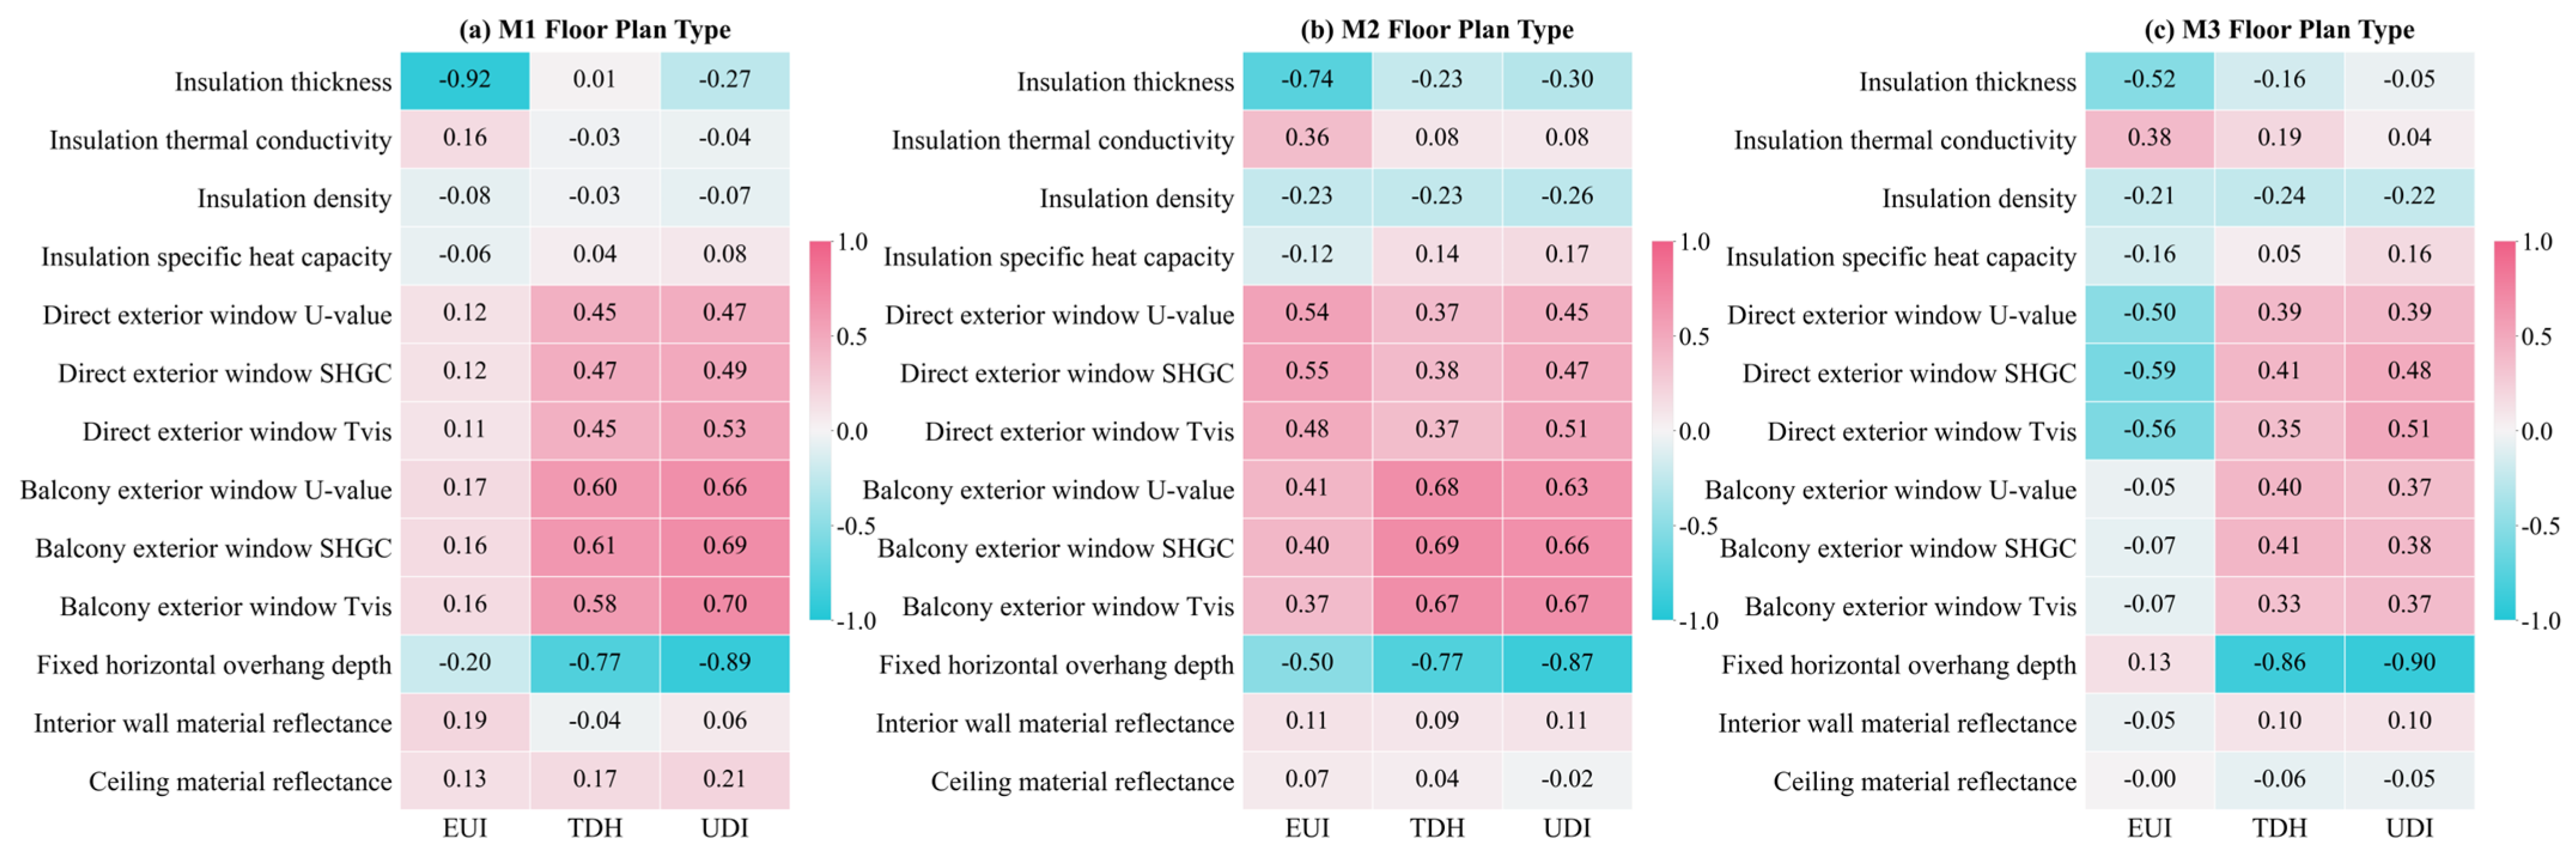
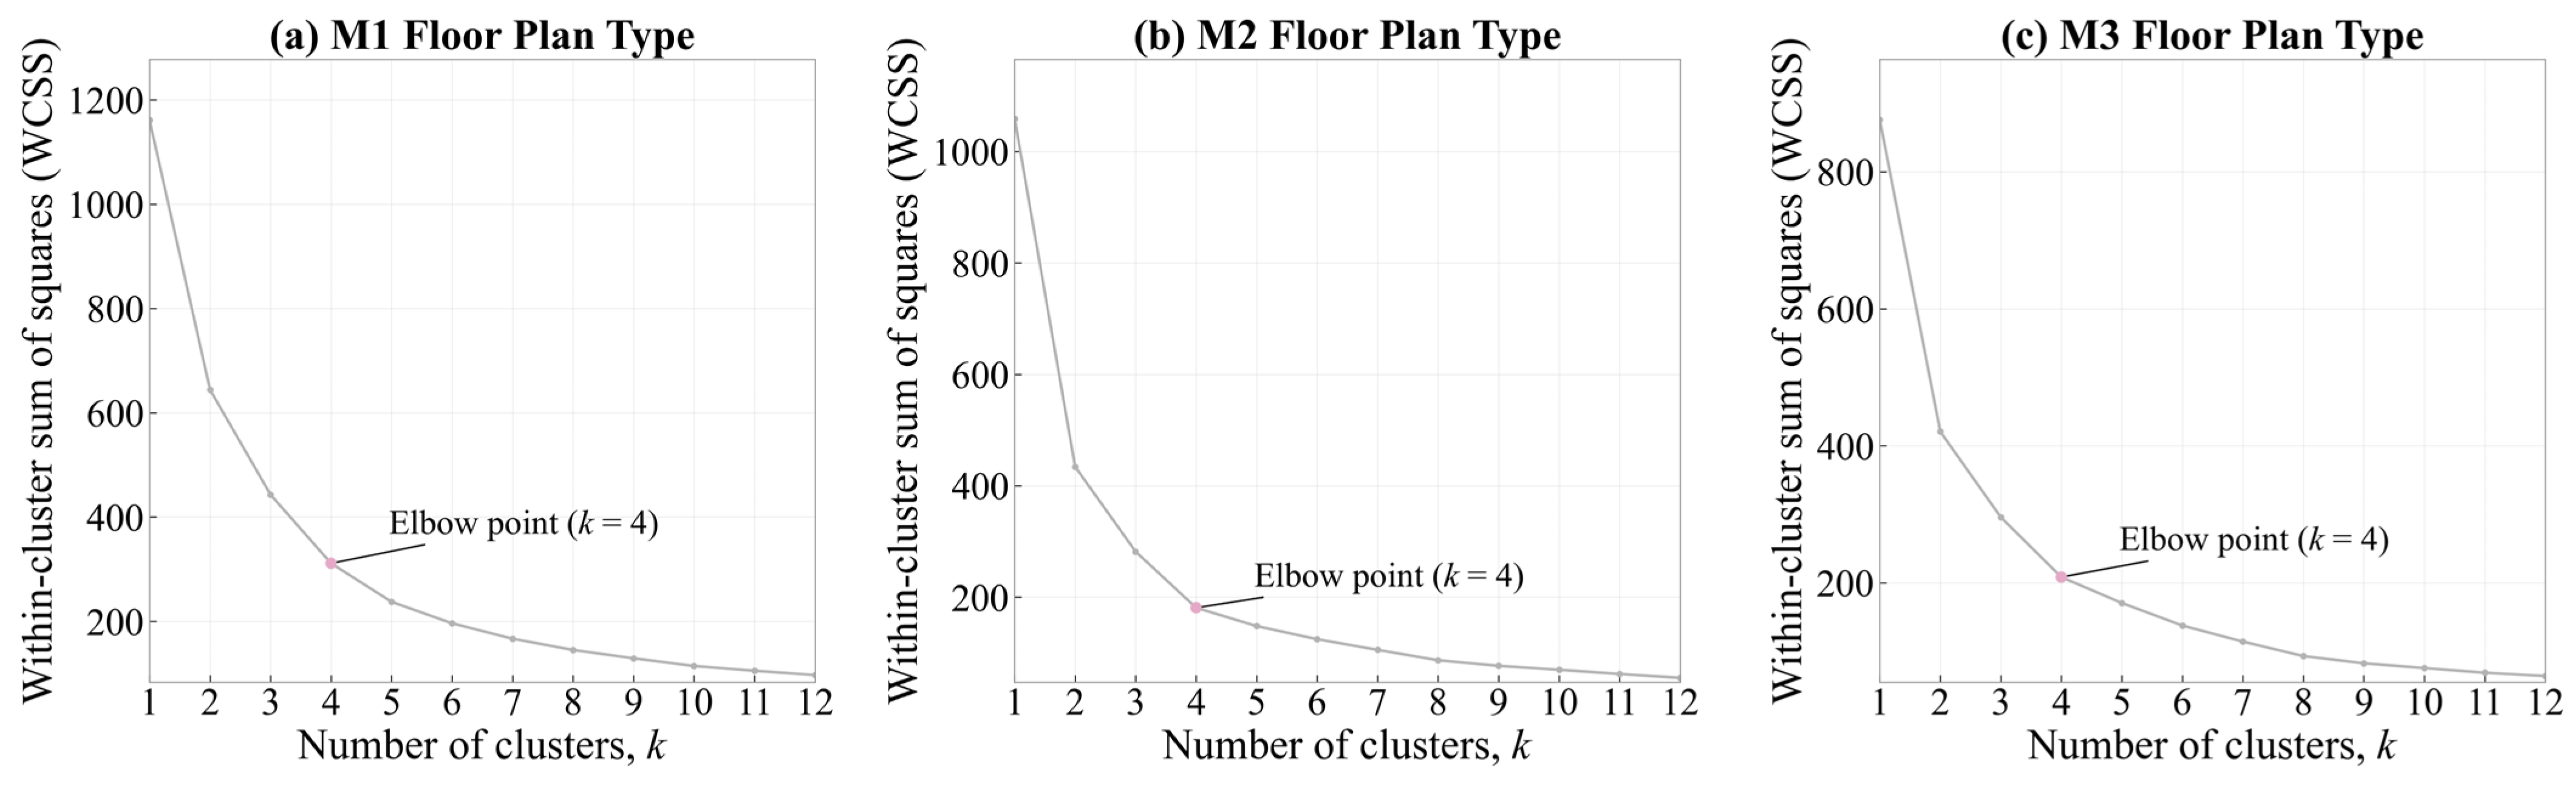
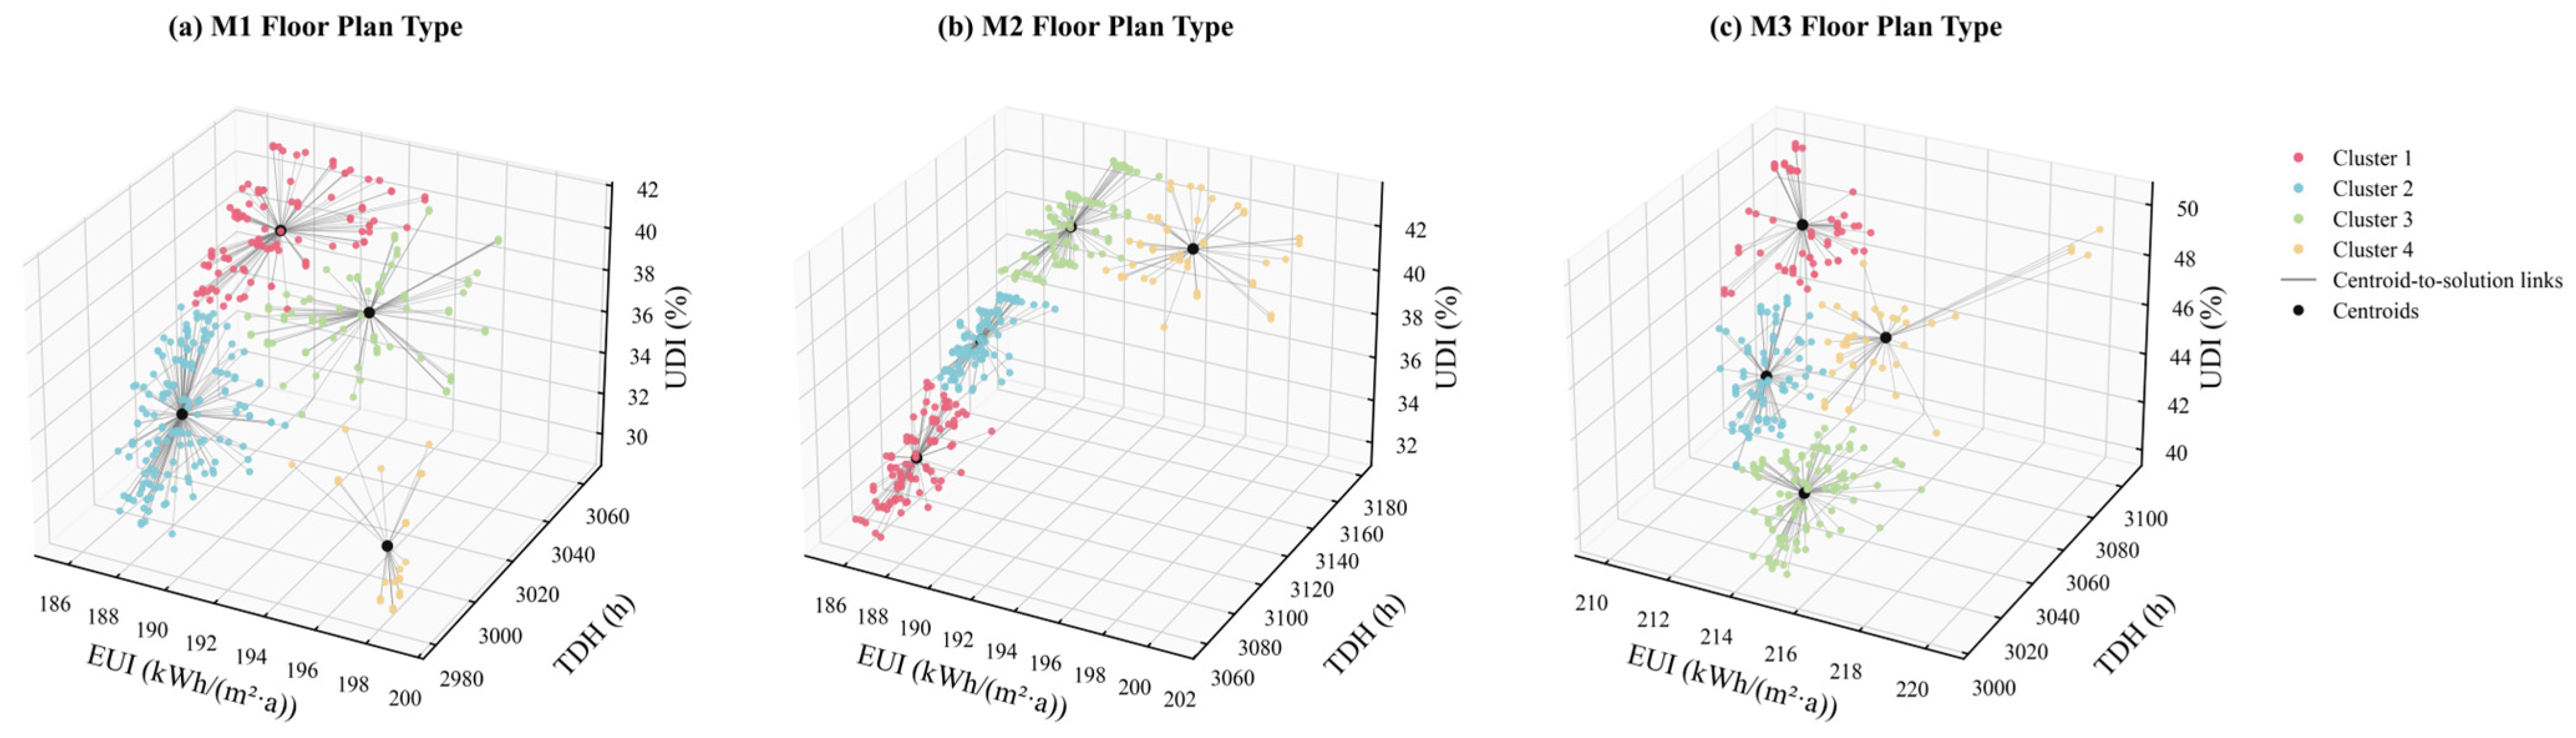
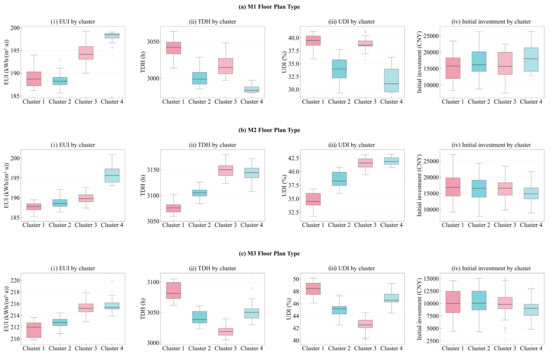
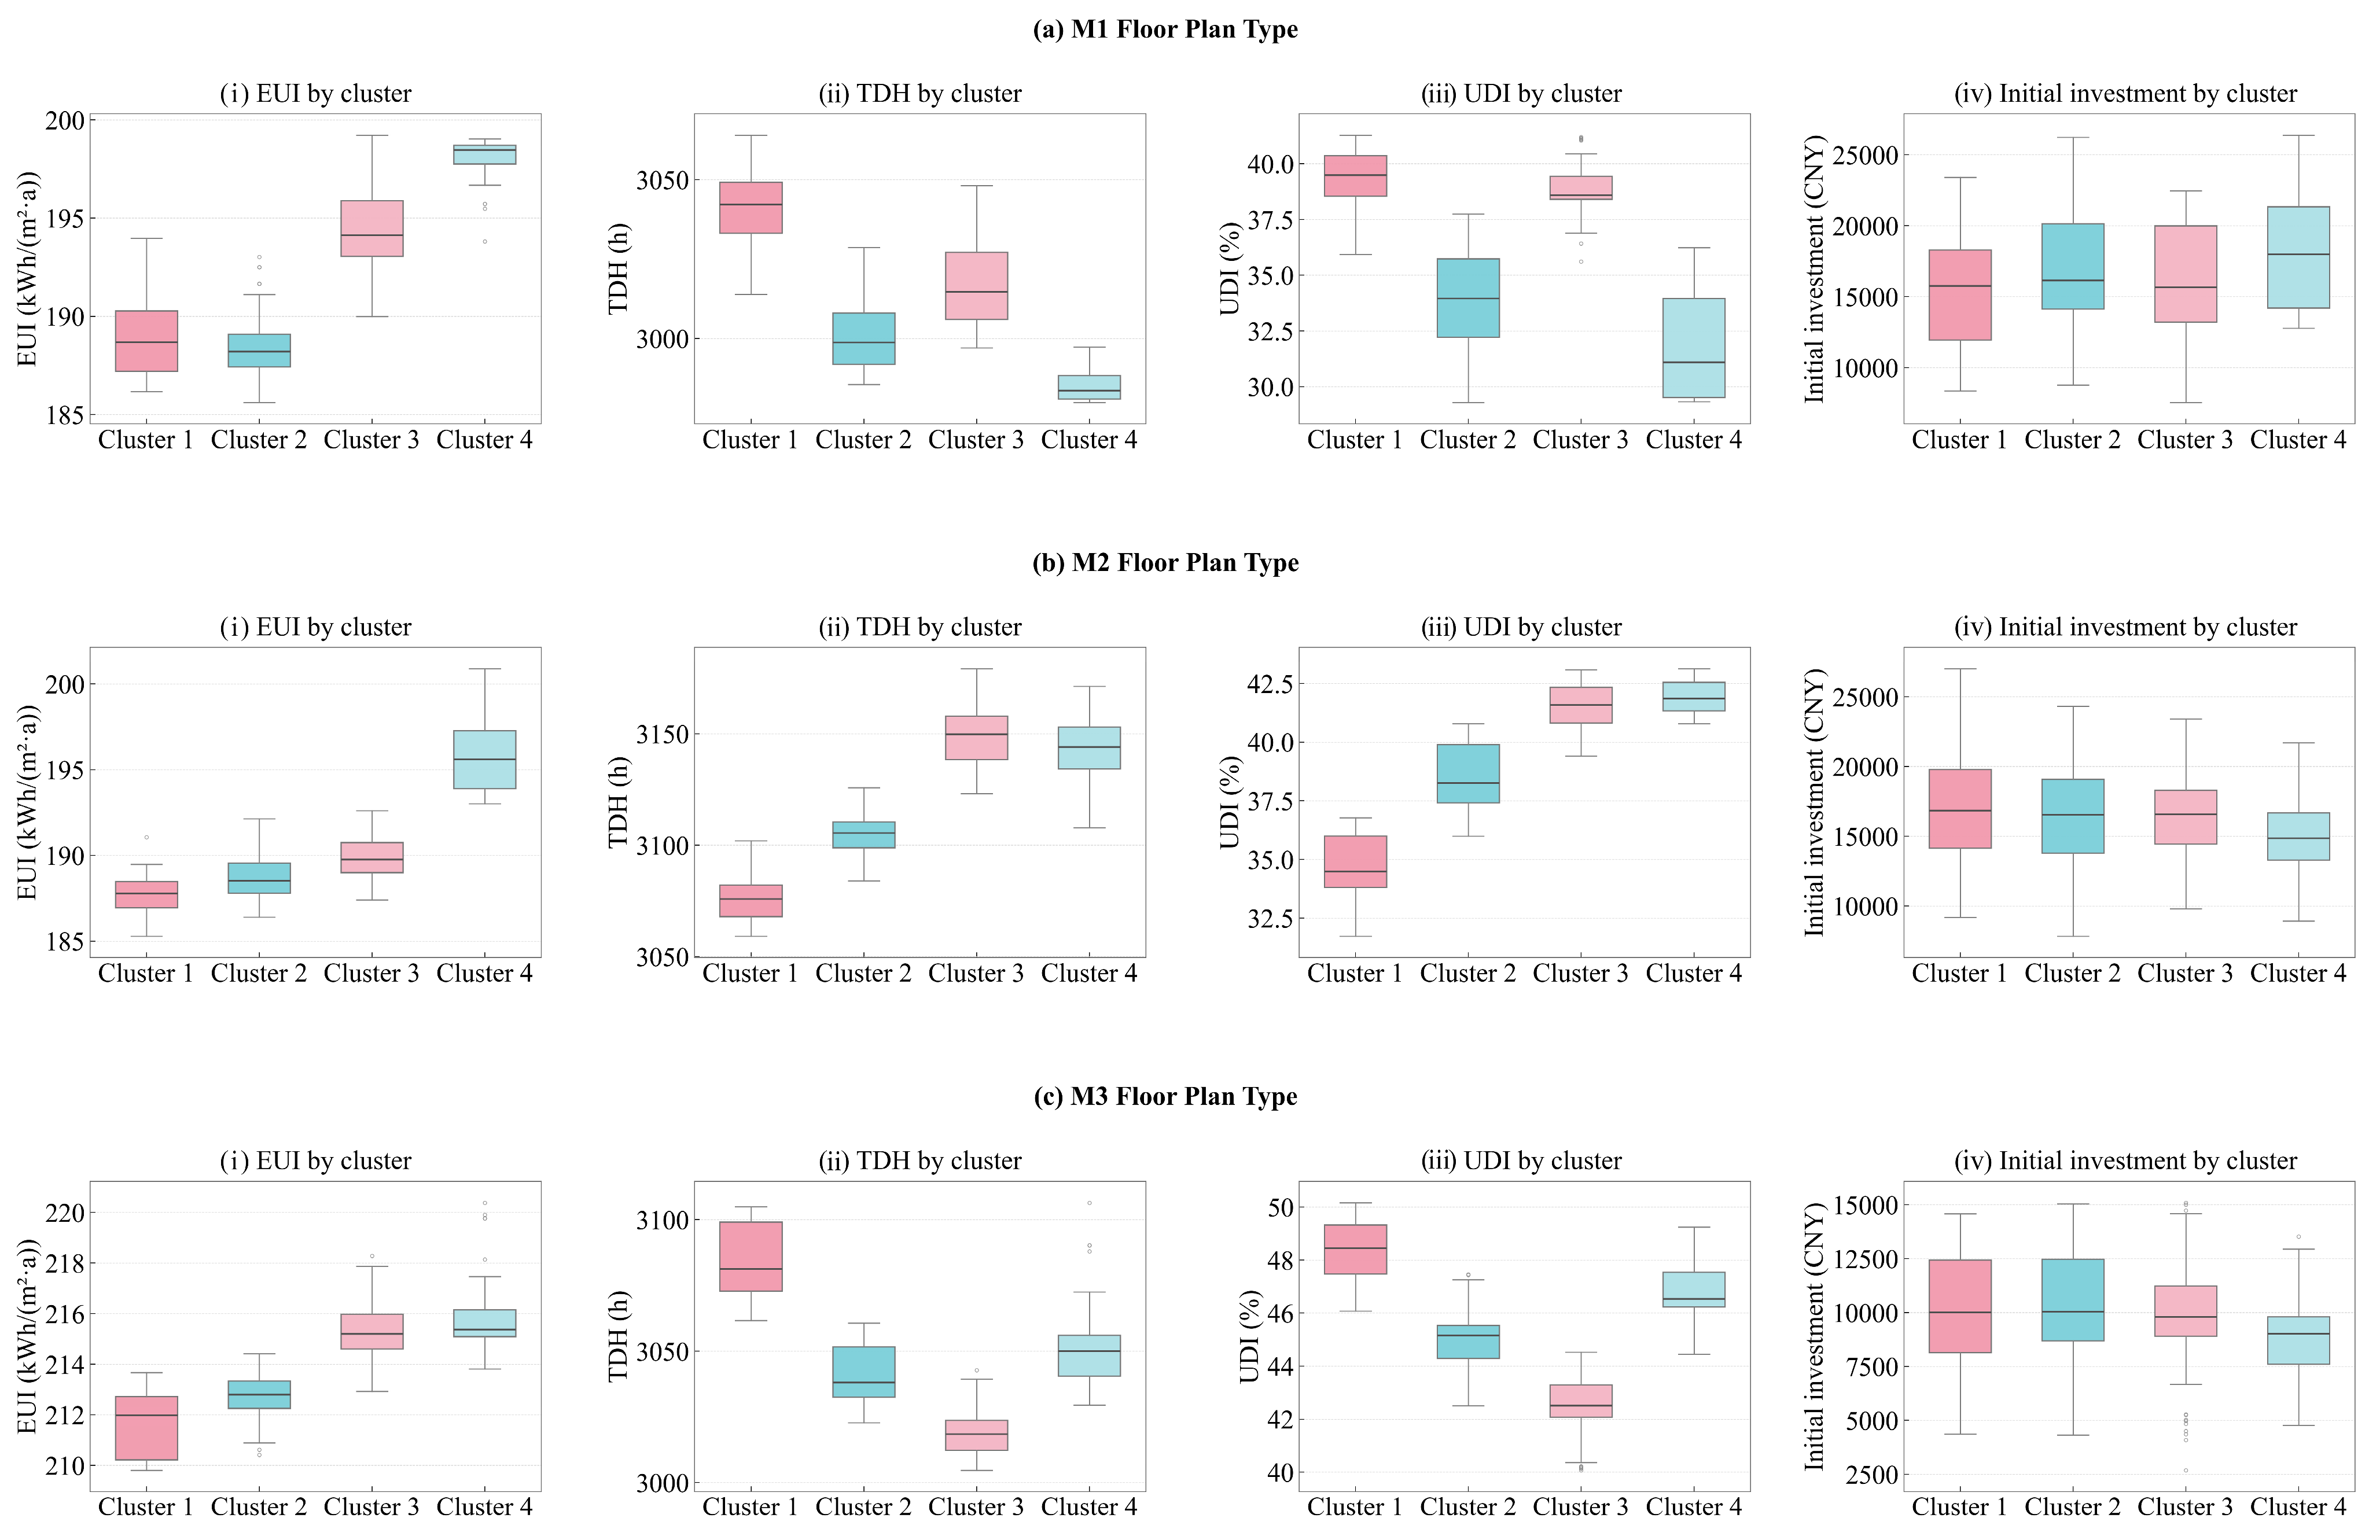
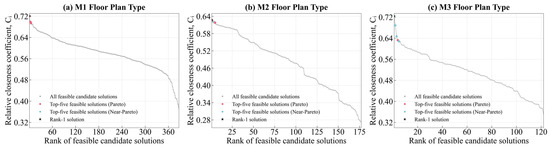
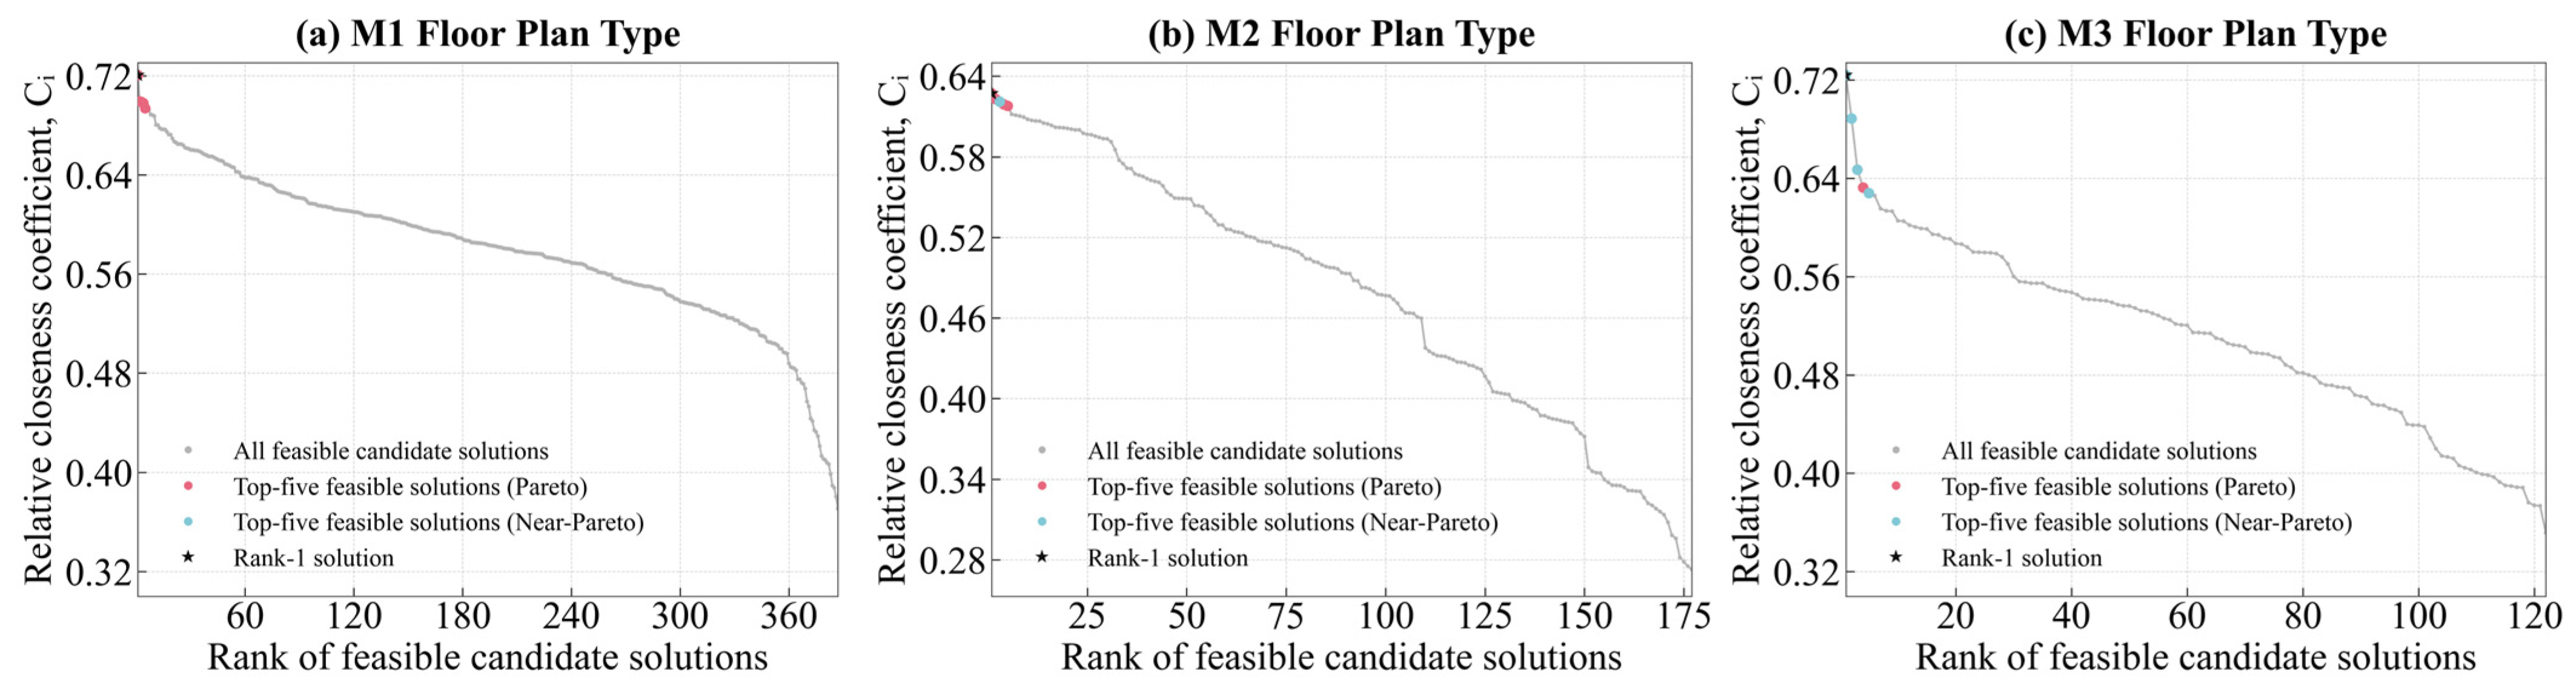
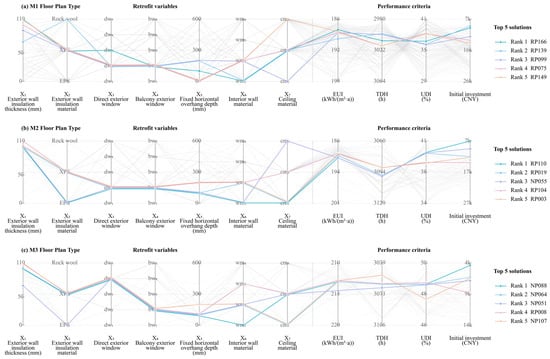
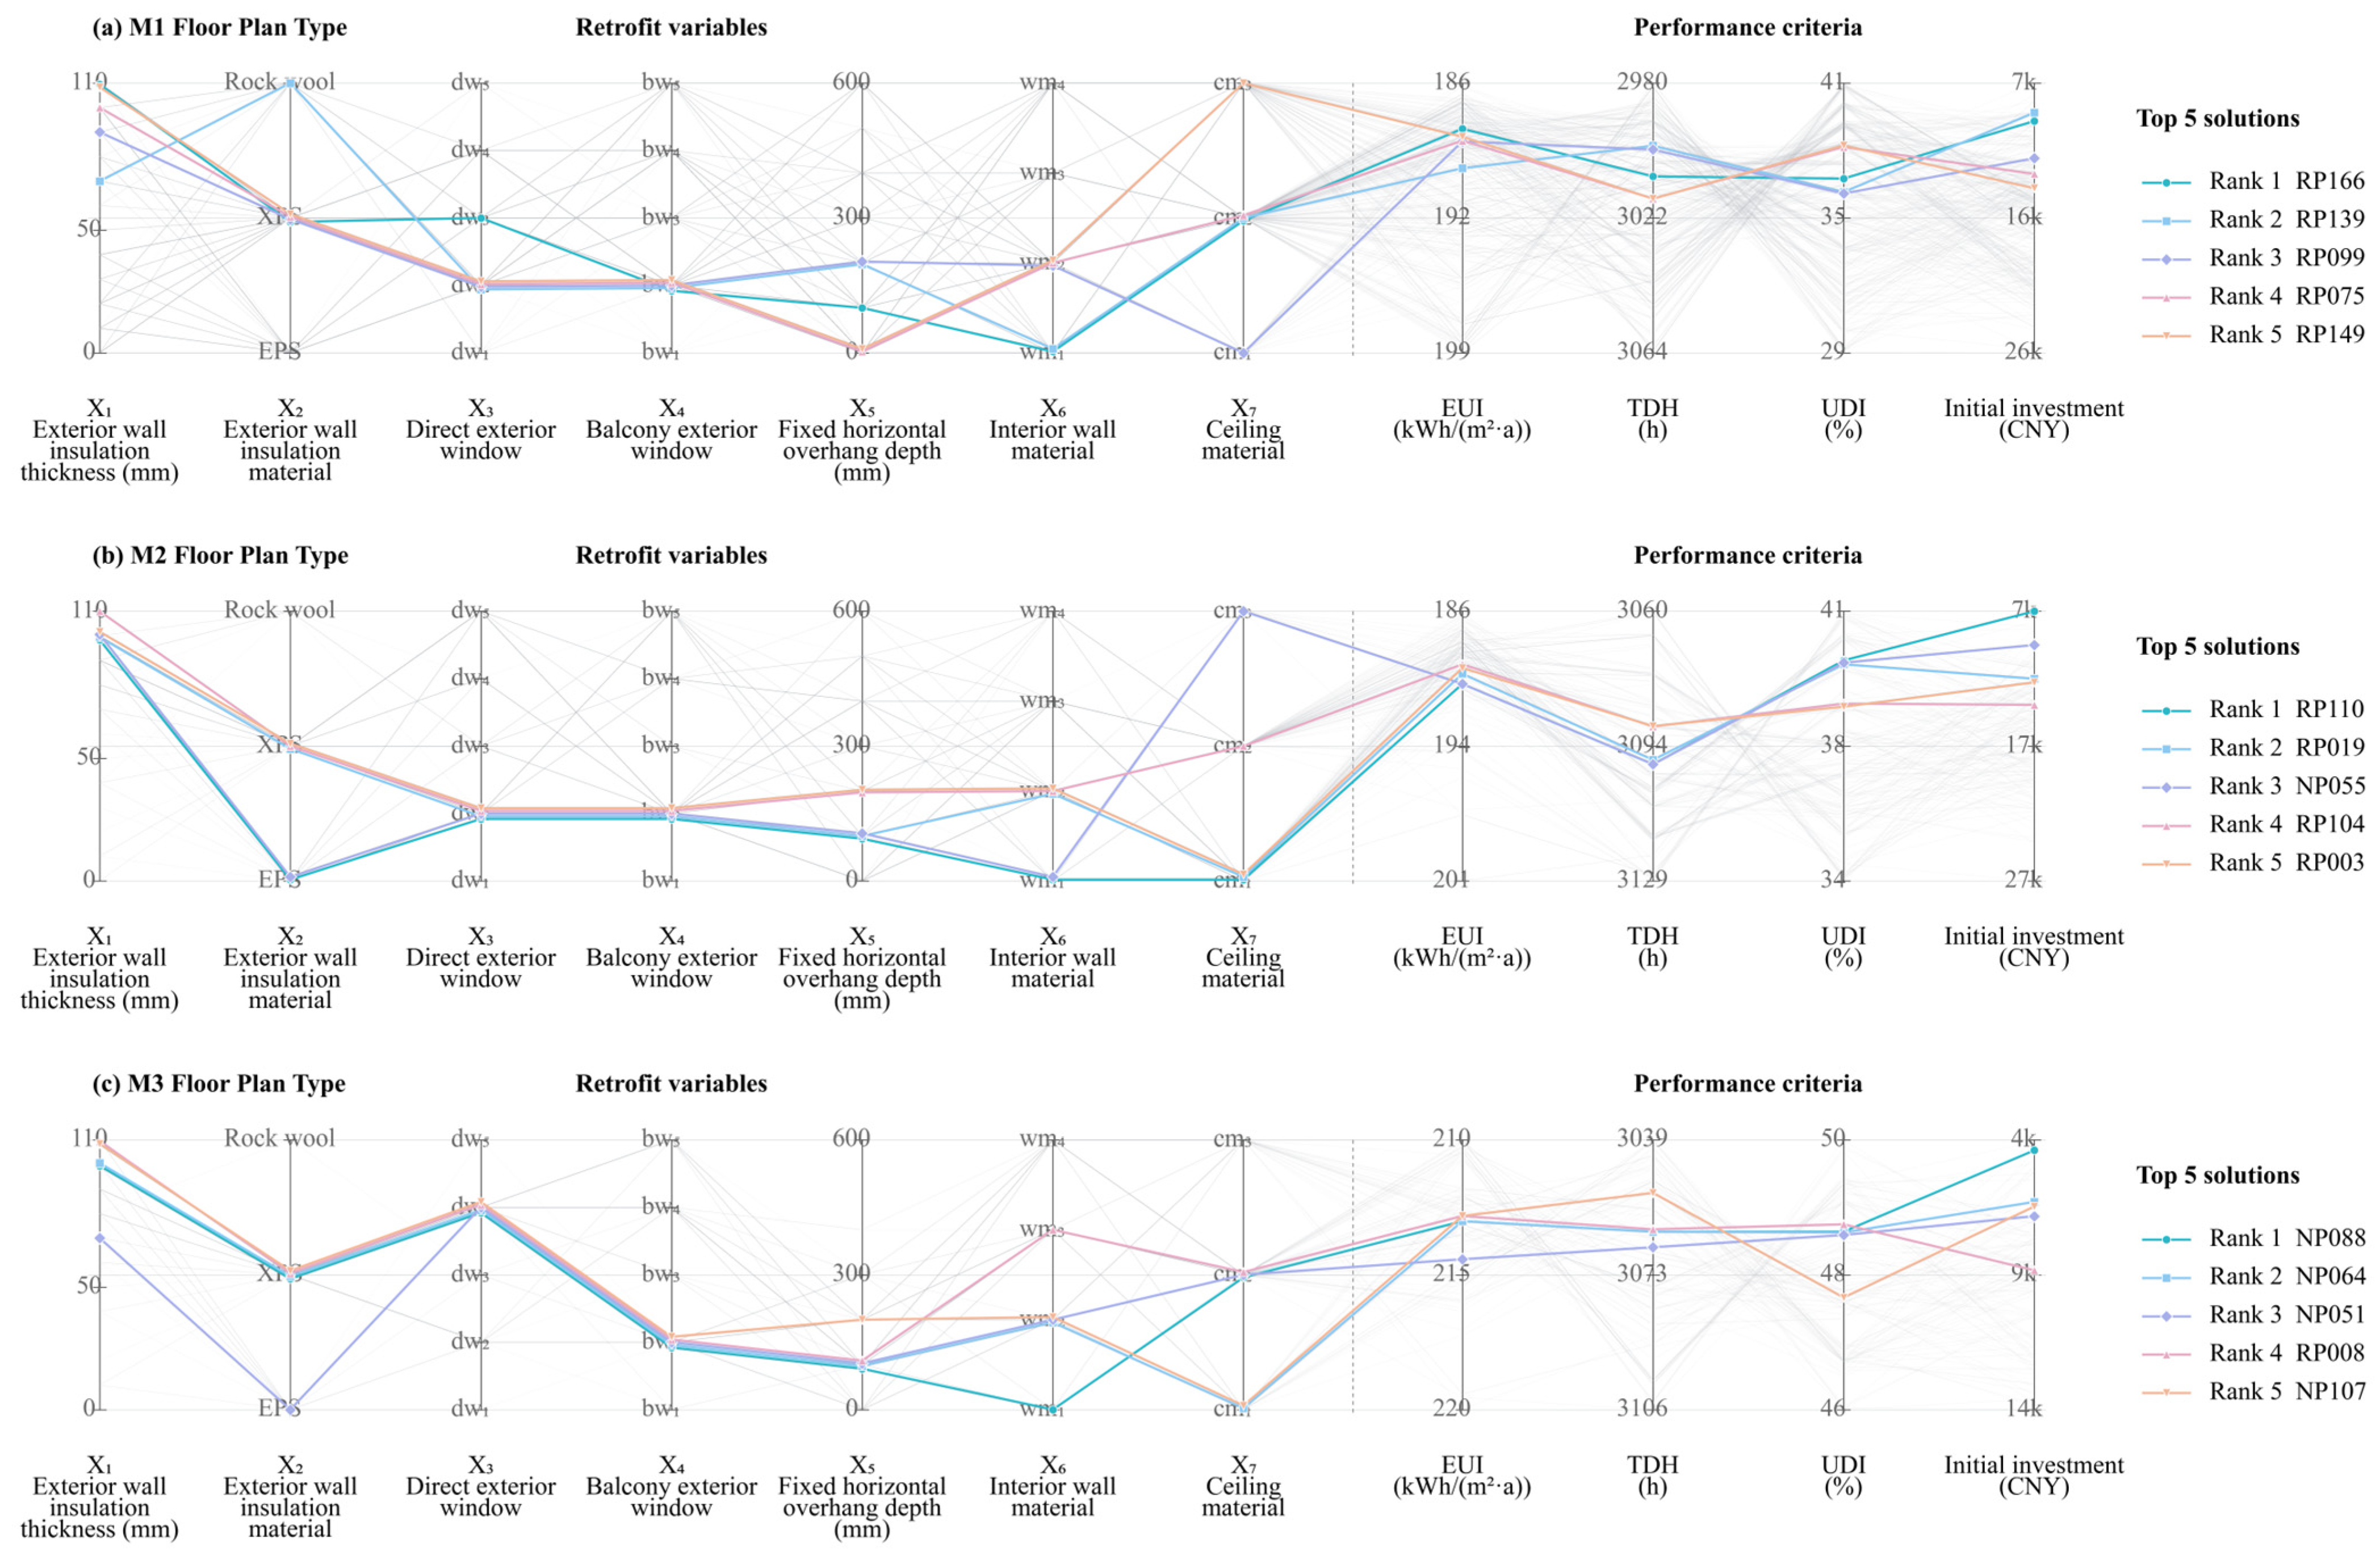
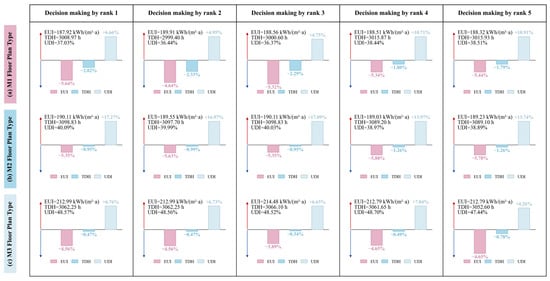
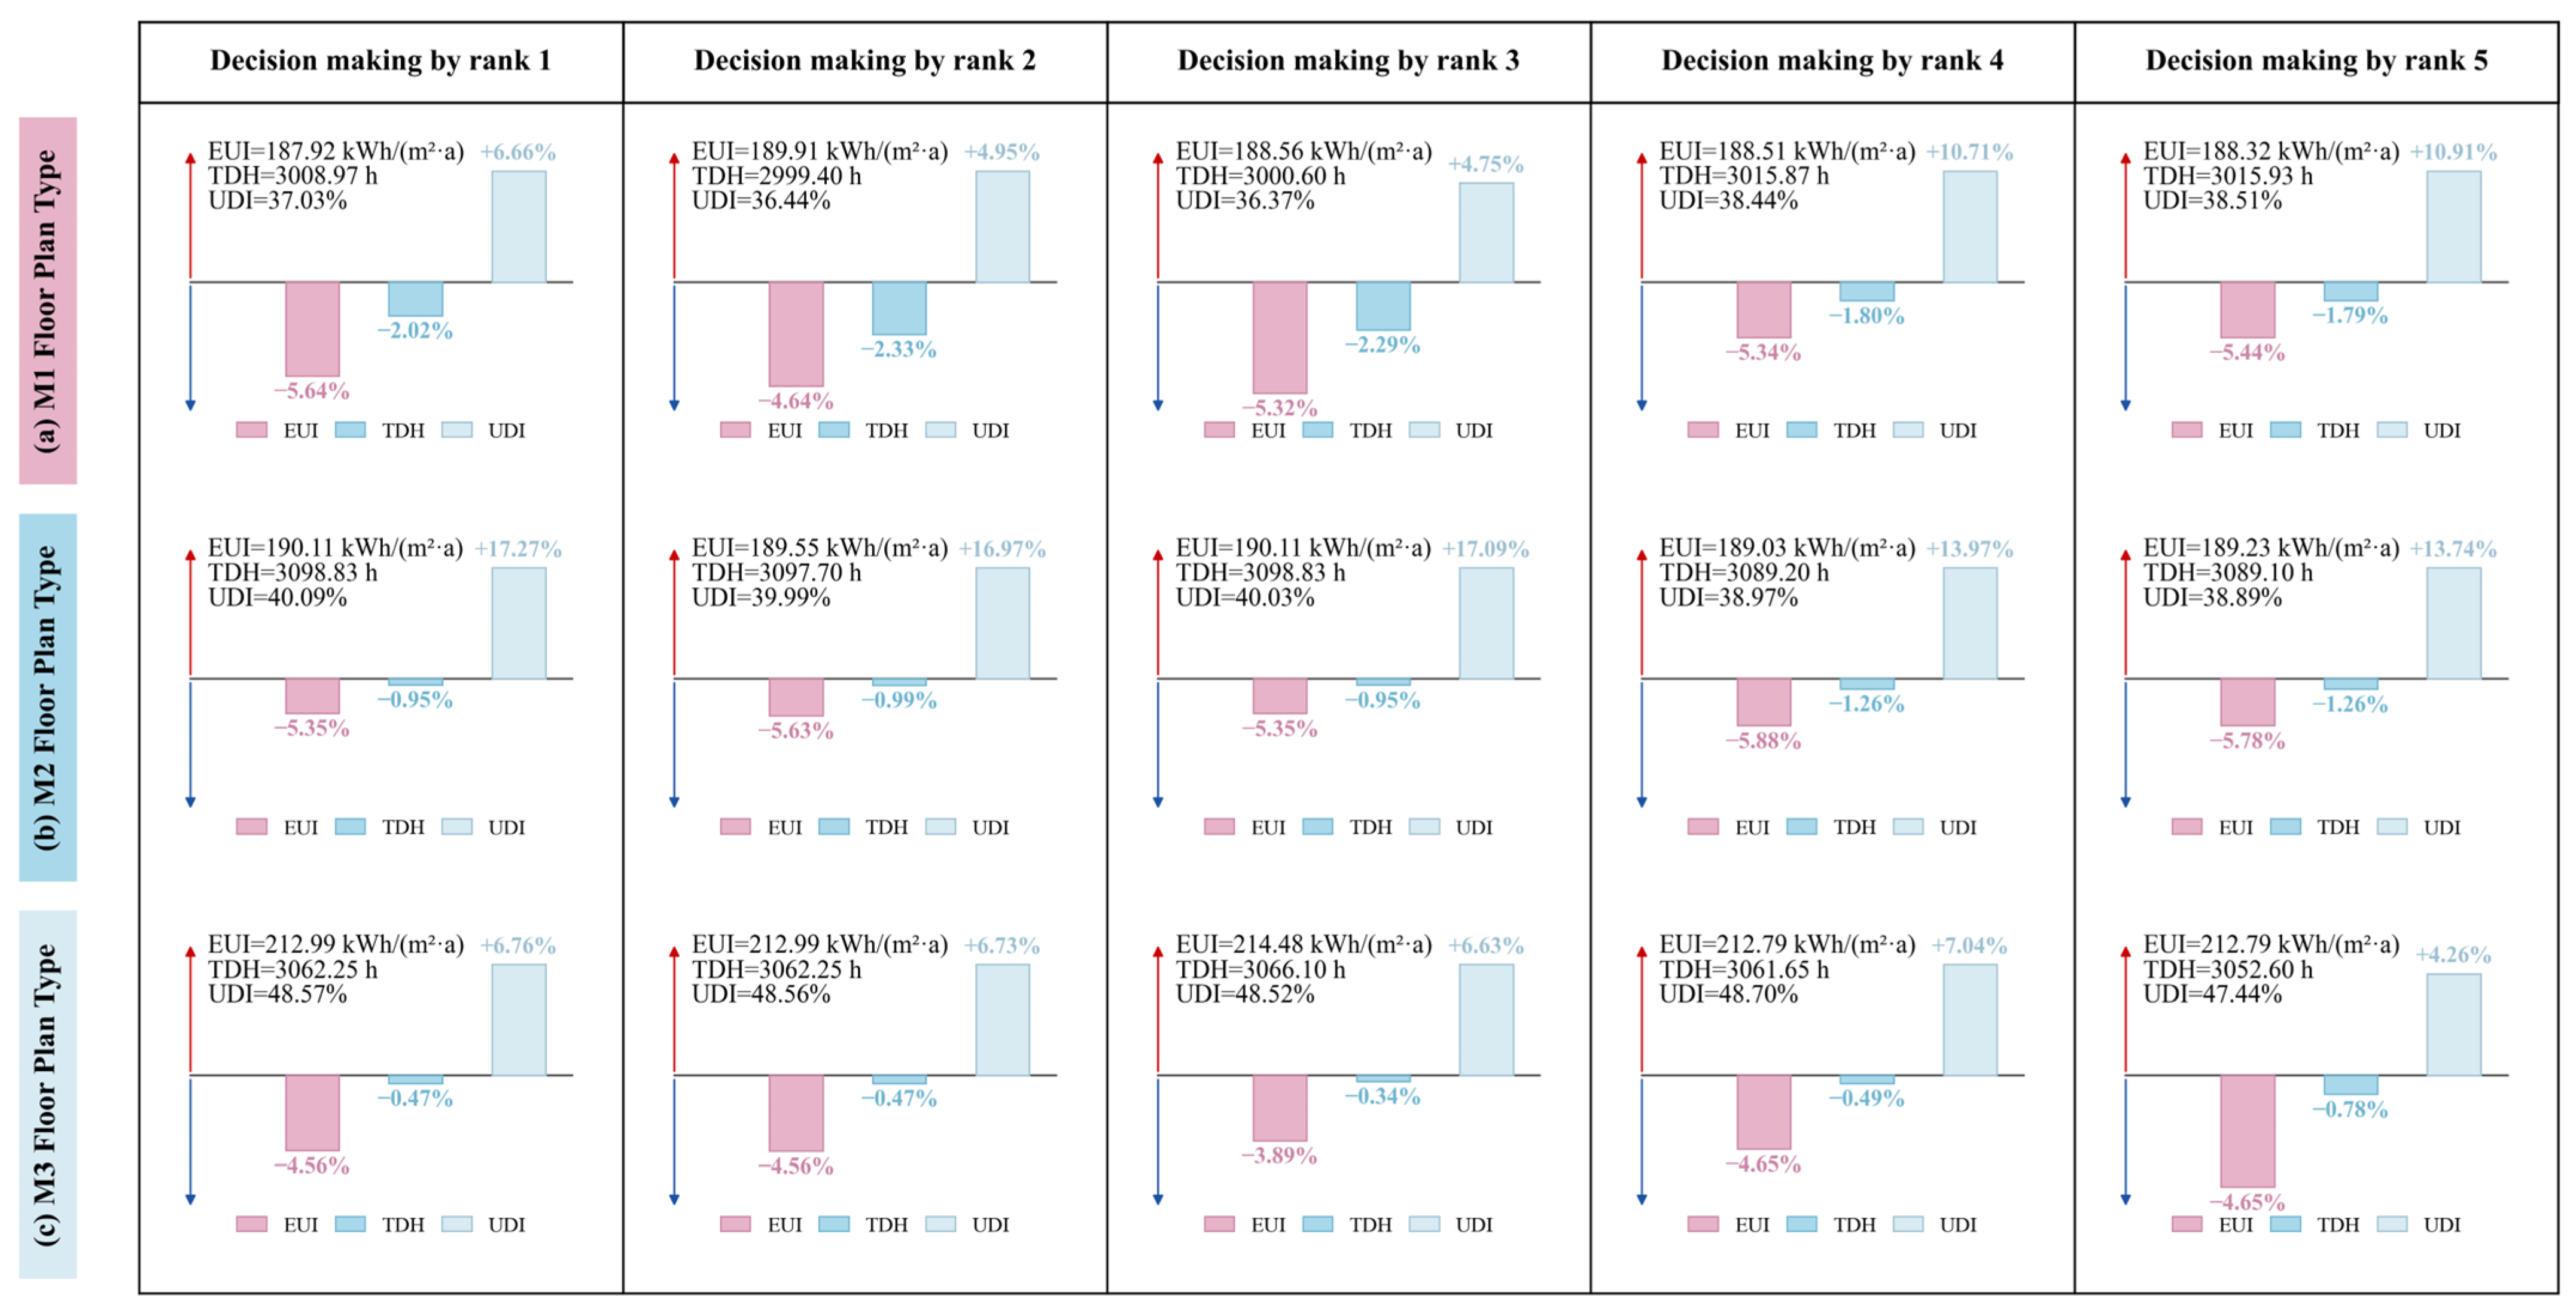

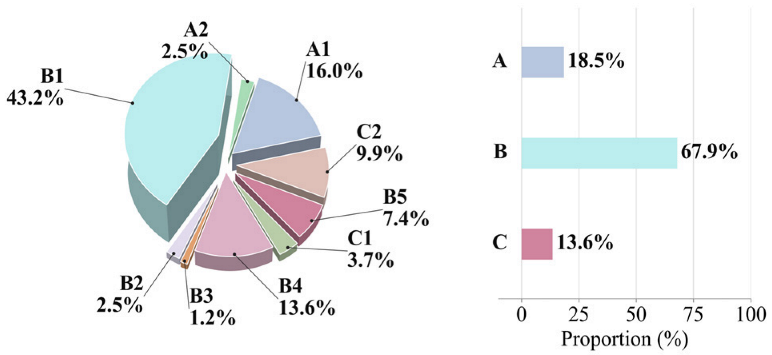
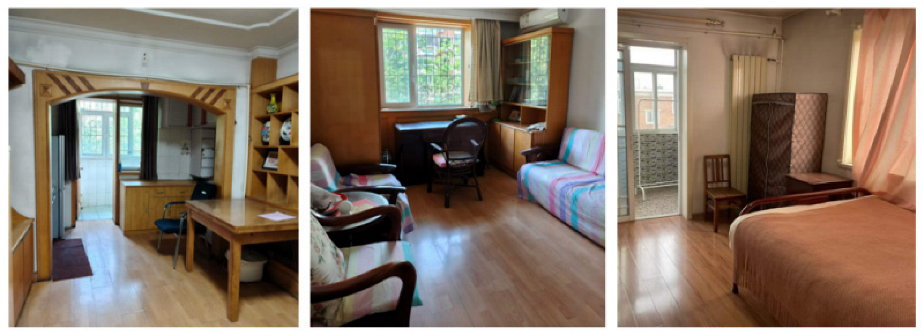
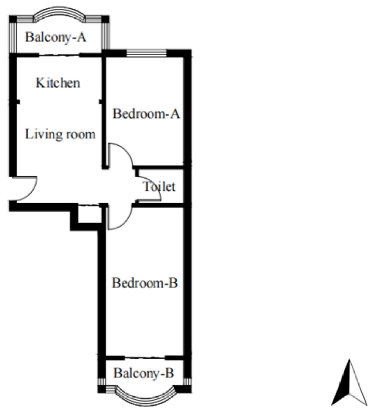
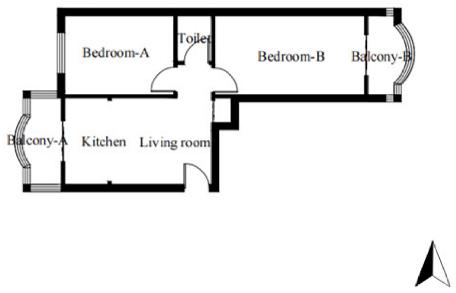
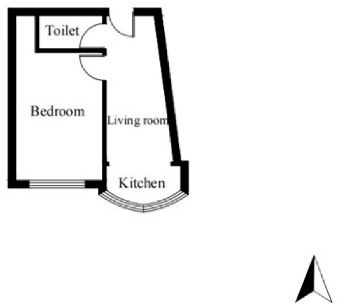
Disclaimer/Publisher’s Note: The statements, opinions and data contained in all publications are solely those of the individual author(s) and contributor(s) and not of MDPI and/or the editor(s). MDPI and/or the editor(s) disclaim responsibility for any injury to people or property resulting from any ideas, methods, instructions or products referred to in the content. |
© 2026 by the authors. Licensee MDPI, Basel, Switzerland. This article is an open access article distributed under the terms and conditions of the Creative Commons Attribution (CC BY) license.