


Abstract
This paper focuses on quantifying overall lifecycle carbon emissions of a case-study structure, identifying key emission stages, and proposing carbon reduction strategies. The lifecycle assessment (LCA) framework combined with BIM technology was used to calculate stage-wise carbon outputs across the materials, assembly, occupancy, and decommissioning phases. The research proposes strategies such as optimizing the localized supply of materials, promoting recyclable building materials, improving building thermodynamic performance, and using clean power applications. The results offer empirical references for lifecycle carbon mitigation across the built environment and critical guidance to accelerate a sectoral low-carbon transition toward carbon peaking and carbon neutrality.
1. Introduction
As a pivotal pillar of the worldwide economic landscape, the construction sector is recognized among the key consumers of global power demand, thereby generating substantial volumes of greenhouse gas emissions [1]. Lifecycle carbon outputs generated by the building domain constitute nearly half of China’s total consumption-related emissions, which has long been deemed a key challenge in achieving the “dual carbon” goals. It is during the entire lifecycle of buildings—from material production and construction to operation, maintenance, and eventual demolition—that enormous amounts of energy are consumed and substantial carbon emissions are generated. Therefore, strengthening envelope energy conservation and accelerating green building retrofits play pivotal roles in curbing planetary carbon footprints. As documented in the Research Report on China’s Building Energy Consumption and Carbon Emissions (2023) [2], the total lifecycle carbon emissions of residential and public buildings nationwide reached 4.07 billion tCO2 in 2021. Among this figure, embodied carbon emissions arising from the materials manufacturing phase stood at 1.70 billion tCO2, accounting for 16.0% of China’s aggregate energy-driven carbon footprint. It is the high energy consumption in building materials production that indicates tremendous improvement potential in reducing the overall carbon footprint of the construction industry [2]. Statistical research on carbon emissions from the construction industry across multiple global regions has been conducted by foreign scholar Robert H. Crawford. An analysis of 44 countries, including China, has revealed that China ranks first globally in terms of construction industry carbon emission intensity [3], which implies that the carbon emissions generated per unit of output or activity in China’s construction industry are relatively high.
Amid accelerating sustainable transformation and ecological development within the built environment, one of the core strategies is the management of greenhouse gas emissions spanning the whole-process lifecycle of building facilities, spanning from design and construction to operation. Accordingly, this study aims to quantify the lifecycle carbon emissions of a kindergarten project by linking BIM-based material information, energy simulation, and stage-specific LCA calculations and to identify the dominant emission sources that should be prioritized for carbon reduction.
2. Literature Review
2.1. Current Status of Carbon Emissions on Buildings
Precise quantification of greenhouse gas discharges constitutes a necessary prerequisite in exploring temporal evolution patterns and driving factors in the construction industry [4], and it is also the first step in formulating carbon emission reduction policies. Leontief pioneered the conceptualization of a mathematical model to systematically analyze the interdependencies and flows of goods and services among industrial sectors within a national economy. This framework laid the theoretical groundwork for dynamic forecasting and structural analysis of economic systems, thereby establishing the foundational principles of the input–output methodology [5]. Subsequently, Minx et al. extended and refined the model to evaluate the environmental impacts across diverse industrial sectors, thereby advancing its application in interdisciplinary sustainability analyses [6]. Zhang et al. established a transnational carbon emission accounting system spanning 1995–2009 using a hybrid multi-regional input–output analysis framework. This system enabled systematic evaluation and comparative analysis of the cumulative magnitude and structural characteristics of sectoral greenhouse gas in the construction sector across 41 global economies [7]. Chen et al. applied input–output modeling to comprehensively examine the spatial–temporal trajectory of carbon discharges across the Chinese building sector. Their findings revealed a significant expansion of 388.7% in carbon dioxide emissions between 1995 and 2011, reflecting the sector’s rapid growth [8]. Furthermore, Ju et al. investigated methodologies for quantifying operational-phase carbon emissions in buildings and demonstrated that the carbon emission factor method is a simple yet reliable approach [9]. However, the accuracy of this method heavily relies on the quality of energy consumption data and the precision of emission factors employed. Xiaoyu Luo et al. analyzed the carbon emission characteristics of residential and office buildings in China and established prediction models for estimating their carbon emissions at the design stage. These models enable a rapid estimation of building carbon emissions, encouraging designers to consider carbon reduction in the early design stages [10]. Pingping Liu et al. selected a prefabricated residential building in Shanghai as the research case and found that the operational stage accounts for the predominant share of annualized greenhouse gas releases throughout the whole building lifecycle, accounting for 63.64% of total emissions [11]. Lee et al. developed a Revit-based carbon emission estimation system, which quantifies lifecycle emissions by calculating primary materials constituting 90% of the total building material volume [12]. Xin Wang et al. applied a locally tailored carbon emission calculation criterion to quantify lifecycle embodied impacts of the interior decoration project in a Shenzhen residential building spanning all structural lifecycle tiers, thereby deriving the carbon emission intensity for each phase [13].
2.2. Development of Building Information Modeling (BIM)
Under the backdrop of continuous innovation in Building Information Modeling (BIM) technology, traditional two-dimensional (2D) plan-based design methodologies have been gradually supplanted by three-dimensional (3D) digital modeling techniques. Through the integration of BIM technology, critical stages of the construction process—including architectural design, upstream material synthesis, transit distribution, and engineering erection—can effectively achieve end-to-end visualization management and information integration across all stages. This technological advancement has significantly enhanced multidimensional information exchange efficiency, simultaneously optimizing on-site construction management processes while effectively strengthening the synergistic improvement of engineering quality and operational productivity.
Under the context of advancing Building Information Modeling (BIM) technology, Olatunji et al. advocated for the adoption of BIM as a replacement for conventional 2D drawings, emphasizing that this approach not only effectively stores data and information but also enables design teams and construction crews to simulate real-world construction scenarios, thereby enhancing project implementation understanding and planning [14]. Eleftheriadis’s team developed a carbon emissions evaluation model leveraging BIM technology, categorized by building typology. Their analysis across different structural building types revealed that optimizing design parameters can reduce carbon emission intensity in certain structures while improving assessment precision and sustainability management efficiency [15].
Zongxin Yu synthesized BIM’s technical features to propose application advantages of BIM in construction project management and outlined stage-specific implementation strategies for each project phase [16]. Yong Yang et al. integrated the emission factor method with BIM, complemented by GBS 2020 software and Geographic Information System (GIS) technology, to establish a more convenient and reliable framework for calculating building carbon emissions [17]. Chunli Li et al., meanwhile, constructed a carbon emissions database by analyzing interoperability between GTJ 2018 software and regional climatic impacts on building environments. They further utilized the Guanglianda pricing software to conduct stage-wise carbon emission calculations for construction projects, demonstrating the feasibility of integrating multi-source data for holistic assessment [18]. Recent systematic reviews further distinguish the hard and soft benefits of BIM adoption and identify lifecycle sustainability assessment as an established direction for BIM integration [19,20].
Drawing on interdisciplinary research perspectives, scholars have conducted comprehensive investigations into the footprint generated across the building domain and built environments. Such findings not only delineate research trajectories but also establish methodological frameworks for analyzing emissions during construction phases. This study employs a real-world construction project as a case study, applying the lifecycle assessment framework to quantify carbon emissions across all lifecycle stages. The contribution of this case study is to connect BIM-derived material quantities and building energy simulation with stage-specific LCA accounting in one workflow, so that dominant emission stages and components can be traced directly to case-specific carbon reduction priorities.
3. Establishment of Model
3.1. Division of Lifecycle Phase
In this study, the building lifecycle is defined to consist of four stages: the material production stage, the construction stage, the operation stage, and the demolition stage. The material production stage encompasses the entire process from material manufacturing in factories to their final delivery to construction sites. The operation stage refers to the period starting from the official commissioning of the building and extending until it reaches its predetermined service life.
3.2. Methods for Carbon Emission Quantification
Currently, the internationally recognized carbon emission quantification methods primarily include direct measurement, carbon balancing, carbon emission factor method, and input–output analysis. This study employs the carbon emission factor method as its core computational framework, where carbon emission factors constitute the baseline input data for evaluating total carbon emissions. In this study, the carbon emission factors associated with building materials and construction machinery, and other categories are determined based on the Standard for Building Carbon Emission Calculation (GB/T 51366-2019) [21]. The carbon emission factor for purchased grid electricity uses the 2022 national grid average of 0.5703 tCO2/MWh (equivalent to 0.5703 kgCO2/kWh), as published by the Ministry of Ecology and Environment of China [22].
3.3. Carbon Emission for Material Production Stage
The overall carbon emissions generated in the building materials manufacturing stage are composed of two primary components: direct emissions generated during manufacturing processes coupled with secondary carbon emissions induced by haulage operations conveying materials from production facilities to construction sites. These components collectively account for the total carbon emissions spanning the whole raw material acquisition and processing cycle.
3.3.1. Carbon Emission for Construction Material Production Stage
The carbon emissions arising from material production processes are primarily attributed to the processing and production of construction materials, which can be calculated using Equation (1):
where represents the quantity of material type i in the unit corresponding to its emission factor in Table 1; denotes the carbon emission factor for material type i (kg CO2 per unit quantity of material).
Table 1.
Carbon emission factor of materials.
Where product-specific data are available, independently verified environmental product declarations (EPDs) or equivalent third-party verified carbon data are preferred. When such data are unavailable, the default material emission factors in Table 1, compiled from GB/T 51366-2019, are used. For the use of alternative recycled materials, their carbon emissions should be estimated at 50% of the carbon emissions associated with the primary materials they substitute. Additionally, for recyclable construction and demolition waste generated across the on-site assembly and structural deconstruction stages, if such waste is utilized as substitutes for virgin materials, their carbon emissions should also be calculated at 50% of the emissions from the virgin materials, and this reduction should be subtracted from the total project carbon emissions.
3.3.2. Carbon Emission of Transportation Stage for the Construction Material
Carbon Emission Calculation for the Material Transportation Stage:
The carbon emission factor for the construction material transportation phase should comprehensively account for two categories of emissions: direct carbon emissions arising from material freight operations between production plants and project sites; indirect carbon emissions originating from the generation of fuel and electricity consumed by transport systems.
In Equation (2), is the transported mass of material i (t), is its transport distance (km), and is the transport-mode carbon emission factor (kgCO2e/(t·km)). is selected from Table 2, whereas is determined from the project transport distance or the default distances stated below Table 2.
Table 2.
Carbon emission factors for various transportation modes .
Formula for calculating the total carbon emissions from the production phase of materials versus the transportation phase of materials that consume production:
In Equation (3), is the area-normalized carbon emission from material production and transportation (kgCO2e/m2), and are the corresponding total emissions (kgCO2e), and is the total building floor area (m2). The quantification of carbon emissions spanning building material fabrication and transportation stages of building materials should include the main structural materials of the building, building envelope materials, building components, and parts. Transportation methods can be selected based on Table 2.
3.4. Carbon Emissions During Construction and Demolition Phases
3.4.1. Carbon Emissions in the Construction Phase
The critical key to determining engineering assembly phase carbon emissions lies in quantifying energy consumption associated with electricity, gasoline, diesel, natural gas, and other energy sources. On-site carbon emissions originate not only through sub-division along with itemized construction processes but also from the implementation of additional measures. The total power and fuel inputs across the on-site building phase is preferably evaluated using an empirical construction process energy consumption estimation method.
Specifically, carbon emissions generated by on-site machinery, mixing plants, prefabricated components, modular assemblies, and related temporary facilities during construction should be included in the total carbon emissions inventory of the structural execution stage. However, carbon loads resulting from the construction and operation pertaining to temporary facilities for office, living, and material storage purposes spanning the engineering window are excluded from total carbon emissions attributable to the construction phase. This distinction ensures that only emissions directly tied to core construction activities are accounted for in lifecycle assessments of built environments.
The energy consumption of sub-division and itemized engineering projects should be calculated using the following formula:
where denotes the engineering quantity of the ith divisional/sub-divisional project item; is the specific energy intensity parameter for the ith engineering item (unit: kWh/unit); is the consumption of machine shifts for the jth type of construction machinery per unit quantity of the ith project (unit: shifts); is the operational power/energy requirement per shift for machinery type jth (unit: kWh/shift); represents the auxiliary energy use of small-scale tools (omitted from machinery shift metrics and assigned to material-related energy inputs) in the ith item (unit: kWh); i is the serial number of sub-division/itemized engineering projects; and j is the serial number of construction machinery types.
The energy consumption calculation for measure items shall comply with the following provisions:
where denotes the engineering quantity of the ith construction measure item (expressed in item-specific units); is the energy consumption coefficient for the ith measure item (unit: kWh per unit of project quantity); designates the machine-shift consumption rate of the jth construction machinery per unit quantity of the ith measure item (shifts/unit).
The carbon emissions associated with the on-site construction stage can be formulated as follows:
where represents the carbon emissions intensity per unit gross floor area during the construction stage (kgCO2/m2); denotes the total consumption of the i-th type of energy source throughout the construction phase (kWh or kg); is the carbon emission factor associated with the i-th energy category (kgCO2/kWh or kgCO2/kg), which is determined in accordance with Appendix A of GB/T 51366-2019; and indicates the total building floor area (m2).
3.4.2. Carbon Emissions in the Dismantling Phase
Carbon emissions generated throughout this stage are composed into two parts: Firstly, there are the embodied carbon emissions resulting from heavy machinery operations during demolition operations. Although the machinery employed in this stage differs from that used throughout the building erection stage, the quantification method applied to determine their carbon emissions remains fundamentally similar. Secondly, carbon emissions originating from post-demolition waste management encompass both haulage and end-of-life disposal activities. The calculation framework for this component conforms to the methodology applied in the building material transportation stage.
3.5. Carbon Emissions in the Operational Phase of a Building
The scope of carbon emission calculation for the building operation phase should comprehensively cover the carbon emissions generated by various systems and components during the building’s operational period. Specifically, this accounting scope covers HVAC installations, service water heating systems, lighting and elevator networks, and renewable energy applications, along with carbon offset sinks. The area-normalized carbon emissions generated during the operational stage can be formulated as follows:
For Equation (9), denotes the area-normalized operational stage carbon emission; for Equations (9) and (10), the following subscripts are used consistently: i denotes the energy type, and j denotes the corresponding building subsystem, where is the annual demand for energy source ith within the building (unit/year); is the specific carbon emission coefficient for the ith energy carrier (kgCO2/unit); represents the yearly input of the ith energy form required by the jth energy-consuming subsystem (unit/year); specifies the on-site renewable energy provision of type i delivered to subsystem j (unit/year); i and j represent indices for terminal energy types (e.g., grid power, natural gas, petroleum-based fuels, and municipal thermal supply) and building functional subsystems (e.g., HVAC, illumination, and sanitary hot water installations), respectively; is the annual vegetative carbon offset potential of green landscape areas (kgCO2/year); y denotes the designated building service life (a); and is the total constructed floor area (m2).
4. Case Study
Taking a kindergarten project in Guiyang, Guizhou, as the empirical research object, the project information was obtained from the design drawings used to establish the BIM model, and the primary structural concrete is C40; the essential project specifications are detailed in Table 3:
Table 3.
Basic project information table.
4.1. Construction of BIM Model
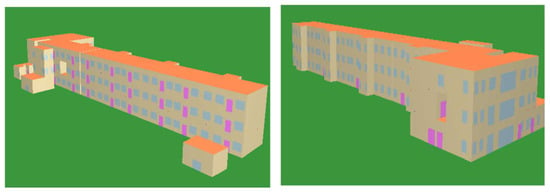
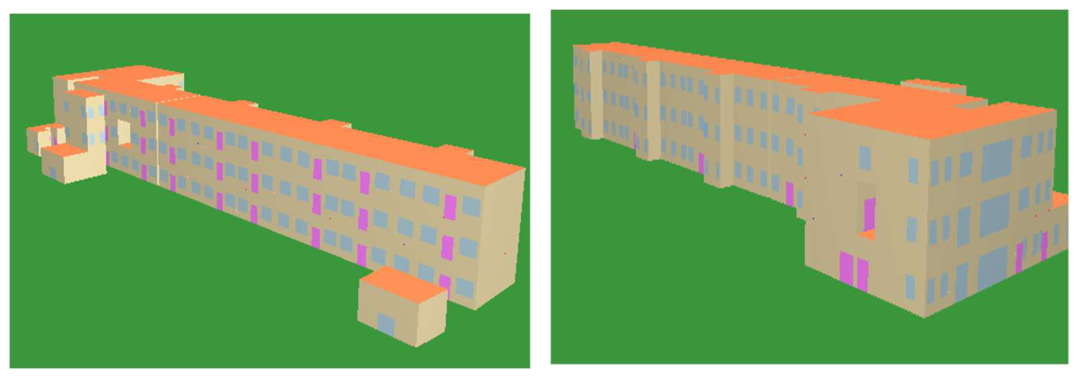
Based on an analysis of the current market share and software interoperability, this study selected Autodesk Revit as the primary tool for constructing base models of building products. By leveraging existing CAD drawings to generate models, this approach ensures efficient model creation across all stages of architectural projects. Not only does this methodology reduce time expenditures associated with remodeling processes, but it also effectively mitigates information asymmetry between project stakeholders. The high interoperability of Revit facilitates seamless integration across the design, construction, and documentation phases, thereby enhancing project management efficiency. For material stage accounting, model quantities were organized through the Revit quantity schedules by material category and checked against the project drawings before being matched with the corresponding emission factor categories in Sware CEEB2024. For operational analysis, the Revit model was imported into Sware Energy Design Software 2024 for thermal simulation, and the resulting energy-use data were then used in the operational stage carbon calculation (Figure 1).
Figure 1.
Energy-saving model.
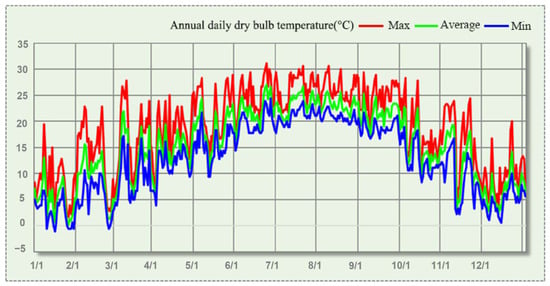
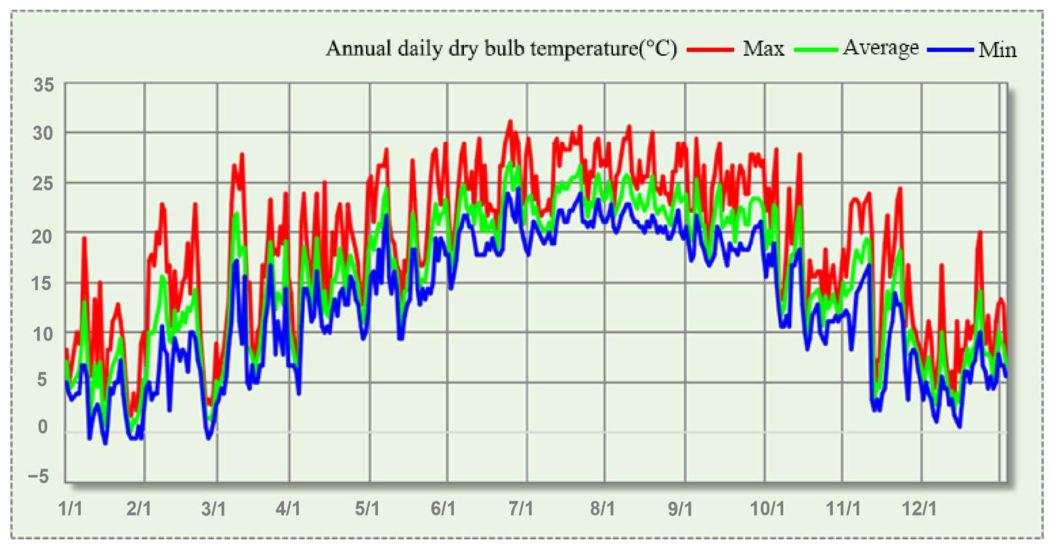
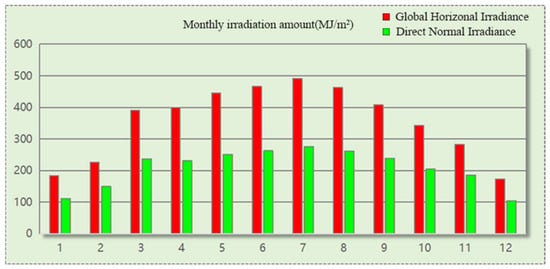
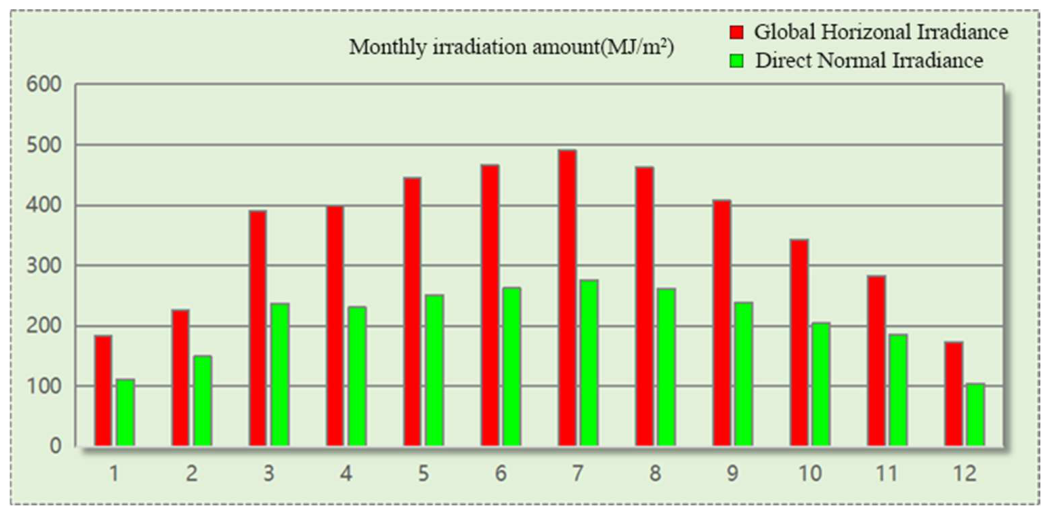
Based on the constructed model, an integrated analysis of local climatic data and solar radiation data was conducted in accordance with the Standard for Meteorological Parameters in Building Energy Efficiency. For Guiyang, the local design parameters used to interpret the simulation include a hottest-month mean temperature of 24.0 °C, a coldest-month mean temperature of 4.9 °C, 11 summer air-conditioning days, and a 74-day heating period; the winter heating design outdoor temperature is −1.0 °C, while the summer air-conditioning dry- and wet-bulb temperatures are 30.0 °C and 23.0 °C, respectively [23]. By utilizing the Code for Thermal Design of Civil Building (GB 50176-2016) [24], parameters such as thermal conductivity (λ) of various materials were precisely determined, yielding accurate test data (as shown in Figure 2 and Figure 3).
Figure 2.
Daily dry-bulb temperature graph.
Figure 3.
Monthly irradiation graph.
4.2. Analysis of Carbon Emissions
Based on the established mathematical equations, the lifecycle carbon footprint of the selected building was calculated utilizing the Sware CEEB 2024 modeling software.
4.2.1. The Stage of Material Production
Carbon emissions are predominantly generated across both the raw material manufacturing and freight transport stages of the production process.
As evidenced by Table 4, C40 concrete constitutes the largest contributor to carbon emissions in the material production stage, reaching 624.828 tCO2e, with steel reinforcement ranking second at 507.757 tCO2e; the C40 factor of 340 kgCO2e/m3 is obtained by linear interpolation between the C30 (295 kgCO2e/m3) and C50 (385 kgCO2e/m3) factors listed in Table 1. Consequently, concrete and steel bars serve as the primary leverage points for decarbonization during the fabrication phase.
Table 4.
Carbon emissions in the material production stage.
As evidenced by Table 5, there is a significant difference in carbon emissions between the material production and transportation stages. The main sources of carbon emissions are concrete, bricks, and sand. The carbon emissions from cables, interior doors, etc., are relatively small. Although sand quarrying generates minimal carbon emissions during the production phase, its carbon footprint escalates substantially during the transportation stage. Therefore, for this raw material, the main emission reduction measures can be focused on the transportation stage. Concrete and steel bars have high carbon emissions in both stages, so they should be the primary targets for emission reduction in the production and transportation stages.
Table 5.
Carbon emissions during the material transportation phase.
4.2.2. Analysis of Carbon in Construction Phase and Demolition Phase
A reinforced concrete (RC) moment-resisting frame is adopted as the primary structural system for this project. During the construction phase, carbon emissions are predominantly driven by the deployment of construction equipment, as quantified by the mechanical carbon emission factors specified in the GB/T 51366-2019 Standard. However, due to insufficient data availability, precise estimation of emissions during the demolition and recycling processes—which are typically conducted using mechanical methods—is not feasible. To address this limitation, the proportional estimation method was adopted in this study. Considering that construction activities generally contribute a relatively small proportion to the embodied carbon emissions compared with material production and that detailed construction activity data were unavailable, a value of 5% of the total embodied carbon associated with material fabrication was adopted to estimate construction stage emissions. Previous studies have reported that demolition-related carbon emissions account for approximately 7.8–10.1% of the materialization stage emissions, and a proportion of 10% has been adopted for estimating demolition emissions in building lifecycle assessments [23]. The demolition and material recovery phase was therefore estimated as 10% of the total embodied carbon associated with material fabrication, as summarized in Table 6 and Table 7.
Table 6.
Carbon emissions during the building construction phase.
Table 7.
Carbon emissions during the building demolition phase.
As illustrated in Table 6 and Table 7, the total carbon emissions during the construction phase are 103.559 tCO2e, while those during the demolition phase are 207.118 tCO2e. Consequently, carbon emissions generated during building deconstruction exceed those from the on-site construction stage, with total embodied emissions remaining predominantly concentrated in the structural material production phase.
4.2.3. Analysis of Carbon in Operational Phase
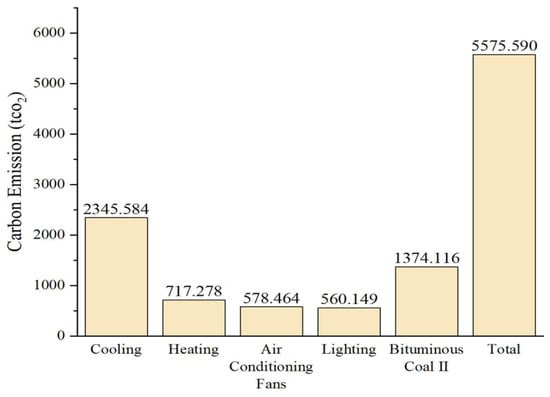
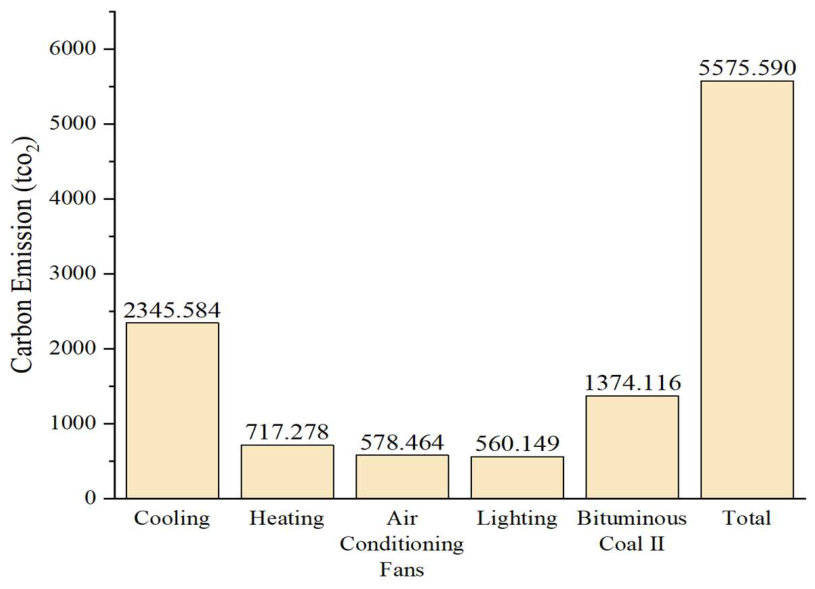
As illustrated in Table 8, operational carbon emissions total 5575.59 tCO2e, substantially dominating and exceeding the cumulative carbon footprint of the remaining lifecycle stages. In the energy model, cooling is supplied by a central cooling source with chilled-water and cooling-water pumps and a cooling tower; heating uses a bituminous-coal-fired boiler with a heating-water pump, while the pumps, fans, and lighting are supplied by grid electricity. Among these, the carbon emissions from the cooling system rank first, with a value of 2345.584; the carbon emissions from bituminous coal rank second, with a value of 1374.116. The carbon emissions from the heating system rank third, with a value of 717.278, followed by those from air-conditioning and lighting systems.
Table 8.
Carbon emissions during the building operational phase.
Quantitative differences among various emission components during the operation phase are clearly reflected in Figure 4. Carbon emissions from the cooling system are considerably higher than those from other components, followed by carbon emissions from bituminous coal II combustion, which rank second. In contrast, carbon emissions from the heating system, air-conditioning fans, and lighting system are relatively low and numerically close, thus intuitively presenting the “high–medium–low” three-level distribution characteristics of carbon emissions in this phase. Based on Figure 4 and Table 8, the cooling system accounts for approximately 42.1% of operational emissions, while bituminous coal II combustion accounts for about 24.6%. It is these two components that together account for 66.7% of the total carbon emissions during the operation stage, thereby serving as the core links for carbon emission control of the kindergarten building in this stage. This characteristic is highly consistent with the usage properties of kindergarten buildings, which require maintaining a constant temperature in children’s activity spaces and involve continuous and high-intensity cooling demand. Moreover, such quantitative findings offer clear empirical evidence as well as directional guidance toward the subsequent targeted development of operational decarbonization strategies throughout the service stage, such as optimizing the operation mode of the cooling system and exploring alternative energy sources to replace bituminous coal II.
Figure 4.
Carbon emissions from building operations.
5. Analysis of Carbon Emissions Based on BIM
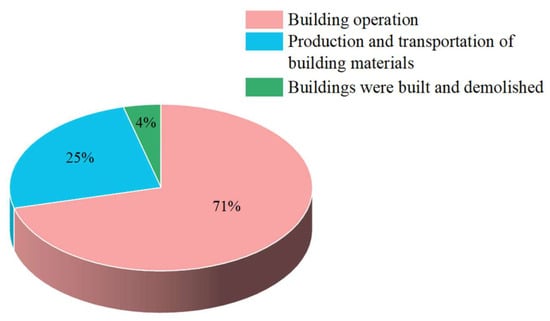
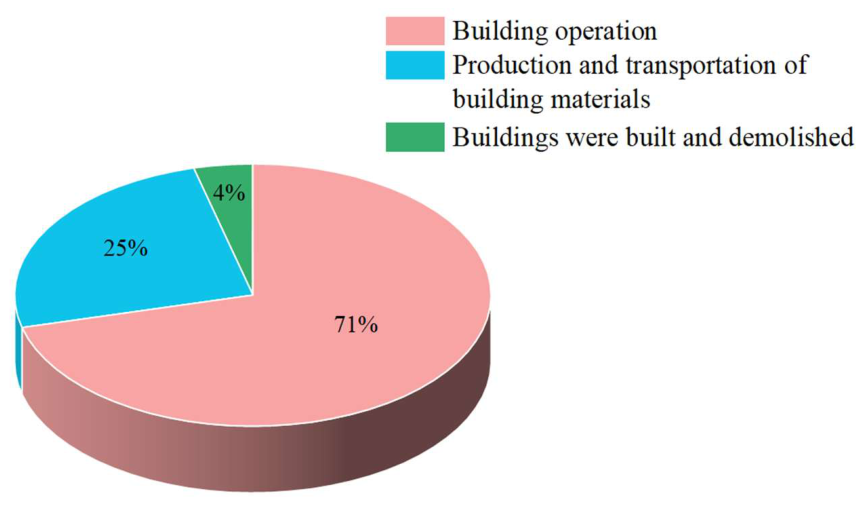
The calculated lifecycle carbon emission of the case building is 7853.887 tCO2e: the operation stage contributes 5575.590 tCO2e (71%), material production and transportation contribute 1967.620 tCO2e (25%), and construction plus demolition contribute 310.677 tCO2e (4%). These stage-level results are summarized in Figure 5.
Figure 5.
Proportion of carbon emissions at each stage.
As illustrated in Figure 5, marked variations exist in the proportional contribution of carbon emissions originating from different stages throughout the entire building lifecycle. In particular, the in-use phase generates the largest proportion of carbon emissions, reaching 71% of the entire lifecycle total, whereas the upstream manufacturing and freight haulage of building materials make up the second-largest contribution at 25%. By contrast, the construction and post-demolition recycling phases, due to their relatively low carbon outputs, together account for only 4% of the total emissions. Thus, the distribution of carbon emissions throughout the project’s lifecycle clarifies the priority of emission reduction: focusing on the operation and maintenance stage as the key area for emission reduction, then enhancing the carbon reduction effect through recycling during the building material manufacturing stage, and finally supplemented by refined control in the transportation and construction stages, to establish a full-chain low-carbon management and control system.
In the pursuit of decarbonizing the construction and built environment sector, the focus should be on improving operational efficiency during building occupancy and optimizing the manufacturing and logistics processes of building materials. Implementing stricter regulatory measures in these two key areas can lead to a significant reduction in the cumulative carbon emissions of building construction projects. Targeted strategies addressing these predominant sources of carbon emissions will substantially mitigate the environmental impact across the entire project lifecycle.
5.1. Carbon Reduction Strategies in the Material Production and Transportation Stages
Adhering to the principle of waste material recycling, the utilization value of materials is fully maximized. For this case, material selection should first target C40 concrete and steel reinforcement, which contribute 624.828 and 507.757 tCO2e, respectively; lower-carbon concrete mixtures and recycled-content steel are therefore the primary material-side options. Building materials incorporating a high proportion of industrial by-products or wastes as raw materials—such as fly ash cement—are employed. For steel, sand, brick, and other materials modeled with 500 km transport distances in Table 5, local suppliers and shorter verified transport routes should be prioritized to reduce transportation emissions. Meanwhile, transportation routes are optimized to enhance efficiency, and more efficient logistics schemes—such as carpooling and railway transportation—are adopted as low-carbon options.
5.2. Carbon Reduction Strategies in the Construction Stage
For the present RC-frame kindergarten, the construction stage contributes 103.559 tCO2e, so the practical reduction focus is on the machinery operation and on-site processing activities included in the construction inventory. The structural type of a project determines the large quantity of machinery and equipment required during construction; therefore, energy-efficient and low-energy-consuming construction machinery should be selected. By optimizing construction techniques and organizing construction with comprehensive consideration of on-site conditions, the issue of low utilization efficiency of construction machinery caused by inter-construction interference can be alleviated. For instance, centralized processing of project steel bars in factories and subsequent transportation to the construction site for installation can be adopted, which reduces carbon emissions from on-site steel bar processing, decreases the workload of steel bar welding, and thereby reduces the number of welding machine operating shifts. Meanwhile, the requirements of green and energy-efficient construction shall be complied with throughout the construction organization process. Implementing these integrated interventions curbs greenhouse gas emissions throughout the on-site construction phase.
5.3. Carbon Reduction Strategies in the Operational Stage
It is the effective management of energy consumption during a building’s operational phase that is identified as a pivotal approach to enhancing carbon emission reduction efficiency at this stage [12]. For this kindergarten, cooling (2345.584 tCO2e) and bituminous-coal heating (1374.116 tCO2e) are the two largest operational sources and together account for 66.7% of operational emissions; therefore, cooling-system efficiency and replacement of the coal-based heat source are the first priorities. The primary strategies involve the installation of high-efficiency energy-saving lighting systems (e.g., LED lamps), combined with designs maximizing natural light utilization to reduce reliance on artificial lighting during daytime. High-performance thermal insulation materials and technologies are adopted to improve the building envelope performance, thereby reducing the demand for heating in winter and cooling in summer. High-efficiency electrical appliances—including air-conditioning units, lighting systems, and water heating facilities—are deployed to curb building energy demand without compromising baseline operational functionality. Because the current case model includes no on-site renewable generation, rooftop photovoltaic generation can be evaluated as a subsequent case-specific scenario rather than treated as an existing carbon reduction. Intelligent control systems are equipped to monitor and regulate indoor temperature, humidity, and air quality, thereby safeguarding comfort while maximizing energy savings.
5.4. Carbon Reduction Strategies in the Demolition Stage
For this case, the demolition stage contributes 207.118 tCO2e (about 2.6% of the lifecycle total); the relevant measures are therefore high-efficiency demolition machinery, shorter waste-haul distances, and recovery of concrete and steel waste. Serving as the reverse operation of structural erection, deconstruction activities do not directly expend building materials; thus, carbon reduction strategies are mainly focused on the following aspects: Firstly, mechanical equipment and transportation vehicles with high energy efficiency should be configured to reduce energy consumption. Secondly, shorter transportation routes should be planned to further lower energy usage. Furthermore, substantial quantities of demolition waste are generated during the demolition process, so special attention should be paid to waste management. In line with the concept of resource recycling, valuable construction waste should be recycled, reprocessed, and reused. To elevate the resource recovery efficiency and valorization rate of solid construction waste, the use of recyclable materials should be given priority in the initial design stage of the project. Through these measures, carbon emissions during the demolition phase can be significantly reduced, and effective resource recycling can be promoted.
6. Conclusions
For the investigated kindergarten, the calculated lifecycle carbon emission is 7853.887 tCO2e. The operation stage contributes 5575.590 tCO2e (71%), followed by material production and transportation at 1967.620 tCO2e (25%), while construction and demolition together contribute 310.677 tCO2e (4%). Accordingly, carbon reduction in this case should prioritize the cooling system and coal-based heating during operation, followed by lower-carbon concrete and steel and shorter material transport distances. In the future, priority should be given to establishing a whole-process low-carbon governance framework spanning schematic planning, architectural design, engineering construction, operational maintenance, and end-of-life deconstruction. Green transformation of the industry can be realized through technological innovation and model reform, which provides strong support for China to achieve the goals of carbon peaking and carbon neutrality, and ultimately forms a sustainable low-carbon development path with industry characteristics.
Author Contributions
The authors confirm contribution to the paper as follows: study conception and design: Y.S. and X.Y.; data collection: S.W., X.C., and D.Z.; analysis and interpretation of results: B.P.J.; draft manuscript preparation: Y.Y. All authors have read and agreed to the published version of the manuscript.
Funding
This research was supported by the China Scholarship Council (CSC) (grant number: 202308140128) and the Fundamental Research Program of Shanxi Province (project number: 202203021212486).
Data Availability Statement
The data is derived from the drawings of case projects selected.
Conflicts of Interest
The authors declare that they have no conflicts of interest.
References
- Peng, C.; Jiang, Y.; Qin, Y. Low Carbon Buildings and Low Carbon Cities; China Environment Publishing Group: Beijing, China, 2018. [Google Scholar]
- China Association of Building Energy Efficiency; Institute of Urban and Rural Construction and Development, Chongqing University. Research Report on Energy Consumption and Carbon Emissions of Buildings in China (2023); China Association of Building Energy Efficiency: Beijing, China; Institute of Urban and Rural Construction and Development, Chongqing University: Chongqing, China, 2023. [Google Scholar]
- Crawford, R.H. Greenhouse Gas Emissions of Global Construction Industries. In Proceedings of the IOP Conference Series: Materials Science and Engineering, Volume 1218, Creative Construction Conference (CCC 2021), Budapest, Hungary, 28–30 June 2021. [Google Scholar] [CrossRef] [Scilit]
- Zhang, Z.; Wang, B. Research on the life-cycle CO2 emission of China’s construction sector. Energy Build. 2016, 112, 244–255. [Google Scholar] [CrossRef] [Scilit]
- Leontief, W.W. Quantitative input and output relations in the economic systems of the United States. Rev. Econ. Stat. 1936, 18, 105–125. [Google Scholar] [CrossRef] [Scilit]
- Minx, J.C.; Wiedmann, T.; Wood, R.; Peters, G.P.; Lenzen, M.; Owen, A.; Scott, K.; Barrett, J.; Hubacek, K.; Baiocchi, G.; et al. Input–output analysis and carbon footprinting: An overview of applications. Econ. Syst. Res. 2009, 21, 187–216. [Google Scholar] [CrossRef] [Scilit]
- Zhang, L.; Liu, B.; Du, J.; Liu, C.; Wang, S. CO2 emission linkage analysis in global construction sectors: Alarming trends from 1995 to 2009 and possible repercussions. J. Clean. Prod. 2019, 221, 863–877. [Google Scholar] [CrossRef] [Scilit]
- Chen, J.; Shen, L.; Song, X.; Shi, Q.; Li, S. An empirical study on the CO2 emissions in the Chinese construction industry. J. Clean. Prod. 2017, 168, 645–654. [Google Scholar] [CrossRef] [Scilit]
- Ju, Y.; Chen, Y. Calculation of Carbon Emissions in the Building Operation Stage—A Study of the Emission Coefficient Method Based on Carbon Emission Factors. Sichuan Build. Sci. 2015, 41, 175–179. [Google Scholar] [CrossRef]
- Luo, X.; Zhang, Y.; Song, Z. Analysis of Carbon Emission Characteristics and Establishment of Prediction Models for Residential and Office Buildings in China. Build. Environ. 2025, 267, 112208. [Google Scholar] [CrossRef] [Scilit]
- Liu, P.; Wang, Y.; Zhu, F.L.; Jiang, L.; Lei, Y.; Zhu, Z.; Sun, M.; Wang, X. Analysis on Carbon Emission of Prefabricated Residential Building Based on BIM. J. Build. Energy Effic. 2024, 52, 19–23. [Google Scholar] [CrossRef]
- Lee, Y.J.; Jun, H.J. Development of a BIM-based Carbon Dioxide Emission Estimation System-Focus on an Apartment in Korea. Archit. Res. 2016, 18, 145–149. [Google Scholar] [CrossRef] [Scilit]
- Wang, X.; Wu, H.; Rong, X.; Yu, L. Calculation and Analysis on building Decoration Project Carbon Discharge in Shenzhen. Archit. Technol. 2022, 53, 610–613. [Google Scholar] [CrossRef]
- Olatunji, O.A.; Sher, W.; Gu, N. Building information modeling and quantity surveying practice. Emir. J. Eng. Res. 2010, 15, 67–70. [Google Scholar]
- Eleftheriadis, S.; Duffour, P.; Mumovic, D. BIM-embedded life cycle carbon assessment of RC buildings using optimised structural design alternatives. Energy Build. 2018, 173, 587–600. [Google Scholar] [CrossRef] [Scilit]
- Yu, Z. Research on the Application of BIM Technology in Construction Project Management. Brick-Tile 2024, 125–127. [Google Scholar] [CrossRef]
- Yang, Y. Calculation Method of Building Carbon Emission under the Concept of Whole Life Cycle. North. Build. 2022, 7, 21–25. [Google Scholar] [CrossRef]
- Li, C.; Gao, X. Analysis on Carbon Emission Measurement in Building Life Cycle Based on BIM Technology. Urban. Archit. 2023, 20, 205–208. [Google Scholar] [CrossRef]
- Tohfa, T.S.; Farouk, A.M.; Rahman, R.A. Conceptualizing Hard and Soft Benefits of Adopting BIM in Construction Projects: A Systematic Review. In Advances in Engineering Management, Innovation, and Sustainability; Rotimi, J.O.B., Shahzad, W.M., Sutrisna, M., Kahandawa, R., Eds.; Springer: Cham, Switzerland, 2024; Volume 480, pp. 559–577. [Google Scholar] [CrossRef] [Scilit]
- Farouk, A.M.; Rahman, R.A. Integrated Applications of Building Information Modeling in Project Cost Management: A Systematic Review. J. Eng. Des. Technol. 2025, 23, 287–305. [Google Scholar] [CrossRef] [Scilit]
- GB/T 51366-2019; Standard for Building Carbon Emission Calculation. China Architecture & Building Press: Beijing, China, 2019.
- Shen, H. Research on Carbon Emission Calculation and Carbon Reduction Strategies for the Whole Life Cycle of Buildings. Sichuan Cem. 2024, 82–84+87. [Google Scholar] [CrossRef]
- Wang, Z.; Liu, Y.; Shen, S. Review on Building Life Cycle Assessment from the Perspective of Structural Design. J. Asian Archit. Build. Eng. 2021, 20, 689–705. [Google Scholar] [CrossRef] [Scilit]
- GB 50176-2016; Code for Thermal Design of Civil Building. China Architecture & Building Press: Beijing, China, 2016.

Disclaimer/Publisher’s Note: The statements, opinions and data contained in all publications are solely those of the individual author(s) and contributor(s) and not of MDPI and/or the editor(s). MDPI and/or the editor(s) disclaim responsibility for any injury to people or property resulting from any ideas, methods, instructions or products referred to in the content. |
© 2026 by the authors. Licensee MDPI, Basel, Switzerland. This article is an open access article distributed under the terms and conditions of the Creative Commons Attribution (CC BY) license.