


Abstract
As progressive collapse incidents in deep excavation projects under complex conditions have become increasingly frequent, enhancing the resilience of deep excavations has become an important direction for future engineering practice. This study explores and proposes a dynamic quantitative method for assessing the construction safety resilience of deep excavations supported by pile-anchor systems. Based on the stress and deformation characteristics of pile-anchor-supported deep excavations during construction, the robustness and recoverability of the excavation system are analyzed, and the evolution of its construction-stage safety performance curve under construction-induced disturbance is characterized. The ratio of post-disturbance residual safety performance to undisturbed safety performance is adopted as the system resilience metric, and a quantitative formulation for construction safety resilience is established. Four monitoring indicators are selected for pile-anchor-supported deep excavations, and their weights are determined using the CRITIC method. Sensitivity analysis is further conducted for the indicator weights. A model for calculating residual safety performance during construction is developed, followed by a two-level resilience assessment method for individual monitoring sections and the entire excavation. Practical cases involving single-row and multi-row anchor systems are comparatively analyzed. These case studies are used to explore the dynamic assessment method for construction safety resilience. The proposed method may have potential for future engineering application and may provide a reference for the green construction of similar projects.
1. Introduction
Progressive failures of deep excavations under complex site conditions can develop through cascading mechanisms that are not fully represented by conventional stability assessments based mainly on strength or limit-state criteria [1]. Consequently, resilience has increasingly been introduced into deep-excavation safety assessment to describe a system’s capacity to withstand disturbance, maintain an acceptable performance level, and recover during construction.
Existing research on deep-excavation safety has focused mainly on risk identification and evaluation. Yuan et al. [2] divided excavations into analytical units and assessed risk using information entropy and membership functions. Fan et al. [3] developed a building-information-modeling-based method for visualizing excavation behavior, whereas Yuan et al. [4] examined seepage and deformation throughout the excavation of a water-rich fractured-rock site. An et al. [5] combined a cloud model with Dempster–Shafer evidence theory for multi-source risk assessment, and Hao et al. [6] used a Grey-DEMATEL framework to identify and rank disaster-causing factors. These approaches improve risk characterization, but they do not directly quantify the capacity of the support system to resist and recover from construction-induced disturbance.
Resilience-oriented studies have begun to address this limitation. Guo et al. [7] evaluated construction safety resilience using a performance curve and an extension-cloud model. Wang et al. [8] assessed metro-station excavation resilience from temporal and functional perspectives, while Zhang [9] developed a Bayesian-network-based measurement model and explored resilience-improvement strategies. Ma et al. [10] proposed a resilience indicator system for water-rich soft-soil excavations, Chen [11] evaluated resilience under rainstorm-induced waterlogging, and Shen et al. [12] integrated the decision-making trial and evaluation laboratory–analytic network process (DEMATEL–ANP) with a cloud model to assess prevention, resistance, recovery, and learning capacities. Nevertheless, current methods remain largely conceptual or outcome-oriented and seldom track the dynamic evolution of safety performance during staged construction.
Existing studies on risk and resilience assessment of deep excavations have mainly focused on optimizing assessment models for engineering outcomes and on conceptual resilience evaluation. Dynamic quantitative assessment during construction remains limited, especially for the evolution of safety resilience in pile-anchor-supported deep excavations. To address this gap, this study explores and proposes a dynamic quantitative method for assessing the construction safety resilience of pile-anchor-supported deep excavations. Based on the stress and deformation characteristics of pile-anchor-supported deep excavations during construction, the method characterizes resilience in terms of robustness and recoverability and describes the evolution of the construction-stage safety performance curve. The ratio of post-disturbance residual safety performance to undisturbed safety performance is adopted as the system resilience metric. A quantitative formulation for construction safety resilience is established, and sensitivity analysis is conducted for the monitoring-indicator weights. A scenario-based uncertainty analysis is also conducted by applying prescribed perturbations to the input data. A model for calculating residual safety performance during construction is then developed, followed by a two-level resilience assessment framework for individual monitoring sections and the entire excavation. The dynamic assessment method for construction safety resilience is further explored to provide a quantitative reference for the sustainable construction of similar projects. The proposed framework is intended as an exploratory, monitoring-based assessment method rather than a general predictor of excavation failure or collapse. The methodological differences between the proposed framework and the approaches reported in [7,12] are summarized in Table 1.
Table 1.
Comparison between existing resilience assessment methods and the proposed method.
2. Construction-Stage Safety Performance and Resilience
The concept of resilience was introduced by Holling [13] to describe the ability of ecological systems to absorb disturbance while maintaining their essential functions. It has since been extended to materials, cities, infrastructure, and engineering systems. Energy-based descriptions of fracture, including Griffith’s theory [14], provide a basis for interpreting the loss of material performance, while resilient-city research emphasizes adaptation and recovery under external hazards [15]. In engineering, resilience generally refers to the ability of a system to withstand disturbance, limit performance loss, and restore functionality.
Engineering resilience is commonly discussed across the design, construction, and operation-and-maintenance stages and is associated with vulnerability, robustness, and recoverability. For deep excavations, vulnerability is largely determined at the design stage by site conditions, excavation geometry, and the selected support scheme. During construction, robustness describes the ability of the excavation system to resist additional stress and deformation induced by unloading while maintaining acceptable safety performance. Recoverability describes the ability of the system to regain performance after abnormal deformation or stress development through timely control measures. Accordingly, the construction stage considered in this study is characterized primarily by robustness and recoverability.
Performance curves are widely used to quantify engineering resilience. Representative formulations are summarized in Table 2. In general, a resilience index is defined either from the normalized performance loss caused by a disturbance or from the normalized residual performance retained during and after the disturbance.
Table 2.
Representative performance-curve-based resilience metrics.
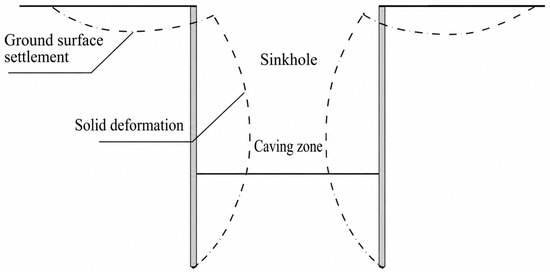
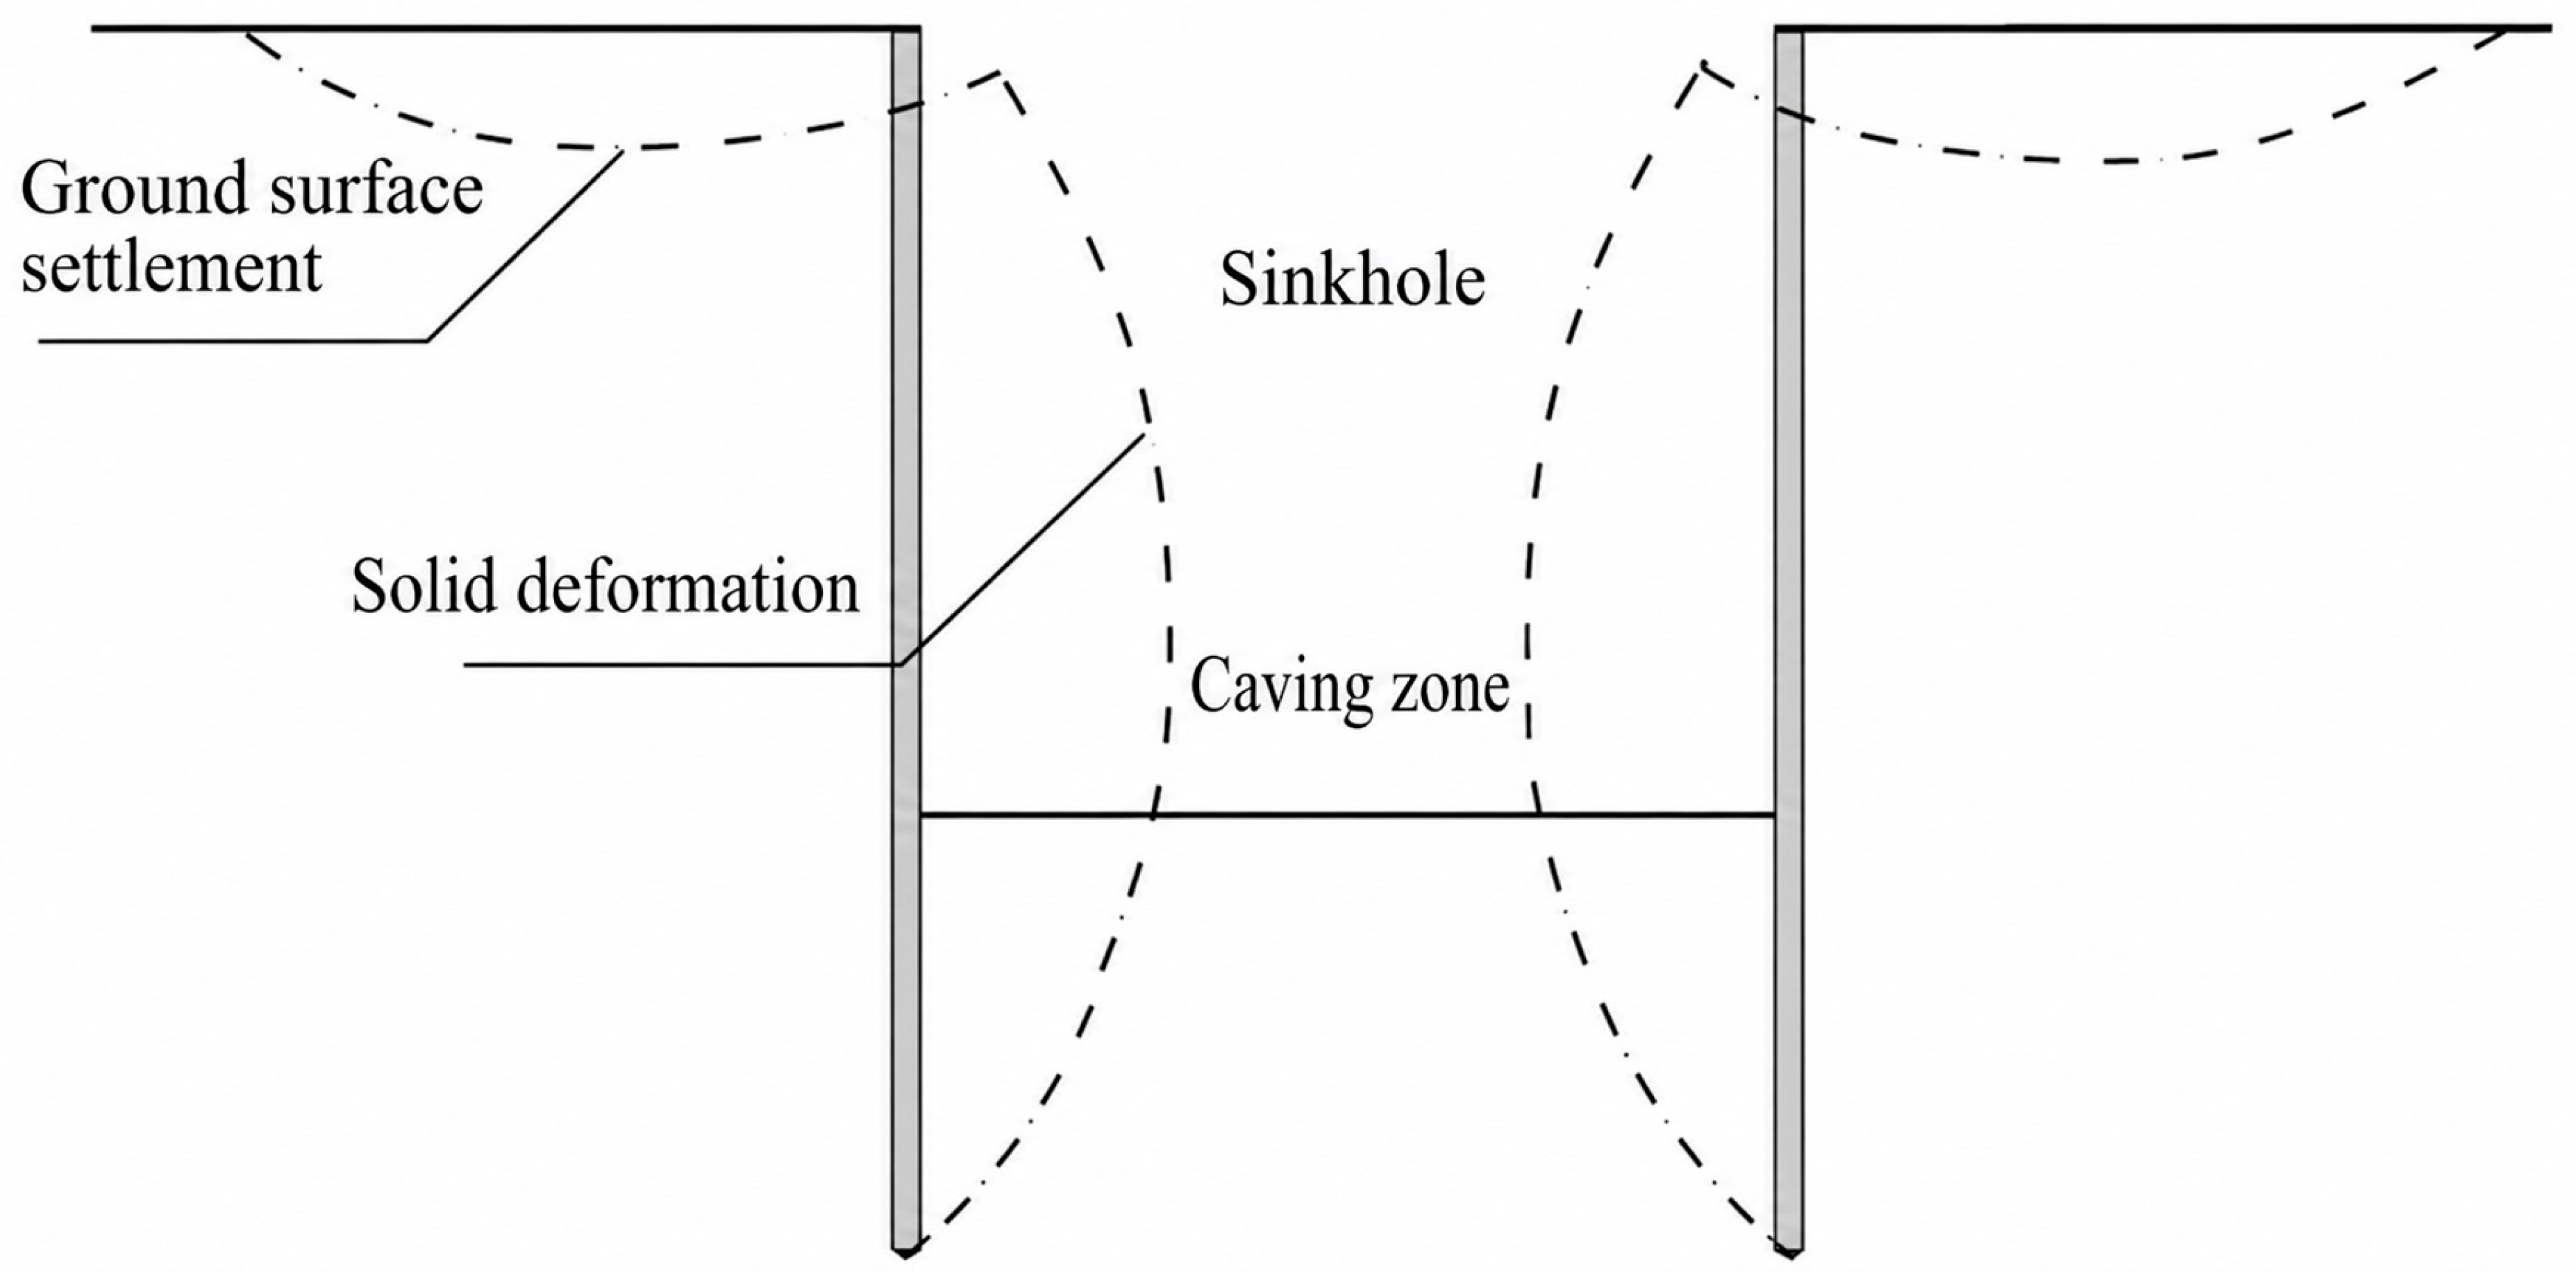
In this study, the construction safety resilience of a pile-anchor-supported deep excavation is defined as the ability of the pile-anchor retaining system to withstand excavation-induced disturbance or accidental hazards, maintain overall stability, and prevent progressive failure. Even under normal construction conditions, excavation unloading causes deformation of the retaining structure. Figure 1 schematically illustrates the resulting deformation pattern.
Figure 1.
Schematic deformation characteristics of a pile-anchor-supported deep excavation during construction.
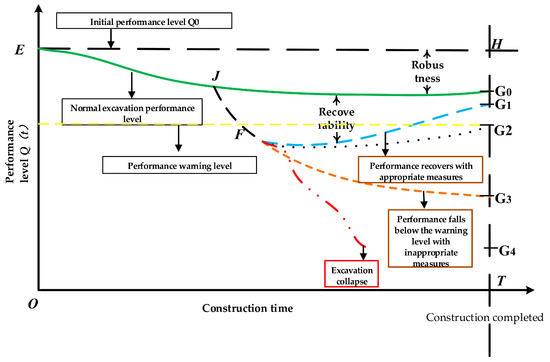
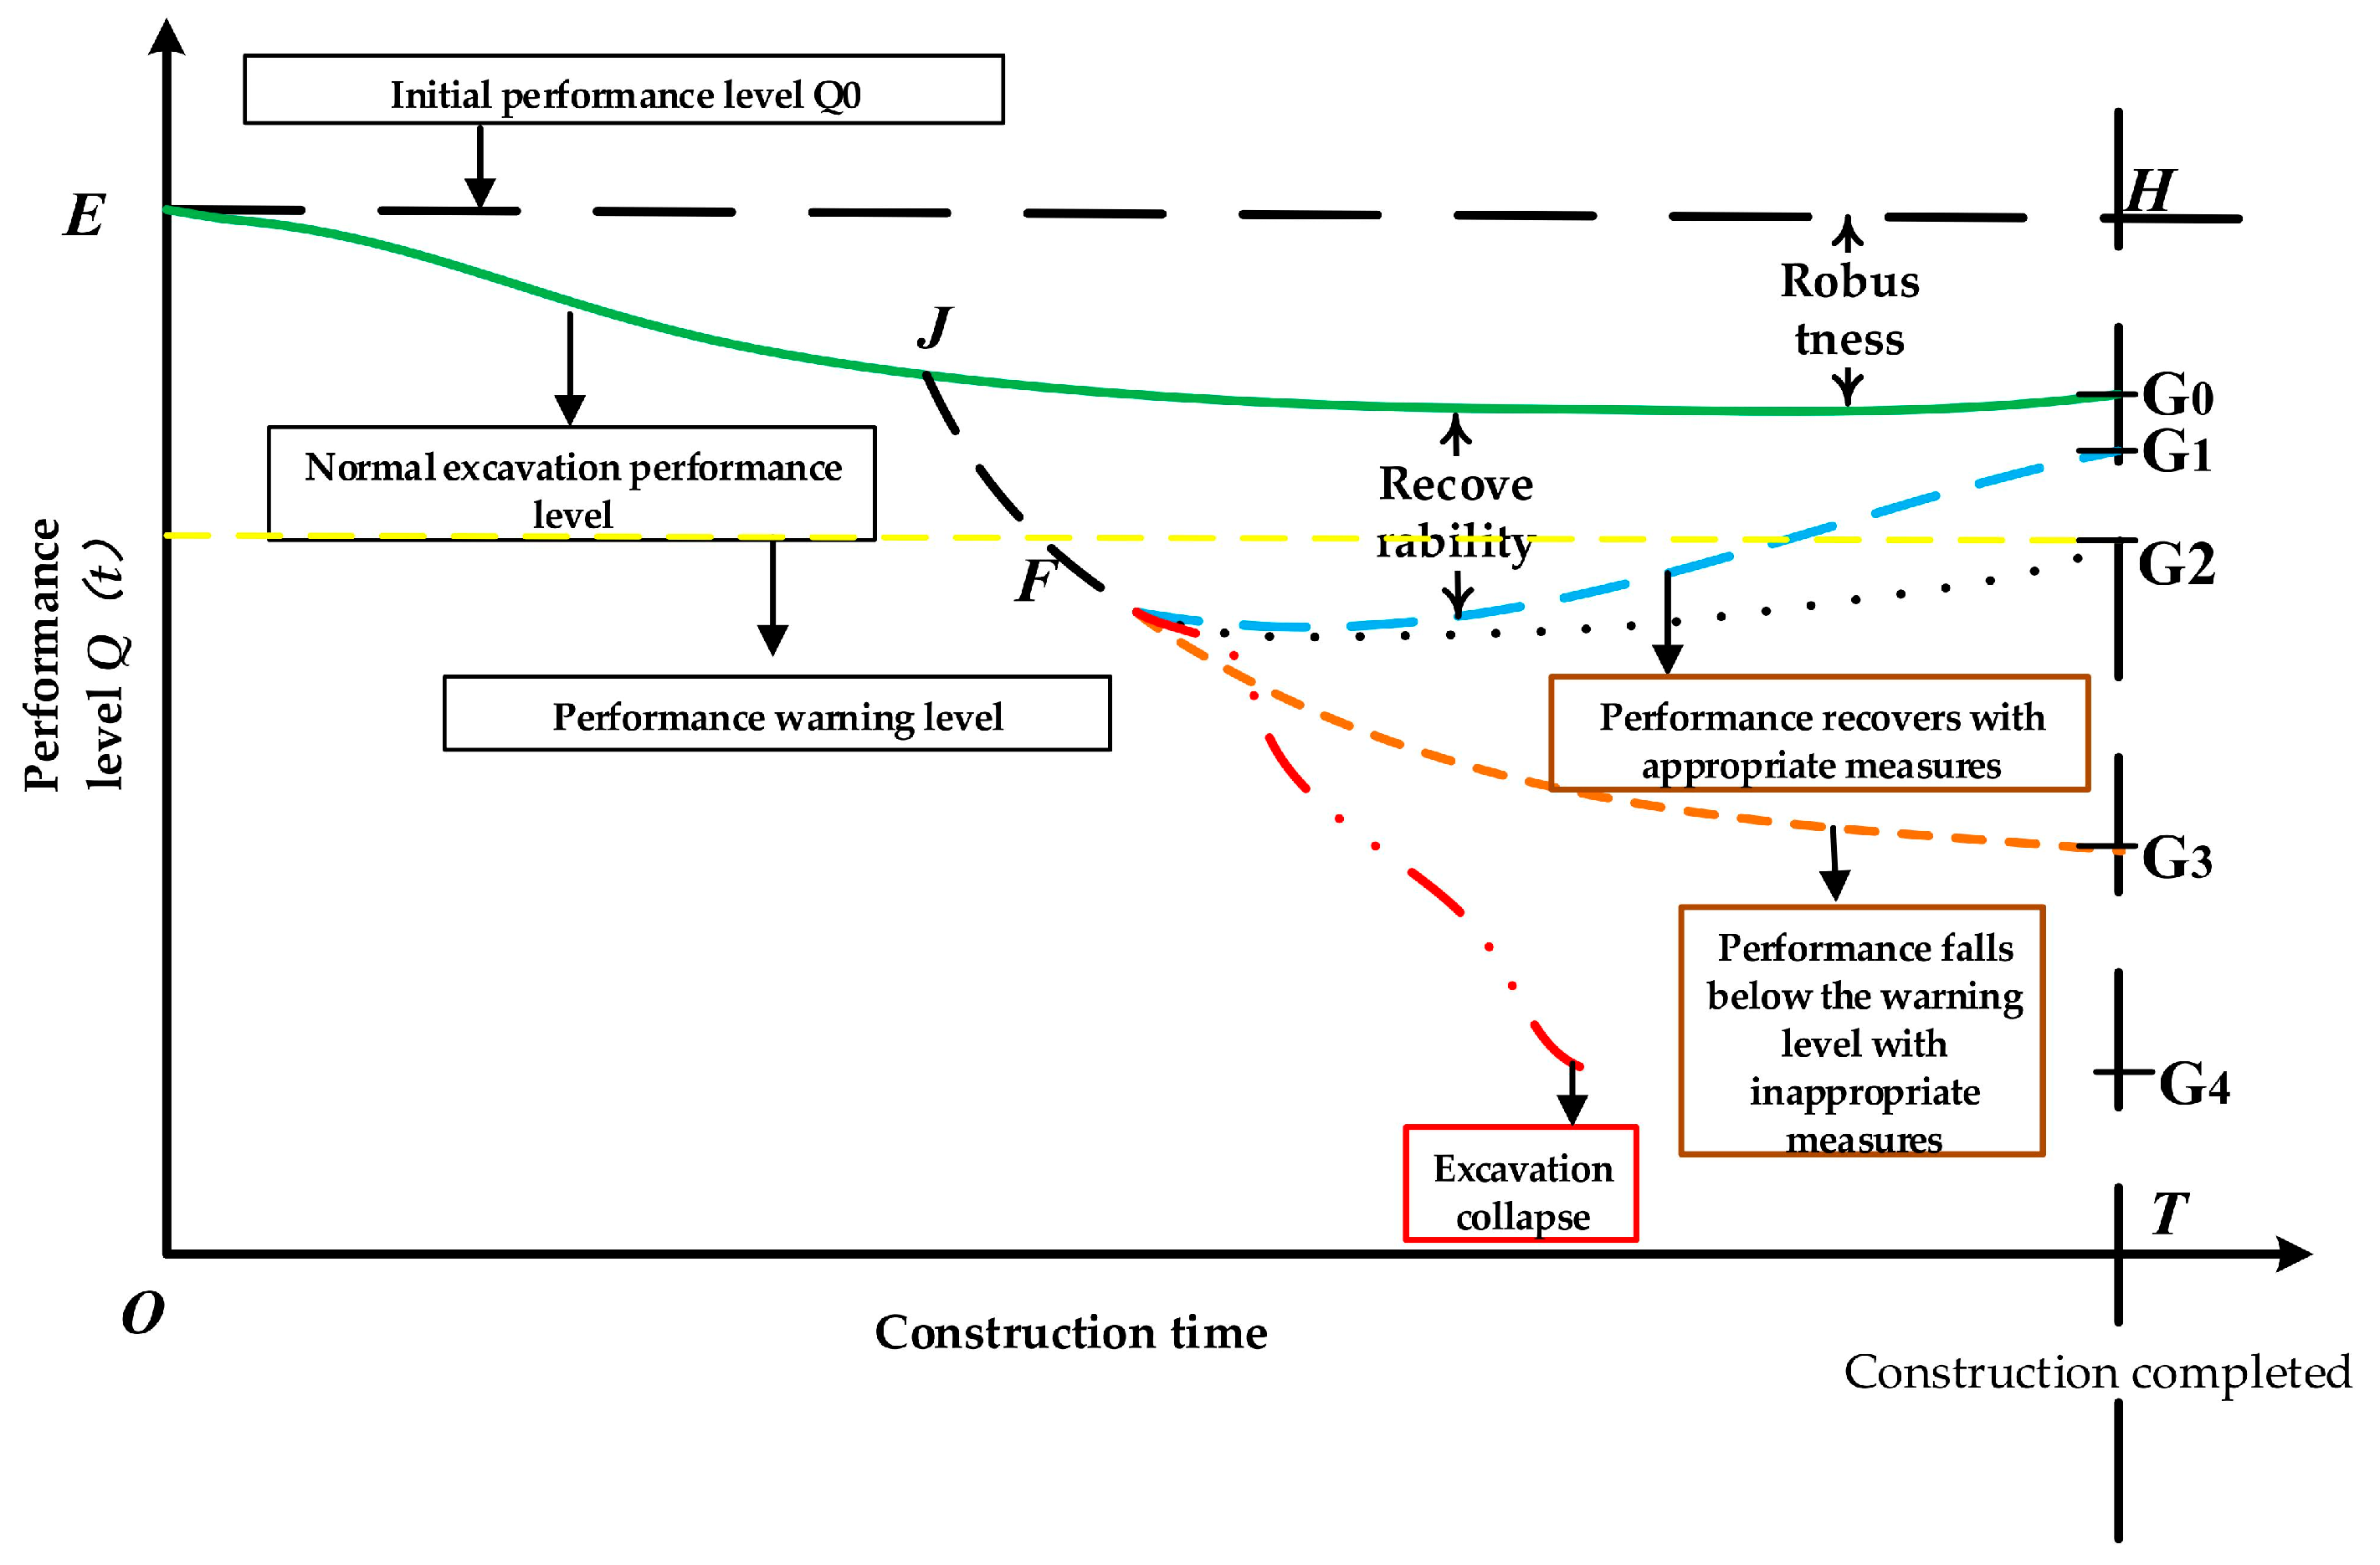
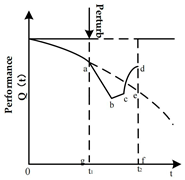
Because deformation and force responses vary around the excavation perimeter, resilience must be evaluated from the stress-deformation state of individual monitoring sections. Figure 2 illustrates the evolution of the construction-stage safety performance level over time.
Figure 2.
Construction-stage safety performance curves for a pile-anchor-supported deep excavation.
In Figure 2, O and T denote the start and end of construction, respectively. Point E represents the initial safety performance Q0 before excavation. Under an ideal undisturbed process, performance remains at Q0 and reaches H at the end of construction. Normal excavation causes a limited performance reduction to the safe level G0. If an excessive disturbance occurs at J, performance may fall to the warning level G2 at F. Effective control measures can restore performance to the safe level G1 or maintain it at G2; ineffective measures may lead to the unsafe level G3. Continued deterioration toward G4 indicates loss of recoverability and eventual collapse.
Based on Figure 2 and the formulations in Table 2, this study adopts the ratio of residual safety performance after disturbance to the undisturbed safety performance as the construction safety resilience index. The resilience of a pile-anchor-supported deep excavation is calculated using Equation (1):
where Re is the construction safety resilience of the pile-anchor-supported deep excavation; represents the residual safety performance of the deep excavation after construction disturbance, and ; is the safety performance of the deep excavation under the undisturbed condition, and and denote the different construction-stage safety performance levels.
3. Residual Safety Performance During Construction
3.1. Evaluation Indicators and Indicator-Level Residual Performance
To characterize the stress and deformation state of the deep excavation at different times, deformation monitoring was conducted. Multiple monitoring sections were arranged according to the support configuration. Based on the stress and deformation characteristics of each monitoring section in the pile-anchor-supported deep excavation and the requirements of [20,21], four monitoring indicators were selected to evaluate the residual safety performance: deep horizontal displacement of the retaining structure (A), horizontal displacement at the pile top (B), vertical displacement at the pile top (C), and anchor axial force (D). In general, the deep horizontal displacement of the retaining structure reflects the lateral deflection of the support system under soil pressure, water pressure, and construction loads. The horizontal displacement at the pile top reflects the restraint performance at the top of the retaining structure. The vertical displacement at the pile top reflects the effects of excavation-induced rebound, confined groundwater pressure, the vertical load-bearing state of the piles, and ground settlement outside the excavation on the retaining structure. It is an important indicator for evaluating the vertical stability of the excavation and the safety of the surrounding environment. The anchor axial force reflects the overall restraint provided by the anchors to the retaining structure and provides an important basis for evaluating whether the anchorage system is safe and effective and for verifying the rationality of the support design. The component residual safety performance of these four indicators at time t was calculated as follows:
where t denotes each monitoring time from the start to the end of monitoring; represents the four monitoring indicators; , , , and are the residual safety performances of indicators A, B, C, and D at time t, respectively; is the control value of the field monitoring data for each indicator, or the design value for anchor axial force; and is the measured value of indicator j at time t. It should be noted that, at some construction sites, the measured value of an individual monitoring indicator may occasionally exceed its corresponding control value. According to Equation (2), the component residual safety performance calculated for that indicator may then become negative, i.e., . Because , the component residual safety performances of all four indicators will not become negative simultaneously. However, the overall residual safety performance still satisfies ; otherwise, the safety performance would fall to level G4 in Figure 2, indicating excavation collapse. In practice, when an individual monitoring indicator exceeds its control value, corresponding prevention and control measures are implemented according to the emergency plan. The monitoring data obtained during the control process are continuously substituted into Equation (2) to update the dynamic residual safety performance. If the measures are effective and the performance recovers to level G1 in Figure 2, the residual safety performance is restored. If the measures are ineffective and the performance deteriorates to level G3, the excavation faces a risk of collapse.
3.2. Construction-Stage Residual Safety Performance
Field monitoring records the integrated response of each support section over time. The four indicators must therefore be objectively weighted before the construction-stage residual safety performance is calculated. Criteria importance through the intercriteria correlation (CRITIC) method is adopted because it accounts for both the variability of each indicator and the conflict among indicators. The calculation procedure for one monitoring section was as follows.
First, Equation (2) was used to calculate the residual safety performance of each indicator at different monitoring times from the start to the end of monitoring. The calculated values also formed the dimensionless matrix of the four indicators.
Second, the mean and standard deviation of each column in the dimensionless matrix were calculated, and the dimensionless matrix was transformed into a standardized matrix .
Third, based on the standardized matrix , the Pearson correlation coefficients among the four indicators, including , , , , , and , were calculated. The conflict intensity of each indicator was then determined from these correlation coefficients.
For example, the Pearson correlation coefficient between indicators A and B was calculated as:
The total conflict between each indicator and the other indicators was calculated as:
where , , , and .
Fourth, the information content of each indicator was calculated as:
Fifth, the weight of each indicator was calculated as:
Sixth, the construction-stage residual safety performance of the monitoring section at time t was obtained as:
It should be noted that these weights are project- and dataset-specific. They reflect the relative information contribution of each monitoring indicator for a specific project and monitoring dataset, rather than a universally applicable ranking of the engineering importance of the indicators.
4. Construction Safety Resilience Calculation
Deep-excavation retaining systems generally consist of retaining piles with limited structural continuity and spatially distributed anchors. Their overall integrity is therefore weaker than that of a continuous retaining structure. Cheng et al. [22] showed that excavation collapse can develop progressively, with local support failure triggering a chain reaction and large-scale collapse. Construction safety resilience is consequently evaluated at two levels: the resilience of each monitoring section and the resilience of the excavation system as a whole.
4.1. Resilience of a Monitoring Section
The construction safety resilience of a monitoring section of the retaining structure was calculated using Equation (8):
where is the construction safety resilience of the monitoring section of the retaining structure; Q0 is the initial safety performance of the pile-anchor supported deep excavation; and t1 to t2 denotes the calculation time interval.
The integral in Equation (8) represents the area enclosed by the safety performance curve and the time axis in Figure 2. Because field monitoring data were collected at discrete time points, Equation (8) was rewritten as Equation (9):
where T is the number of monitoring intervals, and Δt is the interval between monitoring times t and t + 1.
It should be noted that Equation (6) gives one weight for indicator D when a single anchor row is considered. Most deep excavations use multiple anchor rows, and the design axial force may differ among rows. Therefore, the residual safety performance calculated using Equation (2) may also differ by anchor row. The CRITIC method was thus applied separately to the anchors in each monitoring section from top to bottom. The corresponding weights of different anchor rows were obtained as , , , and , where k denotes the k-th row of anchors. These weights were then substituted into Equation (7) to calculate the residual safety performance of the monitoring section under each anchor row. The resilience of each anchor row was further calculated using Equation (9). The minimum resilience value was taken as the construction safety resilience of the monitoring section, as expressed in Equation (10).
The minimum-value rule is used here to determine the controlling resilience among different anchor rows and monitoring sections. This rule is adopted as a conservative engineering aggregation strategy rather than as a formally validated probabilistic system reliability model.
4.2. Overall Excavation Resilience and Classification
In general, a pile-anchor-supported deep excavation contains multiple monitoring sections. According to relevant studies and code requirements [20,23,24], failure at the weakest section can trigger failure of the entire excavation. Therefore, the overall construction safety resilience is determined by the monitoring section with the lowest construction safety resilience. For a pile-anchor-supported deep excavation with n monitoring sections, if the construction safety resilience of the s-th monitoring section is , the overall construction safety resilience is expressed as:
where Re is the overall construction safety resilience of the deep excavation, and is the construction safety resilience of the s-th monitoring section.
Based on [7,12,21,22], no established method is currently available for classifying structural resilience levels. The classification boundaries should be determined using extensive field monitoring data and experimental results. In this study, four preliminary levels of overall construction safety resilience for pile-anchor-supported deep excavations were defined using equal intervals, as shown in Table 3. These resilience ranges are preliminary, and their boundaries should be refined as more field data become available.
Table 3.
Preliminary classification of construction safety resilience.
4.3. Indicator-Weight Sensitivity Analysis
An indicator-weight sensitivity analysis was conducted to examine whether the CRITIC-derived objective weights substantially affected the construction safety resilience assessment. The one-at-a-time (OAT) method was adopted as a local sensitivity analysis method. In OAT analysis, one input parameter was varied at a time, and the corresponding response of the model output was evaluated. Hamby [25] identified OAT as one of the simplest methods for parameter sensitivity analysis. For multi-criteria decision-making models, Triantaphyllou and Sánchez [26] further showed that perturbations in indicator weights and indicator performance values could be used to evaluate the sensitivity of decision results to changes in model inputs.
The CRITIC-derived weights were used as the baseline values. The weights of deep horizontal displacement of the retaining structure (A), horizontal displacement at the pile top (B), vertical displacement at the pile top (C), and anchor axial force (D) were individually perturbed by −20%, −10%, +10%, and +20%. Let denote the baseline weight of the m-th indicator and the perturbation ratio. The perturbed weight was calculated using Equation (12):
Because the indicator weights in a multi-criteria assessment must satisfy the normalization condition, the remaining weights were adjusted simultaneously when the weight of the m-th indicator was changed. To preserve the original relative proportions of the remaining indicators while maintaining a total weight of 1, the proportional redistribution method used by Kittipongvises et al. [27] was adopted. In their OAT analysis, the weight of one indicator was perturbed by a specified percentage, and the remaining weights were adjusted in proportion to their original values so that the total weight remained equal to 1. After the proportional redistribution relationship was expressed using the notation adopted in this study, the adjusted weight of any indicator j that was not directly perturbed was calculated using Equation (13):
This procedure ensured that the perturbed weights continued to satisfy the normalization condition:
where and are the baseline and adjusted weights, respectively, of the indicators other than the perturbed indicator, and is the weight perturbation ratio. Kittipongvises et al. [27] used a weight perturbation range of ±20% with a 5% increment in their OAT analysis. Considering the four-indicator structure of the present model and the need for concise presentation of the results, perturbation levels of ±10% and ±20% were selected within the same ±20% range to examine the stability of the assessment results under moderate and relatively large changes in indicator weights.
For each weight-perturbation condition, the residual safety performance at all monitoring times was recalculated using the original assessment procedure. For deep excavations supported by multiple anchor rows, the resilience of each anchor row, each monitoring section, and the overall excavation was recalculated sequentially. The minimum-value aggregation rule was retained to determine whether changes in indicator weights altered the identified critical anchor row or critical monitoring section.
After the resilience values had been recalculated for all perturbation conditions, the sensitivity index of the m-th indicator, , was defined using the maximum relative change in construction safety resilience:
where is the construction safety resilience calculated using the baseline weights, is the construction safety resilience recalculated after perturbing the weight of the m-th indicator at different perturbation levels, and is the maximum relative sensitivity index of the m-th indicator. A larger indicates that the final resilience assessment is more sensitive to changes in the weight of that indicator.
5. Case Studies
5.1. Case 1
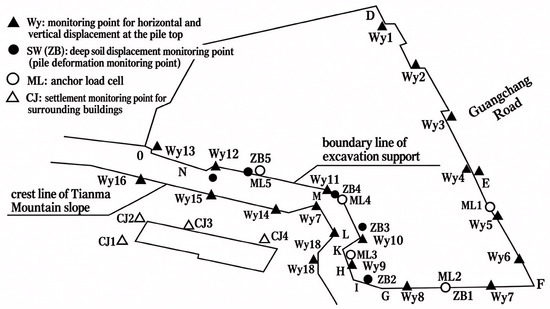
The project documented by Dai [28] used a pile-anchor retaining system and was monitored for 100 d. The monitoring layout is shown in Figure 3.
Figure 3.
Monitoring layout of the pile-anchor-supported deep excavation in Case 1.
The excavation was adjacent to Guangchang Road on the east. The eastern DF section was 170 m long. On the south, the excavation was close to Tianma Mountain, whose crest was approximately 17 m above the crown beam; the FG section was approximately 48 m long. The northern side was approximately 87 m long, and the western GO polyline section had a total length of approximately 194 m. The general excavation depth was approximately 11 m, increasing to approximately 15.5 m in the LM section. The monitoring data reported by Dai [28] showed that the maximum horizontal displacement was below the 30 mm warning threshold in the DEFG and GLM sections. In the MO section, however, horizontal displacement exceeded 30 mm, vertical displacement exceeded the 10 mm warning threshold, and anchor axial force exceeded the 386 kN design threshold. The MO section was therefore identified as the weakest monitoring section and controlled the overall construction resilience.
Using Equation (2), the residual safety performance of each monitoring indicator in the MO section at time t was calculated, as listed in Table 4.
Table 4.
Residual safety performance of each monitoring indicator in the MO section.
According to the CRITIC method described in Section 3.2, the weights of the indicators were calculated. The residual safety performance calculation formula for the MO section at time t was then obtained as Equation (15):
Using the monitoring data recorded at 10 d intervals by Dai [28], Equation (15) was used to calculate the residual safety performance of the MO section at each monitoring time. The results are presented in Table 5.
Table 5.
Construction-stage residual safety performance of the MO section.
Equation (9) gives a sectional resilience of 0.53 for the MO section. Because this was the weakest section, the overall construction safety resilience of the excavation was also 0.53. According to Table 3, the excavation had moderate resilience, although the value was close to the low-resilience boundary. The MO section therefore required closer attention and a higher monitoring frequency. This interpretation is consistent with the project evaluation reported by Dai [28].
5.2. Case 2
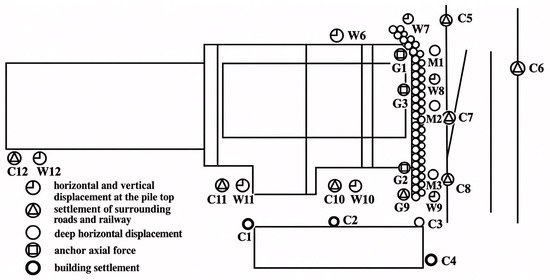
The project documented by Ye [29] was a pile-anchor-supported deep excavation with an irregular plan, a perimeter of 140.9 m, and an excavation depth of up to 14.90 m. A coal receiving pit was located to the north and an existing railway to the east. The monitoring period was 120 d, and the monitoring layout is shown in Figure 4.
Figure 4.
Monitoring layout of the deep excavation in Case 2.
Because the right side of the excavation was adjacent to the railway, four rows of anchors were arranged in the design. Three monitoring sections were installed on the right side of the excavation: Monitoring Section 1 consisted of monitoring points M1, W7, and G1; Monitoring Section 2 consisted of monitoring points M2, W8, and G3; and Monitoring Section 3 consisted of monitoring points M3, W9, and G2.
For brevity, this study presents only the calculation procedure for Monitoring Section 1. The procedures for Monitoring Sections 2 and 3 were identical to those for Section 1. Using Equation (2), the residual safety performance of each indicator in Monitoring Section 1 at time t was calculated, as listed in Table 6.
Table 6.
Residual safety performance of indicators A–C and anchor-force indicator D in Monitoring Section 1; D1–D4 denote anchor rows 1–4.
The deep excavation was designed with four rows of anchors. Because the design axial force and measured force differed among the anchor rows, the weights of the indicators for each anchor row in Section 1 were calculated separately. According to the CRITIC method described in Section 3.2, the indicator weights were obtained, and the construction-stage residual safety performance of Section 1 was calculated for the four anchor rows.
The residual safety performance of Section 1, calculated based on the first anchor row, is expressed as:
The residual safety performance of Section 1, calculated based on the second anchor row, is expressed as:
The residual safety performance of Section 1, calculated based on the third anchor row, is expressed as:
The residual safety performance of Section 1, calculated based on the fourth anchor row, is expressed as:
The residual safety performance values of the individual indicators at different monitoring times in Table 6 were then substituted into Equations (16)–(19). The construction-stage residual safety performance of Section 1 corresponding to each anchor row at time t was obtained, as listed in Table 7.
Table 7.
Construction-stage residual safety performance of Monitoring Section 1 for each anchor row.
The construction safety resilience of Section 1 was calculated using Equation (9). The construction safety resilience values of Sections 2 and 3 were also calculated using the same procedure. The construction safety resilience values of all monitoring sections are listed in Table 8.
Table 8.
Construction safety resilience of Monitoring Sections 1–3.
The minimum value among the three monitoring sections controlled the excavation resilience: . According to Table 3 and Table 8, this value corresponds to moderate resilience and is close to the high-resilience boundary.
Table 8 shows that: (1) most of the resilience values calculated for the three monitoring sections using different anchor rows were greater than 0.75, indicating a high-resilience state; and (2) the first anchor row generally produced the lowest resilience value in each section. This indicates that the design and monitoring of the first anchor row should receive particular attention in pile-anchor-supported excavations.
This result is consistent with the project evaluation reported by Ye [29] and provides a more detailed identification of the critical anchor row and monitoring section.
5.3. Case 3
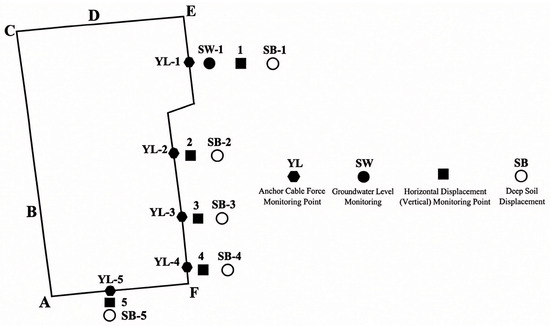
The deep excavation reported in [1] was located at the intersection of two roads, and its monitoring layout is shown in Figure 5. The excavation consisted of support sections AB, BC, CD, and EFA. Section AB was 94.0 m long and 4.0–6.5 m high. It was a soil excavation slope with sufficient space for natural sloping and was classified as safety Grade II. Section BC was 70.0 m long and approximately 8.5 m high. Because a municipal road was located at the slope crest and no space was available for sloping, cantilever piles were used, and the section was classified as safety Grade I. Section CD was 16.0 m long and approximately 4.8 m high. Cantilever piles were also used, and the section was classified as safety Grade II. Section EFA was 227 m long and 2.68–17.3 m high. It was a permanent excavated soil slope supported by pile-anchor retaining structures and was classified as safety Grade I.
Figure 5.
Monitoring layout of the deep excavation in Case 3. Letters A–F denote the endpoints of the support sections.
Monitoring was conducted from 4 to 264 d and included 27 valid monitoring times. Representative monitoring data from section EFA, which had the pile-anchor support configuration relevant to this study, were selected as Case 3 to further examine the applicability of the proposed assessment method under different engineering conditions.
Representative monitoring data from points YL-5, 5, and SB-5 in section EFA were used to obtain four time-series variables: deep horizontal displacement of the retaining structure, horizontal displacement at the pile top, vertical displacement at the pile top, and anchor axial force. To maintain consistency with Cases 1 and 2, these variables were denoted as A, B, C, and D, respectively. The component residual safety performance was calculated using Equation (2), as listed in Table 9.
Table 9.
Component residual safety performance of Case 3.
The CRITIC weights of indicators A, B, C, and D were 0.6325, 0.0482, 0.0618, and 0.2573, respectively. Indicator A had the largest weight, followed by indicator D. The construction-stage residual safety performance was calculated as
The component residual safety performance values in Table 9 were substituted into Equation (20), and the resulting construction-stage residual safety performance values are listed in Table 10.
Table 10.
Construction-stage residual safety performance of Case 3.
Because the monitoring intervals were not uniform, the performance curve was integrated using the actual time intervals and the trapezoidal rule in Equation (9). The integrated area was 167.8498 over a monitoring duration of 260 d, giving a construction safety resilience of . According to Table 3, this value lies within the range 0.50–0.75 and corresponds to moderate resilience. The result was consistent with the assessment reported in [1].
5.4. Sensitivity and Uncertainty Analyses
5.4.1. Weight Sensitivity Analysis for Case 1
Section MO was the controlling monitoring section in Case 1. Based on the component residual safety performance in Table 4 and the CRITIC weights in Equation (15), the recalculated baseline resilience was 0.5237. This value was close to the value of 0.53 obtained in the main analysis using the unrounded source data. The small difference resulted from rounding of the component performance values and weight coefficients in the tables. Resilience values in the sensitivity analysis were therefore reported to four decimal places. Based on [27] and a reasonable range of variation commonly considered in engineering practice, single-factor weight perturbations of ±10% and ±20% were selected. Individual perturbations of ±10% and ±20% were applied to the weights of indicators A–D; the resulting resilience values are listed in Table 11.
Table 11.
Construction safety resilience under indicator-weight perturbations for Case 1.
Under all ±20% single-indicator weight perturbations, the resilience ranged from 0.5115 to 0.5360 and did not cross the current 0.50 classification boundary. The resilience level therefore remained unchanged. The maximum relative changes for A, B, C, and D were 2.253%, 0.006%, 0.337%, and 2.339%, respectively, giving the sensitivity order D ≈ A > C ≫ B.
The time-averaged residual safety performance of indicator A was approximately 0.7165, which was higher than the baseline resilience of 0.5237. The corresponding value for indicator D was approximately 0.4235, and its baseline weight was relatively high. Increasing the weight of D therefore reduced the overall resilience, while increasing the weight of A increased it. The time-averaged residual safety performance of B was approximately 0.5230, close to the baseline resilience, and changes in its weight had little influence on the final result.
5.4.2. Weight Sensitivity Analysis for Case 2
The baseline overall resilience of Case 2 was 0.7204. Indicators A–D were individually perturbed by ±10% and ±20%. Case 2 contained three monitoring sections and four anchor rows. To maintain consistency with the original assessment framework, each perturbation was applied simultaneously to the corresponding weight vector of every monitoring section and anchor row. For each perturbation condition, the full calculation sequence was repeated from anchor-row resilience to monitoring-section resilience and finally to overall excavation resilience.
Under the baseline condition, the resilience values of Monitoring Sections 1, 2, and 3 were approximately 0.7833, 0.7359, and 0.7204, respectively. The overall resilience was controlled by Monitoring Section 3, and the first anchor row was the controlling row in all three monitoring sections. The ranges obtained under the perturbation conditions are listed in Table 12 and Table 13.
Table 12.
Anchor-row construction safety resilience ranges under weight perturbations for Case 2.
Table 13.
Overall construction safety resilience under weight perturbations for Case 2.
Across all ±20% single-indicator perturbations, the overall resilience varied only from 0.7181 to 0.7226. The maximum relative change did not exceed 0.318%, and the resilience level remained unchanged. The sensitivity order was B > C > D > A. This order differed from that obtained for Case 1, showing that weight sensitivity depended on the monitoring response, relative variation in the indicators, and the specific weight combination of each project.
The controlling anchor row remained the first row under all perturbation conditions, and Monitoring Section 3 remained the critical monitoring section. Within the perturbation range examined, variations in CRITIC weights did not alter the identification of either the critical anchor row or the critical monitoring section.
5.4.3. Weight Sensitivity Analysis for Case 3
The same sensitivity analysis procedure was applied to Case 3. The results are listed in Table 14.
Table 14.
Construction safety resilience under indicator-weight perturbations for Case 3.
Under the ±20% perturbation range, the construction safety resilience varied from 0.6208 to 0.6703 and did not cross the current classification boundaries of 0.50 and 0.75. The resilience level therefore remained unchanged. The sensitivity order was A > C > B > D. Indicator A produced the largest relative change of 3.833%, while the corresponding values for C, B, and D were 0.663%, 0.492%, and 0.428%, respectively. The overall assessment of Case 3 was therefore most sensitive to the weight of deep horizontal displacement, although the final resilience remained within a stable range under all prescribed perturbations.
5.4.4. Comparison of the Three Case Studies
The three case studies showed different sensitivity patterns. Case 1 was most sensitive to anchor axial force D and deep horizontal displacement A. Case 2 was most sensitive to pile-top horizontal displacement B. Case 3 was most sensitive to deep horizontal displacement A. The results show that CRITIC weight sensitivity depended on the monitoring response, indicator variability, and correlation structure of each project rather than following a fixed ranking. The weight-sensitivity results for the three case studies are summarized in Table 15.
Table 15.
Summary of weight sensitivity results for the three case studies.
Despite these differences, the resilience classification remained unchanged for all three cases under ±20% single-indicator weight perturbations. The maximum relative change was 3.833%, and the numerical resilience values themselves did not change markedly. In Case 2, which contained several anchor rows and monitoring sections, the identified critical anchor row and critical monitoring section also remained unchanged. These results show that, for the three cases and perturbation ranges examined, the CRITIC-based resilience assessment remained numerically stable under moderate changes in indicator weights.
It should be noted that the three cases examined above are engineering application cases based on existing engineering data. Broader validation of the proposed method will require larger datasets, controlled experiments, numerical simulations, or additional independent field cases.
5.4.5. Scenario-Based Uncertainty Analysis of Monitoring Data
Field monitoring data may also be affected by measurement error, sensor drift, sampling intervals, and abnormal observations. The source data for the three case studies did not provide complete sensor-error distributions or original measurement uncertainty parameters. The present analysis was therefore designed as a scenario-based input perturbation test rather than a formal metrological uncertainty analysis.
The initial performance was kept unchanged. Independent uniform multiplicative perturbations of ±5% and ±10% were applied to the dimensionless component residual safety performance at all other monitoring times, and perturbed values were constrained to the interval [0, 1]. For comparability among the three cases, 10,000 Monte Carlo simulations were performed at each perturbation level, and the complete resilience assessment procedure was repeated in every simulation. The results are listed in Table 16.
Table 16.
Scenario-based uncertainty analysis under perturbations of monitoring inputs.
Under the ±5% and ±10% monitoring-input perturbations, the mean resilience values of all three cases remained close to their baseline values, and none of the 95% empirical intervals crossed the current resilience classification boundaries. At ±10% perturbation, the 95% intervals were 0.5143–0.5333 for Case 1, 0.7076–0.7320 for Case 2, and 0.6365–0.6548 for Case 3.
For Case 2, Monitoring Section 3 remained the controlling section in 99.98% of the ±5% simulations, and the first anchor row remained the controlling row in all three monitoring sections in 100% of the simulations. Under ±10% perturbation, Monitoring Section 3 remained controlling in 95.73% of the simulations, while the first anchor row remained controlling in at least 99.88% of the simulations for each section. Case 3 contained only one representative monitoring section and therefore did not involve switching of the controlling section or anchor row.
These results confirm numerical stability within the prescribed input perturbation scenarios. This analysis should be interpreted as a scenario-based robustness test and does not replace formal uncertainty quantification based on sensor accuracy, measurement-error distributions, and site-specific calibration data, nor should it be regarded as a complete measurement error model.
6. Conclusions
This study developed a monitoring-based, two-level method for evaluating the construction safety resilience of pile-anchor-supported deep excavations. The construction safety resilience assessment method was explored and proposed. The principal conclusions are as follows:
- (1)
- Construction safety resilience of pile-anchor-supported deep excavations is governed primarily by robustness and recoverability. Deep horizontal displacement of the retaining structure, horizontal displacement at the pile top, vertical displacement at the pile top, and anchor axial force were identified as the four key monitoring indicators. Their data-driven weights were determined using the CRITIC method, enabling field monitoring responses to be transformed into time-dependent residual safety performance.
- (2)
- A two-level method for assessing the construction safety resilience of deep excavations was explored and proposed, including resilience assessment at the support-structure monitoring section level and the overall excavation level. Preliminary resilience levels were also defined for the overall excavation. A specific calculation method was established for deep excavations with multiple anchor rows. Comparison with three existing engineering cases showed that the proposed method can reflect the evolution of resilience during deep excavation construction in greater spatial detail. For multi-row anchor support systems, particular attention should be paid to the condition of the first anchor row.
- (3)
- Sensitivity and uncertainty analyses demonstrated numerical stability within the prescribed perturbation ranges. After ±10% and ±20% single-factor weight perturbations were applied to each of the three engineering cases, the CRITIC-based resilience assessment results showed good numerical stability under moderate variations in indicator weights. Under ±5% and ±10% scenario-based perturbations of monitoring inputs, the mean resilience values of the three engineering cases remained close to their respective baseline values, and none of the 95% empirical intervals crossed the adopted resilience-classification boundaries.
Author Contributions
Conceptualization, C.Y. and H.F.; methodology, H.F.; software, K.Z.; validation, C.Y., Z.Y. and H.F.; formal analysis, H.F.; investigation, R.S.; resources, C.Y.; data curation, K.Z.; writing—original draft preparation, H.F.; writing—review and editing, C.Y.; visualization, H.F.; supervision, J.D.; project administration, Z.Y.; funding acquisition, C.Y. All authors have read and agreed to the published version of the manuscript.
Funding
This work was supported by the Key R&D Project of Shandong Province (Public Welfare Projects) (Grant No. 2018GSF120005).
Data Availability Statement
The data supporting the findings of this study are available from the corresponding author upon reasonable request.
Conflicts of Interest
Author Zi-Jin Yuan was employed by Qingdao Baiyang Health Industry Park Co., Ltd., and author Rong-Jun Si was employed by CCTEG Chongqing Research Institute. The remaining authors declare that the research was conducted in the absence of any commercial or financial relationships that could be construed as a potential conflict of interest.
References
- Zheng, G.; Cheng, X.; Zhou, H.; Zhang, T.; Diao, Y.; Wang, R.; Yi, F.; Guo, W. Evaluation and control of structural toughness in geotechnical and underground engineering. J. Civ. Eng. 2022, 55, 1–38. (In Chinese) [Google Scholar] [CrossRef]
- Yuan, M.; Yuan, C.; Chen, F.; Li, L.; Hong, Y.; Yu, G.; Lei, J. BIM digital shadow technology and risk assessment method of deep excavation behavior for Zibo Light Rail. Front. Earth Sci. 2022, 10, 908032. [Google Scholar] [CrossRef] [Scilit]
- Fan, Y.; Yuan, C.; Yuan, M.; Chen, F.; Li, L.; Yu, G. Visualization method of deep excavation digital twin behavior based on building information modeling. Sci. Technol. Eng. 2022, 22, 7972–7980. (In Chinese) [Google Scholar]
- Yuan, C.; Hu, Z.; Zhu, Z.; Yuan, Z.; Fan, Y.; Guan, H.; Li, L. Numerical simulation of seepage and deformation in excavation of a deep excavation under water-rich fractured intrusive rock. Geofluids 2021, 2021, 6628882. [Google Scholar] [CrossRef] [Scilit]
- An, Y.; Li, L.; Gao, H.; Luo, Z.; He, Y. Fusing multiple-source data for foundation excavation risk assessment based on cloud model and Dempster–Shafer evidence theory. Sci. Rep. 2025, 15, 9894. [Google Scholar] [CrossRef] [Scilit]
- Hao, H.; Jian, H.; Peiling, L.; Cong, Z. Identification and evaluation of deep excavation construction risks based on the Grey-DEMATEL-fuzzy comprehensive evaluation method. PLoS ONE 2024, 19, e0304095. [Google Scholar] [CrossRef]
- Guo, X.; Mao, J.; Wang, L.; Gu, J. Safety resilience evaluation of deep foundation pit construction based on an extension cloud model. Buildings 2025, 15, 3216. [Google Scholar] [CrossRef] [Scilit]
- Wang, J.; Zhao, F.; Wang, B.; He, X. Resilience assessment of deep foundation pits of metro stations under the influence of multiple factors. China Saf. Sci. J. 2019, 29, 154–159. (In Chinese) [Google Scholar] [CrossRef]
- Zhang, Z. Identification, Measurement, and Improvement of Safety Resilience in Deep Foundation Pit Engineering Systems. Master’s Thesis, Southeast University, Nanjing, China, 2022. Available online: https://link.cnki.net/doi/10.27014/d.cnki.gdnau.2022.002762 (accessed on 24 September 2026). (In Chinese)
- Ma, B.; Li, J.; Miao, C. Risk management strategy for deep foundation pit construction in water-rich soft soil based on the concept of resilience. Constr. Econ. 2023, 44, 127–130. (In Chinese) [Google Scholar] [CrossRef]
- Chen, F. Resilience Evaluation of Subway-Station Deep Foundation Pit Engineering Under Rainstorm Waterlogging. Master’s Thesis, Jiangxi University of Science and Technology, Ganzhou, China, 2024. (In Chinese) [Google Scholar] [CrossRef]
- Shen, L.; Xue, Z.; Tang, L.; Ge, H. Resilience evaluation and enhancement of deep excavation construction safety systems. Buildings 2022, 12, 1922. [Google Scholar] [CrossRef] [Scilit]
- Holling, C.S. Resilience and stability of ecological systems. Annu. Rev. Ecol. Syst. 1973, 4, 1–23. [Google Scholar] [CrossRef] [Scilit]
- Griffith, A.A. The phenomena of rupture and flow in solids. Philos. Trans. R. Soc. Lond. Ser. A 1921, 221, 163–198. [Google Scholar] [CrossRef] [Scilit]
- Jabareen, Y. Planning the resilient city: Concepts and strategies for coping with climate change and environmental risk. Cities 2013, 31, 220–229. [Google Scholar] [CrossRef] [Scilit]
- Tierney, K.; Bruneau, M. Conceptualizing and measuring resilience: A key to disaster loss reduction. TR News 2007, 250, 14–17. [Google Scholar]
- Attoh-Okine, N.O.; Cooper, A.T.; Mensah, S.A. Formulation of a resilience index of urban infrastructure using belief functions. IEEE Syst. J. 2009, 3, 147–153. [Google Scholar] [CrossRef] [Scilit]
- Ayyub, B.M. Systems resilience for multihazard environments: Definition, metrics, and valuation for decision making. Risk Anal. 2014, 34, 340–355. [Google Scholar] [CrossRef] [Scilit]
- Huang, H.; Zhang, D. Resilience analysis of shield tunnel lining under extreme surcharge: Characterization and field application. Tunn. Undergr. Space Technol. 2016, 51, 301–312. [Google Scholar] [CrossRef] [Scilit]
- GB 50497-2019; Technical Code for Monitoring of Building Foundation Pit Engineering. Ministry of Housing and Urban-Rural Development of the People’s Republic of China: Beijing, China, 2019.
- GB 50911-2013; Code for Monitoring Measurement of Urban Rail Transit Engineering. Ministry of Housing and Urban-Rural Development of the People’s Republic of China: Beijing, China, 2013.
- Cheng, X.; Zheng, G.; Deng, C.; Huang, T.; Nie, D. Mechanism of progressive collapse induced by partial failure of cantilever contiguous retaining piles. Chin. J. Geotech. Eng. 2015, 37, 1249–1263. (In Chinese) [Google Scholar] [CrossRef]
- Lin, X.; Chen, X.; Su, D.; Zhu, M.; Han, K.; Chen, R. Evaluation method of structural resilience of shield tunnels considering multiple disturbances and its application. Chin. J. Geotech. Eng. 2022, 44, 591–601. (In Chinese) [Google Scholar]
- Zhu, M.; Chen, X.; Xia, C.; Wang, C.; Bao, X. Evolution of structural resilience of shield tunnels under ground surcharge. Chin. J. Geotech. Eng. 2024, 46, 35–44. (In Chinese) [Google Scholar]
- Hamby, D.M. A review of techniques for parameter sensitivity analysis of environmental models. Environ. Monit. Assess. 1994, 32, 135–154. [Google Scholar] [CrossRef] [Scilit]
- Triantaphyllou, E.; Sánchez, A. A sensitivity analysis approach for some deterministic multi-criteria decision-making methods. Decis. Sci. 1997, 28, 151–194. [Google Scholar] [CrossRef] [Scilit]
- Kittipongvises, S.; Phetrak, A.; Rattanapun, P.; Brundiers, K.; Buizer, J.L.; Melnick, R. AHP-GIS analysis for flood hazard assessment of the communities nearby the world heritage site on Ayutthaya Island, Thailand. Int. J. Disaster Risk Reduct. 2020, 48, 101612. [Google Scholar] [CrossRef] [Scilit]
- Dai, W. Safety Risk Assessment Technology for Deep Foundation Pits with Pile-Anchor Support in Hengyang City. Master’s Thesis, University of South China, Hengyang, China, 2014. (In Chinese) [Google Scholar]
- Ye, S. Risk Assessment and Early-Warning System for Deep Foundation Pits with Pile-Anchor Composite Support. Master’s Thesis, Anhui University of Technology, Maanshan, China, 2021. (In Chinese) [Google Scholar]

Disclaimer/Publisher’s Note: The statements, opinions and data contained in all publications are solely those of the individual author(s) and contributor(s) and not of MDPI and/or the editor(s). MDPI and/or the editor(s) disclaim responsibility for any injury to people or property resulting from any ideas, methods, instructions or products referred to in the content. |
© 2026 by the authors. Licensee MDPI, Basel, Switzerland. This article is an open access article distributed under the terms and conditions of the Creative Commons Attribution (CC BY) license.