


Abstract
Urban areas account for approximately 70% of global greenhouse gas emissions and are central to climate governance. However, low-carbon urban-block development still lacks an integrated indicator system and an operational management method for evaluating carbon-reduction performance. This study reviews carbon-emission-related indicators from domestic and international policies, standards, and planning cases, focusing on six domains: energy, buildings, transportation, solid waste, water systems, and carbon sinks. Through word-frequency analysis and a four-step validation procedure, a two-level indicator system with six primary categories and 22 secondary indicators is developed. The analytic hierarchy process and expert scoring are used to determine indicator weights, and a comprehensive carbon-reduction evaluation index (CCI) is introduced to quantify overall performance. The method is applied to a selected block in Guangzhou, China. A whole-process carbon management framework, covering systematic planning, performance evaluation, and technical optimization, is implemented for the case area. From 2020 to 2025, total carbon emissions decreased by 26.61%, and the CCI reached 0.9924, indicating substantial aggregate improvement relative to the 2020 baseline. The results show that the proposed indicator system and CCI-based evaluation method can identify key governance priorities, measure implementation performance, and support refined low-carbon management at the urban block scale.
1. Introduction
Global climate change has become a severe challenge shared by human society [1]. Controlling greenhouse gas emissions and implementing carbon management are necessary for addressing the climate crisis and achieving sustainable development [2]. Cities consume approximately 78% of global energy and account for about 70% of greenhouse gas emissions, making them critical arenas for climate-change mitigation and spatial-planning interventions [3]. Urban greenhouse gas accounting has gradually expanded from conventional territorial inventories to consumption-based and hybrid life-cycle approaches, allowing both direct emissions and upstream emissions associated with energy, transportation, materials, and waste to be considered [4,5]. However, urban-scale energy and emission studies are primarily intended to support macro-level policy evaluation, whereas building-scale studies generally focus on architectural design and operational optimization. Differences in spatial resolution, system boundaries, and decision-making objectives limit the direct application of these approaches to carbon management and optimization at the urban-block scale [6,7]. Urban blocks occupy an intermediate position between cities and individual buildings and can encompass the interactions among building energy use, travel behavior, land use, municipal resource flows, and green-space carbon sinks [8,9]. Compared with the city scale, urban blocks have more clearly defined spatial and administrative boundaries; compared with the individual-building scale, they provide greater capacity for coordinating multiple infrastructure and resource systems. They are also more closely linked to specific planning controls, development projects, and management entities. Urban blocks can therefore serve as operational carbon-management units through which citywide emission-reduction targets are translated into spatial-planning measures and implementable projects [8].
In recent years, studies have used hybrid life-cycle accounting, greenhouse gas inventories, decomposition analysis, and policy evaluation to examine urban carbon emissions, their driving factors, and the effectiveness of mitigation policies. Ramaswami et al. developed a consumption-based hybrid life-cycle approach for urban greenhouse gas accounting that incorporated both direct emissions within cities and upstream indirect emissions associated with urban consumption into a unified framework [4]. Kennedy et al. compared greenhouse gas inventories across multiple international cities and examined how energy supply, transport modes, urban form, and waste-treatment practices affected urban emission levels [5]. Shan et al. compiled carbon-emission inventories for 287 Chinese cities and identified the effects of energy structure, energy efficiency, population size, and economic development on urban emission trends [10]. Zeng et al. employed a quasi-natural experiment and spatial econometric methods to evaluate the effects of China’s low-carbon city pilot policy on the carbon-emission intensity of both pilot cities and their neighboring areas [11]. Urban energy-system models have also expanded to incorporate technological design, building performance, urban climate, energy systems, and policy evaluation. Nevertheless, model boundaries vary considerably, and land-use and transport models remain insufficiently integrated with urban energy models [6]. Consequently, urban-scale research is well suited to intercity comparison and macro-level policy assessment but provides limited guidance for selecting and implementing mitigation measures within individual urban blocks.
Research on low-carbon urban blocks can be broadly grouped into three areas: materials and building technologies, urban-form optimization, and integrated low-carbon assessment. Studies of materials and building technologies have primarily applied process-based accounting, life-cycle assessment, and building energy simulation. Olsson et al. quantified greenhouse gas emissions from global fired-clay brick production and identified the principal sources of embodied carbon and their mitigation potential [12]. Building energy models have also been extended from individual buildings to building stocks and urban areas, providing a technical basis for energy-efficient design, building retrofit, and energy-scenario assessment [7]. However, studies at the material or building scale generally focus on particular products, individual buildings, or building energy systems. They therefore have limited capacity to represent, within a consistent system boundary, the interactions among transportation, municipal resource use, land-use patterns, and ecological carbon sinks. Research on urban form optimization has mainly used spatial statistics, geographical detectors, urban morphology analysis, and GIS modeling based on multi-source data. Li and Yan applied an optimal-parameter geographical detector to establish the relationship between development intensity and carbon-emission intensity at the urban-block scale, thereby revealing how urban form affects local carbon emissions [13]. Lian et al. examined the relationship between residential-block morphology and building carbon emissions and quantified the effects of floor area ratio, green-space ratio, and road-network density [14]. Zheng et al. developed a street-scale spatial carbon-emission model using multi-source open data, demonstrating the potential of fine-resolution emission mapping and spatial monitoring [15]. These studies provide substantially higher spatial resolution than citywide carbon inventories. Nevertheless, most focus on a single emission sector or a limited set of physical-form variables. Their findings are therefore more applicable to spatial diagnosis than to the comprehensive evaluation of mitigation performance throughout the planning and implementation process. Integrated low-carbon assessment represents a third line of research. Xu et al. reviewed the development and digital application of assessment tools for low-carbon urban planning and design, demonstrating their potential to support planning-scenario comparison and design decisions [16]. Wang et al. developed an urban renewable-energy planning model subject to carbon constraints, illustrating the role of energy-scenario analysis in low-carbon planning decisions [17]. At the neighborhood and urban-block scales, assessment systems such as LEED for Neighborhood Development, BREEAM Communities, and CASBEE for Urban Development generally employ multicriteria indicator frameworks, scoring procedures, and weighting systems to assess energy, transportation, water resources, land use, the ecological environment, and other dimensions of sustainability [8,9,18]. However, existing tools continue to exhibit several limitations, including imbalanced indicator coverage, insufficient transparency in scoring and weighting, limited adaptation to local conditions, inadequate consideration of interactions among indicators and system boundaries, and weak correspondence between assessment scores and observed changes in carbon emissions [18,19].
The literature therefore contains substantial research on urban carbon emissions, building energy use, and neighborhood sustainability. The principal gap lies in the limited integration of spatial scales and methodological approaches. Three specific shortcomings can be identified. First, citywide carbon inventories generally have a coarse spatial resolution, whereas individual-building models employ relatively narrow system boundaries. Studies at the urban-block scale often focus on a single emission sector or a limited set of urban-form variables and have yet to establish an integrated assessment framework. Second, carbon accounting and sustainability assessment remain insufficiently connected, making it difficult to evaluate actual emission reductions and the implementation performance of low-carbon measures within the same framework. Third, urban-block development involves long implementation periods, multiple interacting factors, and frequent adjustments to planning and construction decisions. A comprehensive method is therefore needed to evaluate both quantitative carbon-emission outcomes and the implementation of mitigation measures.
To address these gaps, this study reviewed 28 domestic and international policies and standards and 14 representative low-carbon development cases. Literature analysis, NVivo-based word-frequency analysis, and a structured indicator-screening process were then used to identify the principal factors affecting carbon mitigation at the urban-block scale. On this basis, an evaluation system comprising six primary indicators and 22 secondary indicators was developed. The analytic hierarchy process (AHP) and expert scoring were used to determine indicator weights, after which a composite index (CCI) was introduced to provide an integrated quantitative assessment of carbon-reduction performance. Finally, the proposed framework was applied to an urban block in Guangzhou, China, to examine its applicability to planning and engineering practice. The study provides a systematic method and practical evidence to support the planning, construction, performance evaluation, and carbon management of low-carbon urban blocks.
2. Materials and Methods
2.1. Survey Samples
This study systematically analyzed 28 standards, guidelines, and assessment tools related to green urban development and conducted field investigations of 14 representative green and eco-district projects. Selected documents and projects are presented in Table 1 and Table 2, respectively. Based on life-cycle theory, the survey focused on extracting core evaluation indicators related to low-carbon development, including block layout planning, energy-structure transformation, and industrial-structure development. A total of 448 indicators associated with low-carbon development were preliminarily screened, with a screening rate of 47.9%. In terms of domain distribution, the indicators mainly covered six fields: energy, buildings, transportation, water, solid waste, and carbon sinks.
Table 1.
Standards, guidelines, and assessment tools for green district and block development (selected).
Table 2.
Low-carbon planning indicators from the field investigation (selected).
2.2. Establishment and Validation of the Indicator System
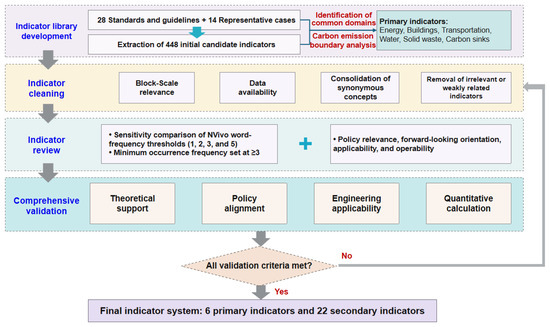
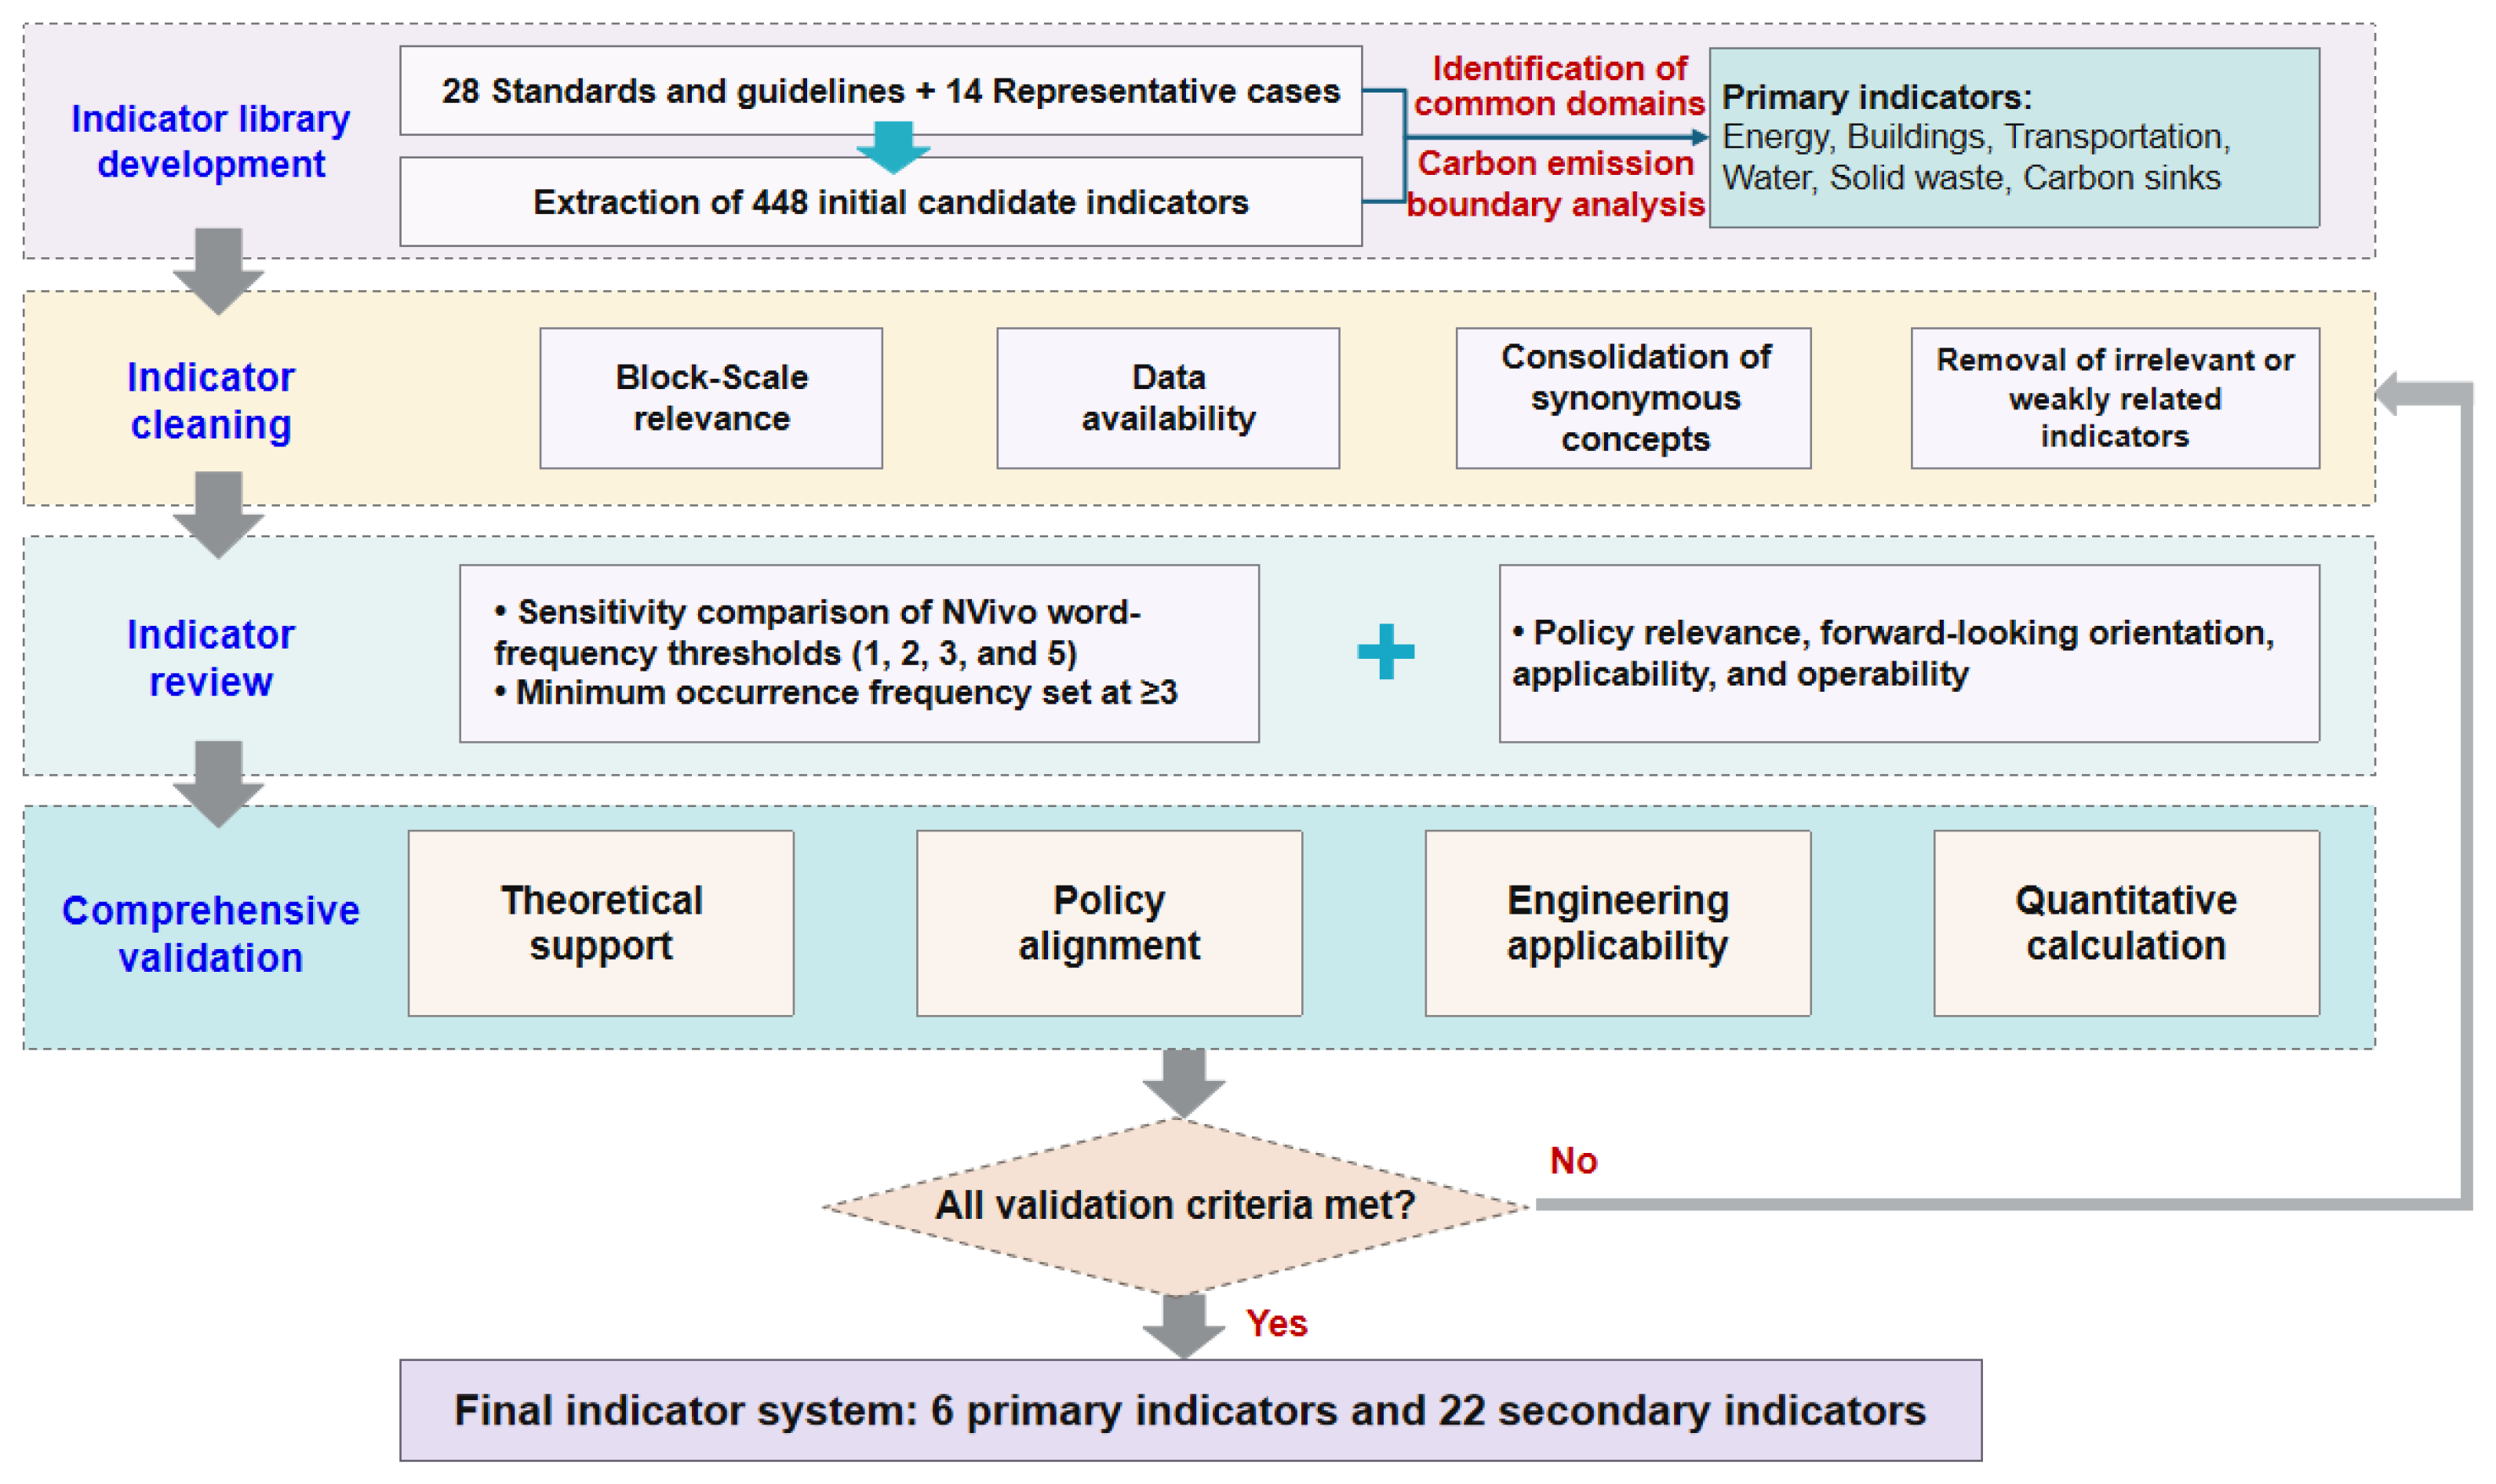
The low-carbon urban-block evaluation indicator system was developed through four stages, namely indicator library development, indicator cleaning, indicator review, and comprehensive validation, as illustrated in Figure 1. First, an initial indicator library was established by systematically reviewing 28 relevant domestic and international standards and 14 representative cases. Based on the domains commonly addressed by these sources and the system boundary of urban-block carbon emissions, energy, buildings, transportation, water, solid waste, and carbon sinks were defined as the six primary indicators. Together, these domains cover the principal emission sources and carbon-sink types associated with the planning, construction, and operation of urban blocks. Second, the candidate indicators were cleaned according to their relevance to the urban-block scale, data availability, conceptual independence, and relationships with other indicators. Content screening and semantic standardization were conducted to clarify the unit of analysis, classification rules, and conceptual boundaries of each indicator [32]. For composite indicators, theoretical relevance, measurability, data quality, and inter-relationships were considered comprehensively [33]. Indicators that were unsuitable for the urban-block scale, weakly associated with carbon-reduction performance, or unsupported by stable data sources were removed. Indicators with essentially consistent evaluation objects, conceptual meanings, and accounting boundaries were subsequently merged [34]. For example, the conceptually similar indicators “proportion of installed photovoltaic capacity” and “building photovoltaic coverage rate” were consolidated as “building photovoltaic coverage rate”. The source, processing method, and decision basis for each indicator were documented to ensure the traceability of the screening process.
Figure 1.
Technical roadmap for indicator construction.
During the indicator review stage, the cleaned indicator library was analyzed using NVivo 15.3.2 for Windows to determine the frequency of standardized indicator terms and their core concepts [35]. Screening results were compared using minimum occurrence-frequency thresholds of 1, 2, 3, and 5. At thresholds of 1 or 2, numerous indicators applicable only to individual cases were retained, resulting in an excessively complex system. When the threshold was increased to 5 or higher, important low-carbon indicators in several specialized fields were omitted, preventing adequate coverage of the six evaluation domains. A threshold of 3 provided a more appropriate balance, retaining the principal management indicators in each domain while excluding incidental, low-frequency indicators. Considering domain coverage, cross-case relevance, and the need for a concise indicator system, an occurrence frequency of at least three was therefore adopted as the quantitative screening criterion. Frequency analysis reflects the degree of agreement among the selected sources but does not necessarily indicate an indicator’s carbon-reduction value or practical feasibility. Accordingly, indicators meeting the frequency threshold were further reviewed qualitatively in terms of policy relevance, forward-looking orientation, applicability, and operability [36]. Indicators occurring fewer than three times were also subjected to supplementary review when they were associated with explicit policy requirements, provided important technical guidance, or represented an irreplaceable carbon-reduction function.
Finally, comprehensive validation was conducted across four dimensions: theoretical support, policy alignment, engineering applicability, and quantitative measurability. This stage examined the scientific validity and forward-looking relevance of each indicator, its consistency with applicable policies, its feasibility in engineering practice, and its capacity for reliable quantitative assessment. The validation was intended to ensure that the indicators could be consistently applied throughout the planning, construction, and operation stages. Indicators that passed the validation were incorporated into the final system, whereas those that did not were returned to the cleaning stage for revision or removal. Through this iterative screening and validation process, the final low-carbon urban-block evaluation system was established, consisting of primary and secondary indicators.
2.3. Weight Calculation
The AHP is a multicriteria decision-making method that combines qualitative judgments with quantitative calculations. Based on the relationships among the factors within a system, AHP decomposes a complex decision problem into a goal level, a criteria level, and an indicator level, and determines the relative importance of the elements at each level through pairwise comparisons [37]. In this study, the low-carbon urban-block indicator system was organized into the following hierarchical structure: (1) the goal level (A), representing the comprehensive evaluation of low-carbon development performance at the urban-block scale; (2) the criteria level (B), comprising the six primary indicators associated with the evaluation goal, namely energy (B1), buildings (B2), transportation (B3), water (B4), solid waste (B5), and carbon sinks (B6); and (3) the indicator level (C), comprising 22 secondary indicators assigned to the six primary indicators. On this basis, a judgment matrix was constructed for the criteria level relative to the goal level (A–B), and six judgment matrices were constructed for the secondary indicators relative to their corresponding primary indicators (B–C).
To improve the professional relevance and reliability of the weighting process, potential experts were evaluated according to their disciplinary background, professional qualifications, years of experience, and project experience. Invitations were sent to 25 candidates, of whom 15 completed the evaluation. The expert panel comprised six specialists in architecture, seven specialists in heating, ventilation, and air-conditioning and building energy, and two specialists in municipal and environmental engineering. Six experts held full-senior professional titles, and nine held associate-senior professional titles. The eligibility criteria were as follows: (1) holding an associate-senior or higher professional title; (2) having at least 10 years of professional or research experience in green and low-carbon development, low-carbon buildings, urban and rural planning, or a related field; (3) having participated in policy or standard development or engineering projects related to low-carbon urban blocks or buildings; and (4) being familiar with China’s policies and regulations concerning low-carbon development. The 15 experts used the Saaty 1~9 scale to conduct pairwise comparisons of the indicators at each level with respect to the corresponding element at the preceding level. A value of 1 indicated equal importance, whereas values of 3, 5, 7, and 9 indicated moderate, strong, very strong, and extreme importance of one indicator over another, respectively. Values of 2, 4, 6, and 8 represented intermediate judgments between adjacent levels, and reciprocal values were used for reverse comparisons [38].
Only judgment matrices that satisfied the consistency requirement were included in the aggregation. The geometric mean method was used to combine the pairwise-comparison results of the individual experts into a group judgment matrix. For the comparison between indicators and , the aggregated group judgment was calculated as follows:
where is the pairwise-comparison value assigned by expert , is the number of valid expert judgments included in the aggregation, and is the aggregated group comparison value.
The aggregated judgment matrix was subsequently normalized by column, and the weight vector was obtained by calculating the arithmetic mean of the normalized values in each row. Matrix consistency was examined using the maximum eigenvalue , the consistency index (CI), and the consistency ratio (CR). These parameters were calculated as follows:
where is the order of the judgment matrix and is the corresponding random consistency index. A judgment matrix was considered acceptably consistent when < 0.10.
In total, one criteria-level judgment matrix and six indicator-level judgment matrices were constructed. The CR values of the seven matrices ranged from 0.06~0.09, all below the threshold of 0.10, indicating acceptable consistency in the expert judgments. The complete pairwise-comparison matrices, column-normalized matrices, calculated weights, and detailed consistency parameters are provided in the Supplementary Materials.
2.4. Comprehensive Carbon-Reduction Evaluation Index (CCI)
The composite carbon-reduction evaluation index (CCI) was developed to measure the overall degree of improvement achieved by low-carbon measures relative to the baseline condition, thereby avoiding reliance on total carbon emissions as the sole evaluation criterion. Because the indicators differ in their units of measurement and directions of improvement, changes in each indicator relative to its baseline value were first dimensionless and directionally standardized. The standardized changes were then combined with the corresponding indicator weights to obtain the comprehensive evaluation result [21,39], Equation (4):
where CCI is the comprehensive carbon-reduction evaluation index; and are the current value and baseline value of the -th indicator, respectively; is the weight of the -th indicator; and is the number of evaluation indicators included in the internal evaluation. is the direction coefficient of the -th indicator. For a positive indicator, an increase relative to the baseline produces a positive contribution, = +1; for a negative indicator, an increase produces a negative contribution, whereas a decrease produces a positive contribution, = −1.
Based on the CCI value, comprehensive carbon-reduction performance was classified into three levels. A value of CCI < −0.1 indicates that performance is below the baseline level and that the implemented measures have produced unsatisfactory results. A value of −0.1 ≤ CCI ≤ 0.1 indicates that performance is broadly comparable to the baseline and that no significant carbon-reduction effect has been achieved. A value of CCI > 0.1 indicates that performance is significantly better than the baseline and that the implemented measures have achieved a substantial carbon-reduction effect, as summarized in Table 3.
Table 3.
Classification of comprehensive carbon-reduction performance.
In terms of methodological applicability, the proposed approach establishes an indicator-based evaluation framework comprising six domains: buildings, energy, transportation, water systems, solid waste, and carbon sinks. The secondary indicators, baseline values, target values, and weights may be adjusted according to project type, climatic conditions, local policies, and data availability. When the method is applied to other urban blocks, the evaluation boundary, carbon-accounting boundary, and data year should remain consistent, and the applicability of the secondary indicators and their weights should be reassessed. For indicators that cannot be included because of missing data, the weights of the remaining valid indicators should be renormalized to prevent differences in the number of available indicators from biasing comparisons among blocks. The method can be applied at different stages of urban-block development. During the planning and design stage, it can be used to compare alternative planning schemes and design strategies and to identify their relative priorities. During the implementation stage, it can support annual performance evaluation and progress monitoring. During the operation stage, monitoring data can be incorporated into the framework for periodic updates.
2.5. Engineering Case
2.5.1. Basic Information
A block in Guangzhou was selected as the case study area. The block covers approximately 3.5 km2, with a planned gross floor area of about 2.7486 million m2 and a planned population of about 30,000 residents. It is conceived as a mixed-use district centered on knowledge services and headquarters-economy functions, integrating scientific research and development, finance and business services, cultural and creative industries, tourism and recreation, and ecological residential development. A central water body forms the principal blue-space core of the case-study area, while the surrounding green corridors, waterfront spaces, and mixed-use developments collectively create an interconnected blue–green spatial structure. The combination of relatively intensive urban development and extensive ecological space provides an appropriate setting for evaluating coordinated carbon-management strategies across energy, buildings, transportation, water resources, solid waste, and carbon sinks and closely corresponds to the six primary evaluation domains established in this study.
2.5.2. Baseline Assessment
Based on a review of the project planning documents, supplemented by field investigations and interviews with the project developer, the existing buildings were found to have been constructed in accordance with the General code for energy efficiency and renewable energy application in buildings (GB 55015-2021) [40]. The green-travel share was approximately 68.10%, while private-car and taxi trips accounted for approximately 30.9%. Domestic waste generation was 26.39 t/day, with incineration for power generation as the main treatment method. Daily water consumption in the block was approximately 20,100 m3/day, and the non-conventional water utilization rate was approximately 11%. The green-space ratio of construction land was 43%, including 163 ha of lake area and 144.3 ha of urban green space. No renewable energy was being used at the time of assessment.
3. Results
3.1. Low-Carbon Block Planning and Development Indicator System
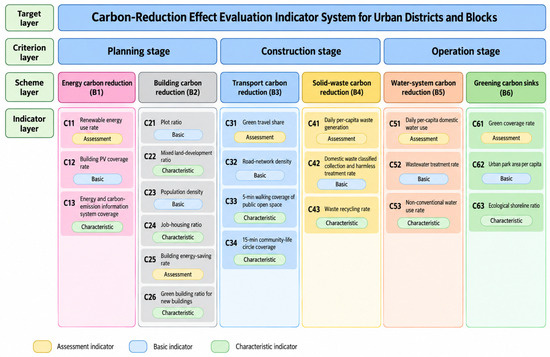
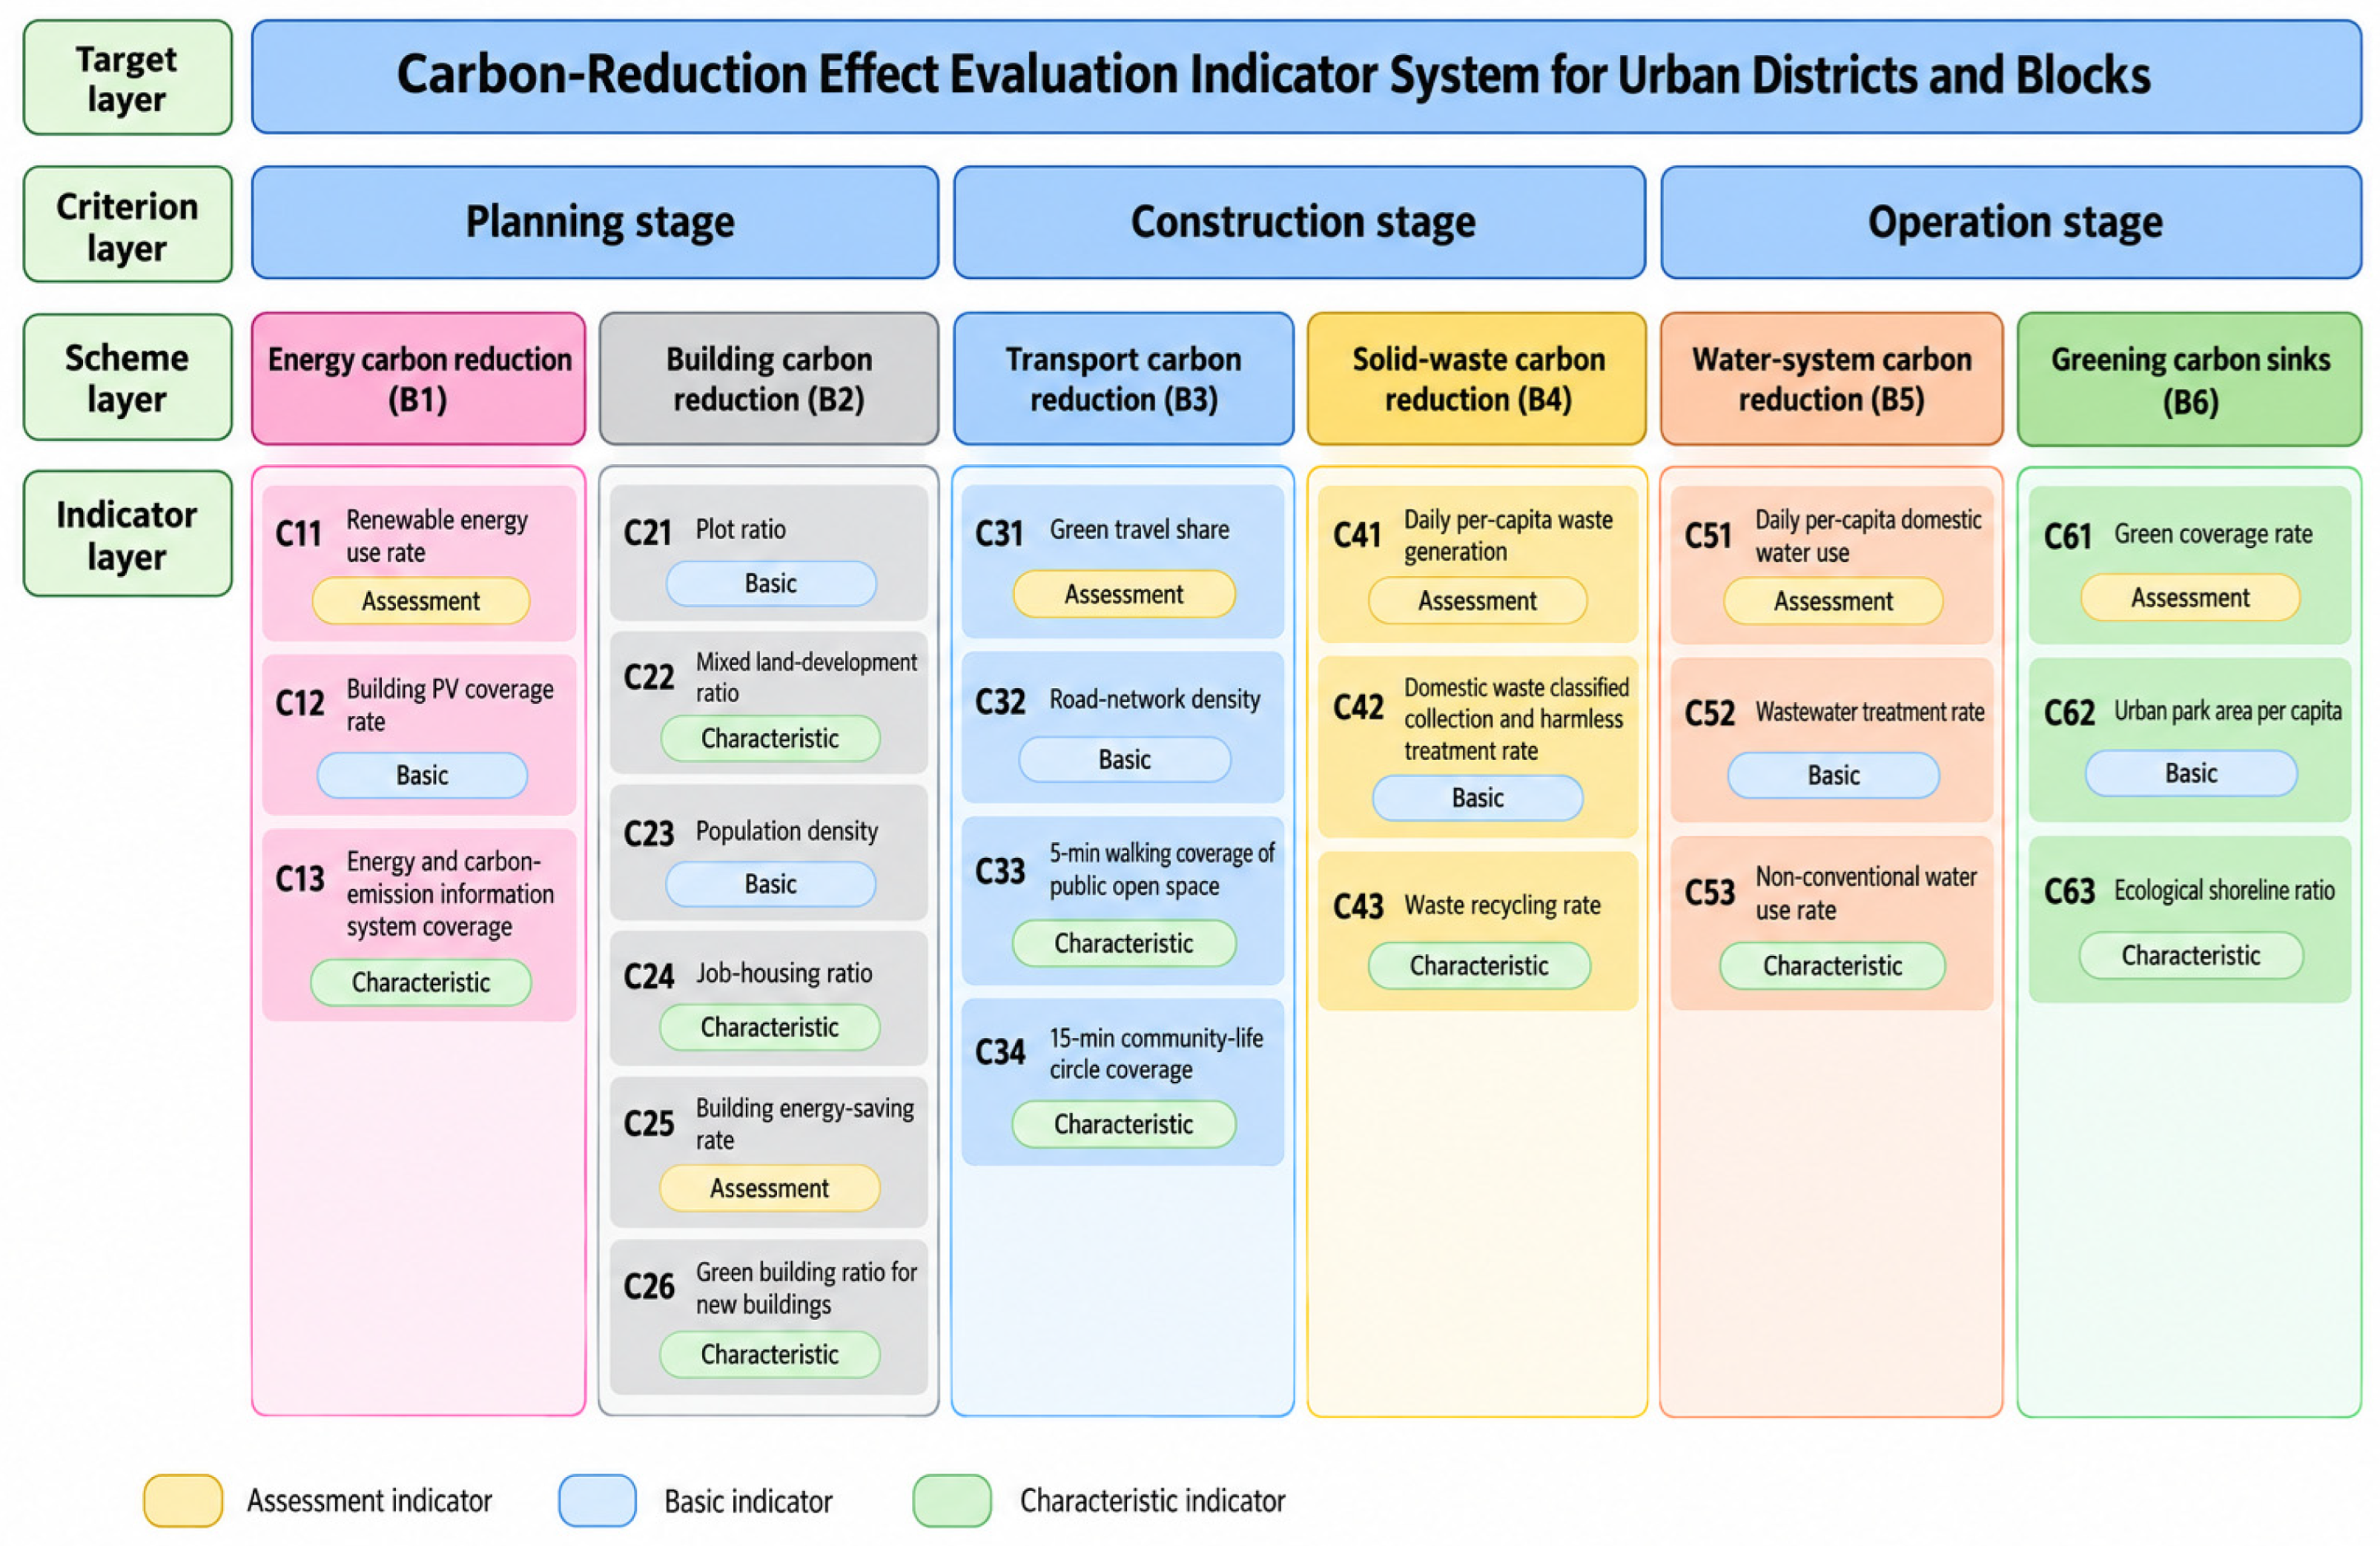
The carbon-reduction performance evaluation indicator system constructed in this study comprises six basic categories—energy, buildings, transportation, solid waste, water systems, and greening carbon sinks—and 22 secondary indicators (Figure 2). The energy field comprises three indicators: renewable energy use rate, building photovoltaic coverage rate, and coverage rate of the energy and carbon-emission information management system. The building field comprises six indicators: plot ratio, mixed land-development ratio, population density, jobs–housing ratio, building energy-saving rate, and green-building ratio for new buildings. The transportation field comprises four indicators: green-travel share, road-network density, 5 min walking coverage of public open space, and 15 min community-life-circle coverage. The solid-waste field comprises three indicators: daily per-capita waste generation, classified collection and harmless treatment rate of domestic waste, and waste recycling rate. The water-system field comprises three indicators: per-capita daily domestic water use, sewage-treatment rate, and non-conventional water utilization rate. Greening carbon sinks comprise three indicators: green coverage rate, per-capita urban park area, and ecological shoreline ratio.
Figure 2.
Comprehensive evaluation indicator system for block-scale carbon-reduction performance.
To improve implementability, the indicator structure was further optimized by classifying indicators as basic, assessment, and characteristic indicators. Seven basic indicators, such as road-network density and building population density, reflect existing low-carbon and ecological control requirements in territorial spatial master plans and detailed regulatory plans and are closely related to baseline carbon-emission accounting. They characterize the basic level and minimum requirements of low-carbon block development. Six assessment indicators, such as renewable energy use rate and building energy-saving rate, can be linked to carbon-emission calculation models [1,14,21] and are key indicators for directly quantifying carbon-reduction performance. They support both integrated evaluation of overall block-level carbon-reduction performance and field-specific evaluation of emission-reduction effects. Nine characteristic indicators, such as the green-building ratio for new buildings and 15 min community-life-circle coverage, closely follow green and low-carbon policy orientations, highlight people-centered development, and encourage innovative applications of low-carbon technologies. These indicators are differentiated indicators highly related to block-scale carbon-reduction pathways and are used to reflect the distinctive advantages and innovative practices of different blocks in low-carbon development.
3.2. Validation of Low-Carbon Block Indicators
This study established a four-stage validation procedure to verify the policy relevance, forward-lookingness, applicability, and operability of the selected indicators from the perspectives of theoretical support, policy benchmarking, engineering application, and quantitative calculation. This procedure ensures that each selected core indicator has a solid scientific basis, a clear policy orientation, reliable application value, and an implementable accounting pathway. The renewable energy use rate is used below as an example to demonstrate the validation process.
From the perspective of theoretical support and policy consistency, the national guideline for evaluating low-carbon development levels of cities and communities provides a standards basis for constructing block-scale low-carbon indicators [21]. For energy and renewable-energy indicators, ISO 16745-1:2017 provides a carbon-metric framework for buildings during the use stage, and life-cycle studies of wind-power projects show that replacing fossil-energy supply with renewable energy can substantially reduce carbon emissions [41,42]. These sources support the inclusion of renewable energy use rate, building photovoltaic coverage, and energy and carbon-emission information management coverage as quantifiable energy-system indicators.
For building-related indicators, studies on residential block form and urban form show that plot ratio, density, land-use mix, green-space configuration, and building energy performance influence block-scale building emissions [14,43]. OECD work on urban building decarbonization further emphasizes renovation of existing building stock and improvement of building performance as core governance levers [44]. These findings support the inclusion of plot ratio, mixed land-development ratio, population density, jobs-housing ratio, building energy-saving rate, and green-building ratio for new buildings.
For resource and carbon-sink indicators, municipal solid-waste recycling has measurable greenhouse gas mitigation potential [44], and urban green spaces provide aboveground carbon storage that supports climate mitigation at city and block scales [45]. Neighborhood-renovation research also shows that integrated evaluation of energy, buildings, and community-scale retrofit measures can support phased decarbonization pathways [46]. These findings support the inclusion of solid-waste resource utilization, water-resource intensity, green coverage, and wetland retention as coordinated indicators in the low-carbon block system.
At the quantitative-accounting level, the renewable energy use rate is calculated using Equation (5). Both the total amount of renewable energy utilized and the total primary energy consumption are quantifiable parameters, making the calculation convenient and operable.
Renewable energy use rate = renewable energy utilized/total primary energy consumption
3.3. Weighting of the Low-Carbon Block Indicator System
As shown in Table 4, among the six primary indicators, the building field has the largest weight, reaching 40.30%, and is the core influencing dimension of low-carbon block development. Buildings are the main carriers of block-scale carbon emissions, and their life-cycle energy consumption and embodied carbon constitute the main portion of block-scale emissions. Building form, energy-saving design, and operation and maintenance levels affect the foundation and emission-reduction potential of low-carbon block development [14,43]. At the same time, the large stock of existing buildings and their stable energy demand make low-carbon renovation a key lever for block-scale decarbonization, exerting a decisive influence on overall low-carbon construction performance [44]. The energy system accounts for 29.77% of the weight. Increasing the share of renewable energy and optimizing the energy-supply structure are key pathways for reducing carbon emissions at the source [41]. The widespread adoption and efficient consumption of distributed clean energy can effectively reduce dependence on fossil energy and continuously lower the carbon intensity of block energy use, providing important support for long-term low-carbon operation [42,47]. Together, the building and energy systems account for more than 70.07% of the total weight and therefore form the core body of the low-carbon block emission-reduction system. By contrast, the water system (2.44%) and solid-waste system (3.93%) have smaller weights and limited direct impacts on block-scale carbon emissions. Nevertheless, from the perspective of coordinated whole-system low-carbon governance and full-process low-carbon control, both are indispensable components of low-carbon block development. Intensive water-resource utilization and low-carbon wastewater treatment can reduce indirect emissions from municipal operations. Waste classification, treatment, and recycling can effectively reduce greenhouse gas emissions from landfill and incineration and lower the energy consumption of resource regeneration, offering stable indirect emission-reduction potential [45].
Table 4.
Weights of low-carbon block indicators.
Among the 22 secondary indicators, renewable energy use rate (21.89%), green-building ratio for new buildings (15.09%), and green coverage rate (13.30%) rank as the top three, with a cumulative weight exceeding 50%; they are therefore the core elements for improving the quality of low-carbon block development. The renewable energy use rate reflects the degree of decarbonization of the energy supply at the urban-block scale. Increasing this rate is an important means of reducing dependence on fossil fuels and mitigating operational carbon emissions. The green-building ratio for new buildings reflects the overall performance of the building sector in terms of energy efficiency, resource utilization, and environmental quality and is a key indicator for guiding the transition toward low-carbon urban blocks. The green coverage rate reflects the contribution of urban vegetation to ecological carbon sequestration. Increasing green coverage can enhance carbon uptake and partially offset carbon emissions generated by human activities within the urban block. As a nature-based measure, urban greening can provide sustained carbon-sequestration benefits while generating additional environmental co-benefits. It therefore complements source-oriented emission-reduction measures and contributes to a multidimensional mitigation framework that integrates source reduction with ecological sequestration [46]. By quantifying the relative importance of indicators at different hierarchical levels, this study distinguishes primary intervention areas from supporting elements and identifies priorities for implementation and governance. The results provide a quantitative basis for low-carbon urban-block planning, regeneration, strategy implementation, and refined carbon management.
3.4. Carbon-Reduction Performance Evaluation and Management Case for the Selected Block in Guangzhou
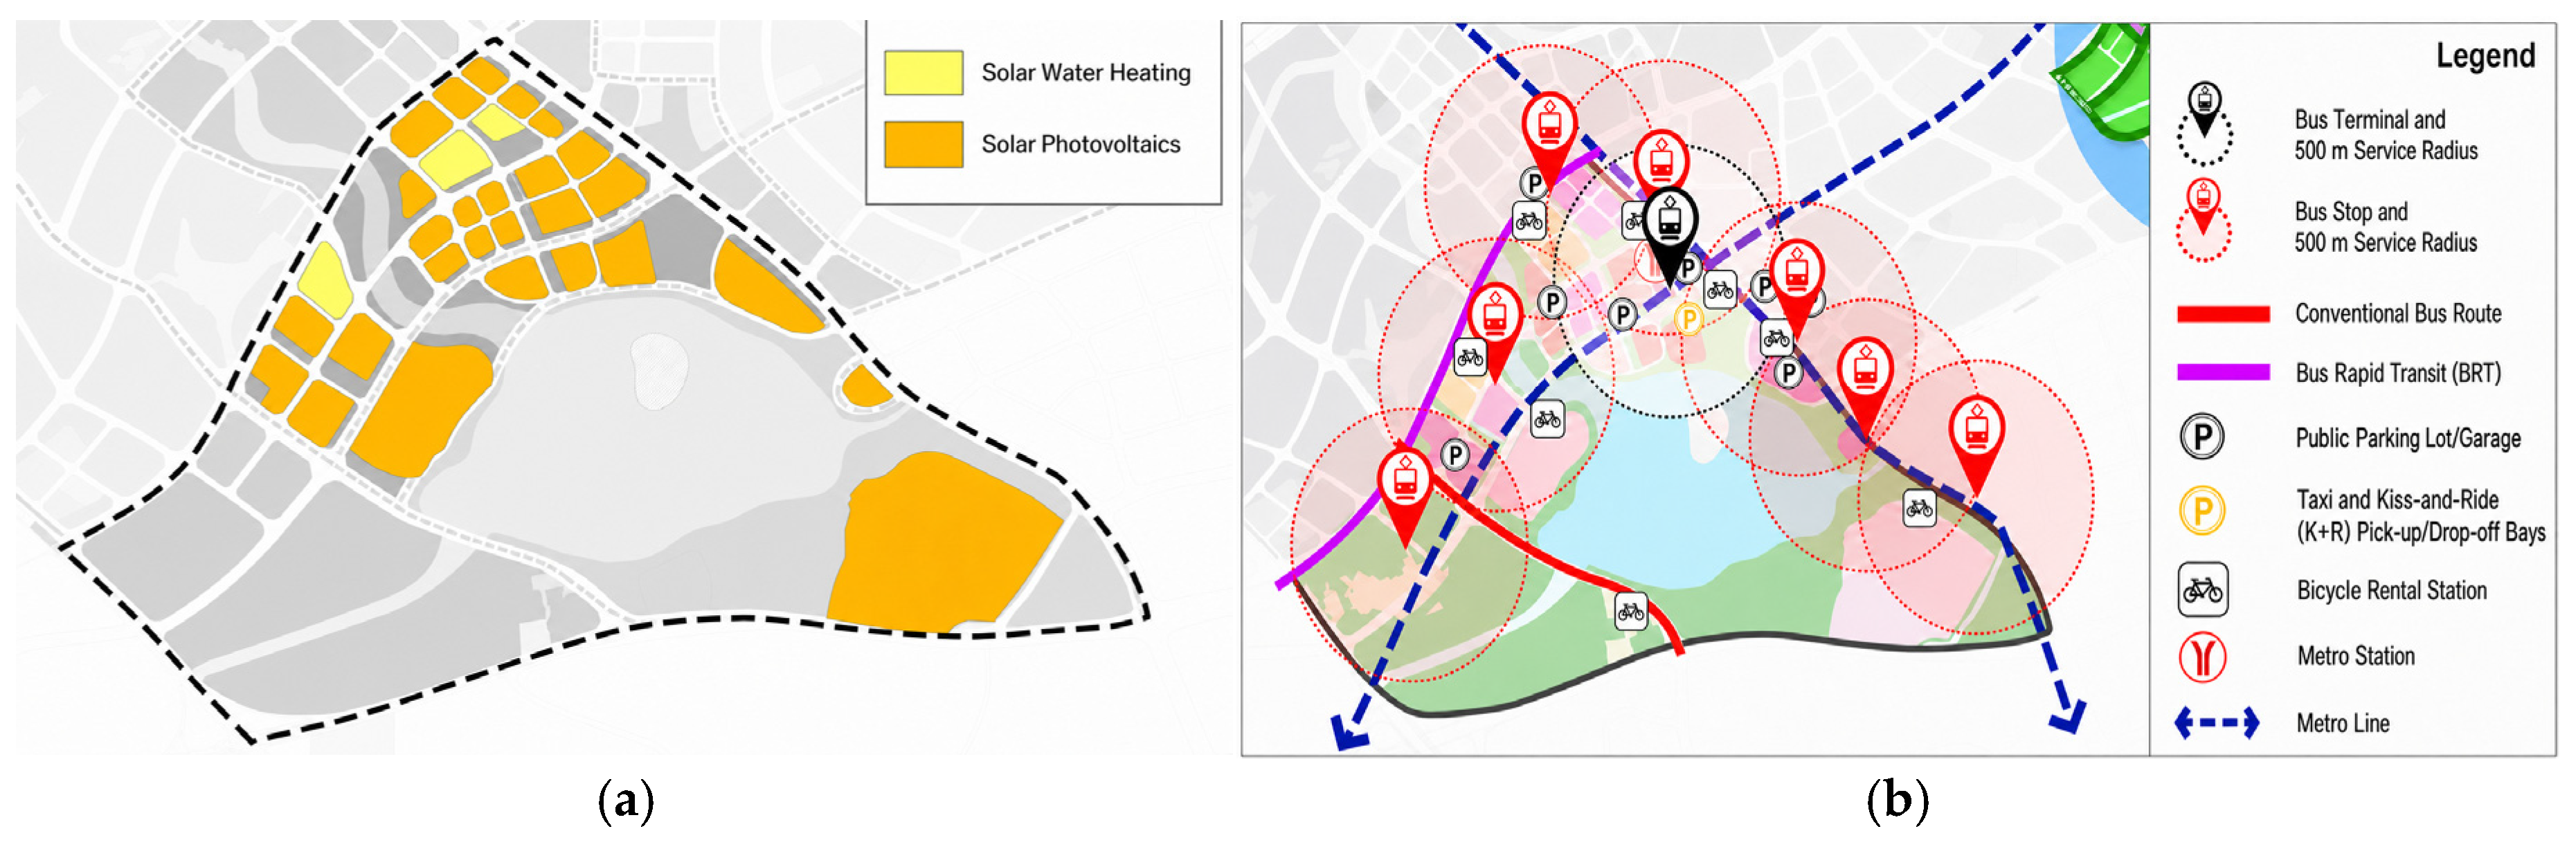
Combining the 2020 baseline planning scheme, the annual carbon emissions of the selected block in Guangzhou were 129,467 tCO2, with the building sector accounting for the highest share, approximately 87.39%. To further enhance carbon-reduction intensity, a coordinated package of multi-system, block-level carbon-reduction measures had been implemented by 2025 around six dimensions, namely spatial planning, building performance, energy systems, transport organization, resource recycling, and ecological carbon sinks, as shown in Figure 3. At the spatial-planning level, the project adopted a climate-adaptive layout, increasing the proportion of blue–green space to 87.80% and optimizing the regional thermal environment through a waterfront high-density plus inland low-density pattern. Building operation energy consumption was effectively reduced through energy-saving design. Two-star green-building standards were implemented across the whole area, and the proportion of three-star green buildings increased to 34%. In the energy system, an intelligent district cooling network was implemented. Based on the spatial distribution of cooling loads and the construction phasing, the block was divided into eight cooling-service zones. Cooling stations, distribution pipelines, and building-side terminals were integrated through a centralized control platform, which monitored system operating parameters and adjusted equipment operation in response to actual cooling demand, thereby improving the matching of energy supply and demand. Building-integrated photovoltaics were promoted, increasing rooftop PV coverage of new buildings by 6% and raising the regional renewable energy use rate by 5.4%. A low-carbon transport system integrating rail transit, public transportation, and slow mobility was established, increasing the regional green-travel rate from 68.10% to 78.13%. A three-level waste collection, transportation, and points-based management system was established, reducing daily per-capita waste generation from 0.85 kg to 0.80 kg. Through the popularization of water-saving facilities and the use of non-traditional water sources, the non-traditional water-source utilization rate increased from 8% to 17%, and per-capita water consumption decreased by 18.75%. Supported by a 40% green-space ratio and 100% wetland retention, ecological carbon-sink capacity was significantly enhanced, and the overall carbon-sink level is expected to increase by 20%, achieving multidimensional coordinated low-carbon development.
Figure 3.
Spatial distribution of low-carbon planning measures. (a) Solar energy applications, and (b) public transport network and 500 m service coverage.
As shown in Table 5, Through the systematic implementation of the above measures, the annual net carbon emissions of the case-study urban block in Guangzhou decreased to 95,016 tCO2 by 2025, representing a reduction of 26.61%. Per-capita carbon emissions declined from 4.17 tCO2/year to 3.06 tCO2/year, which was 42%~47% lower than the Guangzhou average of 5.3~5.8 tCO2/year. In terms of contributions to the overall reduction, improvements in building energy efficiency and the promotion of green buildings contributed 19.47%, while renewable energy utilization and smart cooling within the energy system contributed 5.16%. Transport optimization, water-resource management, solid-waste treatment, and enhanced carbon sinks contributed 0.52%, 0.13%, 0.51%, and 0.83%, respectively. These results indicate a multi-pathway mitigation pattern dominated by building energy conservation and energy-system optimization, with coordinated support from other sectors.
Table 5.
Carbon-reduction performance of the selected block in Guangzhou (unit: tCO2/year).
Using the comprehensive carbon-reduction evaluation model constructed in this study, direction-adjusted changes in the selected indicators between 2020 and 2025 were aggregated using their corresponding weights, as shown in Table 6. The CCI reached 0.9924 in 2025, exceeding the threshold of 0.1 and indicating substantial aggregate improvement relative to the 2020 baseline. Through multidimensional pathways including building energy conservation, clean-energy utilization, low-carbon transportation, intensive water-resource use, solid-waste recycling, and ecological carbon sinks, the approach demonstrates strong feasibility and effectiveness. As planning and construction continue to be implemented, the low-carbon governance system of the block is being continuously improved, and the emission-reduction benefits show a steadily increasing trend, effectively verifying the practical value and application advantages of the multi-system coordinated carbon-reduction model in low-carbon block development.
Table 6.
Comprehensive evaluation results for carbon-reduction performance in the selected block in Guangzhou.
4. Discussion
Urban blocks constitute an important spatial scale, linking building-level technical measures with citywide carbon governance. They can accommodate the coordinated optimization of buildings, energy, transportation, and municipal infrastructure while maintaining relatively well-defined spatial boundaries and management responsibilities. Neighborhood sustainability assessment tools such as LEED-ND, BREEAM Communities, and CASBEE-UD have established systematic evaluation frameworks. However, previous reviews have identified several persistent limitations, including imbalanced coverage of evaluation dimensions, insufficient transparency in scoring and weighting procedures, and limited adaptability to local conditions [8,19]. Nevertheless, the use of measurable indicators and the capacity to identify planning and design priorities remain important strengths of such tools in supporting urban sustainability transitions [48]. Wang et al. developed a low-carbon neighborhood indicator system covering spatial planning, transportation, buildings, the environment, and municipal infrastructure, thereby providing a basis for evaluating “carbon-source control and carbon-sink enhancement” at the neighborhood scale in China [49]. Building on this work, the present study compiled a candidate indicator library from domestic and international standards, policies, and representative cases. Following indicator cleaning and four-dimensional validation, an evaluation system comprising six primary indicators and 22 secondary indicators was established. AHP-derived weights and the CCI were then used to integrate indicator performance, relative importance, and actual emission-reduction performance. Consequently, the framework not only evaluates overall mitigation performance but also identifies specific intervention priorities, including the renewable energy use rate, building energy-saving rate, and green coverage rate. It therefore provides a quantitative basis for planning and design, technology selection, and implementation management. Application to the Guangzhou case demonstrated that the method can support a continuous analytical process encompassing baseline identification, priority-sector determination, mitigation-pathway selection, and implementation-performance evaluation. However, indicator weights should not be transferred directly between urban blocks because climatic conditions, functional composition, development intensity, energy structure, and infrastructure provision may differ substantially. Ameen and Mourshed similarly found that indicator priorities and weights determined by local stakeholders may differ significantly from those embedded in international assessment tools [50]. Accordingly, the proposed framework should be locally calibrated before being applied to urban blocks with different physical, socioeconomic, or institutional contexts.
This study has two main limitations. First, candidate indicators were identified and screened primarily on the basis of standards, case-study materials, and the professional judgment of the research team. Local governments, developers, operators, and residents were not formally involved in the indicator-selection process. Expert participation was mainly limited to AHP-based weighting and therefore cannot fully represent stakeholder perspectives on policy implementation, construction costs, operation and maintenance, user experience, and social equity. Previous studies have shown that multi-stakeholder participation can integrate diverse forms of knowledge and competing value priorities, thereby improving the local relevance, transparency, and social acceptance of assessment tools [51,52,53]. Second, the proposed method was applied to only one demonstration urban block, characterized by stringent green-building requirements, a relatively comprehensive low-carbon technology system, and a high proportion of blue–green space. The findings should therefore be interpreted as an initial validation of methodological feasibility and engineering applicability rather than as evidence that can be generalized to all urban blocks. Future research should involve government agencies, developers, operators, and residents in jointly validating indicator selection and weighting. Comparative applications should also be conducted across newly developed urban blocks, existing urban areas, older residential neighborhoods, and industrial districts. Long-term monitoring, sensitivity analysis of indicator weights, and uncertainty analysis will be required to further assess the robustness and applicability of the proposed evaluation system.
5. Conclusions
To address the insufficient coordination among multiple systems, unclear governance priorities, and overreliance on carbon emissions as a single evaluation criterion in existing low-carbon urban-block research, this study developed an evaluation indicator system covering six domains: energy, buildings, transportation, solid waste, water systems, and carbon sinks. Indicator weights were determined using the analytic hierarchy process and expert judgments, after which a comprehensive evaluation method based on the composite carbon-reduction evaluation index was established. Finally, the feasibility of the proposed method was examined through its application to an urban block in Guangzhou, China. The main conclusions are as follows:
- (1)
- A multi-system evaluation indicator framework for coordinated carbon reduction at the urban-block scale was established. The framework comprises six primary indicators and 22 secondary indicators, which were classified as basic, evaluative, or characteristic indicators. The indicators were validated across four dimensions: theoretical support, policy alignment, engineering applicability, and quantitative measurability. The resulting framework can identify the key elements of low-carbon urban-block development and provide a methodological basis for comprehensive evaluation throughout the planning, construction, and operation stages.
- (2)
- The comprehensive benefits of coordinated multi-system carbon reduction were quantified. Through the coordinated optimization of buildings, energy, transportation, water systems, solid waste, and carbon sinks, the annual net carbon emissions of the case-study urban block decreased from 129,467 tCO2 in 2020 to 95,016 tCO2 in 2025, representing a cumulative reduction of 26.61%. Per-capita carbon emissions were 42–47% lower than the Guangzhou average over the corresponding period. Improvements in the building and energy sectors contributed 19.47 and 5.16 percentage points to the overall reduction, respectively, while enhanced carbon sinks contributed a further 0.83 percentage points.
- (3)
- The CCI-based graded evaluation model addresses the limitations of assessments relying solely on carbon-emission totals or intensities. In 2025, the CCI of the case-study urban block reached 0.9924, substantially exceeding the threshold of 0.1 for significant carbon reduction. By integrating indicator performance, relative indicator importance, and carbon-reduction outcomes within a unified framework, the method can support the identification of mitigation priorities, the evaluation of implementation performance, and the optimization of technical strategies. It therefore provides a quantitative tool for refined carbon management at the urban-block scale.
The proposed indicator system and comprehensive evaluation method clarify the key elements and implementation priorities of low-carbon urban-block development. The case application provides initial evidence of the method’s feasibility and engineering applicability. The framework can also provide methodological support and practical guidance for low-carbon planning, implementation evaluation, technology optimization, and refined carbon management in comparable mixed-use urban blocks.
Supplementary Materials
The following supporting information can be downloaded at: https://www.mdpi.com/article/10.3390/buildings16193785/s1, Table S1: Summary of Consistency Results for the Judgment Matrices; Table S2.1. Candidate Pairwise Comparison Matrix and Weights at the Primary-Criterion Level; Table S2.2. Column-Normalized Matrix at the Primary-Criterion Level; Table S3.1. Candidate Pairwise Comparison Matrix and Weights for Energy; Table S3.2. Column-Normalized Matrix for Energy; Table S4.1. Candidate Pairwise Comparison Matrix and Weights for Buildings; Table S4.2. Column-Normalized Matrix for Buildings; Table S5.1. Candidate Pairwise Comparison Matrix and Weights for Buildings; Table S5.2. Column-Normalized Matrix for Buildings; Table S6.1. Candidate Pairwise Comparison Matrix and Weights for Solid Waste; Table S6.2. Column-Normalized Matrix for Solid Waste; Table S7.1. Candidate Pairwise Comparison Matrix and Weights for the Water System; Table S7.2. Column-Normalized Matrix for the Water System; Table S8.1. Candidate Pairwise Comparison Matrix and Weights for the Water System; Table S8.2. Column-Normalized Matrix for the Water System.
Author Contributions
L.Z. (Lining Zhou), conceptualization, investigation, visualization, formal analysis, and writing—original draft; Y.J., methodology and writing—review and editing; Q.W., funding acquisition and project administration; H.Z., resources and data curation; Q.C., funding acquisition, supervision, validation; L.Z. (Liangji Zheng), writing—review and editing; R.G., project administration. All authors have read and agreed to the published version of the manuscript.
Funding
This work was financially supported by the National Key Research and Development Program of China under the project “Application Demonstration of Key Technologies for Low-Carbon Urban Development Toward Carbon Neutrality” (Grant No. 2023YFC3807700).
Data Availability Statement
The original contributions presented in the study are included in the article, further inquiries can be directed to the corresponding author.
Acknowledgments
We would like to thank Cheng Guo for contributing valuable suggestions during the revision of this manuscript.
Conflicts of Interest
The authors declare that the research was conducted in the absence of any commercial or financial relationships that could be construed as a potential conflict of interest.
References
- IPCC. Climate Change 2023: Synthesis Report; Core Writing Team; Lee, H., Romero, J., Eds.; Contribution of Working Groups I, II and III to the Sixth Assessment Report of the Intergovernmental Panel on Climate Change; IPCC: Geneva, Switzerland, 2023; pp. 35–115. [Google Scholar] [CrossRef] [Scilit]
- UN-Habitat. The Strategic Plan 2020–2023; United Nations Human Settlements Programme: Nairobi, Kenya, 2019; Available online: https://unhabitat.org/the-strategic-plan-2020-2023 (accessed on 30 May 2026).
- UN-Habitat. Urban Climate Action: The Urban Content of the NDCs-Global Review 2022; United Nations Human Settlements Programme: Nairobi, Kenya, 2022; Available online: https://unhabitat.org/urban-climate-action-the-urban-content-of-the-ndcs-global-review-2022 (accessed on 30 May 2026).
- Ramaswami, A.; Hillman, T.; Janson, B.; Reiner, M.; Thomas, G. A Demand-Centered, Hybrid Life-Cycle Methodology for City-Scale Greenhouse Gas Inventories. Environ. Sci. Technol. 2008, 42, 6455–6461. [Google Scholar] [CrossRef] [Scilit] [PubMed]
- Kennedy, C.; Steinberger, J.; Gasson, B.; Hansen, Y.; Hillman, T.; Havránek, M.; Pataki, D.; Phdungsilp, A.; Ramaswami, A.; Villalba Mendez, G. Greenhouse Gas Emissions from Global Cities. Environ. Sci. Technol. 2009, 43, 7297–7302. [Google Scholar] [CrossRef] [Scilit] [PubMed]
- Keirstead, J.; Jennings, M.; Sivakumar, A. A Review of Urban Energy System Models: Approaches, Challenges and Opportunities. Renew. Sustain. Energy Rev. 2012, 16, 3847–3866. [Google Scholar] [CrossRef] [Scilit]
- Reinhart, C.F.; Cerezo Davila, C. Urban Building Energy Modeling-A Review of a Nascent Field. Build. Environ. 2016, 97, 196–202. [Google Scholar] [CrossRef] [Scilit]
- Sharifi, A.; Murayama, A. A Critical Review of Seven Selected Neighborhood Sustainability Assessment Tools. Environ. Impact Assess. Rev. 2013, 38, 73–87. [Google Scholar] [CrossRef] [Scilit]
- Komeily, A.; Srinivasan, R.S. A Need for Balanced Approach to Neighborhood Sustainability Assessments: A Critical Review and Analysis. Sustain. Cities Soc. 2015, 18, 32–43. [Google Scholar] [CrossRef] [Scilit]
- Shan, Y.; Guan, Y.; Hang, Y.; Zheng, H.; Li, Y.; Guan, D.; Li, J.; Zhou, Y.; Li, L.; Hubacek, K. City-Level Emission Peak and Drivers in China. Sci. Bull. 2022, 67, 1910–1920. [Google Scholar] [CrossRef] [Scilit] [PubMed]
- Zeng, S.; Jin, G.; Tan, K.; Liu, X. Can Low-Carbon City Construction Reduce Carbon Intensity? Empirical Evidence from Low-Carbon City Pilot Policy in China. J. Environ. Manag. 2023, 332, 117363. [Google Scholar] [CrossRef] [Scilit] [PubMed]
- Olsson, J.A.; Hafez, H.; Miller, S.A.; Scrivener, K.L. Greenhouse Gas Emissions and Decarbonization Potential of Global Fired Clay Brick Production. Environ. Sci. Technol. 2025, 59, 1909–1920. [Google Scholar] [CrossRef] [Scilit] [PubMed]
- Li, L.; Yan, F. How Does Density Impact Carbon Emission Intensity: Insights from the Block Scale and an Optimal Parameters-Based Geographical Detector. Land 2024, 13, 1036. [Google Scholar] [CrossRef] [Scilit]
- Lian, H.; Zhang, J.; Li, G.; Ren, R. The Relationship between Residential Block Forms and Building Carbon Emissions to Achieve Carbon Neutrality Goals: A Case Study of Wuhan, China. Sustainability 2023, 15, 15751. [Google Scholar] [CrossRef] [Scilit]
- Zheng, Y.; Li, W.; Jiang, L.; Yuan, C.; Xiao, T.; Wang, R.; Cai, M.; Hong, H. Spatial Modelling of Street-Level Carbon Emissions with Multi-Source Open Data: A Case Study of Guangzhou. Urban Clim. 2024, 55, 101974. [Google Scholar] [CrossRef] [Scilit]
- Xu, M.; Zhong, Y.; Ye, Y. Towards Digitalized Urban Planning and Design of Low-Carbon Cities: Evolution and Application Review of Assessment Tools. Landsc. Archit. Front. 2024, 12, 9–21. [Google Scholar] [CrossRef] [Scilit]
- Wang, Q.; Sun, X.; Wang, R.; Zhou, L.; Zhou, H.; Di, Y.; Li, Y.; Zhang, Q. Research on Urban Energy Sustainable Plan under the Background of Low-Carbon Development. Sustainability 2023, 15, 14206. [Google Scholar] [CrossRef] [Scilit]
- Ameen, R.F.M.; Mourshed, M.; Li, H. A Critical Review of Environmental Assessment Tools for Sustainable Urban Design. Environ. Impact Assess. Rev. 2015, 55, 110–125. [Google Scholar] [CrossRef] [Scilit]
- Sharifi, A.; Dawodu, A.; Cheshmehzangi, A. Limitations in Assessment Methodologies of Neighborhood Sustainability Assessment Tools: A Literature Review. Sustain. Cities Soc. 2021, 67, 102739. [Google Scholar] [CrossRef] [Scilit]
- GB/T 51255-2017; Assessment Standard for Green Eco-District. China Architecture & Building Press: Beijing, China, 2017.
- GB/T 41152-2021; Sustainable Cities and Communities-Guides for Low-Carbon Development Evaluation. Standards Press of China: Beijing, China, 2021.
- DB1331/T 040-2023; Standard for Green Urban Area Planning and Design of Xiong’ an New Area. Hebei Xiong’ an New Area Administrative Committee: Xiong’ an, China, 2023.
- T/CECS 1145-2022; Standard for Green Planning and Design of New Urban Area. China Association for Engineering Construction Standardization: Beijing, China, 2022.
- DB1331/T 041-2023; Standard for Green Block Planning and Design of Xiong’ an New Area. Hebei Xiong’ an New Area Administrative Committee: Xiong’ an, China, 2023.
- DB11/T 1371-2016; Technical Guidelines for Low-Carbon Community Assessment. Beijing Municipal Administration of Quality and Technology Supervision: Beijing, China, 2016.
- T/TJSES 004-2022; Guidelines for Zero-Carbon Community Identification and Evaluation. Tianjin Society of Environmental Sciences: Tianjin, China, 2022.
- Shanghai Municipal Commission of Housing and Urban-Rural Development and Management. New Town Low-Carbon Block Implementation Guideline (Pilot Edition); Shanghai Municipal Commission of Housing and Urban-Rural Development and Management: Shanghai, China, 2022. Available online: https://zjw.sh.gov.cn/cmsres/89/89d3b7e3d4ac44e5953e7a9b394f216f/153deb46fa98744ad20f28503846a520.pdf (accessed on 22 July 2026).
- U.S. Green Building Council (USGBC). LEED v4 for Neighborhood Development. Available online: https://www.usgbc.org/leed/rating-systems/neighborhood-development (accessed on 22 July 2026).
- SD202-1.2:2012; BREEAM Communities Technical Manual. BRE Global Ltd.: Watford, UK, 2017. Available online: https://breeam.com/standards/communities (accessed on 22 July 2026).
- Cole, R.J.; Larsson, N.K. GBC‘ 98 and GBTool: Background. Build. Res. Inf. 1999, 27, 221–229. [Google Scholar] [CrossRef] [Scilit]
- DGNB GmbH. DGNB System-Criteria Set for Districts; Version 2020; DGNB GmbH: Stuttgart, Germany, 2020; Available online: https://www.dgnb.de/en/certification/districts (accessed on 22 July 2026).
- Krippendorff, K. Content Analysis: An Introduction to Its Methodology, 4th ed.; SAGE Publications: Thousand Oaks, CA, USA, 2018. [Google Scholar]
- OECD; European Union; European Commission Joint Research Centre. Handbook on Constructing Composite Indicators: Methodology and User Guide; OECD Publishing: Paris, France, 2008. [Google Scholar] [CrossRef] [Scilit]
- Xiong, X.Y.; Li, Y.Z. Comprehensive Evaluation of Urban Low-Carbon Economy Based on Grey Correlation. In Proceedings of the 2015 Conference on Informatization in Education, Management and Business; Atlantis Press: Amsterdam, The Netherlands, 2015. [Google Scholar] [CrossRef] [Scilit][Green Version]
- QSR International. Word Frequency Query-NVivo Help. Available online: https://help-nv.qsrinternational.com/15/win/Content/queries/word-frequency-query.htm (accessed on 22 July 2026).
- Chang, W.; Yang, L.; Zhang, W.W.; Wang, G.; Li, B.; Meng, S. Research on Evaluation Index System of Low-Carbon Existing Communities. Int. J. Nat. Resour. Environ. Stud. 2024, 2, 248–257. [Google Scholar] [CrossRef] [Scilit]
- Saaty, T.L. Decision Making with the Analytic Hierarchy Process. Int. J. Serv. Sci. 2008, 1, 83–98. [Google Scholar] [CrossRef] [Scilit]
- Li, L.; Liu, F.; Li, C. Customer Satisfaction Evaluation Method for Customized Product Development Using Entropy Weight and Analytic Hierarchy Process. Comput. Ind. Eng. 2014, 77, 80–87. [Google Scholar] [CrossRef] [Scilit]
- Yu, X.; Zhao, W.; Wang, W. Evaluation Methodology and Empirical Analysis of Carbon Emission Reduction Effect of Dual-Carbon Policy. Sustain. Energy Res. 2025, 12, 15. [Google Scholar] [CrossRef] [Scilit]
- GB 55015-2021; General Code for Energy Efficiency and Renewable Energy Application in Buildings. China Architecture & Building Press: Beijing, China, 2021.
- ISO 16745-1:2017; Sustainability in Buildings and Civil Engineering Works—Carbon Metric of an Existing Building during Use Stage—Part 1: Calculation, Reporting and Communication. International Organization for Standardization (ISO): Geneva, Switzerland, 2017.
- Li, J.; Li, S.; Wu, F. Research on Carbon Emission Reduction Benefit of Wind Power Project Based on Life Cycle Assessment Theory. Renew. Energy 2020, 155, 456–468. [Google Scholar] [CrossRef] [Scilit]
- Liu, Z.; Xu, Q.; Lyu, S.; Yang, R.; Wan, Z. A Review of the Impact of Urban Form on Building Carbon Emissions. Buildings 2025, 15, 2604. [Google Scholar] [CrossRef] [Scilit]
- OECD. Decarbonising Buildings in Cities and Regions; OECD Publishing: Paris, France, 2022. [Google Scholar] [CrossRef] [Scilit]
- Franchetti, M.; Kilaru, P. Modeling the Impact of Municipal Solid Waste Recycling on Greenhouse Gas Emissions in Ohio, USA. Resour. Conserv. Recycl. 2012, 58, 107–113. [Google Scholar] [CrossRef] [Scilit]
- Sun, Y.; Xie, S.; Zhao, S. Valuing Urban Green Spaces in Mitigating Climate Change: A City-Wide Estimate of Aboveground Carbon Stored in Urban Green Spaces of China’s Capital. Glob. Change Biol. 2019, 25, 1717–1732. [Google Scholar] [CrossRef] [Scilit] [PubMed]
- Alakavuk, E.; Cinar Umdu, D.; Koyuncu, A.; Baro, N.D. Neighborhood Renovation for Reaching EU Targets with Smart Analysis on the Way to 2030 and 2035. Buildings 2026, 16, 1729. [Google Scholar] [CrossRef] [Scilit]
- Sharifi, A.; Dawodu, A.; Cheshmehzangi, A. Neighborhood sustainability assessment tools: A review of success factors. J. Clean. Prod. 2021, 293, 125912. [Google Scholar] [CrossRef] [Scilit]
- Wang, X.; Zhao, G.; He, C.; Wang, X.; Peng, W. Low-carbon neighborhood planning technology and indicator system. Renew. Sustain. Energy Rev. 2016, 57, 1066–1076. [Google Scholar] [CrossRef] [Scilit]
- Ameen, R.F.M.; Mourshed, M. Urban sustainability assessment framework development: The ranking and weighting of Iraqi indicators using analytic hierarchy process. Sustain. Cities Soc. 2019, 44, 356–366. [Google Scholar] [CrossRef] [Scilit]
- Reed, M.S. Stakeholder participation for environmental management: A literature review. Biol. Conserv. 2008, 141, 2417–2431. [Google Scholar] [CrossRef] [Scilit]
- Mascarenhas, A.; Nunes, L.M.; Ramos, T.B. Selection of sustainability indicators for planning: Combining stakeholders’ participation and data reduction techniques. J. Clean. Prod. 2015, 92, 295–307. [Google Scholar] [CrossRef] [Scilit]
- Martins, M.S.; Kalil, R.M.L.; Dalla Rosa, F. Community participation in the identification of neighbourhood sustainability indicators in Brazil. Habitat Int. 2021, 113, 102370. [Google Scholar] [CrossRef] [Scilit]

Disclaimer/Publisher’s Note: The statements, opinions and data contained in all publications are solely those of the individual author(s) and contributor(s) and not of MDPI and/or the editor(s). MDPI and/or the editor(s) disclaim responsibility for any injury to people or property resulting from any ideas, methods, instructions or products referred to in the content. |
© 2026 by the authors. Licensee MDPI, Basel, Switzerland. This article is an open access article distributed under the terms and conditions of the Creative Commons Attribution (CC BY) license.