


Abstract
Industrial lighting audits may combine heterogeneous measurements into performance scores without demonstrating whether the underlying evidence is sufficiently complete, representative, and traceable. This study proposes an evidence-aware multicriteria assessment framework that separates performance evaluation from evidence coverage. Visual, energy, and operational indicators are evaluated only when supporting evidence is available and an applicable criterion has been declared, while evidence quality is reported separately through an evidence-coverage measure. The methodology is illustrated using field records from an industrial research hall under daylight-only and mixed daylight/electric-light conditions. Because no representative whole-installation operating state, applicable task-plane grid, or circuit-level electrical campaign was available, the case is treated as a methodological illustration rather than a compliance assessment or full validation of the installation. The framework prevents non-equivalent records from being combined into a single performance criterion, distinguishes missing evidence from undeclared targets, and converts evidence gaps into a prioritized measurement-completion plan. In the case study, weighted evidence coverage is 36.0%, indicating that measurement completion rather than global performance classification is the immediate audit priority. The proposed approach improves the transparency, traceability, and defensibility of industrial lighting audits conducted under incomplete evidence.
1. Introduction
Industrial research and development spaces combine screen work, equipment inspection, test-bench adjustment, circulation, and occasional fine technical tasks. Illuminance alone does not represent visual comfort: industrial field studies and production-hall analyses also use luminance, glare, daylight variability, and occupant response [1,2,3,4] while a broader review shows that the selected metric must match the task, luminous scene, and subjective endpoint [5].
Energy assessment likewise requires more than installed lighting power density (LPD). Annual performance depends on schedules, occupancy, zoning, controls, daylight, maintenance, and actual circuit demand. Industrial audits and retrofit studies combine measurements with operational evidence and post-implementation verification [1,6]. The present framework therefore reports rated-power scenarios separately from measured energy and integrates them with visual and operational evidence only through declared weights and coverage.
1.1. Industrial Lighting in Modern Production Facilities
Hybrid industrial facilities combine production support, office, laboratory, and technical-bench functions. Daylight can reduce electric demand while increasing luminance contrasts and screen reflections; LED performance also depends on spacing, mounting, driver quality, maintenance, and the match between switching zones and daylight gradients. Recent parametric shading research further shows that daylight redistribution and electric-lighting energy reduction should be coordinated rather than assessed as independent measures [7].
The audit must therefore identify the activity and visual task before selecting a measurement plan. Each record requires location, height, detector orientation, view direction where relevant, time, daylight condition, and operating state. A point of reading is evidence for that point and instant; it is not a substitute for maintained-illuminance, uniformity, glare, or visual-comfort assessment over a prescribed grid.
1.2. Challenges in Industrial Lighting Audits
Three recurring difficulties motivate the present work. First, daylight changes during the measurement campaign, so an apparent off/on difference can only be attributed to electric lighting when both readings are made at the same point and sufficiently close in time. Second, mixed daylight and LED spectra influence correlated color temperature (CCT), color-rendering indices, and temporal-modulation readings; these quantities must be interpreted together with the operating state. Third, data completeness varies: an audit may contain strong photometric evidence, but only nominal power data or an incomplete maintenance inventory. Measurement reporting should therefore make uncertainty and coverage explicit [8,9,10].
Energy calculations introduce a related denominator problem. In a hall containing enclosed laboratories or non-served areas, dividing installed lighting power by the gross envelope can materially understate the density for the served workspace. ISO/CIE energy-performance methods provide a calculation structure [11,12], but the audited area, operating hours, and control factors still must be defined transparently.
1.3. Research Gap and Motivation
Existing approaches commonly optimize design, evaluate compliance, or estimate savings. Lighting studies demonstrate multicriteria selection and weighting at product and building scales [13,14,15,16], but field-oriented methods less often preserve record-level traceability while combining visual, energy, and operational evidence. Recent integrated building-performance research likewise emphasizes the joint treatment of energy, indoor environmental quality, controls, and the reliability of the evidence used for consequential decisions [17]. The methodological gap addressed here is not the formulation of an additional weighted aggregation model, but the explicit separation of supported performance from the completeness of the evidence used to assess it. Recent multi-objective daylighting studies likewise optimize daylight availability, uniformity and glare simultaneously [18]. Comparable conventions exist in energy auditing, measurement and verification, life-cycle inventory, and decision analysis under incomplete information; Section 4.5 states what the present coverage output adds to them.
Industrial sites can be local nocturnal emitters through yard, façade, security, and access lighting and through indoor light transmitted by glazing. Global night-sky and ecological literature establish the wider motivation for controlling artificial light at night [19,20,21], whereas local monitoring and front-luminance studies support installation-scale measurement [22,23]. The optional extension retains the local-audit logic of a defined contour, identified receptors, time-specific measurements, spatial mapping, and verified mitigation [22,23,24,25,26,27]. Technical emission mechanisms remain separate from human, ecological, or astronomical consequences unless receptor-specific evidence exists.
1.4. Contributions of the Proposed Methodology
The contribution is a field workflow that: (i) links records to tasks, geometry, time, and state; (ii) distinguishes screening from formal compliance; (iii) separates target declaration from evidence availability; (iv) reports performance, the weakest supported criterion, and evidence coverage separately; and (v) ranks completion and corrective actions. Visual comfort and local environmental-light measurements are specified as evidence-completion modules, not imputed results. The weighting structure can be re-elicited with AHP or another documented method when stakeholders and complete evidence are available [16,28,29].
2. Materials and Methods
2.1. Overall Multicriteria Audit Methodology
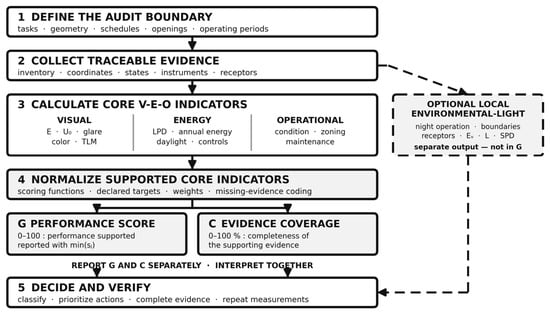
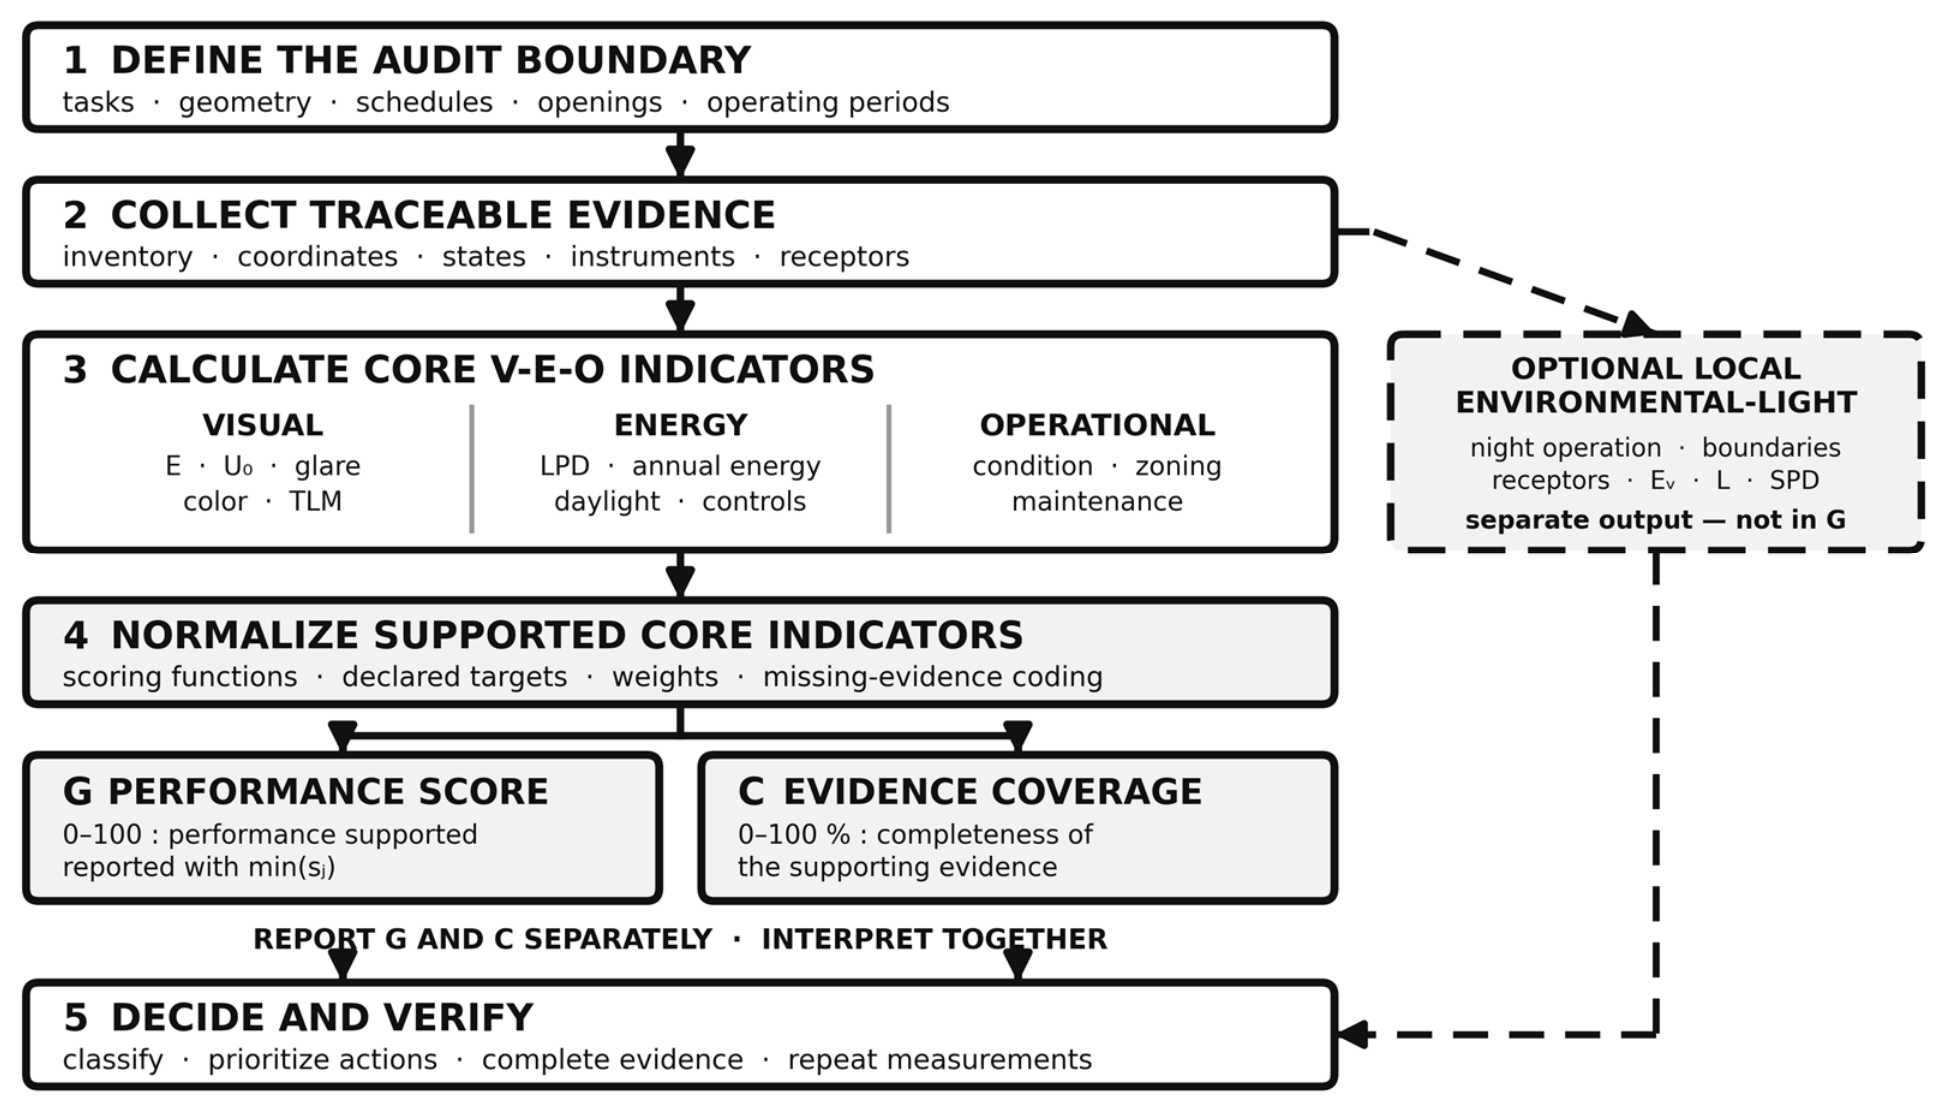
The workflow comprises five stages: (1) define the audit boundary and visual tasks; (2) collect traceable evidence, including the luminaire/circuit/control inventory and operating-state records; (3) calculate visual, energy, and operational indicators; (4) normalize only supported, target-declared indicators and report performance and evidence coverage separately; and (5) decide, prioritize completion or corrective actions, and verify them under repeatable conditions.
The protocol integrates traceable optical measurements, nominal equipment data, operating schedules, and operational observations. In this case study, circuit-level active power was not logged, so energy quantities are explicitly identified as rated-power scenarios rather than meter readings. This distinction is retained in the calculations and in the multicriteria evidence coding.
Scope is fixed before indicator selection. The core indoor audit contains visual, energy, and operational pillars. The local environmental-light pathway is activated for measurement by nocturnal operation, exterior emission, transmitted indoor light, or sensitive receptors. Activation does not authorize a score: the boundary, governing jurisdiction and environmental zone, exterior asset/control inventory, receptor set, assessment periods, admissible measurements, normalization criteria, and stakeholder weights must first be documented and validated.
2.2. Industrial Facility Characterization
The case study is an industrial research workspace used for monitor-based office tasks and electrical measurement and development benches (Table 1). The hall envelope is 30 m × 20 m (600 m2) and approximately 6 m high. The supplied source table identifies 600 m2 as both total and effectively illuminated area; this value is therefore retained as the sole quantitative area denominator. The plan shows central enclosed laboratories without measurement records and a two-deep perimeter luminaire ring (Figure 1). Because an as-built served-area boundary was not independently surveyed, no alternative area-normalized result is reported. Large side windows with protective shading create a strong, time-dependent daylight contribution.
Table 1.
Facility and operational characteristics used in the case study.
Figure 1.
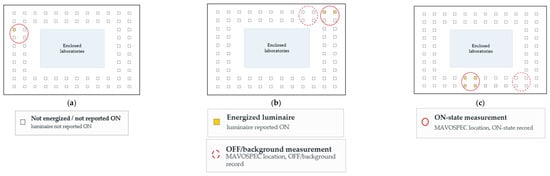
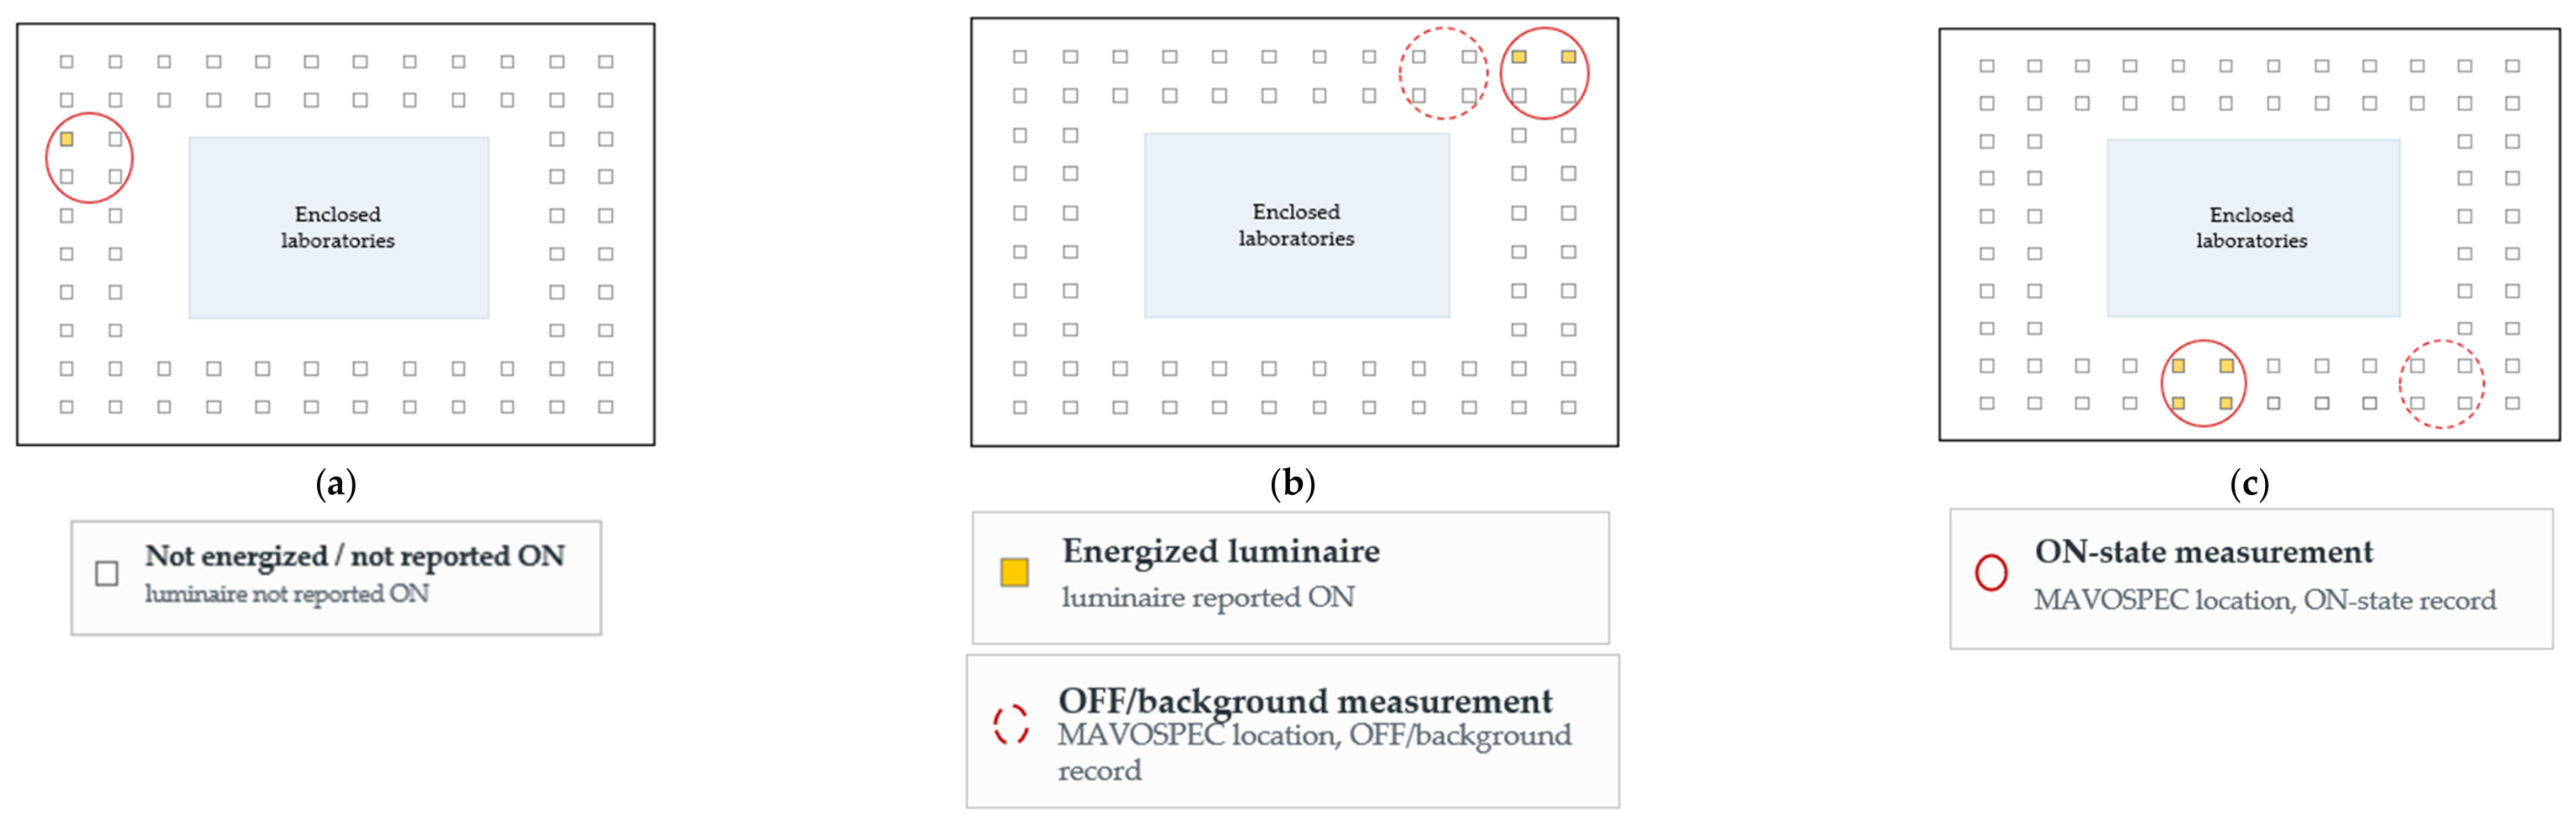
Reconstructed plan of the 30 m × 20 m hall shown as three non-simultaneous measurement configurations: (a) Z1, 10 July 2026; (b) Z2, 13 July 2026; and (c) Z3, 13 July 2026. Yellow squares denote luminaires reported ON, and empty squares denote luminaires not reported ON. Solid red circles identify MAVOSPEC ON-state measurement locations, whereas dashed red circles identify OFF/background measurement locations. Z1, Z2, and Z3 are measurement locations, not verified switching zones. The Z2 lit-state count remains unresolved: the reconstructed plan resolves two panels in the measured area, whereas the source notes report four switched luminaires. No quantitative result depends on selecting either count.
Figure 2 summarizes the five-stage core V-E-O workflow and separates criterion declaration from evidence quality . Performance is computed only for supported, target-declared indicators, whereas C summarizes weighted evidence completeness. The two outputs are reported separately but interpreted jointly. The optional environmental branch remains outside G in the present case.
Figure 2.
Evidence-aware industrial-lighting audit workflow. Criterion declaration and evidence quality are coded separately before supported indicators are normalized. Performance and evidence coverage C are reported separately but interpreted together. The optional environmental light branch remains unscored in the present case.
2.3. Lighting System Inventory
The reconstructed plan resolves 72 suspended 600 mm × 600 mm LED panels with a reported unit input of 36 W and nominal CCT of 4000 K, arranged as a two-deep perimeter ring on a 12 × 10 grid: 20 in the west arm, 20 in the east arm, 16 in the north band, and 16 in the south band (Table 2). The count follows the reconstructed plan, which resolves individual panel positions and is geometrically consistent with every recorded measurement coordinate; all installed power and energy figures reported below are derived from it. Panel positions in Figure 1 are schematic, and the inventory was not surveyed as-built, so the count is treated as reconstructed, and its confirmation is retained as a completion action. Because no circuit schedule was supplied, Z1, Z2, and Z3 are retained as measurement locations rather than as separately documented luminaire sub-inventories. The plan records one locally operating panel at the Z1 series point, two operating panels for the Z2 lit record, and four of the 16 south-band panels for the Z3 lit record. These are separate configurations, not simultaneous whole-hall states. The manufacturer, model, luminous flux, driver type, rated power factor, ingress protection, lifetime, and photometric file were not independently verified and are excluded from performance claims.
Table 2.
Luminaire inventory and nominal installed power reported for the case study.
2.4. Experimental Measurement Methodology
All optical measurements were performed with a GOSSEN MAVOSPEC BASE handheld spectrometer. According to the manufacturer, the instrument covers 380–780 nm, measures illuminance from 10 to 100,000 lx, and reports CCT, chromaticity coordinates, general and special color-rendering indices, normalized spectral power distribution (SPD), percent flicker, flicker index, and dominant modulation frequency (Table 3) [30]. IES TM-30-20 quantities are available in the instrument workflow but were not exported in the current dataset [31]. The available manufacturer documentation does not state a separate minimum illuminance threshold for the CRI or flicker channels; the lowest case-study record (83.7 lx) is above the stated 10 lx illuminance floor, but low-level color and flicker outputs are retained only as instrument-exported screening evidence. ISO/CIE 19476:2014 is used here to frame photometer-performance limitations such as spectral mismatch and directional response; it does not replace a task-specific uncertainty budget [32].
Table 3.
Relevant MAVOSPEC BASE characteristics reported by the manufacturer [30].
The sensor (MAVOSPEC) was positioned 1.5 m above the floor. This height was used as a diagnostic screening plane near seated/standing eye and equipment level, not as the prescribed task plane. Detector orientation and view direction were not recorded; the measurements are therefore retained as point illuminance and are not relabeled as vertical eye illuminance. Z1 was monitored at (1, 5) on 10 July 2026. On 13 July, Z2 OFF/ON records were obtained at (24, 1)/(28, 1), and Z3 OFF/ON records at (24, 18)/(14, 18) (Table 4). Figure 1 locates these non-simultaneous configurations.
Table 4.
Traceable measurement records and coordinates.
Only Z1 records M8 and M9 form the same point off/on pair. They are separated by 31 s, so the local electric contribution can be screened under the assumption that daylight remains approximately stable. The Z2 and Z3 readings are spatial observations. Subtracting them would confound operating state with position and is therefore not permitted in the proposed workflow.
Two infrared frames supplied with the audit were evaluated as thermographic screening evidence. The displayed emissivity setting was ε = 0.95. Minimum, center, maximum, and displayed ambient temperatures were transcribed directly from each frame. Because the camera model, calibration status, load stabilization, reflected-temperature setting, and surface-emissivity verification were unavailable, the thermograms are interpreted descriptively and are not used to infer LED junction or driver temperature.
2.4.1. Visual-Comfort Completion Protocol
A follow-up visual-comfort campaign pairs with the applicable task/surrounding-area grid with fixed observer positions. The grid must document detector orientation and the prescribed measurement plane and report , , and ; at each observer position, the campaign additionally records vertical illuminance at eye height and declared view direction, a calibrated luminance image or validated glare quantity, screen/reflection observations, and a short task-linked comfort response. Industrial studies support combining physical measurements with occupant evidence, while glare studies show that eye-plane illuminance must be interpreted with the luminous scene rather than as a universal threshold [1,2,3,4,5,33,34,35].
The present 1.5 m records do not meet this definition because detector orientation, view direction, luminance distribution, and worker responses are unavailable. They remain valid for point-illuminance screening records and generate completion actions instead of a retrospective visual-comfort score.
2.4.2. Optional Local Spatial and Environmental-Light Screening
The optional pathway is activated only by a defined nocturnal source/receptor question. Its minimum evidence set is a documented contour and environmental zone/curfew; an exterior asset and control inventory; identified receptors and assessment periods; calibrated georeferenced measurements matched to the required plane and direction; and repeatable verification conditions. This retains the local-audit logic of defined contours, receptors, GIS-linked records, and mitigation tied to a diagnosed mechanism [22,23,26,27,36], while EN 12464-2 and CIE guidance provide the applicable workplace, obtrusive-light, and skyglow structure [24,37,38].
Eligible evidence may include receptor vertical illuminance, calibrated source/façade luminance, verified luminous-intensity or ULR information, numerical SPD, operating time, and receptor metadata. Indoor daytime point readings are not interchangeable with nocturnal receptor measurements, and MAVOSPEC alone cannot establish façade/source luminance or installation ULR. When receptor-specific evaluation is justified, integrative-light quantities require the appropriate CIE spectral metrology [39,40], disability-glare or spectral indices require documented geometry, calibrated inputs, and a stated validity domain [41,42], and mitigation should be tied to the diagnosed mechanism rather than inferred from CCT alone [43,44]. Large-scale atlas and ecological studies [19,20,21] provide context rather than site compliance. The present case contains none of the minimum exterior/receptor evidence and therefore does not activate environmental scoring [24,25,38].
2.5. Performance Indicators
2.5.1. Visual Performance Indicators
The complete visual pillar includes maintained task and surrounding illuminance, spatial uniformity , glare/screen-reflection evidence, eye-plane exposure where relevant, CCT/chromaticity, color rendition, temporal light modulation, and a concise task-linked worker response when visual comfort is claimed [1,2,3,4,5,16,34,35,45]. The current dataset contains point illuminance, CCT, Ra, approximate R9, normalized SPD, percent flicker, flicker index, and dominant frequency. It contains no formal grid, vertical-eye orientation, luminance map, glare metric, or worker questionnaire. Percent flicker and flicker index remain diagnostic and do not replace PstLM or SVM [9,10].
For a spatial task-plane grid, illuminance uniformity is defined as . This quantity is not calculated from the Z1 temporal series because temporal variation at one coordinate is not spatial uniformity.
2.5.2. Energy Performance Indicators
Installed power is the sum of nominal luminaire input powers. LPD and annual lighting energy are calculated as follows:
where ni and pi are the number and nominal input power of luminaire type i, A is the explicitly stated served or gross area, and is the annual operating time. For the same point, near-simultaneous OFF/ON pair, the local electric-light increment and the daylight/electric-light fractions are estimated as follows:
Equations (4) and (5) require an unchanged detector position and approximately stable daylight. They are not used for Z2 or Z3. Annual energy is a rated-power schedule scenario rather than measured consumption because circuit energy and control duty cycles were not logged.
2.5.3. Operational Performance Indicators
The operational pillar evaluates functional and failed luminaires, visible dirt or diffuser damage, access for maintenance, circuit documentation, control zoning, sensor status, dimming capability, adaptability to task changes, and the availability of a maintenance record. Each observation is associated with evidence such as a count, photograph, circuit schedule, control test, or work order. An undocumented condition is coded as missing, not as satisfactory.
2.5.4. Contextual Environmental-Light and Receptor Indicators
When the optional pathway is active, indicators are organized by impact pathway: (i) spill and obtrusive-light exposure at receptors (vertical illuminance, source/façade luminance, intensity, and curfew); (ii) upward emission (ULR derived from photometric distribution and installed geometry); (iii) spectral composition (numerical SPD and G-index, with CCT retained only as a color descriptor); (iv) human integrative-light exposure (melanopic EDI at the eye, timing, and duration); and (v) ecological or night-sky impact (receptor/species-specific evidence and sky-brightness measurements or models). Large-scale atlas and ecological studies [19,20,21] establish context, not site compliance; a local monitoring protocol must supply the installation-scale evidence [22]. CCT or G-index alone is not a circadian metric, and human α-opic sensitivity must not be generalized to animals or plants [25,39,40].
For disability-glare screening at an exterior or boundary receptor, an age-adjusted CIE disability-glare equation may be used only when eye-plane illuminance, source angle, observer geometry, and the equation’s validity domain are documented. It supplements, rather than replaces, the applicable discomfort-glare or obtrusive-light criterion [41].
For a calibrated numerical source SPD, the spectral G-index may be calculated using the definition and sampling conventions in Galadí-Enríquez [42]. It characterizes short-wavelength content relative to photopic output, but it does not quantify intensity, directionality, skyglow, or biological response. Any acceptance threshold must therefore be tied to the governing regulation or project brief. The current study does not calculate this index from reconstructed normalized plots.
Mitigation follows the diagnosed mechanism. First remove unnecessary emissions, restrict operating time, and improve zoning. If verified photometric distribution and installed geometry identify upward or misdirected emission, correct aiming/shielding or redesign the luminaire arrangement. If a compliant distribution still produces excessive receptor exposure, apply dimming, flux reduction, or curfew control. Change spectrum only when receptor-specific evidence justifies it. Multicriteria outdoor-lighting work and the European Commission mitigation review support evaluating energy, environmental effect, cost, and implementation together [43,44]. Each action receives a cost, operational risk, owner, and same-condition verification measurement.
2.5.5. Statistical Treatment of the Records and Measurement Sensitivity
Temporal records were summarized using the arithmetic mean, sample standard deviation, coefficient of variation, and a minimum-to-mean temporal ratio. To avoid implying spatial compliance, comparisons with the 500 lx desk/equipment reference and the 750 lx fine-bench scenario are reported as indicative screening ratios rather than capped attainment scores. For a reported screening quantity Q and reference T, the screening ratio is defined together with the temporal ratio as follows:
For the matched Z1 M8–M9 pair, an instrument-specification root-sum-square (RSS) sensitivity estimate is calculated by applying the stated relative illuminance specification r = 0.03 independently to the two readings:
2.6. Multicriteria Assessment Model
Each indicator xj is converted to a 0–100 score using a function appropriate to its direction. For a minimum criterion, for which higher values are favorable, and a maximum criterion, for which lower values are favorable, the proposed bounded ratios are
For a maximum criterion, sj is defined as 100 when xj = 0. For a target band [Lj, Uj], sj is 100 inside the band, 100xj/Lj below it, and 100Uj/xj above it. Qualitative indicators use anchored levels (0 = absent/defective, 50 = partial, 100 = verified). Thresholds Tj and target bands must be selected from the applicable task requirements, project brief, regulation, or documented stakeholder decision; they are not universal constants. Because the bounded ratios cap at 100, a compensatory weighted mean can hide a single deficient criterion behind several saturated ones. Each pillar score is therefore reported together with its minimum criterion score min(sj) and the criterion that produced it, and a pillar is not classified as satisfactory when min(sj) falls below a veto level declared with the weights. The admissible degree of compensation between criteria is a stakeholder’s decision and must be stated, not left implicit in the choice of means. Section 4.5 positions this rule against established non-compensatory practice.
A pillar score Pk and the global score G are computed as weighted means. The baseline pillar weights used to illustrate the method are Wv = 0.50, We = 0.30, and Wo = 0.20:
The baseline values emphasize visual risk in a mixed technical workspace. They are configurable and should be confirmed through stakeholder or expert elicitation before a final audit. Evidence quality and criterion declaration are handled separately. Let ∈ {0, 0.5, 0.75, 1} denote the evidence-quality code of indicator j: 0 for absent or unusable evidence, 0.5 for partial, indirect, assumption-based, or non-representative evidence, 0.75 for modelled evidence that is calibrated and independently validated with a reported residual, and 1 for complete traceable evidence. Let ∈ {0,1}, with = 1 only when an applicable criterion or target is explicitly declared for indicator j. Evidence coverage is then calculated as follows:
For a pilot dataset, an evidence-conditioned observed pillar subscore is calculated only over indicators for which evidence is available ( > 0) and an applicable criterion is declared ( = 1). In Equation (14), evidence quality determines eligibility for inclusion but is not used as a multiplicative performance weight:
Pkobs is reported together with the corresponding evidence coverage and the list of included criteria (Table 5). Global score G is reserved for cases in which every pillar meets a minimum evidence-coverage threshold declared a priori for the specific application. No universal coverage threshold is imposed by the present framework; in the pilot case, no validated minimum threshold was established and G is therefore not reported. Performance and C are therefore separate but structurally related outputs; C does not penalize or inflate a supported criterion score. No universal “good/satisfactory/intervention” bands are imposed here; any decision bands or veto levels must be declared and justified for the specific application. If no indicator satisfies both eligibility conditions, the denominator in Equation (14) is zero; in that case, the observed pillar subscore is not computed and is reported as not available.
Table 5.
Baseline indicator structure, weights, preferred evidence, criterion types, and indicator-specific evidence-code anchors for the integrated model.
Evidence-Classification Protocol
To make evidence-quality assignments reproducible, Table 5 provides indicator-specific anchors for = 0, 0.5, and 1. The value = 0.75 is reserved for modelled and independently validated evidence only when the model is calibrated on one dataset, validated on an independent dataset, and a validation residual or error metric is reported. Criterion declaration remains separate through . This distinction ensures that missing evidence and a missing criterion declaration generate different completion actions.
The 0.5 level represents partial or indirect evidence that is usable but does not satisfy the requirements for complete traceable evidence. The 0.75 level is reserved for calibrated and independently validated model-based evidence and is therefore placed between partial and complete direct evidence. For borderline cases, the lower evidence class is assigned unless all requirements of the higher class are demonstrably satisfied; assessor disagreements should be resolved by documented consensus.
Activating the contextual pathway does not change Wv, We, or Wo. Its findings and evidence coverage are reported separately from G and C. A fourth pillar may be introduced only after applicable criteria, normalization functions, minimum evidence coverage, and stakeholder weights have been validated and the total weights again sum to unity. No environmental score is calculated for the current case.
3. Results
3.1. Description of the Industrial Case Study
The audited installation contains 72 panels and 2.592 kW of calculated nominal lighting power, distributed as 0.720 kW in each perimeter arm and 0.576 kW in each of the north and south bands. The 600 m2 envelope, lateral windows, central enclosed laboratories, and two-deep perimeter luminaire ring create strong spatial and temporal daylight gradients. The campaign comprises nine temporal observations at one Z1 coordinate and two spatial observations each in Z2 and Z3, supplemented by spectral plots, color and temporal-modulation metrics, an inventory, an operating schedule, and two thermograms. Every record was obtained with no more than four of the 72 panels energized; the installation was never measured in a normal whole-hall operating state. All illuminance results below therefore describe specific sparse switching configurations under daylight, not the lighting service delivered in use.
3.2. Illuminance Measurements
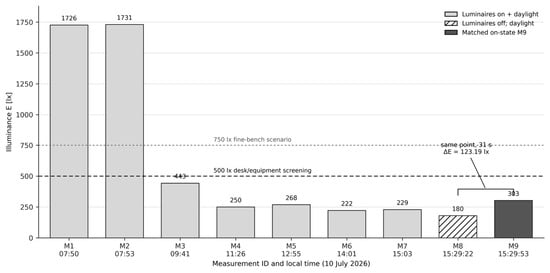
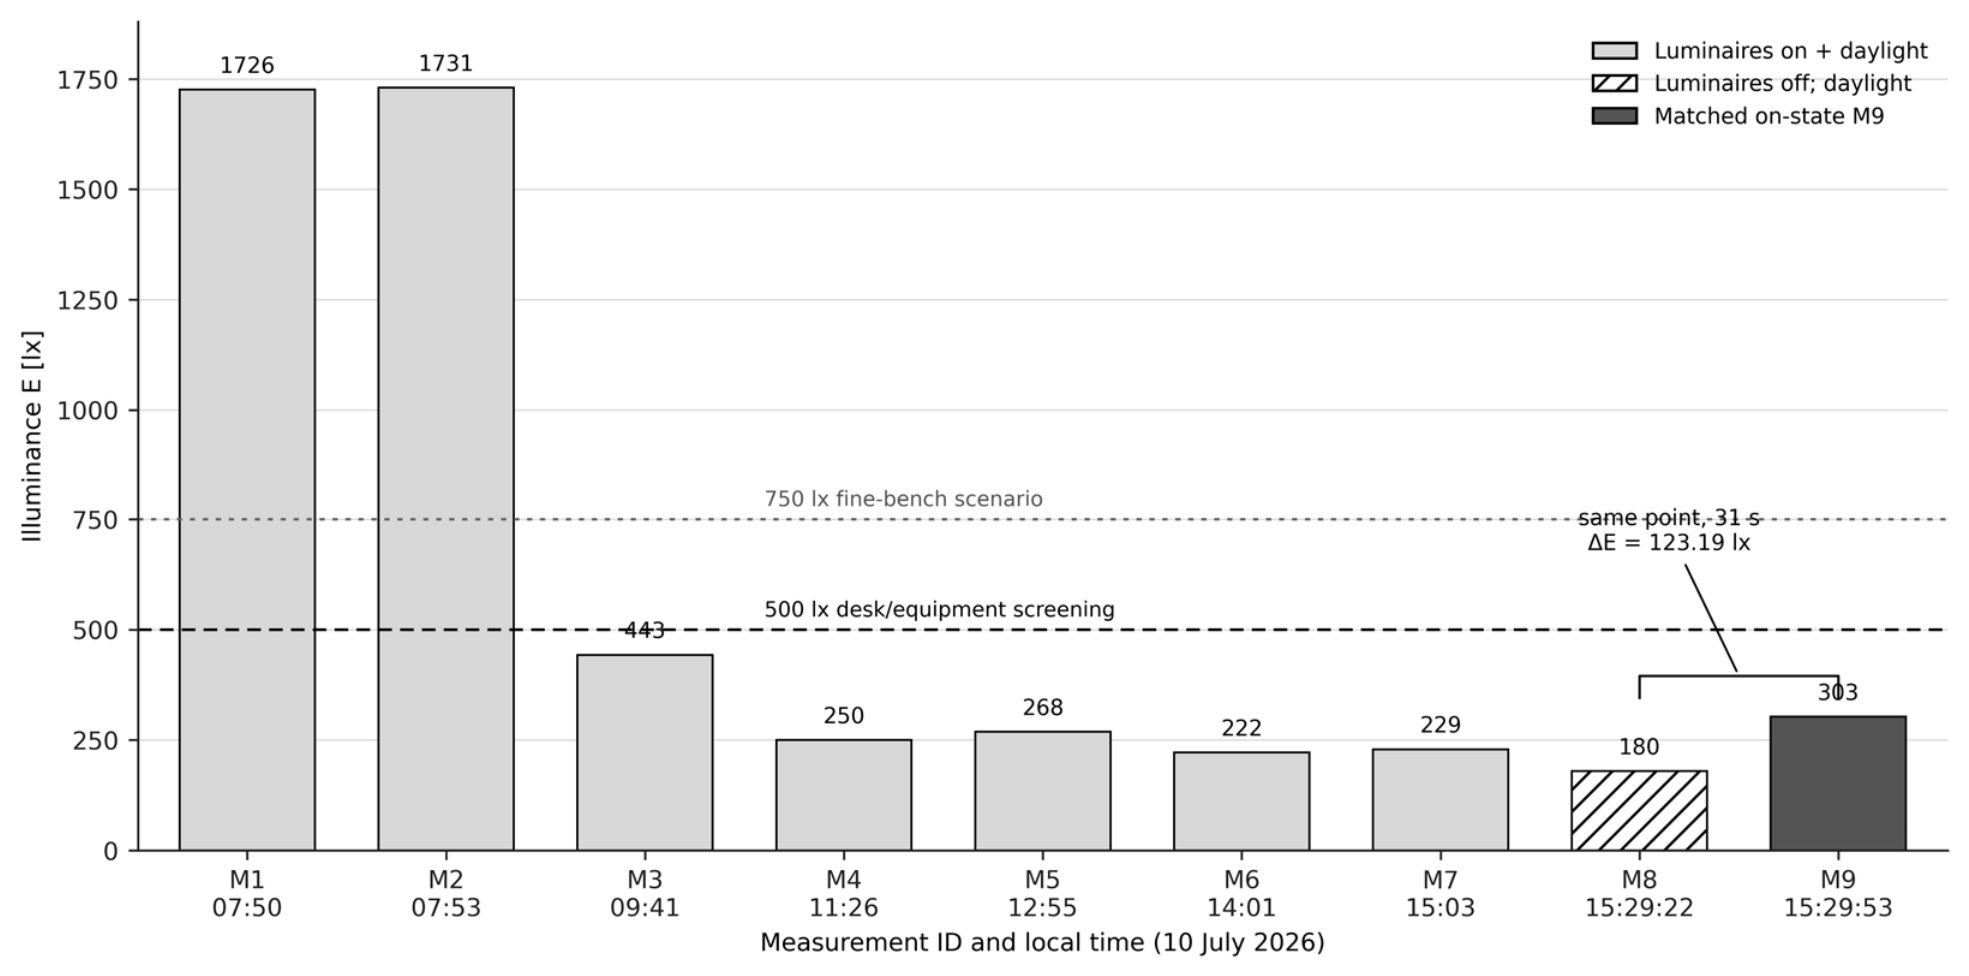
At Z1 (1, 5), illuminance ranged from 180 to 1731 lx over the nine-record campaign (Figure 3). The whole-series mean was 595 lx, but its sample coefficient of variation was 108.8% because the record mixed early daylight peaks, later mixed-light states, and one off-state. The late on-state subset M4–M7 was selected after inspection of the measurement sequence because all four consecutive records share the same coordinate and reported operating state after the early daylight-dominant observations. It had a mean of 242 lx, sample SD of 21 lx, CV of 8.7%, and an observed range of 222–268 lx (Table 6). As a subset-sensitivity check, adding M3 to M4–M7 raises the 500 lx screening ratio from 49% to 56% and the CV from 8.7% to 32.4%; adding both M3 and M9 gives a screening ratio of 57%. These dispersion values are descriptive only because n = 4 and do not support population inference. Its minimum-to-mean ratio was 0.92, a temporal ratio at one coordinate and not spatial uniformity U0.
Figure 3.
Z1 illuminance at (1, 5) on 10 July 2026. The 500 lx and 750 lx lines are task-scenario screening references, not area-wide compliance limits. M8–M9 is the only matched off/on pair.
Table 6.
Calculated illuminance, temporal-variability, and indicative screening-ratio results.
M8 and M9 were obtained 31 s apart at the same coordinate. Their difference gives a local electric-light increment of 123 lx. The off-state daylight reading of 180 lx represents 59.3% of the 303 lx on-state total, while the calculated electric-light increment represents the remaining 40.7%; switching increased the local total by 68.6%. Applying the manufacturer’s stated ±3% illuminance specification independently gives approximately ±5.4 lx for M8 and ±9.1 lx for M9; the root-sum-square combination is 10.6 lx, rounded to ±11 lx for this sensitivity calculation. This is not a metrological uncertainty budget: the ±3% specification is stated at 1000 lx under illuminant A, while spectral mismatch f1′, directional/cosine response f2, mixed daylight/LED spectra, point placement, and short-term daylight stability are not quantified. ISO/CIE 19476:2014 identifies photometer-performance indices relevant to these limitations [32]. An arithmetic upper-bound combination of the same two ±3% terms is approximately ±14.5 lx and is reported only as a sensitivity bound.
The Z2 on + daylight snapshot was 615 lx at (28, 1), approximately 123% of the 500 lx screening reference and 82% of a 750 lx fine-bench scenario. The Z3 mixed-light snapshot was 600 lx at (14, 18), approximately 120% and 80% of the same two references. These are indicative ratios only because the records were obtained at the 1.5 m diagnostic plane. Their off/background records were taken at (24, 1) and (24, 18), respectively. Consequently, the numerical differences of 456 lx and 517 lx are not interpreted as electric-light contributions because position changed together with operating state.
3.3. Spectral and Color Quality Analysis
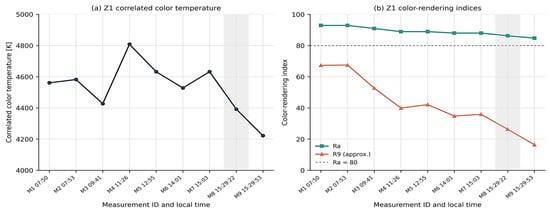
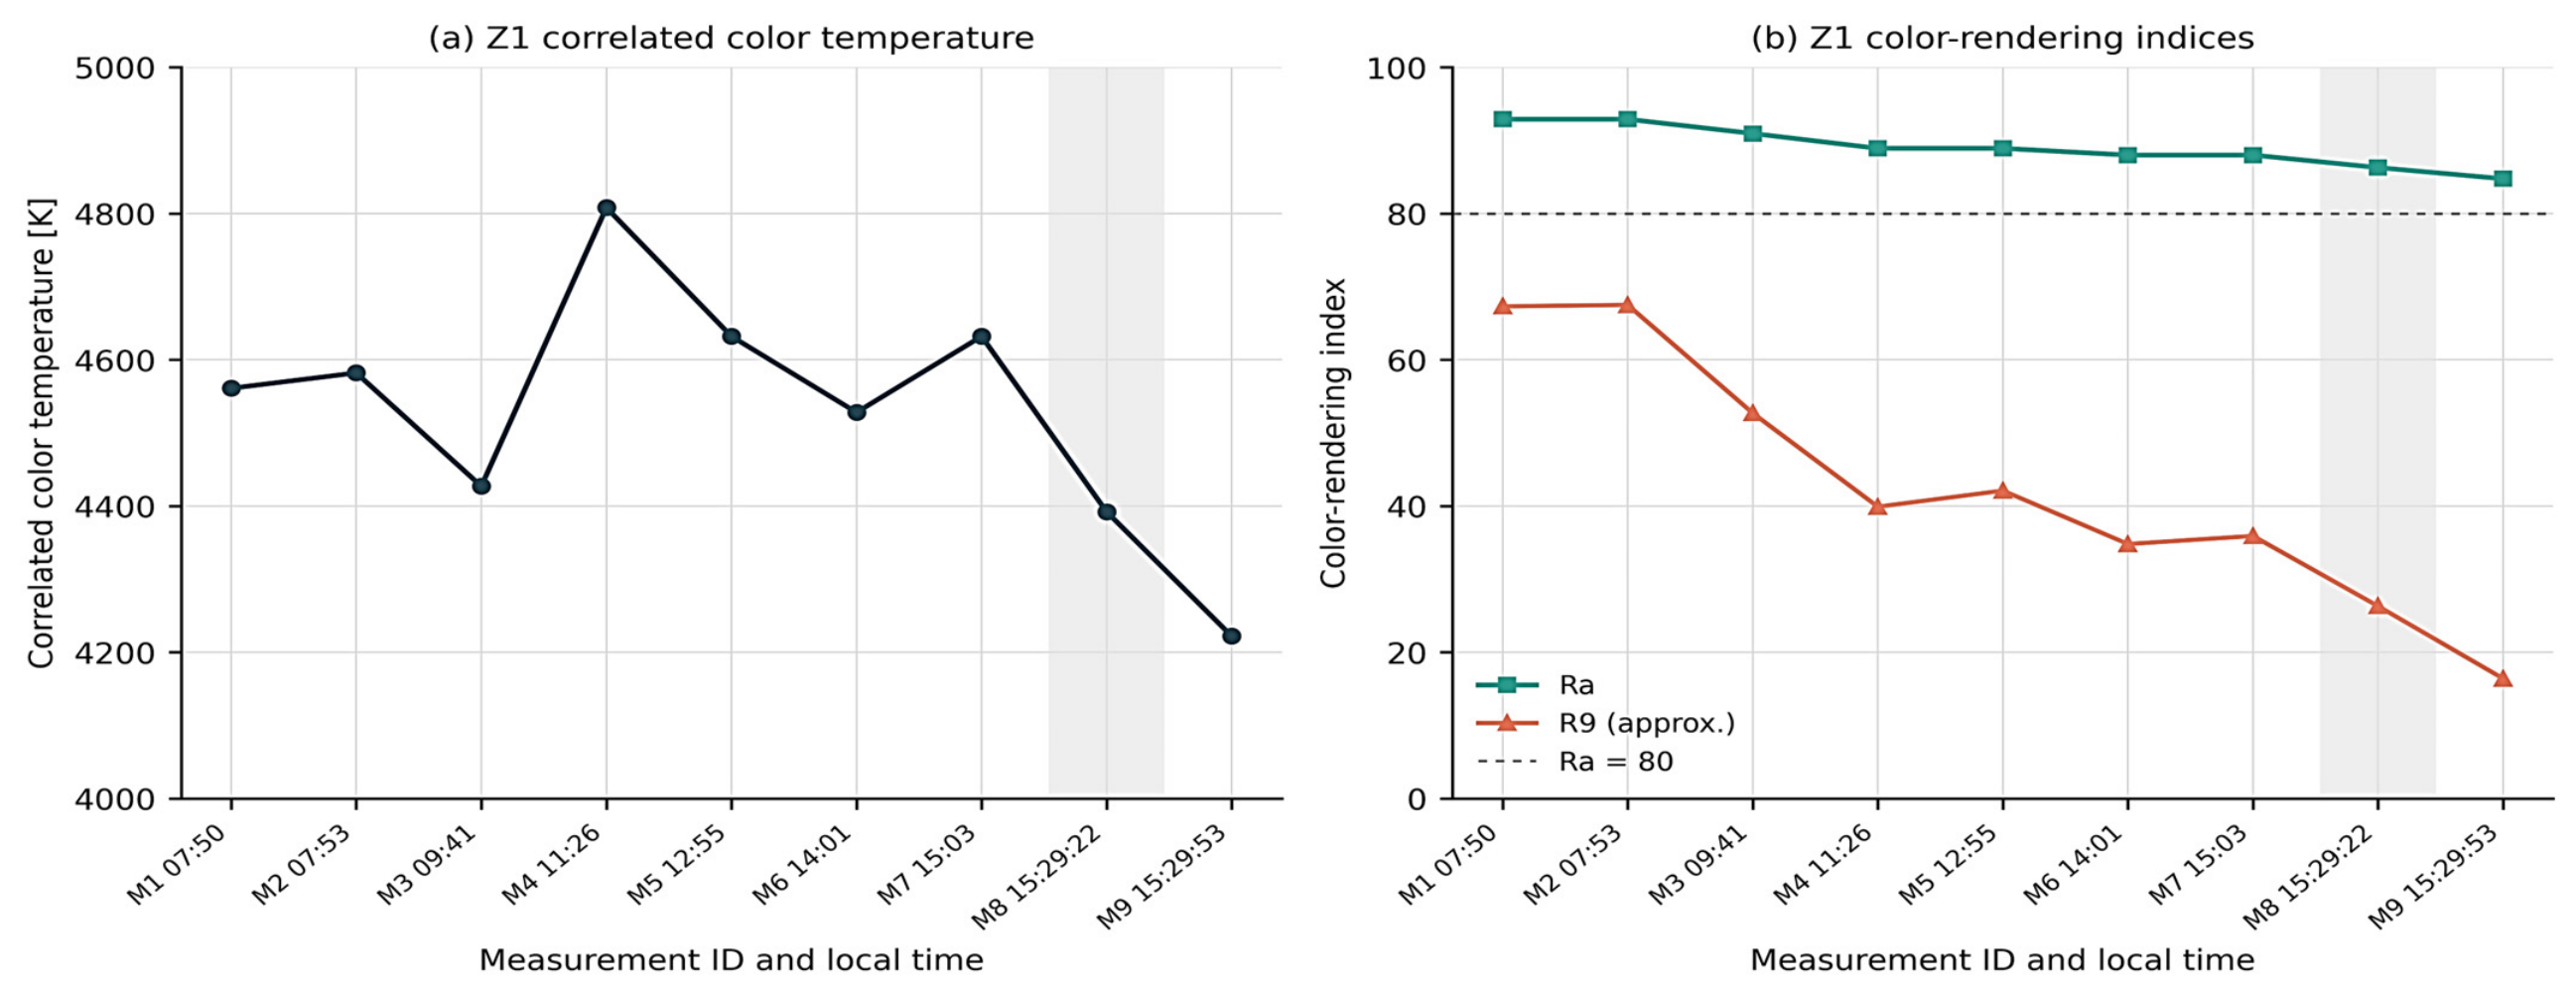
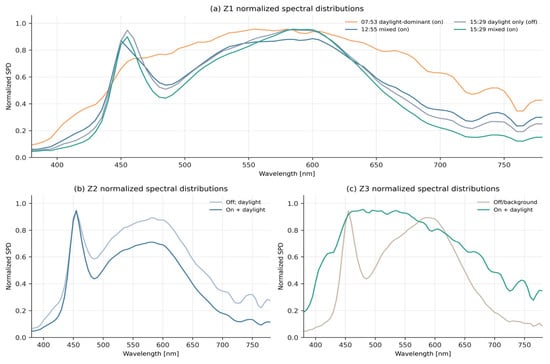
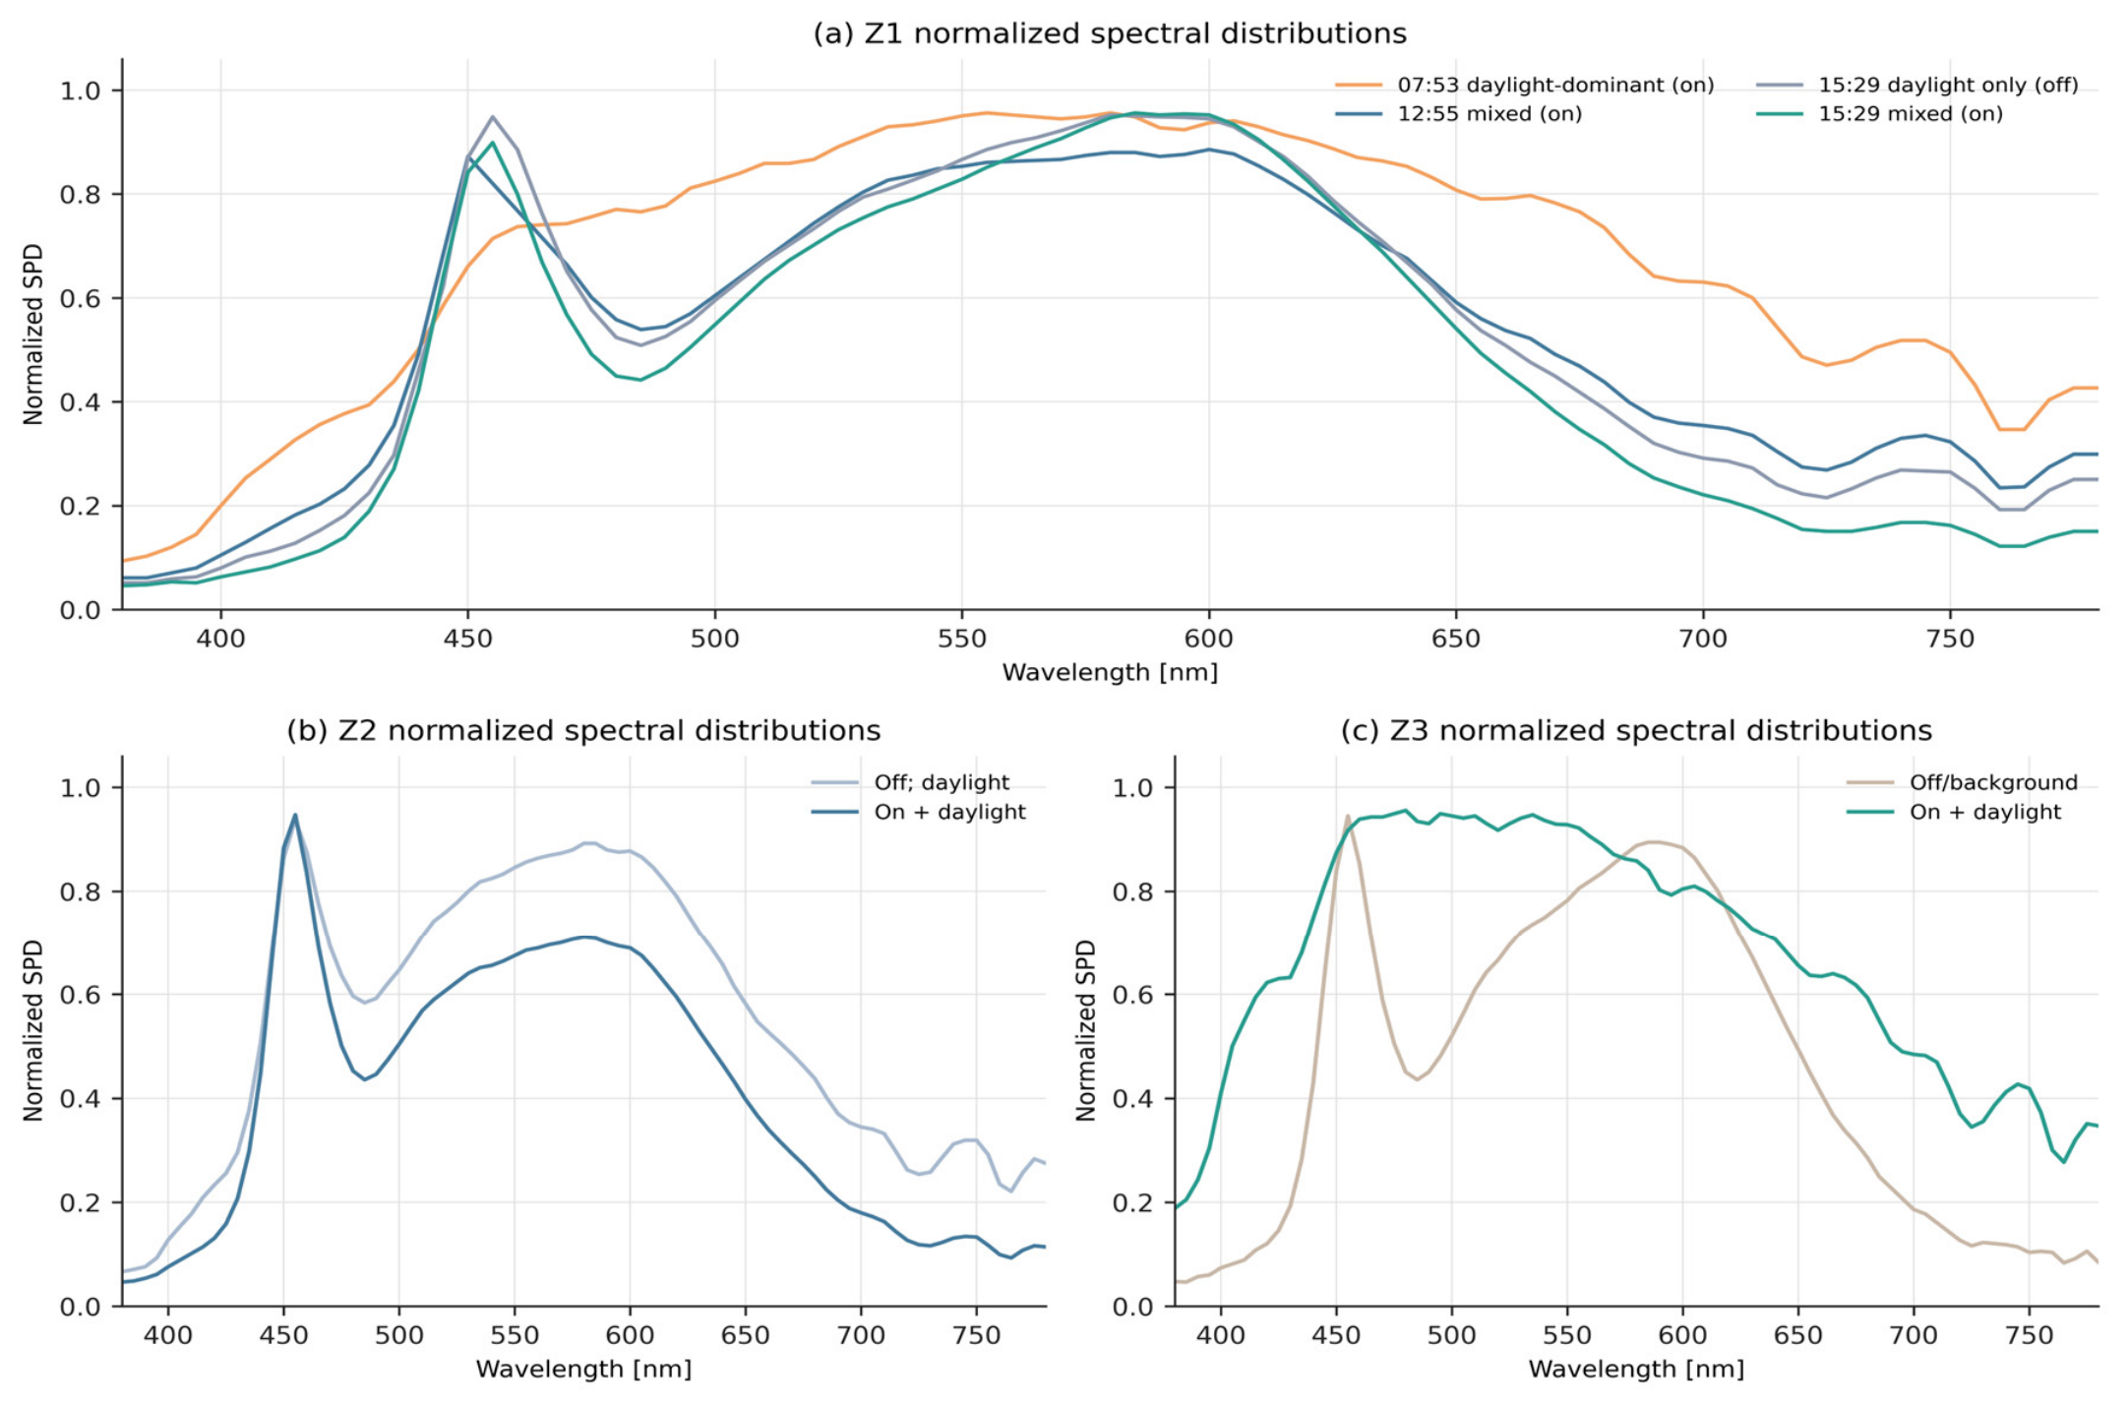
Z1 CCT varied from 4222 to 4808 K and Ra from 84.8 to 92.9 as the daylight/electric-light mixture changed (Figure 4). All summarized Z1 Ra values exceeded the Ra = 80 screening level, but R9 decreased from approximately 67 in the early daylight-dominant records to approximately 16 in M9. The normalized SPD plots retain only spectral shape; they cannot be used to infer absolute spectral irradiance (Figure 5).
Figure 4.
Z1 color quantities over the nine-record sequence: (a) CCT and (b) Ra and approximate R9. The shaded M8 interval identifies the off/daylight record. R9 values were reconstructed from the plotted source summary and are used only for screening.
Figure 5.
Normalized spectral distributions reconstructed from the source measurement plots for (a) Z1, (b) Z2, and (c) Z3. Normalization supports spectral-shape comparison only; the ordinate is not absolute spectral irradiance.
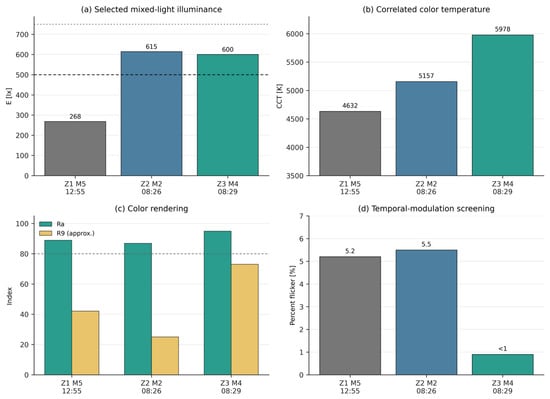
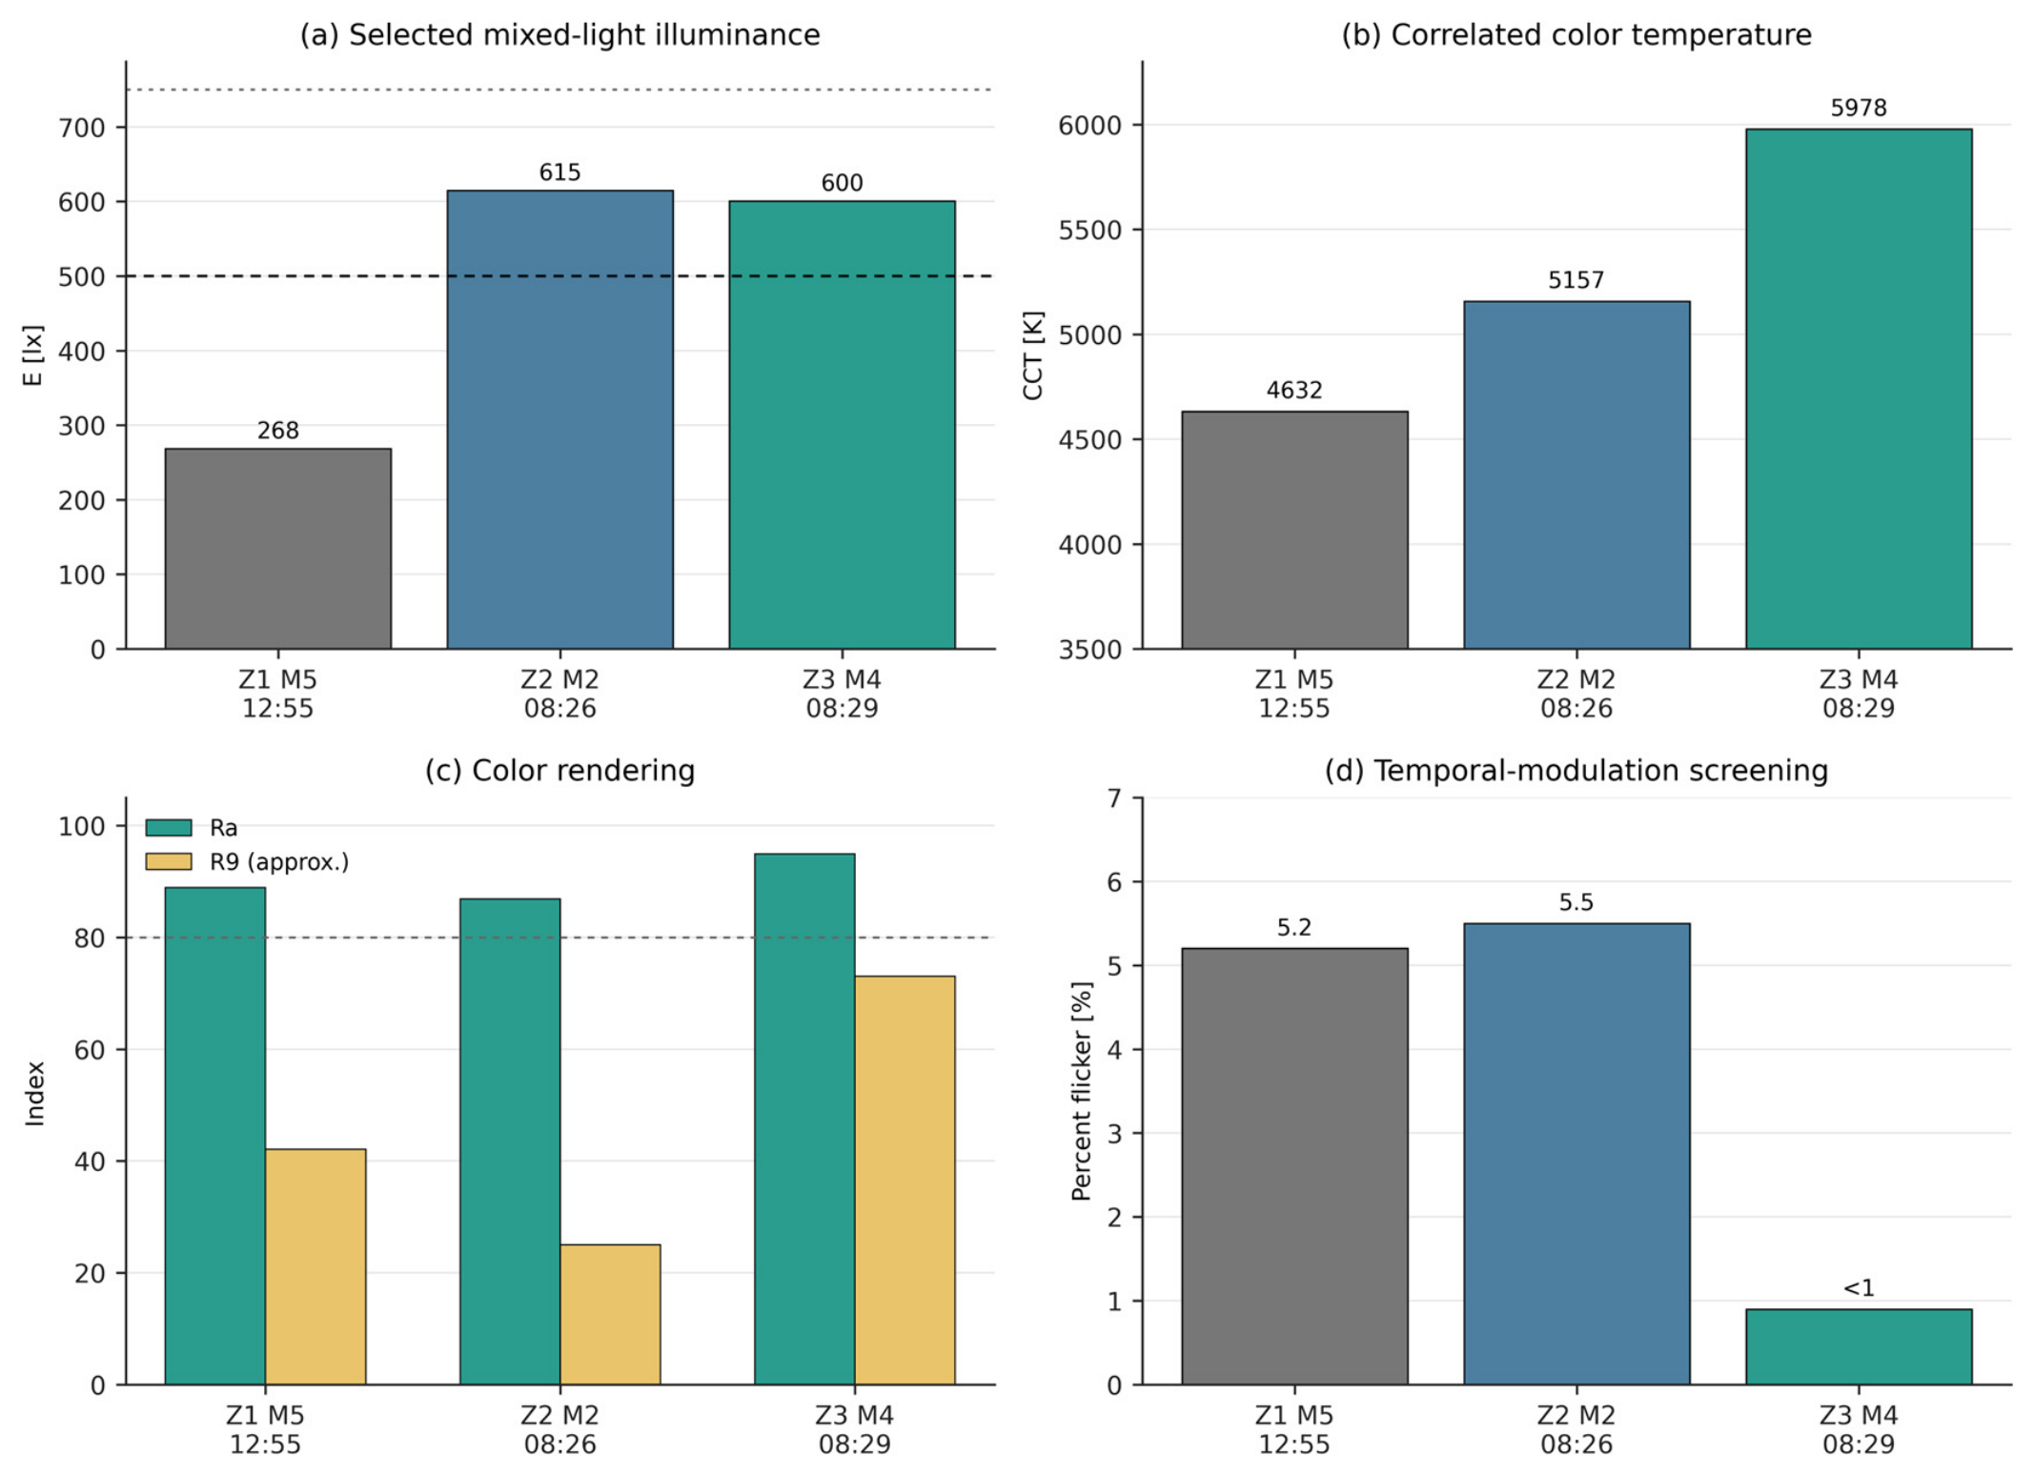
In Z2, the off/daylight point gave 4786 K, Ra 88.97, and R9 approximately 40, whereas the selected on + daylight point gave 5157 K, Ra 86.84, and R9 approximately 25 (Table 7). Z3 changed from a background-point record of 4458 K, Ra 84.48, and R9 approximately 14 to a mixed-light record of 5978 K, Ra 94.91, and R9 approximately 73. Because coordinates changed in both zones, these are spatially distinct spectral conditions, not causal before/after effects (Figure 6).
Table 7.
Photometric, color, and temporal-modulation results used in case-study screening.
Figure 6.
Selected mixed-light records shown side-by-side for screening only: Z1 uses M5, Z2 uses M2, and Z3 uses M4. These are non-equivalent records obtained at different coordinates and times; the graphical arrangement does not imply direct comparability or intrinsic zone ranking.
3.4. Flicker Assessment
With the luminaires operating at Z1, percent flicker ranged from 1.4% to 6.6%, FI from 0.003 to 0.020, and the dominant frequency was approximately 100 Hz. The daylight-only M8 record was 7.6% with FI 0.024; this may include modulated light from adjacent sources or measurement-context effects and is not attributed to daylight itself. Z2 gave 3.1%/0.008 at the off/daylight point and 5.5%/0.017 at the lit point. Z3 M3 gave 9.7%/0.030 at the background point; as with Z1 M8, this is treated as a background modulation observation that may include other electric sources or spatial/context effects and is not attributed to daylight. Z3 M4 reported below 1.0% flicker; the unmodulated daylight component can dilute the modulation depth of the electric-light contribution, so this value characterizes the mixed luminous field and is not an intrinsic driver-quality result.
These values reveal a 100 Hz modulation component in several records, but they do not by themselves demonstrate regulatory compliance. PstLM and SVM were not available, and the records were not repeated across all luminaires or operating levels. A completion campaign should measure the applicable standardized metrics at representative workstations, dimming states, and camera-sensitive tasks.
3.5. Daylight Contribution Analysis
The Z1 M8–M9 pair shows that the local total at 15:29 remained strongly daylight-dependent even after the luminaires were switched on. Conversely, the early Z1 total above 1700 lx signals a need to test for excessive task illuminance and high luminance ratios near the façade; neither condition was verified by the present point readings. The same space can therefore experience low electric-light support later in the day and high daylight exposure earlier in the day. This pattern motivates the evaluation of coordinated shading and daylight-responsive control before considering an increase in installed power.
No daylight fraction is calculated for Z2 or Z3 because the state changes coincide with coordinate changes. A future protocol should use matched points, a stable exterior-light reference, and repeated overcast/clear-sky and electric-only conditions. Time-series logging would then allow daylight utilization to be integrated into annual energy estimates rather than inferred from isolated readings.
3.6. Thermographic Screening
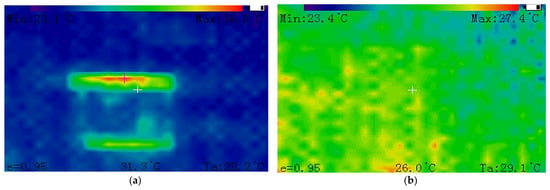
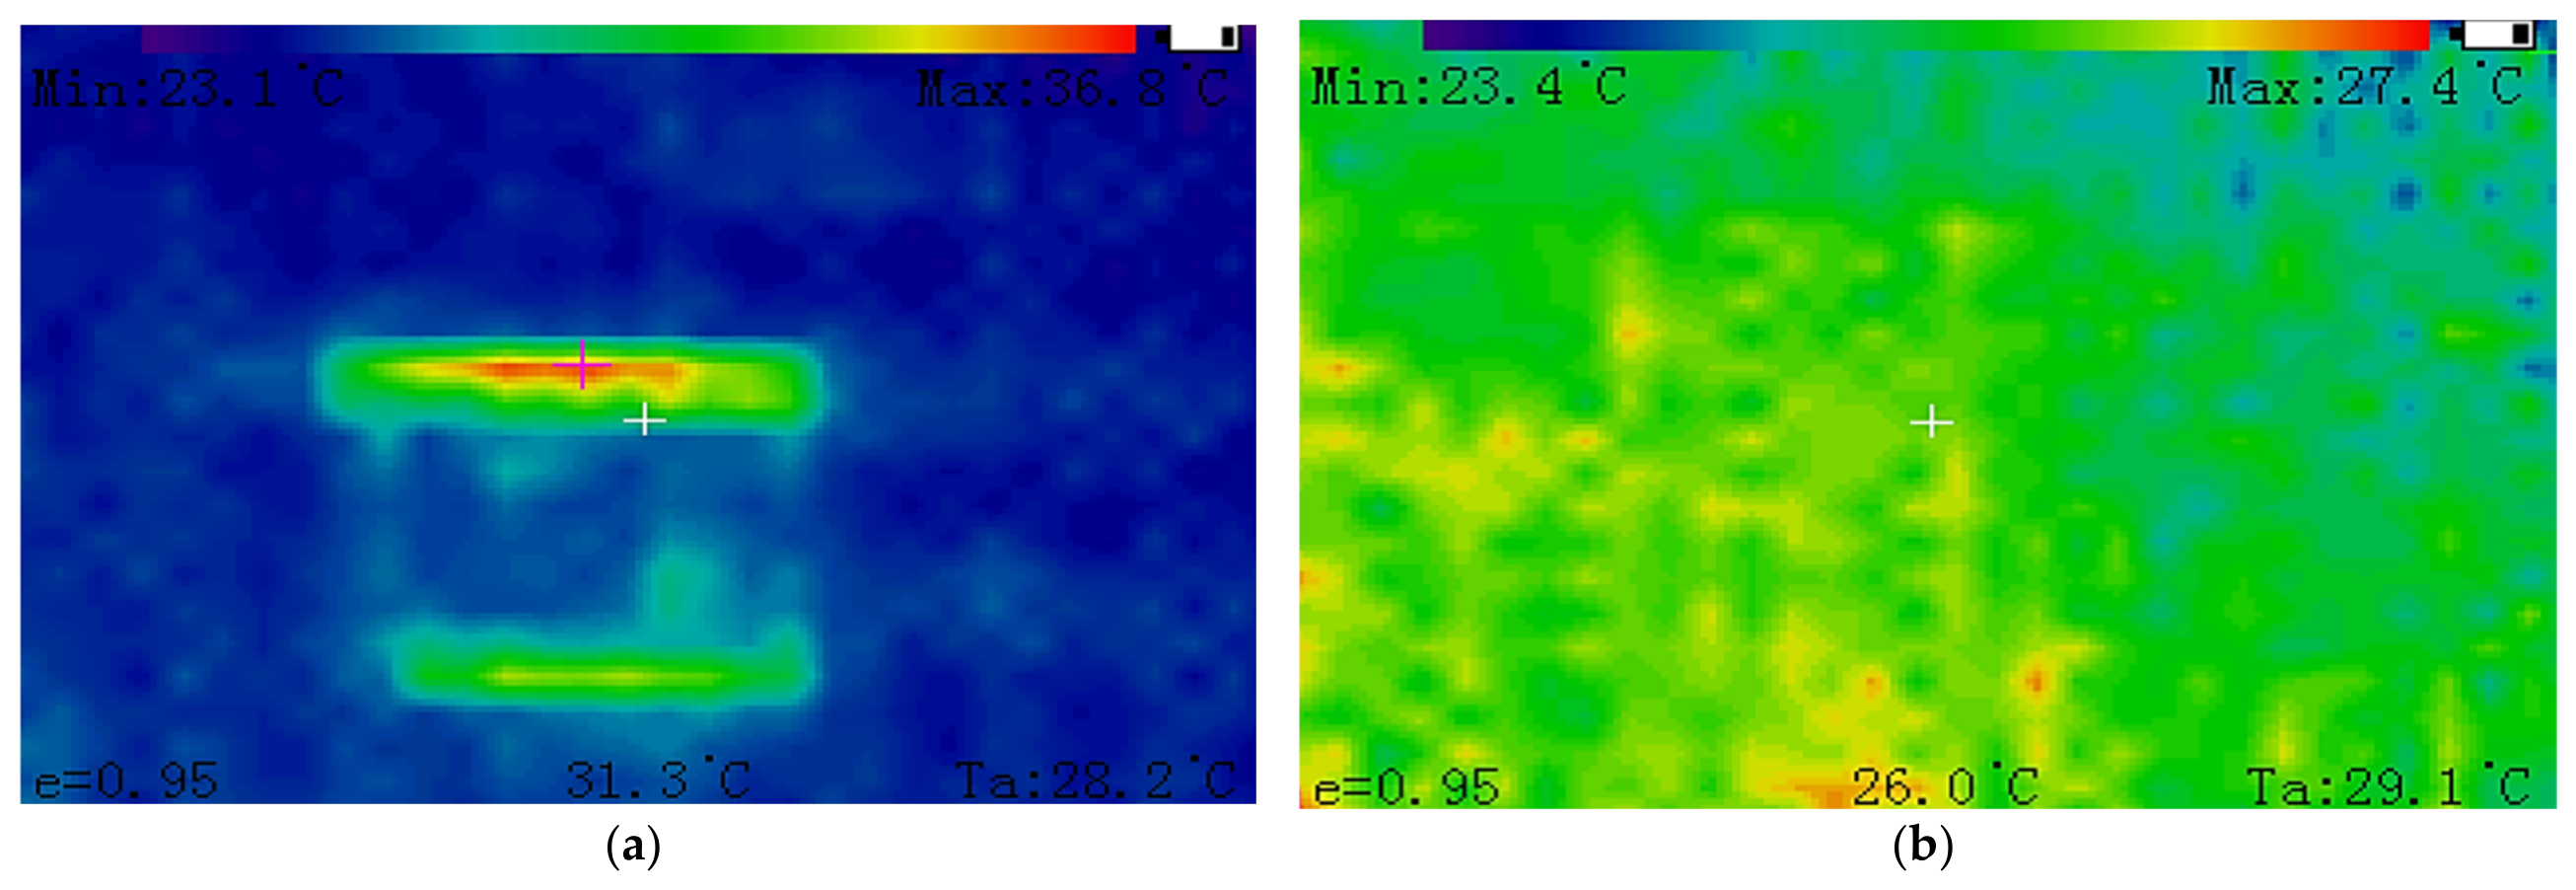
Two infrared frames supplied with the audit were evaluated as thermographic screening evidence. The first frame corresponds to an energized luminaire (“Light 1 ON”), whereas the second corresponds to a different luminaire located in another measurement zone and recorded in the non-energized state (“Light 2 OFF”). The first frame displayed a minimum temperature of 23.1 °C, a center temperature of 31.3 °C, a maximum temperature of 36.8 °C, and an ambient temperature of 28.2 °C. The second frame displayed a minimum temperature of 23.4 °C, a center temperature of 26.0 °C, a maximum temperature of 27.4 °C, and an ambient temperature of 29.1 °C. Figure 7 shows the two thermographic frames, and Table 8 summarizes the transcribed temperature values and the calculated within-frame temperature spans.
Figure 7.
Infrared screening frames supplied with the audit: (a) energized luminaire in the first measurement zone (“Light 1 ON”); (b) a different, non-energized luminaire in another measurement zone (“Light 2 OFF”). The displayed ambient temperatures were 28.2 °C and 29.1 °C, respectively. Because the frames refer to different luminaires and different zones, they are not treated as a paired ON/OFF comparison.
Table 8.
Thermographic screening values transcribed from the infrared frames and calculated within-frame temperature spans.
Because the two frames refer to different luminaires and different measurement zones, and because ambient and stabilization conditions were not identical or fully documented, no ON/OFF thermal difference is calculated or attributed to luminaire operation. The thermograms are retained only as descriptive screening evidence. The displayed emissivity setting was 0.95. In the absence of verified camera calibration, reflected-temperature settings, stabilization duration, independent emissivity verification, and component-temperature limits, the apparent surface temperatures cannot be used to infer LED-junction temperature, driver-component temperature, thermal conformity, or component overheating.
3.7. Comparative Evaluation and Energy Scenarios
The case records indicate that Z2 and Z3 can reach approximately 600 lx at selected mixed-light points, while the same-point Z1 pair indicates a much smaller local electric increment. Because the zones were not measured under identical sky, time, position, luminaire count, or detector-to-luminaire geometry, a ranking of intrinsic zone performance would be premature. The defensible comparison is methodological: Z1 supplies temporal information at one point, while Z2 and Z3 supply sparse spatial snapshots.
Nominal installed power is 2.592 kW. With the source-declared 600 m2 area, LPD is 4.32 W m−2. The 2500 h year−1 schedule gives a full-power rated scenario of 6.480 MWh year−1, corresponding to 10.8 kWh m−2 year−1 (Table 9). The recorded south-band condition had 4 of 16 panels operating (0.144 kW within that band). Table 9 uses this condition only in an illustrative schedule scenario that hypothetically keeps all other luminaire groups at rated power; it is not an observed whole-hall operating state, measured annual consumption, or a realized saving. Representative active power, power factor, operating hours, and control duty cycles must be logged at circuit level before annual-energy, daylight-control-effectiveness, or saving claims are made.
Table 9.
Calculated installed-power and annual energy scenarios.
3.8. Illustrative Evidence-Conditioned Worked Example
For the present worked example, Ra ≥ 80 is declared as an illustrative screening criterion for the color-rendition indicator (tj = 1). The conservative case-study input is the minimum exported Ra value, 84.48. No other case-study performance target is declared. Using the bounded minimum-criterion normalization, the color-rendition score is 100/100. Because color rendition is the only target-declared visual indicator in this worked example, PV,obs = 100/100 and the weakest supported criterion is min(sj) = 100/100. Visual evidence coverage remains CV = 32.0%, reflecting the substantial missing evidence elsewhere in the visual pillar. These values are screening outputs and do not constitute a visual-compliance assessment.
To demonstrate evidence conditioning without averaging non-equivalent measurements, the Z1, Z2, and Z3 illuminance records are retained as separate record blocks. No cross-zone illuminance score is calculated because coordinate, date, daylight condition, and switching state differ. Table 10 reports the actual evidence coverage by pillar together with an evidence-completion contrast in which only currently partial evidence is upgraded from to , while absent evidence remains at . Under this contrast, C changes from 36.0% to 72% without altering or imputing any supported performance value.
Table 10.
Illustrative evidence-conditioned worked example for the pilot case.
3.9. Evidence-Coverage Contrast and Completion Decision
The evidence-completion contrast in Table 10 upgrades only currently available partial evidence from aj = 0.5 to aj = 1, while indicators with absent evidence remain at aj = 0. Weighted coverage consequently increases from 36.0% to 72.0%. This contrast distinguishes evidence completion from the acquisition of entirely missing evidence and does not alter or impute any performance value.
The case-study decision is therefore limited to evidence completion. The Z1 late mixed-light subset reaches approximately 49% of the 500 lx screening reference, but this ratio is governed by the sparse switching state: a single 36 W panel at approximately 5 m mounting height cannot characterize the installed system. Conversely, the selected Z2 and Z3 points were recorded under morning daylight conditions and exceeded the 500 lx screening reference. No zone is therefore classified as deficient or adequate. The first completion step is a task-plane grid measured with the installation in its representative operating state; Z1 additionally requires a repeated matched OFF/ON series. Daylight-responsive zoning and local bench lighting should be evaluated before any increase in installed power is considered.
4. Discussion
The case study illustrates why an industrial lighting audit should preserve the distinction between measurement, estimate, observation, and requirement. A conventional summary might label selected Z2 and Z3 points satisfactory and Z1 deficient, then assign one score. The proposed method instead asks whether those measurements are spatially comparable, whether the task plane was used, and whether missing pillars are visible to the decision maker. This reduces the risk of false precision while retaining actionable information.
4.1. Compliance with Lighting Standards
ISO/CIE 8995-1 and EN 12464-1 associate criteria with the activity and task area [46,47]. The 1.5 m points do not constitute the required task-plane grid; , , U0, glare, detector orientation, and view direction were not determined. The 500 lx line is therefore a screening reference, not a pass/fail threshold. The verification provisions of EN 12464-1 reinforce the evidence-coverage concept used here: missing task-grid, uniformity, or glare evidence must remain visible as incomplete coverage rather than being inferred from point measurements. A follow-up should document the task/surrounding areas, grid, reflectances, daylight state, and screen-related glare, and should add eye-plane vertical illuminance plus luminance or validated glare assessment where view-dependent discomfort is plausible [2,3,4,5,34,35,45].
4.2. Visual Performance Versus Energy Performance
The Z1 series shows the central trade-off: more general lighting could raise late readings but not resolve early daylight peaks or reflections, while indiscriminate energy reduction could worsen electric-only conditions. A rational follow-up sequence is to evaluate façade control, daylight-responsive zoning or dimming, and local bench lighting, followed by commissioning and measurement. Parametric shading studies likewise show that daylight redistribution and electric-lighting energy use should be coordinated [7], while building and industrial retrofit evidence emphasize verification rather than assumed savings [6,48,49,50,51,52,53,54].
Using the source-declared 600 m2 boundary gives 4.32 W m−2 and 10.8 kWh m−2 year−1. Both figures assume all 72 panels energized for the declared 2500 h year−1, and that assumption is not supported by any evidence in this study: the only operating states ever recorded had at most four panels on. The scenario is retained because it is the conventional rated-power benchmark, but it is an upper bound on a schedule that was never observed, and the difference between it and actual demand can only be closed by circuit metering. The area boundary must accompany every LPD or specific-energy claim, and any alternative denominator requires an as-built survey.
4.3. Operational Implications for Industrial Lighting Systems
The recorded 4-of-16 operation of the south band suggests that lighting can be matched to occupancy or daylight. However, the circuit schedule, manual switching logic, sensors, dimming interface, and user practice were not verified. The operational audit should test each control state, map circuits to luminaires, and record whether the resulting photometric condition remains suitable. Maintenance access is also important in a 6 m high space because access cost can dominate routine luminaire replacement or cleaning decisions.
Color and temporal-modulation results should be linked to actual tasks. Ra above 80 in all summarized records does not guarantee good rendering of every saturated color, as the lower R9 observations show. Similarly, a low percent flicker record at one location does not characterize all drivers. Equipment inspection, machine vision, high-speed imaging, or visually sensitive occupants may justify stricter task-specific checks.
4.4. Interpretation of the Optional Environmental-Light Extension
The optional extension asks which inventoried source emits, where nocturnal emission goes, which receptor receives it, and under which operating state and assessment period. It therefore requires source/control records, receptor geometry, zone/curfew definition, and matched nocturnal measurements rather than reuse of indoor daytime records. This preserves the local-audit emphasis on contours, GIS-linked points, and mechanism-specific mitigation [22,23,26,27,36], while CIE guidance provides the applicable source-, receptor-, direction-, time-, and zone-specific structure [24,25,38]. Because these data are absent, the extension is a future methodological pathway rather than a validated component of the present case.
4.5. Positioning Relative to Evidence-Quality and Audit-Level Conventions
The methodological stress test uses only quantities that can be evaluated from the available records. It varies evidence-code assumptions, pillar weights and illuminance screening references and reports the M8–M9 instrument-specification sensitivity and the descriptive dispersion of the n = 4 Z1 M4–M7 subset. Because representative task-plane, repeated-daylight and circuit-level data are absent, the exercise is a methodological sensitivity analysis (Table 11).
Table 11.
Methodological stress tests for evidence coverage, screening references, sampling dispersion, and measurement sensitivity.
Across the tested pillar-weight sets, C varies only from 35.0% to 37.1%, whereas it changes directly when the evidence-code scenario is altered. The Z1 screening ratio also depends on the selected task reference, and the n = 4 dispersion remains descriptive. None of these checks addresses spatial sampling adequacy, daylight repeatability, actual circuit demand, or external validity; they are sensitivity checks, not a validation of robustness
The methodological contribution is to operationalize established evidence-quality concepts at the individual-indicator level within an industrial lighting audit. Building-energy auditing establishes clear boundaries and standards beforehand through discrete audit levels [55], measurement and verification declares which parameters are measured and which are estimated [56], life-cycle inventory scores the quality of each input and converts it into additional uncertainty [57], and multicriteria analysis under incomplete information admits imprecision in the preference model rather than in the data [58]. Non-compensatory aggregation addresses the related problem that a weighted mean lets strong criteria mask a weak one [59]. Table 12 positions the present framework against these conventions. Three differences define it: coverage is computed after the campaign for each indicator rather than assign to the audit as a whole; it is reported beside the score instead of being absorbed into its uncertainty; and it spans visual, energy, and operational indicators, most of which have no savings or inventory analog. The construct is therefore a recombination of established ideas that have not been widely applied in industrial lighting audits, rather than a new decision theory.
Table 12.
Positioning of the proposed evidence-coverage output relative to established data-quality and audit-level conventions.
4.6. Advantages and Limitations of the Proposed Methodology
The advantages are traceability, modular evidence completion, and explicit separation of criterion declaration from evidence quality. Direct industrial studies support combined photometric, comfort, energy, and operational assessment [1,2,3,4,6]; multicriteria and expert-consensus studies support transparent selection and weighting of heterogeneous indicators [13,14,15,16]. Table 5 integrates indicator-specific coding anchors, including an intermediate modelled and independently validated class. The weights remain illustrative until elicited and externally validated.
The limitations are stated at the level of inference, and the primary limitation concerns the representativeness of the measured operating state. The installation was never measured in a normal operating state: all 13 records were taken with no more than four of 72 panels energized, so no result characterizes the lighting service delivered to the workplace, and the rated-power scenarios rely on an assumed schedule. Second, the aggregation model remains compensatory; min() exposes a weak support criterion, but no stakeholder veto level has been elicited. Although the indicator-specific anchors integrated in Table 5 make coding reproducible in principle, inter-rater agreement has not been tested, and the baseline weights have not been validated through AHP or another stakeholder process. Third, sampling is sparse and unbalanced: Z1 M4-M7 has n = 4 and Z2/Z3 provide isolated lit snapshots. Fourth, the 1.5 m diagnostic plane is not the applicable task plane, so Emean, Emin, U0, glare, detector orientation, and view-direction evidence required for formal verification are absent. Fifth, PstLM/SVM and circuit active power, power factor, duty-cycle, and energy logs were not obtained; the uncertainty discussion omits a task-specific treatment of spectral mismatch and directional response; the 600 m2 area, panel count, and spacing were not surveyed as-built; and the thermal camera model, calibration, stabilization, reflected-temperature setting, and emissivity verification were unavailable. A calibrated lighting model would be a valid intermediate evidence pathway only if luminaire photometry, geometry/reflectance, a calibration subset, and an independent validation set with reported residuals were available; the M8/M9 pair alone cannot support both calibration and independent validation. The environmental pathway additionally lacks the minimum exterior/receptor evidence defined in Section 2.4.2. These limitations preclude area-wide compliance, realized savings, external validation of the weighting model, or any environmental result.
5. Conclusions
This paper developed an evidence-aware multicriteria method for industrial-lighting audits that keeps criterion declaration, evidence quality, performance, and evidence coverage distinct. The method preserves record-level context, prevents non-equivalent measurements from being averaged into a single criterion, and couples any supported score with its weakest criterion and explicit coverage.
The case study is a methodological illustration rather than validation of the installation in service. The available records show strong daylight dependence, a valid same-point off/on screening pair at Z1, sparse mixed-light snapshots at Z2 and Z3, nominal installed-power scenarios, and preliminary color, flicker, and thermographic evidence. None of these substitutes for a representative task-plane or circuit-level campaign.
Non-equivalent Z1, Z2, and Z3 records are retained as separate record blocks and are not aggregated into a common illuminance criterion; no global performance score G is reported. Weighted evidence coverage for the available case is 36.0%; completing only the current, partial evidence would increase coverage to 72.0%, while indicators with absent evidence would remain explicitly unresolved. The required completion sequence is to measure the applicable task/surrounding-area grid in normal operation; report , , and ; repeat matched off/on measurements; add glare and eye-plane evidence where relevant; map circuits and control states; and validate energy with circuit-level active power, power factor, duty-cycle, and operating-hour records.
The optional environmental pathway remains unscored because the case contains no nocturnal exterior/receptor, zone/curfew, luminance, or verified photometric-distribution evidence. It is retained as a clearly identified methodological extension, and no light-pollution claim is made.
Author Contributions
Conceptualization, E.S.; methodology, E.S. and G.B.; investigation, G.B.; formal analysis, E.S. and G.B.; data curation, E.S.; visualization, G.B.; writing—original draft, E.S. and G.B.; writing—review and editing, E.S. and G.B. All authors have read and agreed to the published version of the manuscript.
Funding
This research received no external funding.
Data Availability Statement
Numerical inputs and formula-based calculations are reported in the article. Original instrument exports and infrared images are available from the corresponding authors on reasonable request, subject to facility approval.
Acknowledgments
The authors acknowledge the facility personnel who enabled the measurement campaign.
Conflicts of Interest
The authors declare no conflicts of interest.
Abbreviations
The following abbreviations are used in this manuscript:
| Abbreviation | Definition |
| CCT | Correlated color temperature |
| CRI | Color rendering index |
| E | Illuminance |
| FI | Flicker index |
| LPD | Lighting power density |
| PstLM | Short-term light flicker indicator |
| R9 | Special color rendering index for saturated red |
| SPD | Spectral power distribution |
| SVM | Stroboscopic visibility measure |
| TLM | Temporal light modulation |
| U0 | Illuminance uniformity, Emin/Emean |
| GIS | Geographic information system |
| ULR | Upward light ratio |
| EDI | Equivalent daylight illuminance |
References
- Ab Wahab, N.; Sahril, N.A.; Amiruddin, A.; Yasin, Z.M.; Salim, N.A.; Rahmat, N.A.; Aziz, N.F.A. Performance of Environmental and Energy Audit for Manufacturing Industrial Buildings. Indones. J. Electr. Eng. Comput. Sci. 2018, 12, 534–541. [Google Scholar] [CrossRef] [Scilit]
- Pham, K.; Garcia-Hansen, V.; Isoardi, G. Appraisal of the Visual Environment in an Industrial Factory: A Case Study in Subtropical Climates. J. Daylighting 2016, 3, 12–26. [Google Scholar] [CrossRef] [Scilit]
- Dolníková, E.; Katunský, D. Visual Comfort Assessment in an Industrial Environment: A Case Study. Environments 2019, 6, 54. [Google Scholar] [CrossRef] [Scilit]
- Dupláková, D.; Zajac, J.; Knapčíková, L.; Sloboda, P. Combined Approach to the Analysis of Lighting-Technical Parameters of Artificial Illumination at the Visual Task Area in the Production Hall. TEM J. 2024, 13, 2694–2702. [Google Scholar] [CrossRef] [Scilit]
- Shafavi, N.S.; Zomorodian, Z.S.; Tahsildoost, M.; Javadi, M. Occupants Visual Comfort Assessments: A Review of Field Studies and Lab Experiments. Sol. Energy 2020, 208, 249–274. [Google Scholar] [CrossRef] [Scilit]
- Uyan, E.; Atlar, M.; Ölçer, A.I. Improving the Energy Efficiency of Lighting Systems for a Marine Equipment Manufacturing Plant through Retrofitting, Daylighting, and Behaviour Change. J. Clean. Prod. 2023, 413, 137216. [Google Scholar] [CrossRef] [Scilit]
- Alsukkar, M.; Alkhater, M.; Su, Y.; Ibrahim, A. Optimizing Daylighting Performance and Energy Efficiency through the Integration of Parametric Split Louvers in Office Buildings. Energy Built Environ. 2026, 7, 1260–1274. [Google Scholar] [CrossRef] [Scilit]
- Knoop, M.; Broszio, K.; Diakite, A.; Liedtke, C.; Niedling, M.; Rothert, I.; Rudawski, F.; Weber, N. Methods to Describe and Measure Lighting Conditions in Experiments on Non-Image-Forming Aspects. LEUKOS 2019, 15, 163–179. [Google Scholar] [CrossRef] [Scilit]
- CIE TN 006:2016; Visual Aspects of Time-Modulated Lighting Systems-Definitions and Measurement Models. International Commission on Illumination (CIE): Vienna, Austria, 2016.
- European Commission. Commission Regulation (EU) 2019/2020 of 1 October 2019 Laying Down Ecodesign Requirements for Light Sources and Separate Control Gears, Consolidated Version 1 September 2021; European Commission: Brussels, Belgium, 2019.
- ISO/CIE 20086:2019; Light and Lighting-Energy Performance of Lighting in Buildings. International Organization for Standardization; International Commission on Illumination (ISO/CIE): Geneva, Switzerland, 2019.
- ISO/CIE 10916:2024; Light and Lighting-Energy Performance of Lighting in Buildings-Calculation of the Impact of Daylight Utilization. International Organization for Standardization; International Commission on Illumination (ISO/CIE): Geneva, Switzerland, 2024.
- Pracki, P.; Skarżyński, K. A Multi-Criteria Assessment Procedure for Outdoor Lighting at the Design Stage. Sustainability 2020, 12, 1330. [Google Scholar] [CrossRef] [Scilit]
- Cárdenas, L.; Herrera, F.; Acuña, P. Multi-Criteria Decision-Making Methods for Labelling Energy, Visual and Circadian Performance of LED Lighting Products. Light. Res. Technol. 2026, 58, 47–67. [Google Scholar] [CrossRef] [Scilit]
- Madias, E.-N.D.; Doulos, L.T.; Kontaxis, P.A.; Topalis, F.V. A Decision Support System for Techno-Economic Evaluation of Indoor Lighting Systems with LED Luminaires. Oper. Res. 2021, 21, 1403–1422. [Google Scholar] [CrossRef] [Scilit]
- Ruiz, V.; Rodriguez, R.; Pattini, A. Expert Consensus on Integrative Lighting Descriptors and Indicators for Green Building Rating Systems: A Delphi Study. Light. Res. Technol. 2025, 57, 108–126. [Google Scholar] [CrossRef] [Scilit]
- Ibrahim, A.; Alsukkar, M.; Xu, Y.; Hermaputi, R.L.; Yin, S.; Xiao, Y. The Potential of Large Language Models for Sustainable Building Performance: A Review of Applications, Evaluation Practices, and Reliability. Energy Sustain. Dev. 2026, 95, 102104. [Google Scholar] [CrossRef] [Scilit]
- Ibrahim, A.; Alsukkar, M.; Eltaweel, A.; Hermaputi, R.L. Multi-Objective Optimization of Daylighting for an Office Space in a Very Hot Climate: A Comparison of Corrugated, Perforated, and Separated Shadings. Buildings 2026, 16, 2625. [Google Scholar] [CrossRef] [Scilit]
- Falchi, F.; Cinzano, P.; Duriscoe, D.; Kyba, C.C.M.; Elvidge, C.D.; Baugh, K.; Portnov, B.A.; Rybnikova, N.A.; Furgoni, R. The New World Atlas of Artificial Night Sky Brightness. Sci. Adv. 2016, 2, e1600377. [Google Scholar] [CrossRef] [Scilit] [PubMed]
- Longcore, T.; Rich, C. Ecological Light Pollution. Front. Ecol. Environ. 2004, 2, 191–198. [Google Scholar] [CrossRef]
- Hölker, F.; Wolter, C.; Perkin, E.K.; Tockner, K. Light Pollution as a Biodiversity Threat. Trends Ecol. Evol. 2010, 25, 681–682. [Google Scholar] [CrossRef] [Scilit] [PubMed]
- Górniak-Zimroz, J.; Romańczukiewicz, K.; Sitarska, M.; Szrek, A. Light-Pollution-Monitoring Method for Selected Environmental and Social Elements. Remote Sens. 2024, 16, 774. [Google Scholar] [CrossRef] [Scilit]
- Galatanu, C.D.; Gherasim, I.; Beu, D.; Lucache, D.D. Luminance Field of the Façades: From Aggressive to Attractive Lighting. In 2018 IEEE International Conference on Environment and Electrical Engineering and 2018 IEEE Industrial and Commercial Power Systems Europe (EEEIC/I&CPS Europe); IEEE: New York, NY, USA, 2018; pp. 1–5. [Google Scholar]
- CIE 150:2017; Guide on the Limitation of the Effects of Obtrusive Light from Outdoor Lighting Installations, 2nd Edition. International Commission on Illumination (CIE): Vienna, Austria, 2017.
- International Commission on Illumination. CIE Position Statement on Obtrusive Light and Light Pollution, 1st ed.; CIE: Vienna, Austria, 2025. [Google Scholar]
- Serea, E.; Lucache, D.D. Consequences of Inappropriate Use of Architectural Lighting. In Proceedings of the 2020 International Conference and Exposition on Electrical and Power Engineering (EPE), Iasi, Romania, 22–23 October 2020; pp. 16–21. [Google Scholar]
- Skarżyński, K.; Rutkowska, A. The Interplay between Parameters of Light Pollution and Energy Efficiency for Outdoor Amenity Lighting. Energies 2023, 16, 3530. [Google Scholar] [CrossRef] [Scilit]
- Saaty, T.L. Decision Making with the Analytic Hierarchy Process. Int. J. Serv. Sci. 2008, 1, 83–98. [Google Scholar] [CrossRef] [Scilit]
- Hanine, M.; Boutkhoum, O.; Tikniouine, A.; Agouti, T. Application of an Integrated Multi-Criteria Decision Making AHP-TOPSIS Methodology for ETL Software Selection. SpringerPlus 2016, 5, 263. [Google Scholar] [CrossRef] [Scilit] [PubMed]
- GOSSEN Foto-und Lichtmesstechnik GmbH. MAVOSPEC BASE Operating Instructions; GOSSEN: Nuremberg, Germany, 2024. [Google Scholar]
- IES TM-30-20; IES Method for Evaluating Light Source Color Rendition. Illuminating Engineering Society (IES): New York, NY, USA, 2020.
- ISO/CIE 19476:2014; Characterization of the Performance of Illuminance Meters and Luminance Meters. International Organization for Standardization; International Commission on Illumination (ISO/CIE): Geneva, Switzerland, 2014.
- Rasouli Kahaki, Z.; Jahangiri, H.; Smith, A.P.; Kazemi, R. Subjective and Objective Survey of Office Lighting: Effects on Alertness, Comfort, Satisfaction, and Safety. Med. Lav. 2022, 113, e2022024. [Google Scholar] [CrossRef] [Scilit] [PubMed]
- Suk, J.Y. Luminance and Vertical Eye Illuminance Thresholds for Occupants’ Visual Comfort in Daylit Office Environments. Build. Environ. 2019, 148, 107–115. [Google Scholar] [CrossRef] [Scilit]
- Giovannini, L.; Favoino, F.; Lo Verso, V.R.M.; Pellegrino, A.; Serra, V. A Simplified Approach for the Annual and Spatial Evaluation of the Comfort Classes of Daylight Glare Using Vertical Illuminances. Buildings 2018, 8, 171. [Google Scholar] [CrossRef] [Scilit]
- Graser, A.; Sutton, T.; Bernasocchi, M. The QGIS Project: Spatial without Compromise. Patterns 2025, 6, 101265. [Google Scholar] [CrossRef] [Scilit] [PubMed]
- EN 12464-2:2024; Light and Lighting-Lighting of Work Places-Part 2: Outdoor Work Places. European Committee for Standardization (CEN): Brussels, Belgium, 2024.
- CIE 126-1997; Guidelines for Minimizing Sky Glow. International Commission on Illumination (CIE): Vienna, Austria, 1997.
- CIE S 026/E:2018; CIE System for Metrology of Optical Radiation for ipRGC-Influenced Responses to Light. International Commission on Illumination (CIE): Vienna, Austria, 2018.
- International Commission on Illumination. CIE Position Statement on Integrative Lighting Recommending Proper Light at the Proper Time, 3rd ed.; CIE: Vienna, Austria, 2024. [Google Scholar]
- CIE 146/147:2002; CIE Collection on Glare 2002. International Commission on Illumination (CIE): Vienna, Austria, 2002.
- Galadí-Enríquez, D. Beyond CCT: The Spectral Index System as a Tool for the Objective, Quantitative Characterization of Lamps. J. Quant. Spectrosc. Radiat. Transf. 2018, 206, 399–408. [Google Scholar] [CrossRef] [Scilit]
- Doulos, L.T.; Sioutis, I.; Kontaxis, P.; Zissis, G.; Faidas, K. A Decision Support System for Assessment of Street Lighting Tenders Based on Energy Performance Indicators and Environmental Criteria: Overview, Methodology and Case Study. Sustain. Cities Soc. 2019, 51, 101759. [Google Scholar] [CrossRef] [Scilit]
- Directorate-General for Environment. Light Pollution: Mitigation Measures for Environmental Protection; Publications Office of the European Union: Luxembourg, 2023. [Google Scholar]
- Sepúlveda, A.; Bueno, B.; Wang, T.; Wilson, H.R. Benchmark of Methods for Annual Glare Risk Assessment. Build. Environ. 2021, 201, 108006. [Google Scholar] [CrossRef] [Scilit]
- ISO/CIE 8995-1:2025; Light and Lighting-Lighting of Work Places-Part 1: Indoor. International Organization for Standardization; International Commission on Illumination (ISO/CIE): Geneva, Switzerland, 2025.
- EN 12464-1:2021; Light and Lighting-Lighting of Work Places-Part 1: Indoor Work Places. European Committee for Standardization (CEN): Brussels, Belgium, 2021.
- Castillo-Martinez, A.; Medina-Merodio, J.-A.; Gutierrez-Martinez, J.-M.; Aguado-Delgado, J.; De-Pablos-Heredero, C.; Otón, S. Evaluation and Improvement of Lighting Efficiency in Working Spaces. Sustainability 2018, 10, 1110. [Google Scholar] [CrossRef] [Scilit]
- Amirkhani, M.; Garcia-Hansen, V.; Isoardi, G.; Allan, A. An Energy Efficient Lighting Design Strategy to Enhance Visual Comfort in Offices with Windows. Energies 2017, 10, 1126. [Google Scholar] [CrossRef] [Scilit]
- Balocco, C.; Volante, G. Lighting Design for Energy Sustainability, Information, and Perception: A Museum Environment as a Case Study. Sustainability 2018, 10, 1671. [Google Scholar] [CrossRef] [Scilit]
- Shackelford, J.; Mathew, P.; Regnier, C.; Walter, T. Laboratory Validation of Integrated Lighting Systems Retrofit Performance and Energy Savings. Energies 2020, 13, 3329. [Google Scholar] [CrossRef] [Scilit]
- Thomson, G.D.; Davis, R.G.; Fernandes, L.; Wang, T. Achieving Integrated Daylighting and Electric Lighting Systems: Current State of the Art and Needed Research. Energies 2021, 14, 3833. [Google Scholar] [CrossRef] [Scilit]
- Gentile, N.; Lee, E.S.; Osterhaus, W.; Altomonte, S.; Naves David Amorim, C.; Ciampi, G.; Garcia-Hansen, V.; Maskarenj, M.; Scorpio, M.; Sibilio, S. Evaluation of Integrated Daylighting and Electric Lighting Design Projects: Lessons Learned from International Case Studies. Energy Build. 2022, 268, 112191. [Google Scholar] [CrossRef] [Scilit]
- Albu, H.; Beu, D.; Rus, T.; Moldovan, R.; Domniţa, F.; Vilčeková, S. Life Cycle Assessment of LED Luminaire and Impact on Lighting Installation—A Case Study. Alex. Eng. J. 2023, 80, 282–293. [Google Scholar] [CrossRef] [Scilit]
- ASHRAE. ANSI/ASHRAE/ACCA Standard 211-2018 (RA 2023), Standard for Commercial Building Energy Audits; ASHRAE: Atlanta, GA, USA, 2018. [Google Scholar]
- Efficiency Valuation Organization. International Performance Measurement and Verification Protocol (IPMVP): Core Concepts; EVO: Washington, DC, USA, 2022. [Google Scholar]
- Weidema, B.P.; Wesnæs, M.S. Data Quality Management for Life Cycle Inventories-An Example of Using Data Quality Indicators. J. Clean. Prod. 1996, 4, 167–174. [Google Scholar] [CrossRef] [Scilit]
- Salo, A.A.; Hämäläinen, R.P. Preference Ratios in Multiattribute Evaluation (PRIME)-Elicitation and Decision Procedures under Incomplete Information. IEEE Trans. Syst. Man Cybern. Part A Syst. Hum. 2001, 31, 533–545. [Google Scholar] [CrossRef] [Scilit]
- Munda, G. Social Multi-Criteria Evaluation for a Sustainable Economy; Springer: Berlin/Heidelberg, Germany, 2008. [Google Scholar]

Disclaimer/Publisher’s Note: The statements, opinions and data contained in all publications are solely those of the individual author(s) and contributor(s) and not of MDPI and/or the editor(s). MDPI and/or the editor(s) disclaim responsibility for any injury to people or property resulting from any ideas, methods, instructions or products referred to in the content. |
© 2026 by the authors. Licensee MDPI, Basel, Switzerland. This article is an open access article distributed under the terms and conditions of the Creative Commons Attribution (CC BY) license.