


Abstract
Bentonite slurry is used to maintain trench stability during cut-off wall construction. Because the slurry level remains above the groundwater table, slurry can infiltrate the surrounding soil and form a spatially heterogeneous clogging structure within the pore network. In this study, field excavation of an experimental cut-off wall was conducted to observe the slurry infiltration into the surrounding soil. A large-scale laboratory experimental apparatus was developed to reproduce the slurry infiltration into soil and test the seepage erosion resistance of the clogging structure. Field observations revealed a distinct interfacial filter cake and bridging zone in the soil adjacent to the wall, and grain size distribution analyses of wall-adjacent samples indicated an enrichment of fine material consistent with slurry intrusion. The laboratory results showed that the post-clogging specimens exhibited lower hydraulic conductivity and fines eroded ratios, together with higher progression hydraulic gradients, than the corresponding baseline specimens. However, no replicate tests were conducted, no water-treated process control was included, and no in situ permeability tests were performed in the slurry-affected soil. Accordingly, the results characterize the bulk hydraulic and erosion responses of internally unstable gravelly soils following support-slurry intrusion during cut-off wall construction, rather than the overall seepage performance of cut-off walls with explicit defects. The slurry-affected zone should therefore be considered in seepage analyses around local wall defects.
1. Introduction
Internal erosion caused by seepage threatens the safety of earth-rock dams and levees during long-term operation [1,2]. Concrete cut-off walls are widely used for seepage control [1,3,4]. The walls are commonly constructed panel by panel, with bentonite slurry used to stabilize the trench walls. With the slurry level in the trench above the groundwater table, slurry inevitably infiltrates the surrounding soil, leading to a spatially heterogeneous clogging structure [5,6,7]. This clogging structure alters the permeability and internal erosion resistance of the surrounding soil, thereby contributing to the seepage-sealing performance of cut-off walls containing defects. Therefore, clarifying the hydraulic and erosion responses of the surrounding soil following slurry infiltration is essential for the safe design and performance assessment of cut-off walls.
Slurry infiltrates coarse-grained strata through the pore network, while suspended particles are selectively retained at pore constrictions and progressively form bridges and deposits. This process produces a heterogeneous clogging structure comprising an interfacial filter cake, a near-wall bridging zone and a deeper invasion zone [7,8,9,10]. Experimental and pore-scale studies have shown that slurry composition, soil gradation, and pore geometry control the particle retention, filter-cake formation, and the hydraulic resistance of the clogged zone [11,12,13,14,15,16]. The resulting reduction in pore connectivity and effective flow area can substantially decrease the hydraulic conductivity of the surrounding soil [7,9,12,16]. These studies have established the formation mechanisms and hydraulic consequences of slurry-induced clogging. However, existing research has focused primarily on slurry infiltration and the associated reduction in permeability, while the subsequent internal erosion behavior of the clogged soil remains insufficiently understood.
The urgency to clarify this contribution stems from the inherent internal instability of the surrounding strata. Gravelly soil commonly comprises broadly graded sand-gravel mixtures. Because the coarse-grained skeleton cannot fully retain the finer fraction, fine particles may detach, migrate through the pore network and be washed out under seepage, giving rise to internal erosion [17,18,19]. As erosion progresses, the pore structure, hydraulic properties and mechanical response of the soil evolve, thereby affecting the long-term seepage stability of the surrounding soil [17,18]. Internal stability is commonly assessed using particle-size-based criteria, including the Kenney-Lau, Sherard, Wan-Fell and Chang-Zhang criteria [19,20,21,22]. The initiation and development of internal erosion are not only controlled by particle gradation and fines content but also hydraulic loading and stress state as revealed by extensive experimental studies [23,24,25,26,27]. In addition, the mechanical response of the soil after the erosion is determined by the amount of particles lost [28,29,30,31,32]. Current assessments, however, usually consider the pristine soil structure but not the altered pore network resulting due to slurry infiltration. Consequently, the extent to which this clogging process inhibits the loss of fine particles and enhances the overall resistance of the soil to internal erosion is not well understood.
Slurry-induced clogging and internal erosion are sequentially linked through particle migration and the associated evolution of the pore network. The retention and bridging of slurry particles at pore throats reduce pore connectivity and effective flow area, thereby modifying the local hydraulic and geometric conditions that govern the detachment and transport of native fines [33,34,35,36]. The influence of surcharge pressure on this coupling is mainly associated with compression-induced changes in pore geometry and interparticle confinement, which constrain slurry penetration and fines migration [37,38]. Nevertheless, how surcharge pressure governs the spatial development of slurry-induced clogging and how the resulting clogging structure modifies soil permeability and internal erosion resistance relative to the original condition remain insufficiently understood.
To address these issues, field excavation of an experimental cut-off wall was first conducted to identify the occurrence and spatial characteristics of slurry-induced clogging in the surrounding gravelly soil. Then, large-scale horizontal seepage tests were performed on internally unstable gravelly soils under different surcharge pressures to reproduce slurry infiltration and subsequent internal erosion under controlled conditions. The spatial development of the clogging zone, together with the changes in hydraulic conductivity and internal erosion behavior before and after slurry infiltration, were systematically evaluated.
2. Field Observation
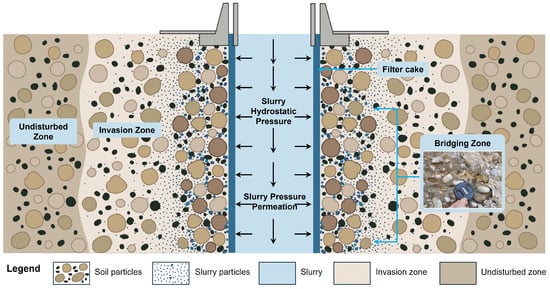
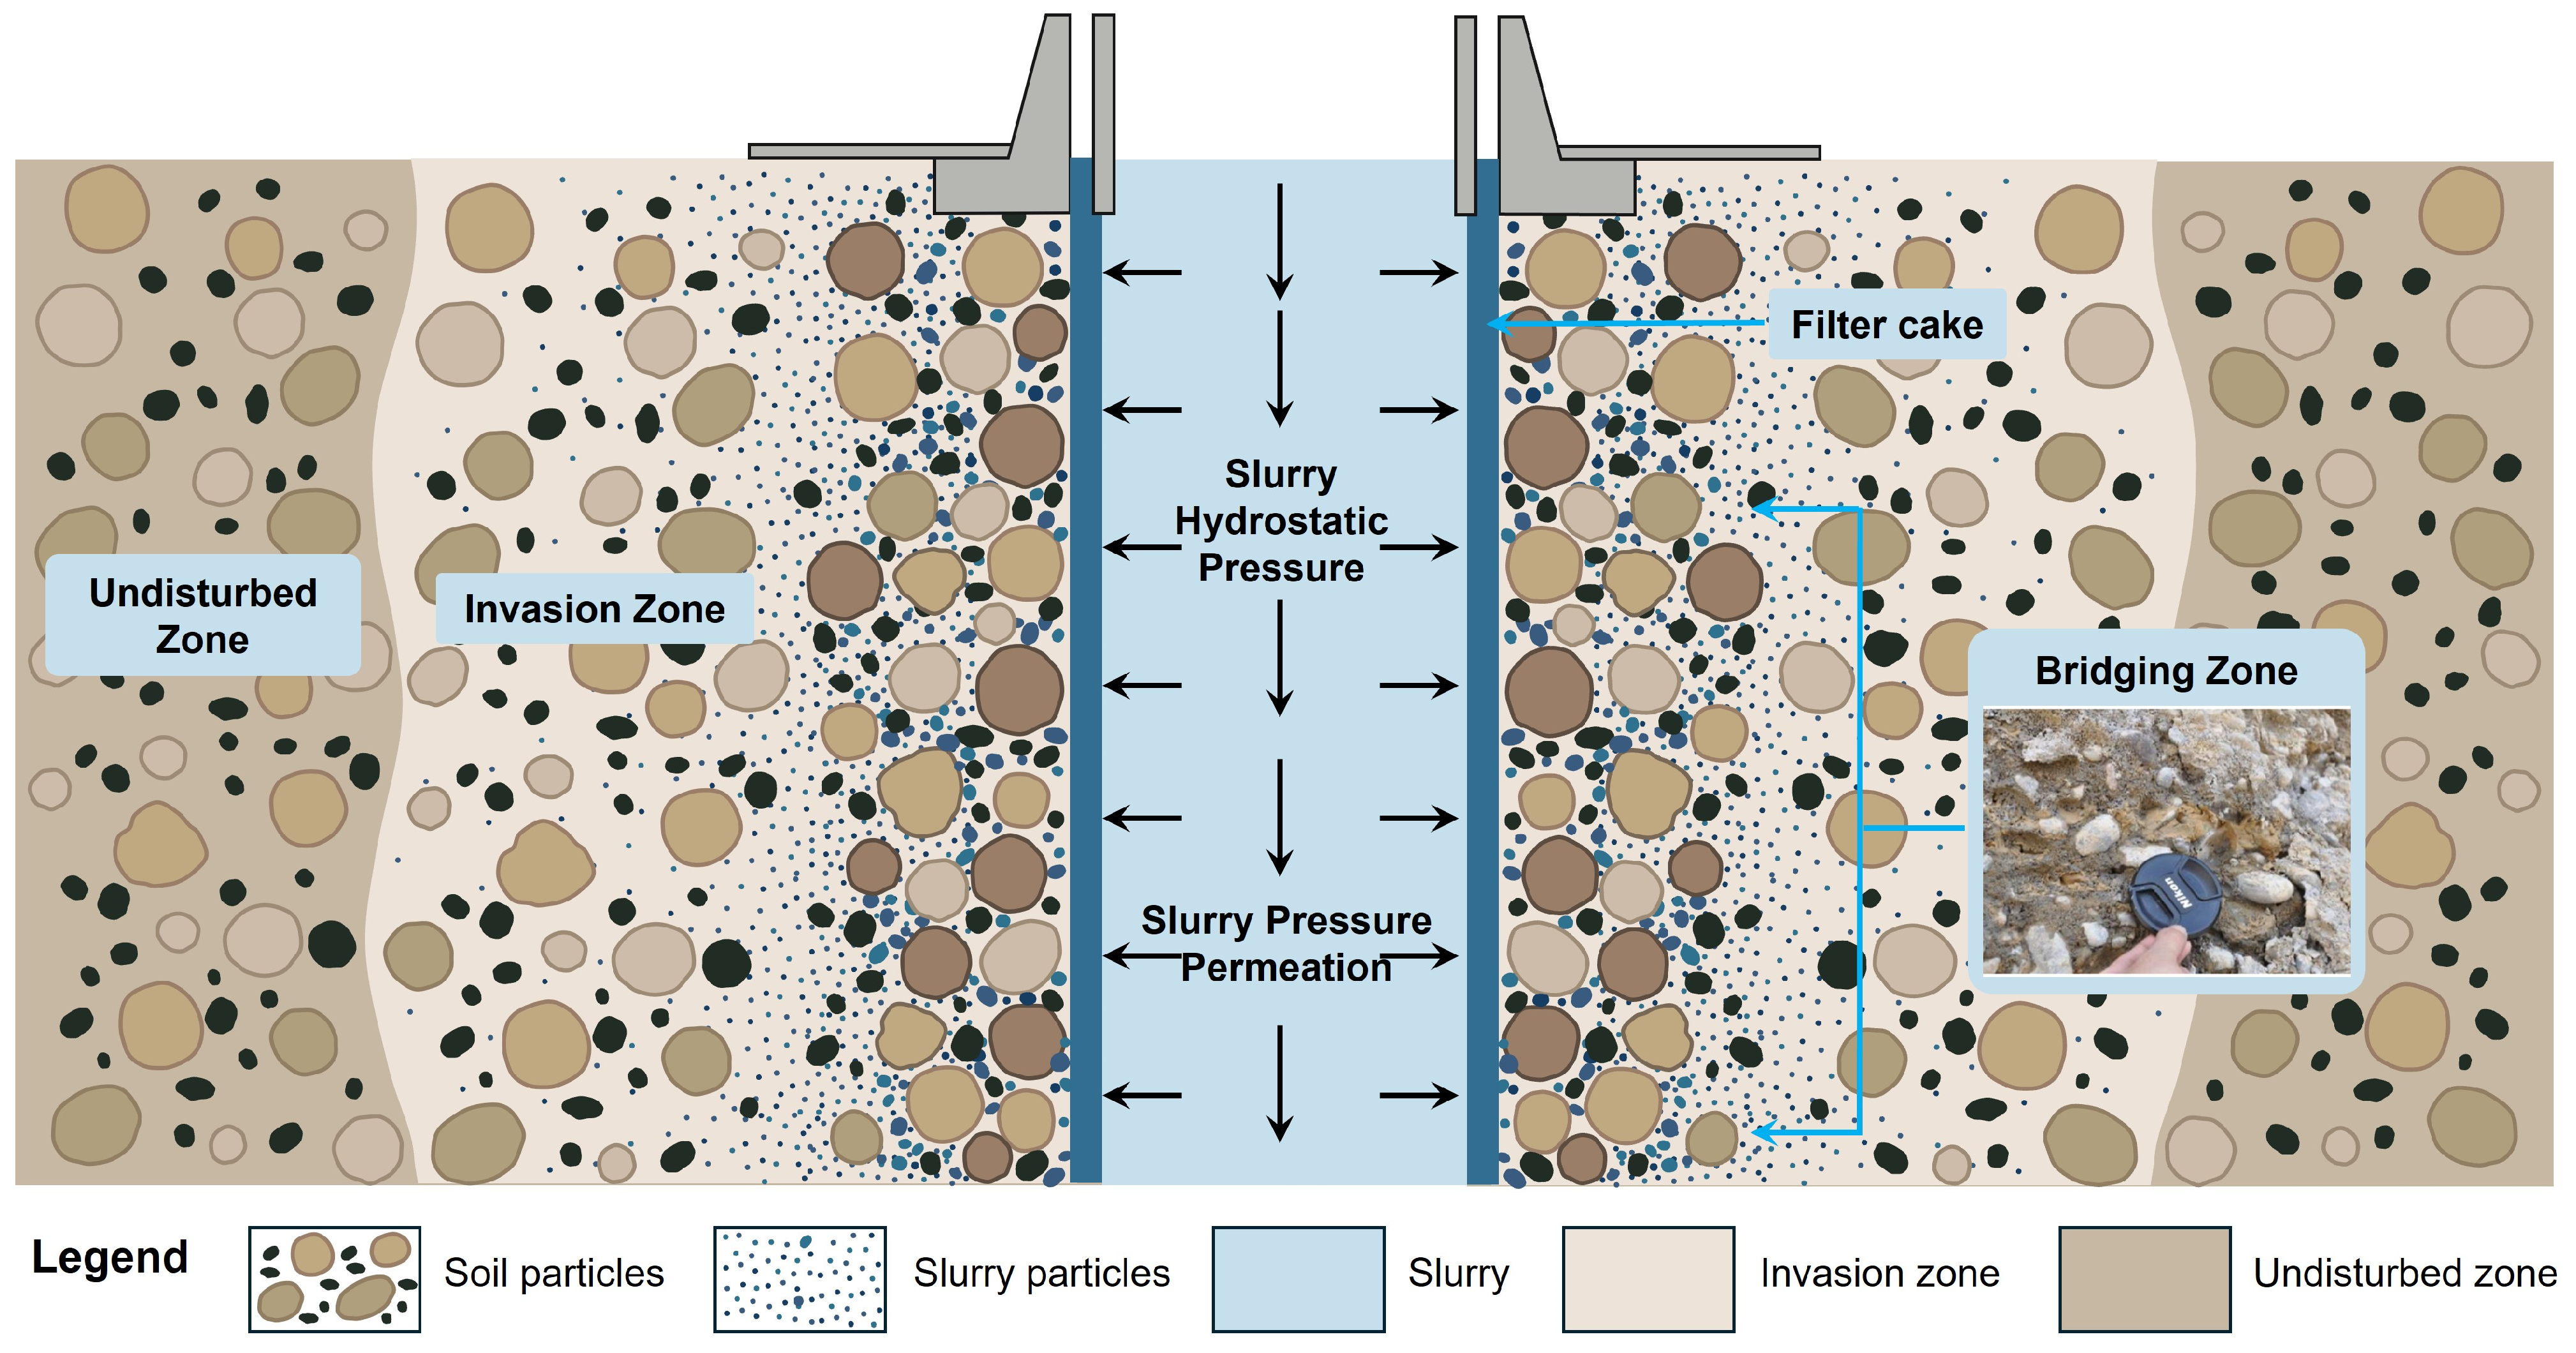
Concrete cut-off walls are typically constructed using a panel-by-panel method to form a continuous seepage barrier. During trench excavation, the trench is filled with support slurry to maintain trench-wall stability. Because the slurry level is maintained above the ambient groundwater table, an excess hydraulic head develops across the soil-slurry interface, driving slurry infiltration into the surrounding soils. As illustrated in Figure 1, larger suspended particles are preferentially retained at narrow pore throats to form a bridging zone, whereas smaller particles migrate farther with the seepage flow and progressively deposit as the seepage velocity decreases, giving rise to an invasion zone. Meanwhile, continued filtration and fine particle accumulation at the soil-slurry interface result in the formation of a low-permeability external filter cake. Together, the filter cake, bridging zone, and invasion zone form a spatially heterogeneous clogging structure that may change the hydraulic conductivity and internal erosion resistance of the surrounding soil.
Figure 1.
Conceptual illustration of slurry infiltration and the formation of a filter cake, bridging zone, and invasion zone.
For field observation of slurry infiltration and clogging, experimental cut-off walls were constructed at a downstream test site of the earth-rock dam. These experimental walls, which were separate from the permanent cut-off wall of the dam, were approximately 16–18 m deep and 1.2 m thick, with a spacing of about 5 m between adjacent walls. Each construction panel was approximately 6 m in length. The upper portion of the overburden comprises Quaternary alluvial sandy-pebble deposits, with a typical thickness of approximately 3–7 m and a local maximum thickness of about 11 m. These deposits are underlain by gravelly strata. Groundwater within the overburden is hydraulically connected to the river and is recharged primarily by precipitation, bedrock-fissure water, and river water. Consequently, the groundwater level generally fluctuates in response to changes in river stage.
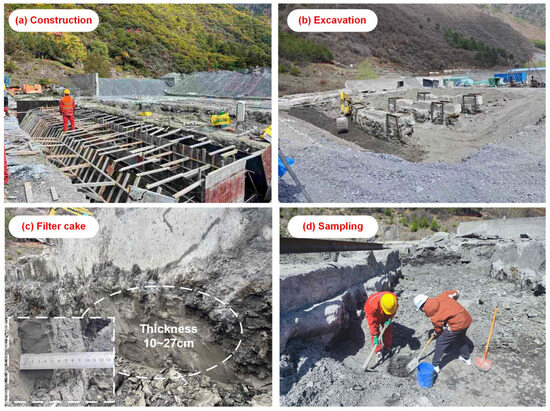
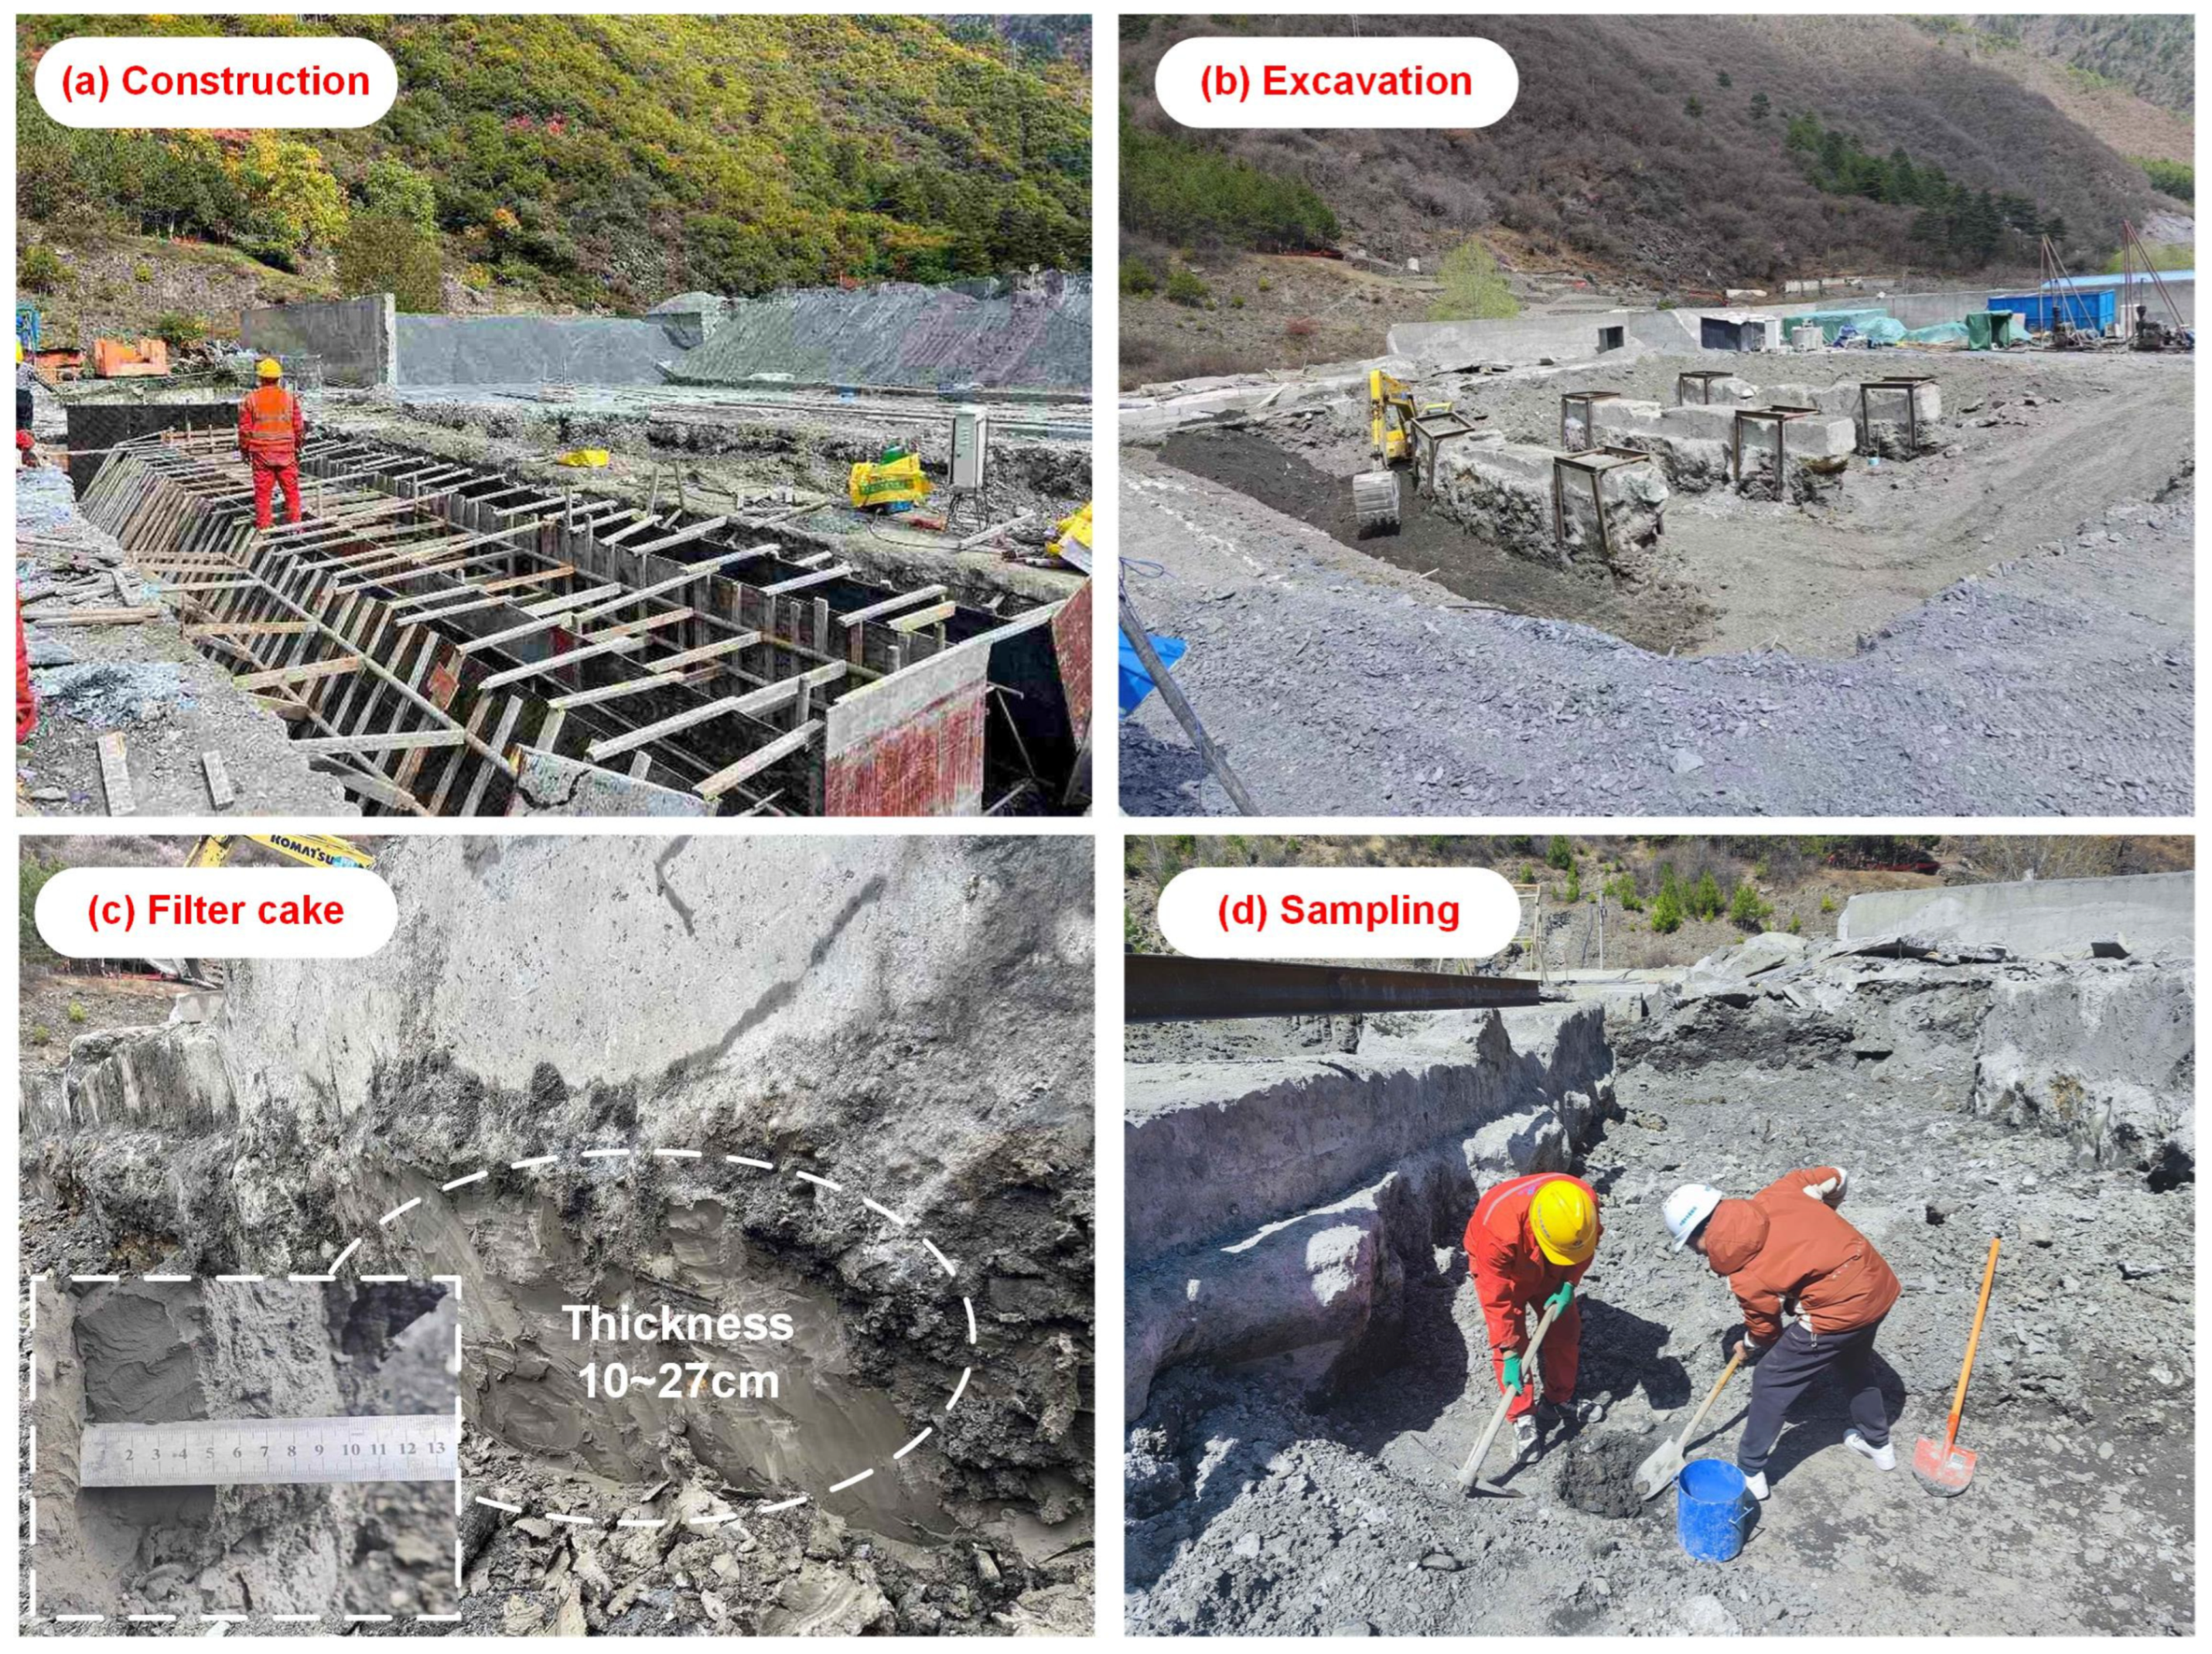
The soil samples used in this study were collected from the Quaternary alluvial sandy-pebble deposits. The natural soil had a bulk density of 2.18–2.29 g/cm3, a dry density of 1.98–2.07 g/cm3, and a water content of 9.96–10.41%, with a fine fraction content of 7.6%. Based on an average bulk density of 2.22 g/cm3 and the approximately 95 m depth of the permanent cut-off wall, the maximum vertical overburden stress was estimated to be approximately 2.0 MPa. The in situ soil is highly permeable, dominated by coarse particles and a wide range of pore sizes with few fines, which naturally provided preferential pathways for the slurry. Further digging of the neighboring soil distinctly revealed the clogging structures (Figure 2). It is noteworthy that a separate filter cake was discovered at the interface between wall and soil. Field testing measured its thickness to be 10–27 cm, natural density of 1.87 g/cm3 and water content of 28.74%.
Figure 2.
(a) Construction of the cut-off wall; (b) excavation of the adjacent soil; (c) filter cake created at the wall–soil interface; (d) extraction of soil samples in the bridging zone.
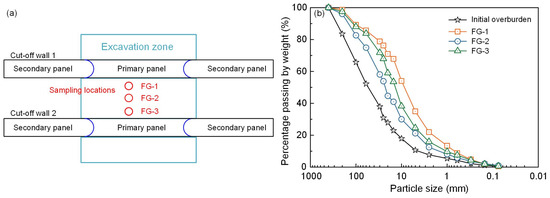
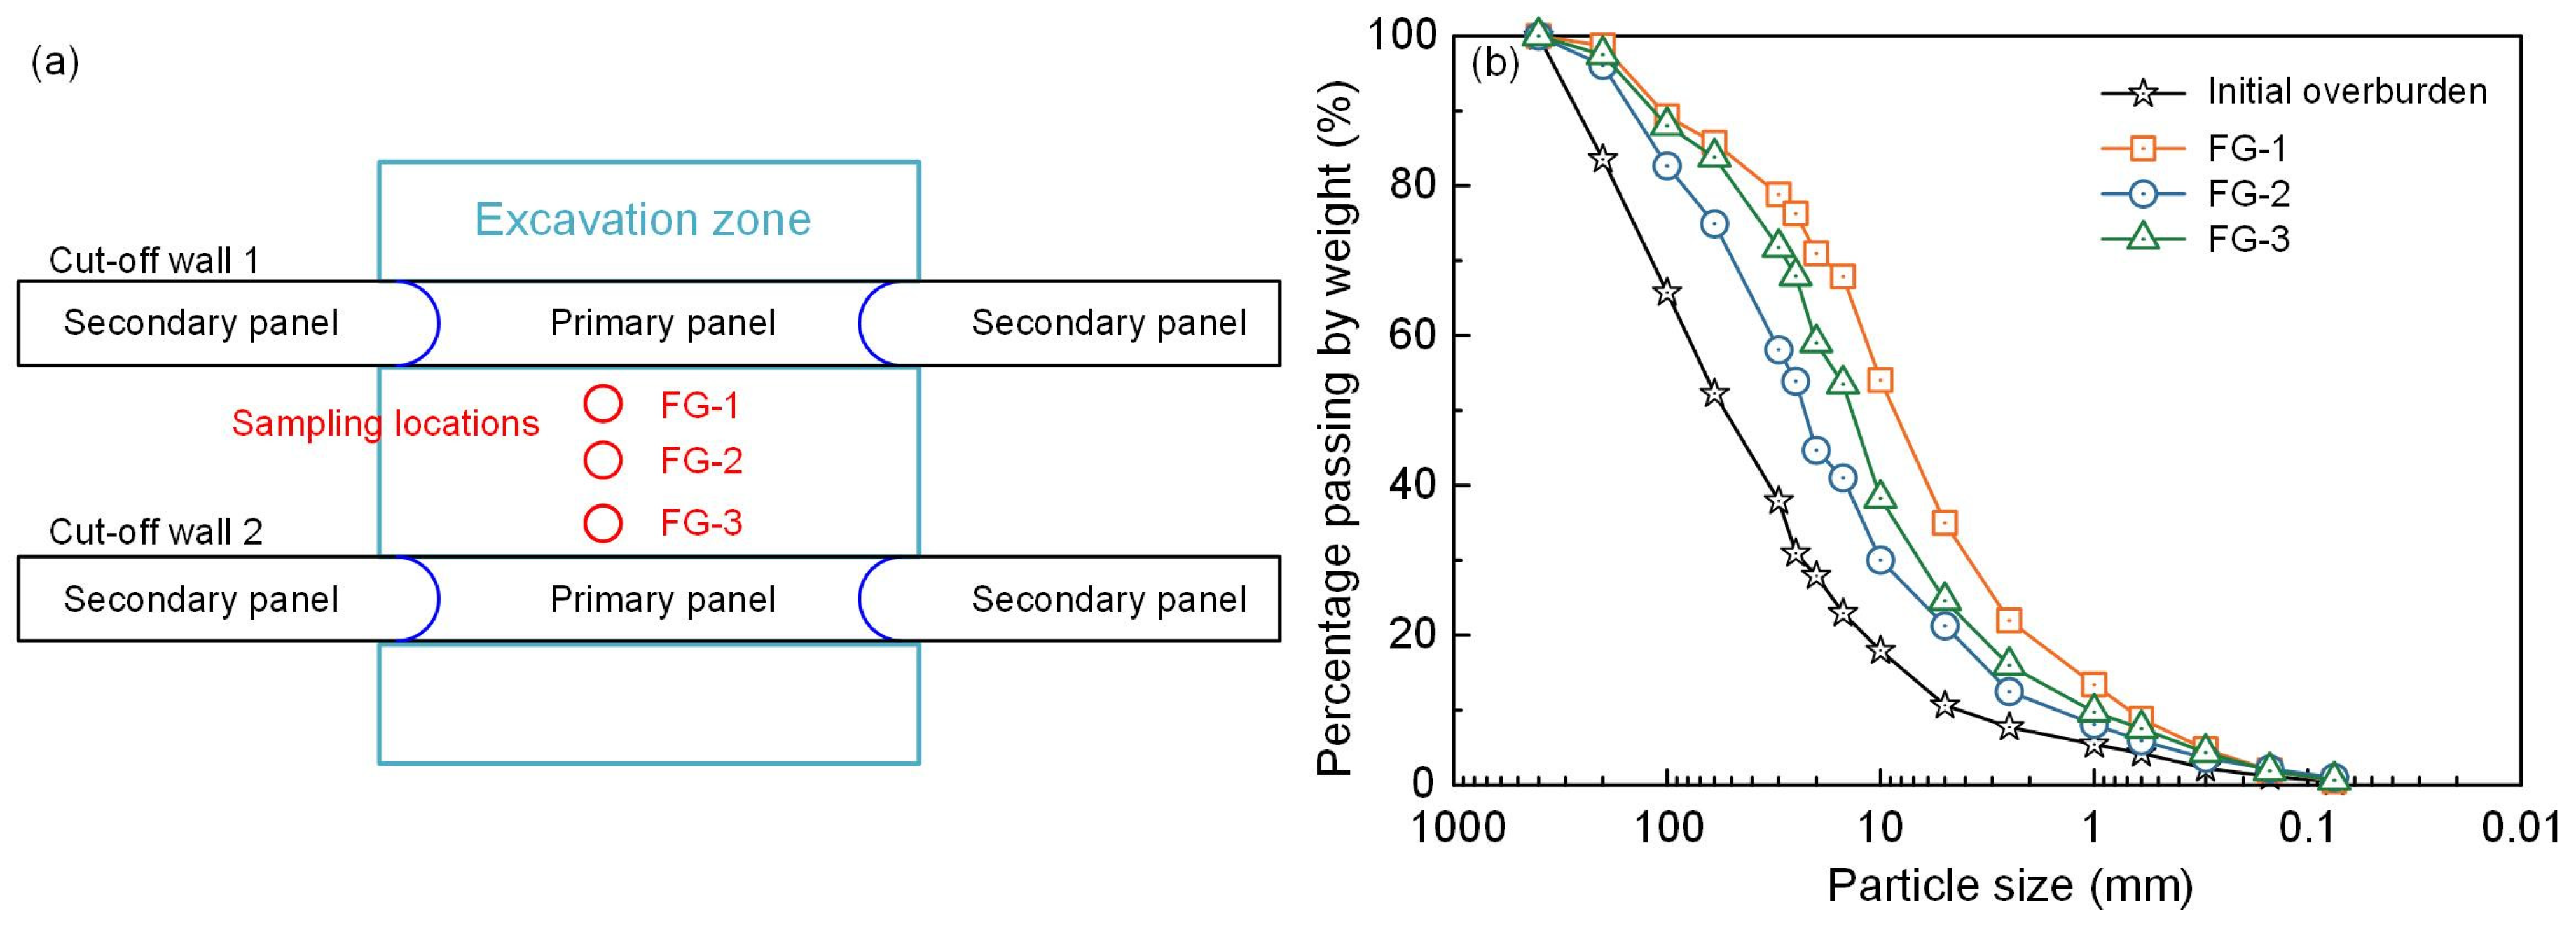
Figure 3 shows the post-excavation sampling sites and the particle size distributions. The grading curves of samples FG-1, FG-2 and FG-3 show a clear shift towards the finer fraction relative to the undisturbed soil. The shift toward finer particle sizes indicates enrichment of fine material in the soil adjacent to the cut-off wall. The elevated fine fraction content near the wall and its gradual decrease with increasing distance are consistent with slurry intrusion and subsequent particle retention within the surrounding pore network.
Figure 3.
Post-construction soil sampling: (a) the spatial arrangement of the sampling points between the cut-off walls, and (b) the particle size distributions of the samples.
Taken together, these field observations are consistent with the formation of a spatially nonuniform slurry-affected zone characterized by an interfacial filter cake and particle accumulation near pore constrictions. Because no in situ permeability tests were performed, the field investigation could not directly quantify changes in hydraulic conductivity associated with slurry-induced clogging. The corresponding hydraulic and erosion responses of the clogged zone were therefore assessed through the subsequent laboratory testing program.
3. Laboratory Experiments
3.1. Testing Apparatus
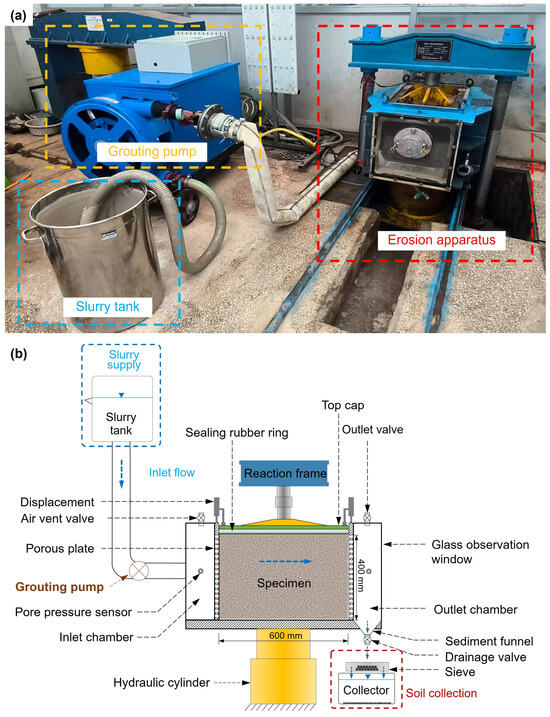
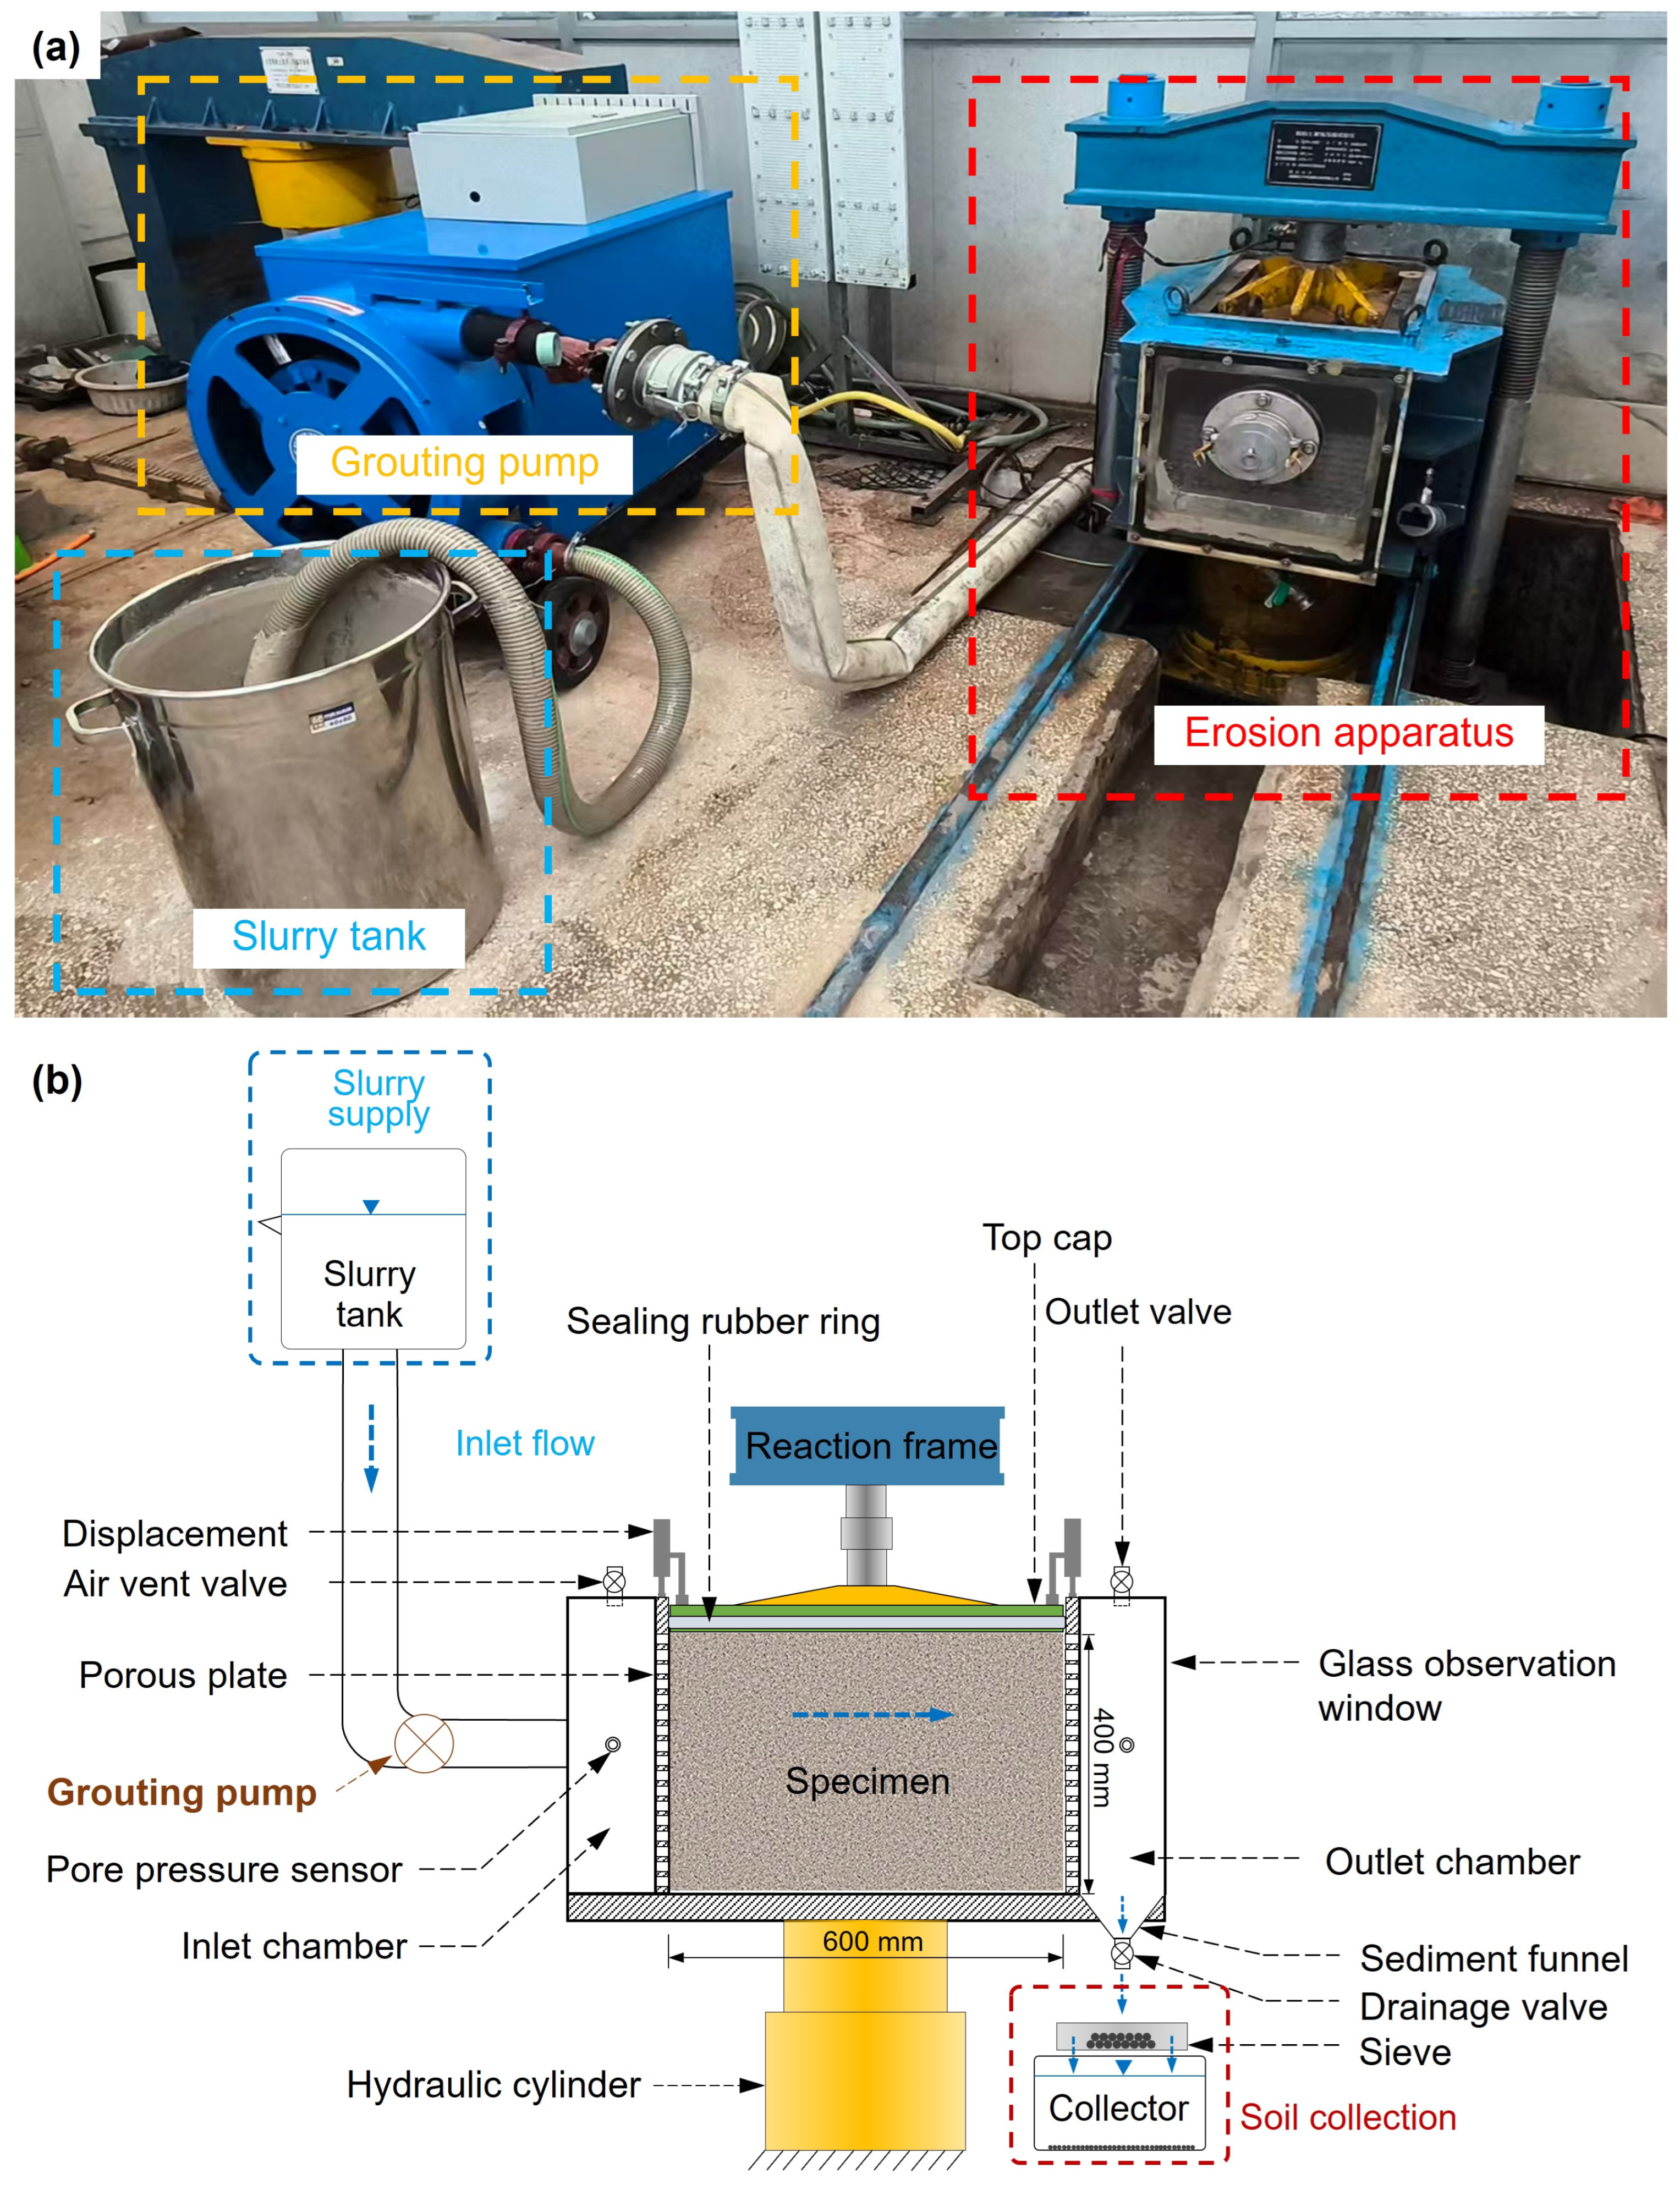
The slurry infiltration tests were performed with a modified large-scale device, as shown in Figure 4. This device was originally developed to investigate horizontal internal erosion at high surcharge pressures and has a large testing chamber (600 mm long and 400 mm × 400 mm cross-section). These sizes are carefully selected to allow for coarse-grained soil, thereby reducing scale effects on slurry penetration and transport of particles.
Figure 4.
Large-scale slurry infiltration test apparatus. (a) Photograph and (b) schematic configuration.
During testing, the grouting pump draws slurry from the storage tank and delivers it to the inlet chamber. The pump output is adjusted to control the inlet pressure. Subsequently, the slurry is distributed uniformly across the specimen inlet through a porous plate and infiltrates horizontally through the specimen under the imposed pressure gradient before entering the outlet chamber. The specimen chamber is closed by a vertically movable top cap fitted with a peripheral rubber seal to prevent leakage along the cap-wall interface. The prescribed surcharge pressure is applied to the specimen through the hydraulic cylinder. Specimen deformation is determined from the vertical displacement of the top cap, which is recorded continuously throughout the test. Meanwhile, pore pressure sensors installed at the inlet and outlet were used to monitor the boundary pressures. The hydraulic gradient was calculated from the pressure difference between the inlet and outlet and represents the average hydraulic gradient across the specimen. Because no pore pressure sensors were embedded within the specimen, the local pore pressure distribution and local hydraulic gradients along the seepage path were not directly measured. The transparent window in the outlet chamber allows direct observation of fine-particle discharge from the specimen. The eroded fines settle in the sedimentation funnel and are periodically discharged into a collector for subsequent mass measurement.
3.2. Testing Materials
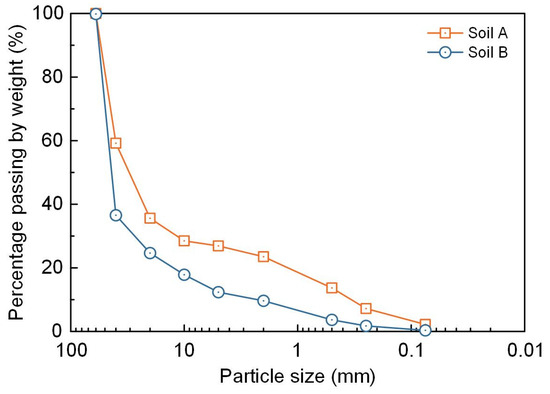
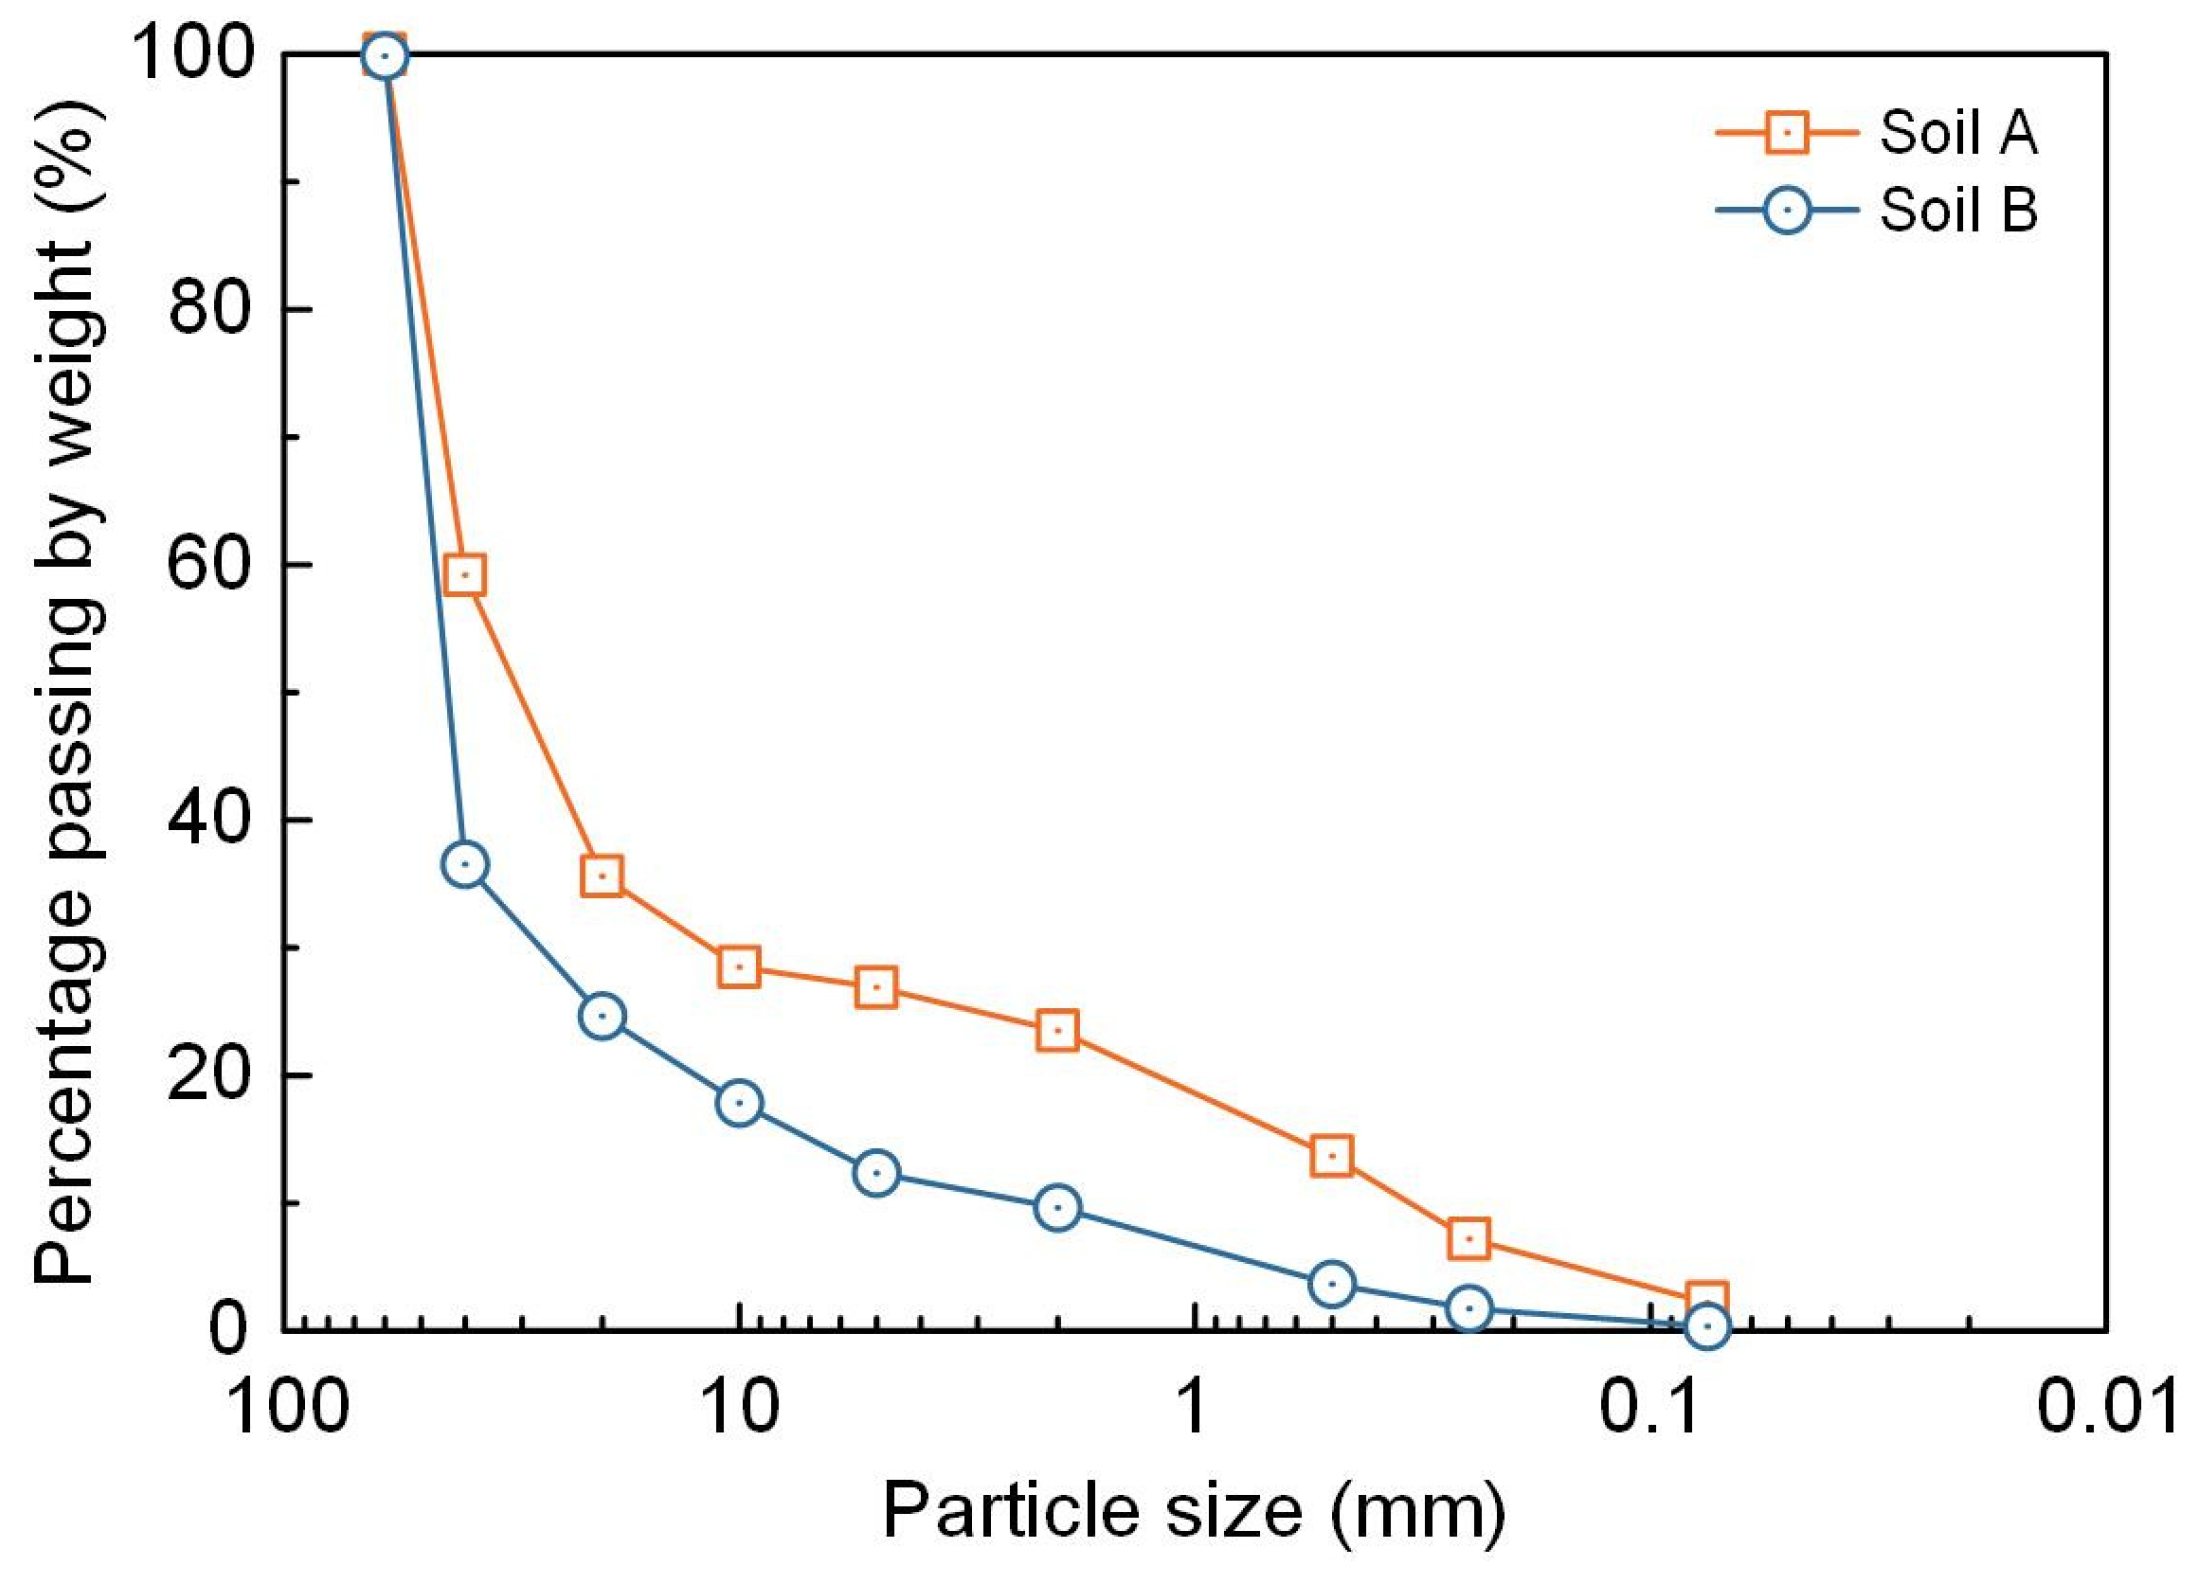
The test soils were reconstituted from the field gravelly soil described in Section 2. The field soil contained 7.6% fines and exhibited a broader particle size range, including particles larger than 60 mm. Owing to the dimensional limitations of the test apparatus, particles larger than 60 mm were removed before specimen preparation, resulting in truncation of the original gradation and modification of the coarse particle skeleton represented in the laboratory specimens. In addition, moist tamping altered particle contacts and pore-throat geometry. Consequently, the pore structure of the reconstituted specimens was not identical to that of the in situ soil. Two test soils with different fine fraction contents were prepared. Soil B had an initial fine fraction content of 8.6% and closely represented the field soil, whereas Soil A had an initial fine fraction content of 23.8%. The corresponding particle size distributions are presented in Figure 5. For the purpose of quantifying particle loss during internal erosion, the fine fraction in this study was operationally defined as soil particles smaller than 2 mm (d < 2 mm), following the definitions adopted in previous internal erosion studies [31,35]. The fine fraction content, Ff, was calculated as
where is the initial dry mass of particles smaller than 2 mm and is the initial total dry mass of the soil specimen. Based on this definition, the initial fine fraction contents of Soils A and B were 23.8% and 8.6%, respectively. The 15 mm outlet apertures were sufficiently large to permit the discharge of particles within this defined fine fraction without substantial outlet clogging [37].
Figure 5.
Particle size distributions of the test soils.
According to the geometric criteria summarized in Table 1, both test soils were classified as internally unstable. Their fine particles are therefore susceptible to mobilization and transport through the pore network of the coarse skeleton under seepage flow. This susceptibility makes the soils suitable for comparison of the internal erosion responses before and after slurry infiltration.
Table 1.
Geometric assessment of the internal stability of the test soils.
A weighted slurry was prepared to reproduce the support slurry used during trench excavation for concrete cut-off wall construction. The formulation consisted of sodium bentonite, barite powder, plant gum, surfactant, and water. Sodium bentonite provided the required viscosity and suspension capacity, whereas barite powder controlled the slurry density. Plant gum and surfactant were added to regulate the rheological behavior, particle dispersion, and suspension stability. Each batch contained 150 g of sodium bentonite, 4000 g of barite powder, 100 g of plant gum, 9 g of surfactant, and 1750 g of water. The bentonite, barite, plant gum, and surfactant used in this study were obtained directly from the field construction site. The slurry was therefore prepared using the same component masses and proportions as those adopted in the field, with the measured slurry properties summarized in Table 2. Accordingly, the present results are specific to the field-derived slurry formulation examined in this study and should not be generalized to other slurry formulations without further characterization and validation.
Table 2.
Mixture proportions and properties of the weighted slurry.
3.3. Specimen Preparation
Specimens were made in layers using the moist tamping method to avoid particle segregation that is inherent in such widely graded soils. The mass of individual fractions needed to produce each layer was calculated based on the desired dry density of 2050 kg/m3 and the required gradation, and then blended thoroughly to obtain an initial water content of 3%. The testing chamber was longitudinally divided into a 250 mm long upstream cobble zone and a 350 mm long test-soil zone with a steel wire mesh between them. This grid was successful in avoiding material intermixing without restricting slurry permeation, enabling the cobbles to serve as a very permeable buffer against injection-related disturbances.
To obtain a consistent vertical density profile, the cobbles and soil mixture had to be deposited in four equally thick layers. The under-compaction technique proposed by Ladd [42] was used to prepare the soil, where each lower layer is deliberately under-compacted to compensate for densification caused by overlying layers. At the same time, equal fill heights on either side of the mesh were able to prevent its bending. This holistic approach ensured a distinct soil-cobble interface and ensured the structural consistency of the samples.
After placement, the specimen was capped with a rubber-ringed top cap and equipped with four linear variable differential transformers (LVDTs) to monitor vertical deformation. The surcharge pressure that was desired was imposed and maintained until the vertical settlement reached its complete stabilization. After stabilization, the specimen was saturated under a low hydraulic gradient of 0.05 to reduce premature migration of mobile fines. Similar low-gradient or low-flow saturation procedures have been adopted in previous internal erosion studies [31,35,37]. No visible fines discharge was observed during the saturation process. Subsequently, all chamber vents were opened to release entrapped air. After the discharge of air bubbles had entirely stopped, slurry was flushed into the supply lines in order to start the infiltration test.
3.4. Testing Scheme
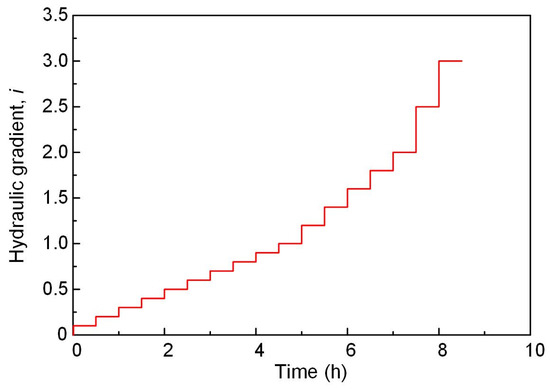
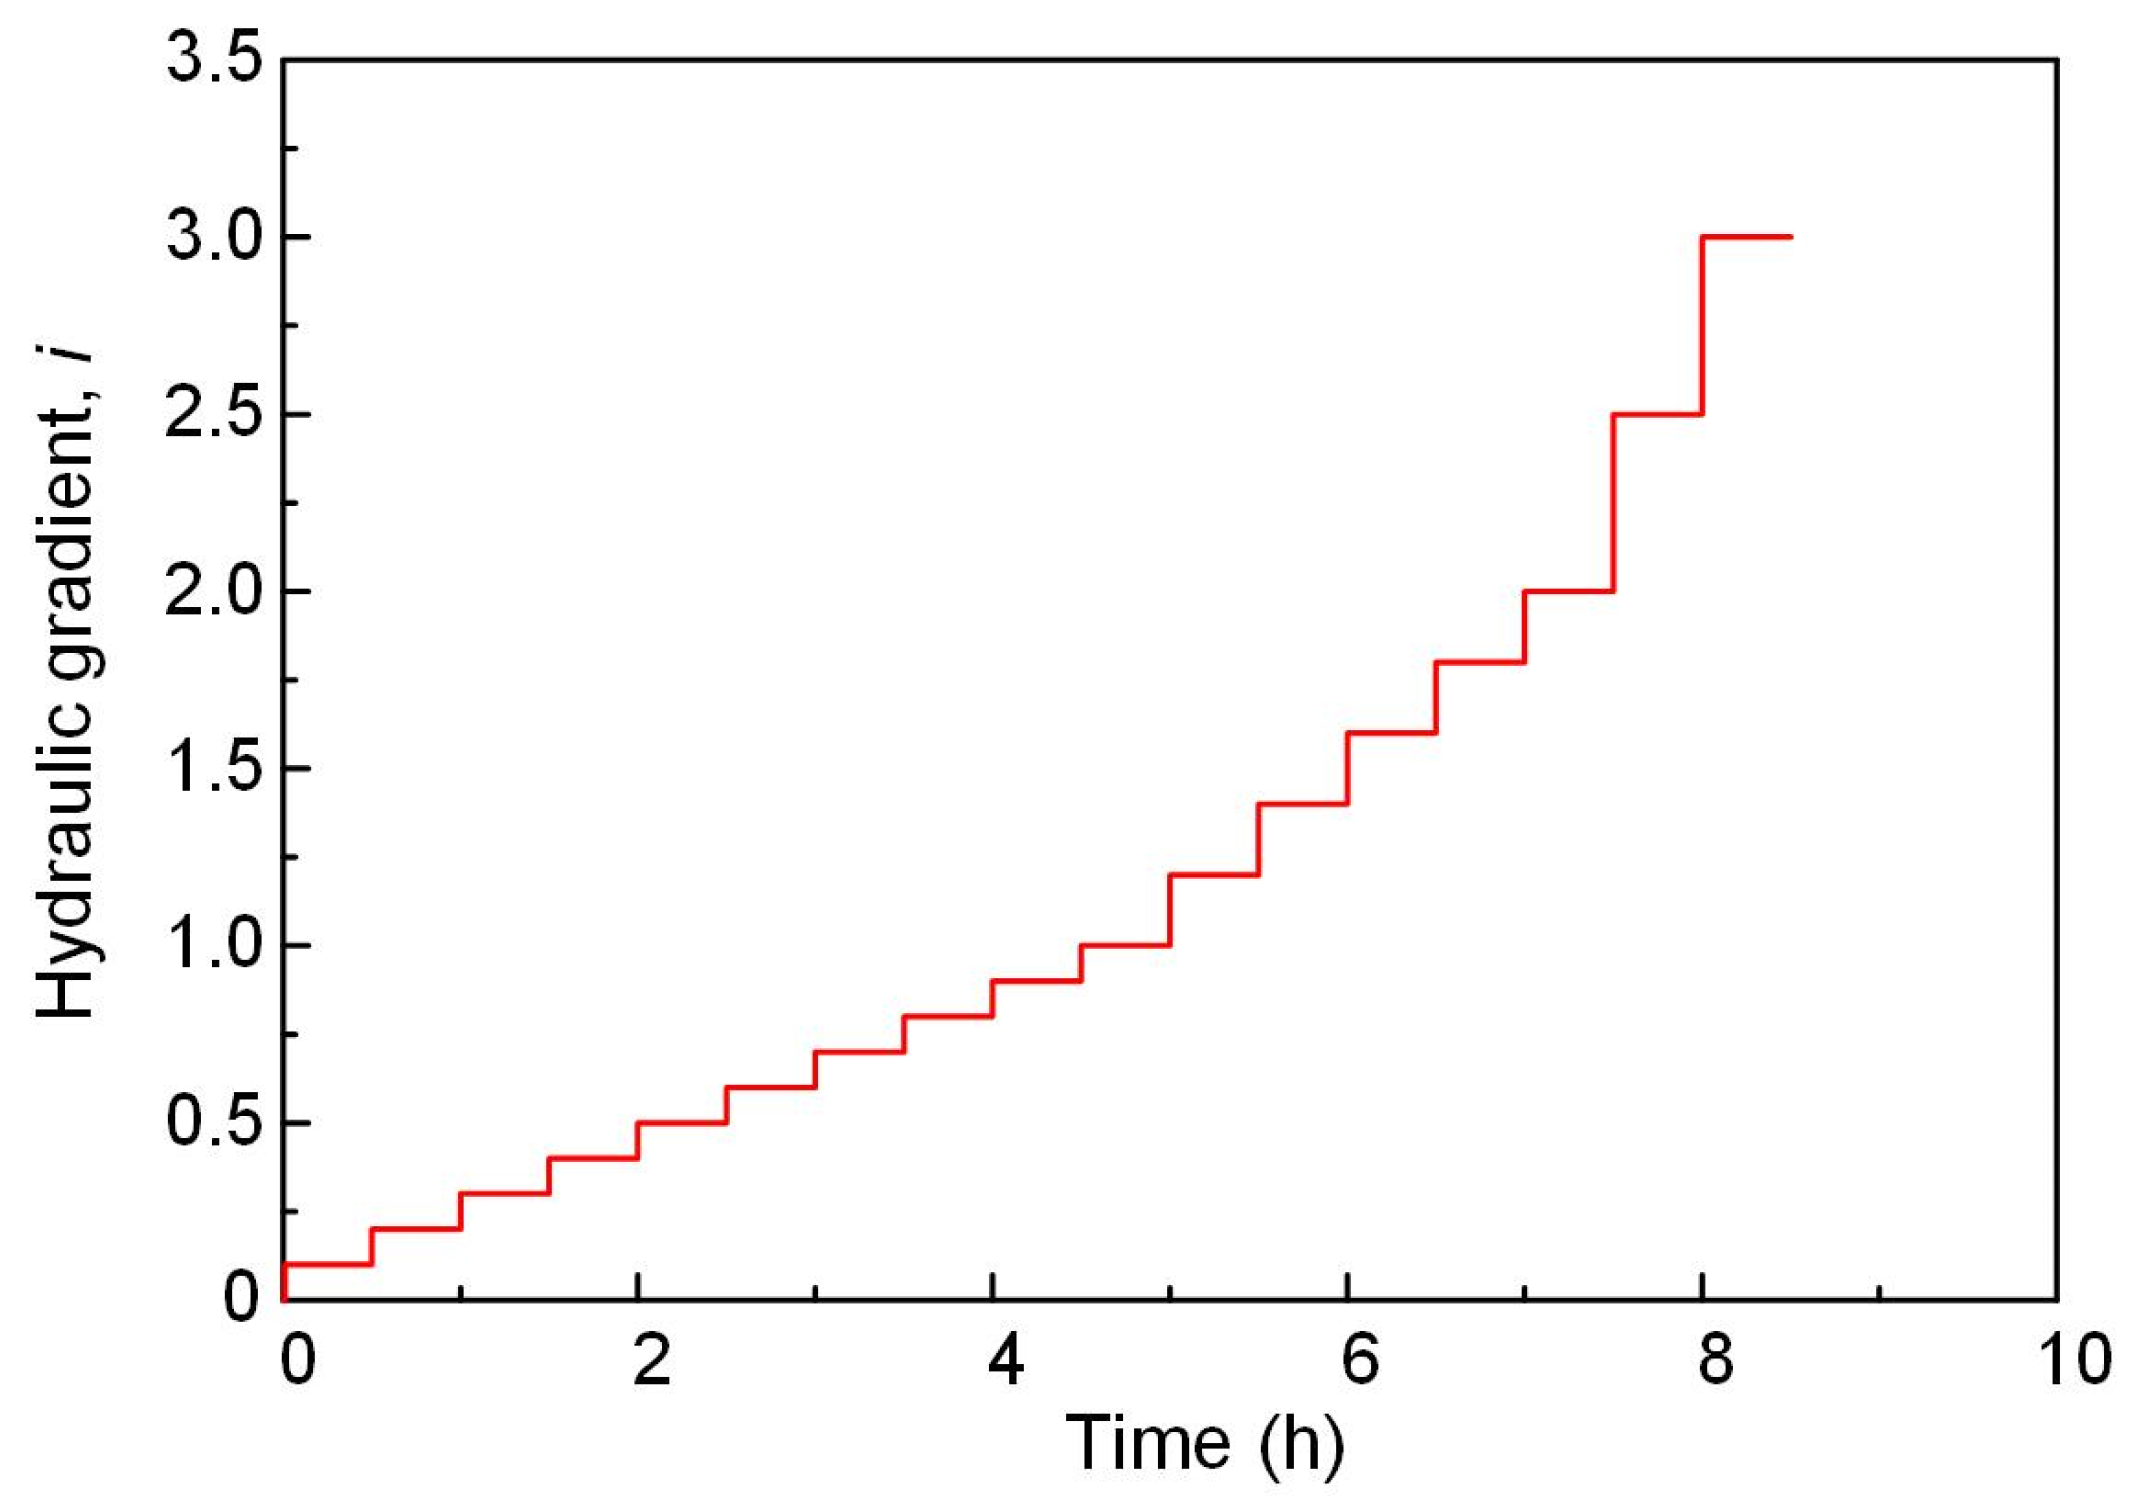
The testing scheme included baseline erosion tests, slurry clogging tests and post-clogging erosion tests to compare soil hydraulic behavior before and after slurry infiltration. The erosion tests adopted a multistage hydraulic gradient loading procedure, as illustrated in Figure 6, following the stagewise testing framework of Wang et al. [43]. Each hydraulic gradient stage was maintained for 30 min, and the hydraulic gradient applied at each stage is explicitly shown in Figure 6. For the internally unstable soils tested in this study, once particle migration was activated, most of the observable fine particle discharge at a given stage occurred relatively rapidly and generally approached a stable condition within the 30 min loading period, as indicated by the gradual clearing of the effluent. Therefore, the experimental program was designed to characterize the response at the end of each loading stage rather than to resolve the detailed transient evolution within the stage. Following Wang et al. [43], the progression hydraulic gradient, , was defined as the hydraulic gradient corresponding to the onset of progressive internal erosion. The identification of was based primarily on a marked increase in fine particle discharge, characterized by substantial visible flushing of fines from the specimen and a pronounced increase in effluent turbidity. Because the hydraulic gradient was increased stepwise, was taken as the applied hydraulic gradient at the loading stage where progressive particle loss was first observed. The same identification criterion was consistently applied to all baseline and post-clogging specimens. All the tests were performed at surcharge pressures of 0.5, 1.0 and 1.5 MPa and an infiltration pressure of 0.1 MPa was used in the slurry-treated tests. After application and stabilization of surcharge pressures of 0.5, 1.0, and 1.5 MPa, the corresponding void ratios before slurry infiltration were 0.286, 0.281, and 0.277, respectively. Table 3 summarizes the test conditions and representative results.
Figure 6.
Multistage hydraulic gradient loading scheme.
Table 3.
Testing scheme and results.
The baseline erosion tests were performed on the specimens that had not been previously infiltrated with slurry and were used as a reference to assess the post-clogging response. At each loading stage, hydraulic conductivity and fines eroded ratio were established. The fines eroded ratio, , was defined as the cumulative dry mass of eroded particles belonging to the defined fine fraction (d < 2 mm), normalized by the initial dry mass of this fraction in the specimen:
where is the cumulative dry mass of eroded particles smaller than 2 mm collected up to the hydraulic loading stage, and is the initial dry mass of particles smaller than 2 mm in the specimen. Thus, the same particle size criterion was used for both the definition of the initial fine fraction and the calculation of the fines eroded ratio.
Slurry clogging tests used independently prepared Soil A specimens with the same initial conditions as the baseline group. These tests imposed surcharge pressures of 0.5, 1.0 and 1.5 MPa in addition to a constant slurry injection pressure of 0.1 MPa and recorded the flow rate continuously. When steady flow was achieved, injection was stopped to allow excavation of the specimens. This delicate excavation showed the extent of slurry penetration, preferential flow paths and the spatial distribution of the clogged zones. The excavated samples have identifiers that are marked with the suffix “exc”.
The post-clogging erosion tests were performed to evaluate the effects of slurry-induced clogging on the hydraulic behavior and internal erosion resistance of the specimens. Each specimen was first subjected to slurry infiltration under the prescribed surcharge pressure and a constant inlet pressure of 0.1 MPa. Once the volumetric slurry flow rate reached a steady state, the inlet fluid was switched from slurry to water without disturbing the specimen. The same multistage hydraulic-gradient sequence was subsequently applied to the baseline and slurry-treated specimens, with each loading stage maintained for 30 min. During each stage, effluent condition and fine particle discharge were observed manually. For stages exhibiting evident erosion, particle discharge increased rapidly and then gradually diminished during loading, whereas little additional change was observed during the later part of the loading stage. Therefore, repeated intermediate sampling within an individual stage was not performed. The hydraulic response and accumulated eroded fines mass used in the analysis were measured and recorded at the end of each loading stage. The slurry-treated specimens additionally underwent the preceding slurry-infiltration stage, which was required to establish the clogged condition, whereas no water-treated process control was included to reproduce this stage without slurry particles. Accordingly, the baseline tests characterize the untreated soil response, while the post-clogging tests characterize the response following the complete slurry-infiltration process.
4. Experimental Results
4.1. Slurry Infiltration and Clogging Characteristics
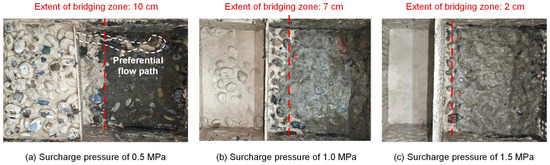
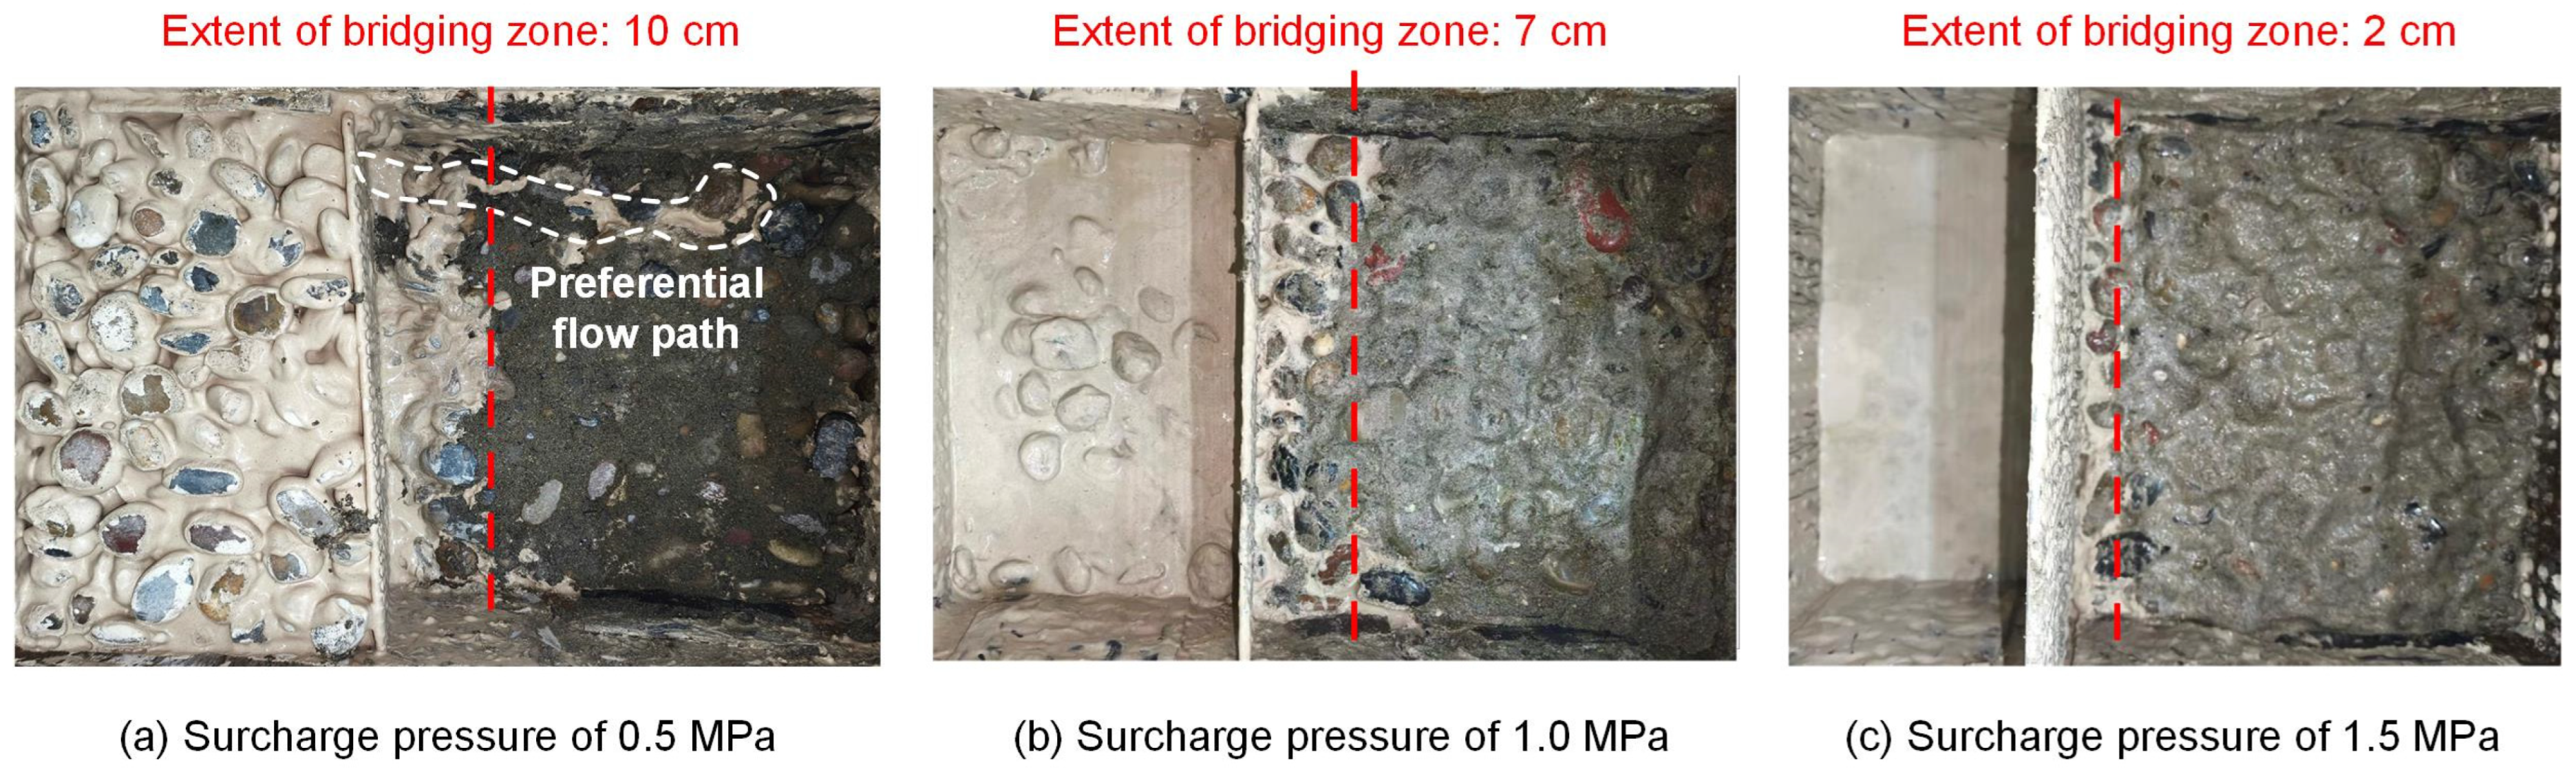
Figure 7 shows the excavated profiles of Soil A following slurry infiltration at a constant inlet pressure of 0.1 MPa under surcharge pressures of 0.5, 1.0, and 1.5 MPa. The slurry-affected region and the apparent bridging zone were identified visually from the color and texture contrasts observed after specimen excavation. Based on these visually identified boundaries, the apparent bridging-zone lengths were approximately 10, 7, and 2 cm under surcharge pressures of 0.5, 1.0, and 1.5 MPa, respectively. In the tested specimens, the observed slurry penetration depth decreased with increasing surcharge pressure. Under the lowest pressure of 0.5 MPa, the bridging zone exhibited a highly irregular boundary with preferential flow paths extending well beyond the primary clogged area. This geometry indicates a spatially heterogeneous slurry-affected zone, which is likely associated with preferential pathways through large interconnected pores.
Figure 7.
Excavated profiles of Soil A after slurry infiltration at an inlet pressure of 0.1 MPa under surcharge pressures of (a) 0.5 MPa, (b) 1.0 MPa, and (c) 1.5 MPa.
This trend is consistent with stress-induced evolution of the pore structure. At relatively low surcharge pressures, the more open pore network may provide preferential pathways for slurry migration, thereby allowing deeper penetration into the specimen. As surcharge pressure increases, compression of the particle skeleton is expected to narrow the pore throats and increase resistance to slurry migration, promoting particle retention and bridging near the inlet. These observations indicate that surcharge pressure affects the spatial extent of slurry-induced clogging.
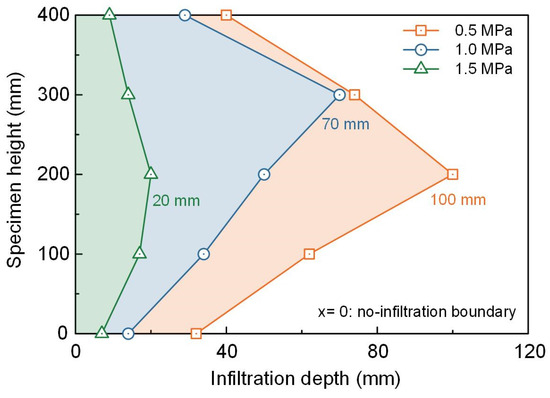
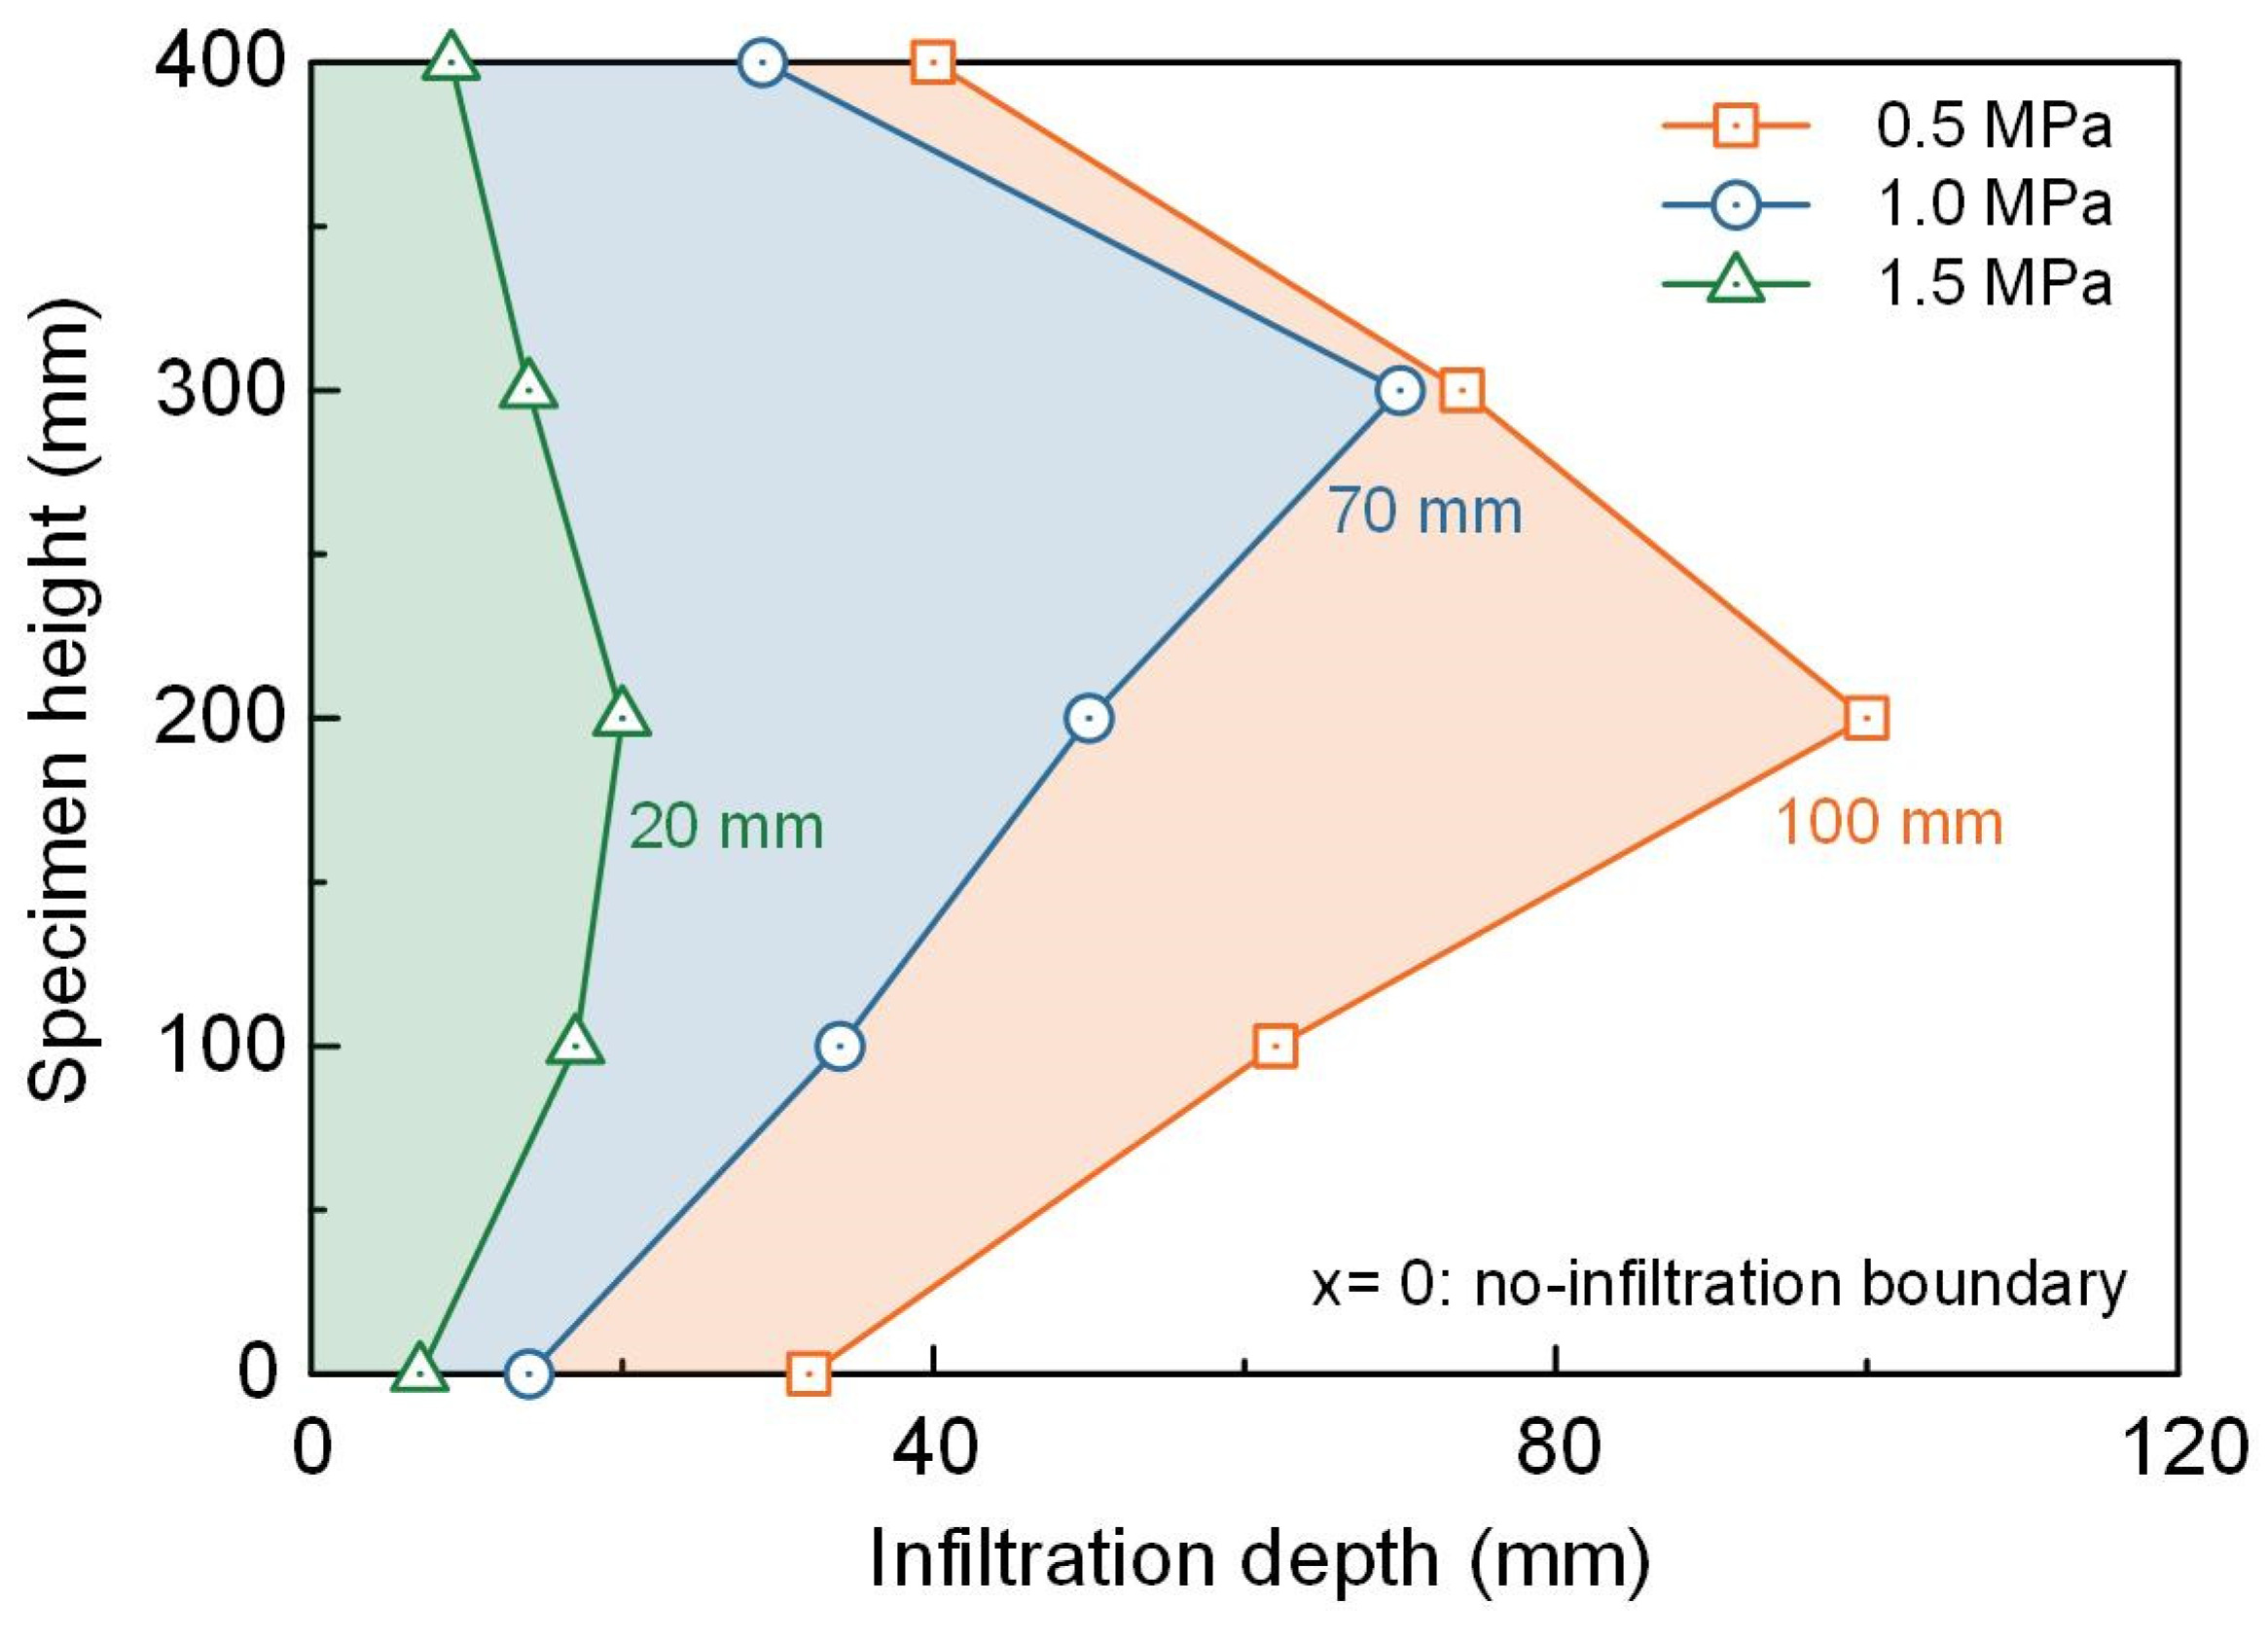
Figure 8 shows the variation in slurry infiltration depth along the height of a central longitudinal section through the specimen, where x = 0 denotes the soil-cobble interface. Under all three surcharge pressures, the infiltration depth varies along the specimen height, indicating spatially nonuniform slurry migration within the specimen. At a surcharge pressure of 0.5 MPa, the infiltration depth increases from both the upper and lower boundaries toward the specimen mid-height, where it reaches a maximum of 100 mm at approximately 200 mm. When the surcharge pressure increases to 1.0 MPa, the slurry-affected region contracts markedly, with the maximum infiltration depth decreasing to 70 mm. It should be noted that the penetration-depth profiles were identified from the visually distinguishable boundaries of the slurry-affected zones after specimen excavation, and no particle size analyses were performed at different locations within the clogged zones. Accordingly, Figure 8 illustrates the observed spatial variation in slurry penetration depth, although the spatial distribution of retained slurry particles within the clogged zone cannot be quantitatively determined from the present measurements.
Figure 8.
Slurry infiltration depth profiles along the specimen height in the central longitudinal section under different vertical stresses.
4.2. Hydraulic Conductivity
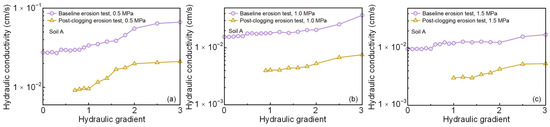
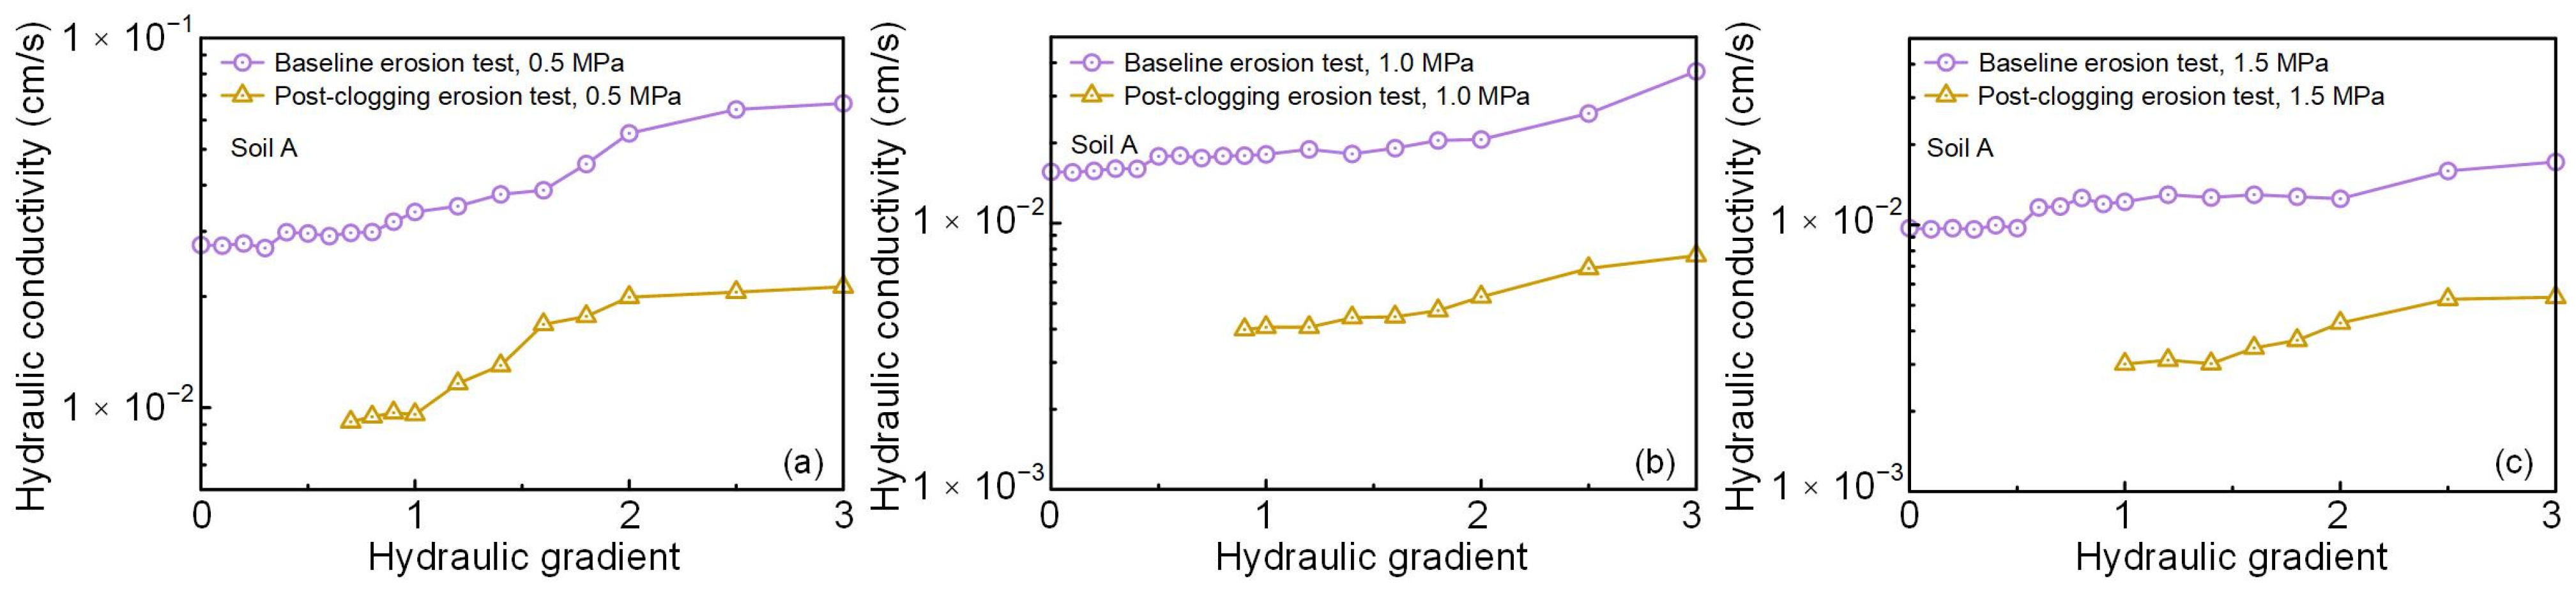
Figure 9 compares the evolution of hydraulic conductivity with hydraulic gradient for the baseline and post-clogging specimens of Soil A under different surcharge pressures. Hydraulic conductivity increases with hydraulic gradient in both groups, although the values for the post-clogging specimens remain consistently below those of the corresponding baseline specimens throughout loading. For the baseline specimens, hydraulic conductivity varies only slightly at low hydraulic gradients but increases progressively under further hydraulic loading. Over the range of applied hydraulic gradients, hydraulic conductivity varies from approximately 2.5 × 10⁻² to 6.5 × 10⁻² cm/s at a surcharge pressure of 0.5 MPa, from 1.5 × 10⁻² to 3.5 × 10⁻² cm/s at 1.0 MPa, and from 9.0 × 10⁻³ to 1.6 × 10⁻² cm/s at 1.5 MPa. The downward shift in hydraulic conductivity with increasing surcharge pressure is consistent with compression of the particle skeleton, which narrows the pore throats and restricts seepage flow. It should be noted that each test condition was represented by a single independently prepared specimen, and no replicate tests were conducted under identical conditions.
Figure 9.
Variation in hydraulic conductivity with hydraulic gradient for baseline and post-clogging Soil A specimens under surcharge pressures of (a) 0.5 MPa, (b) 1.0 MPa, and (c) 1.5 MPa.
Following slurry infiltration, the hydraulic conductivity measured for each post-clogging specimen was lower than that of the corresponding baseline specimen under the investigated surcharge pressures. At a hydraulic gradient of approximately 1, the post-clogging specimens exhibit hydraulic conductivities of 1.0 × 10⁻², 4.0 × 10⁻³, and 3.0 × 10⁻³ cm/s under surcharge pressures of 0.5, 1.0, and 1.5 MPa, respectively. Across the investigated conditions, the hydraulic conductivity of the post-clogging specimens decreased to approximately 20% to 35% of the corresponding baseline values. This range reflects the variation observed among individual test conditions rather than a statistically averaged reduction. The observed decrease in hydraulic conductivity after slurry infiltration is consistent with slurry particle bridging and deposition within pore throats, which may reduce the effective flow area and hydraulic connectivity.
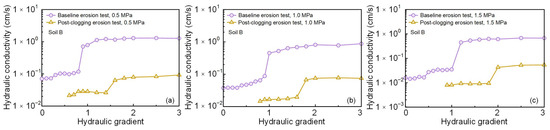
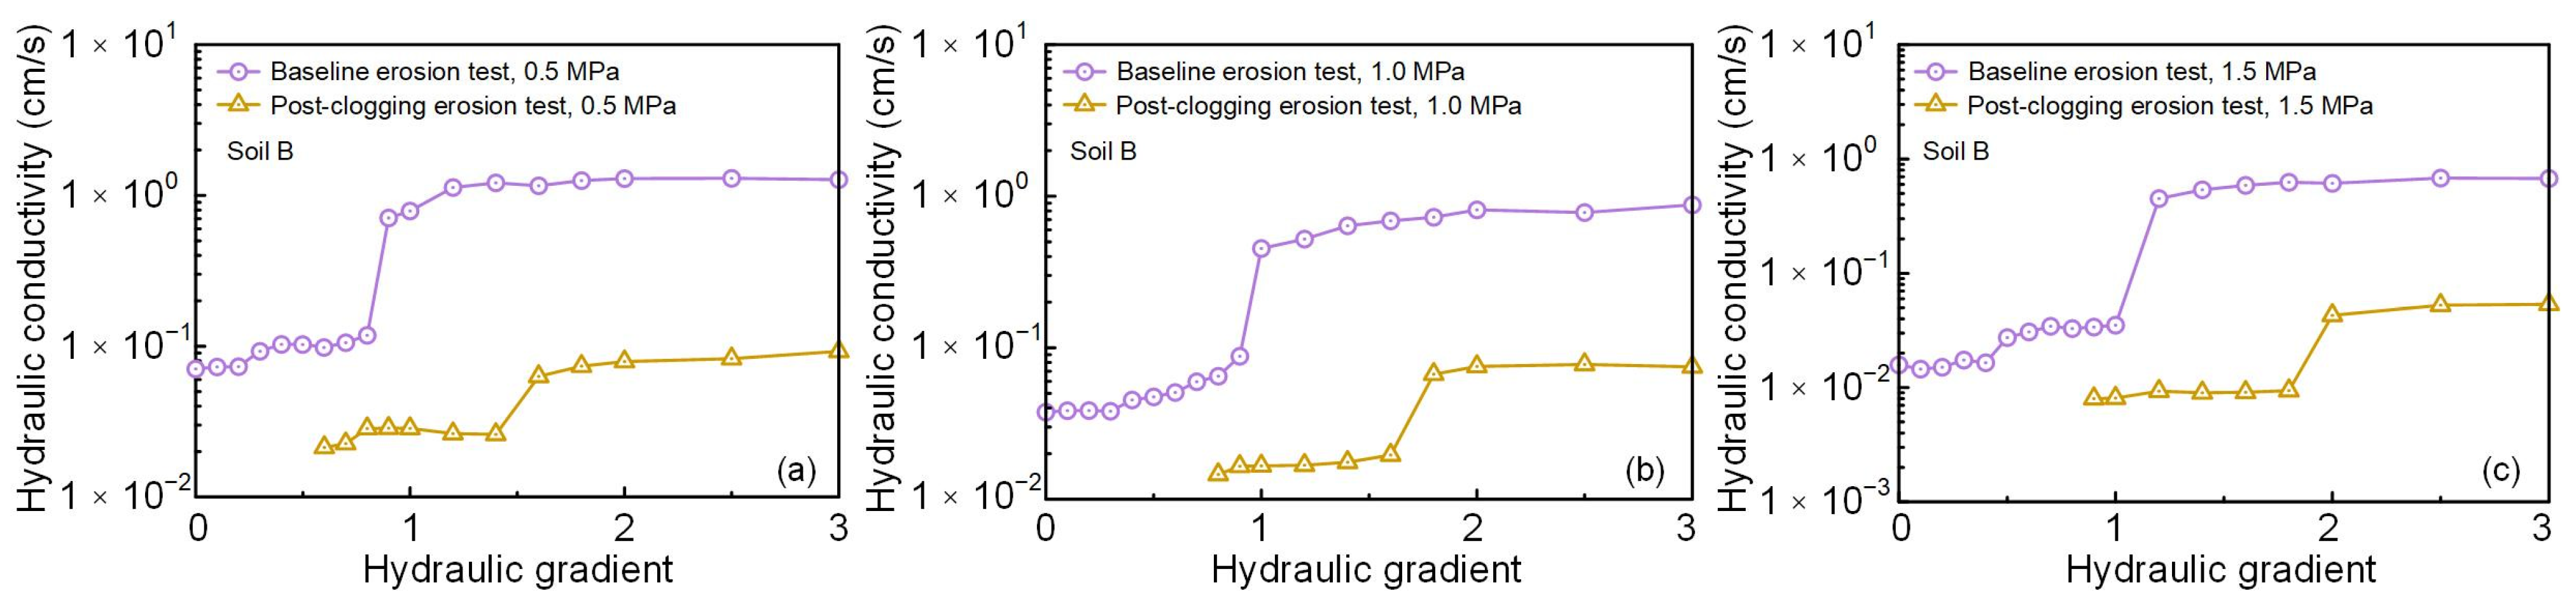
Figure 10 shows the variations in hydraulic conductivity of baseline and post-clogging Soil B specimens with hydraulic gradient under different surcharge pressures. The measured hydraulic conductivity after slurry infiltration was lower than that of the corresponding baseline specimens over the applied hydraulic gradient range. Hydraulic conductivity also tended to decrease with increasing surcharge pressure in the tested specimens. These observations are consistent with the lower permeability observed following slurry infiltration.
Figure 10.
Variation in hydraulic conductivity with hydraulic gradient for baseline and post-clogging Soil B specimens under surcharge pressures of (a) 0.5 MPa, (b) 1.0 MPa, and (c) 1.5 MPa.
4.3. Fines Eroded Ratio
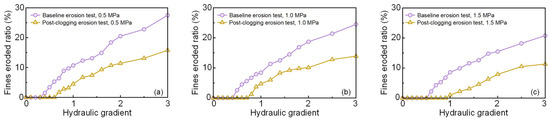
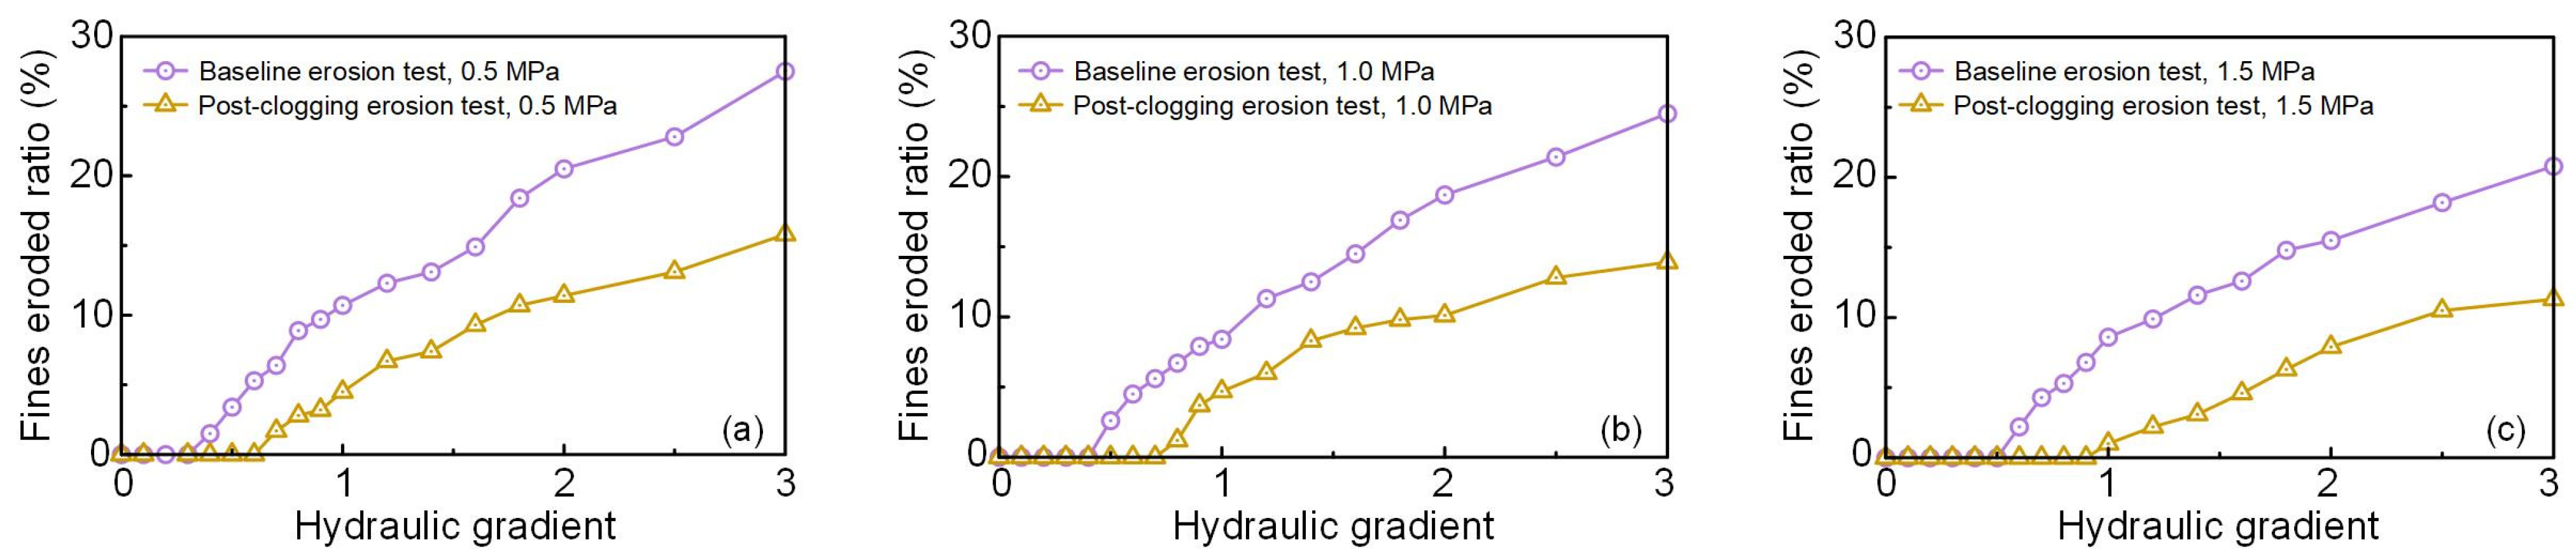
Figure 11 compares the evolution of the fines eroded ratio with hydraulic gradient for the baseline and post-clogging specimens of Soil A under different surcharge pressures. The fines eroded ratio increases continuously with hydraulic gradient in both groups, but remains consistently lower in the post-clogging specimens throughout loading. Under surcharge pressures of 0.5, 1.0, and 1.5 MPa, the progression hydraulic gradients of the baseline specimens are approximately 0.3, 0.4, and 0.6, respectively. Following slurry infiltration, the corresponding values increase to approximately 0.7, 0.9, and 1.1. This shift suggests that particle bridging and deposition within the pore throats delay the mobilization and transport of fines. The progression hydraulic gradient also increases with surcharge pressure in both groups.
Figure 11.
Variation in fines eroded ratio with hydraulic gradient for baseline and post-clogging Soil A specimens under surcharge pressures of (a) 0.5 MPa, (b) 1.0 MPa, and (c) 1.5 MPa.
At a hydraulic gradient of 3, the fines eroded ratios of the baseline specimens are approximately 27.5%, 24.5%, and 20.5% under surcharge pressures of 0.5, 1.0, and 1.5 MPa, respectively, whereas the corresponding post-clogging values are 15.5%, 14.0%, and 11.0%. Minor amounts of slurry-derived material may have been retained on the sieve and included in the measured mass of the post-clogging specimens. Consequently, the reported fines eroded ratios for the post-clogging specimens may be slightly overestimated and should therefore be interpreted as conservative estimates of the loss of the original soil fraction. Despite this potential bias, the measured fines eroded ratios of the post-clogging specimens were lower than the corresponding baseline values under the tested conditions. This observed difference is consistent with reduced fine particle loss following slurry infiltration. Increasing surcharge pressure further delayed the progression of internal erosion and reduced the subsequent loss of fine particles.
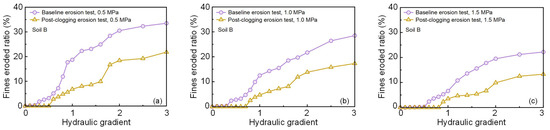
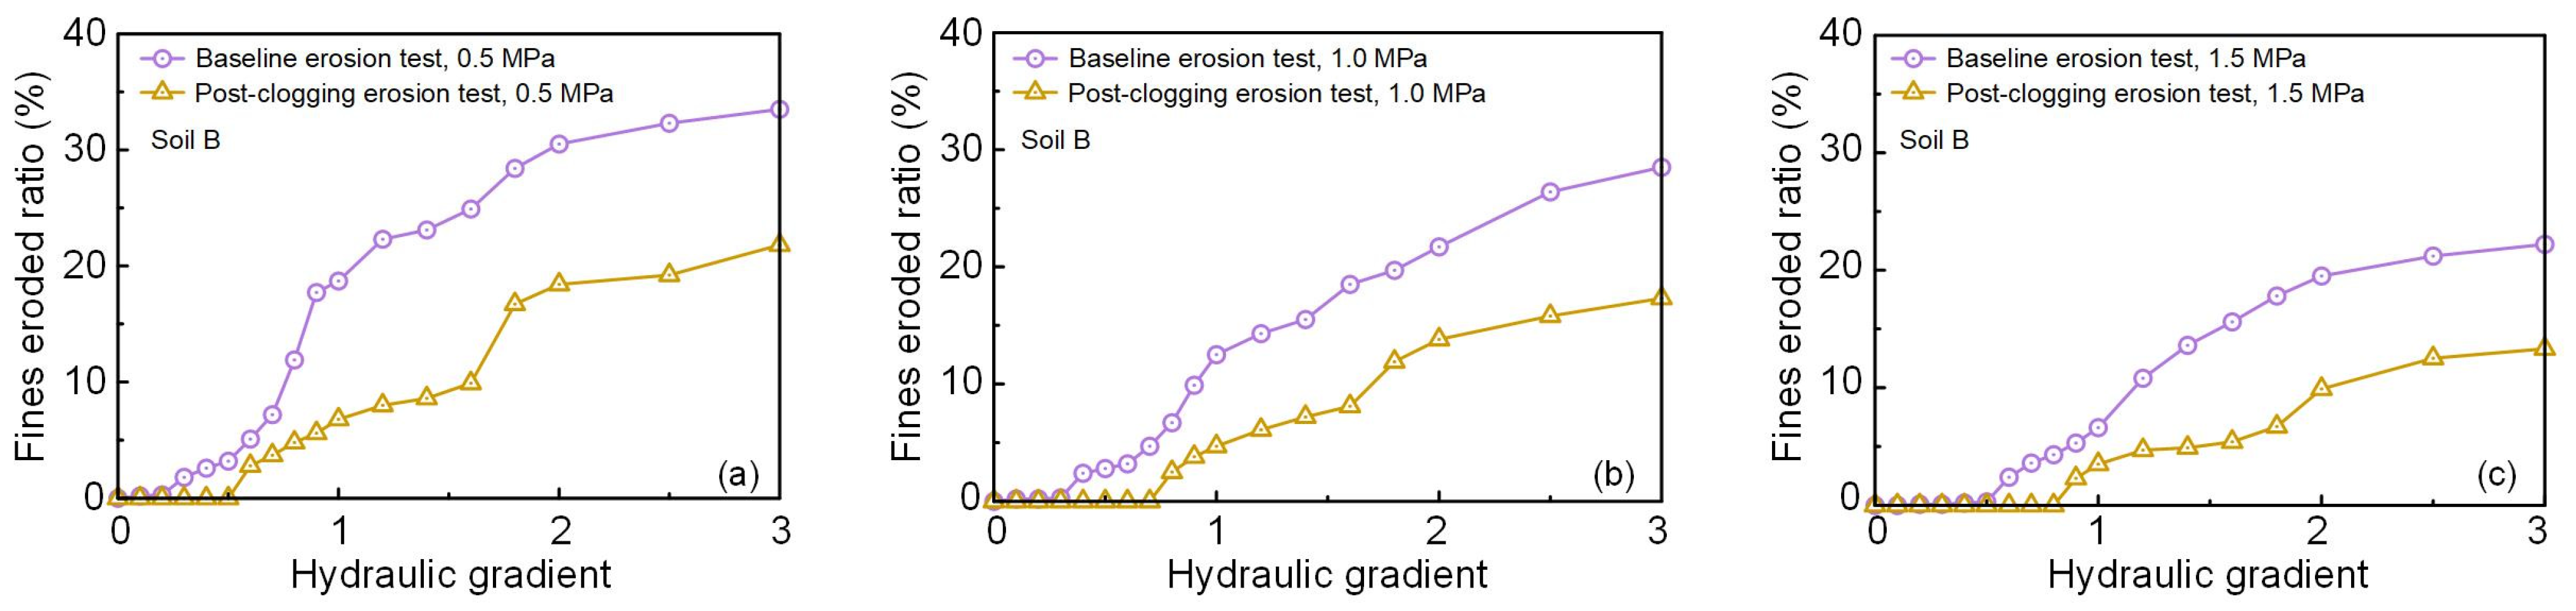
Figure 12 presents the variation in the fines eroded ratio with hydraulic gradient for the baseline and post-clogging Soil B specimens under different surcharge pressures. Soil B exhibited a trend similar to that observed for Soil A. Compared with the corresponding baseline specimens, the post-clogging specimens showed higher progression hydraulic gradients and lower fines eroded ratios throughout the applied loading stages. These observations indicate that, despite the lower initial fine fraction content of Soil B, the post-clogging specimens still exhibited greater resistance to internal erosion than the corresponding baseline specimens.
Figure 12.
Variation in fines eroded ratio with hydraulic gradient for baseline and post-clogging soil B specimens under surcharge pressures of (a) 0.5 MPa, (b) 1.0 MPa, and (c) 1.5 MPa.
5. Discussion
5.1. Formation Mechanism of Slurry-Induced Clogging
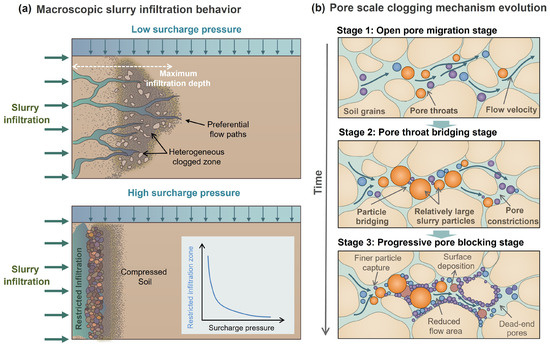
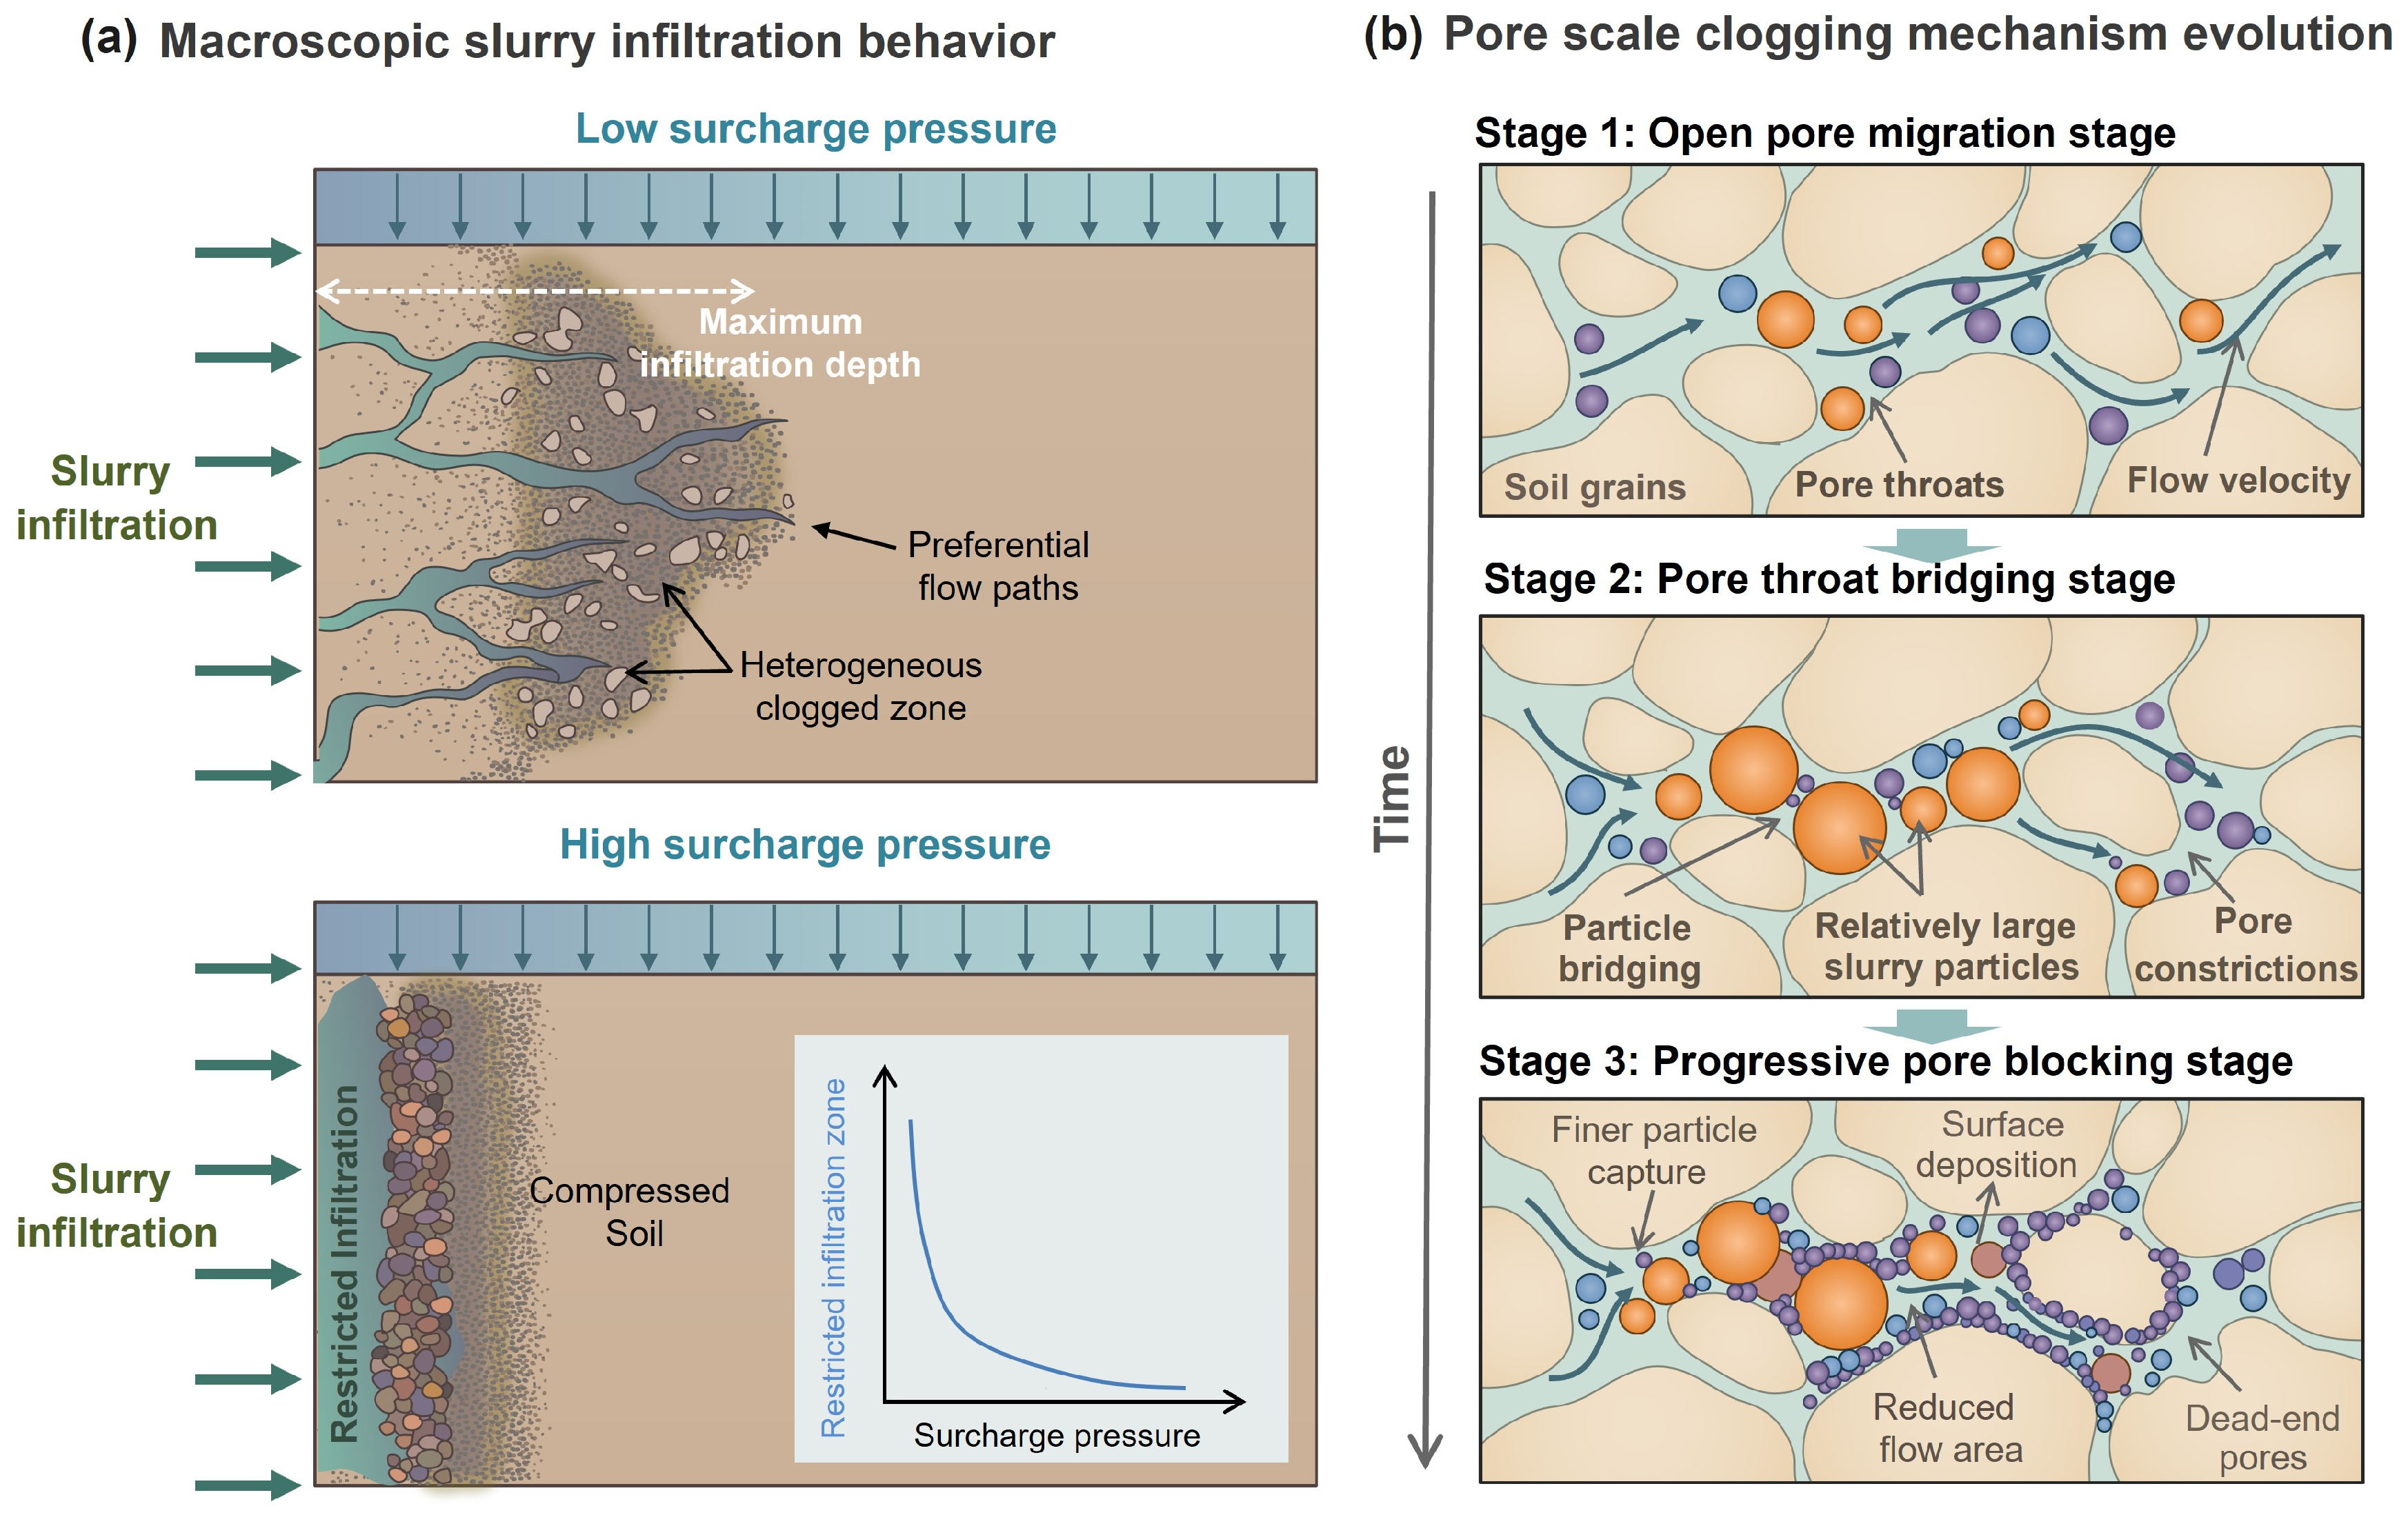
Figure 13 presents a conceptual interpretation of the possible processes governing the development and geometry of the slurry-affected zone. The schematic is inferred from the visually identified clogging profiles and the measured bulk hydraulic responses. At the specimen scale, the observed slurry penetration depth decreased with increasing surcharge stress. At low surcharge stresses, the soil matrix may retain a relatively open and connected pore network, which is consistent with the greater penetration depths observed in the tests. The irregular boundary of the clogged region (Figure 7) may reflect spatial heterogeneity in particle packing and local flow pathways. Increasing surcharge stress is expected to compress the soil skeleton and narrow or disconnect some flow pathways, thereby increasing flow resistance and favoring slurry-particle retention near the inlet. However, because the pore structure was not directly characterized, the respective contributions of pore constriction, local gradation, and specimen fabric cannot be distinguished from the present results.
Figure 13.
Conceptual schematic of the inferred slurry infiltration and clogging processes under surcharge pressure.
At the pore scale, the observations are consistent with a plausible sequence of particle migration, throat bridging, and progressive pore blockage. During the initial stage, slurry particles may migrate into the soil through connected flow pathways under seepage forces. As infiltration progresses, particles comparable to or larger than local pore-throat dimensions may be retained and promote bridging. Subsequent accumulation of finer particles around the developing bridges may further constrict the available flow paths and reduce pore connectivity. This sequence provides a plausible interpretation of the observed clogging profiles and hydraulic responses, although direct pore scale measurements are required for further validation.
5.2. Engineering Implications of Slurry-Induced Clogging
Slurry-induced clogging during cut-off wall construction substantially altered the hydraulic and erosion behavior of the adjacent soil. Following slurry infiltration, the specimens exhibited reduced hydraulic conductivity and fines eroded ratio, together with an increased hydraulic gradient required for the onset of internal erosion. In this study, spatial heterogeneity refers to the nonuniform geometry and penetration depth of the slurry-affected zone identified through specimen excavation. The hydraulic gradients reported herein are specimen-scale imposed gradients; local variations in pore pressure, hydraulic gradient, and particle transport pathways within the specimen were not directly resolved. The measured bulk hydraulic responses, together with the excavated clogging profiles, indicate the development of a low-permeability slurry-affected zone adjacent to the cut-off wall. The interpretation of these results is subject to three experimental limitations. Each laboratory test condition was represented by a single independently prepared specimen, and no replicate tests were conducted. No water-treated process control was included to separate the effect of additional hydraulic exposure from that of slurry infiltration. In addition, no in situ permeability tests were conducted within the slurry-affected field soil. Accordingly, the laboratory results describe the observed specimen-scale hydraulic and erosion responses, while the contribution of additional hydraulic exposure cannot be fully separated and the measured permeability changes cannot be directly extrapolated to field conditions.
Concrete cut-off walls are typically constructed panel by panel, and local seepage pathways may develop along the joints between adjacent panels owing to construction-related imperfections or loading-induced deformation. However, slurry infiltration during construction creates a filter cake and associated bridging and invasion zones around the wall. The slurry-affected zone may represent an important component in seepage analyses of cut-off walls with local defects, although its contribution to the overall seepage-control performance requires further validation using numerical models of defective cut-off walls.
When conducting engineering seepage analyses, the contact region between the cut-off wall and the surrounding soil could be considered as a composite seepage barrier rather than a single interface where slurry intrusion is present. This composite barrier may comprise the cut-off wall, an interfacial filter cake, a bridging zone and an invasion zone. The spatial extent and hydraulic resistance of this barrier may depend on slurry pressure, soil gradation and surcharge level, which should therefore be considered in structural design and seepage analysis. Under the tested laboratory conditions, the slurry-infiltrated specimens exhibited lower hydraulic conductivity than the corresponding baseline specimens during multistage hydraulic loading.
Because field-scale hydraulic conductivity was not directly measured, the field observations cannot quantify the corresponding change in permeability of the slurry-affected soil. Field-scale heterogeneity and hydraulic boundary conditions may also differ from those reproduced in the laboratory; therefore, the magnitude of the laboratory-measured reduction in hydraulic conductivity should not be directly extrapolated to field conditions without further validation. Future studies should incorporate in situ permeability testing to quantify field-scale hydraulic changes associated with the slurry-affected zone and assess the applicability of the laboratory results to field conditions. Additional investigations are also needed to evaluate the long-term stability and spatial evolution of the slurry-affected zone under cyclic hydraulic loading.
6. Conclusions
Field observations and large-scale horizontal slurry infiltration tests were employed to characterize slurry infiltration and clogging patterns and to compare the hydraulic and erosion responses of baseline and slurry-infiltrated specimens under different surcharge pressures.
- (1)
- Field excavation of the experimental cut-off walls identified a spatially heterogeneous clogging structure in the surrounding soil, including a distinct external filter cake at the wall–soil interface with a measured thickness of 10–27 cm. Particle size distribution tests showed higher fine fraction contents in the soil adjacent to the cut-off walls, with the fine fraction content gradually decreasing with distance from the walls. This spatial pattern is compatible with slurry intrusion and particle retention near the cut-off walls.
- (2)
- For both testing soils with different initial fine fraction contents, post-clogging specimens exhibit lower hydraulic conductivity than their corresponding baseline specimens across all applied hydraulic gradients. Under multistage hydraulic loading, hydraulic conductivity increased with hydraulic gradient but remained below the baseline level, which is consistent with slurry-particle bridging and deposition contributing to reductions in the effective flow area and hydraulic connectivity.
- (3)
- Compared with the corresponding baseline specimens, the post-clogging specimens exhibited higher progression hydraulic gradients and lower final fines eroded ratios under the tested conditions. Higher surcharge pressures were associated with higher progression hydraulic gradients, indicating a delayed onset of progressive internal erosion in the tested specimens.
- (4)
- The observed reductions in hydraulic conductivity and fine-particle loss are interpreted as being associated with interfacial filter-cake formation and deposition and retention of slurry particles within the pore network. Accordingly, the wall-soil contact zone could be conceptualized in seepage analyses as a composite seepage barrier composed of the filter cake, bridging zone, and invasion zone, rather than a single interface. The spatial extent and hydraulic resistance of this composite barrier may depend on slurry pressure, soil gradation, and surcharge pressure. However, the influence of this composite barrier on the seepage-control performance of cut-off walls with explicit defects requires further validation.
The present study was subject to three main experimental limitations: no replicate tests were conducted, no water-treated process control was included, and no in situ permeability tests were performed within the slurry-affected soil. These limitations should be considered when interpreting the reproducibility of the laboratory trends and extrapolating the laboratory-measured permeability changes to field conditions.
Author Contributions
M.L.: Writing—original draft, Conceptualization, Investigation, Validation, Methodology. G.W.: Conceptualization, Supervision, Methodology, Project administration, Writing—review and editing, Funding acquisition. H.Z.: Investigation, Validation. All authors have read and agreed to the published version of the manuscript.
Funding
This research was supported by Science and Technology Projects of Xizang Autonomous Region, China (XZ202501ZY0105) and the Power Construction Corporation of China (DJ-ZDXM-202304).
Institutional Review Board Statement
Not applicable.
Informed Consent Statement
Not applicable.
Data Availability Statement
Data are contained within the article.
Conflicts of Interest
The authors declare no conflicts of interest.
References
- Yu, X.; Wang, Y.; Tulamaiti, Y.; Zhou, C.; Zhou, Y.; Wang, G. Refined numerical simulation of a concrete cut-off wall in the thick overburden of dam foundation. Structures 2021, 33, 4407–4420. [Google Scholar] [CrossRef] [Scilit]
- Malusis, M.A.; Barlow, L.C. Comparison of laboratory and field measurements of backfill hydraulic conductivity for a large-scale soil-bentonite cutoff wall. J. Geotech. Geoenviron. Eng. 2020, 146, 04020070. [Google Scholar] [CrossRef] [Scilit]
- Huang, Z.; Shen, Z.; Liu, D.; Xu, L.; Sun, Y.; Li, H. Seepage characteristics of core rockfill dam foundation with double cutoff walls in deep overburden: A case study. Case Stud. Constr. Mater. 2024, 21, e03576. [Google Scholar] [CrossRef] [Scilit]
- Wen, L.; Cao, W.; Li, Y. Behavior of a concrete-face rockfill dam cutoff wall considering the foundation seepage–creep coupling effect. Int. J. Geomech. 2023, 23, 04023031. [Google Scholar] [CrossRef] [Scilit]
- Morgenstern, N.; Amir-Tahmasseb, I. The stability of a slurry trench in cohesionless soils. Géotechnique 1965, 15, 387–395. [Google Scholar] [CrossRef] [Scilit]
- D’Appolonia, D.J. Soil-bentonite slurry trench cutoffs. J. Geotech. Eng. Div. 1980, 106, 399–417. [Google Scholar] [CrossRef] [Scilit]
- Xu, T.; Bezuijen, A. Bentonite slurry infiltration into sand: Filter cake formation under various conditions. Géotechnique 2019, 69, 1095–1106. [Google Scholar] [CrossRef] [Scilit]
- Min, F.; Zhu, W.; Han, X. Filter cake formation for slurry shield tunneling in highly permeable sand. Tunn. Undergr. Space Technol. 2013, 38, 423–430. [Google Scholar] [CrossRef] [Scilit]
- Qin, S.; Xu, T.; Zhou, W.-H.; Bezuijen, A. Infiltration behaviour and microstructure of filter cake from sand-modified bentonite slurry. Transp. Geotech. 2023, 40, 100963. [Google Scholar] [CrossRef] [Scilit]
- Lam, C.; Jefferis, S.A.; Suckling, T.P.; Troughton, V.M. Effects of polymer and bentonite support fluids on the performance of bored piles. Soils Found. 2015, 55, 1487–1500. [Google Scholar] [CrossRef] [Scilit]
- Filz, G.M.; Henry, L.B.; Heslin, G.M.; Davidson, R.R. Determining hydraulic conductivity of soil-bentonite using the API filter press. Geotech. Test. J. 2001, 24, 61–71. [Google Scholar] [CrossRef] [Scilit]
- Xu, T.; Bezuijen, A. Pressure infiltration characteristics of bentonite slurry. Géotechnique 2019, 69, 364–368. [Google Scholar] [CrossRef] [Scilit]
- Nguyen, T.-B.; Lee, C.; Lim, J.; Choi, H. Hydraulic characteristics of bentonite cake fabricated on cutoff walls. Clays Clay Miner. 2012, 60, 40–51. [Google Scholar] [CrossRef] [Scilit]
- Wang, Z.; Yao, X.; Chen, J.; Yu, L. Permeation behavior and filter cake formation of graded sand modified bentonite slurries in highly permeable strata. Sci. Rep. 2026, 16, 20671. [Google Scholar] [CrossRef] [Scilit] [PubMed]
- Shi, F.-J.; Feng, S.-J.; Zheng, Q.-T.; Peng, C.-H. Hydraulic conductivity and compressibility of polyanionic cellulose-modified sand-calcium bentonite slurry trench cutoff wall materials. Acta Geotech. 2024, 19, 5503–5515. [Google Scholar] [CrossRef] [Scilit]
- Chen, Y.; Liu, H.; Gao, Y.; Ye, X.; Guo, H.; Gao, Y.; Lv, Y. Visualization of the microscopic mechanism of slurry infiltration and filter cake formation for slurry shield tunneling in saturated sand: A microfluidic chip experiment. Transp. Geotech. 2025, 51, 101529. [Google Scholar] [CrossRef] [Scilit]
- Skempton, A.W.; Brogan, J.M. Experiments on piping in sandy gravels. Géotechnique 1994, 44, 449–460. [Google Scholar] [CrossRef] [Scilit]
- Fannin, R.J.; Slangen, P. On the distinct phenomena of suffusion and suffosion. Géotech. Lett. 2014, 4, 289–294. [Google Scholar] [CrossRef] [Scilit]
- Kenney, T.C.; Lau, D. Internal stability of granular filters. Can. Geotech. J. 1985, 22, 215–225. [Google Scholar] [CrossRef] [Scilit]
- Sherard, J.L.; Dunnigan, L.P.; Talbot, J.R. Filters for silts and clays. J. Geotech. Eng. 1984, 110, 701–718. [Google Scholar] [CrossRef] [Scilit]
- Wan, C.F.; Fell, R. Assessing the potential of internal instability and suffusion in embankment dams and their foundations. J. Geotech. Geoenviron. Eng. 2008, 134, 401–407. [Google Scholar] [CrossRef] [Scilit]
- Chang, D.S.; Zhang, L.M. Extended internal stability criteria for soils under seepage. Soils Found. 2013, 53, 569–583. [Google Scholar] [CrossRef] [Scilit]
- Indraratna, B.; Israr, J.; Rujikiatkamjorn, C. Geometrical method for evaluating the internal instability of granular filters based on constriction size distribution. J. Geotech. Geoenviron. Eng. 2015, 141, 04015045. [Google Scholar] [CrossRef] [Scilit]
- Wan, C.F.; Fell, R. Investigation of rate of erosion of soils in embankment dams. J. Geotech. Geoenviron. Eng. 2004, 130, 373–380. [Google Scholar] [CrossRef] [Scilit]
- Israr, J.; Indraratna, B. Study of critical hydraulic gradients for seepage-induced failures in granular soils. J. Geotech. Geoenviron. Eng. 2019, 145, 04019025. [Google Scholar] [CrossRef] [Scilit]
- Indraratna, B.; Israr, J.; Li, M. Inception of geohydraulic failures in granular soils—An experimental and theoretical treatment. Géotechnique 2018, 68, 233–248. [Google Scholar] [CrossRef] [Scilit]
- Prasomsri, J.; Takahashi, A. The role of fines on internal instability and its impact on undrained mechanical response of gap-graded soils. Soils Found. 2020, 60, 1468–1488. [Google Scholar] [CrossRef] [Scilit]
- Prasomsri, J.; Shire, T.; Takahashi, A. Effect of fines content on onset of internal instability and suffusion of sand mixtures. Géotech. Lett. 2021, 11, 209–214. [Google Scholar] [CrossRef] [Scilit]
- Chen, L.; Wan, Y.; He, J.-J.; Luo, C.-M.; Yan, S.-F.; He, X.-F. Experimental study on the suffusion mechanism of gap-graded soils under an exceedance hydraulic gradient. Nat. Hazards 2021, 109, 405–439. [Google Scholar] [CrossRef] [Scilit]
- Chitravel, S.; Otsubo, M.; Kuno, M.; Kuwano, R. Post-erosion mechanical responses of internally unstable gap-graded soil under drained torsional simple shear and triaxial compression. Soils Found. 2022, 62, 101224. [Google Scholar] [CrossRef] [Scilit]
- Li, M.; Fannin, R.J.; Foster, M.; Yan, L. Internal instability of cohesionless soils in upward and downward flow: An experimental verification of theory. Can. Geotech. J. 2024, 61, 2036–2041. [Google Scholar] [CrossRef] [Scilit]
- Douglas, K.J.; Fell, R.; Peirson, W.L.; Studholme, H. Experimental investigation of global backward erosion and suffusion of soils in embankment dams. Can. Geotech. J. 2019, 56, 789–807. [Google Scholar] [CrossRef] [Scilit]
- Reddi, L.N.; Bonala, M.V.S. Analytical solution for fine particle accumulation in soil filters. J. Geotech. Geoenviron. Eng. 1997, 123, 1143–1152. [Google Scholar] [CrossRef] [Scilit]
- Reddi, L.N.; Ming, X.; Hajra, M.G.; Lee, I.M. Permeability reduction of soil filters due to physical clogging. J. Geotech. Geoenviron. Eng. 2000, 126, 236–246. [Google Scholar] [CrossRef] [Scilit]
- Chang, D.S.; Zhang, L.M. Critical hydraulic gradients of internal erosion under complex stress states. J. Geotech. Geoenviron. Eng. 2013, 139, 1454–1467. [Google Scholar] [CrossRef] [Scilit]
- Zhang, L.; Deng, G.; Chen, R.; Luo, Z. Confining stress effects on global and local responses of internal erosion in gap-graded cohesionless soils. Bull. Eng. Geol. Environ. 2023, 82, 326. [Google Scholar] [CrossRef] [Scilit]
- Deng, Z.; Wang, G.; Jin, W.; Tang, N.; Ren, H.; Chen, X. Characteristics and quantification of fine particle loss in internally unstable sandy gravels induced by seepage flow. Eng. Geol. 2023, 321, 107150. [Google Scholar] [CrossRef] [Scilit]
- Deng, Z.; Wang, G.; Jin, W. Coupling of hydraulic loading and surcharge pressure during suffusion in sandy gravels. Géotech. Lett. 2023, 13, 75–81. [Google Scholar] [CrossRef] [Scilit]
- Istomina, V.S. Filtration Stability of Soils; Gostroizdat: Moscow, Russia, 1957. [Google Scholar]
- Kezdi, A. Soil Physics: Selected Topics; Elsevier Scientific Publishing Co.: Amsterdam, The Netherlands, 1979. [Google Scholar]
- Burenkova, V.V. Assessment of suffusion in non-cohesive and graded soils. In Proceedings of the 1st International Conference on Geo-Filters; Taylor & Francis: Karlsruhe, Germany, 1993; pp. 357–360. [Google Scholar]
- Ladd, R.S. Preparing test specimens using undercompaction. Geotech. Test. J. 1978, 1, 16–23. [Google Scholar] [CrossRef] [Scilit]
- Wang, G.; Deng, Z.Z.; Yang, J.; Chen, X.S.; Jin, W. A large-scale high-pressure erosion apparatus for studying internal erosion in gravelly soils under horizontal seepage flow. Geotech. Test. J. 2022, 45, 1037–1053. [Google Scholar] [CrossRef] [Scilit]

Disclaimer/Publisher’s Note: The statements, opinions and data contained in all publications are solely those of the individual author(s) and contributor(s) and not of MDPI and/or the editor(s). MDPI and/or the editor(s) disclaim responsibility for any injury to people or property resulting from any ideas, methods, instructions or products referred to in the content. |
© 2026 by the authors. Licensee MDPI, Basel, Switzerland. This article is an open access article distributed under the terms and conditions of the Creative Commons Attribution (CC BY) license.