


Abstract
This methodological diagnostic tests whether broad building descriptors support retrofit-class shortlists beyond popularity. We mapped 2623 New York City Local Law 87 audit rows to six classes with five decision states, trained on 2019–2022, validated on 2023, and tested on unseen 2024 property groups. Under natural recorded-label visibility, state-aware and equal-information global policies both achieved an observed-positive Recall@3 of 0.832. The state model returned the same Top-3 set for 99.7% of test rows; all evaluated natural-condition neural models missed every recorded insulation and window-upgrade positive. Light-emitting diode (LED) lighting and heating, ventilation, and air conditioning (HVAC) controls comprised 277 of 394 test positives, explaining why high recall did not demonstrate personalization. In a secondary synthetic 10% visibility stress test, excluding unlabelled entries from negative supervision improved recall over naive binary cross-entropy by 0.279; the natural state–naive difference was 0.002 (95% confidence interval (CI) [−0.007, 0.012]). Post hoc capacity, ontology, status-precedence, and stopping sensitivities did not establish reliable superiority over popularity. The benchmark diagnoses label misspecification and nearly constant shortlists.
1. Introduction
This paper diagnoses popularity collapse in retrofit-class shortlists from New York City Local Law 87 (LL87) audits. In the evaluated cohort, standard tabular descriptors do not establish a reliable retrieval advantage over an equal-information global popularity policy. The output is a ranked list of broad retrofit classes, not the selection, sizing, specification, or scheduling of individual engineering measures. A high observed-positive recall can therefore coexist with a nearly identical list for every building. Reviews of retrofit decision support emphasize data quality, generalization, physical feasibility, and real-world validation [1,2,3,4]. Our question is whether an apparent learning gain survives appropriate label handling and popularity controls.
Public audit data create a specific label problem. A measure may be recorded as recommended, already implemented or planned, requiring further study, or explicitly not recommended. A measure that is absent from the record is not necessarily unsuitable; it may have been outside the audit scope, omitted from reporting, or unresolved. Collapsing these states into a binary matrix makes every unlabelled entry a negative. That operation can manufacture apparent gains for a model that merely avoids the resulting false-negative supervision.
New York City’s Local Law 87 (LL87) provides a case study. Covered large buildings undergo periodic energy audits and retro-commissioning, and the public release contains building descriptors, system fields, and energy-conservation-measure records [5]. Earlier research evaluated the energy-use effects of mandatory audits [6] and used machine learning to identify recorded retrofit opportunities [7,8]. These records describe auditor practice.
1.1. Relation to Prior Retrofit-Prediction Studies
Table 1 compares the designs of directly related multi-measure studies. Marasco and Kontokosta [7] studied more than 1100 earlier LL87 buildings and reported class-dependent receiver operating characteristic (ROC) areas for 15 opportunities. Curcio [8] used 10,422 LL87 records and 19 labels in a random 80/20 benchmark. Rempi et al. [9] evaluated four retrofit outputs in datasets from the United Kingdom and Latvia with explainability and human oversight. This study evaluates future, previously unseen property groups; preserves five audit states; and challenges every learned shortlist with a policy derived from the same visible labels.
Table 1.
Contextual comparison with direct multi-measure retrofit-prediction studies. Reported metrics are not directly comparable because the datasets, labels, splits, and estimands differ.
Positive–unlabelled (PU) learning studies learning from positives and unlabelled examples [10,11], and evaluation under missing labels requires special care [12]. A selected-completely-at-random recording mechanism is not justified for LL87: recording can depend on systems, audit scope, costs, implementation plans, auditor judgement, and vendor practice. We combine multi-state label provenance, matched information budgets, a future-property split, popularity and concentration baselines, ontology sensitivity, and machine-readable audit lineage to assess personalization.
1.2. Research Questions and Contributions
We ask three questions:
- Under the natural recorded-label condition, do state-aware models improve Recall@1, Recall@2, or Recall@3 over a validation-selected, equal-information global policy?
- When strict-positive labels are artificially hidden, how much of the difference from naive binary cross-entropy is caused by excluding unlabelled entries from the negative class, and how much is added by graded audit states?
- Are any learned advantages robust to a 12.2-fold increase in neural-network parameters, coarser retrofit ontologies, and fold-local rolling-origin evaluation?
The study makes four contributions. First, it defines and releases an auditable multi-state LL87 shortlisting task. Second, it foregrounds the natural 100% recorded-label condition and reports . Third, it defines a personalization success rule requiring corrected improvement over a same-information global policy without loss of macro recall and with greater shortlist diversity and catalogue coverage. Fourth, it translates the results into pre-deployment checks for building practitioners.
2. Materials and Methods
2.1. Study Scope and Exact Data Snapshot
The source was the NYC Open Data LL87 Energy Audit Data view, dataset identifier au6c-jqvf [5]. The archived workbook was LL87_2019-2024.xlsx, 27,380,157 bytes, blob identifier e36e9138-0b7e-4e09-89fe-6a6c7c4e9e16. Its view metadata was last modified at 2026-04-21 13:09:20 Coordinated Universal Time (UTC). The workbook Secure Hash Algorithm 256-bit (SHA-256) digest is f3885968363b786247fce08e7d77a54904d22ebbb6cfaa981ae02f18c533c9f2. The prepared six-class table has SHA-256 b9f4061ec116906973984d8dd887ee8adfe23d570773e7ceb797aa2fa1ed665f. Full dictionary, metadata, and processing hashes are given in Supplementary S2 and the public manifest.
The analysis covers large non-residential buildings in the 2019–2024 LL87 release after case normalization and six-class alignment. Source-restricted records are not redistributed; they must be retrieved from the cited provider under its terms.
The aligned cohort contains 2623 audit rows, 1896 property groups, and 15,738 building–class cells. Before any artificial masking, these cells comprise 3103 P, 140 I, 234 W, 108 N, and 12,153 U states. The ontology mapping audit traces 16,702 matched source measure records, with no source record matching more than one class.
2.2. Audit States and Worked Example
For building b and retrofit class a, the normalized state is
where P is recommended; I is implemented or planned to be implemented; W is further study recommended; N is explicitly not recommended; and U is unlabelled or unmatched. If multiple source records map to one building–class cell, the primary precedence is P > I > W > N > U. This preserves any recorded recommendation within a class, which can contain both completed work and a different remaining measure. We test the alternative I > P > W > N > U in Section 2.11. U contributes neither a positive nor a negative target to the state-aware loss.
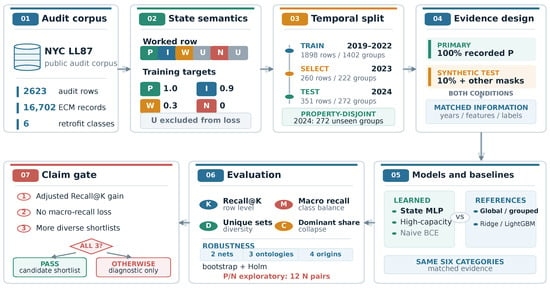
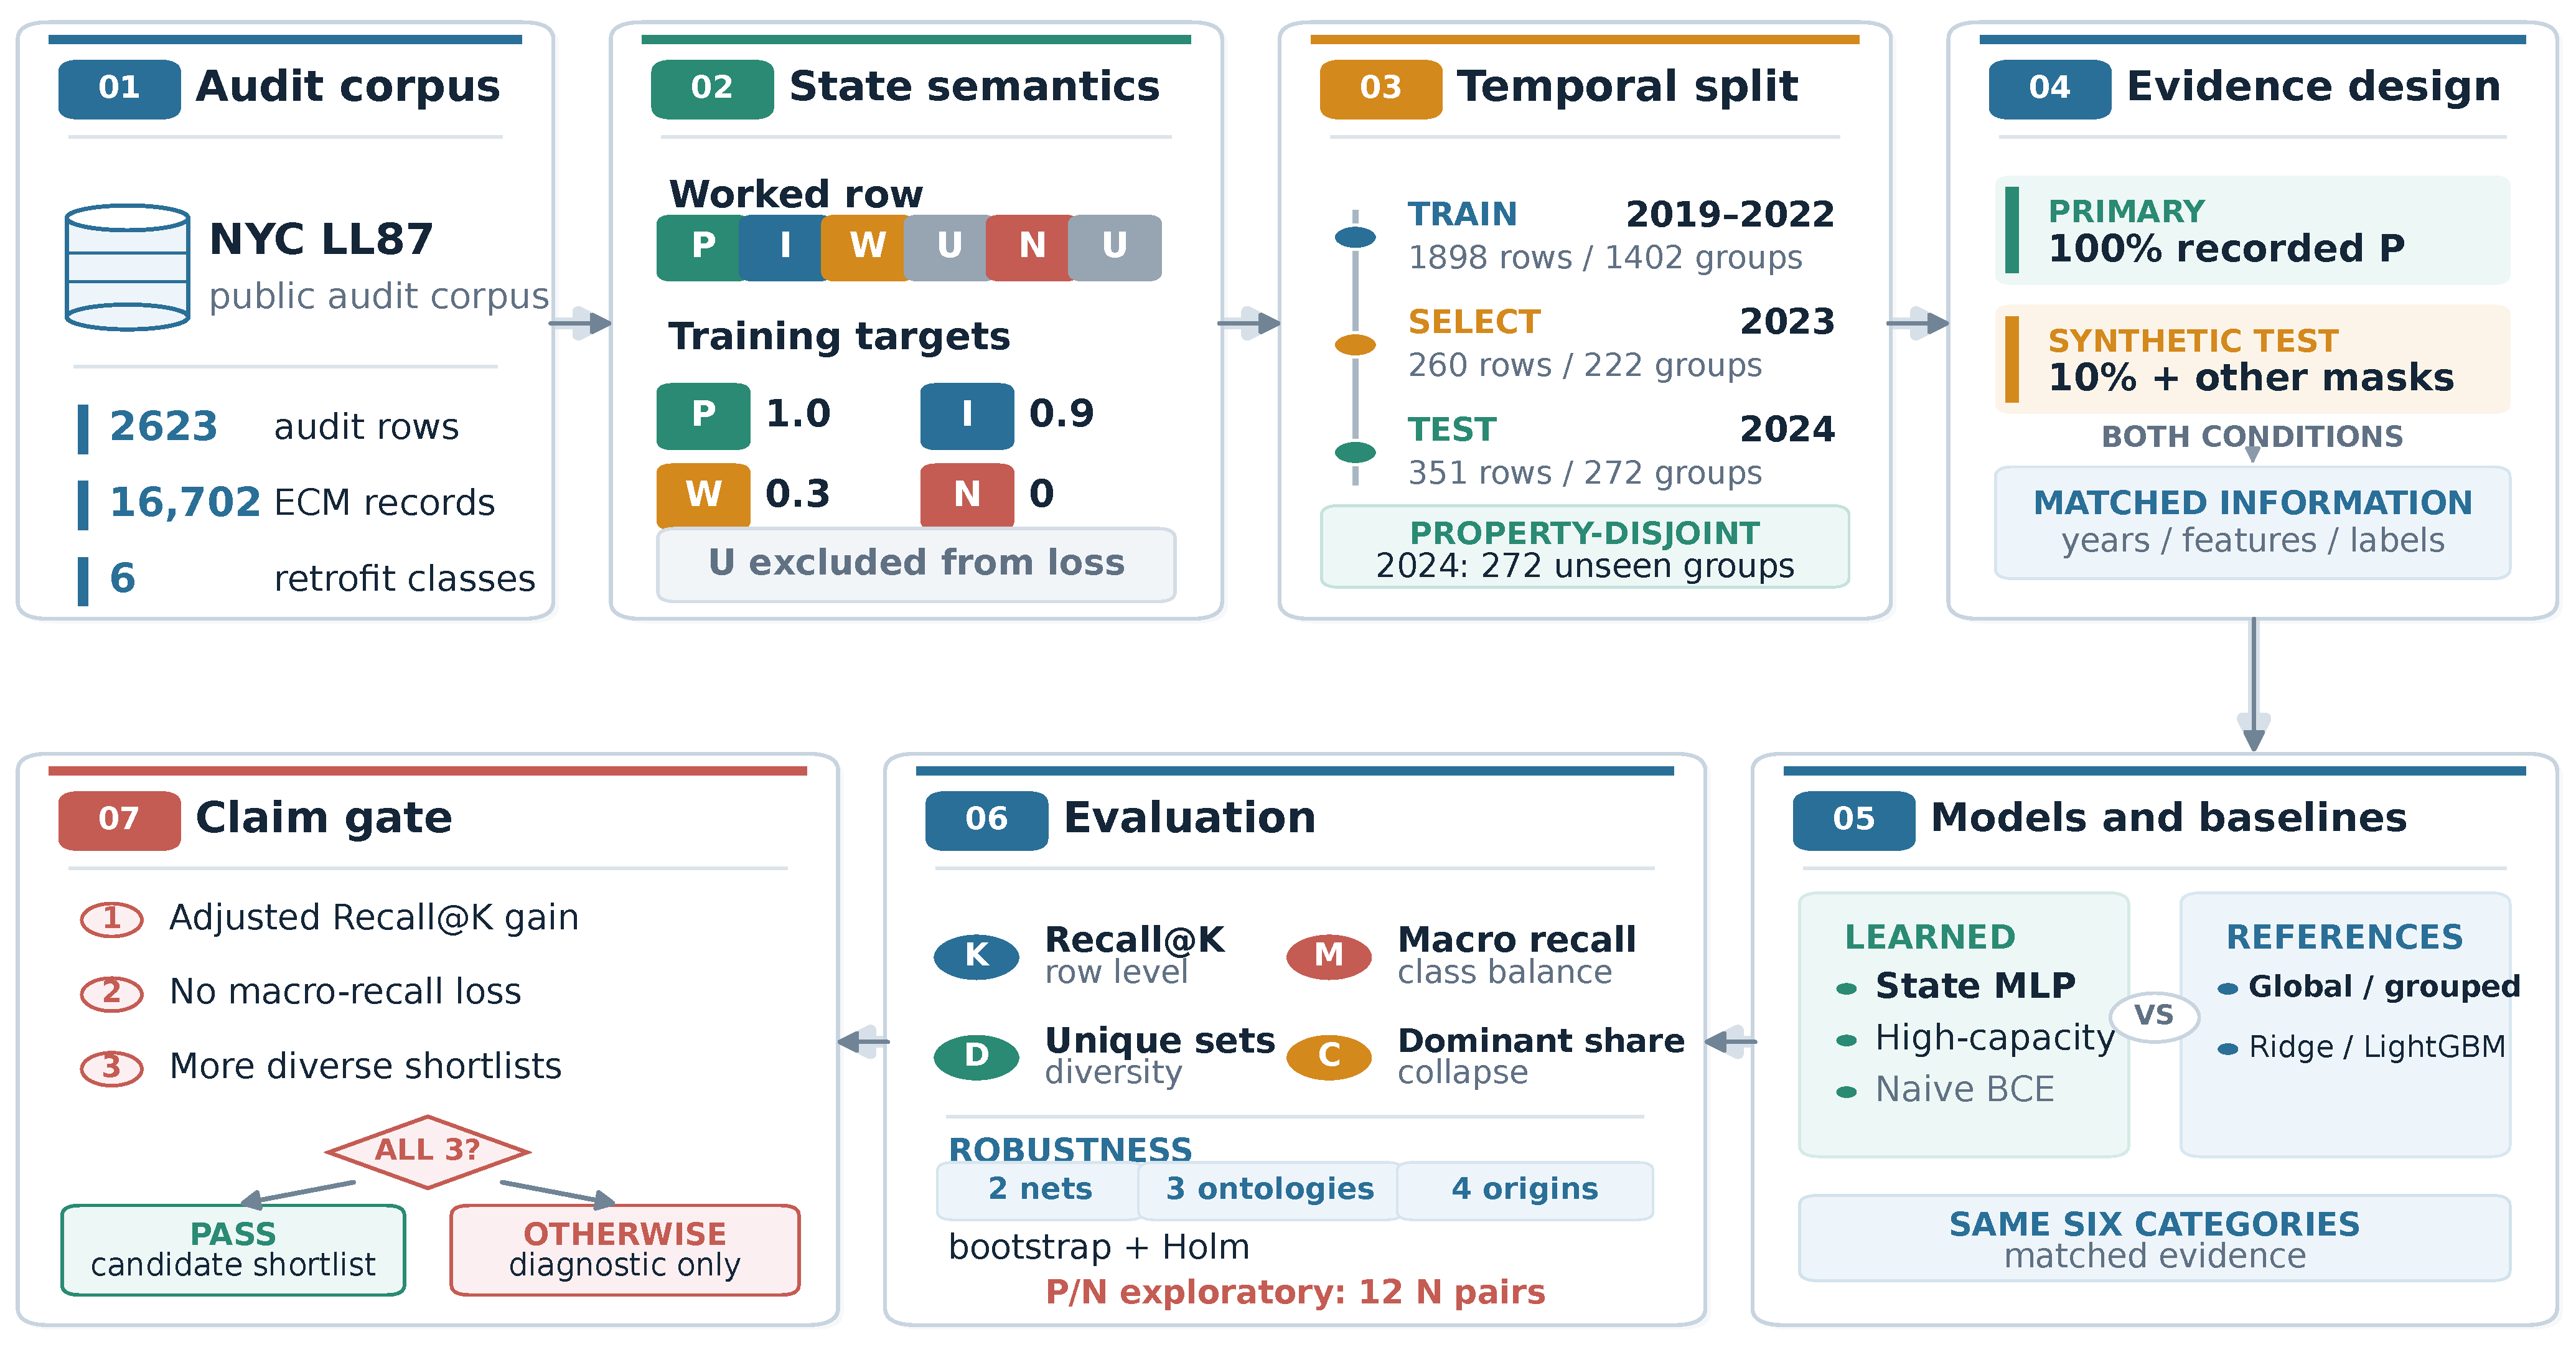
Figure 1 gives a worked row. For example, a building can contain P for light-emitting diode (LED) lighting, I for lighting controls, W for insulation, N for heating, ventilation, and air conditioning (HVAC) controls, and U for windows and HVAC equipment. The state-aware model uses targets , , , and , while omitting U from the loss. The values for I and W are ranking utilities selected on the 2023 validation partition, not probabilities of engineering suitability or savings.
Figure 1.
Seven-module audit workflow. Modules 1–4 define the LL87 cohort, state semantics, property-disjoint temporal split, and matched natural-label evidence and the synthetic 10% visibility stress test; Modules 5–6 compare learned rankers and equal-information baselines across ranking, balance, diversity, concentration, and robustness endpoints; Module 7 applies the joint personalization gate. The 2024 test comprises 351 rows from 272 unseen property groups; Recall@K is defined for 280 rows from 228 groups. NYC, New York City; LL87, Local Law 87; ECM, energy conservation measure; MLP, multilayer perceptron; BCE, binary cross-entropy; P, recommended; I, implemented or planned; W, further study; N, not recommended; U, unlabelled.
2.3. Retrofit Ontologies and Granularity Sensitivity
The fine ontology contains six classes: LED lighting, lighting controls, envelope insulation, window upgrades, HVAC controls, and HVAC equipment. Frozen regular expressions, every matched source term, record counts, and conflict resolutions appear in Supplementary S3. The first four classes have direct technology mappings; HVAC controls and HVAC equipment are broader functional aggregations. Economizer repairs, demand-controlled ventilation, and building automation system upgrades differ in control logic, while heat pumps, boilers, chillers, and variable-refrigerant-flow systems differ in energy carriers, capacity, and compatibility. Aggregation supports a compact, traceable retrieval audit, but it can conceal within-class building-specific patterns and amplify class prevalence. No external engineering adjudication was performed.
To test sensitivity to the small six-class catalogue, two coarser ontologies were created without changing property rows or temporal partitions. The four-class ontology merges LED and lighting controls into lighting, and insulation and windows into envelope, while retaining HVAC controls and HVAC equipment. The three-class ontology further merges the two HVAC classes. We report for these smaller catalogues; for the three-class ontology would select the full catalogue and is therefore uninformative.
2.4. Building Representation and Omitted Decision Variables
Every model receives the same 25-dimensional representation. Numeric variables are log floor area, construction year, number of floors, and log energy-use intensity, each accompanied by a missingness indicator. Building type, coarse HVAC type, and heating fuel are one-hot encoded. Within each temporal split, medians, means, standard deviations, and categorical vocabularies are fitted using training rows only. Previously unseen categories map to an all-zero block.
These stock descriptors omit equipment age, condition, efficiency, and capacity; control sequences; envelope assemblies; observed operational faults; access and constructability; interactions among measures; audit narrative; capital cost; expected savings; payback; incentives; and owner constraints.
2.5. Models and Supervision
The base model is a multilayer perceptron (MLP) with hidden widths 64 and 32, rectified linear unit (ReLU) activations, dropout 0.15, and 3942 trainable parameters. The post-review capacity check uses hidden widths 256, 128, and 64 and 48,198 parameters. Both produce one score per class. Models initialized with five fixed integer seeds (20260716, 20260717, 20260718, 20260719, and 20260720) are trained with AdamW, learning rate , weight decay , a maximum of 120 epochs, and early-stopping patience 15. Predictions average 20 Monte Carlo (MC) dropout passes per model and then average the five models. The archived primary analyses used Python 3.12.3, PyTorch 2.8.0+cu128, and NumPy 2.3.2; full dependency versions are listed in Supplementary S1.
For the state-aware model, U is omitted and the class-balanced loss is
where contains P/I/W/N observations for class a. Under the archived synthetic 10% visibility stress test, the 2023 validation grid selected and from and , subject to . Selection maximized validation Recall@3, followed by prespecified tie-breakers on the selectively observed P/N subset. We chose a small auditable grid to limit tuning on a modest validation cohort. Continuous utility optimization would increase the search space; a probabilistic ordinal model would require a latent ordering across recommendation, implementation, plans, and uncertainty, with U handled separately as missing information. Neither alternative was evaluated. The selected utilities were frozen for the post hoc natural, ontology, and precedence analyses. Supplementary S6 reports all grid candidates.
The naive binary-cross-entropy (BCE) model uses P as 1 and both N and U as 0; I and W are omitted. In the synthetic stress test, hiding approximately 90% of each class’s P cells introduces known false-negative targets when those cells become U. Common classes contribute more hidden positives in absolute numbers, each receiving a zero target that pushes its score downward. The loss is averaged within class, so these counts do not determine relative gradient magnitudes. The state-aware loss omits U and avoids that penalty. A matched P/N-only model also omits U, I, and W, separating U handling from graded-state supervision. Ridge, LightGBM 4.6.0 [13], grouped empirical-Bayes, and a post hoc listwise extension are supplementary comparisons.
2.6. Natural Condition and Synthetic Label-Scarcity Stress Test
The primary post hoc analysis uses natural recorded-label visibility: all strict P labels recorded in training are visible, although unrecorded true opportunities remain unknown. The secondary synthetic stress test uses deterministic, nested 5%, 10%, 20%, 50%, and 100% within-class P masks. Every method and initialization receives the same retained P cells at each fraction; masked P cells become U. I, W, and N remain available to state-aware models. The synthetic 10% condition isolates false-negative supervision from U and the incremental information added by I/W; it is not an estimate of a real-world missingness rate.
2.7. Equal-Information Popularity Policies
An equal-information baseline is constructed from exactly the labels visible to the learned model’s training protocol, using no validation or test labels to estimate class popularity. Global visible-P ranks classes by retained P counts. Global state utility ranks classes by mean observed P/I/W/N utility. For every ontology and K, the stronger of these two global policies is selected using the validation year only and is then frozen for test evaluation. Thus, a learned method and its selected global comparator receive the same training years, visible labels, and class definitions.
Grouped empirical-Bayes policies condition on building type or building type plus HVAC type, with shrinkage selected on validation data. Ridge and LightGBM use the same train-only features and state targets as the neural model.
2.8. Temporal Property-Cold-Start Design and Leakage Audit
The primary split trains on 2019–2022, validates on 2023, and tests on 2024. A recorded property group appearing earlier is excluded from each later cold-start partition. The realized counts are 1898 rows/1402 groups for training, 260/222 for validation, and 351/272 for test; recall uses 280 test rows from 228 groups. Dates are reparsed with mixed-format UTC normalization, and exclusions are reconciled in Supplementary S2. The audit verifies disjointness of the archived group_id. We did not independently resolve multi-parcel campuses, common owners, audit firms, or vendors; the modelling table has no corresponding linkage columns. Shared ownership or audit practice may therefore create dependence across otherwise disjoint property groups.
The frozen 2024 primary analysis already selected utilities using 2023 and was unaffected by the historical-fold defect described here. In an earlier rolling-origin sensitivity script, however, the 2023-selected utility pair was inadvertently reused for earlier folds. The corrected audit selects utilities separately on each fold’s validation year, retrains the selected model, and creates predictions immediately after each fit. The four test years are 2021, 2022, 2023, and 2024. All 127 independent leakage and identity checks pass; hashes and superseded artifacts are listed in Supplementary S11.
2.9. Endpoints, Inference, Multiplicity, and Success Rule
For , observed-positive row recall is
where is the set of recorded strict positives and is the Top-K shortlist. U is never evaluated as a negative. We additionally report micro recall, macro label recall, the number of distinct unordered shortlists, dominant-shortlist share, and catalogue coverage [14]. Macro recall prevents frequent classes from completely determining the conclusion.
Paired differences use 10,000 bootstrap samples of property groups to obtain 95% confidence intervals (CIs); all eligible rows from a sampled group are retained with multiplicity. The 280 eligible test rows arise from 228 groups. Group resampling preserves within-property dependence, whereas independent row resampling could understate uncertainty when errors are correlated. The natural-condition family contains six comparisons: base-state and high-capacity state models versus the validation-selected global policy at . Two-sided bootstrap p values are adjusted by Holm’s procedure [15]. Other intervals are descriptive.
For the post hoc natural-condition analysis, a personalization claim requires, at the same K: (i) positive learned-minus-global row Recall@K with Holm-adjusted ; (ii) macro label recall no lower than global; and (iii) both more unique shortlists and greater catalogue coverage than global. Rolling origins are a separate temporal-consistency check under the synthetic 10% visibility stress test. Section 4.4 gives illustrative operational warning thresholds, distinguished from this statistical rule.
P/N area under the receiver operating characteristic curve (AUROC), calibration error, Brier score, negative exposure, and risk–coverage are exploratory endpoints reported in Supplementary S9.
2.10. Reproducibility and Evidence Boundary
The public repository provides processing code, frozen split identifiers, mask identifiers, fitted feature schemas, aggregate predictions, corrected tables, and SHA-256 manifests. The post-review analysis has identity BUILDINGS-4492602-POSTREVIEW-R3-20260821. Its analysis JavaScript Object Notation (JSON) file SHA-256 is c6447fa3dfa880493dadaf5fd98ed5d16dc012835a53595ffafdf17f4d27b4ed; the safe NumPy prediction archive SHA-256 is f26a2d17e33d0f8e031396918b6e62dedb17da769a0655d606302027d5155f7c. The archive opens with allow_pickle=False. All fixed architectures are reported.
The 2024 set was inspected in the original study. Natural-condition , capacity, ontology, status-precedence, and stopping analyses are post hoc. The present revision adds a separately versioned analysis and prediction archive in the supplementary reproducibility package; the frozen primary results remain unchanged.
2.11. Post Hoc Status-Precedence and Stopping Sensitivities
We reconstructed all six-class states from the hashed source-record mapping and required exact equality with the archived state matrix. For P > I versus I > P, the two five-seed base ensembles use identical rows, train-only features, temporal partitions, utilities, optimization, and natural visibility. Global policies are reselected on each definition’s validation labels only. We report changed cells, changed unordered lists, both evaluation denominators, and cross-evaluation of each prediction matrix against both target definitions. An additional diagnostic excludes I classes from both rankers using the same recorded-state eligibility mask; this oracle-assisted check is not a deployable cold-start protocol, and class-level exclusion may remove a different remaining measure within the same class.
For stopping sensitivity, both fixed architectures are trained along 120-epoch central processing unit (CPU) trajectories. We preserve the checkpoint that the original patience-15 rule would have selected and compare it with the fixed final checkpoint. Five fixed seeds, unchanged optimization, and separately seeded MC inference isolate the checkpoint contrast within each trajectory. These paired sensitivity analyses used Python 3.12.10, PyTorch 2.8.0+cpu, NumPy 2.5.1, and pandas 3.0.5. All endpoints and loss histories from these paired CPU fits are reported separately from the archived graphics processing unit (GPU) results in Supplementary S14.
3. Results
3.1. Cohort and Evaluation Boundary
Table 2 summarizes the property-cold-start partitions. Of the 351 test rows, 280 contain at least one recorded P. These rows contain 394 P cells. Per-class P counts are 128 for LED lighting, 42 for lighting controls, 24 for insulation, 10 for windows, 149 for HVAC controls, and 41 for HVAC equipment.
Table 2.
Temporal property-cold-start cohort and observed-label boundary. Property groups are disjoint across partitions.
3.2. Natural-Condition Performance at
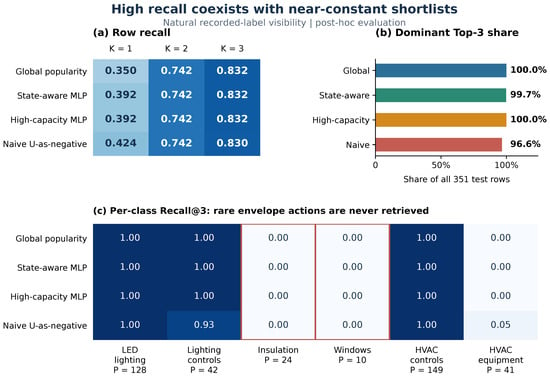
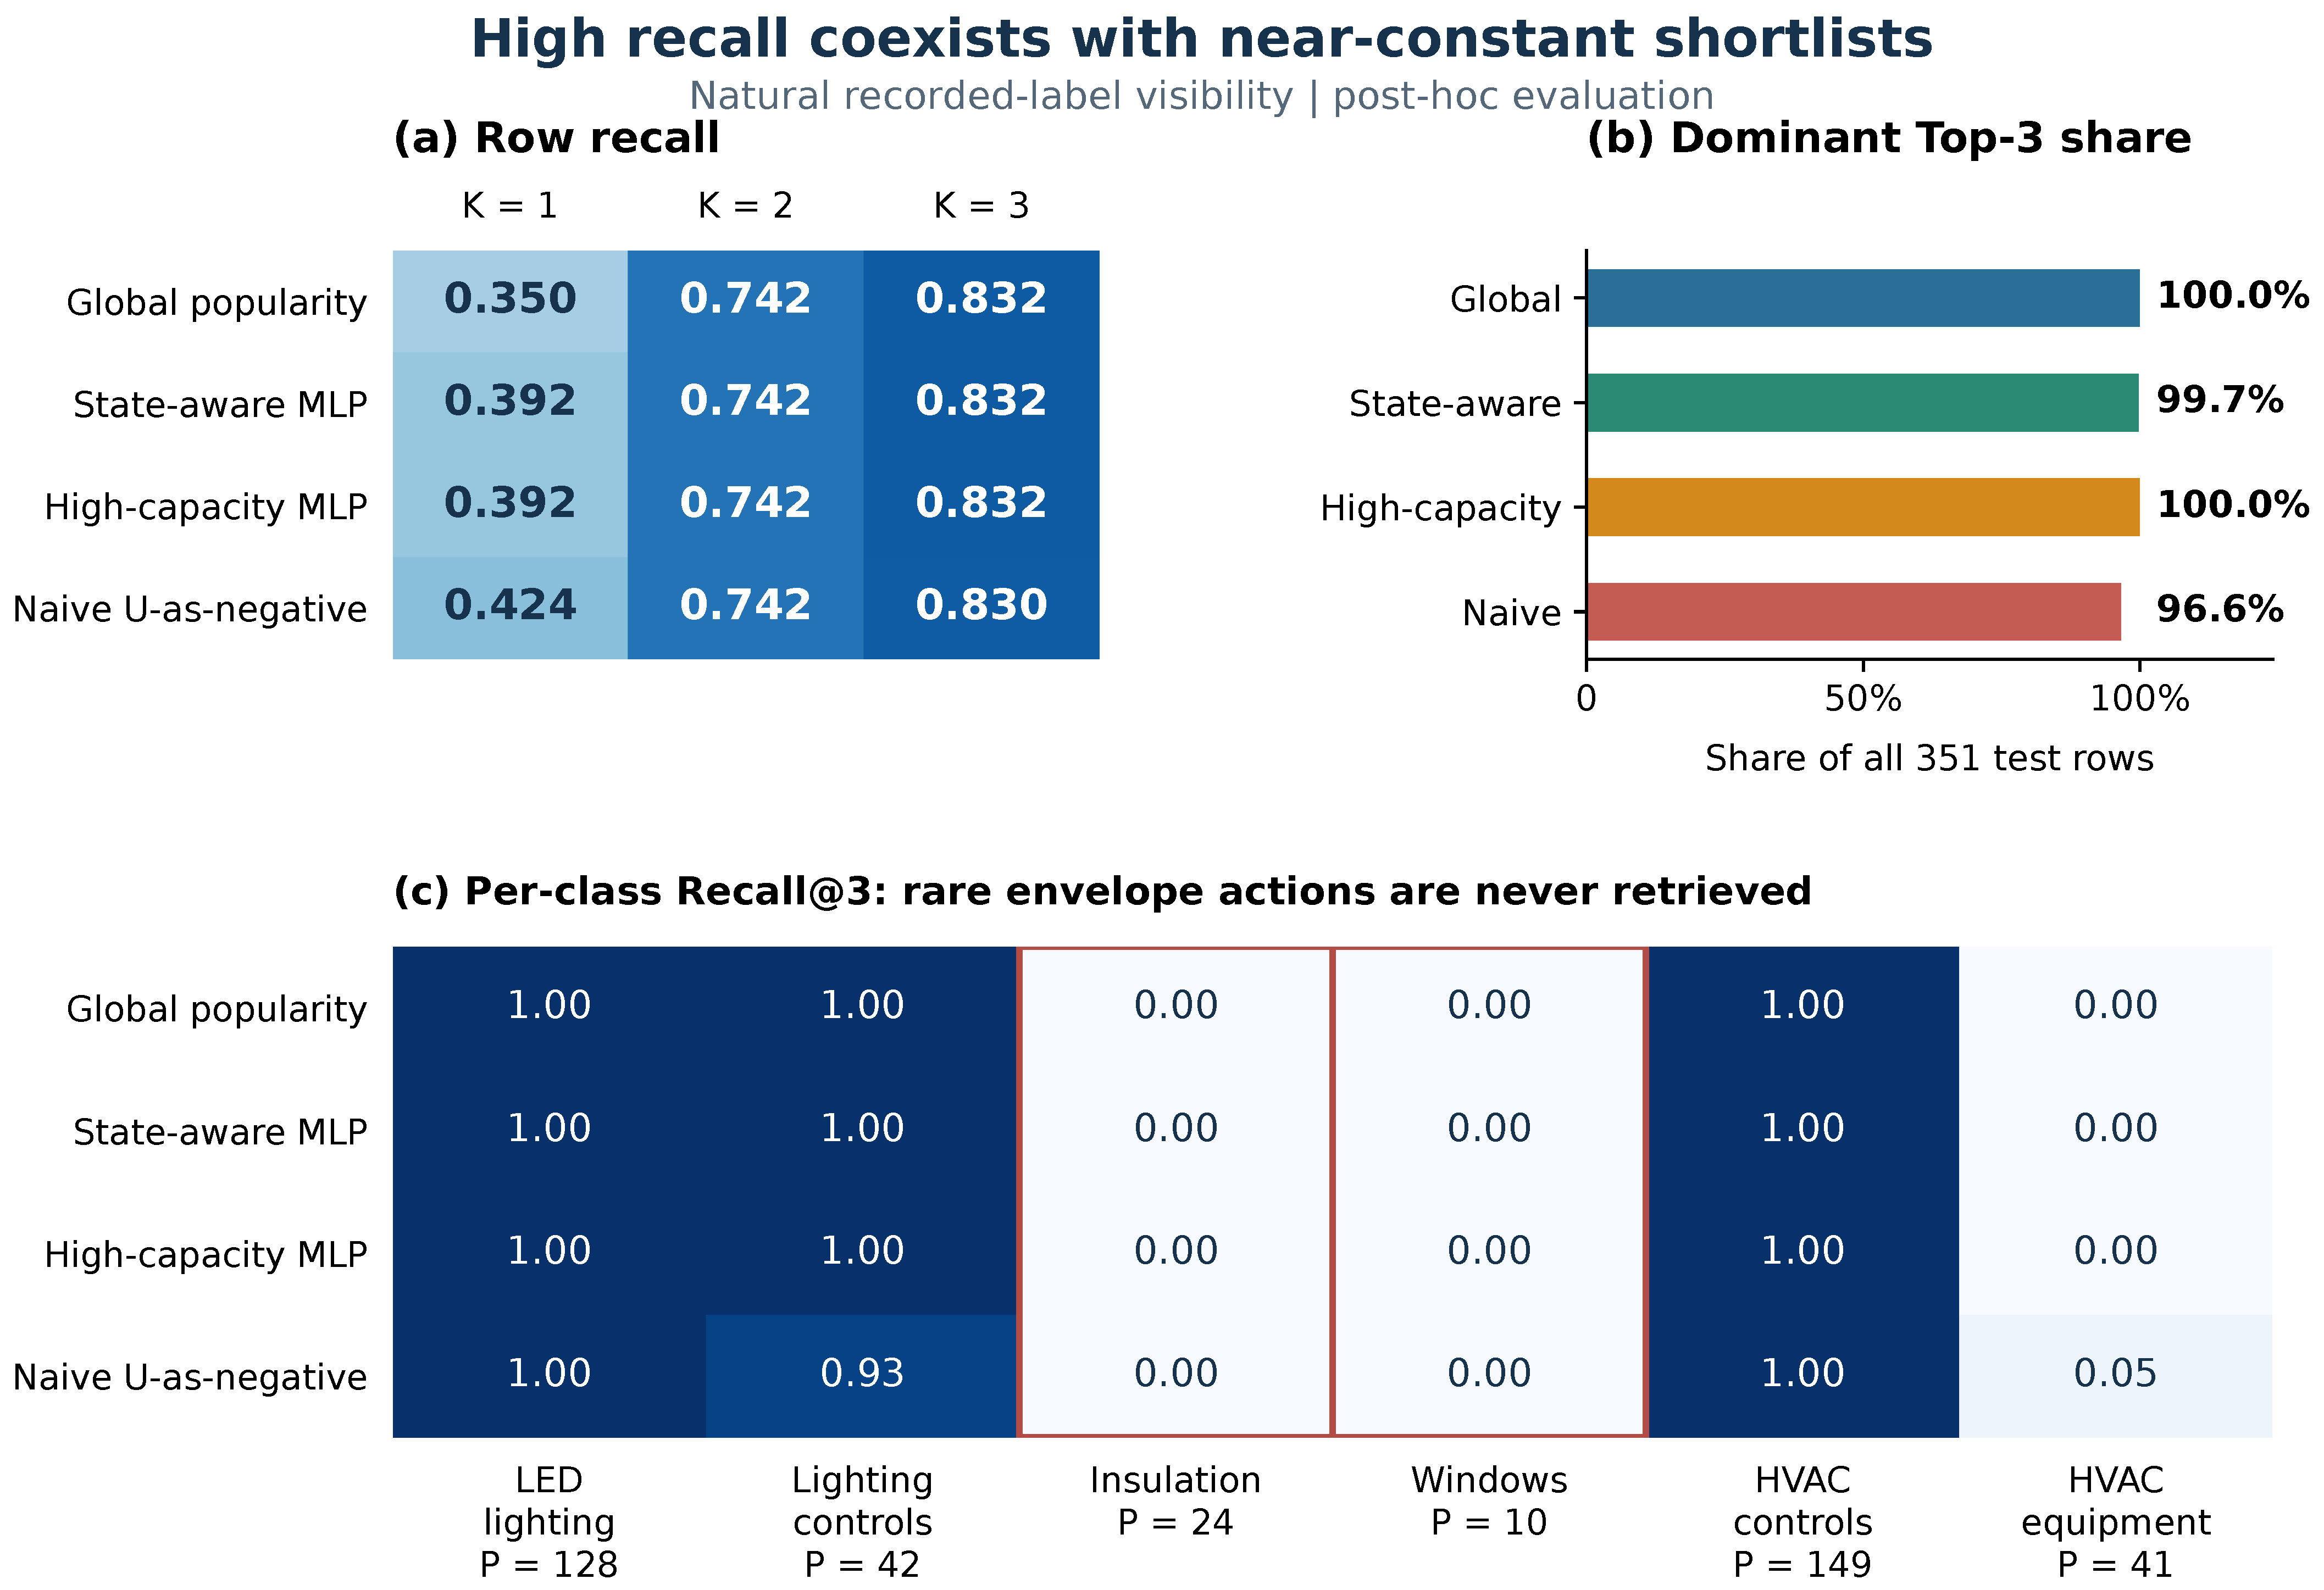
Figure 2 and Table 3 foreground natural recorded-label visibility. The validation-selected comparator was global state utility at every K. State–global differences were at (95% CI [, 0.160]) and zero at . At , both achieved row recall 0.832, micro recall 0.810, and macro recall 0.500. The base state MLP assigned the same unordered Top-3 set to 350/351 rows (99.7%); high-capacity and global policies did so for all 351. This is a near-constant shortlist collapse. At , the state model selected the same class for every test row.
Figure 2.
Post hoc natural-condition ranking, concentration, and class coverage. Panel (a) shows row recall for 280 eligible rows from 228 property groups. Panel (b) shows dominant Top-3 set share over all 351 rows. Panel (c) reports per-class Recall@3 and P denominators; insulation and windows have zero retrieval for all evaluated models. Red outlines identify these two envelope classes.
Table 3.
Post hoc natural-condition results on unseen 2024 property groups. R@K is row recall; macro is class-averaged Recall@3. Sets and share refer to unordered Top-3 shortlists; coverage is the number of six classes appearing in any list. Full macro endpoints are in Supplementary Table S27.
The base state–naive difference at was (95% CI [, 0.012]). The base and high-capacity state models had state–global differences of zero at and . For all six base/high-capacity versus global tests, Holm-adjusted . No comparison satisfied the first condition of the personalization rule.
The near-equality at reflects class prevalence. Global selected LED lighting, lighting controls, and HVAC controls and recalled all recorded P cells in those classes, but none of the 24 insulation, 10 window, or 41 HVAC-equipment positives. The base state model produced the same per-class recall pattern, except for one rare change in set membership that did not alter any aggregate recall. Thus, high row recall did not imply balanced coverage of retrofit opportunities.
3.3. Capacity and Ontology-Granularity Robustness
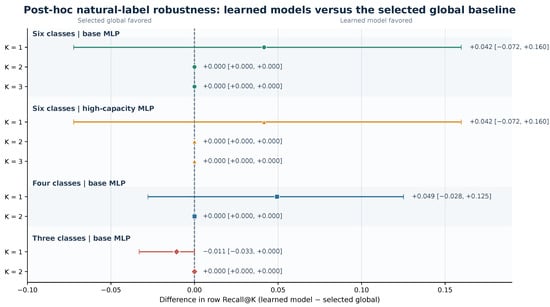
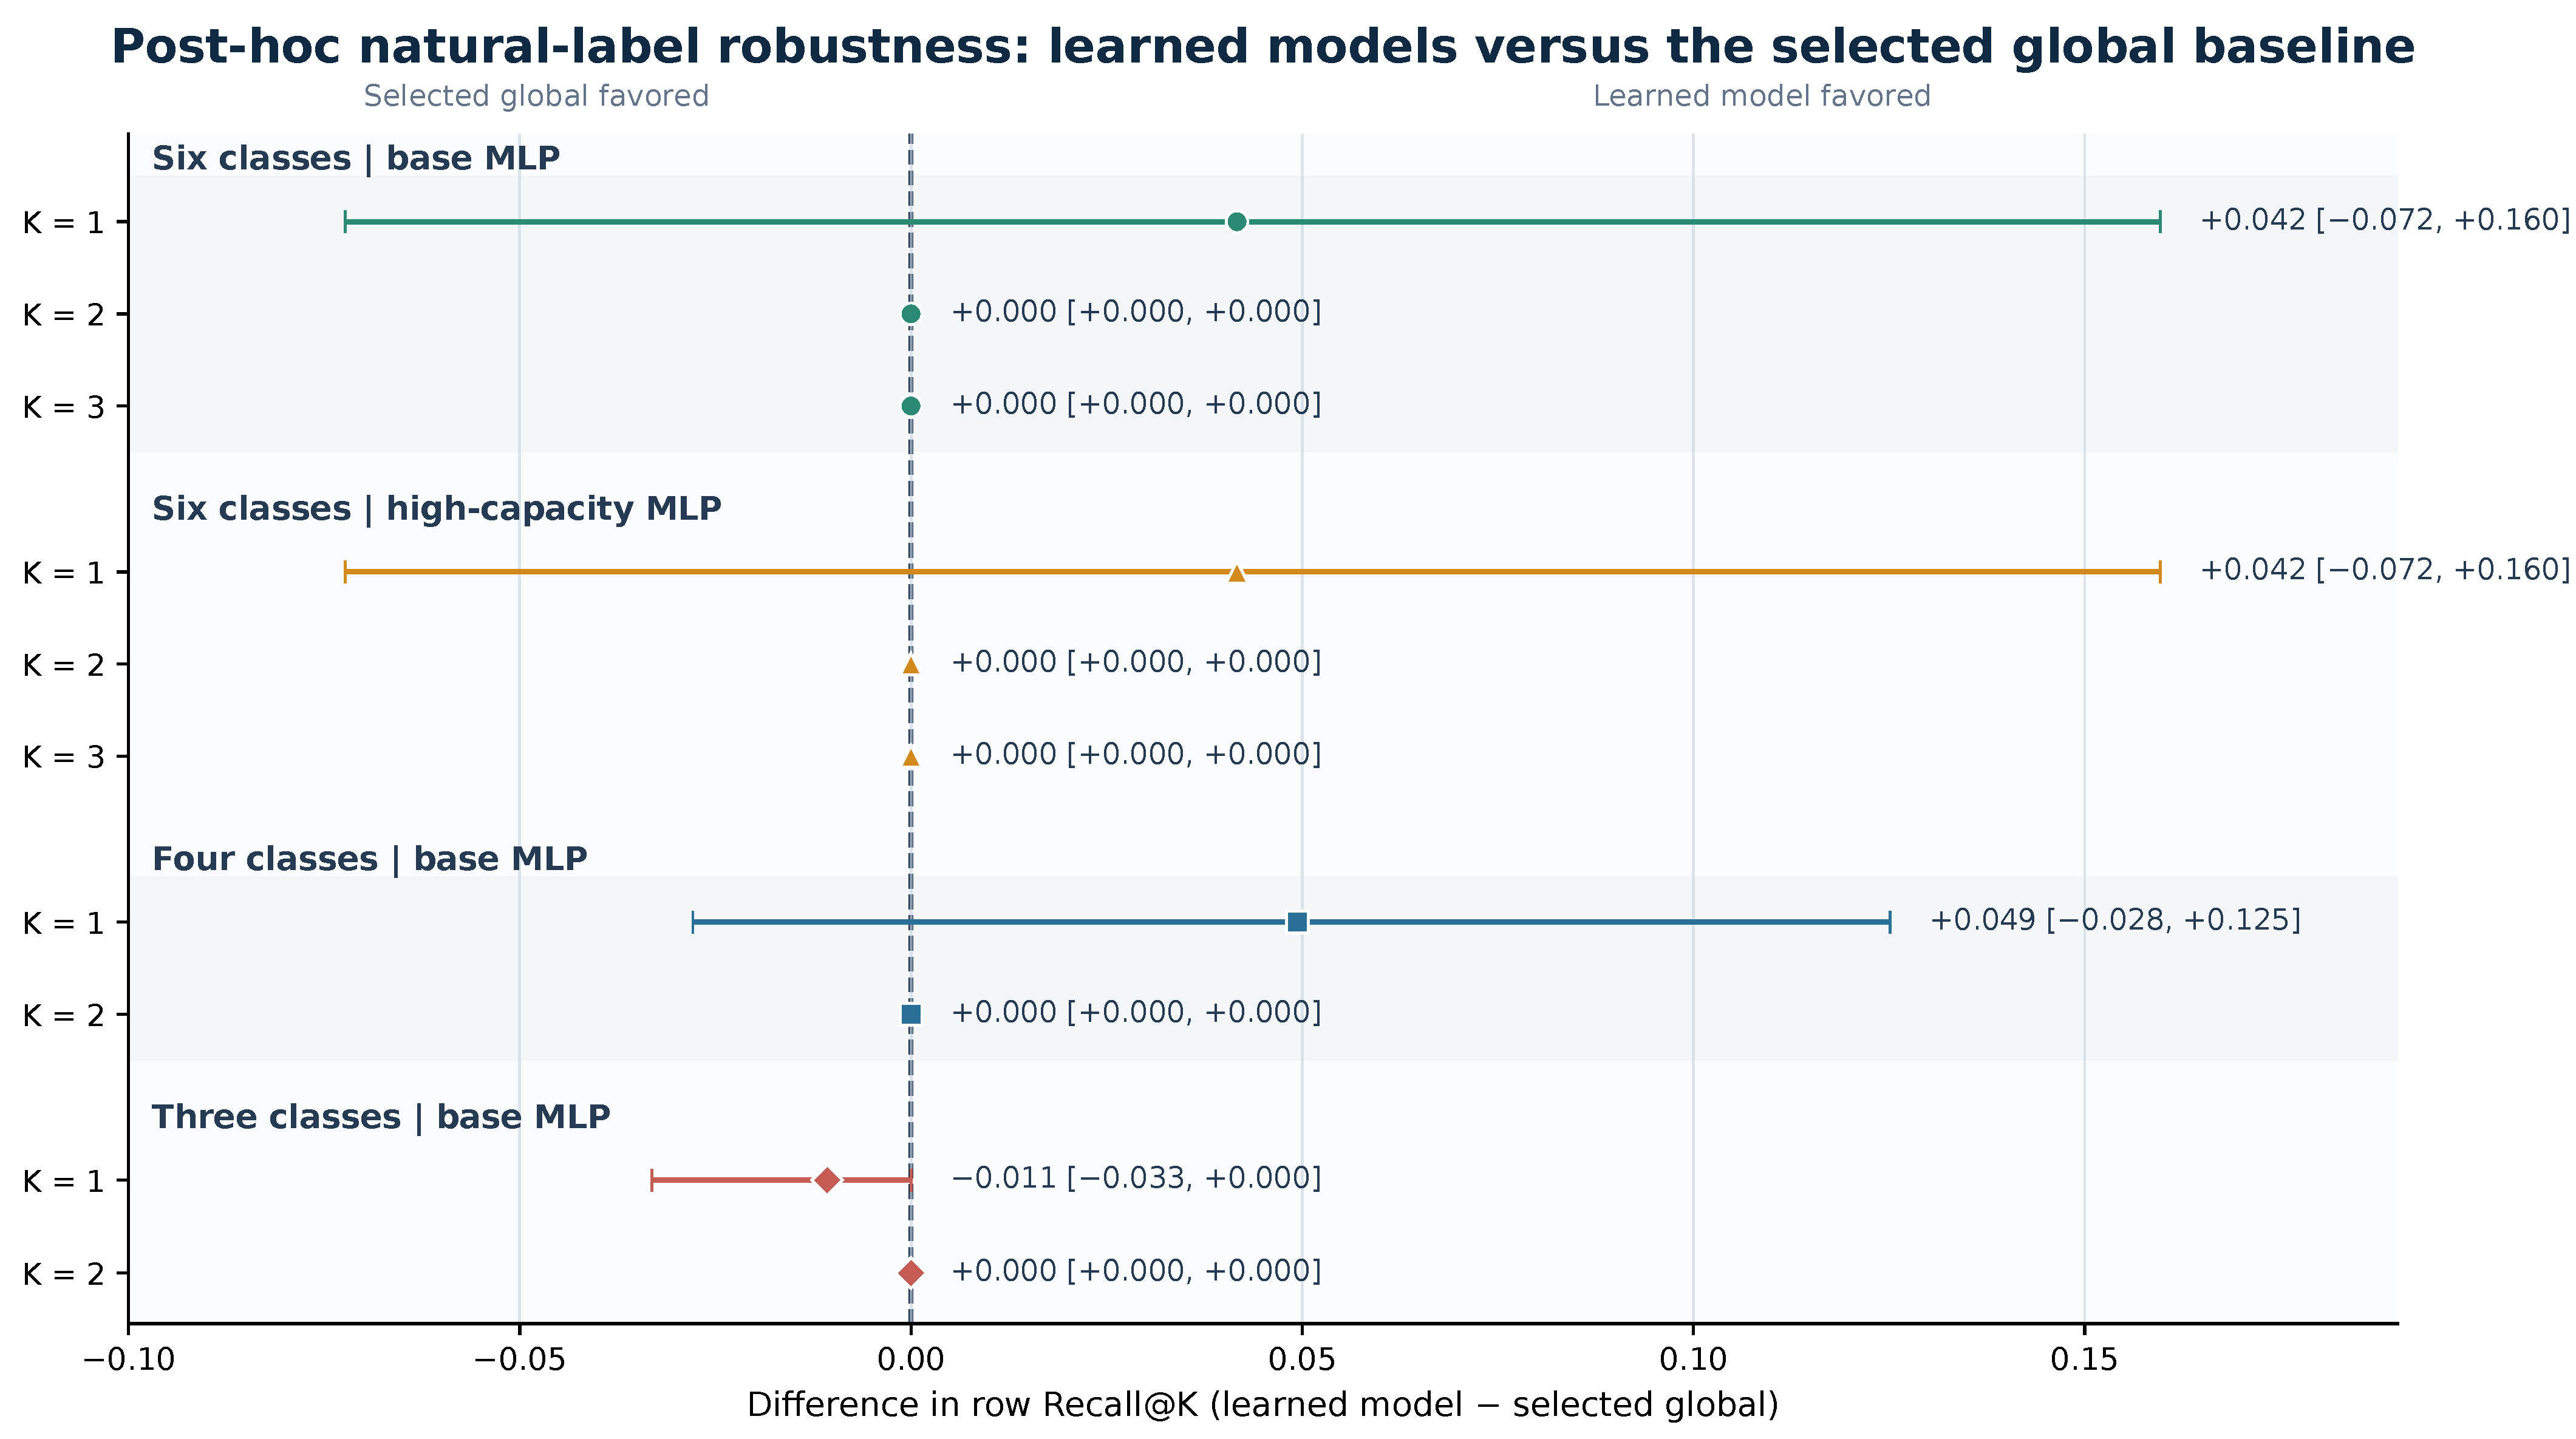
Increasing trainable parameters from 3942 to 48,198 did not improve the archived natural-condition Recall@K values. The high-capacity model returned the global Top-3 set for every row. Figure 3 shows the wide intervals and zero differences. The archived high-capacity checkpoints were selected at epochs 22–43, with patience stopping at 37–58. Section 3.7 tests the effect of continuing to the full epoch budget.
Figure 3.
Post hoc capacity and ontology sensitivity under the natural label condition. Points are learned-minus-validation-selected-global row Recall@K; bars are 95% property-group bootstrap intervals. Six base/high-capacity comparisons form the Holm family; ontology-merger intervals are descriptive.
The four-class ontology increased the base model’s recall from 0.439 for global to 0.489, a difference of (95% CI [, 0.125]); its macro recall was 0.289 versus 0.250, and it produced two sets rather than one. At , both policies obtained 0.832 row recall and 0.500 macro recall and selected one set. In the three-class ontology, base-minus-global was at (95% CI [, 0.000]) and zero at ; both policies obtained 0.911 row recall at . Here, already selects 66.7% of the action space, so the high recall has limited practical decision value. Merging reduces sparsity but also conceals different engineering requirements.
3.4. Synthetic Label-Scarcity Stress Test
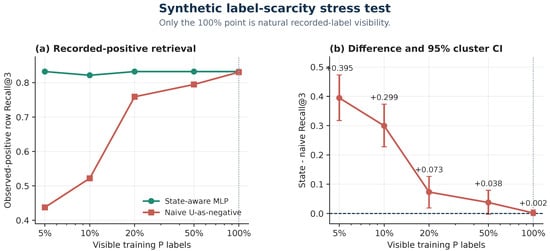
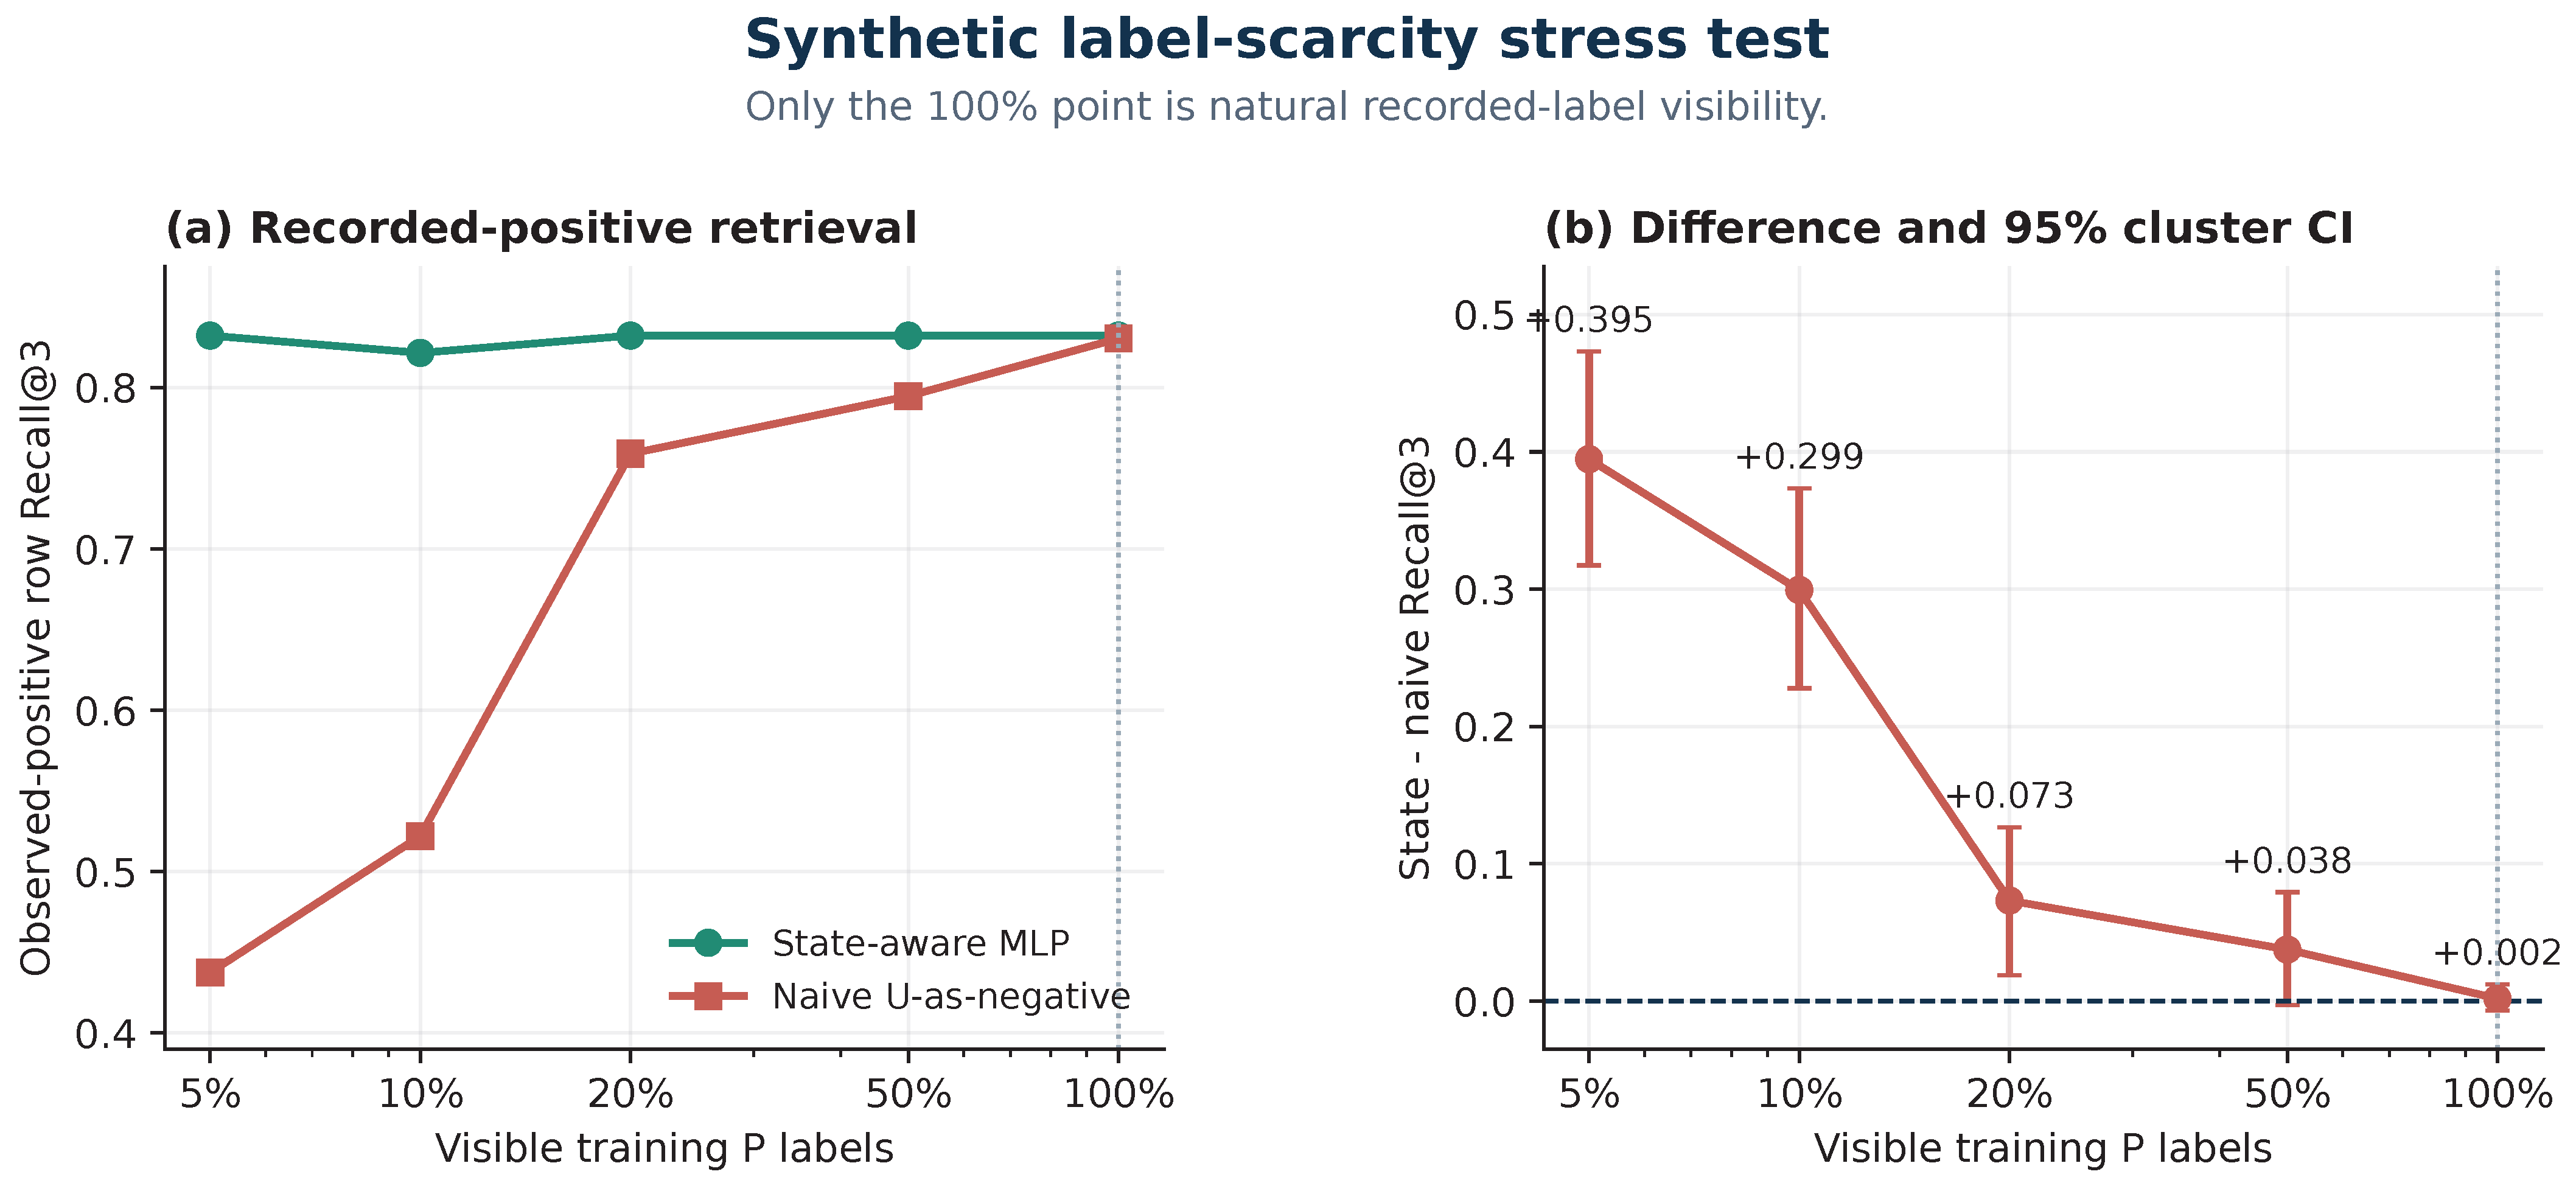
Figure 4 shows state-aware Recall@3 near 0.82 across nested synthetic masks, whereas naive BCE increased from 0.438 at 5% visibility to 0.830 at natural visibility. The state–naive difference attenuated from approximately 0.39 to 0.002.
Figure 4.
Secondary synthetic label-scarcity stress test on the same 280 eligible 2024 rows. Panel (a) compares state-aware and naive Recall@3 across nested visibility masks, including the synthetic 10% condition. Panel (b) shows paired differences with 95% property-group bootstrap intervals. Only the 100% point represents natural recorded-label visibility.
At the archived 10% mask, state-aware Recall@3 was 0.821, P/N-only was 0.801 in the matched decomposition, naive BCE was 0.522, and the selected global policy was 0.832. Excluding U from the negative class while holding I/W exclusion constant improved recall by (95% CI [0.207, 0.351]). Adding the selected I/W targets improved the state model over P/N-only by a further (95% CI [0.006, 0.039]). The full state–global difference remained (95% CI [, 0.010]).
3.5. Rolling Origins Under Synthetic 10% Visibility and Post Hoc Listwise Results
Table 4 reports the corrected fold-local audit under the synthetic 10% visibility stress test. The state model was below global in every year: substantially in 2021 and 2022, with intervals below zero, and marginally in 2023 and 2024. The early folds train on only 2019 or 2019–2020, and retaining approximately one tenth of P labels leaves less supervised information than the later folds. Global policies require only class-level aggregation, whereas conditional models must also estimate feature-dependent parameters. Limited supervision is a plausible explanation alongside changes in class prevalence, audit practice, and feature distribution; their effects were not separately estimated. The post hoc listwise difference was positive only in 2024 with intervals crossing zero in earlier folds (Supplementary S8).
Table 4.
Corrected fold-local rolling-origin sensitivity at under the synthetic 10% visibility stress test. Each fold selects utilities and the stronger global policy on its own validation year.
3.6. Sparse Negatives and Tail Classes
Only 12 explicit N cells occur among 406 observed P/N test cells. Consequently, class-level AUROC and calibration are undefined or unstable for several classes, and a risk–coverage curve over this subset cannot represent the 1643 U cells in the test matrix. Supplementary S9 reports these exploratory results with denominators.
At natural visibility, the base state, high-capacity state, and naive MLPs each retrieve 0/24 insulation and 0/10 window-upgrade positives at , as does global (Supplementary Table S29). High aggregate recall therefore coexists with complete failure to retrieve the recorded rare envelope actions. The small denominators limit extrapolation beyond these labelled cases.
The non-neural evidence points in the same direction under the secondary synthetic 10% stress test (Table S16). Ridge and LightGBM both obtained Recall@3 of 0.832; their dominant-set shares were 1.000 and 0.977, respectively. Ridge exactly matched global retrieval, while LightGBM’s paired difference was 0.000 with a descriptive 95% CI of approximately [−0.005, 0.005]. Neither retrieved insulation or windows.
3.7. Post Hoc Status-Precedence and Stopping Results
Changing P > I to I > P altered 41/15,738 cells (0.26%), including 30 training, six validation, four test, and one excluded-row cell. In test, P cells decreased from 394 to 390 and eligible rows from 280 to 278. Paired CPU refits changed zero Top-1, three Top-2, and four Top-3 unordered lists among 351 test rows. Under I-first targets, state/global Recall@3 was 0.836/0.832, a descriptive difference of 0.004 (95% CI [0.000, 0.011]). Cross-target evaluation in S14 separates altered predictions from altered labels. With a common I-exclusion mask, five Top-3 lists changed between the two fitted rankers; both still missed all insulation and window positives.
Removing early stopping did not improve the larger model. At epoch 120, base/high-capacity Recall@3 was 0.832/0.810, compared with 0.832/0.832 at their paired early checkpoints. High-capacity Recall@1 and Recall@2 fell to 0.202 and 0.520; its validation loss increased despite decreasing training loss. This pattern supports overfitting within the tested representation and optimization schedule (Supplementary S14).
4. Discussion
4.1. Natural Labels Change the Headline Conclusion
Foregrounding the natural condition changes the interpretation of the study. When all recorded P labels are visible, state-aware and naive models differ by only at , with an interval spanning zero. More importantly, neither the base nor high-capacity state model improves on the equal-information global policy at or . The small point difference is imprecise, has no macro-recall advantage, and uses one shortlist for every building. These results do not meet the declared success rule.
The synthetic-scarcity analysis shows that encoding hidden positives as negatives can severely degrade a learner. Its matched decomposition attributes most of the 10% difference to U handling rather than to the graded I/W targets, consistent with established PU-learning concerns [10,11]. Correcting that error leaves the shortlist dominated by the same classes as the equal-information popularity policy.
4.2. Why Popularity Dominates These Shortlists
LED lighting and HVAC controls account for 277/394 test P cells (70.3%). Selecting three of six classes covers half the catalogue; the dominant global set retrieves 319/394 P cells (micro recall 0.810) and yields mean row recall 0.832 without using property descriptors. Row recall differs from the raw positive fraction because each eligible row receives equal weight. Nearly all learned lists reproduce this popularity pattern. The fixed-budget audit found no benefit from removing early stopping, favoring overfitting and limited generalizable signal in the tested representation as explanations for the scaling result.
The prior studies in Table 1 use different datasets, label vocabularies, splits, and metrics. In this six-class future-property task, broad descriptors provided no reliable added retrieval over popularity.
4.3. Recorded Recommendations Are Noisy Practice Signals
A P label records what an audit reported. Compliance deadlines, auditor expertise, firm templates, vendor relationships, incentives, cost thresholds, and owner plans may influence reporting. For example, Con Edison’s July 2024 commercial and industrial (C&I) programme listed incentives for LED fixtures and lighting controls, alongside HVAC and envelope measures [16]. Programme participation, rebate receipt, and auditor identity were not measured, so their contribution to this cohort’s skew remains unknown. I and W also mix technical considerations with history and uncertainty, undermining a simple random-missingness interpretation.
The study estimates retrieval of recorded audit practice, not annual energy savings, percentage energy reduction, capital expenditure, simple payback, net present value (NPV), or a techno-economic optimum. Those outputs require costs, tariffs, baseline operation, measure interactions, and an explicit evaluation horizon [17]. No measured post-retrofit energy outcomes or physics-based building-energy simulations validate the shortlists.
A useful next dataset would join audit equipment and envelope sub-tables to the case identifiers, retaining equipment age, measured or rated coefficient of performance (COP), capacity, thermal properties, geometry, control settings, faults, and proposed measure costs/savings. These variables might discriminate otherwise similar buildings and recover within-class patterns that aggregation obscures. This requires checking linkage quality, missingness, availability at decision time, and incremental future-property performance.
Future validation should first freeze measure-level candidates and compare them with an engineer’s feasible shortlist, then test expected savings using calibrated building-energy simulation [18], and finally compare implemented measures with weather- and occupancy-adjusted measured outcomes and documented costs. Simulation agreement would test physical plausibility; measured follow-up would test realized performance.
4.4. Implications for Building Practitioners
The practical output is a pre-deployment audit. The following illustrative warning thresholds have not been empirically validated. For a new application, they should be agreed with engineers and frozen on development data before testing:
- Label integrity: require 0 U-to-N recodings and 100% traceability of included class labels to a documented source/mapping; otherwise fail the data-integrity check.
- Added retrieval: apply the statistical rule in Section 2.9 and require at least 0.02 absolute learned-minus-global row recall with macro-recall difference .
- Concentration and neglected classes: flag dominant-set share , catalogue coverage , or recall for any class with at least 20 recorded positives. Flag smaller class samples as insufficiently supported. These flags trigger case inspection.
- Temporal consistency: require 0 overlapping property identifiers, at least two prespecified future/external evaluation periods, and no negative learned-minus-global point difference in either period before claiming stable added retrieval. Report uncertainty and owner/auditor linkage gaps separately.
- Engineering hand-off: require 100% of proposed installed measures to undergo qualified feasibility, sizing, interaction, cost, and savings assessment.
Failure to outperform the equal-information global policy, combined with nearly constant shortlists, identifies a popularity-dominated model.
4.5. Limitations and Future Validation
The study is limited to one city’s large non-residential audit programme, six broad classes, and the available stock descriptors. Independent engineering adjudication, broader ownership/auditor linkage, and physical or economic outcome validation remain necessary. Sparse tail-class and negative labels limit precision, while changing practice and policy may affect repeated audits.
The post hoc analyses require confirmation on an untouched temporal release or external dataset, with a frozen ontology, information boundary, K values, popularity baselines, success rule, and physical/economic validation plan.
5. Conclusions
In 2623 New York City LL87 non-residential audit rows, preserving multi-state audit labels prevented severe degradation when strict-positive labels were artificially hidden. Under the natural recorded-label condition, a base state-aware MLP, a 12.2-times-larger MLP, and coarser ontology variants did not establish an advantage over validation-selected global popularity policies. At , state and global row recall were both 0.832; state–naive was (95% CI [, 0.012]). The learned lists were almost constant and missed the same tail classes as the global policy.
The benchmark diagnoses two failures: encoding unlabelled audit entries as known negatives and mistaking popularity-dominated retrieval for personalization. Retrofit-shortlisting studies should combine same-information popularity baselines, temporal unseen-property tests, multiple K values, macro and concentration metrics, and transparent label provenance.
Supplementary Materials
The following supporting information can be downloaded at: https://www.mdpi.com/article/10.3390/buildings16183666/s1. S1–S14: archived reproducibility protocol; data provenance and splits; ontology/state construction; features; synthetic visibility masks; utilities; baselines; synthetic rolling origins; exploratory calibration; interpretation guide; artifacts/commands; inventory; prior post hoc natural/capacity/ontology analyses; and new precedence and stopping sensitivities. The supplementary reproducibility archive contains the new analysis code, aggregate results, prediction matrices, and hashes.
Author Contributions
Conceptualization, J.F. and S.C.; methodology, J.F. and S.C.; software, J.F.; validation, J.F., Y.Z., Y.L. and S.C.; formal analysis, J.F.; investigation, J.F., Y.Z. and Y.L.; resources, S.C.; data curation, J.F., Y.Z. and Y.L.; writing—original draft preparation, J.F.; writing—review and editing, J.F., Y.Z., Y.L. and S.C.; visualization, J.F., Y.Z. and Y.L.; supervision, S.C.; project administration, S.C. All authors have read and agreed to the published version of the manuscript.
Funding
This research received no external funding.
Institutional Review Board Statement
Not applicable. The study used a public building-audit dataset and involved no human participants or animals.
Informed Consent Statement
Not applicable.
Data Availability Statement
The study uses the public NYC LL87 Energy Audit Data (dataset identifier au6c-jqvf). Archived processing code, frozen split and mask identifiers, fitted schemas, predictions, and prior robustness artifacts are available at https://github.com/Jingjing4949/ll87-audit-state-shortlist-benchmark (accessed on 22 August 2026). The new major-revision analysis code, aggregate results, predictions, and SHA-256 manifest accompany this article in the supplementary reproducibility archive. Source-restricted records are not redistributed and must be obtained from the cited provider under its terms.
Conflicts of Interest
Author Shengxi Cao was employed by Norendar International Ltd. The company had no role in the decision to submit this work for publication. The remaining authors declare no conflicts of interest.
Abbreviations
The following abbreviations are used in this manuscript:
| LL87 | New York City Local Law 87 |
| HVAC | Heating, ventilation, and air conditioning |
| MLP | Multilayer perceptron |
| PU | Positive–unlabelled |
| P/I/W/N/U | Recommended/implemented or planned/further study/not recommended/unlabelled |
References
- Baset, A.; Jradi, M. Data-Driven Decision Support for Smart and Efficient Building Energy Retrofits: A Review. Appl. Syst. Innov. 2025, 8, 5. [Google Scholar] [CrossRef] [Scilit]
- Grillone, B.; Danov, S.; Sumper, A.; Cipriano, J.; Mor, G. A Review of Deterministic and Data-Driven Methods to Quantify Energy Efficiency Savings and to Predict Retrofitting Scenarios in Buildings. Renew. Sustain. Energy Rev. 2020, 131, 110027. [Google Scholar] [CrossRef] [Scilit]
- Manfren, M.; Gonzalez-Carreon, K.M.; James, P.A.B. Interpretable Data-Driven Methods for Building Energy Modelling—A Review of Critical Connections and Gaps. Energies 2024, 17, 881. [Google Scholar] [CrossRef] [Scilit]
- Shu, L.; Zhao, D. Decision-Making Approach to Urban Energy Retrofit—A Comprehensive Review. Buildings 2023, 13, 1425. [Google Scholar] [CrossRef] [Scilit]
- City of New York. LL87 Energy Audit Data, 2019–2024. NYC Open Data, 2026. Dataset Identifier au6c-jqvf; View Metadata Last Modified 2026-04-21; Archived Workbook SHA-256 f3885968363b786247fce08e7d77a54904d22ebbb6cfaa981ae02f18c533c9f2. Available online: https://data.cityofnewyork.us/d/au6c-jqvf (accessed on 22 August 2026).
- Kontokosta, C.E.; Spiegel-Feld, D.; Papadopoulos, S. The impact of mandatory energy audits on building energy use. Nat. Energy 2020, 5, 309–316. [Google Scholar] [CrossRef] [Scilit]
- Marasco, D.E.; Kontokosta, C.E. Applications of machine learning methods to identifying and predicting building retrofit opportunities. Energy Build. 2016, 128, 431–441. [Google Scholar] [CrossRef] [Scilit]
- Curcio, E. Retrieval over Reasoning: A Cost-Controlled Benchmark of Language Models for Energy-Retrofit Recommendation. arXiv 2026. [Google Scholar] [CrossRef] [Scilit]
- Rempi, P.; Pelekis, S.; Tzortzis, A.M.; Spiliotis, E.; Karakolis, E.; Ntanos, C.; Mouzakitis, S.; Askounis, D. A trustworthy by design classification model for building energy retrofit decision support. Energy Build. 2026, 360, 117340. [Google Scholar] [CrossRef] [Scilit]
- Bekker, J.; Davis, J. Learning from positive and unlabeled data: A survey. Mach. Learn. 2020, 109, 719–760. [Google Scholar] [CrossRef] [Scilit]
- Kiryo, R.; Niu, G.; du Plessis, M.C.; Sugiyama, M. Positive-Unlabeled Learning with Non-Negative Risk Estimator. In Proceedings of the 31st International Conference on Neural Information Processing Systems, Long Beach, CA, USA, 4–9 December 2017; Volume 30, pp. 1675–1685. [Google Scholar]
- Jain, S.; White, M.; Radivojac, P. Recovering True Classifier Performance in Positive-Unlabeled Learning. In Proceedings of the AAAI Conference on Artificial Intelligence, San Francisco, CA, USA, 4–9 February 2017; Volume 31, pp. 2066–2072. [Google Scholar] [CrossRef] [Scilit]
- Ke, G.; Meng, Q.; Finley, T.; Wang, T.; Chen, W.; Ma, W.; Ye, Q.; Liu, T.Y. LightGBM: A Highly Efficient Gradient Boosting Decision Tree. In Proceedings of the 31st International Conference on Neural Information Processing Systems, Long Beach, CA, USA, 4–9 December 2017; Volume 30, pp. 3146–3154. [Google Scholar]
- Castells, P.; Hurley, N.; Vargas, S. Novelty and Diversity in Recommender Systems. In Recommender Systems Handbook, 3rd ed.; Ricci, F., Rokach, L., Shapira, B., Eds.; Springer: New York, NY, USA, 2022; pp. 603–646. [Google Scholar] [CrossRef] [Scilit]
- Holm, S. A Simple Sequentially Rejective Multiple Test Procedure. Scand. J. Stat. 1979, 6, 65–70. [Google Scholar]
- Con Edison. 2024 Commercial and Industrial Energy Efficiency Program: Mid-Year Webinar, 2024. 16 July 2024, pp. 6–9. Available online: https://www.coned.com/en/save-money/rebates-incentives-tax-credits/participating-contractor-resources-and-directory/incentives-and-resources/-/media/90cf5d80bdab4e1895682a8208bce3da.ashx (accessed on 22 August 2026).
- Papangelopoulou, M.D.; Alexakis, K.; Askounis, D. Assessment Methods for Building Energy Retrofits with Emphasis on Financial Evaluation: A Systematic Literature Review. Buildings 2025, 15, 2562. [Google Scholar] [CrossRef] [Scilit]
- Pan, Y.; Zhu, M.; Lv, Y.; Yang, Y.; Liang, Y.; Yin, R.; Yang, Y.; Jia, X.; Wang, X.; Zeng, F. Building Energy Simulation and Its Application for Building Performance Optimization: A Review of Methods, Tools, and Case Studies. Adv. Appl. Energy 2023, 10, 100135. [Google Scholar] [CrossRef] [Scilit]

Disclaimer/Publisher’s Note: The statements, opinions and data contained in all publications are solely those of the individual author(s) and contributor(s) and not of MDPI and/or the editor(s). MDPI and/or the editor(s) disclaim responsibility for any injury to people or property resulting from any ideas, methods, instructions or products referred to in the content. |
© 2026 by the authors. Licensee MDPI, Basel, Switzerland. This article is an open access article distributed under the terms and conditions of the Creative Commons Attribution (CC BY) license.