


Abstract
Site photographs, material micrographs, and construction records are often used directly as evidence for claims in building research, and generative artificial intelligence can now synthesize such images in their entirety or edit authentic ones locally. How this material is judged once it enters the evidence stream has not been tested empirically. Using ChatGPT Images 2.0, this study assembled 18 images covering three sources—authentic, fully AI-generated, and AI-modified—across three types of evidence content, and 151 participants judged the source of each image and rated its evidentiary credibility and acceptability. Overall identification accuracy was 36.9% against a chance level of 33.3%, and 63.6% of participants scored at or below chance. Fully AI-generated images were judged authentic in 55.1% of cases and authentic images were correctly identified in 51.8%. Stated confidence did not distinguish correctly from incorrect judgments, and AI images mistaken for authentic ones were rated close to genuine images in credibility and acceptability. Accuracy rose with building-related experience, from 32.3% among participants reporting none to 53.1% among those reporting six to ten years, but no group reached a level at which the image alone would be a dependable check of its provenance.
1. Introduction
In civil engineering research, visual records are not merely tools for presentation. Photographs, video frames, microscopic images, thermal images, construction records, and image-based measurement results can all be used to support research claims concerning whether failure is present, what structure a material has, whether construction has progressed, or how a building has changed. For example, modern civil infrastructure assessment treats visual inspection as an important component of condition assessment and identifies images and videos as important data sources for detecting damage, identifying structural components, and measuring displacement [1,2]. Backscattered electron images obtained using scanning electron microscopy (SEM) can be used to observe and quantitatively characterize the microstructures of cement and concrete and to analyze hydration products, pores, paste–aggregate interfaces, and deterioration characteristics [3,4]. Visual construction records, such as site photographs collected daily or periodically, can be used to reconstruct the actual construction status and compare it with a building information model (BIM), thereby identifying completed components and deviations between actual and planned progress [5,6]. Images used as evidence maintain a substantiable correspondence with the objects, events, experiments, or analytical processes that they claim to represent. Recent studies have shown that machine learning, deep learning, and AI technologies have improved the accuracy of visual evidence analysis in building research, including the aforementioned concrete crack detection [7,8] and automated construction progress monitoring [5].
However, the development of generative AI has also changed the ways in which images are produced and modified. From the perspective of generation principles, representative generative image models can mainly be divided into two categories. The first category is latent diffusion models, which learn the transformation from noise to image representations in a compressed latent representation space, after which a decoder reconstructs the latent representations into images [9]. For example, Imagen 3 proposed by Google is a latent diffusion model. It can generate images from text prompts and enhance the model’s ability to process complex prompts, spatial relationships, and text in images. The second category is flow-matching and rectified-flow models, which learn a vector field along a continuous probability path to gradually transform an initial noise distribution into a target image distribution. For example, Stable Diffusion 3 and 3.5 use a rectified-flow generation mechanism and introduce a multimodal diffusion Transformer framework, allowing text tokens and image tokens to exchange information in attention layers to improve the model’s understanding of text prompts and its image-generation capabilities [10]. FLUX.1 Kontext unifies image generation and image editing within a flow-matching framework in the latent space, allowing the model to receive text and image inputs simultaneously and supporting local editing, global modification, character and style references, and successive multi-turn editing. In addition, DALL·E 3 enhances the model’s ability to follow complex text prompts by increasing the coverage of image content in its training text. It can be said that the capabilities of generative image technologies have expanded from synthesizing entirely new images based on text to making successive modifications to existing visual materials under the joint constraints of input images, reference images, and natural-language instructions, including local inpainting, object addition and removal, and background replacement.
Evidence from human visual perception experiments indicates that visual realism cannot reliably represent image source authenticity. The study by Nightingale and Farid [11] found that participants may no longer be able to reliably distinguish faces generated by a generative engine from real human faces and give higher ratings to synthetic faces. Högemann et al. [12] asked 104 participants to judge whether 50 landscape, architectural, and interior images were authentic images or AI-generated images and to report their confidence in their judgments. The participants’ overall identification accuracy for AI-generated images was 63.7%, but identification performance differed significantly among generative models. For images generated by FLUX.1-dev, the identification accuracy was only 29.0%. When explaining the basis for their judgments, participants commonly mentioned visual cues such as geometric relationships, materials, lighting, reflections, perspective, and scene logic. The study also found inconsistency between judgment confidence and identification accuracy. An experiment by Farooq and de Vreese [13] with 292 British participants found that AI-generated misinformation images with higher aesthetic realism were more likely to be judged as authentic images, although the explanatory effect of aesthetic realism on judgment results was small. An example from the context of scientific evidence use is the experiment conducted by Hartung et al. [14] on histological images. They used Stable Diffusion 1.5 and DreamBooth to generate mouse kidney histology images and asked 816 participants to distinguish authentic images from generated images. Participants with experience in biomedical histology achieved an identification accuracy of 69.3%, whereas participants without relevant experience achieved 54.5%. Davydiuk et al. [15] used authentic atomic force microscopy (AFM) and transmission electron microscopy (TEM) images as training and reference materials and used getimg.ai to generate fabricated images that retained similar experimental characteristics, noise, and heterogeneity without reproducing the original microstructures. They invited 250 scientists to judge the authenticity of the images they viewed, and the identification accuracies for the six image groups were only 40–51%. It can be inferred that professional experience can improve identification performance, but visual inspection by professionals alone is still insufficient to reliably confirm the source authenticity of scientific images.
Concerns about scientific image integrity predate the emergence of generative AI. Digital image processing guidelines have long distinguished between permissible image adjustments and image alterations that add, delete, obscure or move information [16]. A large-scale visual screening study of images in a total of 20,621 papers published in 40 scientific journals between 1995 and 2014 documented the improper reuse of images in the published literature [17]. Problematic images were found in 3.8% of the published papers, and at least half of the images showed characteristics of suspected deliberate manipulation. In other words, the correctness and integrity of image evidence cannot be assumed merely because an image has passed peer review. Generative models have further expanded this existing problem. As previously stated, they can synthesize new visual materials or regenerate an image and alter its local details.
Both fully AI-generated images and AI-modified images may maintain visual coherence with research data and textual claims. There is currently a lack of relevant research on how generated images are judged when used as research evidence in the field of building. There is also a lack of studies that simultaneously compare authentic images, fully AI-generated images, and AI-modified images, and examine perceived authenticity, evidentiary credibility, acceptability as research evidence, and the relationship between judgment confidence and identification accuracy across different types of building research evidence.
This study investigates the above issues through mechanism analysis and a participant judgment experiment. The experiment places the three aforementioned image types in different types of building research evidence contexts. Source identification accuracy, judgment confidence, perceived authenticity, evidentiary credibility, and acceptability as research evidence are used as evaluation metrics. The effects of source disclosure, professional experience in building research, and prior experience using generative AI are also examined. Accordingly, this study proposes the following four research questions:
Q1: Through what mechanisms do fully AI-generated images and AI-modified images weaken the source integrity, traceability, and verifiability of visual evidence?
Q2: With what level of accuracy can participants distinguish authentic images, fully AI-generated images, and AI-modified images? How does this identification performance vary across different types of building research evidence?
Q3: How are participants’ building-related professional experience, prior experience using generative AI, and device conditions during task completion associated with the above judgment performance?
Q4: How do image source and evidence type affect perceived authenticity, evidentiary credibility, acceptability as research evidence, and the calibration relationship between judgment confidence and identification accuracy?
2. Materials and Methods
This work mainly investigates the research questions through a questionnaire-based image judgment experiment. As shown in Figure 1, the study first proposes four research questions based on the research background and gaps, then collects images and uses AI to generate experimental images, conducts expert validation, administers a questionnaire to participants with different levels of building-related professional experience, and analyzes source identification accuracy and the various evidence evaluation metrics.
Figure 1.
Research road map.
2.1. Study Design
This work used a questionnaire survey method to conduct an image judgment experiment with participants and collect their answers to related questions. The experiment included two within-subject factors: image source and building research evidence type. Image source included authentic images, fully AI-generated images, and AI-modified images. Evidence type included structural damage images, construction material microscopic images, and construction site recording images. Participants’ building-related professional experience and prior experience using generative AI were treated as participant-level measured variables. Authentic images referred to images captured by cameras, microscopes, or other imaging devices from actual building objects, material specimens, construction events, or experimental processes, without using generative AI to add, delete or alter visual content related to the research claims. The visual content of fully AI-generated images was entirely synthesized by generative AI and did not correspond to any actual site inspection, material imaging, construction site record, or experimental acquisition process. AI-modified images were based on authentic images, but visual content that affected the research claims was locally added, deleted, replaced or altered using generative AI.
As shown in Table 1, the image evidence types used in the questionnaire survey had three levels: structural damage, construction material microscopic images, and construction site recording images. The evidence for structural damage included structural deterioration, cracking and spalling at beam–column joints, and post-fire structural damage. The stimuli for construction material microscopic images included microscopic images of ordinary Portland cement, fiber-reinforced concrete, aggregate–cement paste interfacial transition zone (ITZ), concrete with freeze–thaw damage, and concrete after high-temperature exposure. Construction site recording images included images of the main structural construction of civil buildings and the construction of deep foundation pits for subway stations. For each evidence type, two independent images were included for each image source, resulting in a total of 18 survey test images: 6 authentic images, 6 fully AI-generated images, and 6 AI-modified images. Survey participants were required to judge the source of each image and whether the image could support its evidence type.
Table 1.
Image evidence types and numbers used in the questionnaire survey.
The questionnaire consisted of a participant background survey, an explanation of image source concepts, and a formal image judgment task. Detailed content is provided in the Supplementary Material. The background survey collected information on participants’ response devices, building-related professional fields, respondent role, years of construction-related experience, highest levels of education, general frequency of using generative AI tools, frequency of using AI to generate images, frequency of using AI to modify images, and age ranges. The questionnaire also included an instructional attention-check item. Building-related professional field, years of relevant experience, and current role were used to characterize participants’ building research or engineering experience. The frequencies of using generative AI models, using AI to generate images, and using AI to modify images were used to characterize participants’ prior experience using generative AI.
Before the formal judgment task began, participants read the operational definitions of the three image sources but were not informed of the correct source of any stimulus image. Participants were also instructed not to search for the images, use reverse image search tools or ask other people. Each image trial included a neutral image identifier, the evidence type, the image itself, and an accompanying research context or research claim. Participants first made a forced choice among authentic images, fully AI-generated images, and AI-modified images. They then reported their judgment confidence using a scale. Afterward, they separately rated the evidentiary credibility of the image when used to support the corresponding research claim and the extent to which they would accept it as evidence in peer-reviewed research based on the current information. All measures used 0–10 scales.
Image source identification results were coded as correct or incorrect according to the ground-truth source labels in the stimulus material register. These results were used to calculate the overall identification accuracy and conditional identification accuracy for different image sources and evidence types. The relationship between judgment confidence and source identification correctness was used to evaluate confidence calibration. Evidentiary credibility and acceptability as research evidence were treated as continuous outcome variables to compare rating differences produced by different image sources and evidence types. Participants’ building-related experience, experience using generative AI, and response devices were treated as participant-level measured variables, and their associations with the above judgments were examined.
2.2. Survey Material Development, Collection, and Validation
The sources, collection, or generation processes, and related information for all image materials in the questionnaire were recorded in the image information register and uploaded to the Supplementary Material for this work. Authentic images were collected from journal articles, professional organization webpages, building project reports, and construction site record webpages with traceable links.
All fully AI-generated images were generated from text prompts using the ChatGPT Images 2.0 model. According to the corresponding evidence type, the generation prompts specified the image subject, damage or construction status, material morphology, photographic or imaging method, lighting conditions, observation scale, and visual features to be avoided. The prompts for structural damage images mainly constrained the locations and severity of cracks, spalling, smoke staining, and thermal damage. The prompts for construction material microscopic images specified microscopic features such as hydration products, pores, fiber–matrix interfaces, ITZ, and microcracks. The prompts for construction site recording images specified the structural system, construction stage, machinery and equipment, temporary facilities, photographic viewpoint, and engineering relationships among components. Fully AI-generated images did not use authentic images as reference inputs. Therefore, no actual acquisition event, material specimen, or construction site directly corresponded to their visual content.
AI-modified images were based on authentic images with source records. ChatGPT Images 2.0 was used to modify local regions related to the research claims. The local modifications included altering the morphology of cracks and spalling at beam–column joints, adjusting fire-damaged surfaces, adding microcracks in ITZ, changing the crack distribution in concrete exposed to high temperatures, modifying unfinished floor slab areas into cast floor slabs, and modifying areas of exposed reinforcement at the tops of foundations into formed concrete column pedestals. The prompts also required the preservation of the camera viewpoint, structural geometric relationships, material textures, lighting, shadows, background, and image dimensions outside the modified content.
Because the visual characteristics of an image can themselves act as source cues, these characteristics were standardized across the image materials before the materials entered expert validation. The characteristics that could not be equalized by construction are stated explicitly below. All images were converted to the sRGB color space in Adobe Photoshop and exported in PNG format, so that no image carried lossy compression artifacts and no image differed from the others in color encoding or in compression history. Nominal resolution was equalized using the Super Resolution function in Adobe Lightroom, so that the three source categories did not differ systematically in pixel dimensions. Within each matched subject-matter set, pixel dimensions and aspect ratios were also brought as close to one another given the three source conditions. In addition, every image was presented in the questionnaire at the same on-screen width, with no file name, file format, file size, or metadata shown. As shown in Table 2, each image judgment was accompanied by a brief research context or research claim. The text mainly described the structural damage, microscopic material features, or construction status observable in the image and did not disclose the ground-truth source of the image to participants. The images were presented in the questionnaire using the neutral identifiers №1–№18.
Table 2.
Example of the information presented to participants for an image judgment in the questionnaire.
Before the formal survey, the image materials used in the survey underwent expert content validation. Three experts with backgrounds in structural engineering, construction materials, and construction management were invited to complete the evaluation independently. Without knowing the predefined source labels, the experts used a four-point scale to evaluate each image in terms of engineering plausibility, consistency between the image and the research claim, clarity of the evidence type, and visual quality, judged whether any non-target cues that could reveal the source were present, and provided an overall judgment on whether the image could be used directly, used after revision, or should be replaced or excluded. Images with obvious engineering contradictions, insufficient image–text correspondence, unrecognizable content, or prominent source cues were to be modified, replaced and revalidated. The formal survey questionnaire included the image materials determined to be suitable for the survey after expert validation. In addition, the experts made a binary judgment on whether the source of each image was credible and traceable. The item-level content validity index (I-CVI) and scale-level content validity index (S-CVI/Ave) were used as quantitative criteria for content validity.
In the evaluation results for the candidate image materials, an I-CVI of 1.00 for an evaluation dimension was considered to indicate that no modification was required [18]. As shown by the validation results in Figure 2, after expert evaluation and screening, 18 images were retained and used in the questionnaire following minor modifications based on the experts’ comments. The S-CVI/Ave values for all candidate image materials were 0.794, 0.810, 0.794, and 0.937 for engineering plausibility, image–text consistency, clarity of evidence type, and visual quality, respectively. All images excluded during expert validation were fully AI-generated candidate images produced during the preparation of the survey materials. For the dimensions of “engineering plausibility” and “clarity of evidence type”, these excluded images received I-CVI values ranging from 0 to 0.333. The damage, material morphology, or construction condition depicted in these images contradict existing engineering knowledge. In contrast, the S-CVI/Ave values for the retained images were 0.907, 0.889, 0.907, and 1.000 for engineering plausibility, image–text consistency, clarity of evidence type, and visual quality, respectively. Polit and Beck [19] recommended S-CVI/Ave ≥ 0.90 as the criterion for the excellent overall content validity of a scale, meaning that, on average, at least 90% of the expert ratings support the material content. Therefore, the overall content validity of the 18 images ultimately retained for the questionnaire was considered acceptable.
Figure 2.
Scale-level content validity index of the validation dimensions for all candidate images and for the images retained after expert screening. The dashed line indicates the S-CVI/Ave threshold of 0.90 for excellent content validity.
2.3. Participants, Procedure, and Data Quality
Participants were recruited through convenience and snowball sampling from 20 to 25 July 2026. A total of 151 complete responses were obtained. Most participants used smartphones to complete the questionnaire, accounting for 75.5%. The background characteristics of the survey participants are shown in Figure 3. Approximately two-thirds of the participants reported having received education, conducted research, or worked in at least one building-related field. Fifty-one participants did not belong to any building-related field, accounting for 33.8%. The most frequently reported field was civil engineering, with 75 participants, followed by structural engineering with 24, architecture with 18, construction or engineering management with 18, construction materials with 11, other building-related fields with 11, building inspection, maintenance, or repair with 4, and structural safety engineering with 4. The sample mainly consisted of currently enrolled students, including 85 undergraduate students, 29 master’s students, and 17 doctoral students, for a total of 131 participants, accounting for 86.8% of the sample.
Figure 3.
Demographic and background characteristics of respondents.
Overall, the participants were proficient users of generative AI. A total of 121 participants used generative AI tools weekly or more frequently, accounting for 80.1% of the sample, while only 5 participants had never used them, accounting for 3.3%. This experience also extended to image-related operations. A total of 135 participants used generative AI to generate images at least once, accounting for 89.4%, among whom 53 used it weekly or more frequently, equivalent to 35.1% of the sample. A total of 124 participants used generative AI to modify images at least once, accounting for 82.1%, among whom 38 used it weekly or more frequently, equivalent to 25.2% of the sample. It can be said that the sample group generally represented people familiar with generative image technologies rather than people encountering these technologies for the first time.
The participants’ experience of completing the survey is shown by the questionnaire structure in Figure 4. They first answered the background questions, which included an instructional attention-check item used to assess response validity, and then read the operational definitions of the three image source categories before any images were presented.
Figure 4.
Questionnaire structure and image evaluation procedure.
In the judgment task, participants viewed the images one at a time in a fixed order grouped by evidence type. The images were presented with the neutral identifiers №1 to №18, and each image was followed by the same four questions. All three ratings used scales from 0 to 10. A score of 0 represented no confidence at all, not credible at all, and completely unacceptable, while a score of 10 represented complete confidence, completely credible, and completely acceptable. All questions were required, and participants were instructed to answer only on the basis of the information presented. There was no feedback or learning between trials, and participants were not informed of the number of images from each source category. Thus, each participant completed 18 source judgments and 54 ratings.
All 151 complete responses passed the attention check. No participant gave the same source judgment for all 18 images, and no participant gave the same score for all 54 ratings. As shown in Figure 5, the distribution of individual scores was bimodal. Most participants answered 4 to 7 of the 18 questions correctly, while 18 participants, accounting for 11.9%, answered 13 or more questions correctly. Under guessing at p = 1/3, the probability that a participant answers 13 or more of 18 questions correctly is 8.5 × 10⁻⁴, so 0.13 such participants would be expected among 151 and 18 were observed. A randomization test that permutes the assignment of the three source categories across the 18 images, holding the composition of the image set and each participant’s own pattern of responses fixed, gave an expected count of 0.08, and the observed count was not reached in any of 200,000 permutations. This level of performance therefore cannot be attributed to guessing.
Figure 5.
Distribution of individual identification accuracy.
After the questionnaire data were collected, all 2718 judgments made by the 151 participants were coded, with a correct judgment recorded as 1 and an incorrect judgment as 0. Because every participant judged all 18 images in the same order, the design was fully crossed and balanced, and differences in identification difficulty between images were held constant across participants.
The design produces two sources of dependence that operate simultaneously. Judgments made by the same participant are correlated, and judgments of the same image made by different participants are also correlated [20]. The primary inferential analyses were therefore conducted using generalized linear mixed-effects models (GLMMs) with a logit link, fitted by maximum likelihood with the Laplace approximation, in which crossed random intercepts for participant and for image model accounted for these two sources of dependence at the same time [21]. The three levels of image source were authentic, fully AI-generated, and AI-modified, and the three levels of evidence type were structural damage, construction material microstructure, and construction site record. Both factors were entered as fixed effects using sum-to-zero contrasts. The primary model is given by Equation (1):
where πij is the probability that participant i judges the source of image j correctly, s(j) and e(j) denote the image source and the evidence type of image j, respectively, β0 is the intercept, α and τ are the main effects of image source and of evidence type, respectively, ατ is their interaction, and ui and vj are the random intercepts for participant and for image, each normally distributed with mean zero and mutually independent. The sum-to-zero constraints on α, τ, and ατ make β0 the mean log-odds of a correct judgment across the nine design cells and make each main effect an average over the levels of the other factor. In the notation of the R package lme4 [22], Equation (1) is correct ~ source * evidence + (1 | participant) + (1 | image).
logit(πij) = β0 + αs(j) + τe(j) + (ατ)s(j)e(j) + ui + vj
Fixed effects were tested by likelihood-ratio tests against nested models. The random-effect structure was evaluated by comparing Equation (1) with models that omitted either random intercept, with the boundary nature of the null hypothesis considered.
All analyses were carried out in RStudio 2026.05.0 Build 218 with R version 4.5.2. The figures were prepared in OriginPro 2026b. The analysis code is available from the corresponding author on request.
Because both experimental factors varied within participants, the maximal random-effect structure justified by the design was also fitted as a robustness check, as given by Equation (2):
where u0i is the by-participant random intercept and ui,s(j) are by-participant random slopes for image source, the vector of by-participant random effects following a multivariate normal distribution with mean zero and an unstructured covariance matrix. Intraclass correlation coefficients (ICCs) were computed on the latent logistic scale using a residual variance of π2/3 [23].The secondary binary analysis, in which fully AI-generated and AI-modified images were pooled into a single AI-produced category, was carried out in two ways. This analysis was introduced to facilitate direct comparison with previous studies that generally used an authentic-versus-AI binary classification, and because both fully AI-generated images and AI-modified images involved generative AI intervention. First, individual sensitivity d′ and response bias c were computed for each participant with a log-linear correction and analyzed at the participant level, as reported below. Second, the same task was analyzed with a mixed-effects signal-detection model [24], a probit GLMM given by Equation (3):
where rij equals 1 if participant i judges image j to be AI-produced, aj equals 1 if image j is AI-produced, Φ is the standard normal distribution function, w0i and w1i are the by-participant random intercept and random slope, and zj is the random intercept for image. In the same notation, Equation (3) is said_AI ~ is_AI + (1 + is_AI | participant) + (1 | image) with a probit link. Sensitivity and the response criterion follow from the fixed-effect coefficients as given by Equation (4):
so that γ1 estimates d′ for a typical participant judging a typical image. Under an equal-variance Gaussian model, sensitivity is related to the area under the receiver operating characteristic (ROC) curve (AUC) by AUC = Φ(d′/√2), so effect sizes are reported on both scales. The two analyses answer different generalization questions. The participant-level analysis describes how the result would generalize to new participants judging these images, whereas the mixed-effects analysis additionally treats the images as a sample and describes how far the result generalizes to new images of the same kinds.
logit(πij) = β0 + αs(j) + τe(j) + (ατ)s(j)e(j) + u0i + ui,s(j) + vj
Pr(rij = 1) = Φ(γ0 + γ1 aj + w0i + w1i aj + zj)
d′ = γ1, c = −(γ0 + γ1/2)
The aggregate analyses were retained as descriptive summaries and as robustness checks on the distributional shape of the data. Identification accuracy was compared with the one-in-three chance level of the three-alternative forced-choice task using a one-sample t-test and a Wilcoxon signed-rank test. The effects of image source and evidence type were also examined using a Friedman test and a 3 × 3 two-way repeated-measures analysis of variance on the 9 sources by evidence-type accuracy values. Differences between participant groups defined by response device and by professional field were examined using Kruskal–Wallis and Mann–Whitney U tests, with Holm adjustment where multiple comparisons were made. Because response device, building-related professional background and experience using generative AI were measured rather than assigned, these variables were also entered together into Equation (1) as participant-level fixed effects.
In addition, a sensitivity power analysis based on the noncentral t distribution for a one-sample t-test with a two-tailed α of 0.05 identified the smallest effect detectable with a power of 0.80, expressed in both d′ and AUC units [20,21]. Because the individual d′ values were skewed, a bootstrap simulation confirmed this value at a simulated power of 0.82. Two one-sided tests (TOSTs) examined whether the observed effect was statistically smaller than the smallest effect size of interest [22,23]. This bound was set at an AUC of 0.60 for discrimination, corresponding to d′ = 0.358 and to a balanced accuracy of 60%, and at |c| = 0.20 for response bias. An AUC of 0.60 lies below the value of 0.70 from which discrimination is conventionally considered acceptable [24] and below the accuracies reported for earlier generative models in other previous studies [12,14], so an ability smaller than it cannot support visual inspection as a practical safeguard. Equivalence was concluded when the 90% confidence interval fell entirely within the bounds. These bounds and the equivalence criterion apply to the participant-level analysis. The corresponding tests based on Equation (3), which additionally treats the images as a sample, are reported alongside them in Section 3.
3. Results and Analysis
Among the 2718 source judgments made by 151 participants, 1004 judgments were correct. The overall identification accuracy was 36.9%, with a 95% confidence interval (CI) of 35.1% to 38.8%. The mean individual identification accuracy was 0.369, with a standard deviation of 0.192. The mean individual identification accuracy was only 3.6% higher than the one-third chance level of a three-alternative forced-choice task. A one-sample t-test showed that this difference was significant (t(150) = 2.31, p = 0.022, Cohen’s d = 0.19). However, the Wilcoxon signed-rank test did not support this conclusion (W = 2972.0, p = 0.190, r = 0.12). In combination with the score distribution shown in Section 2.3, the difference between the two tests resulted from the shape of the distribution. The median participant correctly identified exactly 6 of the 18 images, which was the chance level. A total of 96 participants, accounting for 63.6%, performed at or below the chance level. The mean was slightly higher than the chance level because it was raised by a small number of high-scoring participants. Therefore, for the typical participant, image source identification did not perform better than guessing.
Both tests were conducted on participant-level accuracy and therefore treated the 18 images as a fixed set. When the same question was addressed with a reduced form of Equation (1) that retained only the intercept and the two crossed random intercepts, the estimated mean log-odds of a correct judgment was −0.649, with a standard error of 0.195. This corresponds to a probability of 0.343 for a typical participant judging a typical image, with a 95% confidence interval from 0.263 to 0.433 that contains the one-in-three chance level. The difference from chance was not significant (z = 0.23, p = 0.821). The population-averaged probability implied by the model, 0.362, was close to the observed value of 0.369. The disagreement between the t-test and the Wilcoxon signed-rank test is therefore resolved once the images are treated as a sample rather than as a fixed set. The small mean advantage over chance is not distinguishable from the variation contributed by the images used, and the conclusion drawn from the median participant is supported.
After the image judgment task collapsed into a binary judgment between authentic images and AI-produced images, the results of the signal-detection analysis are as shown in Figure 6. Figure 6a shows performance in ROC space. Each circle represents one or more participants, and its area is proportional to the number of participants at that position. The diamond represents the group mean, and the diagonal dashed line represents chance performance with no discriminative ability. Figure 6b shows the distribution of individual sensitivity, and Figure 6c shows the distribution of individual response bias. The dashed line is located at zero, and the diamond represents the mean and its 95% CI. Sensitivity and response bias were calculated using a log-linear correction. The analysis showed that the hit rate for AI-produced images was 52.2%, while 48.2% of authentic images were misjudged as AI-produced images. The mean sensitivity of the participants was d′ = 0.113, with a 95% CI from −0.043 to 0.268. The difference from zero was not statistically significant (t(150) = 1.43, p = 0.153). The mean response bias was c = −0.001, with a 95% CI from −0.099 to 0.097, and it also did not differ significantly from zero (t(150) = −0.02, p = 0.984). Among all judgments, 49.2% of responses selected “authentic images”. Because neither index differed significantly from zero, the sensitivity power analysis and the equivalence tests were used to determine whether this pattern reflects the absence of a practically relevant effect or a design that was unable to detect one.
Figure 6.
Results of the signal-detection analysis for the binary judgment task.
With 151 participants and a two-tailed α of 0.05, this work could detect a mean sensitivity of d′ = 0.222, corresponding to an AUC of 0.562, with a power of 0.80, and its power to detect discrimination at the smallest effect size of interest was 0.995. The non-significant result is therefore not attributable to the size of the sample. The equivalence tests agreed. The mean sensitivity was statistically equivalent to zero within bounds of ±0.358, TOST t(150) = −3.12, p = 0.001, and on the AUC scale, the mean per-participant AUC of 0.520 was equivalent to chance against bounds of both 0.60 and 0.55, with p < 0.001 and p = 0.015, respectively. The response bias was likewise equivalent to zero within bounds of ±0.20, p < 0.001.
Table 3 summarizes these results. Within the images set here, the average ability to discriminate between AI-produced and authentic images was therefore not merely undetected but statistically smaller than the smallest difference of practical relevance. A small residual ability was not excluded. The upper limit of the 90% confidence interval of d′, 0.243, corresponds to an AUC of 0.568 and to a balanced accuracy of about 57%, and detecting an effect of the size observed in participants judging these images would require approximately 578 participants. Such an ability would still fall far below the level at which visual judgment could verify the source of image evidence.
Table 3.
Sensitivity power analysis and equivalence tests for the non-significant results of the signal-detection analysis.
To examine how far the result generalizes to new images of the same kinds, the binary task was reanalyzed with the mixed-effects signal-detection model of Equation (3).
The estimate of sensitivity was stable across random-effect structures. With by-participant random intercepts and slopes only, which corresponds to the participant-level analysis reported above, the estimate was d′ = 0.111, SE = 0.084, 95% CI −0.054 to 0.276, p = 0.188, reproducing the participant-level estimate of 0.113. Adding a random intercept for image gave d′ = 0.120, SE = 0.226, 95% CI −0.322 to 0.562, p = 0.595, corresponding to an AUC of 0.534. The response criterion remained indistinguishable from zero, c = −0.000, SE = 0.118, 95% CI −0.232 to 0.231, p = 0.998. Both the point estimate of discriminability and the conclusion that it does not differ from zero are therefore unaffected by whether the images are treated as fixed or as a sample. The variance components of the maximal model show why the images cannot be ignored. Sensitivity varied substantially between participants, with a by-participant slope variance of 0.780, and the images themselves contributed a random-intercept variance of 0.170.
The width of the interval was affected. The standard error of d′ increased by a factor of about 2.7 when the image random intercept was added, because the contrast between AI-produced and authentic images was carried between images, and the study contained only 6 authentic and 12 AI-produced images. Decomposing the sampling variance of d′ in the maximal model confirmed this. Of a total of 0.051, variation between images contributed 0.043 and variation between participants contributed 0.005. For this particular comparison, the effective number of independent units is therefore the number of images rather than the number of participants, even though 151 participants took part.
This has a direct consequence for the equivalence tests. Under the participant-level analysis, the mean sensitivity was statistically equivalent to zero within the bound of ±0.358. Under the mixed-effects model, it was not equivalent to zero, TOST p = 0.145, with a 90% confidence interval from −0.251 to 0.491. The two results are not in conflict, because they answer different questions. For the 18 images used here, the mean discriminability is smaller than the smallest difference of practical relevance. Whether the same holds for building research images of these kinds in general cannot be established from 18 images. With the variance components estimated here, approximately 17 authentic and 34 AI-produced images (51 in total) would be required for the equivalence test to reach significance against the same bound. The finding that generalizes across both participants and images is the absence of any detectable discrimination.
The same pattern held when sensitivity was estimated separately for each evidence type in the same model. The estimate was d′ = −0.082 for structural damage images, 0.311 for construction material microscopic images, and 0.130 for construction site recording images, with a standard error of 0.321 in each case. None differed significantly from zero, and none was equivalent to zero against the ±0.358 bound. Participants therefore did not show discrimination for any evidence type, and with two images per source and evidence-type combination, the data do not have the resolution to establish that discrimination is practically negligible for any evidence type individually.
3.1. Effects of Image Source and Evidence Type
Figure 7 presents statistics on participants’ judgments of the three image source categories. Each row of the matrix represents the ground-truth source of the images, while each column represents the source category selected by the survey participants. Using participants’ accuracy for the three source categories as paired data, the Friedman test showed that image source had a significant effect on identification accuracy, χ2(2) = 61.53, p < 0.001, Kendall’s W = 0.20. The identification accuracies for authentic images, AI-modified images, and fully AI-generated images were 51.8%, 35.3%, and 23.7%, respectively.
Figure 7.
Confusion matrix of the source judgments.
A comparison of the proportions of images from the three source categories that were judged to be authentic shows that 55.1% of fully AI-generated images were judged to be authentic. This proportion was higher than but close to the proportion of authentic images that were judged correctly. That is, for this sample, the realism presented by images synthesized in their entirety using generative AI was close to that of authentic images. The proportion of AI-modified images judged to be authentic was 40.6%, which was significantly lower than the proportions of fully AI-generated images and authentic images judged to be authentic.
Figure 8 cross-classifies image source identification accuracy by evidence type and registered source. The identification accuracy of the nine combinations ranged from 15.2% to 55.3%. The combination with the highest overall participant identification accuracy in the matrix, at 55.3%, was building macroscopic structural damage images in the authentic images source category. The combination with the lowest overall participant identification accuracy, at 15.2%, was building macroscopic structural damage images in the fully AI-generated images source category. This indicates that even when images belong to the same macroscopic structural damage evidence type, different image-source conditions may substantially affect identification performance.
Figure 8.
Identification accuracy for each combination of evidence type and image source.
In the matrix, the mean identification accuracy for authentic images across the three evidence types was 51.8%, which was significantly higher than the mean identification accuracy of 23.7% for fully AI-generated images and 35.3% for AI-modified images. Overall, participants found it easier to correctly identify authentic images, while their ability to identify the sources of fully AI-generated images and AI-modified images was more limited than their ability to identify authentic images.
Among authentic images, structural damage images had the highest overall participant identification accuracy. The overall participant identification accuracies for construction material microscopic images and construction site recording images in the authentic images category were 46.4% and 53.6%, respectively, which were relatively close to the highest value. Overall, evidence in the construction material microscopic images category with authentic images as the evidence source was more difficult for participants to judge correctly.
In the fully AI-generated images source category, construction material microscopic images had the highest overall participant identification accuracy, at 36.4%. This was significantly higher than the accuracy of 15.2% for structural damage images and 19.5% for construction site recording images. Based on the distribution of accuracy, among images with fully AI-generated images as the evidence source, construction material microscopic images were relatively easier to identify correctly, while structural damage images and construction site recording images were more difficult to identify.
In the AI-modified images source category, the image evidence type with the highest overall participant identification accuracy was building macroscopic structural damage images, at 38.4%, which was close to the levels for the other two image sources. The overall participant identification accuracies for construction material microscopic images and construction site recording images in this image source category were 35.4% and 32.1%, respectively. This indicates that the difficulty in source identification caused by local modification using AI was present across all three types of building research evidence.
It can also be observed that the differences in accuracy across the columns of the matrix were much greater than those across the rows. The two-way repeated-measures analysis of variance using participants’ accuracy across the nine combinations as paired data showed a significant main effect of image source, F(2, 300) = 49.47, p < 0.001, a non-significant main effect of evidence type, F(2, 300) = 2.69, p = 0.070, and a significant interaction, F(4, 600) = 10.52, p < 0.001, partial η2 = 0.066.
The same effects were tested using Equation (1), which models the dependence between judgments made by the same participant and between judgments of the same image at the same time. The results are given in Table 4. Removing the random intercept for image increased the deviance by 20.91 on 1 degree of freedom (p < 0.001), and removing the random intercept for participant increased it by 155.42 on 1 degree of freedom (p < 0.001). The pooled model without random effects had a deviance of 3375.64 against 3204.24 for the full model. Variation between participants was the larger of the two components, with a variance of 0.673 on the logit scale, a standard deviation of 0.820, and an ICC of 0.167. The variance remaining between images after the design factors were included was 0.078, with a standard deviation of 0.279 and an ICC of 0.019. The two design factors thus account for most of the between-image variation.
Table 4.
Generalized linear mixed-effects model of source identification accuracy, as specified by Equation (1).
Under this model, image source affected identification accuracy (χ2(2) = 17.26, p < 0.001), but evidence type did not (χ2(2) = 1.17, p = 0.557), and the interaction between the two factors was significant (χ2(4) = 11.97, p = 0.018). The direction of all three conclusions is the same as in the analysis of variance, but the evidence for the interaction is weaker once the variation between images is modelled. This is expected, because each combination of image source and evidence type is represented by only two images. The same three conclusions were obtained under the maximal random-effect structure of Equation (2). In that model, the effect of image source remained significant at p < 0.001, evidence type remained non-significant (χ2(2) = 1.38, p = 0.502), and the interaction remained significant (χ2(4) = 12.99, p = 0.011). Sensitivity to image source also varied considerably between participants, with by-participant slope variances of 1.292 and 0.474 for the two source contrasts, respectively.
Table 5 compares the probabilities estimated by the model for a typical participant judging a typical image with the observed accuracies. The model reproduces the observed pattern, and the confidence intervals show the precision that is available for each cell once both participants and images are treated as samples. The intervals are considerably wider than the observed proportions alone would suggest.
Table 5.
Model-estimated probability of a correct source judgment for a typical participant judging a typical image, with observed accuracies for comparison.
When comparing the effect of evidence type on participants’ mean identification accuracy, construction material microscopic images had the highest mean accuracy, at 39.4%. However, this value was close to the mean identification accuracies for the other two evidence types, which were 36.3% for structural damage images and 35.1% for construction site recording images. This distribution also supports the above finding that evidence type itself had a relatively limited effect on overall identification accuracy. Its effect was mainly reflected in the identification difficulty of different image sources.
For structural damage images, the identification accuracies for authentic images, AI-modified images, and fully AI-generated images were 55.3%, 38.4%, and 15.2%, respectively. The overall difference among the three sources was statistically significant (Friedman χ2(2) = 77.30, Holm-adjusted p < 0.001, Kendall’s W = 0.256). The descriptive difference between authentic images and fully AI-generated images was 40.1%, representing the most pronounced source difference among the nine combinations. Among structural damage images, authentic images were the easiest source category to identify, while fully AI-generated images were the most difficult.
Construction site recording images showed a similar but smaller source difference. The identification accuracy was 53.6% for authentic images, 32.1% for AI-modified images, and 19.5% for fully AI-generated images. The overall difference among the three sources was significant (Friedman χ2(2) = 62.24, Holm-adjusted p < 0.001, Kendall’s W = 0.206). Consistent with the structural damage image group, identification accuracy was highest for construction site recording images in the authentic-image source category and lowest for those in the fully AI-generated-image source category.
Construction material microscopic images showed a different pattern. The identification accuracies for authentic images, fully AI-generated images, and AI-modified images were 46.4%, 36.4%, and 35.4%, respectively. The overall difference among the three sources was not statistically significant (Friedman χ2(2) = 1.77, Holm-adjusted p = 0.413, Kendall’s W = 0.006). The difference between authentic images and fully AI-generated images was 9.9%, the difference between authentic images and AI-modified images was 10.9%, and the difference between the two types of AI images was only 1.0%. Compared with the other two evidence types, the differences associated with image source were clearly smaller for construction material microscopic images. This indicates that more participants did not show source discrimination ability that could be confirmed by statistical testing.
Overall, the differences in overall participant identification accuracy among image sources were more evident for structural damage images and construction site recording images, but were markedly smaller for construction material microscopic images. The identification accuracy for authentic images exceeded 50% for both structural damage images and construction site recording images, but decreased to 46.4% for construction material microscopic images in the authentic images source category. Thus, the difficulty of source identification was not consistent across different evidence types.
Figure 9 shows the overall participant identification accuracy for each image in the survey. Among the 18 images, Image №2 had the lowest overall participant identification accuracy, at 12.6%, while Image №14 had the highest, at 69.5%, resulting in a range of 57.0%. This reflects clear differences in identification difficulty among the images. Among all images, only two had identification accuracy above 50%, while another eight were below the chance level of 33.3%. The distribution indicates that participants did not form stable and accurate source judgments for most images. Although image source and evidence type could explain some differences at the category level, the visual content, composition, technical characteristics, and modification locations of specific images could still affect judgments. The 95% CIs of four images were entirely below the chance level: Images №2, №16, №5, and №15, with identification accuracies of 12.6%, 17.2%, 17.9%, and 21.9%, respectively. All four were fully AI-generated images, and all belonged to macroscopic building research evidence. Images №2 and №5 were structural damage images, while Images №16 and №15 were construction site recording images. The CIs for the overall participant identification accuracy of these images did not include the chance level, indicating that participants’ judgments as a whole deviated significantly from the correct source. That is, when most participants in this study encountered these fully AI-generated macroscopic images, they not only had difficulty making accurate judgments but were also more likely to classify them into other source categories.
Figure 9.
Identification accuracy for each of the 18 images.
Image №2 was the most prominent case of the above phenomenon. This image belonged to the fully AI-generated images category and showed damage to a reinforced concrete beam–column joint, with narrow diagonal cracks near the joint and small areas of concrete surface spalling. Among the 151 participants, only 19 correctly assigned it to the fully AI-generated images category, while 113 assigned it to the authentic images category. Thus, most participants consistently misidentified it as an authentic image. The cracks and local spalling shown in the image are common visual content in structural inspection and damage records and did not depend on a rare, exaggerated, or clearly inconsistent engineering scenario. It can therefore be inferred that when advanced generative AI models generate images using common engineering objects, plausible damage locations, and relatively restrained forms of defect presentation, their visual content may align with participants’ existing experience of engineering images and thereby achieve high apparent authenticity. At least in this experimental context, visual observation alone was insufficient to reliably rule out fully AI-generated images of this kind.
Corresponding to the above images with low identification accuracy, six images had 95% CIs entirely above the chance level: Images №7, №3, №1, №8, №6, and №14. Their overall participant identification accuracies were 43.1%, 45.0%, 47.0%, 49.7%, 63.6%, and 69.5%, respectively. Five of these images belonged to the authentic images category, while only Image №3 belonged to the AI-modified images category. None of the fully AI-generated images had a 95% CI entirely above the chance level. This distribution further confirms that, among the stimulus materials in this study, images that participants could identify above the chance level were mainly concentrated in the authentic images category. For fully AI-generated images, participants did not show identification results with CIs entirely above the chance level for any individual stimulus.
Considering the distribution of accuracy across all images, authentic images were more frequently located at the high-accuracy end of the ranking, fully AI-generated images were more concentrated at the low-accuracy end, and AI-modified images were mainly located between them. Among fully AI-generated images, Image №12 had the highest overall participant identification accuracy, at 39.1%, which was higher than the 37.7% accuracy of Image №13, the authentic image with the lowest overall participant identification accuracy. This means that some fully AI-generated images may be easier to classify correctly than some authentic images, while some authentic images may also present relatively high source ambiguity.
A side-by-side comparison of images from the three sources within the same subject matter shows that differences in overall participant identification accuracy among image sources still depended on the specific subject matter and its visual presentation. For oblique aerial images of an open-cut foundation pit at a subway station, Image №14 from the authentic images category had an identification accuracy of 69.5%, Image №17 from the AI-modified images category had an accuracy of 31.8%, and Image №16 from the fully AI-generated images category had an accuracy of only 17.2%. The range within the same subject matter reached 52.3%. The fire-damage subject matter showed a similar ranking. Image №6 from the authentic images category had an accuracy of 63.6%, Image №4 from the AI-modified images category had an accuracy of 31.8%, and Image №5 from the fully AI-generated images category had an accuracy of 17.9%, with a difference of 45.7% among the three. The source difference was relatively smaller for the civil building construction site subject matter. Image №13 from the authentic images category had an accuracy of 37.7%, Image №18 from the AI-modified images category had an accuracy of 32.5%, and Image №15 from the fully AI-generated images category had an accuracy of 21.9%, resulting in a range of 15.9%.
Because each combination of image source and evidence type was represented by two images, the effect of image source was also examined with the image as the unit of observation. The mean accuracies of the 18 images grouped by source were 51.8% for authentic images, 35.3% for AI-modified images, and 23.7% for fully AI-generated images, and the difference between the three sources remained significant when each image contributed one observation, F(2, 15) = 12.32, p = 0.001, with a Kruskal–Wallis test giving H = 10.33 (p = 0.006). The 18 images were then divided into two subsets of nine, each containing one image from every combination of source and evidence type, and the effect of image source was significant in both subsets, Friedman χ2(2) = 29.95 and 58.03 (both p < 0.001). Image source accounted for 62.2% of the variance in accuracy between images, evidence type accounted for 1.5%, and the remaining 36.3% was specific to individual images.
3.2. Effects of Response Device, Professional Field, and AI Experience on Identification Accuracy
Because participant backgrounds and response settings may also be related to the results, this section examined how identification accuracy was associated with participants’ response devices, professional fields, and experience using generative AI. As shown in Figure 10a, 114 participants used smartphones to complete the questionnaire, 25 used laptop computers, 10 used desktop computers, and 2 used tablet computers. The tablet computer group was excluded from the test because it contained too few participants. The Kruskal–Wallis test showed a significant difference in image identification accuracy among the three main device groups (H(2) = 11.05, p = 0.004, ε2 = 0.075). The overall identification accuracy of participants using smartphones, laptop computers, tablet computers, and desktop computers were 33.9%, 40.9%, 55.6%, and 58.3%, respectively. The same ordering was obtained when response device was added to Equation (1) as a participant-level fixed effect (χ2(2) = 17.12, p < 0.001). Relative to the smartphone group, the odds of a correct judgment were 1.43 times higher for the laptop computer group (p = 0.078) and 3.42 times higher for the desktop computer group (p < 0.001). The tablet computer group was excluded from this model because it contained only two participants.
Figure 10.
Identification accuracy by response device: (a) overall accuracy; (b) accuracy by response device and evidence type.
In the descriptive results, identification accuracy gradually increased from the smartphone group to the laptop computer group and the desktop computer group. The accuracy of the smartphone group was close to the chance level of 33.3% under the three-alternative forced-choice condition, while the desktop computer group had the highest accuracy. One possible explanation for this result is related to visual presentation conditions. When the image display area is larger, participants may find it easier to inspect local image details and judge their coherence within the image. For example, on a smartphone, an image may need to be displayed within a smaller viewing window. If participants do not actively enlarge the image, some details may not be fully observed.
As shown in Figure 10b, judgment accuracy for the three image evidence types was compared across different devices. Among the three image evidence types, construction material microscopic images had the highest participant judgment accuracy on all device platforms. The overall identification accuracies for construction material microscopic images among participants using smartphones, laptop computers, and desktop computers were 36.3%, 44.0%, and 61.7%, respectively. Structural damage evidence images ranked second, with overall participant judgment accuracies of 33.3%, 40.0%, and 56.7% for smartphones, laptop computers, and desktop computers, respectively. Construction site recording images had the lowest participant judgment accuracy on all device platforms, with overall accuracies of 32.0%, 38.7%, and 56.7% for smartphones, laptop computers, and desktop computers, respectively.
When devices were compared within the same evidence type, overall participant identification accuracy for all image evidence types showed a gradual increase from the smartphone group to the laptop computer group and the desktop computer group. Compared with the smartphone group, the laptop computer group had accuracy rates that were 6.7%, 7.7%, and 6.7% higher for structural damage images, construction material microscopic images, and construction site recording images, respectively. The corresponding accuracy rates of the desktop computer group were 23.4%, 25.4%, and 24.7% higher. The consistent ranking of accuracy across the three evidence types and the similar between-group differences indicate that the association between response device and participant identification accuracy showed the same pattern across evidence types.
Figure 11 shows the overall identification accuracy in the questionnaire survey for participants with different professional backgrounds. Because professional field was a multiple-selection item, the categories were not mutually exclusive. Each of the seven fields with at least 10 participants was compared with the remaining participants using a Mann–Whitney U test, and the seven p-values were Holm-adjusted. Building inspection, maintenance, or repair and structural safety engineering each included only four participants and were reported descriptively. The accuracy rates for construction or engineering management, structural engineering, construction materials, architecture, civil engineering, and other building-related fields were 48.8%, 47.9%, 47.5%, 46.6%, 41.1%, and 36.4%, respectively, while the accuracy rate for participants without a building-related background was 31.7%. The descriptive accuracy rates for the building inspection, maintenance, or repair group and the structural safety engineering group were 27.8% and 26.4%, respectively. All building-related fields with at least 10 participants had higher accuracy than the group without the building-related background. The same difference was obtained when building-related background was added to Equation (1) as a participant-level fixed effect. Participants who reported at least one building-related field had higher odds of a correct judgment than those who reported none (odds ratio of 1.49, χ2(1) = 5.61, p = 0.018), corresponding to observed accuracies of 39.6% and 31.7%.
Figure 11.
Identification accuracy by construction-related professional field (fields with n < 10 are reported descriptively).
Figure 12 compares the identification accuracy of participants with different types of professional backgrounds across the three evidence types. Participants without the building-related background had identification accuracies of 31.4%, 33.0%, and 30.7% for building structural damage evidence images, construction material microscopic images, and construction site record evidence images, respectively. These values were the lowest among all participant background types. The rankings in Figure 11 and Figure 12 indicate that a building-related professional background was associated with higher accuracy for all three types of evidence images in this study. However, none of the seven Friedman tests shown in the figure reached statistical significance after Holm adjustment, indicating that professional background did not make any one evidence type consistently easier to identify.
Figure 12.
Identification accuracy by professional field and evidence type.
To test whether experience in a particular professional field provided participants with an additional advantage when judging images of a specific evidence type, Figure 13 compares identification performance across the three evidence types between participants in each professional field and the remaining participants who did not select that field. Each point in the figure represents a combination of one participant professional field and one evidence type. The horizontal coordinate of each point is the accuracy of participants in that field for the six images of that evidence type minus the accuracy of the remaining participants for the same evidence type. A positive value indicates that participants with experience in that field had higher identification accuracy for image materials of the specific evidence type than the remaining participants.
Figure 13.
Difference in identification accuracy between each professional field and the remaining participants across evidence types.
Figure 13 shows that participants with experience in construction management, structural engineering, construction materials, architecture, and civil engineering had positive accuracy differences from the remaining participants for all three evidence types. For participants in all five fields, the judgment advantage for construction site record evidence images was the smallest among the three evidence types. The figure also shows that the accuracy difference associated with the building-related background was not equal across the three evidence types. Its magnitude mainly varied with evidence type and was not strongly related to the participants’ own areas of expertise. This is consistent with the analyses in Figure 11 and Figure 12, in which a building-related background was associated with slightly higher image source identification accuracy. However, the nonsignificant statistical test results may also be related to the limitation of the small number of participants in each field group.
When designing the questionnaire, another question was considered: If familiarity with generative technologies could itself be transformed into identification ability, would the difficulty of judging image sources decrease on its own as these tools became more widely used? The questionnaire recorded three types of use experience: frequency of using generative AI tools, frequency of using AI to generate images, and frequency of using AI to modify images. As shown in Figure 14, the curves for the overall identification accuracy of evidence image sources did not increase monotonically with use frequency in the analyses of the three types of AI use experience. Instead, they first increased and then decreased. In addition, across all three types of participant AI use experience, the identification accuracy for authentic images was consistently the highest, and its changes with use frequency were relatively smaller than those of the other two image source categories.
Figure 14.
Identification accuracy on each image source by frequency of experience with generative artificial intelligence: (a) frequency of generative AI tool use; (b) frequency of AI image generation; (c) frequency of AI image modification.
In Figure 14a, participants in the “Weekly” category for generative AI tool use had the highest overall accuracy in judging evidence image sources, at 42.7%. The image source categories showing large changes in identification accuracy with use frequency were fully AI-generated images and AI-modified images. The accuracy for fully AI-generated images increased from 16.7% in the “Never” category and 10.0% in the “<Monthly” category to 29.8% in the “Weekly” category. The accuracy for AI-modified images increased from 23.3% and 10.0%, respectively, to 43.3% in the “Weekly” category. It can be inferred that the accumulation of participants’ experience using generative AI tools improved their identification of AI images.
In Figure 14b, participants in the “Weekly” category for using generative AI to generate images had the highest overall accuracy in judging evidence image sources, at 40.2%. For fully AI-generated images, the highest identification accuracy occurred among participants in the “Almost daily” category for using generative AI to generate images, at 31.5%.
In Figure 14c, participants in the “Almost daily” category for using generative AI to modify images had the highest overall accuracy in judging evidence image sources, at 40.5%. For AI-modified images, the highest identification accuracy occurred among participants in the “Monthly” category for using AI to modify images, at 43.8%.
This sample did not consist of people encountering generative technologies for the first time. A total of 121 participants, accounting for 80.1%, used generative AI tools weekly or more frequently, while only 5 had never used them. A total of 135 participants, accounting for 89.4%, had used AI to generate images at least once, and 124 participants, accounting for 82.1%, had used AI to modify images at least once. Based on the overall patterns shown in Figure 14, the difficulty of judging image sources does not decrease on its own as generative tools become more widespread. This may be because, with the development of generative AI, generated images are becoming increasingly realistic and more consistent with professional knowledge, while errors may appear only in details that are easily overlooked. This study also found the interesting situation that participants who used generative AI several times a day had a lower mean accuracy than participants whose use frequency was slightly lower. The reasons underlying this phenomenon should be further investigated in future research.
Figure 15 presents the proportions of images from the three image source categories that were judged to have an authentic source, grouped by participants’ experience using generative AI. In all six groups, the proportion of fully AI-generated images judged to have an authentic source was no lower than the proportion of authentic images in the same group. In all six groups, the proportion of AI-modified images judged to have an authentic source was lower than the proportion of authentic images in the same group. It can therefore be inferred that photographs synthesized entirely by AI are already close to being photorealistic, whereas AI-modified images may retain traces that are inconsistent with the rest of the original image, causing participants to become suspicious instead.
Figure 15.
Proportion of authentic, fully AI-generated, and AI-modified images judged authentic by self-reported frequency of generative AI use.
3.3. Confidence, Credibility, and Acceptability of Misjudged Visual Evidence
To examine whether participants’ subjective perceptions of their image source judgments could reflect their actual identification accuracy, a comparative analysis was conducted between the judgment results and the three 0–10 scale ratings provided for each image in the questionnaire: judgment confidence, evidentiary credibility, and acceptability as research evidence.
Figure 16 presents the relationship between judgment confidence and judgment correctness. Figure 16a compares each participant’s mean judgment confidence when their judgments were correct and when their judgments were incorrect. Figure 16b compares each participant’s mean judgment confidence for incorrect judgments with their mean judgment confidence for correct judgments. Figure 16c plots the observed identification accuracy of the judgments given at each level of stated confidence against that level. The mean judgment confidence of all participants, computed as the mean of the 151 participant means so that it matches the construction of Figure 16a,b, was 7.37 when their judgments were correct and 7.36 when their judgments were incorrect. The corresponding means over judgments are 7.55 and 7.30, respectively. The difference of 0.019 points (95% CI: −0.091 to 0.128) is statistically equivalent to zero against a bound of 0.25 points on the rating scale, with two one-sided tests yielding p < 0.001, so participants were as confident when they were wrong as when they were right.
Figure 16.
Judgment confidence and judgment accuracy. (a) Mean confidence for correct and for incorrect judgments. (b) Mean confidence when incorrect against mean confidence when correct, with one point per participant and the dashed identity line. (c) Observed identification accuracy against stated confidence.
The calibration curve of Figure 16c shows that this holds across the whole range of the scale. Observed accuracy was 36.8% among the judgments given at a confidence of 4 or below, 31.9% at 5, 38.3% at 6, 33.4% at 7, 32.8% at 8, 45.7% at 9, and 41.9% at 10, so that it never departed far from the chance level of 33.3% while the stated confidence rose from 30% to 100%. Taking the stated confidence divided by ten as the participant’s subjective probability of being correct, the Brier score was 0.395, which decomposes into a reliability of 0.164, a resolution of 0.002, and an uncertainty of 0.233. The resolution term is 1.1% of the uncertainty, so stated confidence carried almost no information about whether a judgment was correct; the reliability term is large because a mean stated confidence of 73.9% stood against an observed accuracy of 36.9%, indicating an overconfidence of 37.0%. At the level of individual judgments, the point-biserial correlation between confidence and correctness was 0.062 (p = 0.001); when computed within participants and then averaged, it was 0.013, with a standard error of 0.024, t(127) = 0.54, p = 0.593. The small association at the level of judgments therefore arises between participants.
Figure 17 divides the judgments into three categories: AI images misjudged as authentic images, AI images correctly identified as AI images, and authentic images correctly identified. In the first two groups, fully AI-generated images and AI-modified images were combined for calculation. In addition, an AI image is counted as correctly identified when it was assigned to either of the two AI categories rather than to the exact category of its source. The three groups contained 867, 945, and 469 judgments, and the values plotted are means over judgments. When AI images were correctly identified as AI images, evidentiary credibility decreased to 6.11, and acceptability as research evidence decreased to 6.08. When these two types of AI images were misjudged as authentic images, evidentiary credibility was 7.41, and acceptability as research evidence was 7.38. These values were close to but still slightly lower than those for authentic images. That is, once participants regarded AI images as authentic images, their visual appearance was also accompanied by relatively high ratings of evidentiary credibility and acceptability as research evidence. However, after AI images were correctly identified as AI images, their evidentiary credibility and acceptability as research evidence were both clearly lower than when they were misjudged as authentic images.
Figure 17.
Confidence, evidentiary credibility, and acceptability for AI images mistaken as authentic, AI images correctly identified, and authentic images correctly identified.
Figure 18 presents the misjudgments of fully AI-generated images and AI-modified images across all evidence types and the three specific evidence types, together with the survey participants’ evaluations after these misjudgments. As shown in Figure 18a, 55.1% of fully AI-generated images were misjudged as authentic images, while 40.6% of AI-modified images were misjudged as authentic images.
Figure 18.
Deception rate and the ratings recorded after these images were mistaken as authentic, for the two categories of AI evidence, reported for all evidence types combined and for each evidence type: (a) proportion judged authentic (deception rate); (b) confidence after deception; (c) evidentiary credibility after deception; (d) acceptability as evidence after deception.
The rates at which fully AI-generated images were misjudged as authentic images were 65.9%, 37.1%, and 62.3% for structural damage images, construction material microscopic images, and construction site recording images, respectively. The rates at which AI-modified images were misjudged as authentic images were 47.4%, 38.1%, and 36.4% for structural damage images, construction material microscopic images, and construction site recording images, respectively. The overall rate at which fully AI-generated images were misjudged as authentic images was 14.5% higher than that for AI-modified images. For building structural damage evidence images and construction site record evidence images, the differences between the two were 18.5 and 25.9%, respectively. However, for construction material microscopic evidence images, the misjudgment rates of the two image types were very close, at 37.1% and 38.1%, respectively. It can be inferred that whether an image is easily misjudged is also related to the evidence type it presents. One possible explanation is that structural damage images and construction site recording images usually contain more irregular forms, occlusions, and complex backgrounds, making anomalous details in fully AI-generated images more likely to blend into this visual information. The textures and scale relationships of construction material microscopic images are relatively concentrated, so inconsistent features in generated images may be easier for participants to detect.
As shown in Figure 18b–d, among judgments in which fully AI-generated images were misjudged as authentic images, the mean judgment confidence across the three evidence types ranged from 7.04 to 7.71, evidentiary credibility ranged from 6.96 to 7.71, and acceptability as research evidence ranged from 7.03 to 7.69. When AI-modified images were misjudged as authentic images, judgment confidence across the three evidence types ranged from 7.30 to 7.65, evidentiary credibility ranged from 7.26 to 7.56, and acceptability as research evidence ranged from 7.07 to 7.43. The orange dashed lines in Figure 18b–d represent, respectively, the overall mean judgment confidence of 7.67, overall mean evidentiary credibility of 7.59, and overall mean acceptability as research evidence of 7.60 for authentic images.
When fully AI-generated structural damage images were misjudged as authentic images, the three ratings were 7.71, 7.71, and 7.69, respectively. These ratings were slightly higher than but close to the overall levels for authentic images. The three ratings for fully AI-generated construction site recording images were 7.52, 7.44, and 7.44, respectively, which were 0.15–0.16 points lower than the overall levels for authentic images, representing a relatively limited difference. In contrast, the three ratings for fully AI-generated construction material microscopic images were only 7.04, 6.96, and 7.03, respectively. These values were 0.63, 0.63, and 0.57 points lower, respectively, making this the category of fully AI-generated images with the largest overall difference from authentic images.
When AI-modified construction site recording images were misjudged as authentic images, judgment confidence and evidentiary credibility were 7.65 and 7.56, respectively, differing from the overall levels for authentic images by only 0.02 and 0.03 points. However, acceptability as research evidence was 7.43, which was 0.17 points lower. The three ratings for AI-modified structural damage images were 7.45, 7.29, and 7.36, respectively, which were 0.22–0.30 points lower than the overall levels for authentic images. For AI-modified construction material microscopic images, judgment confidence and evidentiary credibility were 7.30 and 7.26, respectively, which were 0.37 and 0.33 points lower than those for authentic images. Their acceptability as research evidence was 7.07, which was 0.53 points lower.
Based on these results, it can be inferred that the fully AI-generated structural damage images and AI-modified construction site recording images in this study were the closest to authentic images. In addition, the analyses in this section indicate that relying only on the apparent professional plausibility of an image or the observer’s subjective confidence may be insufficient to determine the true source of visual evidence. This also raises the possibility that image evidence in future research publications may require additional review and verification technologies beyond human judgment, as well as stricter source documentation requirements.
4. Conclusions
Through a questionnaire-based judgment experiment containing 18 images, this study investigated the source identification accuracy and subjective perceptions of 151 participants regarding authentic images, fully AI-generated images, and AI-modified images, as well as their evaluations of these images as evidence in building research. In this study, the overall source identification accuracy for all images was 36.9%, and 96 participants, accounting for 63.6%, performed at or below the chance level. A GLMM with crossed random intercepts for participant and for image, which accounts simultaneously for repeated judgments within a participant and for repeated judgments of the same image, estimated the probability of a correct judgment for a typical participant judging a typical image at 34.3%, with a 95% confidence interval from 26.3% to 43.3% that contains the one-in-three chance level, z = 0.23, p = 0.821. Under the same model, image source affected identification accuracy, χ2(2) = 17.26, p < 0.001, evidence type did not, χ2(2) = 1.17, p = 0.557, and the two factors interacted, χ2(4) = 11.97, p = 0.018. After the two types of AI images were combined into one category and source judgment became a binary judgment between authentic images and AI-produced images, participants’ mean discriminability and response bias did not differ significantly from zero. This held whether the images were treated as a fixed set, d′ = 0.113, p = 0.153, or as a sample in a mixed-effects signal-detection model, d′ = 0.120, SE = 0.226, p = 0.595. A criterion of zero is measured against the equal-variance midpoint rather than against the composition of the set. However, in this set, two images in three were AI-produced: participants answered “AI-produced” on 50.8% of trials against the 66.7% that the set contained. The three-alternative responses were correspondingly unbalanced, 49.2% selecting “authentic” against a true share of 33.3%, and the errors were asymmetric in the direction that matters for evidence integrity: of the 1714 incorrect judgments, 867 (50.6%), accepted a synthetic image as authentic, while 437 (25.5%) rejected an authentic image as synthetic. Therefore, based on the judgment results of the participants in this study, determining the source of building research images through observation alone did not perform better than guessing.
Figure 19 compares the binary identification accuracy between authentic images and AI-produced images with that reported in previous similar discrimination survey experiments on AI-generated images reviewed in this work. Because those experiments used a two-alternative task, whose chance level is 50%, while the task in this study had three alternatives and a chance level of 33.3%, the two cannot be placed on a common axis. Figure 19a therefore reports the present data recoded as a binary judgment between authentic and AI-produced images: 1414 of 2718 judgments were correct, yielding an accuracy of 52.0%. Figure 19b reports the three-alternative accuracies of this study against their respective chance levels.
Figure 19.
Comparison of judgment accuracy for authentic images and AI-generated images across studies and generative models.
StyleGAN2 used by Nightingale and Farid [11] and Stable Diffusion 1.5 used by Hartung et al. [14] are now both relatively early generative models, and their participants were still able to perform above the chance level. Högemann et al. [12] reported an accuracy of 63.7% after combining the results of five models, but the accuracy for the subset of images generated by FLUX.1-dev was only 29.0%. FLUX.1-dev is a 12-billion-parameter rectified-flow Transformer released by Black Forest Labs in 2024. Among the models discussed in this section, it is a relatively recent and currently popular image-generation model. The participant binary identification accuracies corresponding to the other four models in that study were 68.3%, 74.2%, 82.7%, and 86.7%, which differed greatly from the result for FLUX.1-dev.
Three factors may account for this variation. The first is the identity of the model. Within the single study of Högemann et al., with one task and one pool of participants, accuracy varies by 57.7% across five models, which is larger than any difference between the studies compared here and larger than any effect measured in the present work. The second is training and domain experience, which raised accuracy by 10.8 points in Nightingale and Farid and by 14.8 points in Hartung et al. The third is the kind of image and the population judging it. The two studies closest to the present one in using scientific or technical imagery report 40% to 51% and 54.5% without domain experience, a band within which the 52.0% recorded here falls, whereas the everyday scenes of Högemann et al. gave 63.7%.
The previous study most similar to the context of this study was that of Davydiuk et al. [15]. The study asked 250 scientists to judge AFM and TEM images of nanomaterials. The accuracy rates for the six image groups ranged from 40% to 51%, and four groups did not differ significantly from chance performance.
In this study, 55.1% of fully AI-generated images were judged to be authentic, which was even higher than the 51.8% of authentic images that were correctly identified. In contrast, only 40.6% of AI-modified images were judged to be authentic. That is, participants were more likely to become suspicious of AI-modified images. Local modifications using AI may leave traces in the original image that are inconsistent with the remaining content and thereby cause suspicion. However, this suspicion did not enable most participants to correctly identify the true source of the images, as the identification accuracy for AI-modified images was only 35.3%. Nightingale et al. [25] found that detecting whether an image had been modified and accurately locating the modified region were tasks at different levels. Even when participants correctly judged that an image had been modified, they were often unable to identify the location of the modification.
Image source was the main factor determining identification performance, while evidence type had a certain moderating effect, and the interaction between evidence type and image source was significant. Among the mean identification accuracy for the three evidence image types, construction material microscopic images had an accuracy of 39.4%, structural damage images had an accuracy of 36.3%, and construction site recording images had an accuracy of 35.1%, with a range of 4.3%. That is, evidence type did not greatly change the mean difficulty of judgment. What it significantly changed was the extent of the difference among the identification accuracies of the three image sources within the same evidence type. For structural damage images and construction site recording images, the proportions of authentic images correctly identified by participants were relatively high, with accuracies of 55.3% and 53.6%, respectively. However, participants could barely identify fully AI-generated images, with accuracies of only 15.2% and 19.5%, respectively. In other words, judgment errors resulted from fully AI-generated images being accepted as authentic images. The situation was different for construction material microscopic images. The identification accuracies for authentic images, fully AI-generated images, and AI-modified images were 46.4%, 36.4%, and 35.4%, respectively. The differences were smaller than those for the other two evidence image types, and the difficulty of judging fully AI-generated images was also lower. This also indicates that the difficulty caused by local modifications using AI was similar across all evidence types. In contrast, fully AI-generated macroscopic evidence images were markedly more difficult for participants to judge.
The image-by-image analysis of participants’ identification accuracy suggests that when fully AI-generated image content includes common components, plausible damage locations, and relatively restrained levels of damage, its visual content may align with participants’ existing building engineering experience and thereby be highly deceptive.
Among participant characteristics, response device was significantly associated with image identification accuracy. Participants who completed the survey using smartphones had a mean accuracy of 33.9%, compared with 40.9% for the laptop computer group and 58.3% for the desktop computer group. This ranking was the same for the separate accuracy results within all three evidence types, and an association remained after adjustment for the recorded participant-level variables, with adjusted odds of a correct judgment of 2.17 (95% CI: 1.17 to 4.01) for the desktop group relative to the smartphone group, compared with 3.42 before adjustment. Devices were chosen by the participants and not assigned, and the device groups differed in education, professional role, and experience, so this is an association and not evidence that screen size improves the identification of AI-generated images. A difference in display area is one possible explanation, since a larger display may make it easier to inspect local details and judge whether they are coherent with the image as a whole, but the choice of device is also related to who the participant is and to the circumstances in which a questionnaire is completed, and the present design cannot separate these accounts.
Building-related professional backgrounds produced a small improvement in image identification accuracy, with all fields showing accuracy higher than the mean accuracy of 31.7% for the group without the building-related background. In addition, this study found a pattern in the relationship between experience using generative AI and accuracy, in which accuracy first increased and then decreased as use frequency increased. The design of this study cannot determine the cause of this decline, and subsequent research is required to test it specifically.
In this study, the participants’ mean judgment confidence rating was 7.37 when their judgments were correct and 7.36 when their judgments were incorrect. These two values were very close. The difference is statistically equivalent to zero against a bound of a quarter of a scale point, so judgment confidence did not distinguish correct judgments from incorrect ones. The comparative analysis of evidentiary credibility and acceptability as research evidence showed that, when participants incorrectly judged the image source, the evidence evaluations given by the vast majority of participants were consequently also incorrect.
For a long time, some types of image evidence have been treated as materials that can directly support claims in building research. Identification accuracy in this study rose steadily with building-related experience, from 32.3% among the 66 participants reporting none to 43.7% at three to five years and 53.1% among the 16 reporting six to ten years, an odds ratio of 1.22 per level of the experience scale, χ2(1) = 15.66, p < 0.001. However, even the most experienced group identified only about half of the images on a three-alternative task, so none of them could confirm from the image alone whether it corresponded to an actual inspection, imaging, or construction process. Civil infrastructure assessment uses visual inspection as a component of condition assessment, SEM images are used for the quantitative characterization of cement and concrete microstructures, and site photographs are used to reconstruct actual construction status and compare it with BIM. All these activities are based on the correspondence between an image and the object it represents. Once this correspondence cannot be verified, the corresponding conclusions lose their basis.
Machine learning studies that use images as inputs also face additional risks. Related concerns arise in structural health monitoring and structural prediction, where machine-learning and deep-learning models are developed from experimental and numerical data [26,27,28]. Synthetic or simulation-derived data are not inherently unreliable when their sources, assumptions, and validation procedures are reported; the problem arises when generated or altered records of uncertain provenance enter training or validation datasets without disclosure. In that case, models may learn generation-specific artifacts, validation performance may not reflect results on independently acquired data, and generalization to real structures becomes more difficult to assess. Such studies require large numbers of images to construct training and validation datasets. If generated images that cannot be identified are mixed into these datasets, the model may not learn actual damage or construction characteristics. Shumailov et al. [21] found that training on recursively generated data causes models to gradually lose the tail characteristics of the original distribution. Datasets for image recognition tasks in civil engineering already have problems related to annotation quality and cross-scene generalization [22,23]. Mixing generated images of unknown provenance into these datasets would make these problems more difficult to detect.
Existing technical responses to synthetic-image risks can be broadly divided into provenance-based authentication, proactive watermarking, and post-hoc detection. Provenance-based authentication provides an alternative to approaches that infer authenticity from visual content alone. In the assessment of existing structures, the same principle already operates in physical rather than cryptographic form. Visual and photographic records are one layer of a deliberately redundant campaign in which ambient vibration testing and operational modal identification, geophysical and geotechnical surveying, geometric and material characterization, and calibrated model updating are cross-validated against one another, so that a diagnosis rests on the mutual consistency of independently measured quantities [29]. Media provenance has been investigated as a means of linking digital content to information about its source and assisting users in evaluating potentially manipulated media [30,31]. More recent systems extend this principle by combining secure media acquisition with cryptographic mechanisms that authenticate the source of visual content and document subsequent processing operations [32,33]. Authentication of Media via Provenance (AMP), for example, associates media with digitally signed manifests and supports retrieval of these records from a manifest database [30]. Related provenance principles are also reflected in the Coalition for Content Provenance and Authenticity (C2PA), an open standard designed to cryptographically secure and describe information about the origin and editing history of digital media [34]. Provenance-based approaches therefore address a different verification problem from post-hoc synthetic-image detection. They seek to establish verifiable information about how the media were created, attributed and subsequently processed [30,31,33,34].
Proactive watermarking represents a related but technically distinct strategy in which information is embedded in media or incorporated into the outputs of generative models [35]. Its effectiveness, however, depends on both the watermarking method and the transformations subsequently applied to the image. Zhao et al. showed that a class of pixel-level invisible watermarks is vulnerable to regeneration attacks based on image corruption and reconstruction, including implementations using diffusion models, while also identifying semantic watermarking as a potentially more resistant alternative [36]. Jiang et al. demonstrated that small and visually imperceptible adversarial perturbations can enable watermarked artificial intelligence (AI)-generated images to evade watermark-based detection [37]. Saberi et al. further showed that watermarking systems may be susceptible to both evasion and spoofing attacks, including cases in which authentic images are modified so that they are falsely identified as watermarked [38]. Post-hoc synthetic-image detectors face a different set of limitations. Corvi et al. reported substantial variation in detector performance across generator architectures and found that common image-processing operations, including resizing and JPEG compression, can further reduce detection performance [39]. At the editorial level, automated tools such as Proofig and Imagetwin have already been incorporated into scientific publishing workflows to identify image alteration, duplication, and other image-integrity problems [40,41]. These systems can support preliminary screening, but their current use still cannot be interpreted as definitive authentication of AI-generated images. This study has several limitations. Participants were recruited through convenience and snowball sampling, and 86.8% were currently enrolled students. The numbers of participants with some professional backgrounds were also relatively small. The sensitivity power analysis reported in Section 3 indicates that this limitation applies to the subgroup comparisons. For the full sample, the smallest detectable standardized effect was dz = 0.23, whereas the seven professional-field groups examined in Section 3.2 contained between 11 and 75 participants, for which the smallest detectable standardized effects range from dz = 0.94 to dz = 0.33. The two smallest groups, structural safety engineering and building inspection, maintenance or repair, contained four participants each, and their descriptive accuracies cannot be distinguished from sampling variation. Whether specialists in these sub-fields are more susceptible to the scene logic reproduced by current generative models requires studies with larger specialist samples.
In addition, in the questionnaire survey, the images were presented in a fixed order grouped by evidence type, so that serial position and evidence type are completely confounded and their effects cannot be separated. Identification accuracy and judgment confidence showed no decline across the questionnaire, but a design that counterbalances the order of the evidence-type blocks would be needed to separate the two.
The generalization of the source effect is limited by the number of stimuli. Each combination of image source and evidence type was represented by two images, so every combination rests on a small sample of the images of that kind. Identification accuracy differed considerably between individual images, from 12.6% to 69.5%, and the two images within a combination differed by a median of 6.6% and by as much as 31.8%. This variation was modelled directly by the random intercept for image in the mixed-effects analyses, and the effect of image source remained significant under every random-effect structure examined, including the maximal structure justified by the design. Image source, nevertheless, accounted for 62.2% of the variance in accuracy between images, evidence type for 1.5%, and individual images accounted for the remaining 36.3%.
The limitation that remains is one of precision. Because both experimental factors vary between images rather than within them, the effective number of independent units for the source contrasts is the number of images, and the study contains 18. This is visible in two places. First, the evidence for the interaction between image source and evidence type is weaker under the mixed-effects model (χ2(4) = 11.97, p = 0.018) than under the repeated-measures analysis of variance that treats the images as fixed (p < 0.001). Second, and more importantly, the equivalence test on sensitivity, which is significant when the images are treated as fixed, is not significant when they are treated as a sample, TOST p = 0.145. With the variance components estimated here, approximately 51 images, including 17 authentic and 34 AI-produced images, would be required for that test to reach significance against the same bound. The differences reported between authentic, AI-generated, and AI-modified images, and in particular the conclusion that mean discriminability is smaller than the smallest difference of practical relevance, should therefore be read as established for the image used in this work. The finding that generalizes across both participants and images is that no discrimination was detectable at all. A larger set of images per combination would be needed to establish how far the remaining claims generalize.
In addition, all fully AI-generated and AI-modified images were produced using the single ChatGPT Images 2.0 model and were not compared with other image-generation models.
Supplementary Materials
The following supporting information can be downloaded at https://www.mdpi.com/article/10.3390/buildings16183663/s1, Table S1: Image information record for the images used in the questionnaire; Document S1: Full questionnaire; Table S2: Complete expert content validation results; File S1: Origin Lab project files, exported vector graphics, and plotting data for the figures.
Author Contributions
Conceptualization, S.X., N.I.F., J.L., and S.Z.; methodology, S.X., N.I.F., J.L., and S.Z.; software, S.X. and J.L.; validation, S.X. and J.L.; formal analysis, J.L.; investigation, S.X., N.I.F., J.L., and S.Z.; resources, S.X., N.I.F., J.L., and S.Z.; data curation, J.L.; writing—original draft preparation, S.X. and J.L.; writing—review and editing, S.X., N.I.F., J.L., and S.Z.; visualization, S.X.; supervision, N.I.F. and S.Z.; project administration, N.I.F. and S.Z. All authors have read and agreed to the published version of the manuscript.
Funding
This research received no external funding.
Institutional Review Board Statement
Ethical review and approval were waived for this study because it was a non-interventional anonymous online questionnaire survey of adult respondents that involved no biomedical intervention and collected no directly identifiable personal information; responses were stored under anonymous codes and reported in aggregate form only. According to Article 32 of the Measures for Ethical Review of Life Science and Medical Research Involving Humans (National Health Commission of China and three other ministries, Guo Wei Ke Jiao Fa [2023] No. 4, effective 18 February 2023), research using anonymized information data is exempt from ethical review.
Informed Consent Statement
Informed consent was obtained from all subjects involved in the study. The opening page of the online questionnaire informed all participants of the purpose of the study, the anonymity of their responses, and the intended use of the data; participants indicated their consent electronically by proceeding to the questionnaire, and only those who consented completed the survey. The full questionnaire, including the consent page, is provided as Supplementary Document S1.
Data Availability Statement
The data presented in this study are available on request from the corresponding author due to privacy.
Acknowledgments
During the preparation of this study, the authors used ChatGPT Images 2.0, model identifier gpt-image-2, released by OpenAI, to prepare part of the images used in the questionnaire. In addition, during the preparation of the manuscript the authors used ChatGPT-5.6-Sol for language editing of the text. The authors have reviewed and edited the output and take full responsibility for the content of this publication.
Conflicts of Interest
The authors declare no conflicts of interest.
Abbreviations
The following abbreviations are used in this manuscript:
| AFM | atomic force microscopy |
| AI | artificial intelligence |
| AMP | Authentication of Media via Provenance |
| AUC | area under the receiver operating characteristic curve |
| BIM | building information model |
| C2PA | Coalition for Content Provenance and Authenticity |
| CI | confidence interval |
| GLMM | generalized linear mixed-effects model |
| ICC | intraclass correlation coefficient |
| I-CVI | item-level content validity index |
| ITZ | interfacial transition zone |
| JPEG | Joint Photographic Experts Group |
| PNG | Portable Network Graphics |
| ROC | receiver operating characteristic |
| S-CVI/Ave | scale-level content validity index, average calculation method |
| SD | standard deviation |
| SE | standard error |
| SEM | scanning electron microscopy |
| sRGB | standard red, green, blue color space |
| TEM | transmission electron microscopy |
| TOST | two one-sided test |
References
- Koch, C.; Georgieva, K.; Kasireddy, V.; Akinci, B.; Fieguth, P. A Review on Computer Vision Based Defect Detection and Condition Assessment of Concrete and Asphalt Civil Infrastructure. Adv. Eng. Inf. 2015, 29, 196–210. [Google Scholar] [CrossRef] [Scilit]
- Spencer, B.F.; Hoskere, V.; Narazaki, Y. Advances in Computer Vision-Based Civil Infrastructure Inspection and Monitoring. Engineering 2019, 5, 199–222. [Google Scholar] [CrossRef] [Scilit]
- Scrivener, K.L. Backscattered Electron Imaging of Cementitious Microstructures: Understanding and Quantification. Cem. Concr. Compos. 2004, 26, 935–945. [Google Scholar] [CrossRef] [Scilit]
- Li, L.; Yang, J.; Liu, W.; Ren, P. Overview of the Application of Quantitative Backscattered Electron (QBSE) Image Analysis to Characterize the Cement-Based Materials. Constr. Build. Mater. 2023, 406, 133332. [Google Scholar] [CrossRef] [Scilit]
- Golparvar-Fard, M.; Peña-Mora, F.; Savarese, S. Automated Progress Monitoring Using Unordered Daily Construction Photographs and IFC-Based Building Information Models. J. Comput. Civ. Eng. 2015, 29, 04014025. [Google Scholar] [CrossRef] [Scilit]
- Braun, A.; Borrmann, A. Combining Inverse Photogrammetry and BIM for Automated Labeling of Construction Site Images for Machine Learning. Autom. Constr. 2019, 106, 102879. [Google Scholar] [CrossRef] [Scilit]
- Cha, Y.; Choi, W.; Büyüköztürk, O. Deep Learning-Based Crack Damage Detection Using Convolutional Neural Networks. Comput.-Aided Civ. Infrastruct. Eng. 2017, 32, 361–378. [Google Scholar] [CrossRef] [Scilit]
- Dorafshan, S.; Thomas, R.J.; Maguire, M. Comparison of Deep Convolutional Neural Networks and Edge Detectors for Image-Based Crack Detection in Concrete. Constr. Build. Mater. 2018, 186, 1031–1045. [Google Scholar] [CrossRef] [Scilit]
- Chen, H.; Xiang, Q.; Hu, J.; Ye, M.; Yu, C.; Cheng, H.; Zhang, L. Comprehensive Exploration of Diffusion Models in Image Generation: A Survey. Artif. Intell. Rev. 2025, 58, 99. [Google Scholar] [CrossRef] [Scilit]
- Esser, P.; Kulal, S.; Blattmann, A.; Entezari, R.; Müller, J.; Saini, H.; Levi, Y.; Lorenz, D.; Sauer, A.; Boesel, F.; et al. Scaling Rectified Flow Transformers for High-Resolution Image Synthesis. In Proceedings of the 41st International Conference on Machine Learning, PMLR, Vienna, Austria, 21–27 July 2024; pp. 12606–12633. [Google Scholar]
- Nightingale, S.J.; Farid, H. AI-Synthesized Faces Are Indistinguishable from Real Faces and More Trustworthy. Proc. Natl. Acad. Sci. USA 2022, 119, e2120481119. [Google Scholar] [CrossRef] [Scilit] [PubMed]
- Högemann, M.; Betke, J.; Thomas, O. What You See Is Not What You Get Anymore: A Mixed-Methods Approach on Human Perception of AI-Generated Images. Front. Artif. Intell. 2025, 8, 1707336. [Google Scholar] [CrossRef] [Scilit] [PubMed]
- Farooq, A.; de Vreese, C. Deciphering Authenticity in the Age of AI: How AI-Generated Disinformation Images and AI Detection Tools Influence Judgements of Authenticity. AI Soc. 2025, 41, 493–504. [Google Scholar] [CrossRef] [Scilit]
- Hartung, J.; Reuter, S.; Kulow, V.A.; Fähling, M.; Spreckelsen, C.; Mrowka, R. Experts Fail to Reliably Detect AI-Generated Histological Data. Sci. Rep. 2024, 14, 28677. [Google Scholar] [CrossRef] [Scilit] [PubMed]
- Davydiuk, N.; Krieg, E.; Gaitzsch, J.; McCall, P.M.; Auernhammer, G.K.; Yang, M.; Tracy, J.B.; Bals, S.; Parak, W.J.; Kotov, N.A.; et al. The Rising Danger of AI-Generated Images in Nanomaterials Science and What We Can Do about It. Nat. Nanotechnol. 2025, 20, 1174–1177. [Google Scholar] [CrossRef] [Scilit] [PubMed]
- Cromey, D.W. Avoiding Twisted Pixels: Ethical Guidelines for the Appropriate Use and Manipulation of Scientific Digital Images. Sci. Eng. Ethics 2010, 16, 639–667. [Google Scholar] [CrossRef] [Scilit] [PubMed]
- Bik, E.M.; Casadevall, A.; Fang, F.C. The Prevalence of Inappropriate Image Duplication in Biomedical Research Publications. mBio 2016, 7, e00809-16. [Google Scholar] [CrossRef] [Scilit] [PubMed]
- Lynn, M.R. Determination and Quantification of Content Validity. Nurs. Res. 1986, 35, 382–386. [Google Scholar] [CrossRef] [Scilit]
- Polit, D.F.; Beck, C.T. The Content Validity Index: Are You Sure You Know What’s Being Reported? Critique and Recommendations. Res. Nurs. Health 2006, 29, 489–497. [Google Scholar] [CrossRef] [Scilit] [PubMed]
- Judd, C.M.; Westfall, J.; Kenny, D.A. Treating Stimuli as a Random Factor in Social Psychology: A New and Comprehensive Solution to a Pervasive but Largely Ignored Problem. J. Personal. Soc. Psychol. 2012, 103, 54–69. [Google Scholar] [CrossRef] [Scilit] [PubMed]
- Jaeger, T.F. Categorical Data Analysis: Away from ANOVAs (Transformation or Not) and towards Logit Mixed Models. J. Mem. Lang. 2008, 59, 434–446. [Google Scholar] [CrossRef] [Scilit] [PubMed]
- Bates, D.; Mächler, M.; Bolker, B.; Walker, S. Fitting Linear Mixed-Effects Models Using Lme4. J. Stat. Softw. 2015, 67, 1–48. [Google Scholar] [CrossRef] [Scilit]
- Nakagawa, S.; Johnson, P.C.D.; Schielzeth, H. The Coefficient of Determination R2 and Intra-Class Correlation Coefficient from Generalized Linear Mixed-Effects Models Revisited and Expanded. J. R. Soc. Interface 2017, 14, 20170213. [Google Scholar] [CrossRef] [Scilit] [PubMed]
- Wright, D.B.; Horry, R.; Skagerberg, E.M. Functions for Traditional and Multilevel Approaches to Signal Detection Theory. Behav. Res. Methods 2009, 41, 257–267. [Google Scholar] [CrossRef] [Scilit] [PubMed]
- Nightingale, S.J.; Wade, K.A.; Watson, D.G. Can People Identify Original and Manipulated Photos of Real-World Scenes? Cogn. Res. Princ. Implic. 2017, 2, 30. [Google Scholar] [CrossRef] [Scilit] [PubMed]
- Khatir, A.; Capozucca, R.; Khatir, S.; Magagnini, E.; Le Thanh, C.; Riahi, M.K. Advancements and Emerging Trends in Integrating Machine Learning and Deep Learning for SHM in Mechanical and Civil Engineering: A Comprehensive Review. J. Braz. Soc. Mech. Sci. Eng. 2025, 47, 419. [Google Scholar] [CrossRef] [Scilit]
- Khatir, A.; Oulad Brahim, A.; Capozucca, R.; Khatir, S.; Noori, M.; Sarhosis, V.; Bhowmik, B.; Cuong-Le, T. Structural Recovery and Damage Prediction in GFRP-BFRP Patched Plates Using Hybrid SSA-SCA-XGBoost Model and Vibration Data. Compos. Struct. 2026, 393, 120638. [Google Scholar] [CrossRef] [Scilit]
- Osmani, A.; Shamass, R.; Tsavdaridis, K.D.; Ferreira, F.P.V.; Khatir, A. Deflection Predictions of Tapered Cellular Steel Beams Using Analytical Models and an Artificial Neural Network. Buildings 2025, 15, 992. [Google Scholar] [CrossRef] [Scilit]
- Serlenga, V.; Gallipoli, M.R.; Ditommaso, R.; Ponzo, C.F.; Tragni, N.; Perrone, A.; Stabile, T.A.; Calamita, G.; Vignola, L.; Carso, R.F.; et al. An Integrated Approach for Structural Behavior Characterization of the Gravina Bridge (Matera, Southern Italy). Struct. Health Monit. 2021, 20, 3371–3391. [Google Scholar] [CrossRef] [Scilit]
- England, P.; Malvar, H.S.; Horvitz, E.; Stokes, J.W.; Fournet, C.; Burke-Aguero, R.; Chamayou, A.; Clebsch, S.; Costa, M.; Deutscher, J.; et al. AMP: Authentication of Media via Provenance. In Proceedings of the 12th ACM Multimedia Systems Conference; Association for Computing Machinery: New York, NY, USA, 2021; pp. 108–121. [Google Scholar]
- Sherman, I.N.; Stokes, J.W.; Redmiles, E.M. Designing Media Provenance Indicators to Combat Fake Media. In Proceedings of the 24th International Symposium on Research in Attacks, Intrusions and Defenses; Association for Computing Machinery: New York, NY, USA, 2021; pp. 324–339. [Google Scholar]
- Liu, Y.; Farrukh, H.; Sani, A.A.; Agarwal, S.; Tsudik, G. Scoop: Mitigation of Recapture Attacks on Provenance-Based Media Authentication. GetMobile Mob. Comput. Commun. 2026, 30, 29–33. [Google Scholar] [CrossRef] [Scilit]
- Liu, Y.; Yao, Z.; Chen, M.; Amiri Sani, A.; Agarwal, S.; Tsudik, G. ProvCam: A Camera Module with Self-Contained TCB for Producing Verifiable Videos. In Proceedings of the 30th Annual International Conference on Mobile Computing and Networking; Association for Computing Machinery: New York, NY, USA, 2024; pp. 588–602. [Google Scholar]
- Trattner, C.; Forstner, S.L.; Starke, A.D.; Knudsen, E. C2PA Provenance Labels Increase Trust in Digital News Platforms Across Western Countries. In Proceedings of the International AAAI Conference on Web and Social Media, Los Angeles, CA, USA, 27–29 May 2026; Volume 20, pp. 2267–2279. [Google Scholar] [CrossRef] [Scilit]
- Nguyen-Le, H.-H.; Tran, V.-T.; Nguyen, T.; Le-Khac, N.-A. A Survey on Proactive Deepfake Defense: Disruption and Watermarking. ACM Comput. Surv. 2025, 58, 1–37. [Google Scholar] [CrossRef] [Scilit]
- Zhao, X.; Zhang, K.; Su, Z.; Vasan, S.; Grishchenko, I.; Kruegel, C.; Vigna, G.; Wang, Y.-X.; Li, L. Invisible Image Watermarks Are Provably Removable Using Generative AI. In Proceedings of the Advances in Neural Information Processing Systems 37; Curran Associates, Inc.: San Diego, CA, USA, 2024; Volume 37, pp. 8643–8672. [Google Scholar]
- Jiang, Z.; Zhang, J.; Gong, N.Z. Evading Watermark Based Detection of AI-Generated Content. In Proceedings of the 2023 ACM SIGSAC Conference on Computer and Communications Security; Association for Computing Machinery: New York, NY, USA, 2023; pp. 1168–1181. [Google Scholar]
- Saberi, M.; Sadasivan, V.S.; Rezaei, K.; Kumar, A.; Chegini, A.; Wang, W.; Feizi, S. Robustness of AI-Image Detectors: Fundamental Limits and Practical Attacks. In Proceedings of the International Conference on Learning Representations, Vienna, Austria, 7–11 May 2024; Volume 2024, pp. 27500–27526. [Google Scholar]
- Corvi, R.; Cozzolino, D.; Zingarini, G.; Poggi, G.; Nagano, K.; Verdoliva, L. On The Detection of Synthetic Images Generated by Diffusion Models. In Proceedings of the ICASSP 2023—2023 IEEE International Conference on Acoustics, Speech and Signal Processing (ICASSP), Rhodes Island, Greece, 4–10 June 2023; pp. 1–5. [Google Scholar]
- Chaturvedi, A.P.; Hibbard, A.; Nelson, C.; Casadevall, A.; Kullas, A.L. ASM Incorporates Imagetwin to Address Image Duplication and Preserve Scientific Accuracy. mBio 2025, 16, e0199025. [Google Scholar] [CrossRef] [Scilit] [PubMed]
- Thorp, H.H. Genuine Images in 2024. Science 2024, 383, 7. [Google Scholar] [CrossRef] [Scilit] [PubMed]
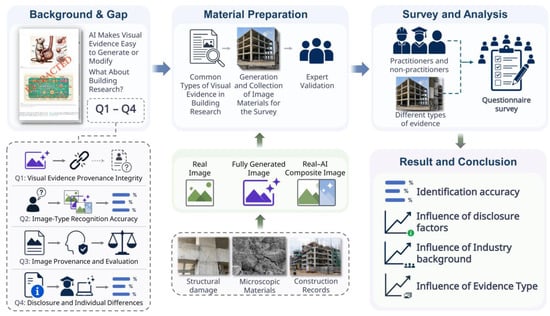
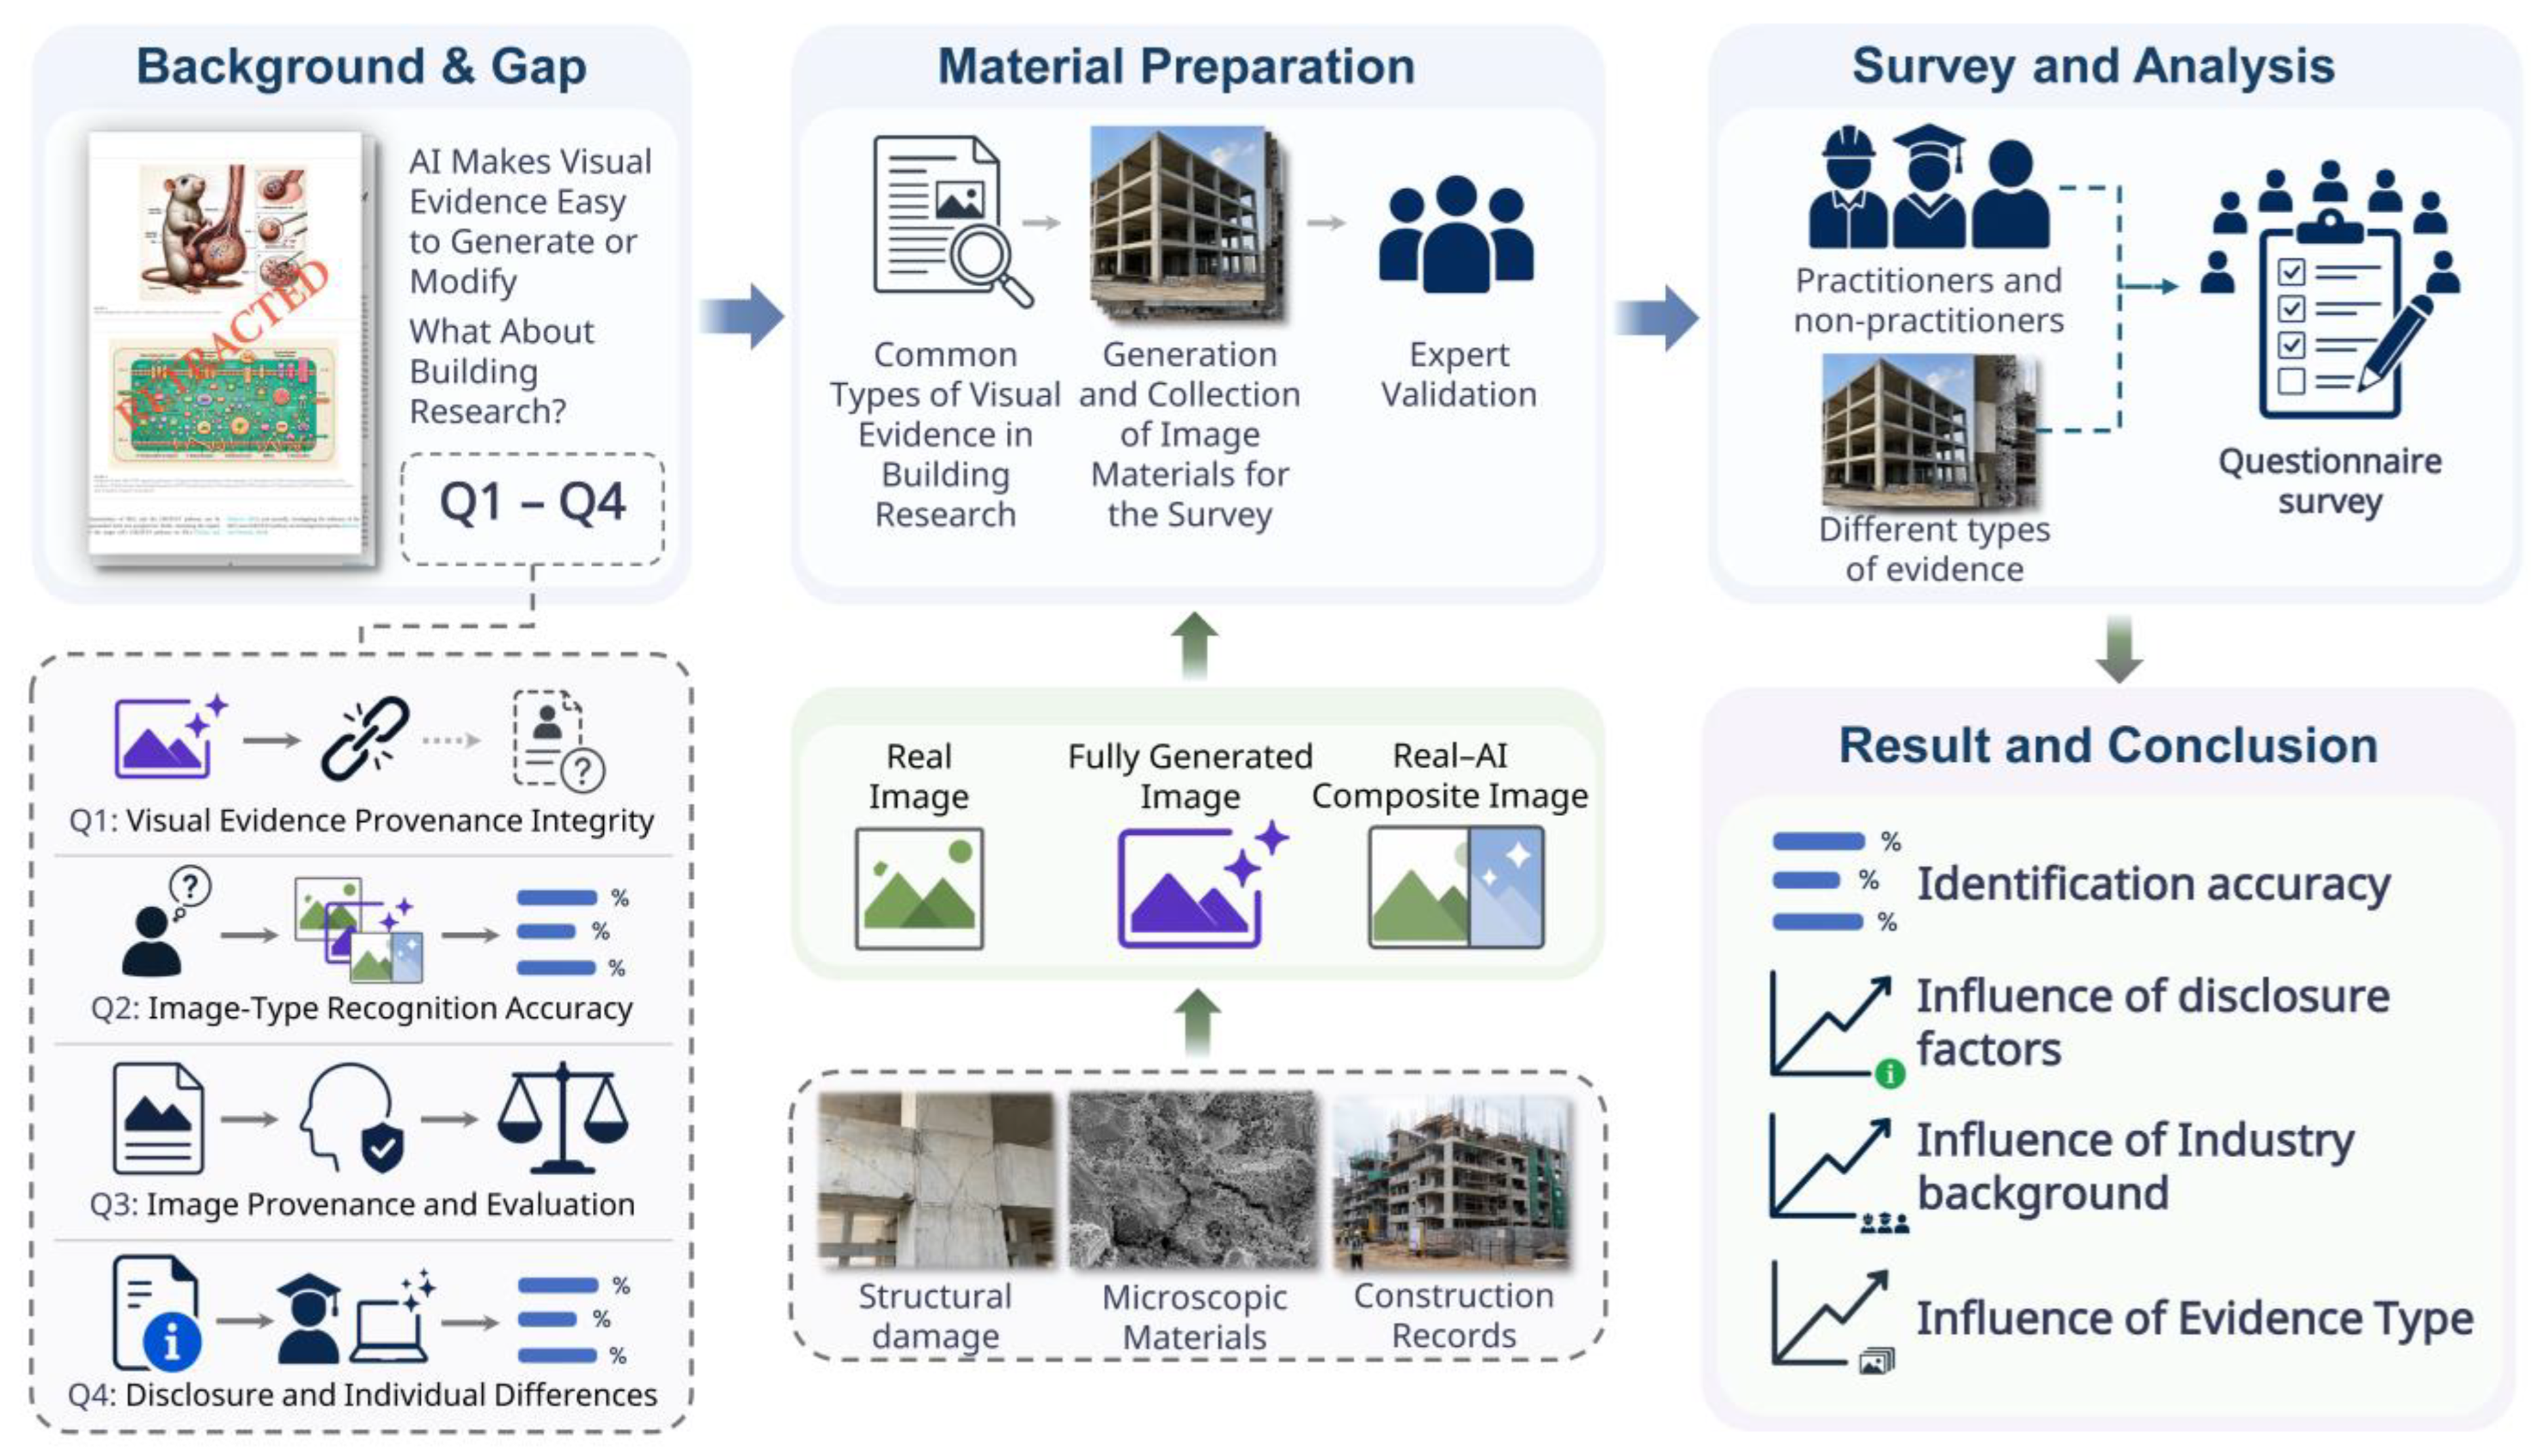
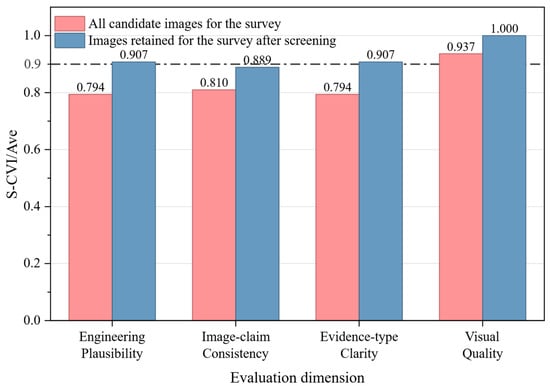
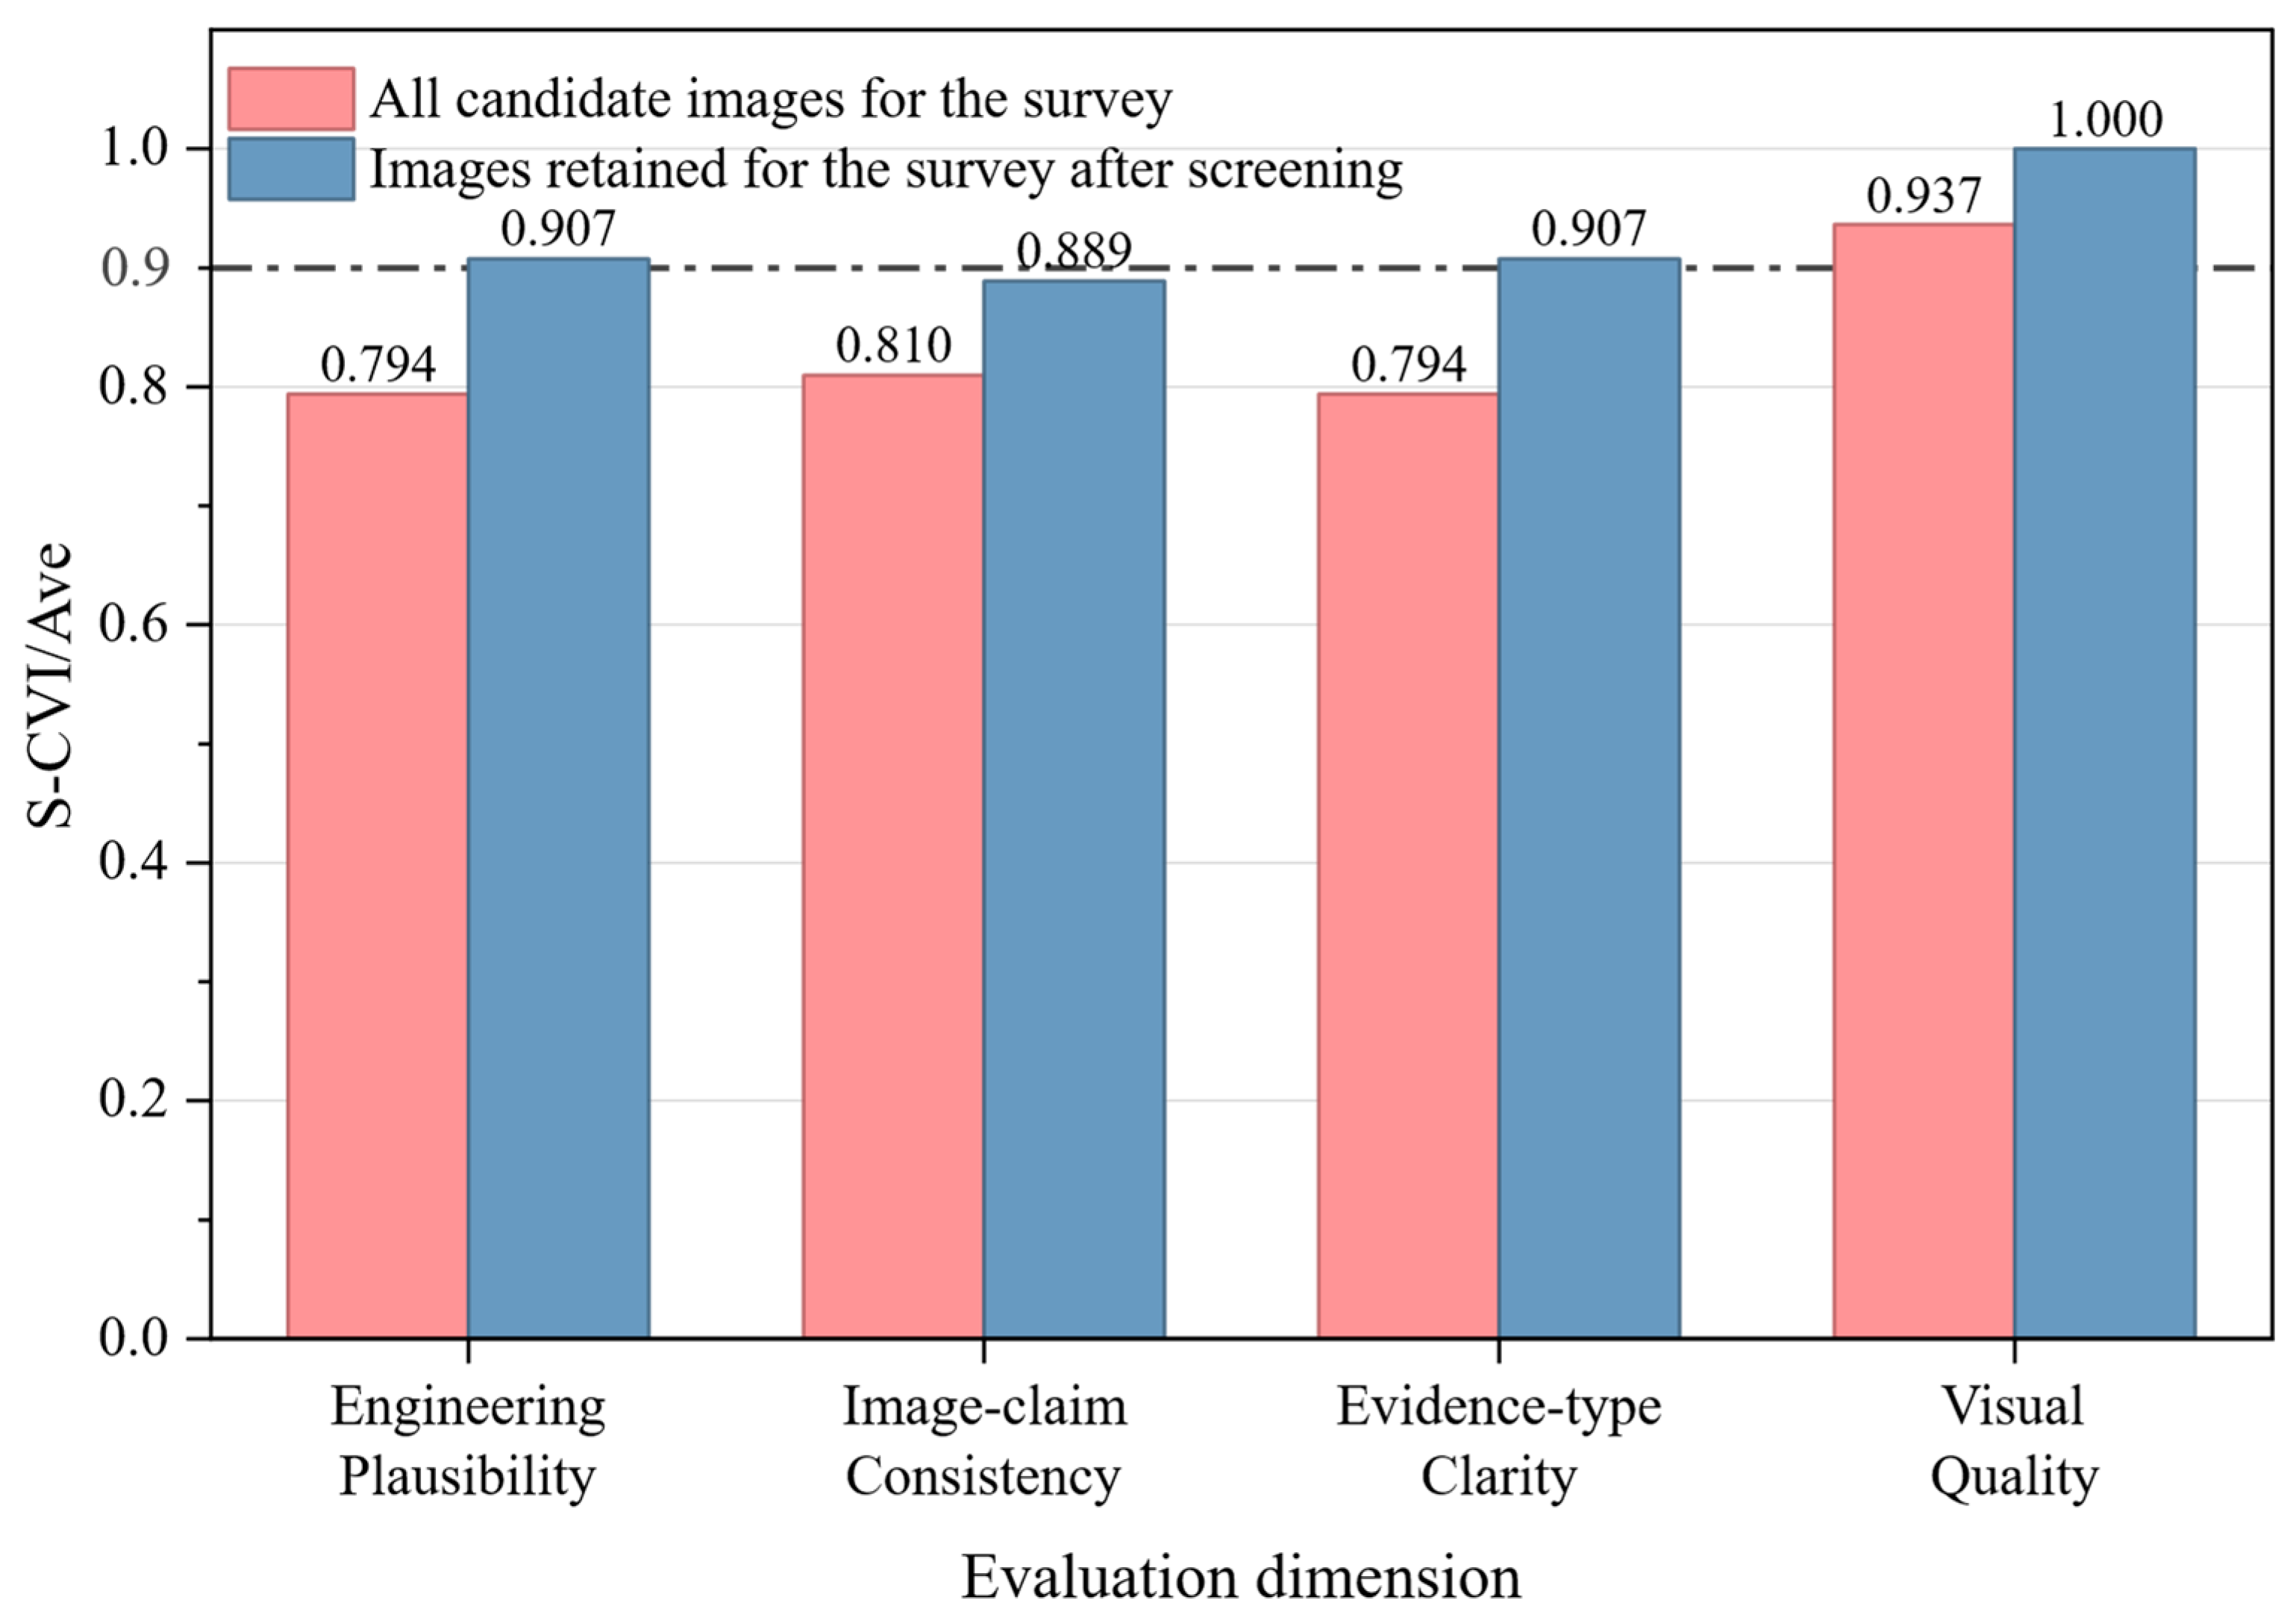
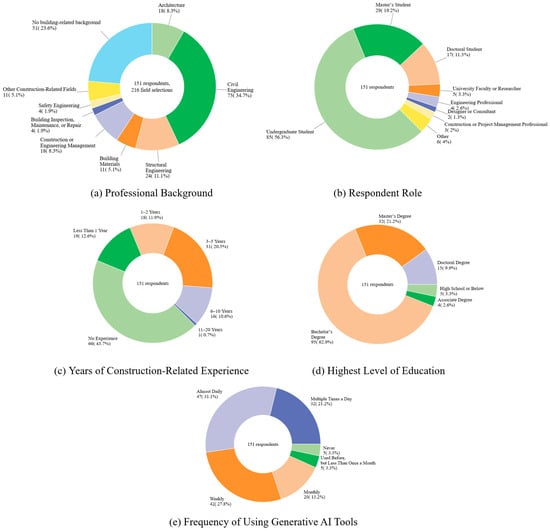
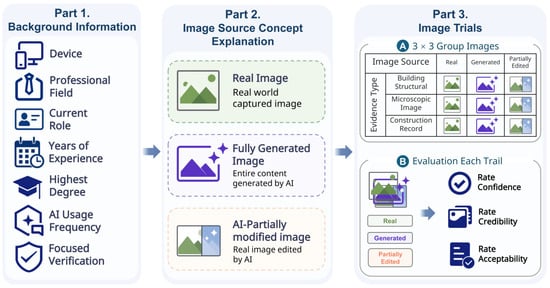
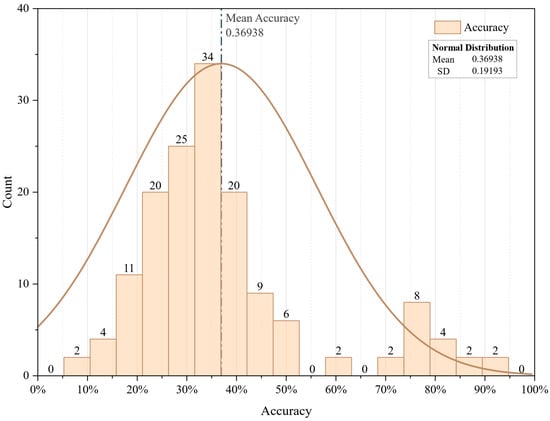
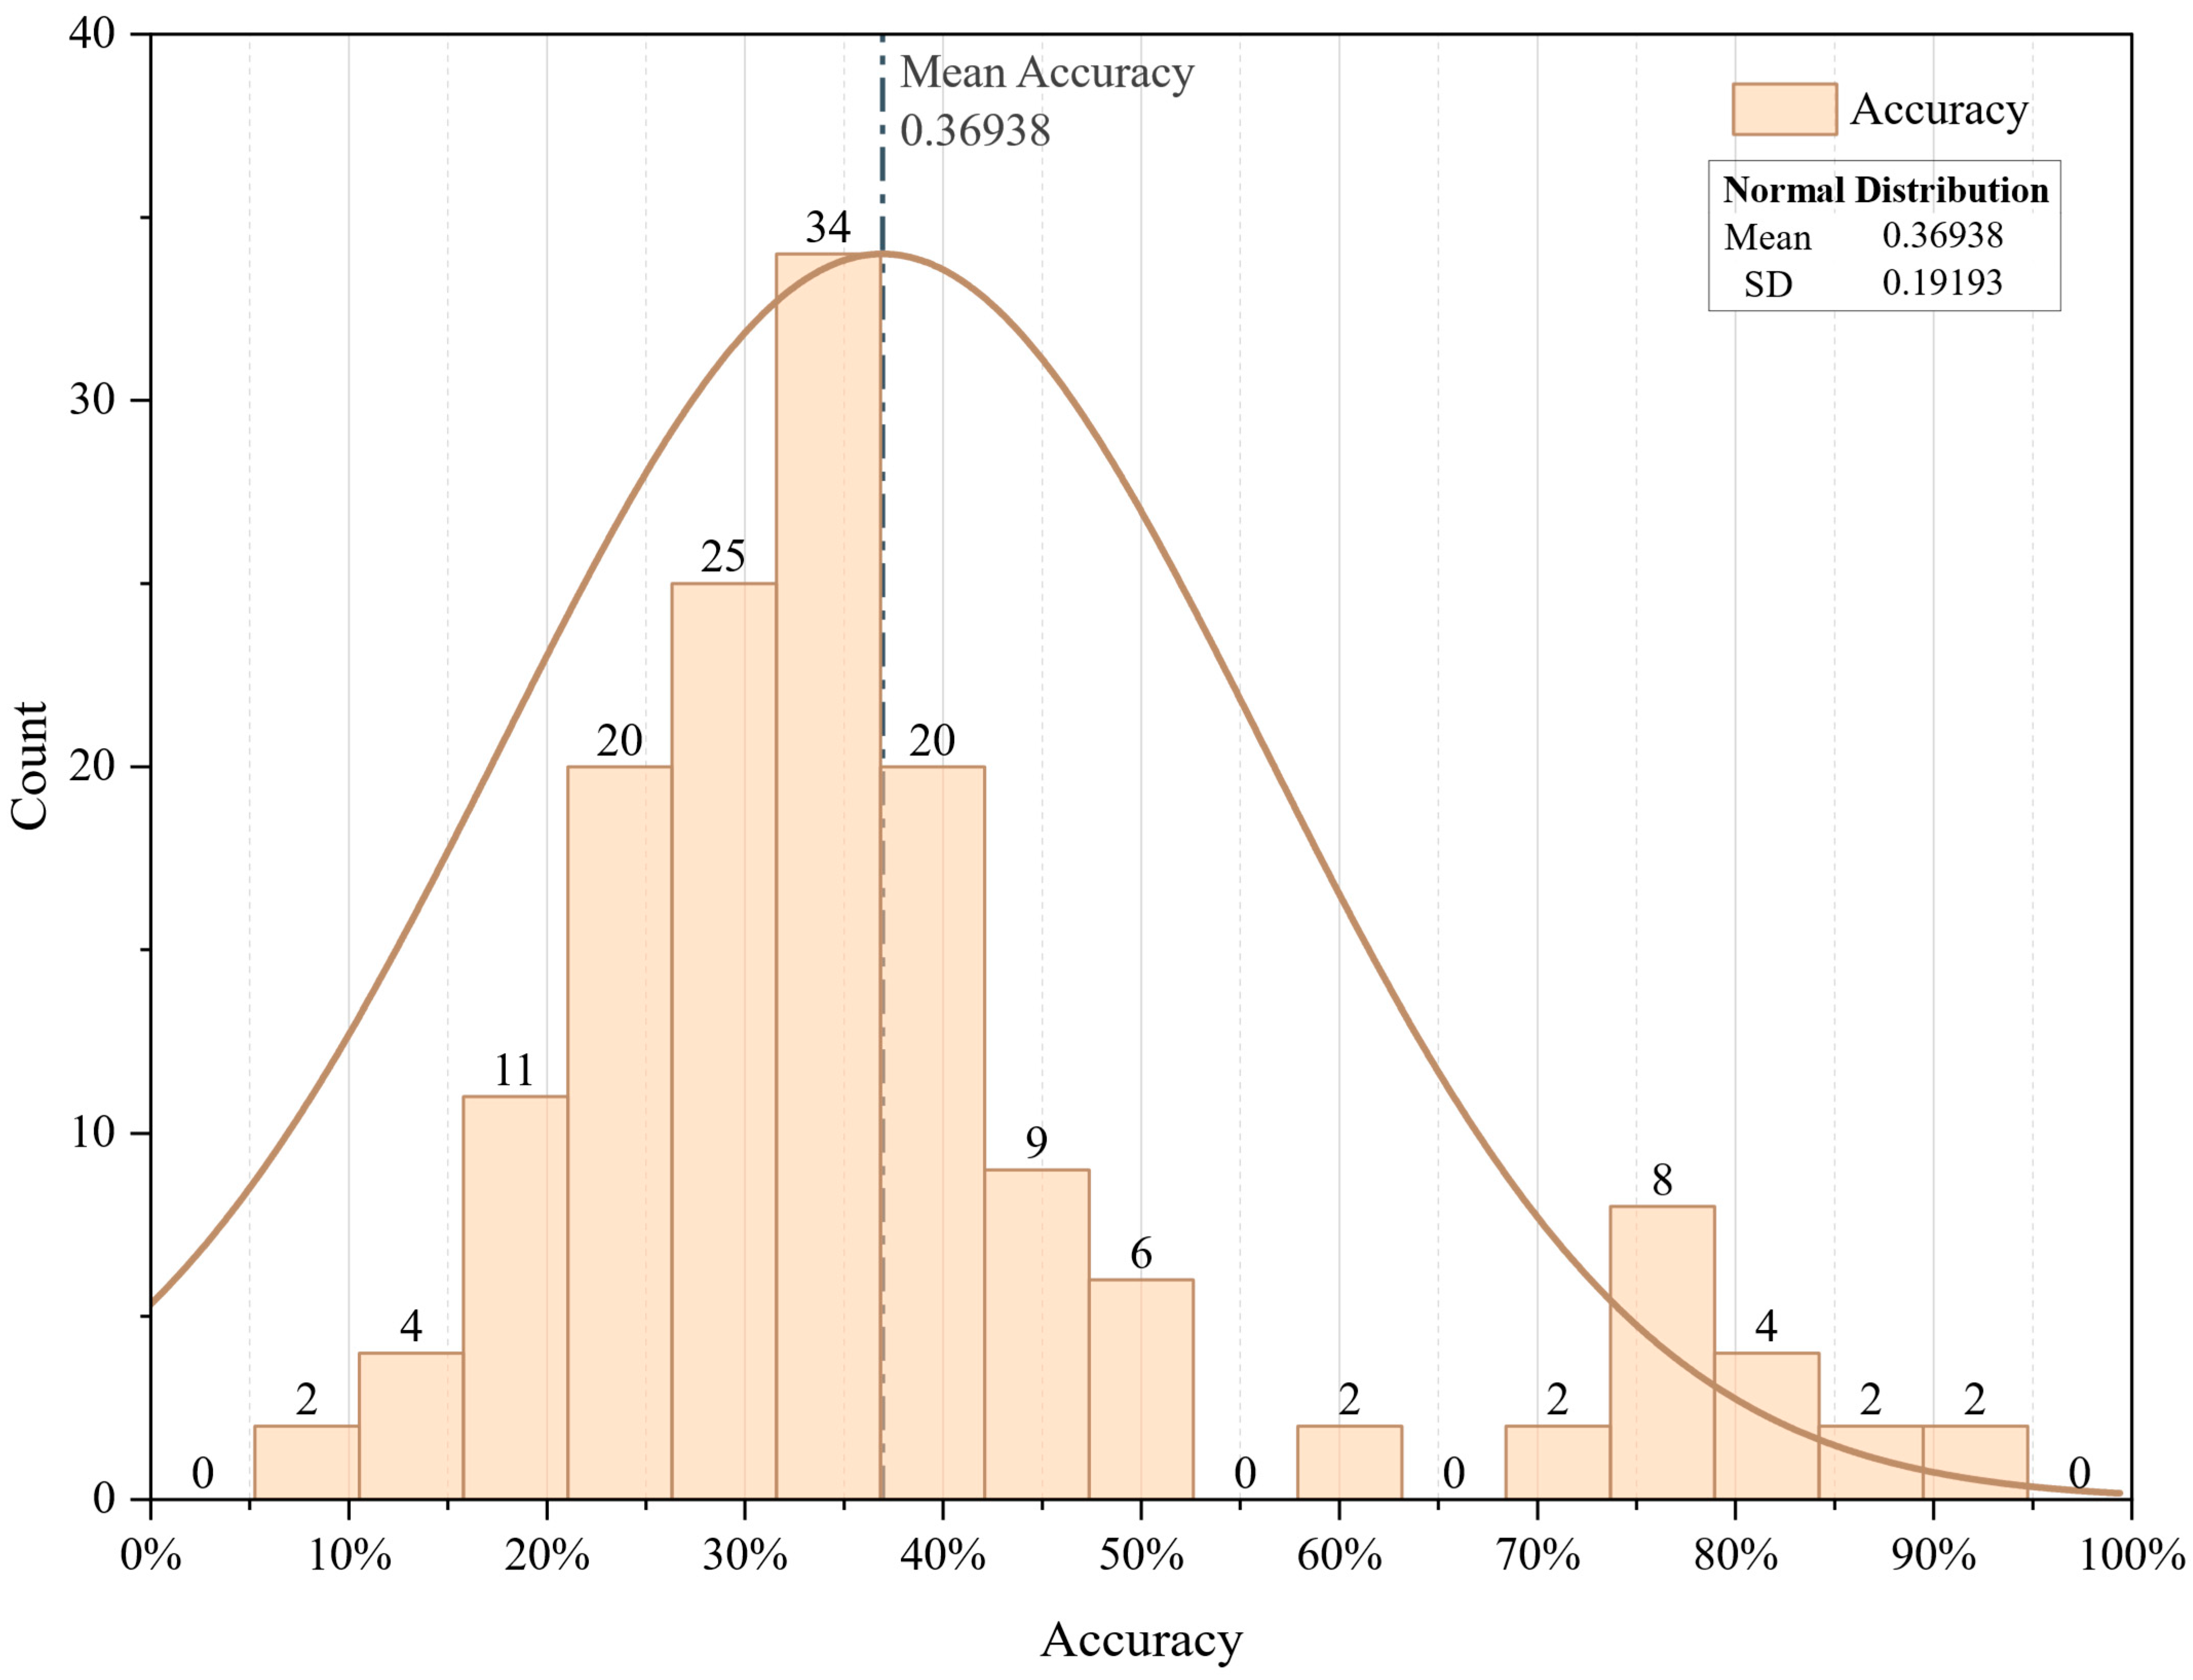
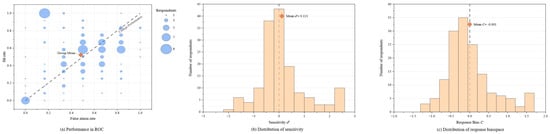
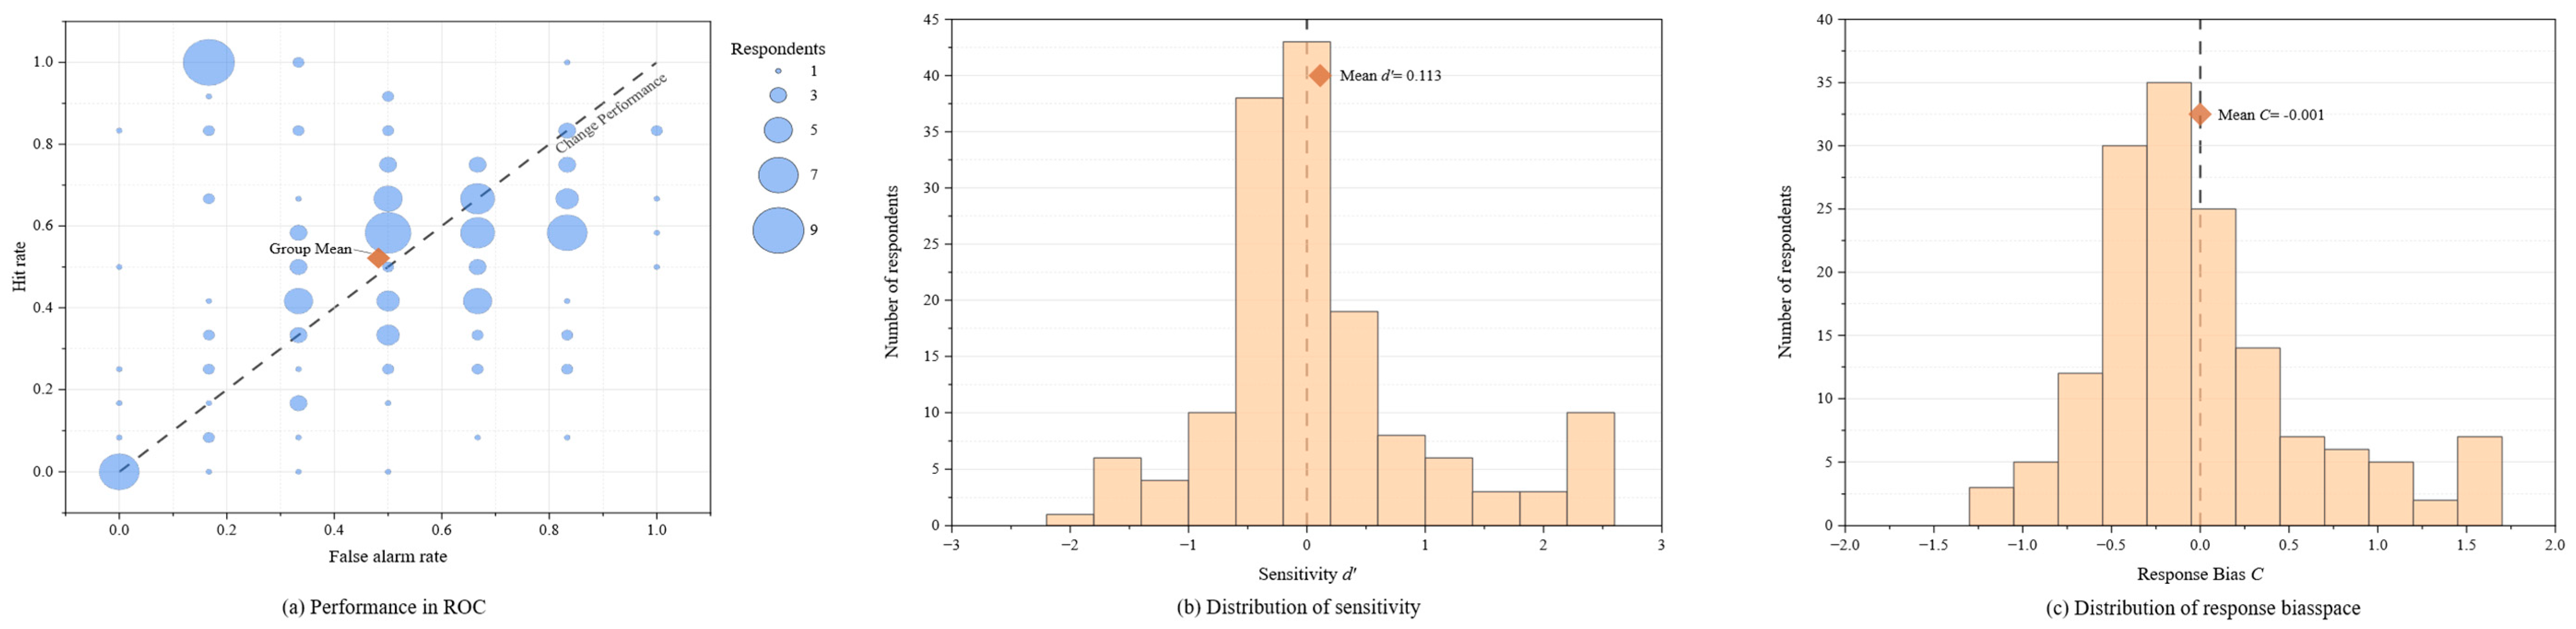
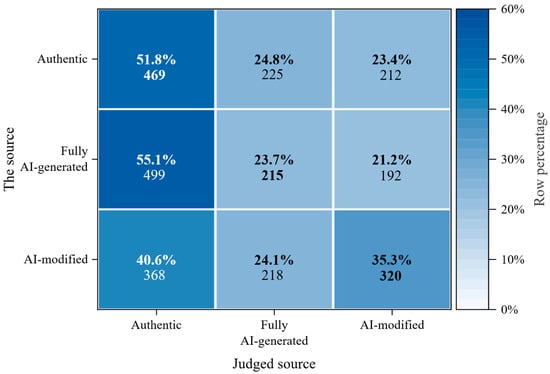
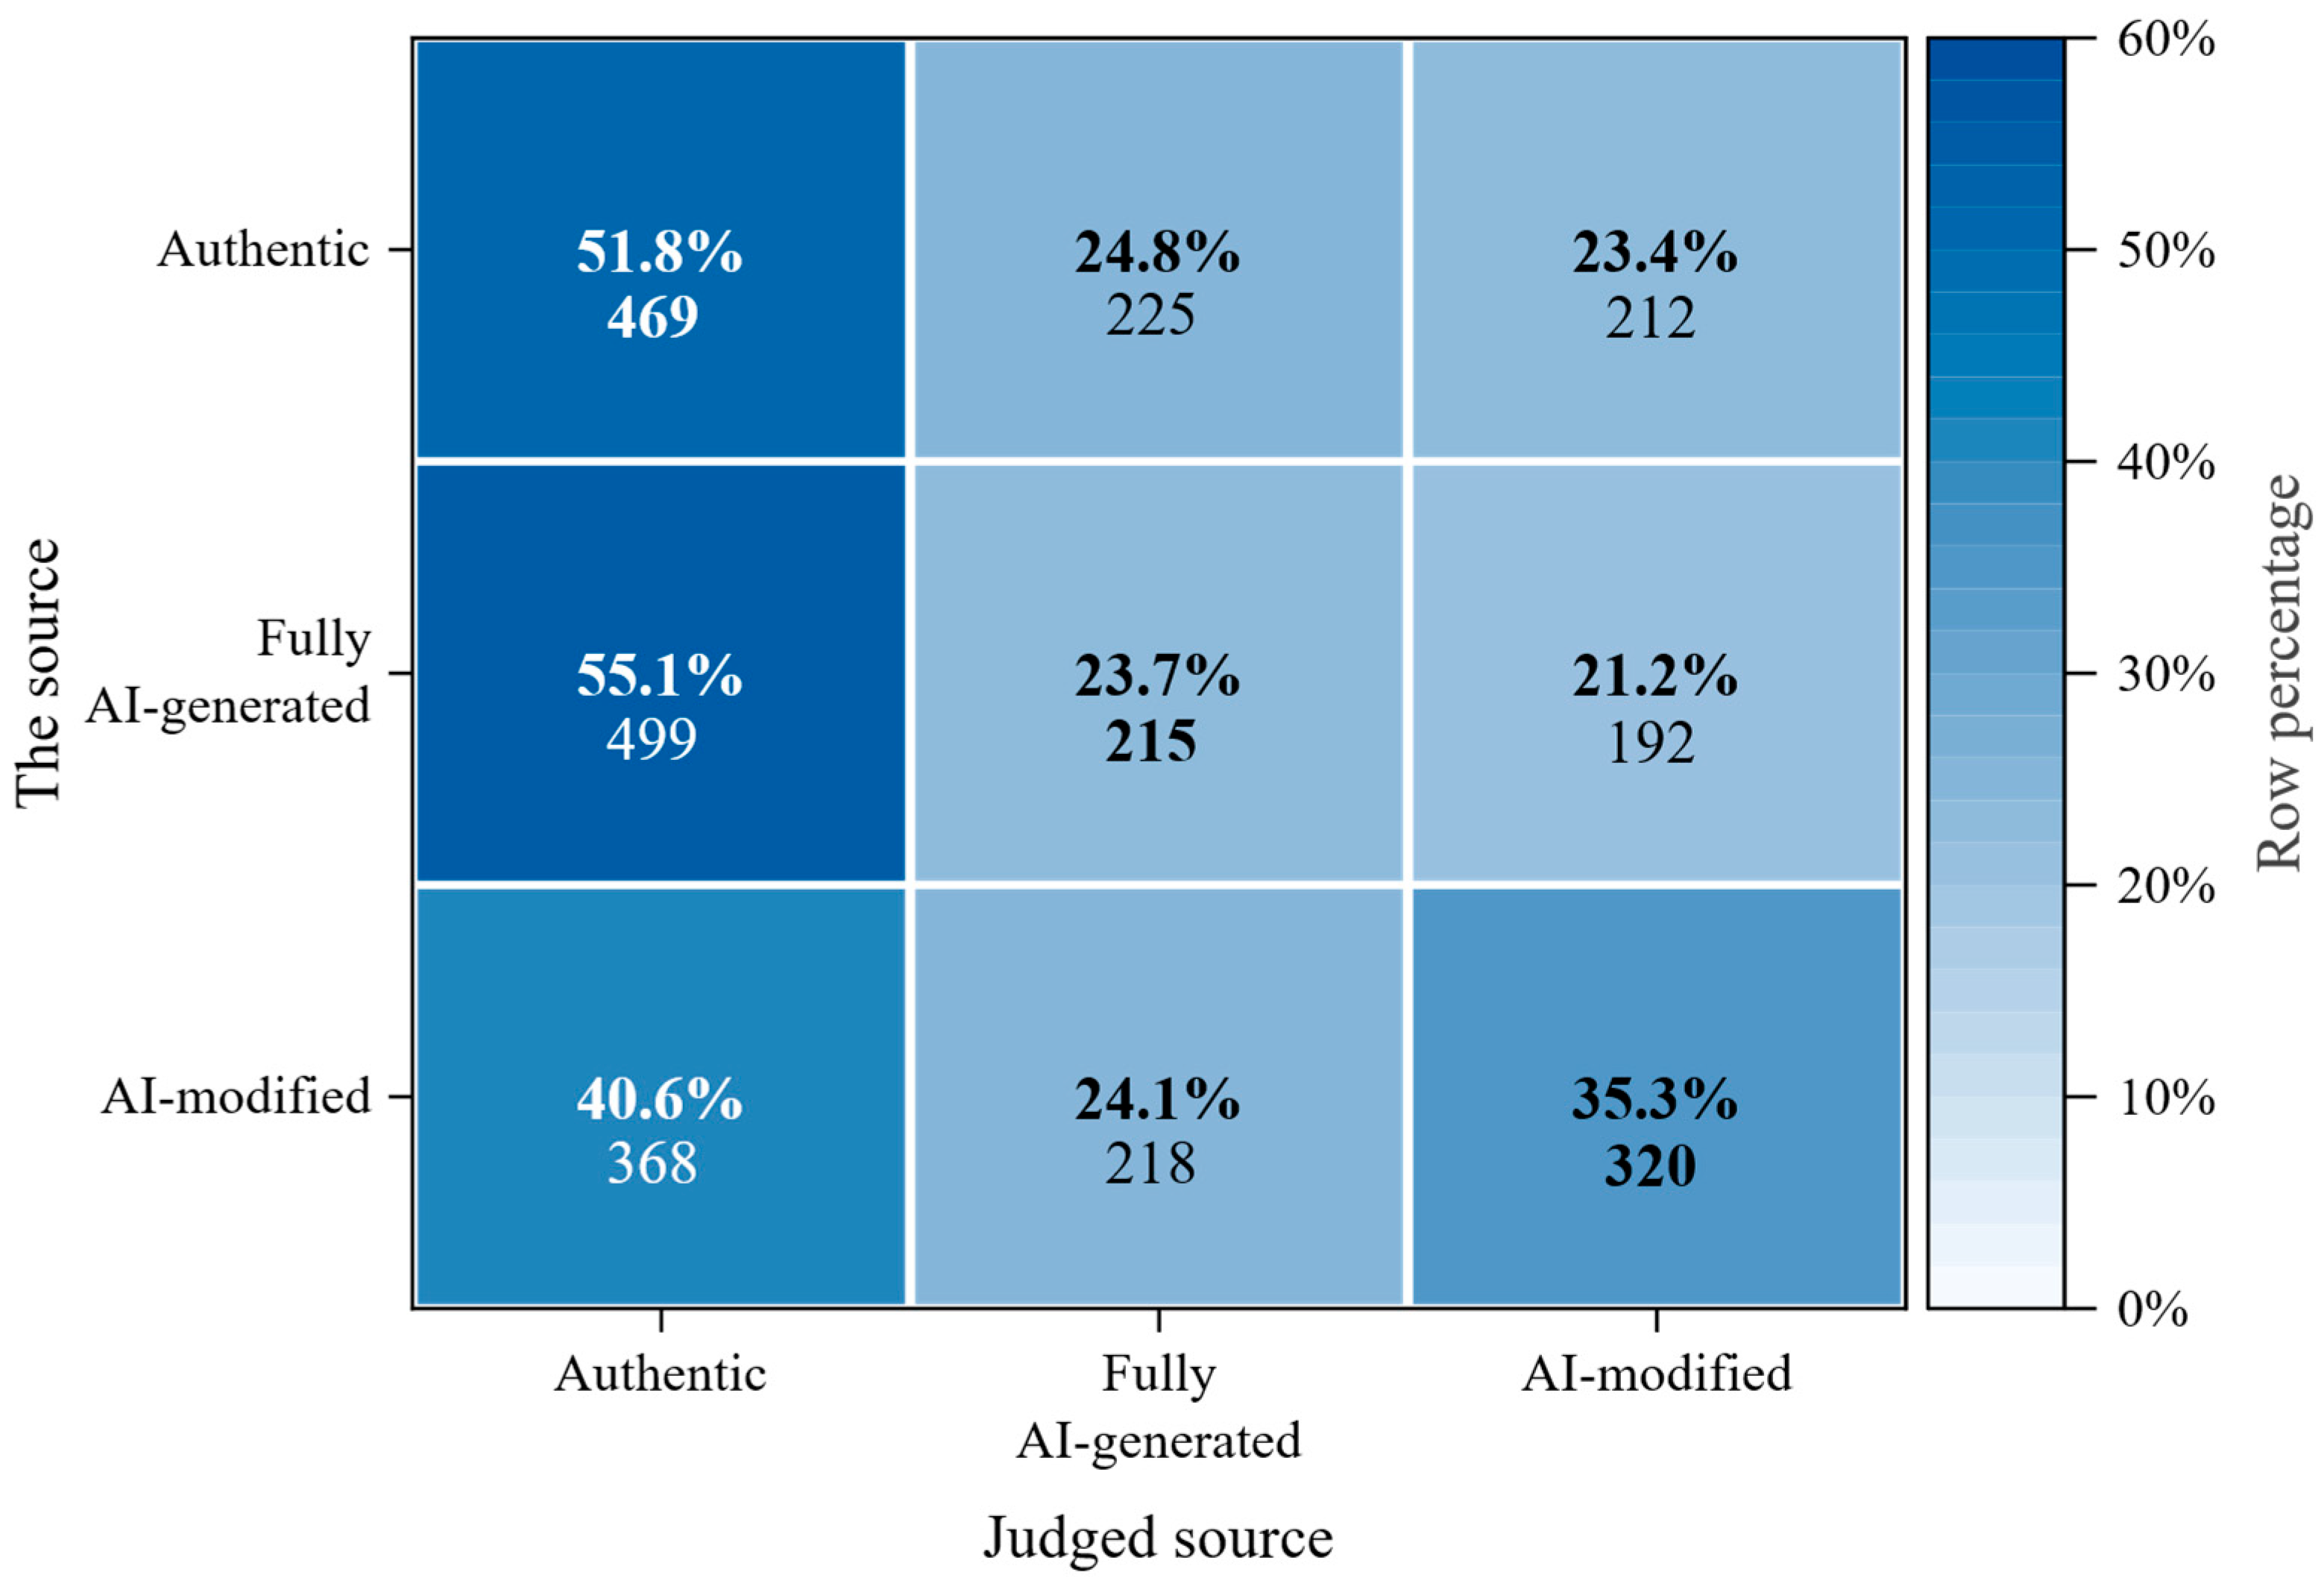
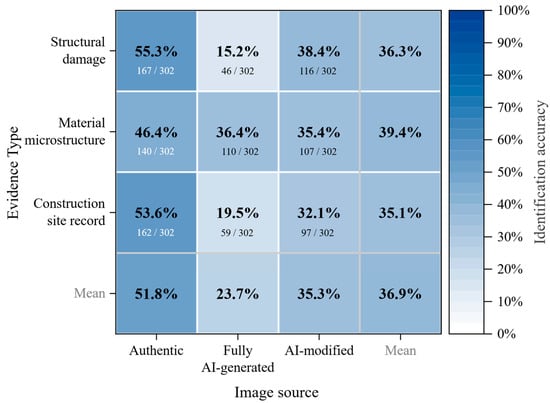
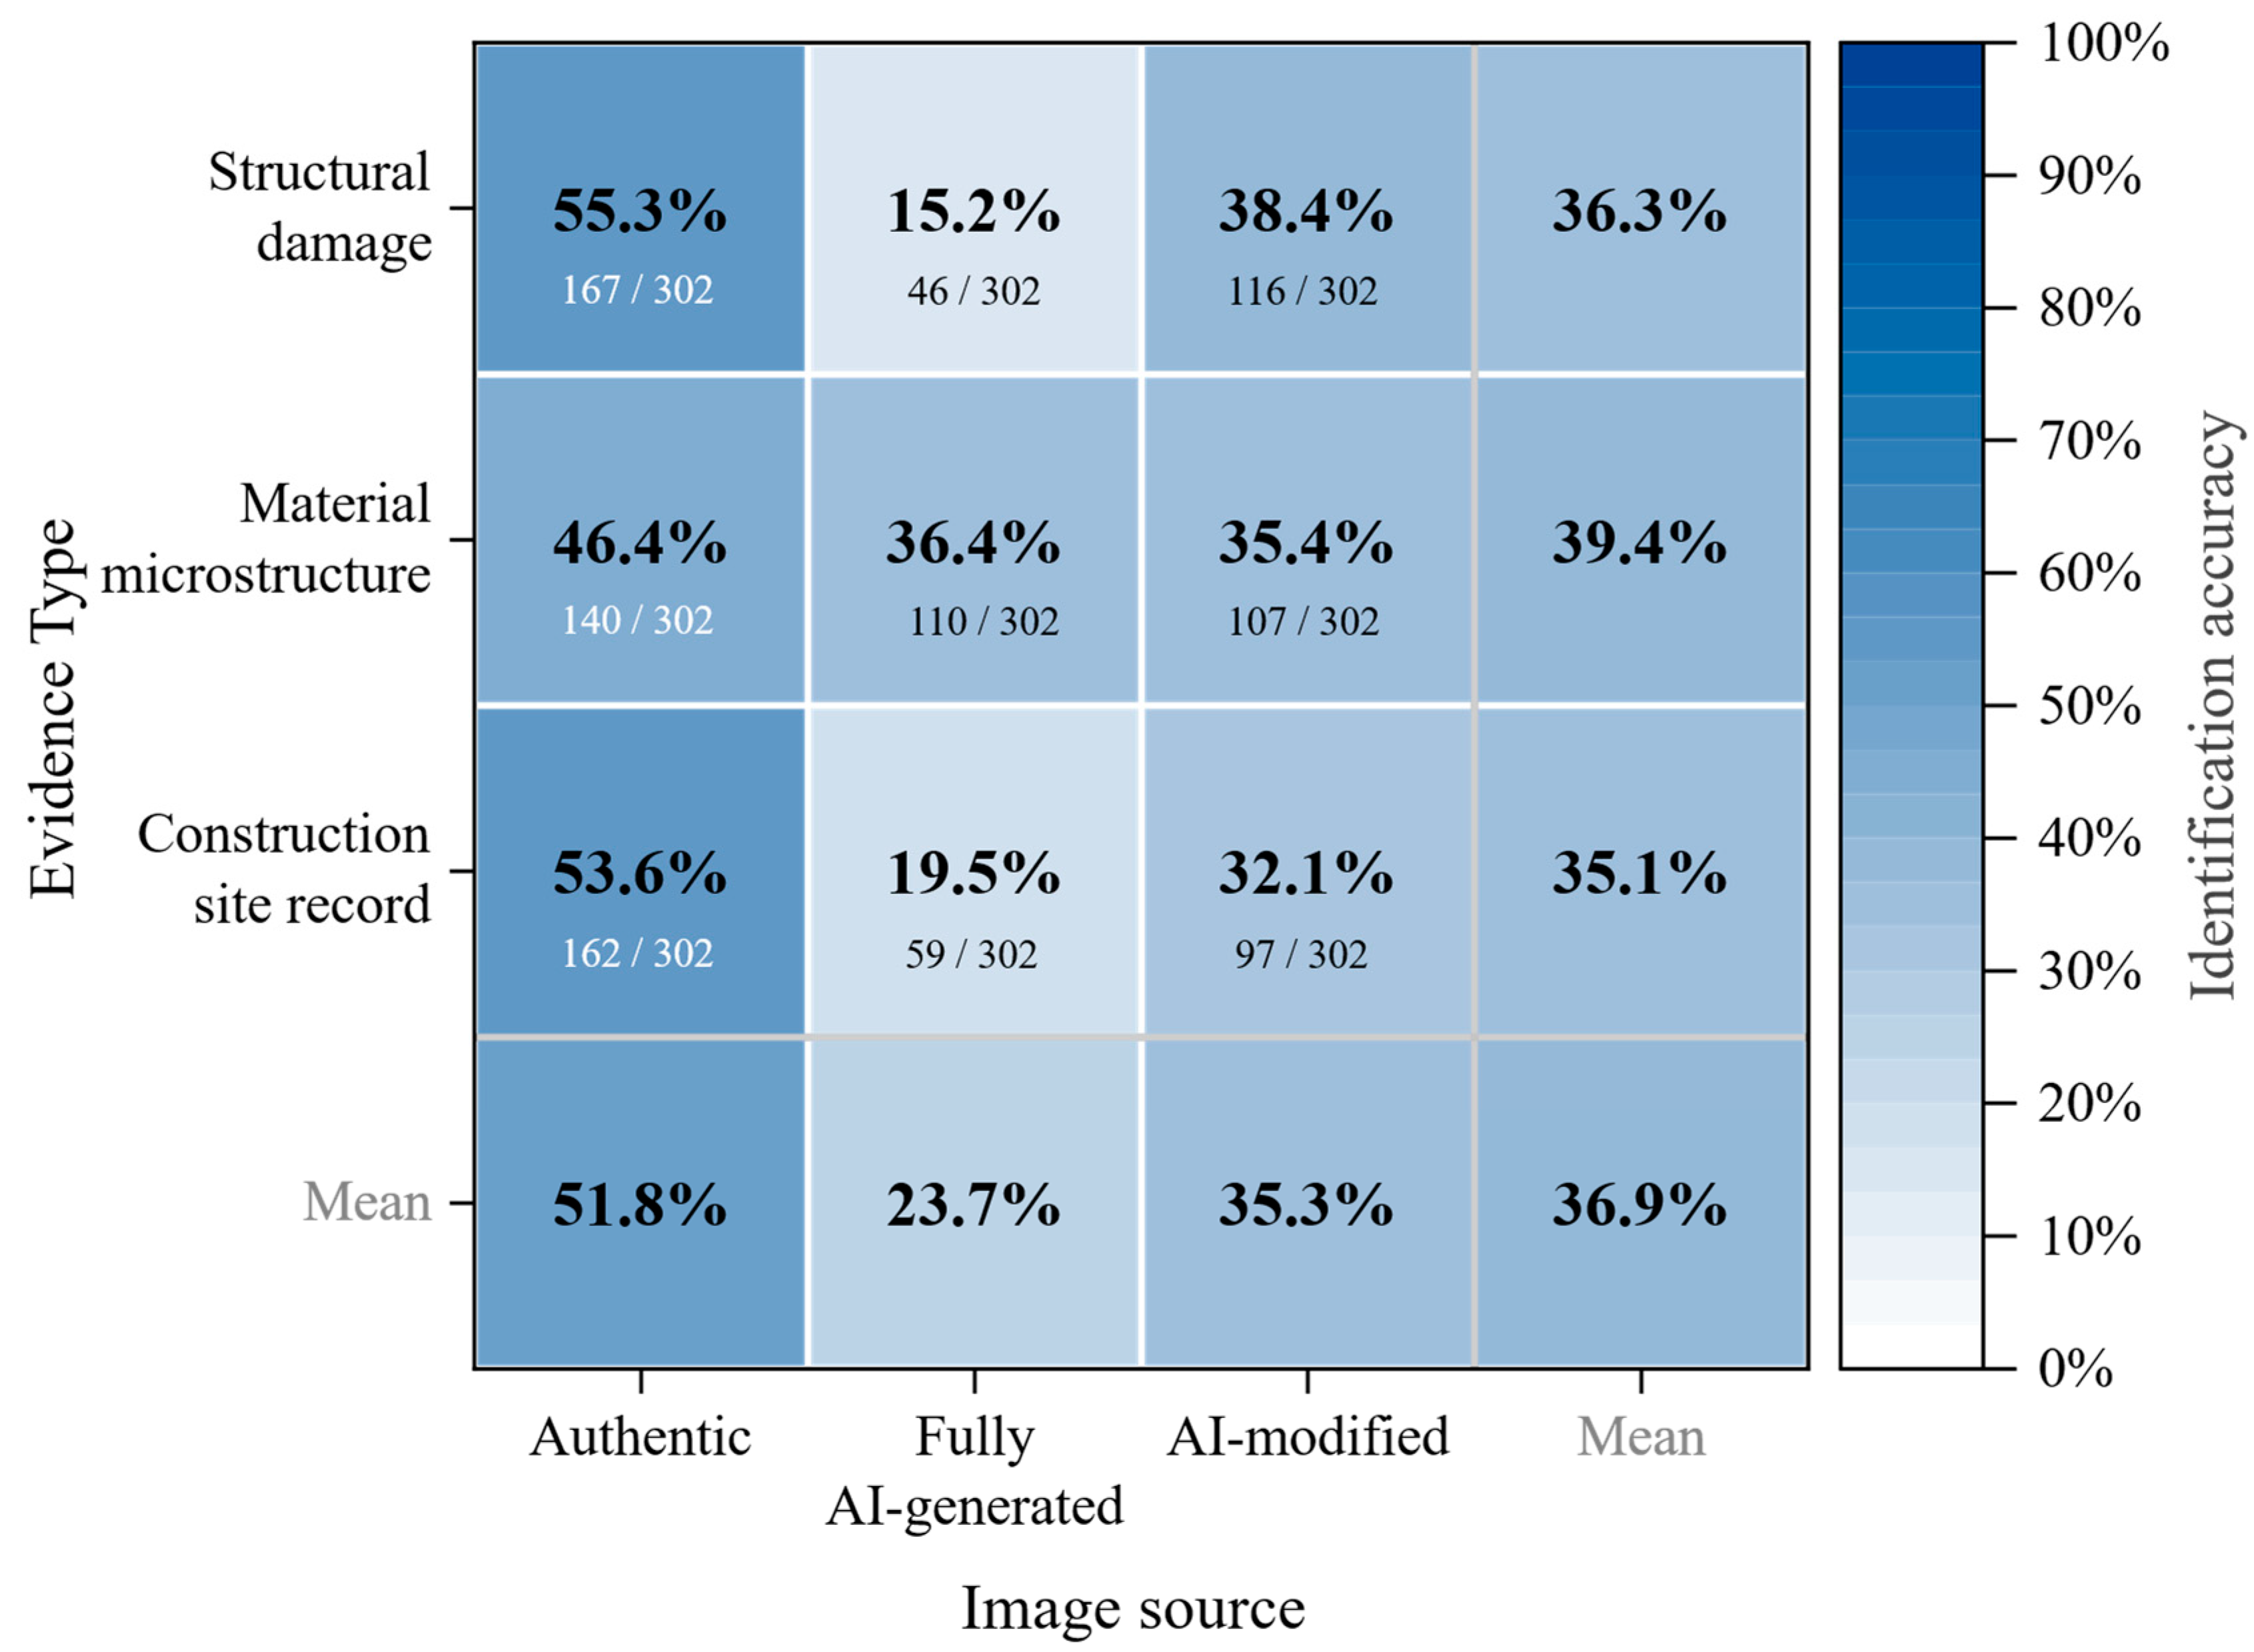
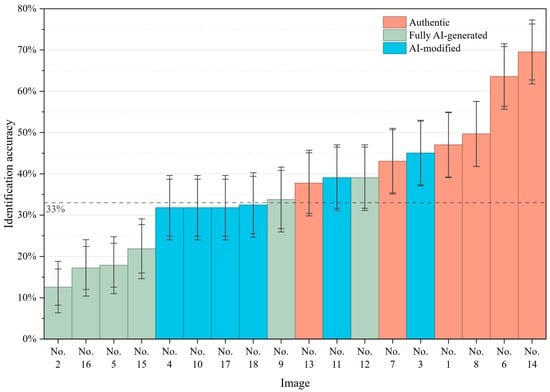
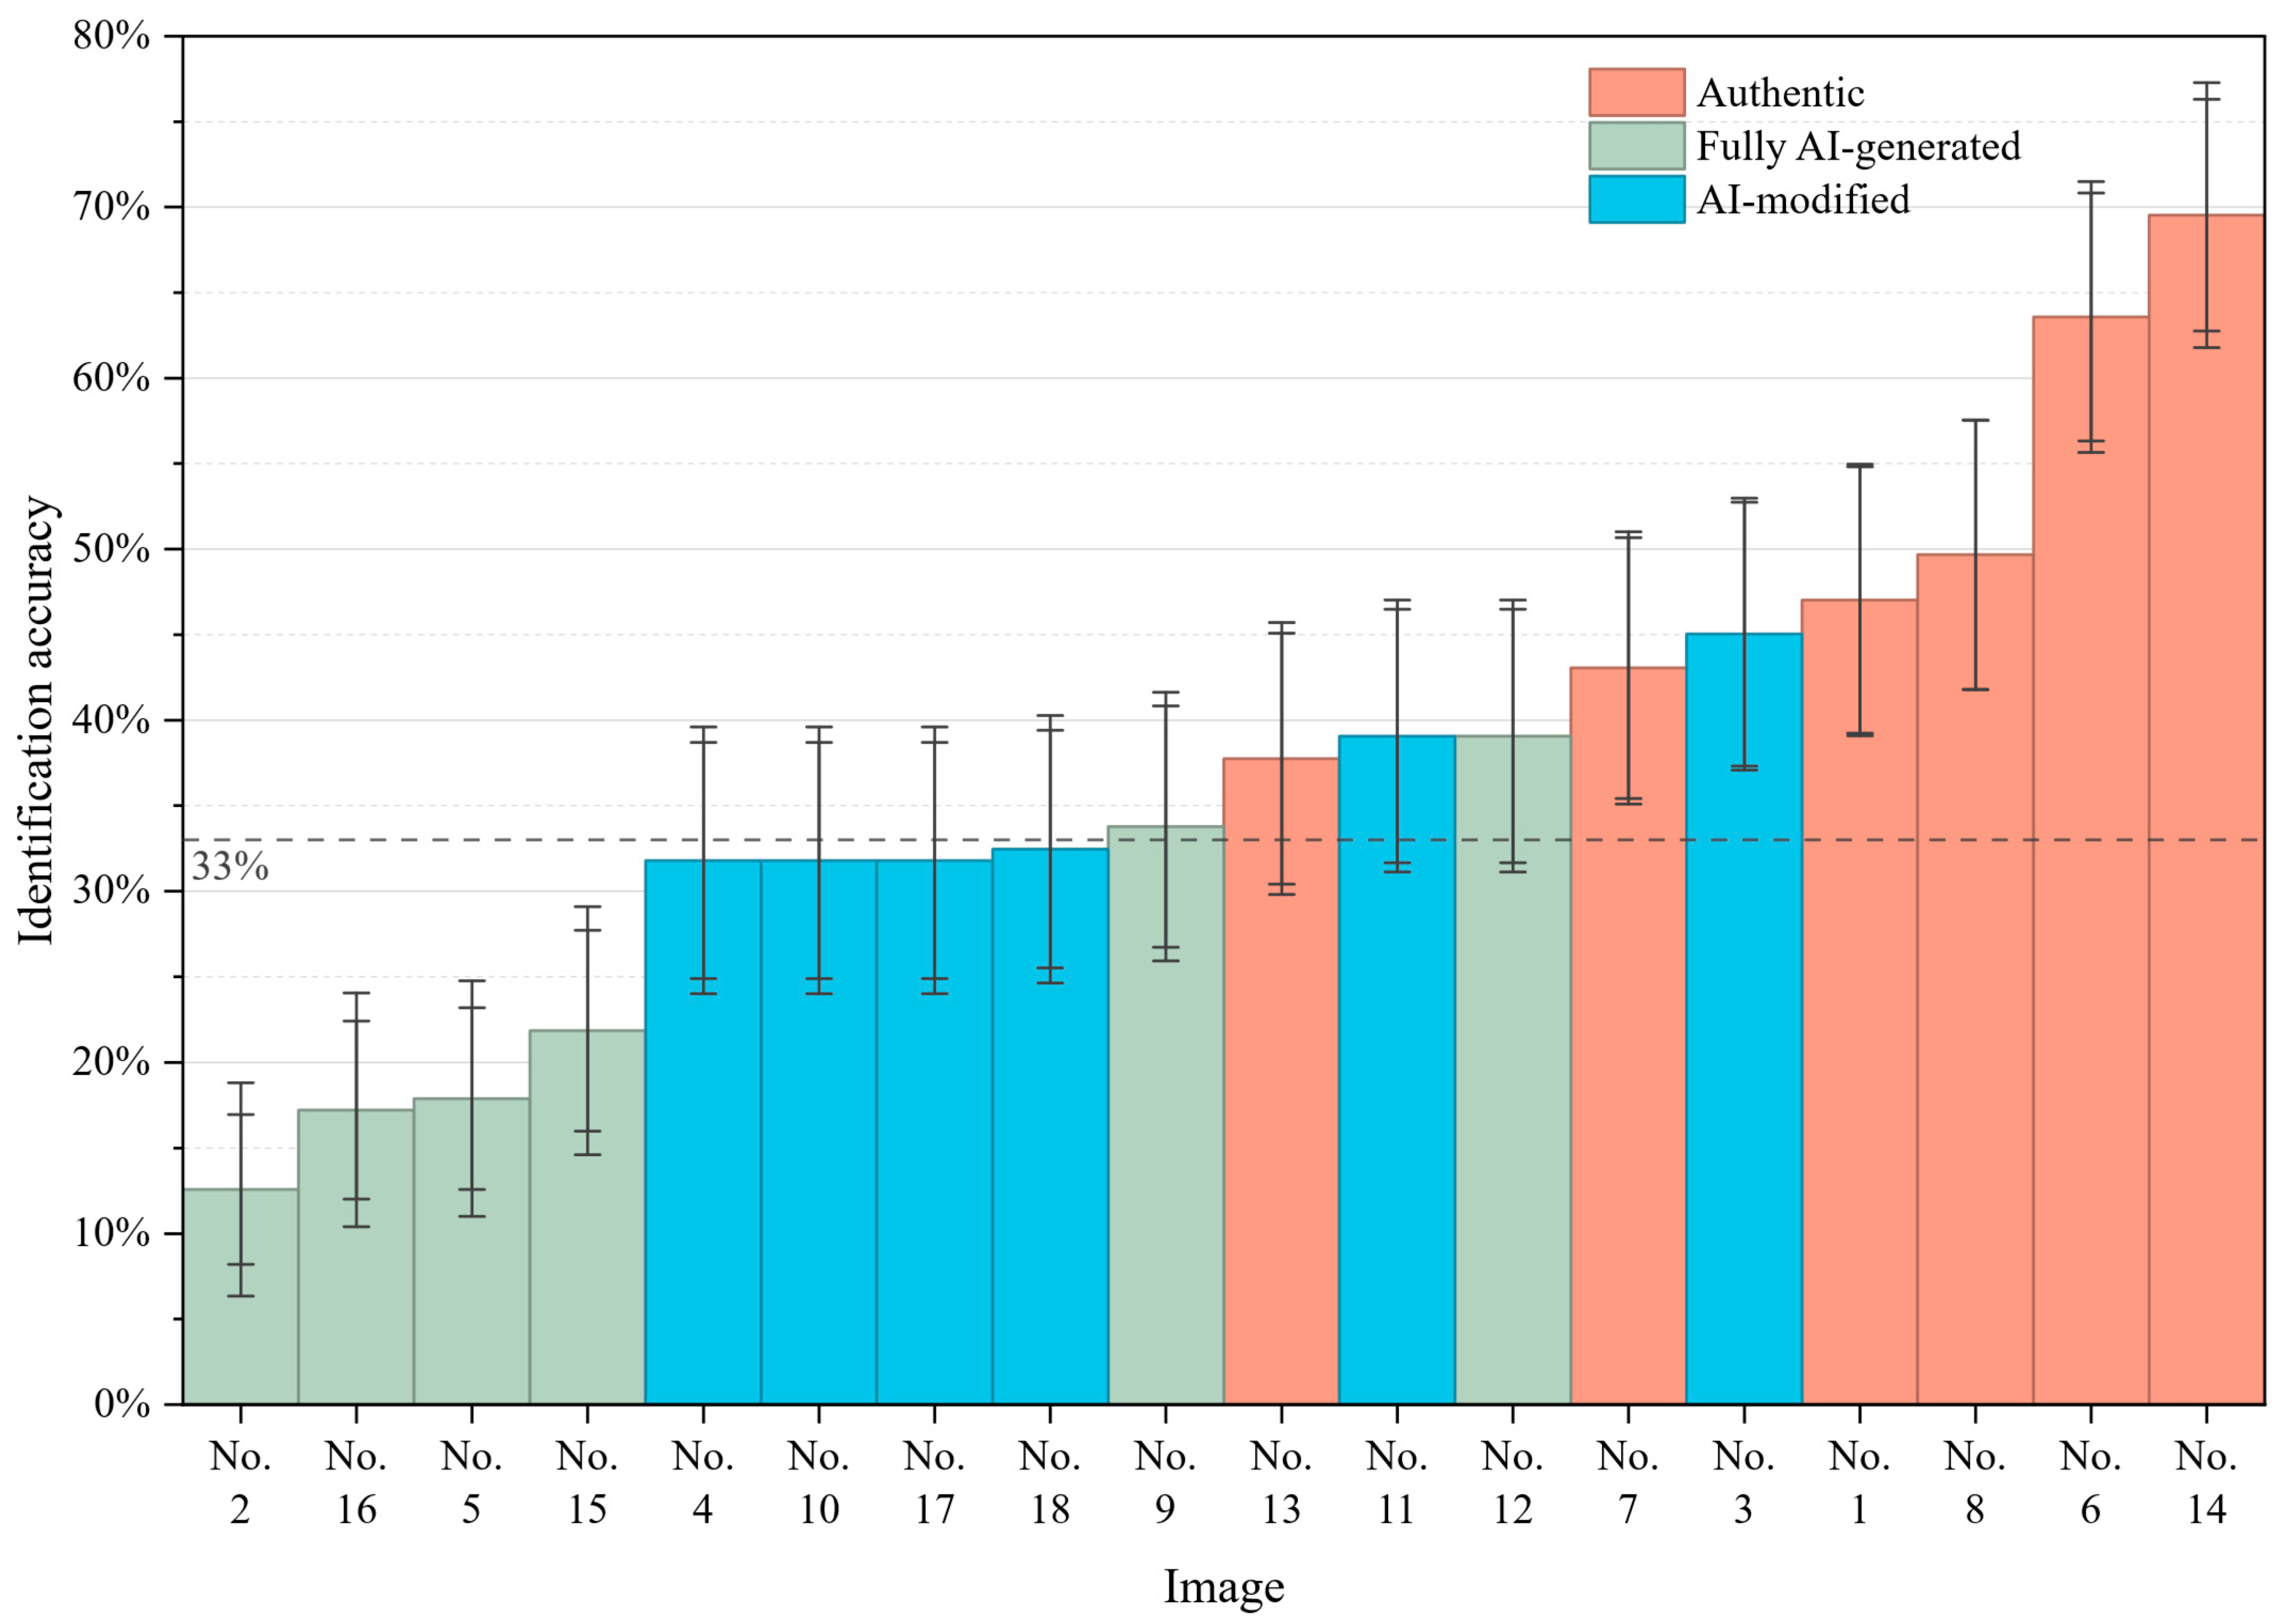
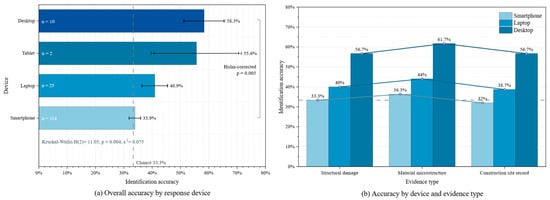
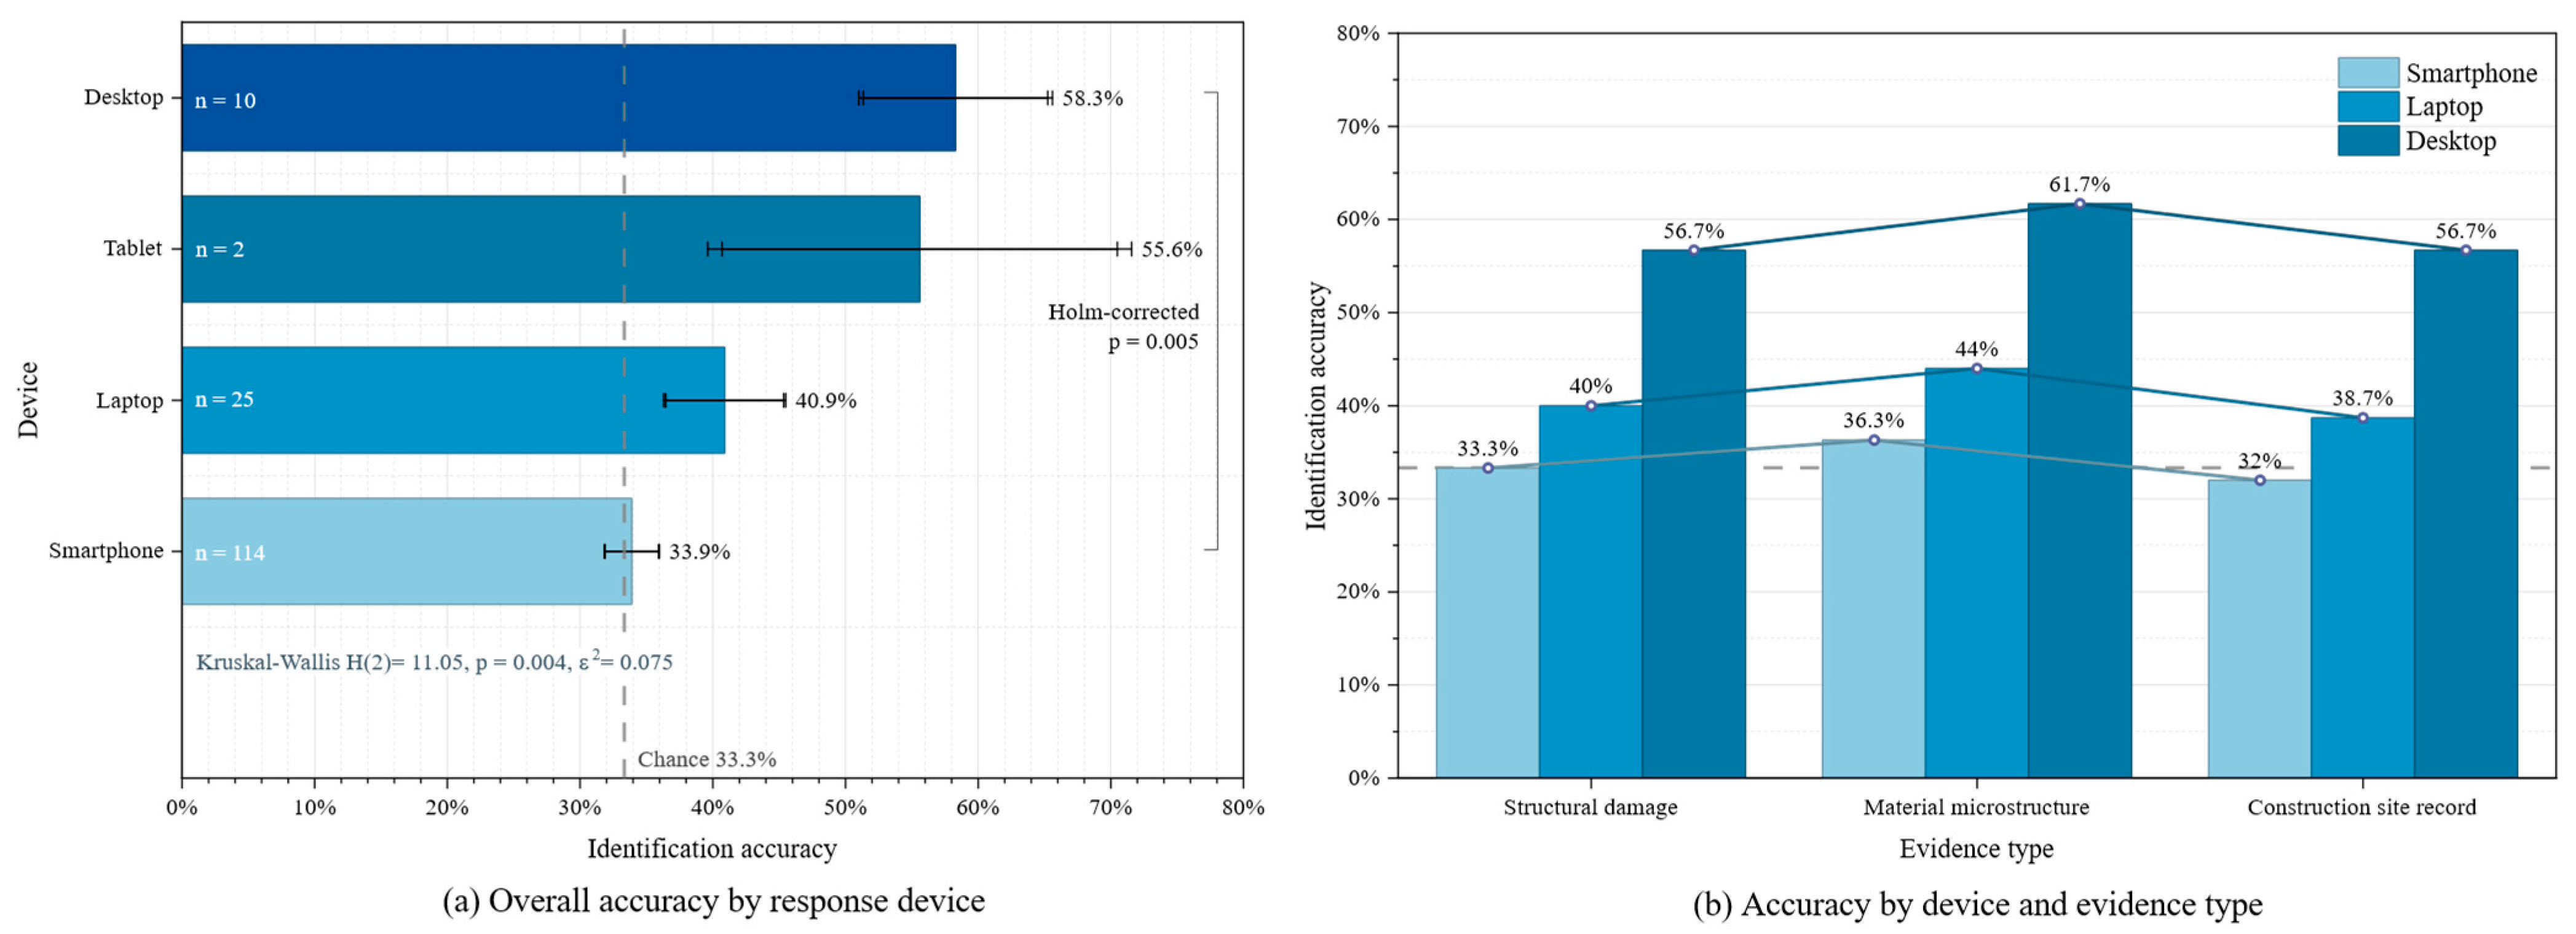
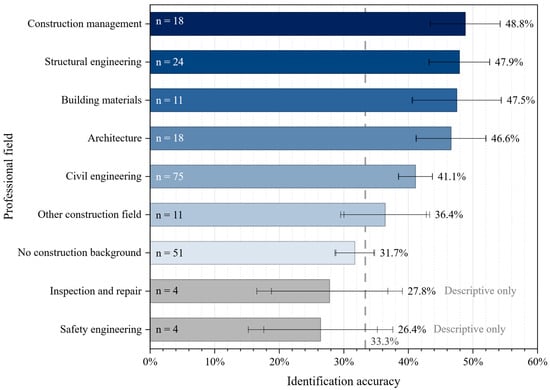
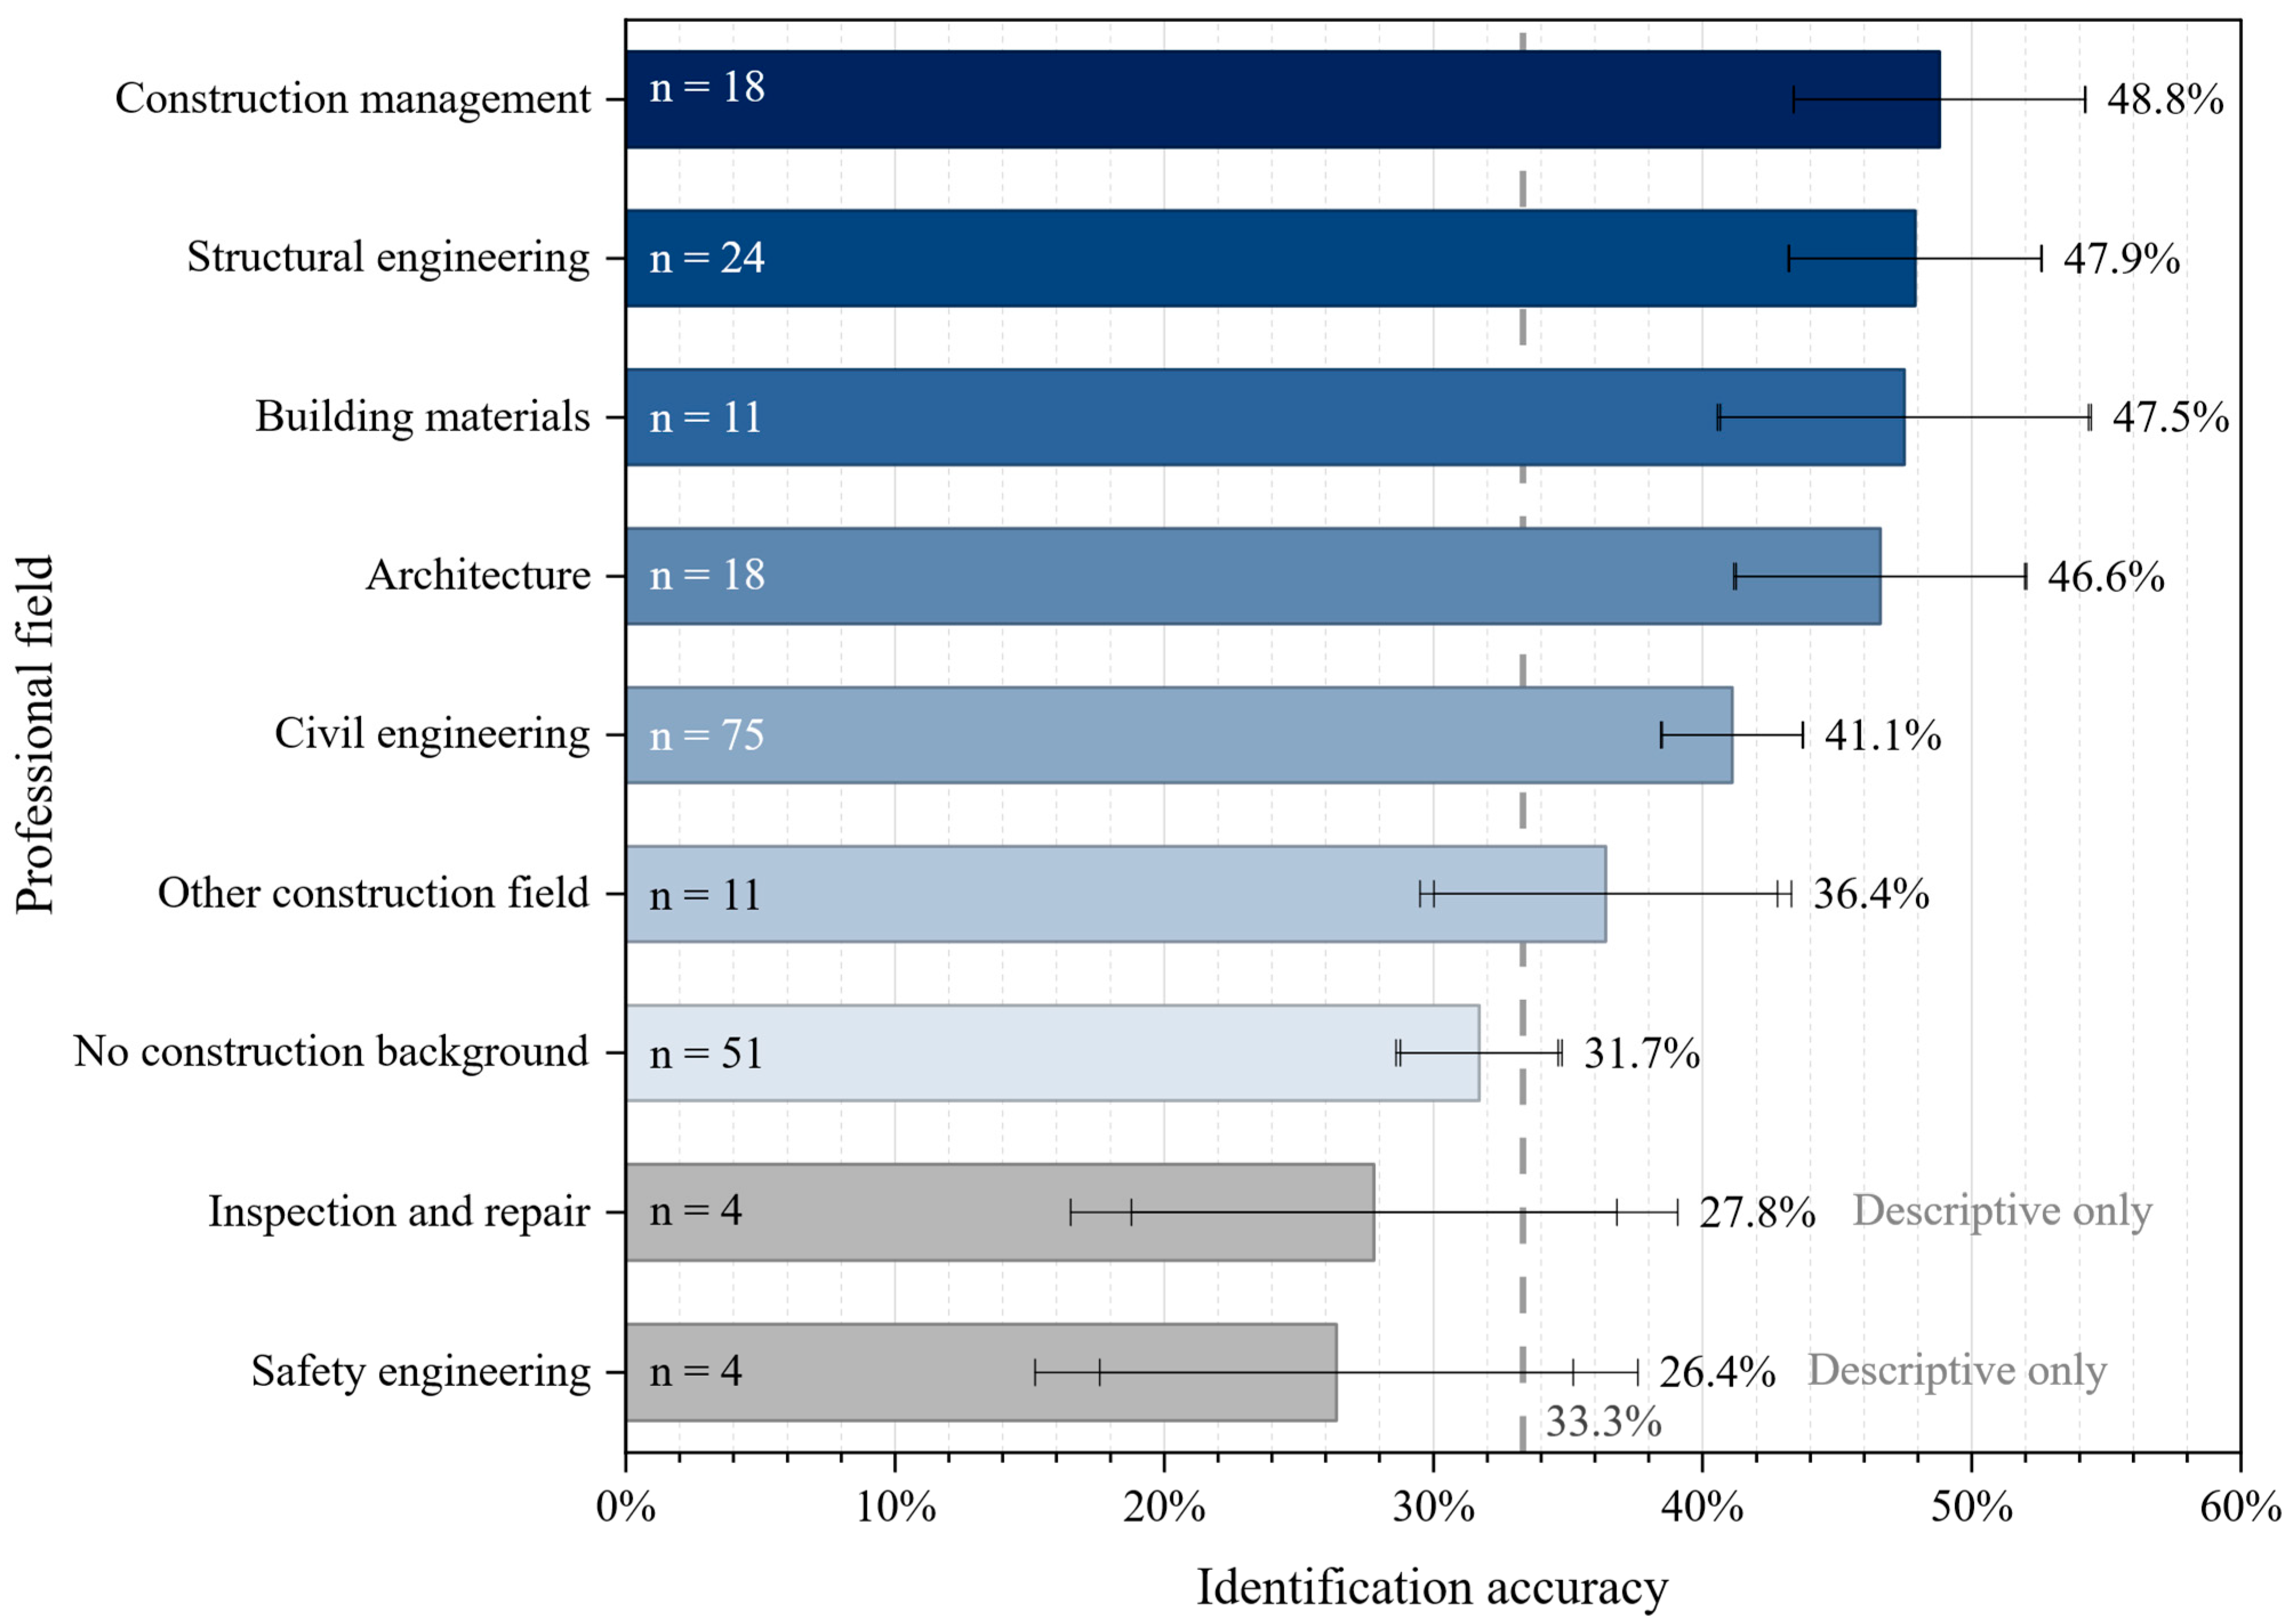
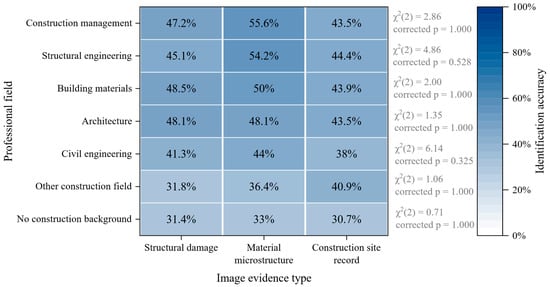
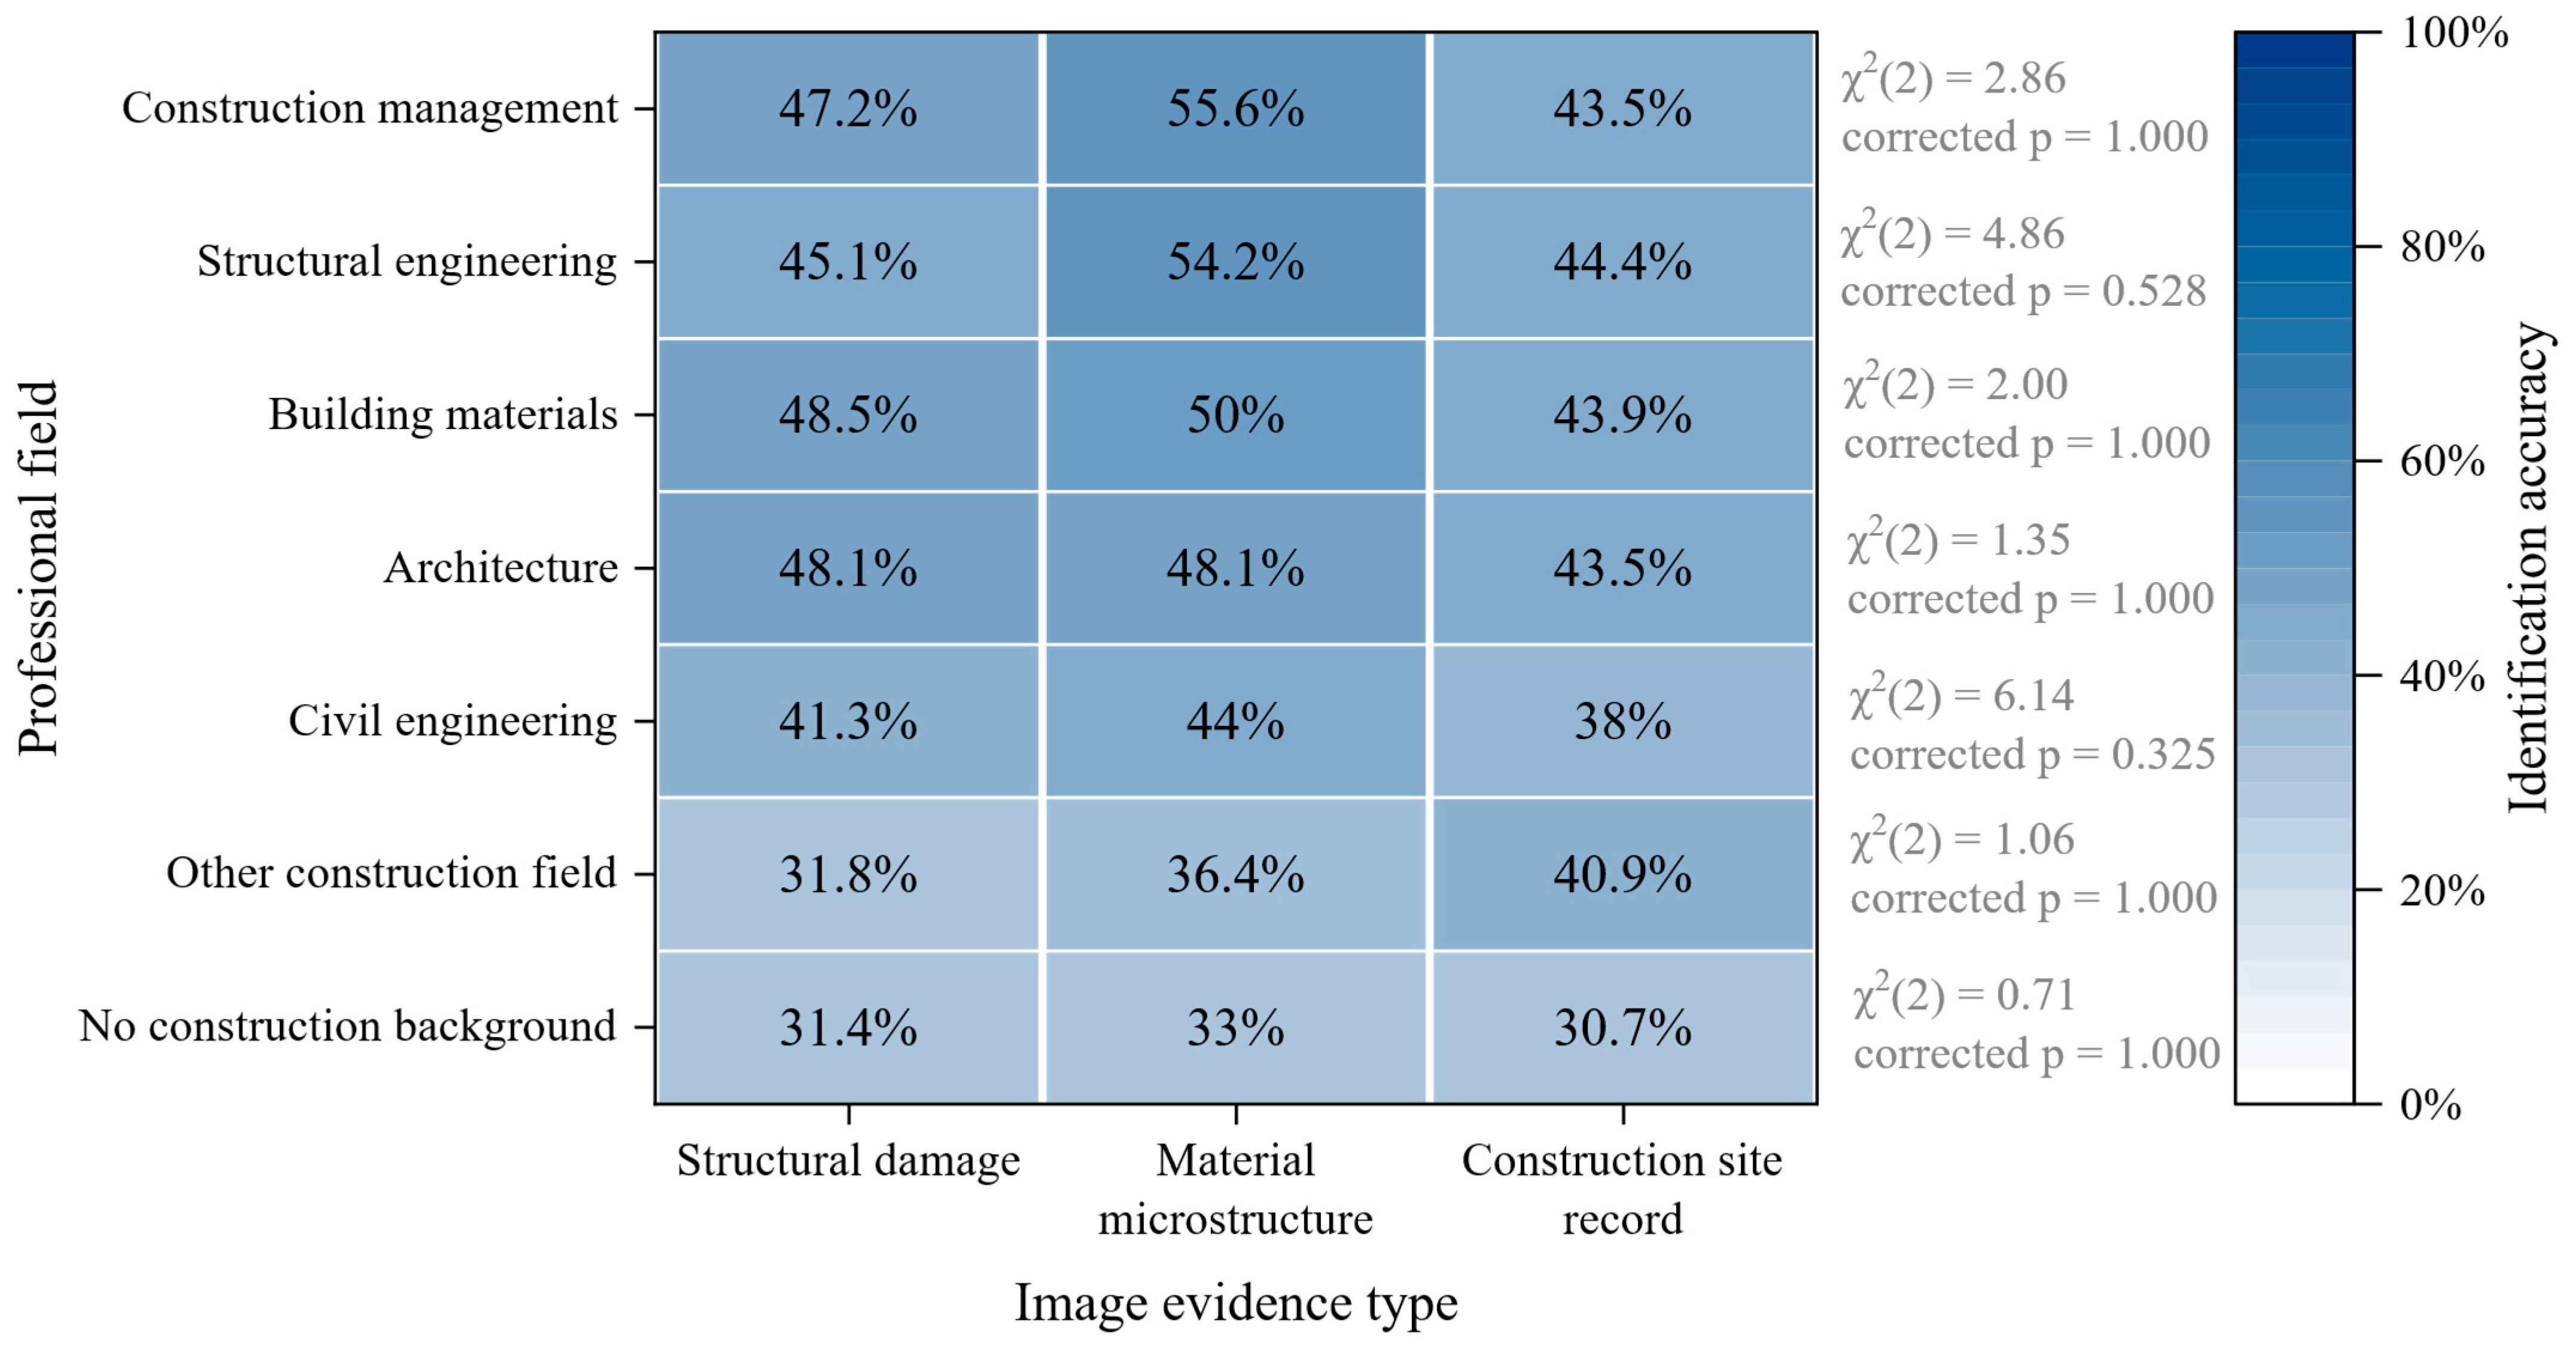
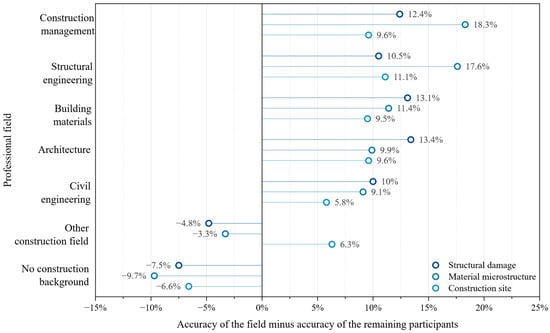
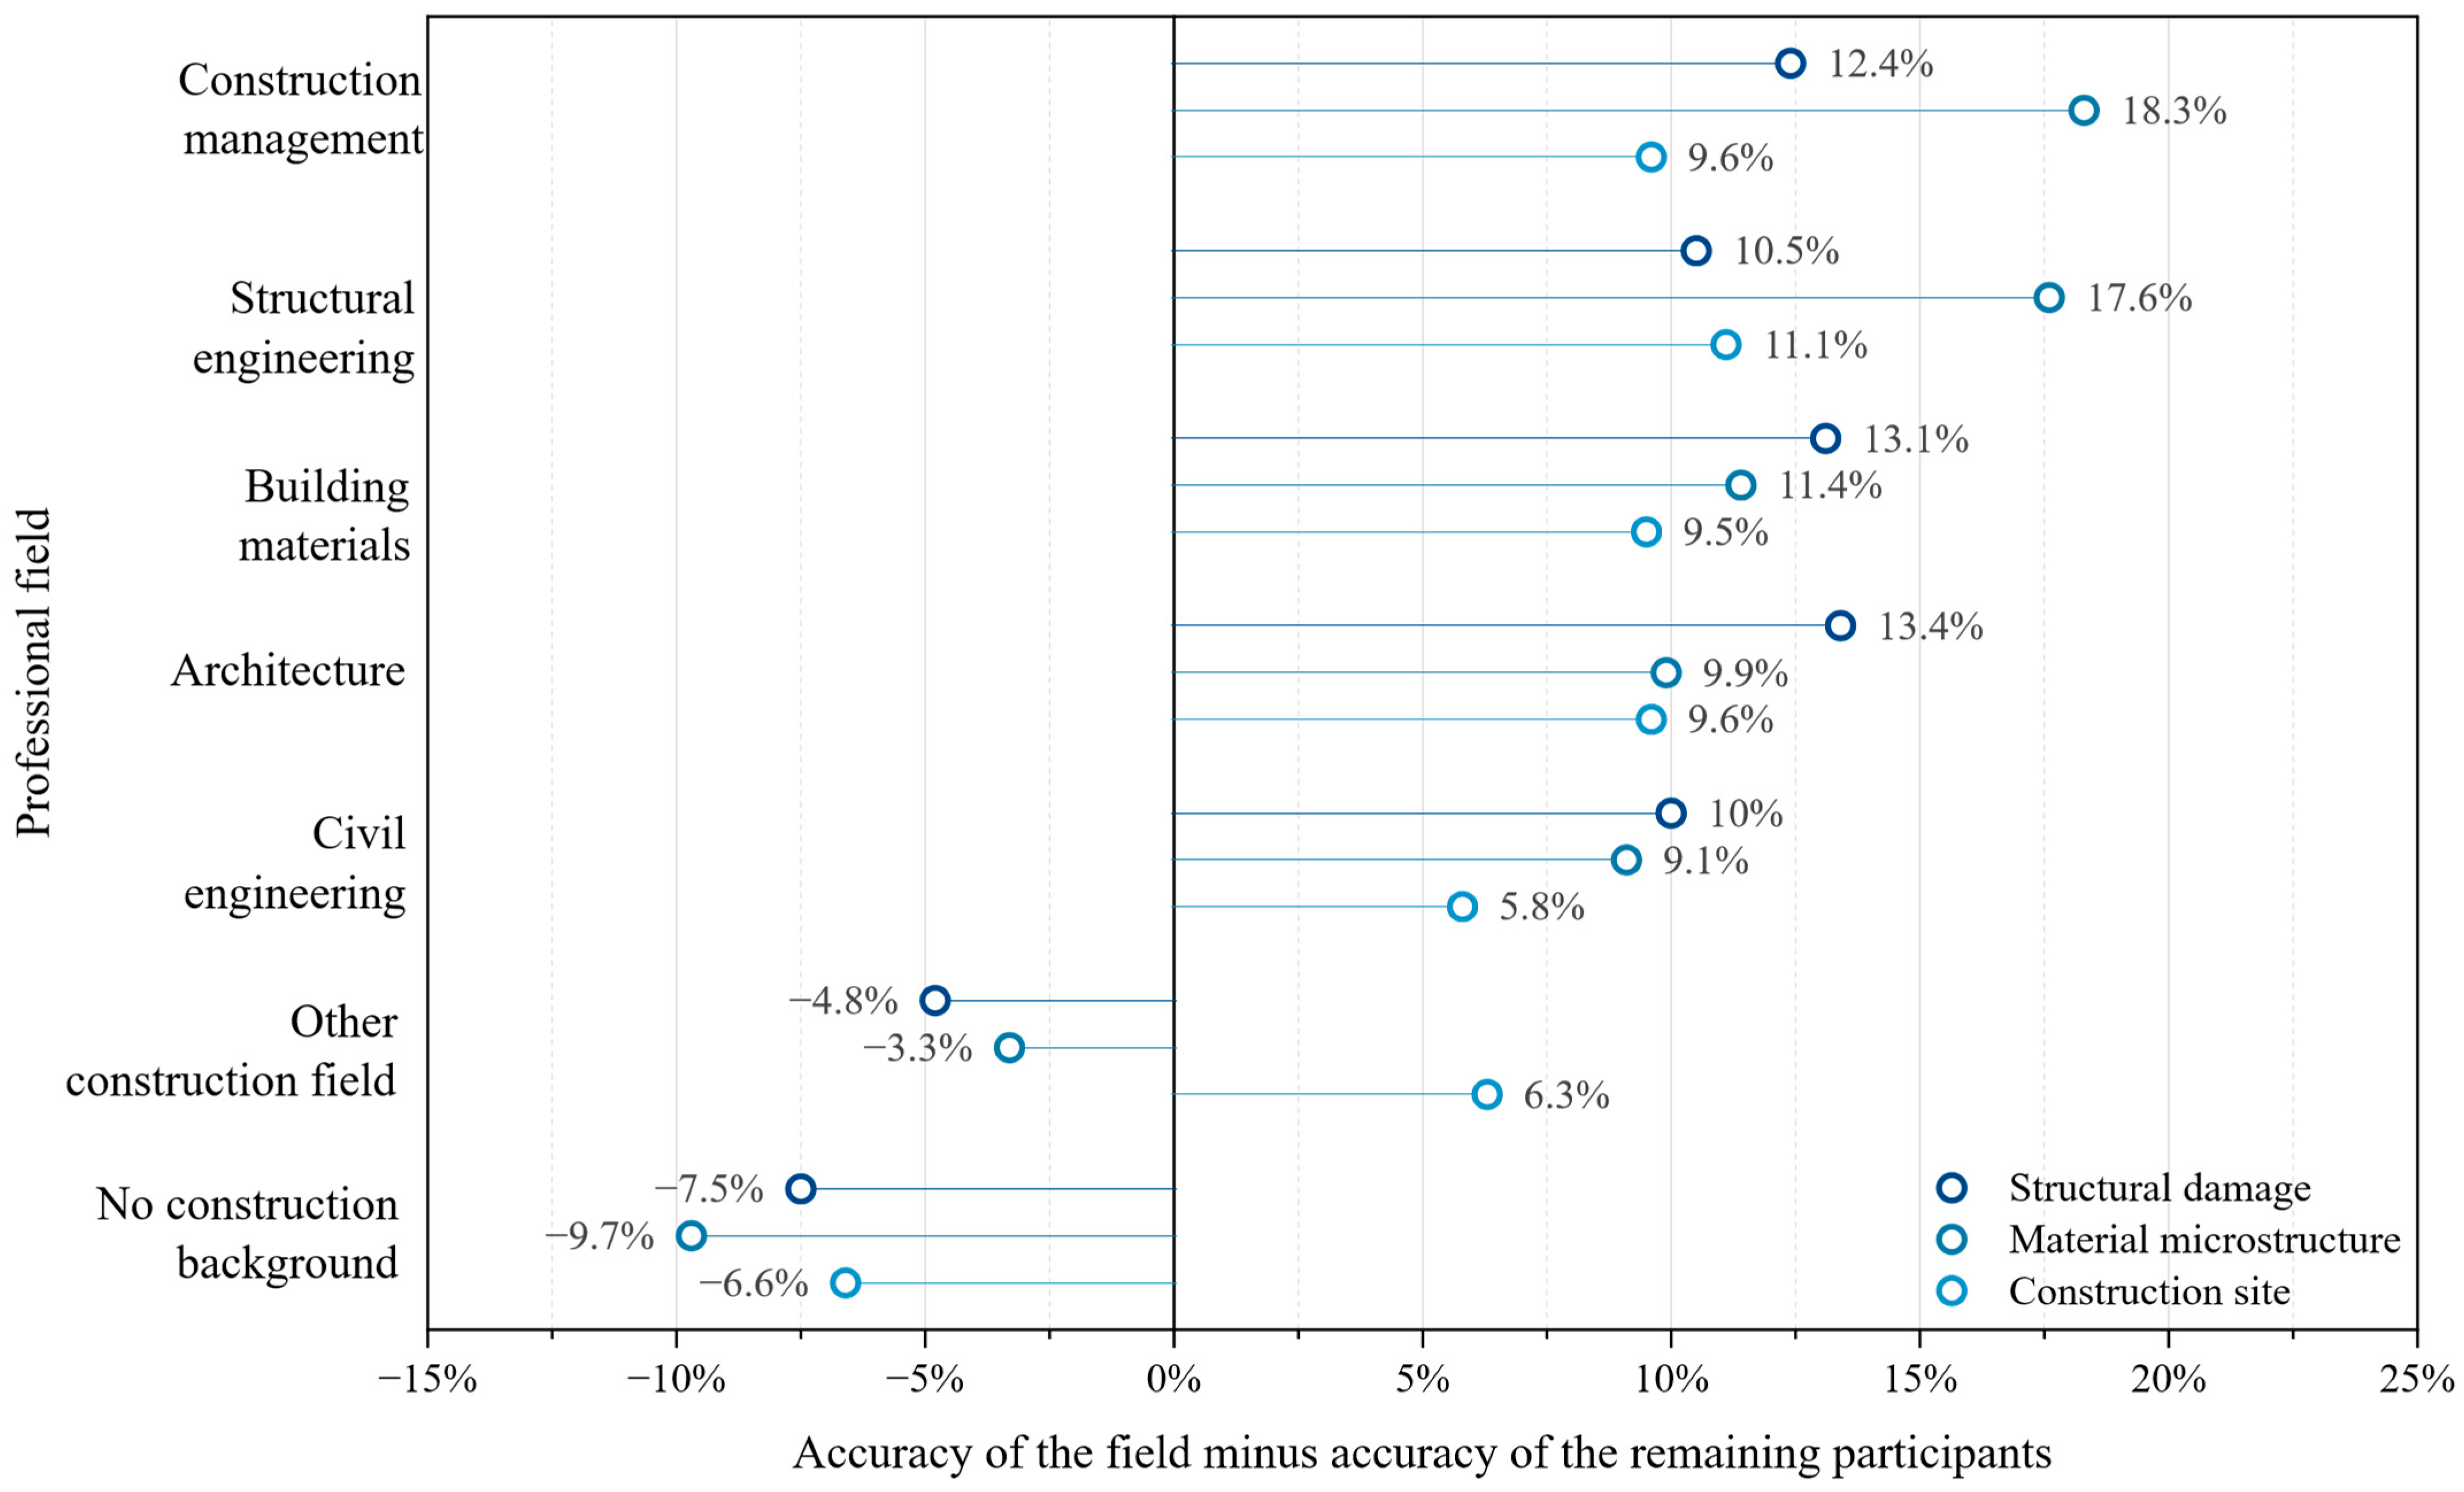
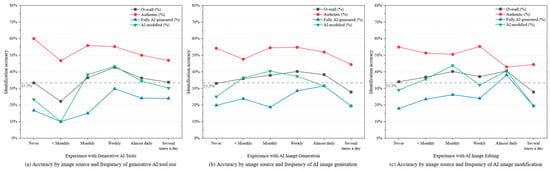
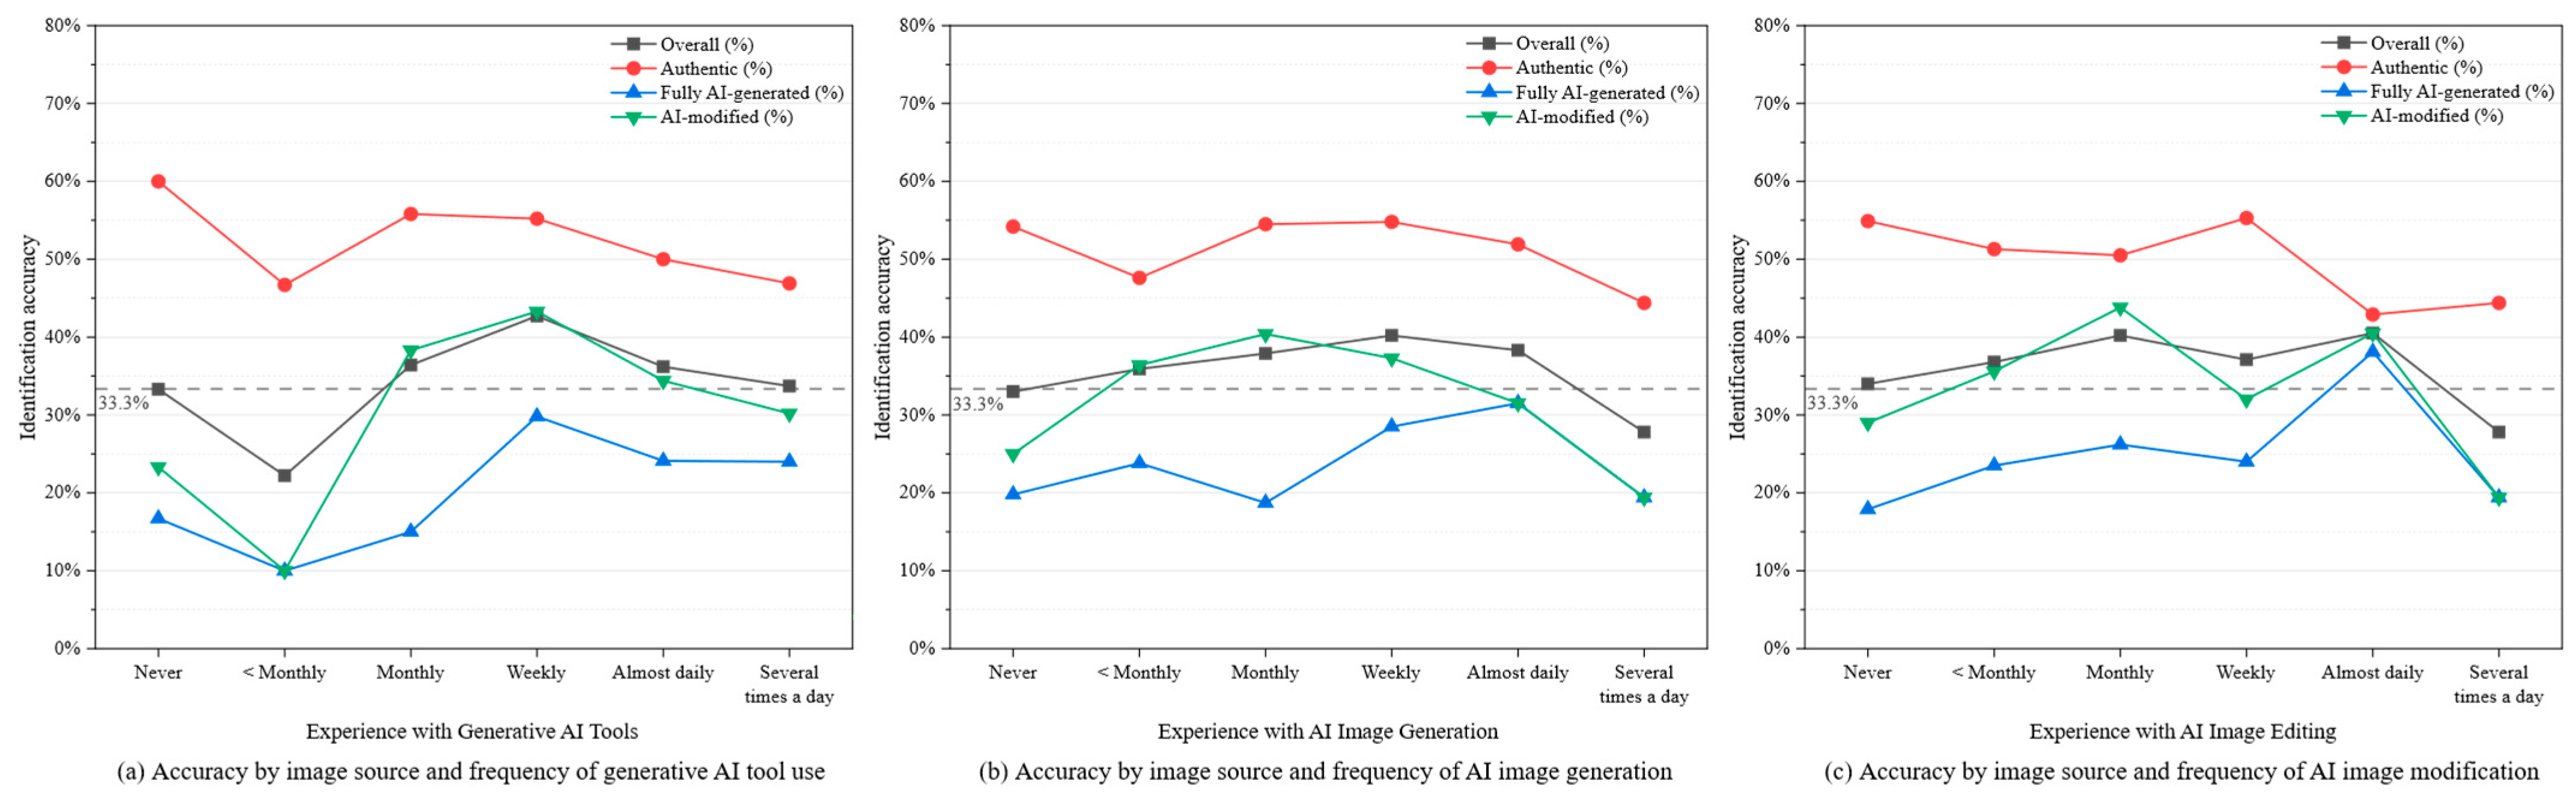
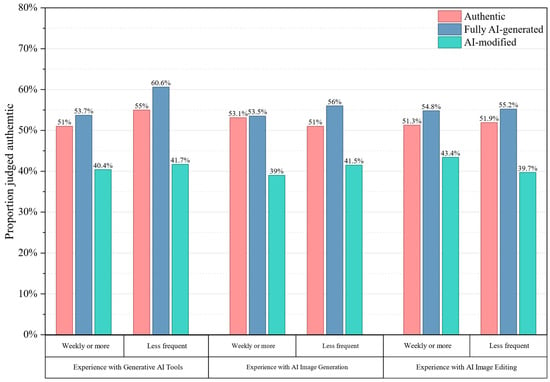
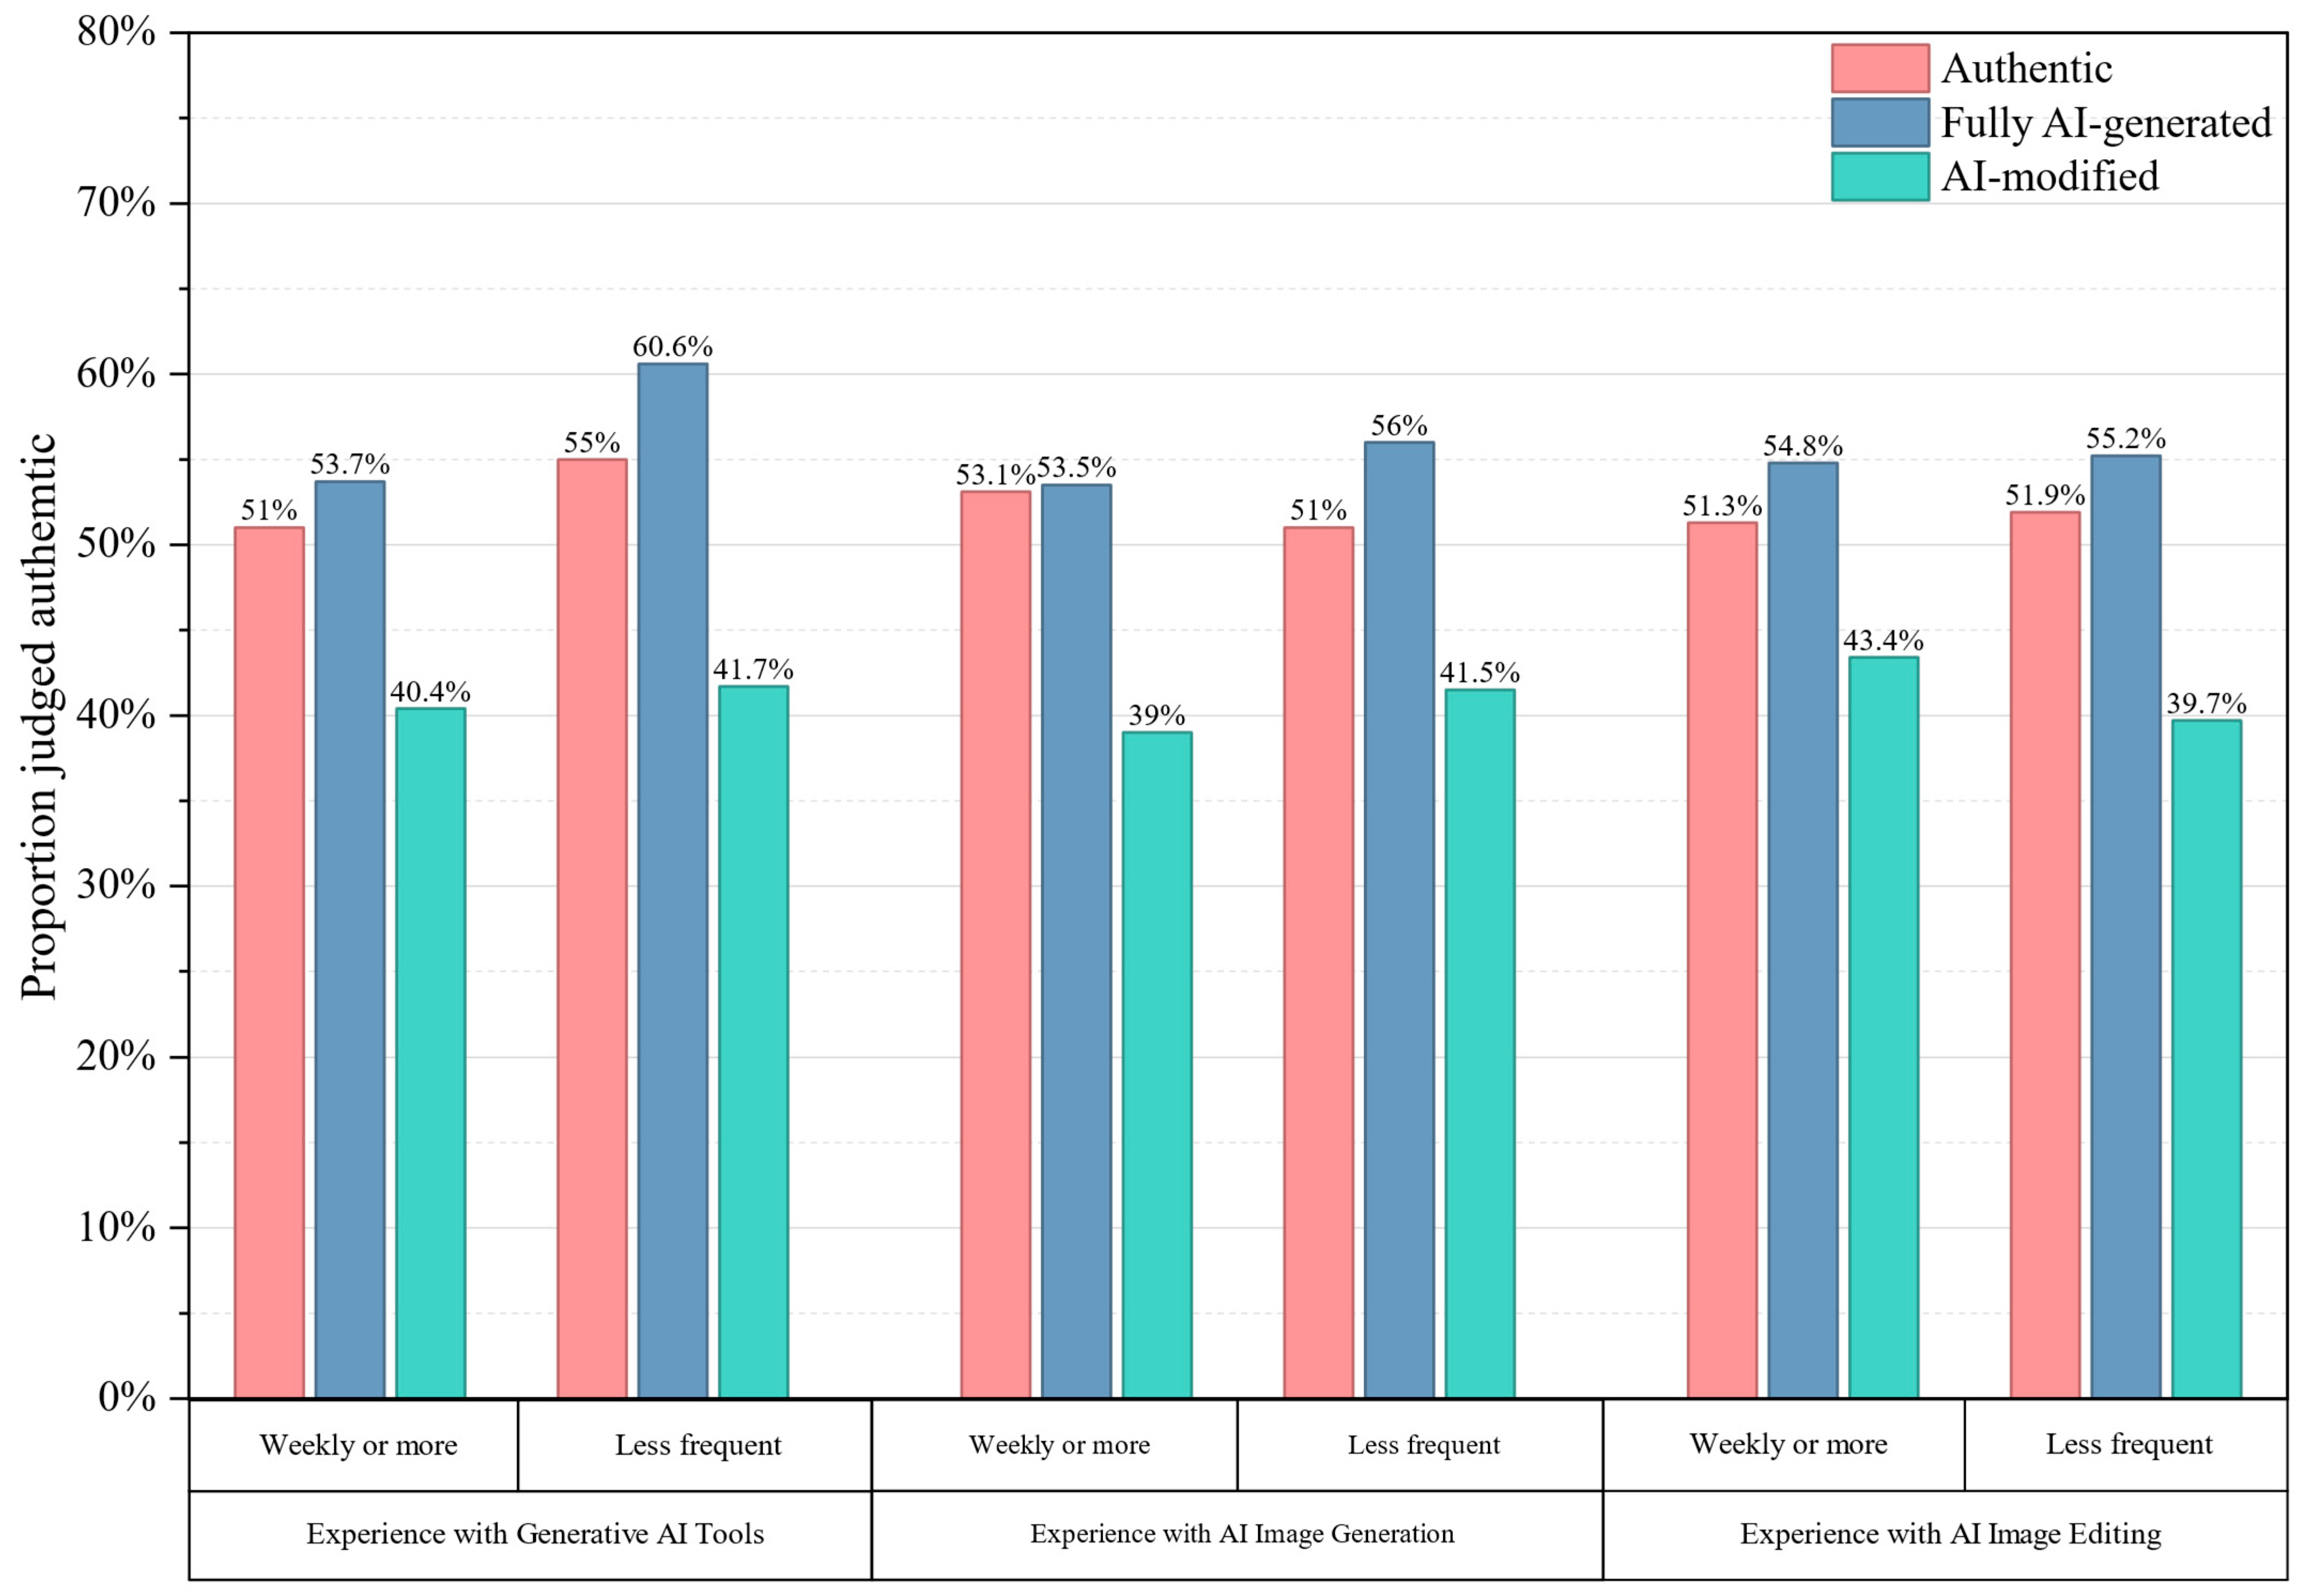
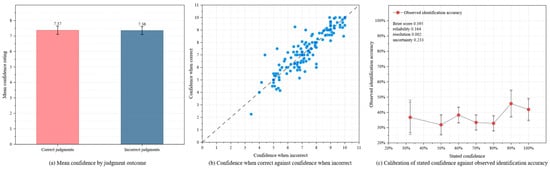
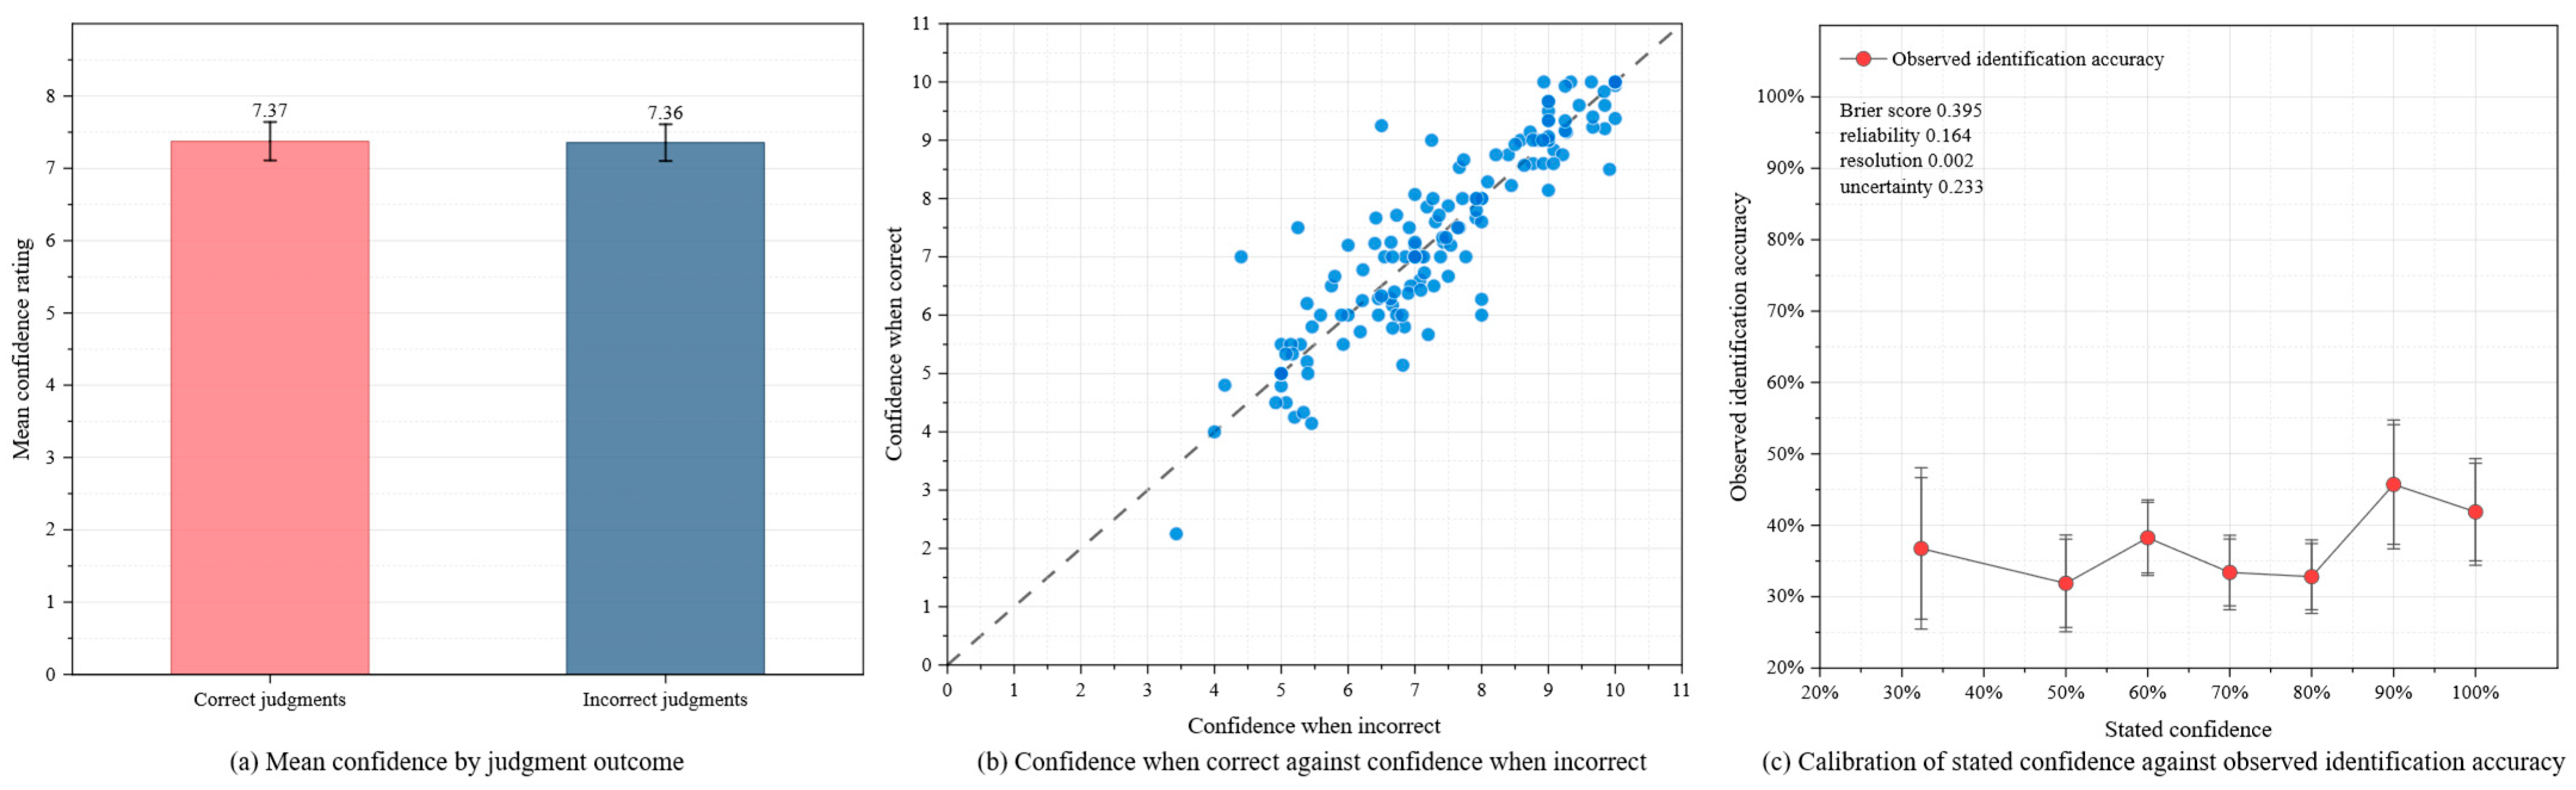
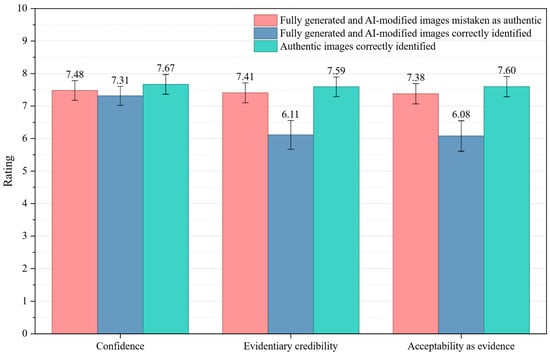
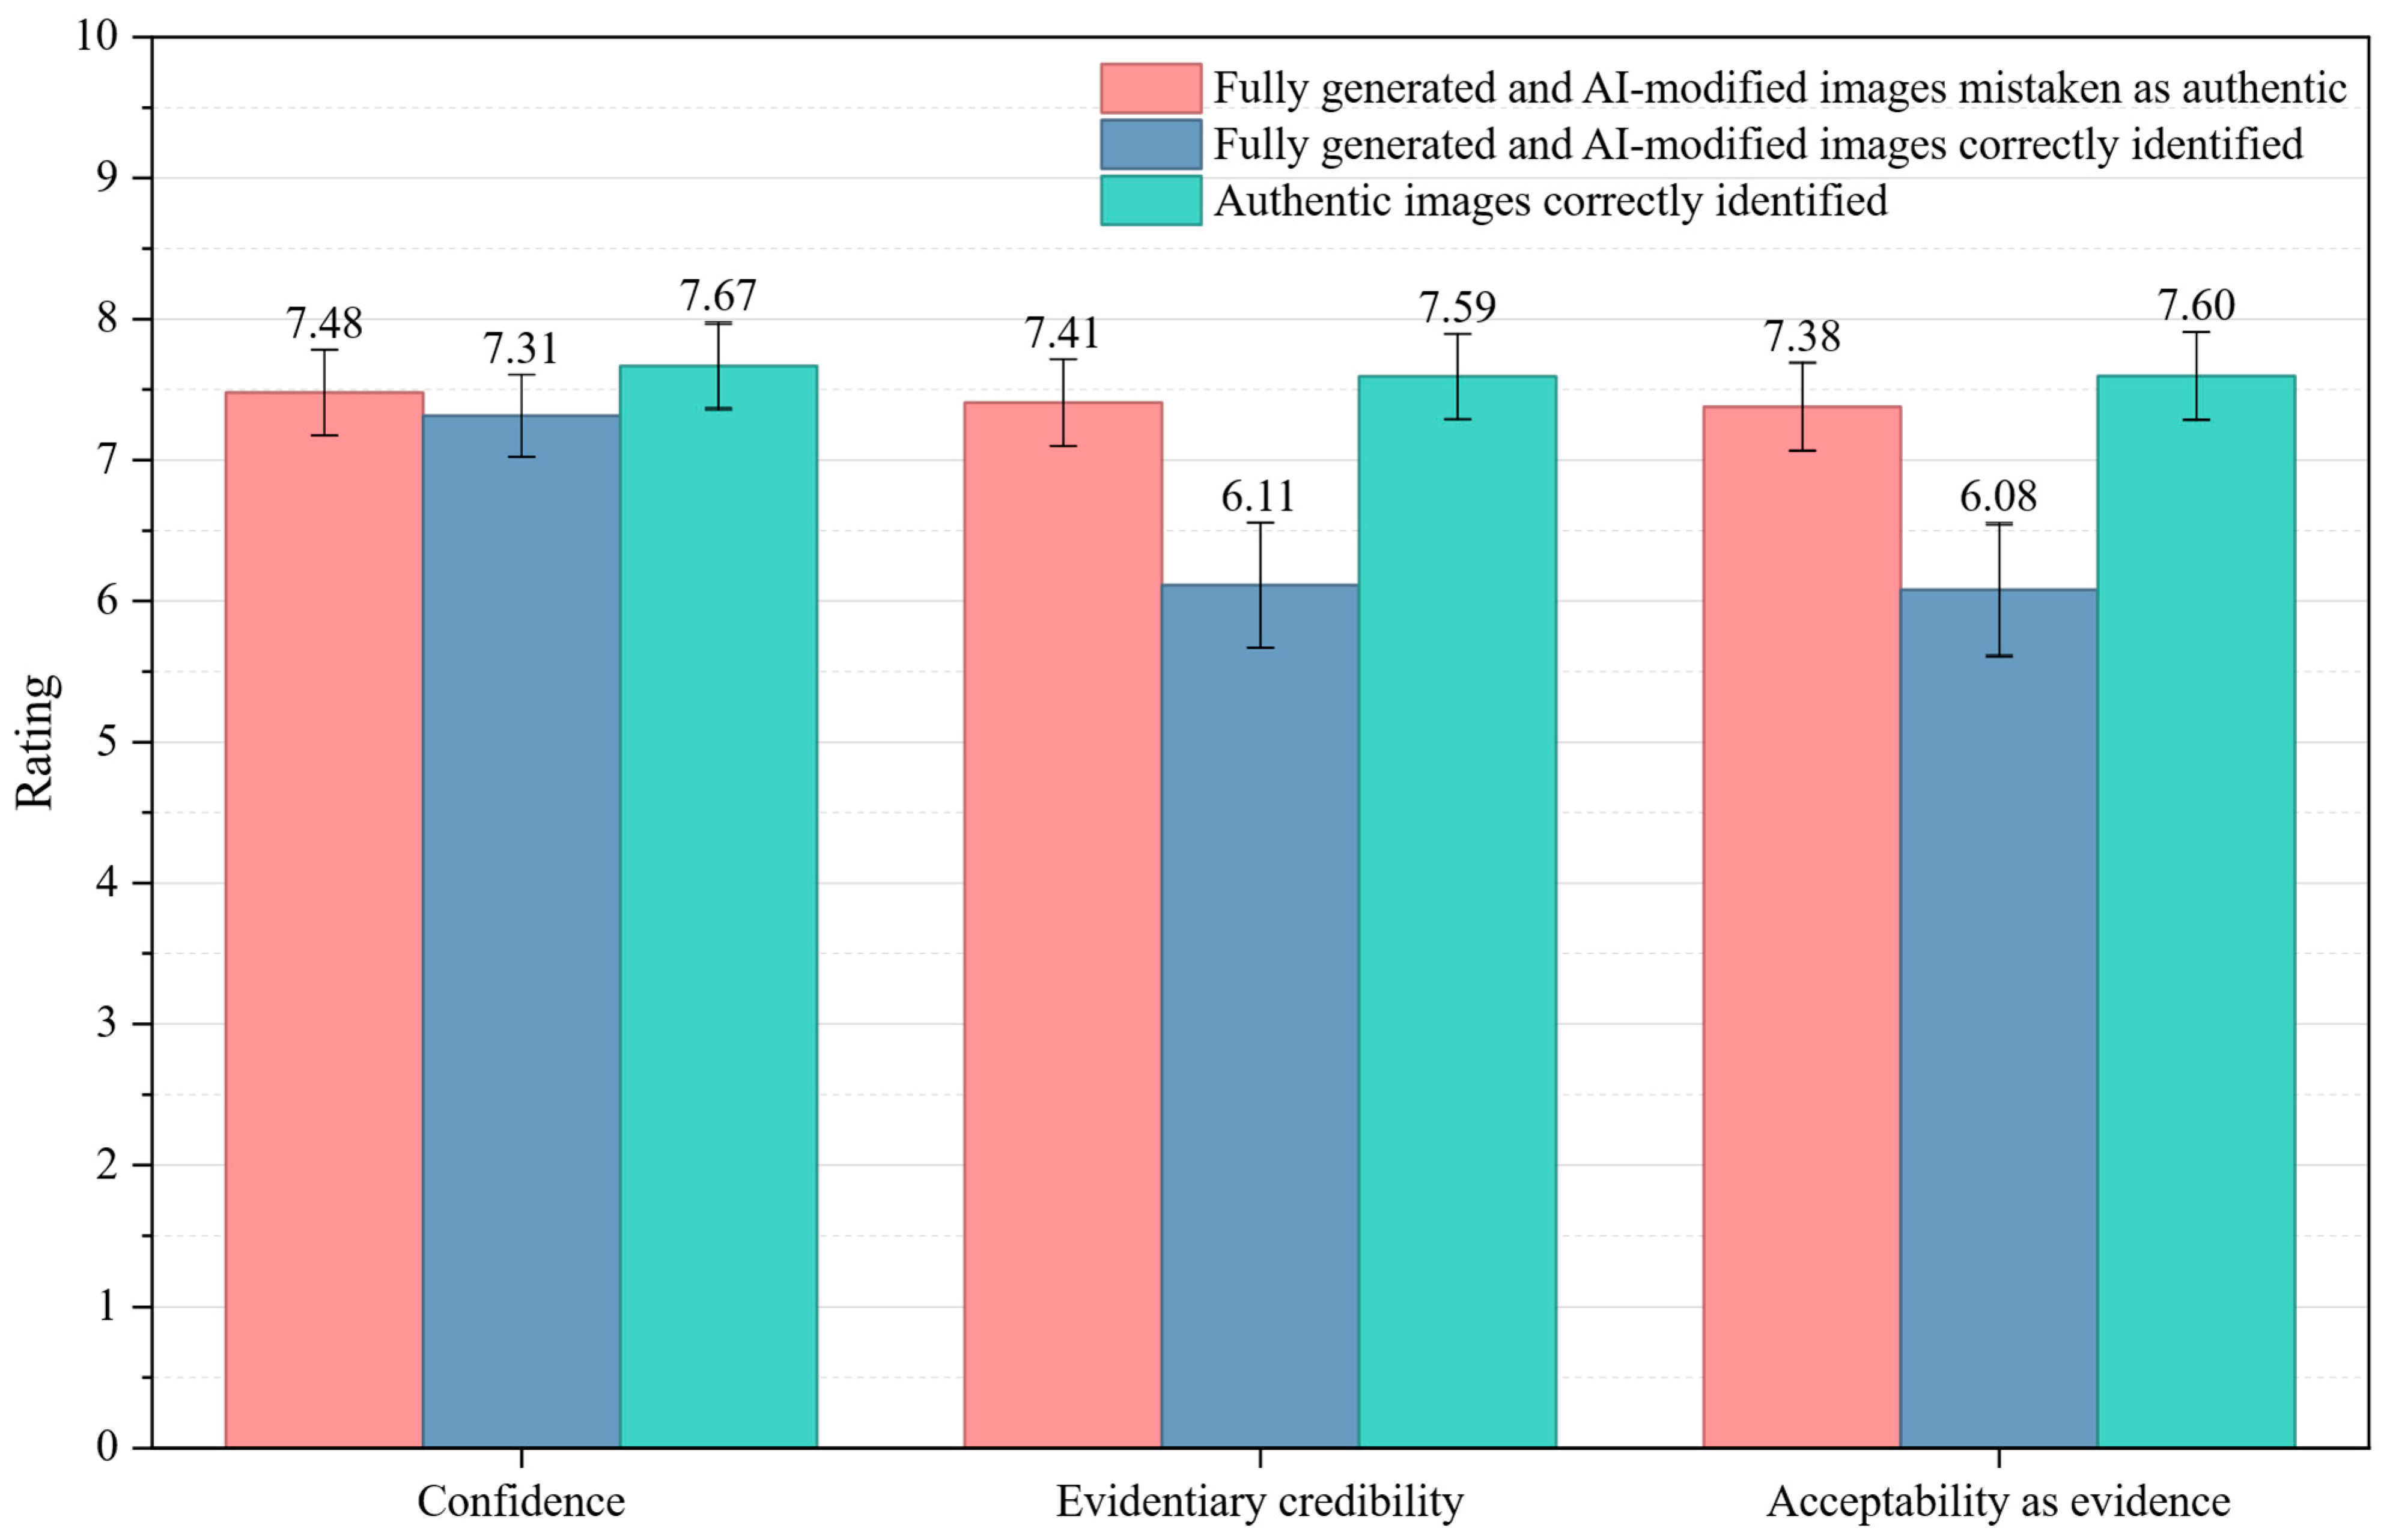
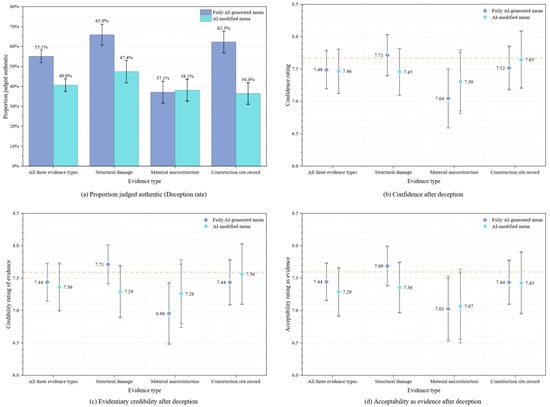
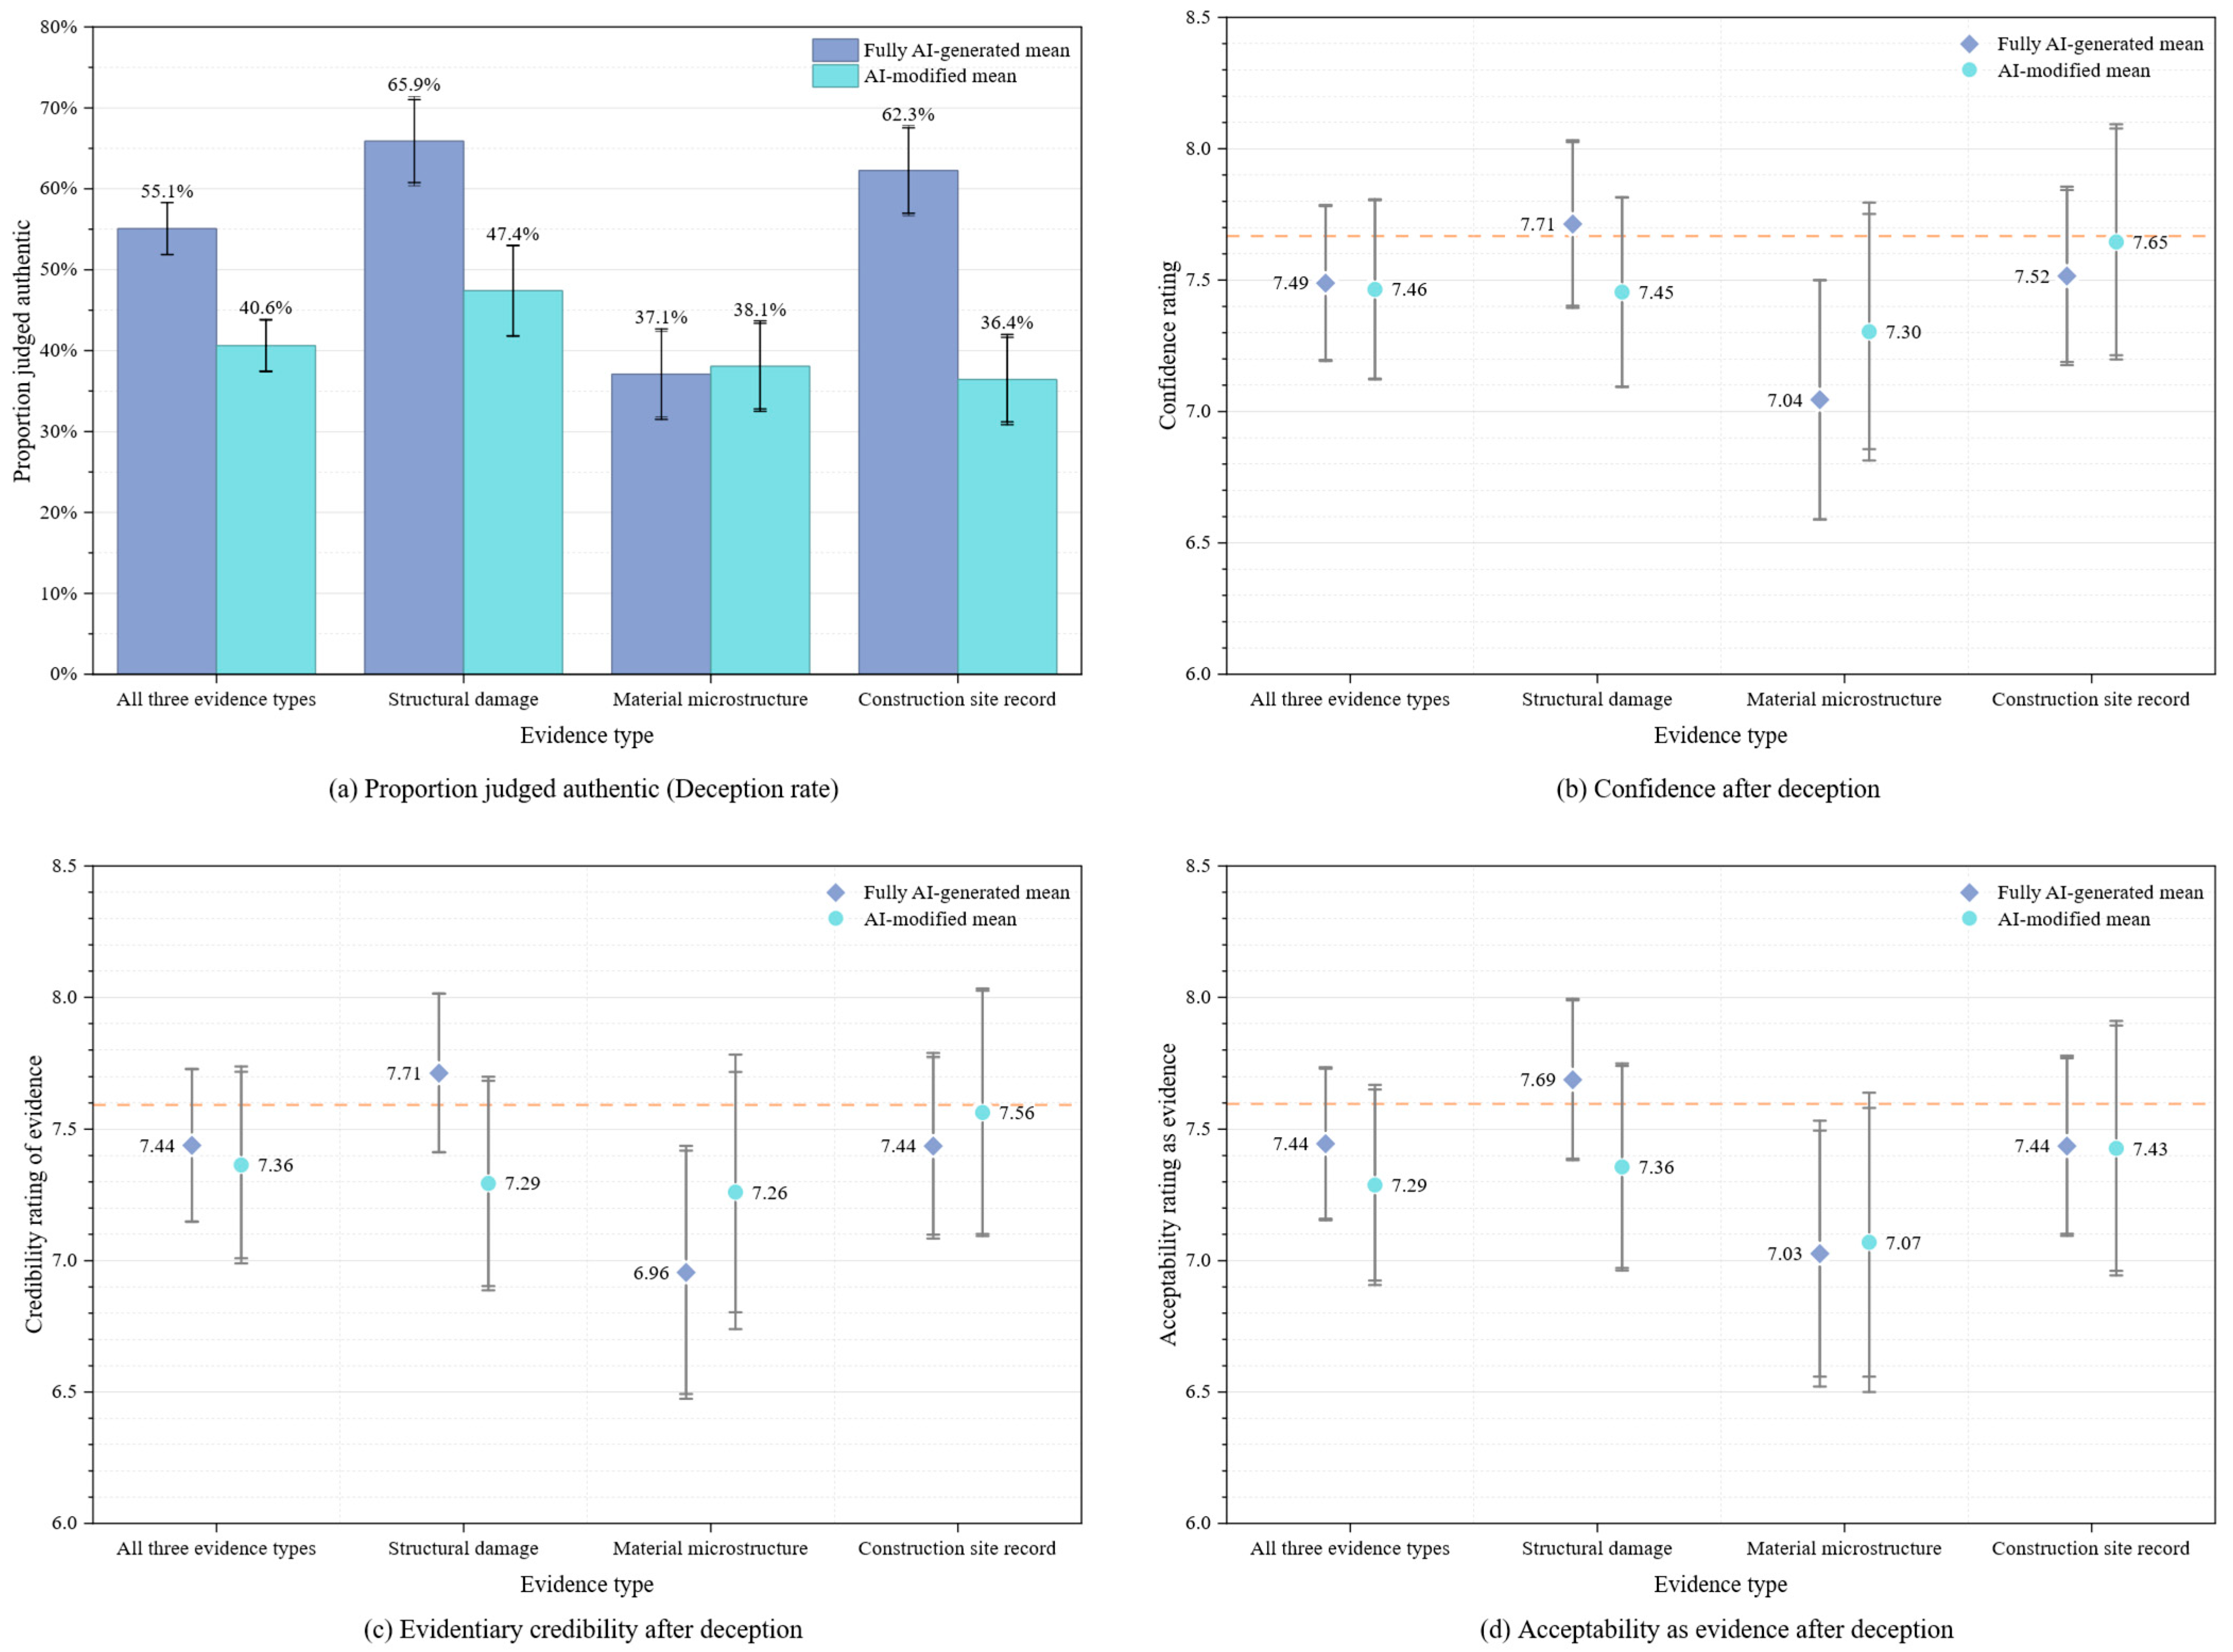
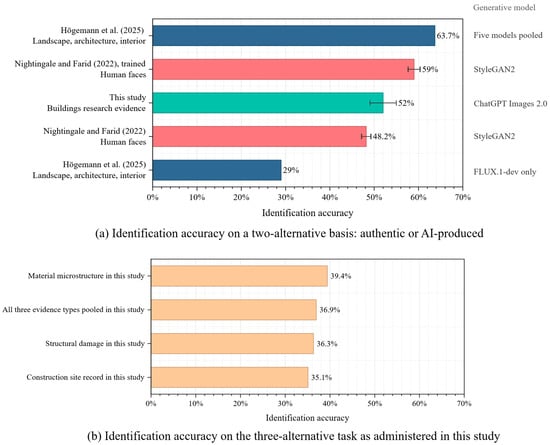
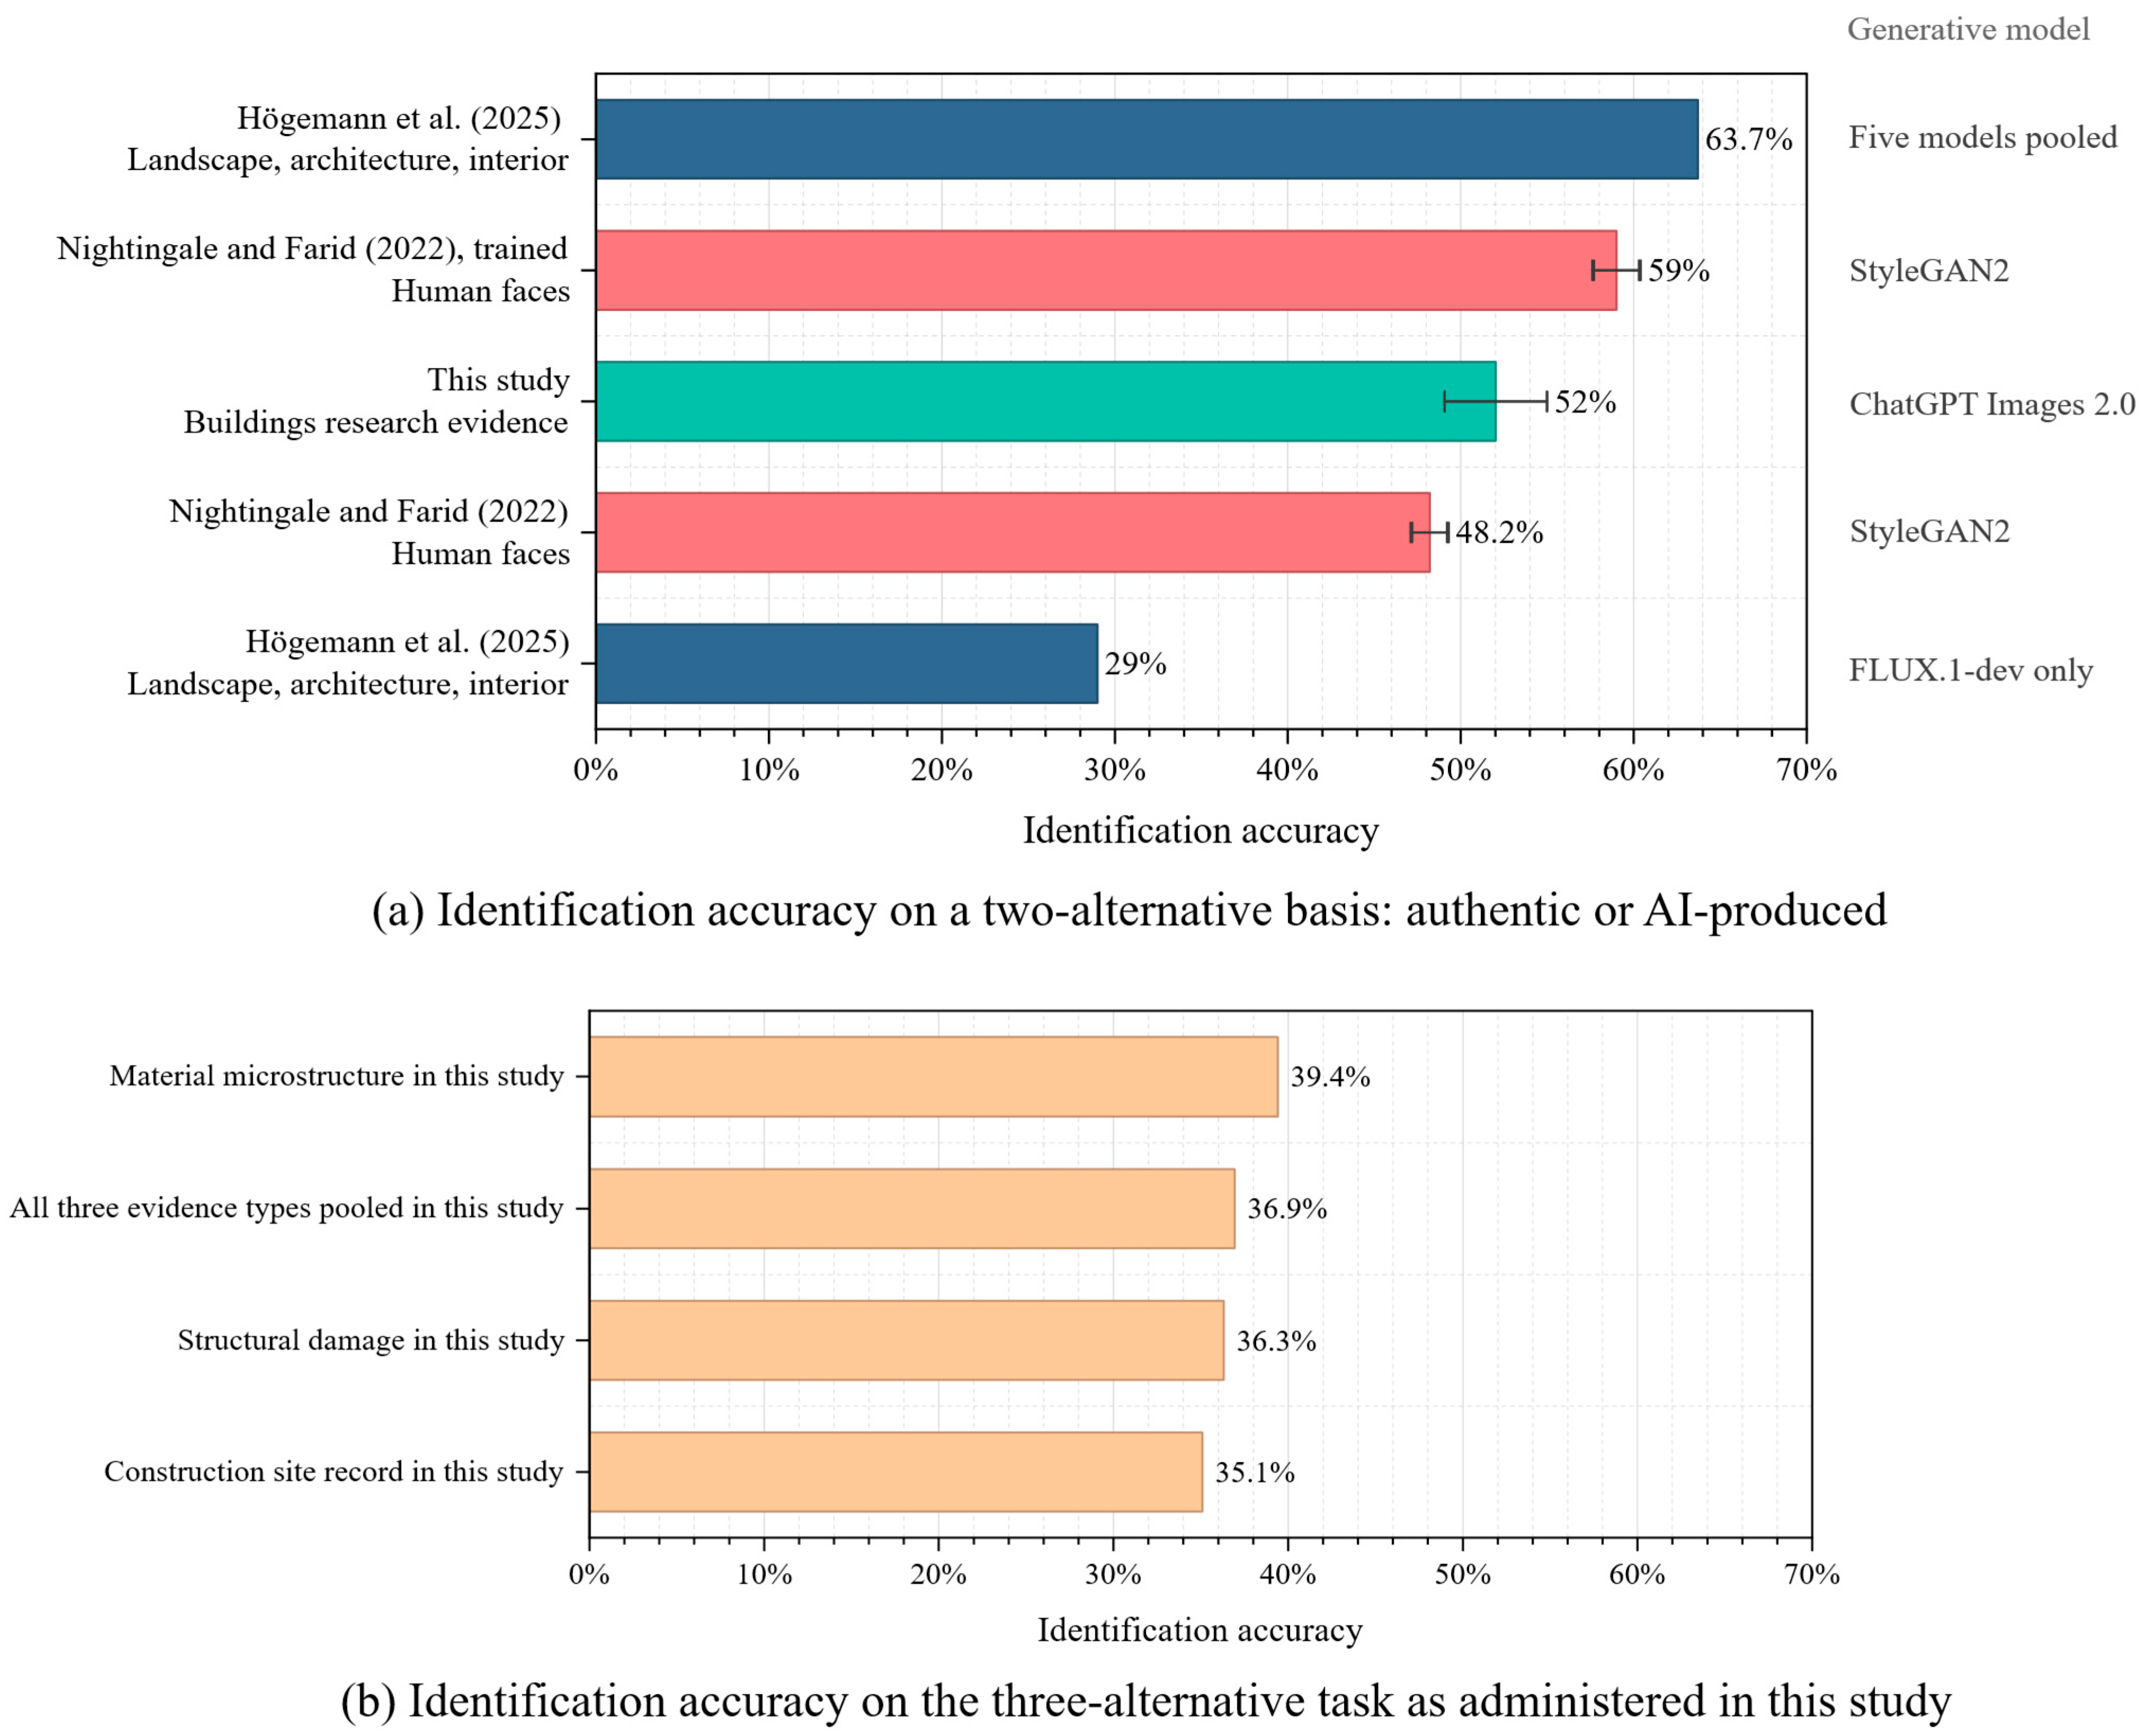

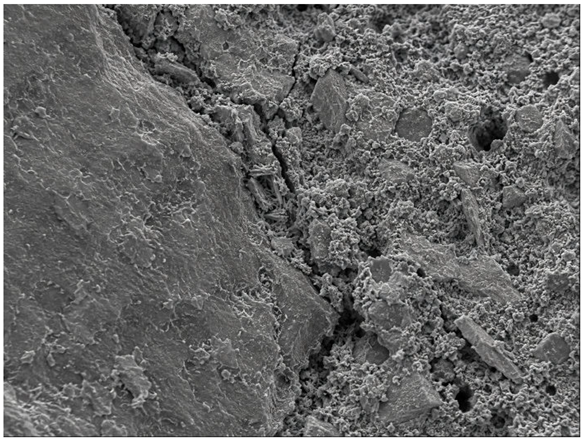
Disclaimer/Publisher’s Note: The statements, opinions and data contained in all publications are solely those of the individual author(s) and contributor(s) and not of MDPI and/or the editor(s). MDPI and/or the editor(s) disclaim responsibility for any injury to people or property resulting from any ideas, methods, instructions or products referred to in the content. |
© 2026 by the authors. Licensee MDPI, Basel, Switzerland. This article is an open access article distributed under the terms and conditions of the Creative Commons Attribution (CC BY) license.