


Abstract
Alkali-activated materials are a sustainable alternative to Portland cement, yet the relative importance of activator and precursor parameters under ambient curing is unquantified, and literature-trained models are rarely validated against independent mixtures. Twelve fly ash–GGBS mortars were prepared in a 2 × 2 × 3 factorial design varying Na2O dosage (4% and 5%), silica modulus (1.0 and 1.5) and fly ash/GGBS ratio (70:30, 50:50 and 30:70) at constant water to binder (0.50) and binder to sand (0.33) ratios, then characterized by flow, compressive strength at 7, 14 and 28 days, water absorption and scanning electron microscopy. Four ensemble models trained on 361 published records were tested on the withheld mixtures. Ambient cured strengths of 31.83–57.91 MPa were obtained, 95% developing by 14 days. Factorial analysis ranked the fly ash/GGBS ratio first (∆ = 18.83 MPa), followed by Na2O dosage (∆ = 3.83 MPa) and silica modulus (∆ = 0.31 MPa), higher GGBS fractions giving lower water absorption and denser matrices under SEM. LightGBM gave the highest cross-validated accuracy (R2 = 0.793; range 0.738–0.793). Precursor calcium content governs strength in ambient cured systems, allowing sodium silicate to be reduced without mechanical penalty and establishing data-driven design as a screening tool that condenses and improves the selection of experimental work towards the application level.
1. Introduction
Ordinary Portland Cement (OPC) continues to be the most common binder in the production of concrete due to its availability and convenience of application, particularly in infrastructure, residential and transport construction. However, the manufacture of OPC is highly energy consuming and non-eco-friendly, as producing one ton of cement releases on the order of 0.8–0.9 tons of CO2 from the calcination of limestone and the combustion of fossil fuels [1,2,3,4]. Consequently, cement production is among the largest industrial sources of anthropogenic CO2 emissions, accounting for approximately 7–8% of global emissions [5]. Concrete is the second most consumed material in the world after water, and hence the world needs to address the environmental concerns of cement manufacturing. Therefore, the necessity to minimize emissions from the cement business has been raised as part of an agenda to realize global carbon neutrality [6].
Environmental issues are forcing researchers towards the development of more environmentally friendly binding materials. Among the various alternatives considered, alkali-activated materials (AAMs) are the most promising candidates to replace the commonly used OPC [4,7]. AAMs are binders produced by reacting an aluminosilicate precursor such as fly ash, metakaolin or ground granulated blast-furnace slag (GGBS) with an alkaline activator [8,9]. Alkali activation is most commonly achieved using sodium hydroxide (NaOH) and sodium silicate (Na2SiO3), although other activators such as potassium hydroxide, potassium silicate and sodium carbonate are also employed; the precursor dissolves and reprecipitates as binding gels, ranging from N-A-S-H gels in low-calcium binders to C-(N)-A-S-H gels in high-calcium binders [10,11]. When compared to those constructed primarily using an OPC-based mix, AAMs can be produced using fewer raw materials, show considerable potential in terms of saving energy, and exhibit superior mechanical characteristics as well as increased durability in the face of thermal, chemical and environmental conditions [12,13,14]. Another prominent benefit is that AAMs create a greatly reduced carbon footprint; depending on the precursor and, in particular, the type and dosage of the alkaline activator (sodium silicate being a significant contribution to embodied carbon), reductions of up to roughly 80% relative to OPC systems have been reported, although the actual saving is highly mix dependent and not universal across all AAM systems [15,16]. Accordingly, AAMs are increasingly regarded as a promising alternative binder system for sustainable construction [17].
Within the broad family of AAMs, a distinction is drawn between low-calcium systems, in which an aluminosilicate precursor such as Class F fly ash reacts to form a three-dimensional N-A-S-H (“geopolymer”) gel, and high-calcium systems, in which slag-rich binders develop C-(N)-A-S-H and C-A-S-H gels analogous to those in hydrated cement [9,18]. The blended fly ash and GGBS binders examined in this study span this transition; accordingly, the term alkali activation is used throughout in the general sense, while geo-polymerization is reserved specifically for the fly ash-rich, low-calcium regime.
Beyond structural mortars and concretes, AAMs are increasingly explored in applications that make use of their low-cost, waste-utilization capacity and thermal durability. In underground mining, alkali-activated binders have been developed for cemented backfill and rockfill; for example, recycling waste gangue through low-alkalinity activation [19] and reinforcing cemented gangue backfill at the microstructural scale [20], offering a low-carbon alternative to cement-based filling materials. Their thermal stability has also drawn attention for geothermal applications, where alkali-activated slag and fly ash systems are among the cementing materials considered for geothermal wells and mine-derived geothermal energy recovery [21]. The workable mix chemistry underlying these diverse uses makes data-driven property prediction, of the kind developed here, broadly relevant across emerging AAM applications.
Despite these benefits, AAM mortars depend on complex reaction mechanisms that are significantly influenced by mix design. At the heart of these mechanisms are the proportions of fly ash and GGBS, along with the characteristics of alkaline activators such as NaOH and Na2SiO3. In particular, optimization of the fly ash to NaOH ratio and Na2SiO3 to NaOH ratio plays a crucial role in enhancing compressive strength through the acceleration of alkali-activation kinetics [22,23]. A higher NaOH concentration (activator molarity) accelerates dissolution of silicate and aluminate species, thereby accelerating the reaction and leading to higher early-age strength [24]. Excessive alkali content can leave unreacted alkali in the matrix and promote efflorescence and drying shrinkage, adversely affecting longer-term performance [25]. Partial substitution of fly ash with GGBS promotes the formation of C-A-S-H and N-A-S-H gels, resulting in a more compact microstructure and higher strength [26,27]. Similarly, increasing the Na2Sio3/NaOH ratio increases silica availability for the gel network and improves mechanical performance [28].
Determining suitable mix proportions is therefore time consuming, requiring extensive trial and error experimentation. The resulting strength depends on numerous interacting factors, including the fly ash to GGBS ratio, the activator dosage and the curing conditions, whose combined effects are difficult to capture with simple empirical relationships [29,30]. Although traditional compressive strength tests are quite reliable, repeated iterations do not contribute much to the efficient prediction of mix ratios [31,32]. To address this situation, scientists have relied considerably upon various types of empirical regression techniques, employing statistical models to make the trial-and-error process much quicker. However, the nonlinear, multivariate complexity of the geo-polymerization approach makes such traditional approaches inadequate or ineffective, thereby leading researchers towards using the newer and much more sophisticated approaches of machine learning (ML) and artificial intelligence (AI). ML techniques, specifically, are greatly effective at extracting complex relationships between input factors, which results in much higher precision when predicting material strengths and making efficient decisions in the field of materials engineering [33,34].
The application of recent advances in ML has helped create an accurate prediction framework within civil engineering, especially with regard to compressive strength prediction in AAM. Researchers have demonstrated the effectiveness of ML modelling in fly ash and GGBS-based AAM [35,36,37,38,39]. A variety of models, both individual and combined, have proven effective within the field. Models include decision tree (DT), support vector regression (SVR), random forest (RF), artificial neural network (ANN), gradient boosting (GB), extreme gradient boosting (XGBoost), light gradient boosting machine (LightGBM), CatBoost, AdaBoost and logistic regression (LR). A prime example is how Nazar et al. [36] addressed major influencers such as fly ash content, NaOH molarity and curing regimes using both traditional and combined ML modelling techniques. Dash et al. [37] developed a hybrid framework based on firefly optimization, SVR and XGBoost modelling. This framework dynamically optimizes feature weights to optimize prediction accuracy. Amin et al. [39] and Shen et al. [38] proved the effectiveness of GB, RF and XGBoost in modelling complex nonlinear relationships.
Data-driven strength prediction has not been limited to alkali-activated systems; in fact, when comparing the performance between material classes, there is much to be learned for the present study. When large and standardized datasets are available and the number of variables that dictate the performance of the engineered material is relatively limited, the level of accuracy achieved is good, as Beskopylny et al. [40] demonstrated in predicting the compressive strength of Vibrocentrifuged concrete across a wide range of strengths. In the case of fiber-reinforced and lightweight concretes, it is due to other parameters such as the fiber type, geometry, concrete dosage and the properties of aggregate, which increase the parameter space and make data-driven approaches an even more valuable tool. Pakzad et al. [41] analyzed a variety of machine learning and deep learning models to predict the compressive strength of steel fiber-reinforced concrete based on available open-literature data, finding that the most promising models were based on shallow networks whose outputs were combined using aggregates of boosting and bagging classifiers; Dai et al. [42] used a multilayer perceptron combined with bagging and adaptive boosting classifiers to predict the compressive strength of high strength fiber-reinforced concrete exposed to fifteen input variables, with curing time and superplasticiser content dominating predictions made using SHAP. These studies confirm that ensemble tree methods can compete well with neural methods regarding the size of dataset usually encountered in construction materials research.
For the specialty geopolymer and alkali-activated systems, the volume of the literature is also increasing. Rathnayka et al. [43] examined the various machine learning methods employed for the compressive strength of fly ash-based geopolymer concrete, classified as nonlinear regression, ensemble learning/strategy and evolutionary programming/in evolution, and determined that the main difficulty in using them was the lack of a standard procedure for mix design. Le et al. [44] implemented models based on deep neural network, k-nearest neighbor and support vector machine using 375 experimental data points with maximum accuracy obtained for the deep network. There are more such methods, such as the GWO algorithm proposed by Parhi and Patro in [45] and the evolutionary algorithms proposed by Huang et al. in [46], which addressed the same problem. The methodology used here closely followed that of Tran et al. [47], who fused an experimental program with machine learning. The reported precision for the alkali-activated ones is consistently poorer when compared with that of conventional concrete and has a wider range due to the larger parameter space and the heterogeneity of the data compiled from different sources. Alkali-activated components are typically being used as supplementary cementing materials and not as independent cementing agents. These hybrid systems are advantageous in that they impart cement hydration at an early age while simultaneously achieving a significant reduction in clinker, and have been evaluated for durability in respect of carbonation, chloride ingress and frost resistance [48]. The principles which have been developed in the field of standalone alkali-activated binders are directly applicable to the formulation of such hybrid systems and apply to the present study, where a set of parameter hierarchies have been quantified.
The research question explored in this study is as follows. It is well known that the compressive strength of fly ash and GGBS alkali-activated mortars are related to the content of alkali used, silica modulus, the ratio of binders, nature of the water and curing process, etc., and the direction of the effect is known for each of these. The barrier to progress is the relative impact and statistical significance of activator chemistry and binder chemistry on ambient curing. In particular, it is unclear which of these two components is the primary controlling parameter in practically realizable mix ranges. Previous studies have relied on one-factor-at-a-time experiments, which do not resolve interaction effects. The reported machine learning models have been trained and evaluated using literature-derived datasets, without being tested against independent experimental datasets from new sources of raw materials. The parameter hierarchy and the transferability of data-driven predictions to new materials have not yet been quantified. These considerations define three specific gaps. First, the compressive strength of fly ash and GGBS AAMs is governed by strongly interacting parameters such as alkali dosage, silica modulus and binder blend ratio, so that exhaustive experimental screening of the mix design space is prohibitively time consuming and resource intensive. The factorial responses are subjected to analysis of variance to define the hierarchy of the parameters. A validated predictive model is therefore required to prescreen candidate proportions before laboratory trials. Second, suitable ML models are trained and evaluated exclusively on literature-derived datasets, without confirmation on independent experimental mixes produced from new raw material sources, leaving their practical predictive reliability unverified. Third, ML predictions are rarely coupled with a designed experiment capable of providing a mechanistic reference against which the learned trends can be checked.
The novelty of this study lies in the integration of data-driven machine learning prediction with experimental and microstructural validation to elucidate the nonlinear relationships between alkaline activator composition, binder ratios and silicate modulus in alkali-activated mortars. A curated database comprising 361 literature records was employed to develop and evaluate four ensemble-based machine learning models, namely gradient boosting, XGBoost, LightGBM and random forest. The predictive capability of these models was subsequently assessed using an independent experimental program involving twelve ambient-cured alkali-activated fly ash–GGBS mortars that were not included in the training dataset. The predicted compressive strengths were further examined in combination with experimental results and microstructural characteristics, providing an integrated framework for assessing the reliability, applicability and interpretability of machine learning approaches for the prediction and design of alkali-activated mortars.
2. Experimental Program
This study aims to evaluate the compressive strength performance of AAM mortars produced using twelve different combinations of fly ash and GGBS under ambient curing conditions. The study further seeks to identify the optimal mixture that yields the highest compressive strength after 28 days of curing. The ultimate objective is to develop sustainable mortar formulations that do not require heat curing while maintaining adequate mechanical performance.
2.1. Materials
In this study, fly ash and GGBS served as the main source materials for producing AAM mortar. The fly ash was procured from Ranchi Thermal Power Station, Ranchi, Jharkhand, India, which supplies low-calcium Class F fly ash suitable for AAM applications. GGBS was sourced from JSW Cement (Mumbai, Maharashtra, India), a well-known producer of industrial byproducts utilized in sustainable construction. The fine aggregate used for mortar preparation was obtained from a nearby local source. Before mix formulation, all materials underwent physical characterization to ensure uniformity and reliability in the mix design. The physical properties of fly ash, GGBS and fine aggregate are presented in Table 1. The chemical composition of Fly ash and GGBS was obtained by X-ray Fluorescence (XRF) and is summarized in Table 2. Fly ash and GGBS were each obtained from a single source (Table 1 and Table 2); the precursor chemical composition was therefore held constant throughout the experimental program, isolating the effects of the activator and binder ratio parameters under investigation. Laboratory grade sodium silicate solution (11.86% Na2O, 38.55 SiO2, 49.59% H2O) with silica moduli of 1 and 1.5 (SiO2/Na2O ratio) and sodium hydroxide pellets of 99% purity were used as alkaline activators in the present study. Figure 1 presents the materials used in the experimental work: (Figure 1a) Class F fly ash; (Figure 1b) GGBS; (Figure 1c) M-sand fine aggregate; (Figure 1d) sodium silicate solution and (Figure 1e) sodium hydroxide pellets.
Table 1.
Physical properties of raw materials.
Table 2.
Chemical composition of fly ash and GGBS.
Figure 1.
Materials used in the experimental work: (a) Class F fly ash, (b) GGBS, (c) M-sand fine aggregate, (d) Sodium silicate solution and (e) Sodium hydroxide pellets.
2.2. Alkali-Activated Mortar Composition Parameters
Alkali activated mortars were prepared with different mix proportions of fly ash and GGBS, incorporating variations in Na2O content and SiO2/Na2O ratio, while maintaining a constant water-to-binder ratio of 0.5 and binder-to-sand ratio of 0.33, in order to examine their effects on compressive strength. Since the alkali-activated binder performance relies on the interaction of multiple compositional factors, a full three-factor factorial design was chosen to identify the interactions and main effects of the three mix parameters on compressive strength at 28 days. Three controlled parameters were investigated: the dosage amount of Na2O at two levels (4% and 5% by mass of binder), silica modulus Ms = SiO2/Na2O at two levels (1.0 and 1.5) and mass ratio of fly ash and GGBS (70:30, 50:50 and 30:70). It is therefore of a 2 × 2 × 3 design, with no points fixed to the center, no points set to be duplicated and no points set to be repeated, so that all main effects and all two- and three-factor interactions are estimable. The water-to-binder ratio is 0.50, the binder-to-sand ratio is 0.33, and the precursor source and activator equilibration time were set as controlled parameters, therefore the response measured is due to the three designed parameters. The choice of 4 and 5 is based on the direct proportionality of the dosage of the alkali (Na2O) to pore solution alkalinity and the dissolution of the aluminosilicate. Moderate values are used in proportions that guarantee sufficient kinetics of the reaction without excess alkali, which may increase the risk of efflorescence or shrinkage potential and decrease practical reliability [49,50]. SiO2/Na2O ratios of 1.0 and 1.5 were taken to cover a realistic silica modulus range that is typically reported in sodium silicate-based activators, where any additional siliceous solution content tends to elevate both silica modulus and polymerization or gel connectivity and strength, building up to an optimum, beyond which solution viscosity may rise and inhibit workability and mixing efficiency [50,51]. In the systematic transition of the binder between low-calcium and calcium-rich regimes, fly ash and GGBS blends (70/30, 50/50 and 30/70) were selected to enable the well-known regions of transition between low-calcium and calcium-rich regimes; that is, from the typically N-A-S-H-derived gels in fly ash-rich to C-(A)-S-H/N-(C)-A-S-H-type binding gels in slag rich [9,18,52]. The combination of these levels generated a 2 × 2 × 3 matrix (12 mixes, C-1 through C-12), which would cover the useful activator chemistry and binder calcium space and allow a strict evaluation of single-factor effects and their interactions on alkali-activated performance. The twelve distinct mix combinations were designed, as presented in Table 3, to determine the optimal fly ash-to-GGBS ratio for improved mechanical properties. Three independent 70.7 mm cubes were cast in each treatment combination and the reported compressive strengths are the average of three cubes for each treatment age. The ones after 7, 14, and 28 days were tested and the 28-day result was considered the response variable of the factorial analysis with the standard deviation. This systematic approach ensures dependable comparisons among various binder compositions, and contributes to the formulation of sustainable, high-strength alkali-activated mortars.
Table 3.
Mix proportions of fly ash- and GGBS-based alkali-activated mortar cubes.
The present factorial design is based on the parameters that were selected for the space which included an OPC control and a single-precursor (100% fly ash and 100% GGBS) endpoint. This is in line with common practice where the setting time, workability, shape change (shrinkage) and strength of a single-precursor-produced medium binder can be controlled using a combined form of fly ash and GGBS binders. However, in this study, an ambient curing regime was targeted, which means that low-calcium Class F fly ash requires elevated temperature activation to ensure sufficient strength [24,53]. There were also some practical limitations for the range of binders evaluated since workability was reduced and casting shrinkage and cracking were high when using 100% GGBS [54,55], so the range between 70/30 and 30/70 was selected to represent the binders in the practically relevant binder space. Comparing with the literature [26,27,56] the highest strengths after 28 days (31.83–57.91 MPa) are obtained here for the external context and match the performance of conventional OPC mortars of a similar w/b ratio.
2.3. Alkali-Activated Mortar Casting and Post-Cure Treatment
The alkaline activator consisted of a commercial sodium silicate solution that had an as-supplied modulus (Ms = SiO2/Na2O). At the target silica moduli (1.0 and 1.5) the sodium hydroxide pellets were dissolved in the sodium silicate solution, and equilibration time before use of the activator was 10 h. During mortar preparation, the required quantities of fly ash, GGBS, and fine aggregates are accurately weighed and dry mixed to ensure uniformity. The pre-prepared alkaline solution is then gradually added to the dry mixture. Mixing is continued for 5–7 min to achieve complete homogeneity. The fresh mortar is subsequently cast into standard sized cube molds and vibrated for 45 s to ensure proper compaction. The specimens are left undisturbed for 24 h, after which they are demolded and cured under ambient conditions (as shown Figure 2) until the specified testing age is reached.
Figure 2.
Specimens prepare for testing mixes C1–C12 at 7, 14, and 28 days.
2.4. Testing
The workability of the fresh alkali-activated mortar was evaluated according to the flow table test based on IS 4031 (Part 7) [57] where the fresh mortar was poured into the flow mold as soon as it was mixed in a mixing trough and the value of flow was determined. The compressive strength of the alkali-activated mortar specimens was measured under a compression machine with strength of 2000 kN working under constant loading rate as per IS 516 [58]. The total water absorption capacity of the hardened specimens was determined as per ASTM C642 [59], and measurements were taken after 24 h and represented as a percentage of the dry specimen mass. The microstructures were studied and morphological features observed by representative fragments of the samples which were then mounted on aluminum stubs using conductive carbon tape, coated with thin layers of platinum using sputter coater to eliminate any surface charging effect on the specimen and examined under a scanning electron microscope (SEM), ZEISS, Oberkochen, Germany.
3. Experimental Results
3.1. Workability
Figure 3 shows that the flow values observed in the presented study ranged from 163 mm to 200 mm. The mixes with the highest fly ash content had the highest flow values up to 200 mm and the mixes with the highest GGBS content had the lowest flow values from 163 mm to 184 mm. This reduction corresponds to the greater specific surface area of GGBS compared to fly ash and fly ash particles are spherical in nature, thereby increasing the demand for water and decreasing flowability. The further decrease in flow with higher silica modulus confirms that a higher silica modulus causes higher activator viscosity, which affects mixing efficiency and workability, as evidenced by the lowest flow for C-9 and C-12.
Figure 3.
Flow table test results across twelve mix proportions.
3.2. Compressive Strength
The 28-day compressive strength performance of the twelve alkali-activated mortar mixes is presented. The mean 28-day compressive strength varied from 31.83 MPa to 57.91 MPa, where the mechanical property of the alkali-activated system significantly depended on both the chemistry and the composition of the binders. Ambient curing configuration had rapid strength development: Over the 12 mixes, 78.6% strength was achieved after 7 days and 95.4% strength was achieved after 14 days of curing. Figure 4 shows the comparison bar chart of compressive strength values of all specimens and error bars, which proves that the experiment had a constant level of variation, which necessitates that the specimen preparation procedure is reliable.
Figure 4.
Comparison of compressive strength across alkali-activated samples.
Being a full 2 × 2 × 3 factorial design, the effect of any one of these factors should be interpreted in terms of the interaction of all factors, rather than as a two-way correlation. A higher compressive strength can be seen consistently in all activator compositions with an increase in the fraction of GGBS, as shown in Figure 4, but this effect is influenced by the alkali dosage and silica modulus, as can be seen from the interaction analysis explained below.
For mixes with Na2O = 4% and SiO2/Na2O = 1.0 (C-1 to C-3), the compressive strength increases significantly from 31.83 MPa (C-1, 70% fly ash) to 51.90 MPa (C-3, 70% GGBS). This enhancement can be attributed to the higher calcium content of GGBS, which promotes the formation of C-A-S-H and hybrid N-(C)-A-S-H gels, resulting in a denser and more compact microstructure compared to the N-A-S-H gel predominantly formed in fly ash-rich systems. A similar trend is observed for mixes with higher alkali dosage (Na2O = 5%) at a constant SiO2/Na2O ratio of 1.0 (C-4 to C-6). The compressive strength increases from 34.64 MPa (C-4) to 57.91 MPa (C-6), with C-6 exhibiting the highest strength among all mixes. This superior performance is likely due to the combined effect of increased alkali concentration, which enhances aluminosilicate dissolution, and higher GGBS content, which facilitates the formation of calcium-rich binding gels and a highly cross-linked matrix.
For mixes with a higher silica modulus (SiO2/Na2O = 1.5), at Na2O = 4% (C-7 to C-9) the compressive strengths are comparatively lower than those of corresponding mixes with SiO2/Na2O = 1.0. Although strength still increases with GGBS content (36.92 MPa for C-7 to 49.49 MPa for C-9), the overall reduction suggests that excessive silica in the activator may increase solution viscosity, thereby slowing effective dissolution and polymerization processes. A similar trend is observed for Na2O = 5% and SiO2/Na2O = 1.5 (C-10 to C-12), where compressive strength increases from 34.37 MPa (C-10) to 53.77 MPa (C-12). However, the strength of C-12 remains lower than that of C-6, despite having the same Na2O content and GGBS proportion. This indicates that a lower silica modulus (SiO2/Na2O = 1.0) is more favorable for strength development under the given conditions.
The influence of each mix parameter on 28-day compressive strength was quantified by a main effect analysis of the factorial responses. The level means in Table 4 seemed to be reported along relationship
where, is the mean 28-day compressive strength for jth treatment combinations tested for factor A at level i and is the number of combinations at level i of factor A (n = 6 for two-level factors Na2O, SiO2/Na2O and n = 4 for three-level factor fly ash/GGBS). The Delta value presented for each factor is defined as the difference between the high-level and low-level means of that factor, calculated as
which represents the change in mean response that occurs when the factor is moved from its min to max level with the other factors held constant. To assess the internal consistency of the values in Table 4, the level means of each factor were compared to one another and showed that they were all equal to the grand mean ( = 42.47 MPa) when the design is fully balanced.
Table 4.
Factorial analysis of mix parameters and their influence on compressive strength.
The factorial analysis highlights that the fly ash to GGBS ratio is the most influential parameter controlling compressive strength, as indicated by the highest delta value of 18.83. This significant enhancement with increasing GGBS content is attributed to the formation of calcium-rich binding gels, resulting in a denser microstructure. The Na2O content shows a moderate effect, with a delta value of 3.83, where increasing Na2O from 4% to 5% improves aluminosilicate dissolution and reaction kinetics. In contrast, the SiO2/Na2O ratio has a negligible influence, as reflected by a low delta value of 0.31. Overall, these results confirm that binder composition governs strength development, while activator parameters play a secondary role, consistent with the experimental observations.
3.3. Water Absorption
The twelve different mortar mixes were tested for the 24 h water absorption shown in Figure 5. The range of water absorption values was between 6% and 3% for mixes with the highest fly ash content to that with the highest percentage of GGBS respectively. The water absorption rate improved systematically with reduction in the percentage of activator, based on the increase in GGBS in all activator combinations. This trend is opposite to the behavior of compressive strength and is characteristic of the sequential density increase in the matrix and the decrease in connected porosity as a function of slag addition. The above densification is said to be achieved due to the increased availability of calcium released from GGBS and the formation of the C-A-S-H and hybrid N-(C)-A-S-H forms of the reaction products [18,27].
Figure 5.
Water absorption test results across twelve mix proportions.
3.4. SEM
SEM examination was carried out in order to obtain a morphological interpretation regarding the differences in compressive strength that were noted between the three slag dominant mixes (C-6, C-9 and C-12). It is a qualitative analysis that constitutes investigation of matrix homogeneity, apparent porosity and degree of unreacted precursor grains, rather than phase identification for which additional chemical and mineralogical analysis would be necessary. The fracture surfaces of the three slag-dominant mixes C-6, C-9 and C-12, were each examined using SEM. The mixes are compared at 2 KX in Figure 6.
Figure 6.
SEM micrographs (a) C-6, (b) C-9 and (c) C-12.
The mixed fracture surface is the most homogeneous in the strongest mix. C-6 and the comparatively dense microstructure has relatively little unreacted precursor grains and very little visible porosity. The morphology shows similarities with that observed in a highly reacted binder matrix that has been reported for slag-rich, alkali-activated systems of similar composition [26,27]. This matrix was associated with the presence of well-developed C-(N)-A-S-H and N-A-S-H gel assemblages. C-9, however, shows larger precursor grain faces that are angular and without smooth surfaces, are covered by small reaction product agglomerates with open cracks between them. Less reaction product can be formed due to the increase in silica modulus increasing the activator viscosity and the decrease in alkali dose causing a reduction in the amount of aluminosilicate dissolution [50,51]. C-12 as the angular shape of the unreacted/partially reacted grains is intermediate, with sharp edges along with the presence of visible inter particle voids leading to lower packing material density. This yields lower strength as a consequence, even though the quantity of alkaline powder and proportion of GGBS remained the same as that of C-6 [18,27].
4. Data Collection and Structuring
The results obtained from the experimental program demonstrate clear trends in compressive strength, with varying mix-design parameters. However, predicting strength across a wider range of compositions requires a more generalized and data-driven approach. For this purpose, a dataset from the published literature was assembled and utilized as the base for machine learning to predict compressive strength over a wider range of composition, whilst the twelve mixes used in this experimental programmer were kept as a comparison set for the ML model.
There are 361 data points of compressive strength that have been aggregated (Supplementary Materials) to enable a thorough analysis and prediction of the mechanical properties of alkali-activated mortar. The data has been aligned in a manner that takes into consideration all the significant factors influencing the development of strength. The key values of inputs include the fly ash content, GGBS content, NaOH (M), sodium silicate-to-sodium hydroxide (SS/SH) ratio, water-to-binder ratio and Fly ash/GGBS ratio. These values are regarded as the key factors due to their great influence on the alkali-activated mortar formulation and mechanical properties. The algorithms of machine learning and analysis of the data were carried out in Python 3.12 and the results are delivered in the form of a web-based interface.
4.1. Database Compilation and Data Curation
Only the abstracts of peer-reviewed literature that cover ambient cured fly ash and GGBS AAM were retrieved and used for machine learning modeling. Through the use of the keywords: “alkali-activated”, “fly ash”, “GGBS” and “compressive strength”, publications were identified using source studies.
The studies were selected if they reported (i) that they used a fly ash and GGBS binder containing a sodium-based activator and (ii) all six input variables in this study (fly ash proportion, GGBS proportion, NaOH molarity, SS/SH ratio, water-to-binder ratio and the fly ash/GGBS ratio derived from the first three input variables and (iii) reported a compressive strength. If any of the required variables in the binder to fly ash and GGBS system was missing, or there were various additives in the binder, such as metakaolin or silica fume, blended OPCs or nanostructure materials or fiber reinforcement, or if the identical finding was reported in multiple publications, such records were dropped from the analysis.
The conditions of the sources, when given as an alternative such as Na2O dosage along with silica modulus SiO2/Na2O, were reconditioned into NaOH molarity and SS/SH by using declared oxide composition in the sodium silicate solution. If the alkali dosage is n.B (% Na2O by binder mass) and the silica modulus is , then the required mass of sodium silicate solution will be
where is the SiO2 mass fraction of the as-supplied solution. The mass of sodium hydroxide needed to supply the remainder of the alkali will be
where and are the mass fraction of SiO2 and Na2O present in the as-supplied solution, respectively, while and represent the molecular mass of NaOH and Na2O, respectively. The nominal NaOH molarity is calculated based on the total water used in the activator, which includes mixing water and the water contained in the silicate solution. The 12 experimental mixes tested in this study were also converted prior to use for model evaluation and feature values were reported. All units were normalized before the model was run. It is observed that there are three duplicate entries in the compiled database and twenty-eight feature combinations that are entered more than once, with a variation in reported strength of up to 37.98 MPa within the feature combination. They are due to independently conducted studies reporting nominally similar mix designs and they set an absolute minimum to the achievable degree of prediction measured, as shown in Section 6.
The detailed dataset intentionally includes a broader range of fly ash and GGBS proportions as 0–100%, and fly ash/GGBS ratios of 0.43, 1.00 and 2.33 (30:70, 50:50 and 70:30), respectively, which may not have been the range explored in the experimental programmer. This is deliberate, as this results in the models being able to learn strength behavior in the practical space of fly ash and slag design, outside of the very limited space investigated experimentally.
The reliability of the compiled dataset is further supported by external comparison: the twelve experimental mixes produced in this study were withheld from training and used as an independent comparison set, confirming that models trained on the curated literature data reproduce experimentally observed strength trends.
4.2. Data Distribution Examination
The Exploratory Data Analysis (EDA) provides information on the distribution of model variables in terms of statistics. Table 5 shows the summary of the mean, standard deviation, minimum, maximum, skewness, and kurtosis of all the input parameters and the output variable.
Table 5.
Analysis of input features and target variable properties.
Fly ash content is 44.28 ± 30.62% and GGBS content is 55.72 ± 30.62%, and this is within the whole span of 0 to 100. The data is also almost symmetrically distributed around the mean, with a modest touch of platy kurtosis (−0.94). The molarity of NaOH = 9.53 ± 3.69 M, with an almost perfect symmetry (−0.0047) and a little bit of flatness (−0.8452). The SS/SH ratio stands at 1.91 ± 0.57, with a weak negative skewness (−0.2434) and negative kurtosis. The water/binder ratio = 0.47 ± 0.12 and this has a weak positive skewness (0.1557). The fly ash/GGBS ratio is strongly right-skewed, reflecting the inclusion of slag-free records for which the ratio is unbounded. Because the untransformed ratio is undefined at zero GGBS content and was assigned a sentinel value in the compiled dataset, the logarithmic transform log (1 + fly ash/GGBS) is adopted as the composition descriptor for modelling; its descriptive statistics are reported in Table 5. The range of the compressive strength is 2.50 to 88.00 MPa, a range of 48.32 ± 19.33 MPa. The skewness of the data is slightly negative (−0.3957) and the kurtosis is nearly normal (−0.2992).
4.3. Visualization of the Dataset
In the first stage of the current research, EDA has been conducted to identify the influence of the key parameters of the major mix design on the compressive strength of the alkali-activated binder systems. In the data, there are six key variables, namely fly ash content, GGBS content, NaOH content (M), sodium silicon/sodium hydroxide (SS/SH) ratio, water-to-binder ratio and fly ash/GGBS ratio, where compressive strength (MPa) is the response variable. All the material variables are adjusted to the same units to be compared and analyzed.
4.3.1. Statistical Distribution of Features
The histograms of the six input parameters and the target variable were plotted to characterize and describe the dispersion and distributional shape of these variables, which are shown as Figure 7. In all panels, abscissa is a measure of the magnitude of the parameter and ordinate is a measure of the frequency of occurrence. Each distribution is described separately below, along with the corresponding values for skewness and kurtosis that are given in Table 5. In the case of fly ash content (Figure 7a), high variation in the content is observed and this is depicted by a spread of low to high values. The mid-range values, however, have very high peaks and this means that most blends are made to be moderate instead of extreme in terms of the content of fly ash. A multi-peaked distribution is observed in the case of GGBS content (Figure 7b), which reflects the level of mixture design. Once again, we can see groups of values that show the intermediate levels of GGBS content, meaning that the optimum blend ratios are regularly used and low and high values are not so common. It can be seen that the molarity of NaOH is concentrated around some molar values (Figure 7c), which shows that there is a control over its approach and not a continuous scale. This would indicate that there was a pre-programmed group of values of alkaline activators that was applied in the preparation of the mixes.
Figure 7.
Feature histograms: (a) fly ash content, (b) GGBS content, (c) NaOH molarity, (d) SS/SH ratio, (e) water-to-binder ratio, (f) log (1 + fly ash/GGBS ratio), and (g) compressive strength.
The SS/SH ratio (Figure 7d) histogram depicts a large amount of data that is concentrated in a narrow range, showing that the design of the activator ratios did not vary greatly. Nonetheless, the distribution of the transformed data log (1 + fly ash/GGBS ratio) is extremely right skewed (Figure 7f), that is, there are a lot of values that are concentrated around the lower values and a long tail that tends to be concentrated on higher values. This indicates that there is a necessity for a change to deal with the high differences in this ratio [60]. The water-to-binder ratio is also distributed moderately, with the highest concentration of the value within an expected range of an alkali-activated mix (Figure 7e). This distribution is peaked, which indicates that there is an optimal balance of workability and strength [61,62]. Compressive strength has an almost normal distribution, with a slight skewness to the right (Figure 7g). Most of the values fall in the mid to high range, which indicates that the data set is mainly dominated by alkali-activated mortar mixes of variable structural importance [63]. The highest and lowest values are not extreme, indicating that the experiments were controlled and the specimen preparation procedure is dependable.
4.3.2. Feature-Target Relationship
The relationship between each of the input variables and the compressive strength was presented in the order of fly ash content, GGBS content, NaOH molarity, water/binder ratio, SS/SH ratio and log (1 + fly ash/GGBS ratio), as shown in Figure 8. These plots illustrate only marginal associations; of course, the composition-related predictors are correlated with one another, so that the single trends should be read as the relative direction of the overall tendency. The following discusses each relationship separately. It is important to note that the univariate trends are meant to be illustrative and suggestive and do not imply a causal relationship between the two parameters, but only the overall, coordinated effect of the mix. The plots offer graphical information of the trend, the intensity and the scatter of the connections among mixture design parameters and compressive performance. The x-axes of both subplots are the respective input variables and the y-axes are compressive strength. The dotted line refers to the linear regression trend, which reflects the trend of overall correlation.
Figure 8.
Feature-target scatter with trend: (a) fly ash content, (b) GGBS content, (c) NaOH molarity, (d) SS/SH ratio, (e) water-to-binder ratio, and (f) log (1 + fly ash/GGBS ratio).
Compressive strength has a weak negative correlation with fly ash content (Figure 8a), as the trend line shows that there is a slight negative slope. Even though the values of strength are distributed around all the fly ash levels, elevated fly ash concentrations are easily found to display slightly decreased compressive strength. This tendency can be explained by the fact that geopolymerization of a binder system containing fly ash is slower [56]. Compressive strength, on the other hand, shows a positive correlation with GGBS content (Figure 8b). The positive correlation indicates that as the composition of slag increases, the mechanical performance is also improved, probably because the products of the calcium-mediated reaction become better, leading to denser matrices. The increase in data points, however, means that the strength is also dependent on parameters that interact. The NaOH molarity plot shows a weak positive slope (Figure 8c). Increased alkaline strength seems to favor strength gain, though there seems to be considerable variance, implying that there is an optimal molarity, beyond which gains no longer occur or occur inconsistently [61,63]. The SS/SH ratio depicts a rather negative or neutral trend (Figure 8d), which gives us an idea that a disproportionate increase in compressive strength is not observed with excessive sodium silicate, as compared to a substantial increase in sodium hydroxide [64]. The vertical aggregation of data points at specific ratio levels indicates experimental design-controlled intervals. Compressive strength has a weak negative relationship with water-to-binder ratio (Figure 8e). In cementitious systems, as would be anticipated, an increase in water content has a tendency to reduce the strength as a result of higher porosity and decreased compactness of the matrix. Nevertheless, the fairly parallel slope suggests that variations in water could have been kept within tolerable levels in the range of the test [62]. Lastly, the negative trend of the transformed variable log (1 + Fly ash/GGBS ratio) is more noticeable (Figure 8f). The greater the fly ash-to-slag ratio, the less the compressive strength. This also supports the above assertion that slag-rich systems are more useful in strength development [60]. The logarithmic transformation effectively squeezes the extreme ratio values and is able to keep the relational trends intact.
4.3.3. Correlation Analysis
Figure 9 presents the pairwise Pearson correlation matrix of the six input features and the compressive strength. The Pearson correlation coefficient r between two variables x and y is defined as
where r ranges from −1 (negative linear association) to +1 (positive linear association), with r = 0 indicating no linear association. In this study, |r| < 0.3, 0.3 ≤ |r| < 0.7 and |r| ≥ 0.7 are interpreted as weak, moderate and strong correlations, respectively. It should be noted that Pearson’s r quantifies only linear pairwise association and does not capture the nonlinear and interactive effects that the ensemble models are designed to learn. Values greater than zero imply direct correlation, whereas values less than zero imply inverse correlation. The color intensity used to show the strength of the relationships among themselves can easily be visualized as dark purple representing a negative relationship and the yellow represented in the middle of the line is a positive relationship.
Figure 9.
Correlation heatmap.
The fly ash and GGBS contents are perfectly negatively correlated (r = −1.00), since the two precursors together constitute 100% of the binder; likewise, the derived fly ash-to-GGBS ratio is strongly correlated with both constituents by construction. This is an exact correlation among the composition-related features: each of the sixteen, distinct levels of the composition features have exactly one corresponding fly ash value, whereas each of the three composition features carries exactly one corresponding value of fly ash/GGBS. Its impact on model behavior was therefore tested empirically, with the feature-set ablation results reported in Section 4.4. If any collinear predictor group is retained, permutated importance is not treated separately for each member of the group, but rather collectively; this is because it is not possible to determine which one of the collinear predictors is more important than the others. The parameter of fly ash to GGBS ratio so derived has a close positive relationship with fly ash and a close negative relationship with GGBS, as the mathematical formula predicted. Compressive strength is positively associated with GGBS content with a moderate degree of correlation, which is consistent with the known effect of slag in promoting calcium-rich binding gels and densifying the matrix. The positive correlation between compressive strength and NaOH molarity is weaker, implying that the molarity has a positive impact on enhancing the strength of the material. The compressive strength and the parameter-derived fly ash/GGBS ratio are negatively related and this supports the observation of the scatterplot of how the mix design affects the material strength. Water binder and compressive strength have a negative relationship, which is understandable given that it is known that the more water is used, the weaker the material becomes. Regarding the parameters of activators, there are moderate positive relationships between them and NaOH, SS/SH ratio and water-to-binder ratio, indicating a positive influence of the mix optimization process [65,66].
4.4. Predictor Set Selection and Treatment of Compositional Redundancy
The amounts of fly ash and GGBS are defined as WFA (weight fraction of fly ash) and WGGBS (weight fraction of GGBS), respectively, and are limited within the compiled database by the constraint WFA + WGGBS = 100. The ratio fly ash/GGBS is defined as WFA/W_GGBS and is constrained within the compiled database by WFA + WGGBS = 100. The simultaneous inclusion of the three composition-related predictors is thus redundant and supports a single independent dimension. Unlike ordinary least squares regression, precisely dependent explanations do not uniquely determine the importance of the features in the situation of numerical stability. Untransformed ratios could not be calculated for slag-free records and were also set in the compiled data set to a value with no physical meaning at the endpoints. The effect of predictor structure was investigated using an ablation study, where all four models were re-trained on the same hyperparameter settings, cross-validation protocol and random seeds for all three cases: Case S1: original six-feature set; Case S2: four-feature set, with the content of GGBS, molarity of NaOH, SS/SH ratio and water-to-binder ratio as the descriptors, and Case S3: four-feature set with GGBS content replaced by log(1 + fly ash/GGBS ratio), molarity of NaOH, SS/SH ratio and water-to-binder ratio. The results are summarized in Table 6. The two redundant composition predictors do not change reported metrics by any more than 0.006 in R2, which is within the 0.005 to 0.006 range of fold-to-fold for cross-validated estimates. To avoid duplication, it was decided that configuration S3 would be used for modeling from here on; the sentinel artefact will be left out of the feature space rather than simply being ignored.
Table 6.
Feature-set ablation: repeated stratified cross-validation.
The permutation importances calculated on the selected feature set also offer confirmation that all four predictors that are retained have a non-trivial influence, their order being NaOH molarity, water-to-binder ratio, log (1 + fly ash/GGBS ratio) and SS/SH ratio. Importantly, the SS/SH ratio and the water-to-binder ratio do not have bivariate statistically significant correlations with compressive strength but both relationships are material and important, indicating that the ensembles capture interactions that marginal correlation cannot capture.
5. Description of Applied Learning Models
Four tree-based ensemble regressors are used in this study: gradient boosting, XGBoost, LightGBM, and random forest. The methods have been chosen because they are extremely suitable for the problem under consideration. Tree-based ensembles can model nonlinear relationships between mix design variables, they require not too much data to learn, they have a high tolerance for variable scales, they are not prone to overfitting small-to-moderate sized databases like the one used here and they can supply interpretation feature importance results [67,68,69,70,71,72]. In contrast to artificial neural networks, however, which usually require much larger data sets for posterior good generalization and less understanding than single base learners (like a single decision tree or linear regression model), the latter only approximate the nonlinear interactions.
It is emphasized that the ensemble models are predictive rather than mechanistic tools; the mechanistic interpretation of strength development in this study is provided by the factorial experimental set and the supporting microstructural evidence, with the ML framework serving as a predictive tool within to compare the domain.
5.1. Gradient Boosting
Gradient boosting, first proposed by Friedman [73], is a family of ensemble learning techniques that build predictive models through an iterative, stage-wise optimization process. In this framework, weak learners commonly use decision trees that are sequentially trained to correct the residual errors of the combined ensemble from previous iterations. This additive learning strategy is guided by the minimization of a differentiable loss function, optimized through gradient descent techniques [74].
In predicting the compressive strength of alkali-activated mortar, the GB constructs the model as an additive expansion of weak base learners , such that
where denotes the learning rate, and is the base learner fitted at iteration t. Each base learner is fitted to the pseudo-residuals, which are the negative gradient of the differentiable loss function L, with respect to the prediction of the base learner, evaluated at the actual prediction of the base learner
where is the pseudo-residual of the i-th training instance at iteration t, is the measured compressive strength for the vector of mix design variables . In the present work, L is the squared error loss, for which the pseudo-residuals reduce to the ordinary residuals . This formulation enables GB to iteratively minimize prediction errors by directing each new learner toward the gradient of the loss, thereby refining the overall model accuracy at each stage. To further enhance generalization and reduce overfitting, a subsampling technique was employed, where random subsets of the training data were used to train each base learner. This random approach lowers variance, improves stability and reduces computational demands. The optimized GB model was implemented in Python [75] and evaluated using multiple statistical performance metrics to ensure high predictive reliability and robustness. A schematic overview of the GBM process is illustrated in Figure 10a.
Figure 10.
(a) Gradient boosting concept, (b) XGBoost training process, (c) LightGBM, and (d) random forest ensemble prediction approach.
5.2. XGBoost
XGBoost, developed by Chen and Guestrin (2016) [76], is a highly efficient and scalable implementation of the gradient boosting decision tree (GBDT) framework. Owing to its strong performance in managing nonlinear relationships and high-dimensional data, it has gained widespread adoption in both academic research and industrial applications [77,78]. In predicting the compressive strength of alkali-activated mortar, XGBoost offers notable advantages, including superior generalization capability, built in regularization to reduce overfitting, and effective handling of missing or sparse values [76,79]. Unlike conventional gradient boosting methods, XGBoost incorporates an additional regularization term within its objective function, which penalizes model complexity and enhances predictive stability [80].
The algorithm constructs an ensemble of decision trees sequentially, with each subsequent tree trained to predict the residual errors from the previous iteration. The iterative error correcting workflow of XGBoost is visually represented in Figure 10b. Through this iterative correction process, XGBoost efficiently minimizes the difference between observed and predicted outcomes [81,82]. Its support for parallel computation further enhances speed and scalability, making it particularly suitable for large and complex civil engineering datasets, including those used for modeling material performance [83,84]. Additionally, XGBoost accommodates a range of objective functions, including regression and classification, and also supports user-defined objectives, providing flexibility across diverse analytical tasks [73]. In this study, a regression objective function was employed due to the continuous nature of compressive strength.
5.3. LightGBM
LightGBM, developed by Microsoft Research Asia [85], is a gradient boosting framework designed to optimize both computational speed and memory efficiency. It utilizes a histogram-based decision tree algorithm and a leaf-wise growth strategy with a maximum depth constraint, resulting in substantially faster training and reduced computational cost compared to conventional level wise algorithms such as XGBoost [76,85]. In this method, continuous feature values are grouped into bins, and statistical summaries such as gradient sums and sample counts are aggregated to determine optimal split points efficiently [86]. This approach minimizes the storage and processing overhead caused by traditional floating point presorting methods used in standard GBDT frameworks.
Two primary innovations distinguish LightGBM from other boosting algorithms: gradient-based one-side sampling (GOSS) and exclusive feature bundling (EFB). GOSS focuses on retaining samples with large gradients while omitting those with smaller gradients, thus maintaining predictive accuracy while reducing computational demand [84,87]. EFB, meanwhile, combines mutually exclusive sparse features into a single vector, effectively lowering feature dimensionality without losing critical information [88]. Collectively, these strategies enable LightGBM to process large-scale datasets with remarkable efficiency. Structurally, LightGBM differs from XGBoost through its leaf-wise tree growth pattern, illustrated in Figure 10c [89,90]. This technique generates deeper and more complex trees, which, when properly constrained, facilitate faster convergence and enhanced predictive performance. Although this approach can increase the potential for overfitting, its capacity to handle categorical variables and perform parallel computation gives LightGBM a distinct advantage when dealing with high-dimensional, large-volume datasets [91].
5.4. Random Forest
The random forest algorithm, introduced by Breiman and Cutler, is recognized as one of the most reliable and widely applied machine learning methods in civil engineering due to its ensemble-based structure and strong resistance to overfitting [67]. In this study, RF was applied to predict the compressive strength of alkali-activated mortar, utilizing its capability to manage high-dimensional datasets and model complex nonlinear interactions effectively. RF constructs numerous decision trees during training and averages their individual outputs to improve predictive accuracy and generalization [68,69]. RF (Figure 10d) builds a collection of decision trees, where each tree is independently trained on a randomly drawn subset of the training data, and at each node a random subset of predictor variables is selected for splitting [70]. This approach, known as bagging with random feature selection, enhances model diversity, minimizes variance, and maintains interpretability [71].
In this work, the Random Forest Regressor from the Python scikit learn library was used, optimized for regression-based prediction. Fully developed binary decision trees were generated using the entire training dataset with bootstrap sampling enabled. The splitting criterion was based on minimizing the squared error, which measures the deviation between the predicted and actual compressive strength at each node [71]. A notable advantage of RF lies in its ability to determine Variable Importance Measures (VIMs). This is performed by permuting the values of each input variable across the out-of-bag (OOB) samples data excluded from a particular tree’s bootstrap sample and assessing the resulting change in prediction error. A larger increase in error after permutation signifies a higher influence of that feature on the model’s output [72]. This feature proves valuable in identifying the relative contribution of composition affecting the compressive strength of alkali-activated mortar.
6. Model Performance
Three common metrics of regression performance were used to quantify the predictive performance of each of the models: the coefficient of determination (R2), the root mean square error (RMSE) and the mean absolute error (MAE).
where Pi and Ti represent the experimental and predicted compressive strength values, respectively, denotes the mean value of the experimental data and j is the number of samples. The systematic component of the error was estimated by the mean bias error, defined as
where n is the number of records in the evaluation set. If the mean bias error was positive, this represents systematic over-prediction and if the mean bias error was negative, this represents systematic under-prediction. The model performance was tested by three-fold, stratified cross-validation, repeated on the entire database comprising 361 independent records. To obtain fifty independent evaluations for each model, five folds with different random seeds were used, with ten evaluations per fold, stratification was performed on quintiles of the compressive strength distribution, with the full response range represented in each fold. For each outer fold of training, an exhaustive grid search was performed to determine the configuration of hyperparameters that minimizes mean cross-validated RMSE, before being tested against the corresponding outer fold of test. This was done to ensure there is no information leakage between the hyperparameter search and evaluation process.
To prevent the difference between algorithms from being attributed to differences in target scales, all four models were trained on the raw response. The four fixed train–test partitions reported in Table 6 are not used to choose a preferred model and are retained as a sensitivity analysis of the influence of the train-test partition and its size. It should be noted that partitioning was performed at record level. The search space included all the main complexity and regularization controlling parameters of each algorithm learning rate, number of estimators, tree depth and model specific parameters (num leaves for LightGBM, max features for random forest, reg lambda for XGBoost and gradient boosting, subsample for gradient boosting and XGBoost). The ranges, slope and value of the hyperparameters searched impact the models, and the split results for both the models and the splits are summarized in Table 7.
Table 7.
Hyperparameter search spaces and selected values for the four ensemble models.
Table 8 provides a summative comparison of the model performance on four train–test splits (60/40, 70/30, 80/20 and 90/10) based on three evaluation measures, namely, RMSE, MAE and R2. Such a combined presentation enables the simultaneous evaluation of accuracy (R2) and the size of prediction error (RMSE and MAE), thereby permitting a more detailed evaluation of model robustness. In addition to the internal test set evaluation, Section 6.1 directly compares the experimentally measured strengths of the twelve mixes with the predictions of the four ML models, serving as an independent experimental comparison with the framework. The performance of the four ensembles on the four fixed partitions of train and test data is reported in Table 8 after retraining on the adopted feature set with the hyperparameter values given in Table 7. XGBoost attains the lowest error at the 70/30 and 80/20 partitions (R2 = 0.775 and 0.705) and gradient boosting at the 60/40 and 90/10 partitions (R2 = 0.698 and 0.762), with XGBoost within 0.010 of gradient boosting at the latter. LightGBM and random forest are consistently behind the two leading models across all four partitions, random forest returning the lowest R2 at three of the four.
Table 8.
Comparative performance of machine learning models across different train–test splits.
Cross-validation was carried out in record-level and group partitioning of the database. Record-level partitioning allows study-specific characteristics learned from the training partition to be rewarded at test time because they come from the same source publication, which also shares the same curing regime and experimental procedure, making records from the same publication not statistically independent. In order to quantify this effect, the publication source of each record was first identified and then the validation was repeated with grouped k-fold partitioning, where all records from the same publication are assigned to a separate fold. The 361 records were recovered from source publications in 31 distinct studies.
In the case of record-level cross validation, the coefficients of determination range from 0.740 to 0.791 and the RMSE varies between 8.73 and 9.77 MPa (Table 9). With study-grouped partitioning, however, performance drops drastically; even with the smallest study groups the coefficient of determination for all the models is negative from −0.654 to −0.231 and the root mean square error is approximately doubled, ranging from 18.11 to 20.12 MPa. A negative coefficient of determination indicates that, when an entire publication is withheld, the models predict its mixes less accurately than the mean of those mixes would. The range of fold-to-fold standard deviations from 0.476 to 1.139 also indicates that there is significant variation depending on the study being removed. Once the transformation is introduced again in this cross-validated model, XGBoost performance further declines to R2 = 0.740, underscoring the need for a transformation rather than the algorithm itself. Rather than this, all models have been trained with the same, untransformed response.
Table 9.
Model performance under record-level and study-grouped cross validation.
Figure 11a–d presents scatter plots illustrating the prediction accuracy of the machine learning models on the test datasets under different train–test split ratios. The subplots compare the predicted compressive strength values with the corresponding actual values for the gradient boosting, LightGBM, XGBoost and random forest models, providing a visual assessment of model performance.
Figure 11.
Scatter plots showing the prediction accuracy of ML models on test data.
The scatter plots show that the concentration of the test data decreases as the training proportion increases, and the 60/40 configuration produces the largest number of test samples, while the 90/10 configuration has the smallest. Nevertheless, a common trend is observed in all splits, where both predicted values approach the diagonal reference line, i.e., perfect agreement with experimental results as the training proportion increases. Precision in the prediction of individual points at the 60/40 split is between 60% and 88%, which is the highest among XGBoost, with the largest ranges between its own numbers and experimental figures (RMSE = 11.423 MPa, MAE = 8.663 MPa). In the lower strength, fly ash-dominant mixes and compressive strengths of 31–35 MPa, the worst case per sample accuracy in this setup, returns to about 60–65% worst case. When the 90/10 split is when accuracy of prediction is evaluated, it is found that the accuracy is significantly higher in all models. LightGBM has the greatest validation performance, with RMSE = 6.773 MPa, MAE = 5.112 MPa, and the greatest evenness = 0.841, denoting an average percent-by-sample comparison of about 89%, and each singular combination relates to 98–99% accuracy in a high strength slag fortune blend of about 57–58 MPa. Gradient boosting and random forest are similar at this split (RMSE 7.122 MPa and 6.795 MPa, respectively), whereas XGBoost advances on its R2 of 0.618 to 0.726, with the addition of the 90/10 ratio.
6.1. Comparison Between Experimental and ML-Predicted Compressive Strengths
The twelve mixes produced in this study were excluded from the training database and originate from independent raw material sources; the comparison in Figure 12 therefore constitutes an external comparison of the models rather than an internal test-set evaluation. The activator parameters of the twelve mixes, expressed in the model feature space through Equations (3) and (4), correspond to NaOH molarities of 1.39 to 2.23 M and SS/SH ratios of 0.214 to 0.444. Because only two Na2O levels and two silica moduli were investigated, the twelve mixes occupy four distinct activator states, all of which lie at or below the lower bound of the compiled activator range.
Figure 12.
Bar chart comparison of experimental results and ML model predictions for different train–test splits: (a) 80/20 and (b) 90/10.
The comparison is thus shown as in Figure 12a and Figure 12b for 80/20 and 90/10 configurations, respectively. Neither of these mixes were used for training and the models were created from independent matrix material sources, making Table 10 an externally validated form of testing rather than an internal test-set evaluation. These comparisons provide a clear quantitative basis for evaluating model performance at the individual mix level, while also highlighting the extent to which each model captures the experimental strength trends. In particular, the plots allow identification of systematic deviations, including under-prediction, over-prediction and convergence behavior, across different binder combinations. This detailed comparison forms the basis for assessing the reliability and consistency of each model in predicting compressive strength.
Table 10.
External validation metrics computed over the twelve withheld experimental mixes.
The comparative analysis of the four machine learning models gradient boosting (GB), LightGBM, XGBoost and random forest (RF) under 80/20 and 90/10 train–test split configurations highlights the influence of training data proportion on predictive performance. Increasing the training dataset from 80% to 90% generally improves model accuracy, as it enables better learning of the relationships between input variables and compressive strength. The metrics of Table 10 quantify this trend. Increasing the training proportion from 80% to 90% reduces the RMSE of gradient boosting from 28.92 MPa to 23.38 MPa, of LightGBM from 13.90 MPa to 10.09 MPa and of random forest from 17.05 MPa to 14.73 MPa, with the mean bias error decreasing in magnitude in each case. LightGBM gives the closest agreement with the measured strengths at both configurations, with RMSE = 10.09 MPa, MAE = 7.77 MPa and MBE = −7.69 MPa at the 90/10 split. The predictions of XGBoost are identical at the two configurations and span only 9.68 to 11.21 MPa against a measured range of 31.83 to 57.91 MPa, indicating that this model discriminates poorly between the twelve mixes in the low-activator region they occupy. The mean bias error is negative for every model at both configurations, so that the deviation from measurement is systematic under-prediction across the full compositional range rather than a random scatter or a bias confined to the high-strength mixes. The magnitude of this bias is consistent with the position of the twelve mixes at the low-activator boundary of the training domain, as set out above.
The framework therefore reproduces the relative ordering of binder compositions, but requires local calibration before absolute strengths are predicted for materials outside the compiled activator range. This trend is evident for GB, where accuracy increases from 24.61–41.20% to 34.05–54.41%, and for RF, which shows consistent improvement from 49.82–77.22% to 54.63–82.49%. In contrast, XGBoost exhibits consistently poor performance across both splits, with low accuracy values ranging from 17.66–31.42% and nearly constant predictions, indicating severe underfitting. This behavior suggests that, even after hyperparameter optimization (Table 7), the comparatively strong built-in regularization of XGBoost penalizes model complexity too heavily for a dataset of this size, biasing its predictions toward the mean and limiting its sensitivity to high-strength mixes [76,92].
At the mix level, C-6 recorded the highest experimental compressive strength of 57.91 MPa. While RF and LightGBM reasonably capture this trend, GB shows limited sensitivity to high-strength variations and XGBoost fails to represent it. Additionally, all models demonstrate a tendency to underpredict higher strength values, reflecting a bias toward mean predictions, which is commonly observed in ensemble models when trained on relatively small datasets [93,94]. Overall, LightGBM demonstrates the most superior and consistent performance among all models, achieving the highest accuracy range of 59.71–80.33% under the 80/20 split and further improving to 63.91–101.42% under the 90/10 split. Its strong responsiveness to increased training data and its ability to effectively model complex nonlinear relationships make it the most reliable and robust approach for compressive strength prediction in this study.
6.2. Limitations and Future Directions
All the machine learning models developed in this study are trained using 361 records from the literature, all of which represent ambient cured fly ash and GGBS systems. In this sense, their applicability domain is limited to this space of parameters and it would require retraining if other types of binders or curing parameters were to be explored. The models output point predictions, evaluated based on the R2, RMSE and MAE on four train–test splits, and the per mix errors are reported for the independent experimental mixes, although no uncertainty quantification is provided formally. Likewise, under-prediction bias was noticed for extreme strength values, which is common with small sampled ensemble learners.
The data is overrepresented by two features paired in various ways, while different feature combinations report comparable strengths, leading to a ceiling of R2 = 0.954 for any model trained on such data and an irreducible RMSE of 4.15 MPa for such a model. The mole fraction and molar perks of the twelve experimental mixes are beneath the database minimum–maximum on both the molarity and the SS/SH parameters, meaning that the external evaluation is extrapolation on both of those parameters and that the framework needs to be applied to mixes with activator dosages outside the range built in the database before retraining. Future studies should therefore account for prediction intervals based on quantile regression, conformal prediction, and Bayesian ensembles as well as using a wider range of multi-source data that also include raw material properties and curing conditions, in addition to durability data. Experimental verification at these compositional extremes, possibly with different curing and/or admixture strategies under the ambient curing and workability requirements of this study, is left for future investigation.
It is also worth noting that the ensemble models are not explicitly modeling the geopolymerization kinetics, gel formation or the evolution of the pore structure that determine strength development; they are simply capturing the statistical correlations between the mix design variables and the compression strength. Mechanistic insight from this study has, therefore, been gained without the use of models, but from the factorial analysis of variance and from the measurement of water absorption and the SEM observations. References to C-(N)-A-S-H, N-A-S-H or C-A-S-H gel assemblages should be understood as inter-predictive following established mechanisms reported on compositionally comparable gel assemblages only and not a result of the phase analysis of the present specimens. The gel assemblages would require complementary EDS, XRD, and FTIR characterization to establish them. Future studies should incorporate data-driven models with physics-informed or hybrid physics mechanisms and ML models.
7. Discussion
7.1. The Relationship of the Parameters to Previous Work
The analysis of variance given in Section 3.2 showed that, along with the silica modulus Na2O dosage 5.2%, the fly ash/GGBS ratio is responsible for 88.4% of the variation in 28-day compressive strength. Previous investigations on fly ash/GGBS systems have consistently shown that increasing slag content leads to increased strength and that the alkali dosage produces a positive but smaller effect [26,27,56]; however, these relationships have been demonstrated in one-factor-at-a-time studies only, which are unable to definitively separate the magnitude of the effects or the interactions between them. The present contribution is to estimate the hierarchy of the balanced factorial design and test it statistically. From the results obtained, it may be concluded that the proposal that increasing silica availability increases the percentage of gel for the range from 1.0 to 1.5 is not supported statistically, and that the effect, at so low a modulus, is not detectable against the wide range of experimental variation [50,51].
7.2. Application and Constraints of Training from the Literature
The predictive framework is consistently applied to the compiled database, and ultimately is validated by a cross-validated coefficient of determination of 0.793 against a grounded ceiling of 0.954 fixed by the duplicated feature combinations of the database. The analysis provided in Section 6.1 shows that casts of the experimental mixes are located at the low-activator extreme of the training domain on both the molarity axis and the SS/SH axis; hence, on the two latter axes, prediction interrelationships are extrapolative, but on the binder axis they are interpolative. A practical implication is specific: literature-based models used on this material class are used to give rankings instead of as absolute strength predictors, and have to be calibrated to a limited number of laboratory mixes before absolute strengths are applied to design. This is a usable and more defensible machine learning-based statement of the role of machine learning in the design of an alkali-activated mix than simply an accuracy number based on a locally divided dataset.
7.3. Comparison with Machine Learning Prediction for Other Stone Materials
Machine learning strength prediction does not work in a similar manner across different material classes and the divergence can be easily explained rather than just observed. Conventional concrete and heavy concrete are well supported by large reliable data sets with only a few carefully controlled parameters and reported accuracies are likewise high [40]. Lightweight and fiber-reinforced concretes fall in between; other variables that relate to fiber geometry, dosage and aggregate characteristics increase the parameter space; however, datasets are internally consistent since fiber–concrete mix design is conducted according to the same conventions as conventional mixes [41,42]. The worst conditions are alkali-activated systems and geopolymers. The parameter space includes precursor chemistry, activator type, modulus, dosage and curing regime; datasets are smaller and, crucially, prepared under a range of studies differing in raw material source and curing protocol, without encoding as a variety of variables [43,44]. The outcomes are directly quantifiable in the present work: 21.9% of the values collected share a predictor vector with another value and they report different strengths, with a spread of up to 37.98 MPa within a combination. This heterogeneity is indeed the main restriction in the accuracy that can be obtained in alkali-activated systems and is the reason for the lower and more variable reported accuracies when compared to conventional concrete.
7.4. Significance for the Construction of Buildings and Structures
The range of measured strengths for these mortars fell between 31.83 and 57.91 MPa, covering the strength range required for structural masonry mortars and also the strength range required for rendering and plastering applications and repair mortars. The higher flow values (195 to 200 mm) of these mixes, particularly C-3, C-6, C-9 and C-12 (strength range > 49 MPa at 28 days) are beneficial in terms of placement and finishing and the greater the flow value the higher the content of fly ash and the lower the strength of the mix. The result of the ambient curing should be emphasized in its constructional meaning. The main requirement preventing the use of fly ash-rich geopolymer systems in in situ construction is elevated temperature curing. The results of the present test have led to the conclusions that a slag content of 30% or more can replace thermal activation in attaining structural grade strength and that 95.4% of the 28-day strength is developed after 14 days, which is compatible with conventional construction programmers and striking schedules of formwork. On top of this, it is found that, apart from the use of silty cement, there is no need to use standard silica modulus reduction to achieve reduced embodied carbon and the expected sodium silicate dosage can also be lowered, which therefore provides a practical pathway to reduced embodied carbon mortars for production and placement using consistent site practice.
7.5. The Novelty and Significance of the Scientific Research
The novelty in this work is built upon three aspects that are never considered together from the perspective of this material system in previous studies. First, a balanced factorial design analyzed by analysis of variance is capable of providing a statistically tested parameter hierarchy instead of a qualitative ranking. Second, the ensemble models are evaluated through independent experiments using raw material sources outside the training database. This subjects the initial accuracy claims to a rigorous test of real-world transferability. Third, the extent to which the predictive framework can be applied is precisely stated in terms of the position of the target mixes within the training distribution; this is not assumed. Practically, it was found that the single design parameter that dictates the strength of the mix is the fly ash/GGBS ratio, and that the design parameters for activators can be chosen without mechanical penalty based on the cost and embodied carbon in the range considered. Data-driven prediction can be used to prescreen the candidate proportions, as long as the results are interpreted as a relative value.
8. Conclusions
In this study, a factorial experimental design was coupled with ensemble machine learning to predict and optimize the 28-day compressive strength of ambient cured alkali-activated fly ash and GGBS mortars, which clearly indicated that good mechanical properties can be obtained without any heat curing. The compressive strength in the 12 mixes ranged from 31.83 MPa to 57.91 MPa, the highest of which was in mortar containing a fly ash/GGBS ratio of 30:70, 5% Na2O along with a silica modulus of 1.0 (C-6). The influence of fly ash/GGBS ratio was determined by factorial analysis (∆ = 18.83 MPa) and suggested here that the higher the fraction of GGBS, the more calcium-rich C-(A)-S-H gels and hybrid N-(C)-A-S-H gels will be formed, leading to a denser and more compact microstructure, which was demonstrated separately with the reduction of water absorption as a result of SEM. The Na2O dosage had a moderate impact (∆ = 3.83 MPa), and under the same conditions the silica modulus was almost negligible (∆ = 0.31 MPa). The lower silica modulus (1.0) performed better than the higher (1.5).
The predictive component employed four ensemble regressors trained on 361 published records and evaluated at four train–test splits, prediction accuracy rising consistently with training size. LightGBM was the best and most stable, achieving R2 = 0.841, RMSE = 6.773 MPa and MAE = 5.112 MPa at the 90/10 split. Random forest and gradient boosting were comparable and XGBoost weaker. All models underestimated the highest strengths, as is common for ensemble learners trained on limited data.
The combination of ensemble machine learning with a targeted experimental program can substantially reduce the trial-and-error nature of mix design for alkali-activated systems, and clarifies the separate contributions of binder and activator chemistry. Prescreening candidate proportions before casting reduces the effort required and shortens the time needed to arrive at a suitable mix. The slag-rich mixes in particular develop the strength required for structural use, and, being attainable under ambient curing, they are suited to building material applications without the heat treatment that has limited the adoption of fly ash-rich systems.
Supplementary Materials
The following supporting information can be downloaded at: https://www.mdpi.com/article/10.3390/buildings16183637/s1.
Author Contributions
Conceptualization, J.S.S., M.S.M., K.N.S. and H.M.Y.; methodology, J.S.S. and K.N.S.; software, J.S.S.; validation, J.S.S., M.S.M., K.N.S. and H.M.Y.; formal analysis, J.S.S. and K.N.S.; investigation, J.S.S.; resources, J.S.S.; data curation, J.S.S. and K.N.S.; writing—original draft preparation, J.S.S.; writing—review and editing, M.S.M., K.N.S. and H.M.Y.; visualization, J.S.S., and K.N.S.; supervision, M.S.M., K.N.S. and H.M.Y.; project administration, K.N.S. and H.M.Y.; Funding acquisition, K.N.S. and H.M.Y. All authors have read and agreed to the published version of the manuscript.
Funding
This work was supported by the National Research Foundation of Korea (NRF), with a grant funded by the Korean government (MSIT) (No. RS-2023-00217322).
Data Availability Statement
The data that support the findings of this study are available from the corresponding author upon reasonable request.
Conflicts of Interest
The authors declare no conflicts of interest.
References
- Lee, N.K.; Jang, J.G.; Lee, H.K. Shrinkage characteristics of alkali-activated fly ash/slag paste and mortar at early ages. Cem. Concr. Compos. J. 2014, 53, 239–248. [Google Scholar] [CrossRef] [Scilit]
- Guades, E.J. Experimental investigation of the compressive and tensile strengths of geopolymer mortar: The effect of sand/fly ash (S/FA) ratio. Constr. Build. Mater. 2016, 127, 484–493. [Google Scholar] [CrossRef] [Scilit]
- Atis, C.D.; Görür, E.B.; Karahan, O.; Bilim, C.; Ilkentapar, S.; Luga, E. Very high strength (120 MPa) class F fly ash geopolymer mortar activated at different NaOH amount, heat curing temperature and heat curing duration. Constr. Build. Mater. J. 2015, 96, 673–678. [Google Scholar] [CrossRef] [Scilit]
- Niu, L.; Wu, S.; Andrew, R.M.; Shao, Z.; Wang, J.; Xi, F. Global and national CO2 uptake by cement carbonation from 1928 to 2024. Earth Syst. Sci. Data 2025, 17, 2231–2247. [Google Scholar] [CrossRef] [Scilit]
- Ige, O.E.; Kabeya, M. Decarbonizing the Cement Industry: Technological, Economic, and Policy Barriers to CO2 Mitigation Adoption. Clean Technol. 2025, 7, 85. [Google Scholar] [CrossRef] [Scilit]
- Ghanbari, M.; Hadian, A.M.; Nourbakhsh, A.A.; Mackenzie, K.J.D. Modeling and optimization of compressive strength and bulk density of metakaolin-based geopolymer using central composite design: A numerical and experimental study. Ceram. Int. 2016, 43, 324–335. [Google Scholar] [CrossRef] [Scilit]
- Turner, L.K.; Collins, F.G. Carbon dioxide equivalent (CO2-e) emissions: A comparison between geopolymer and OPC cement concrete. Constr. Build. Mater. J. 2013, 43, 125–130. [Google Scholar] [CrossRef] [Scilit]
- Nath, P.; Sarker, P.K. Composites, Use of OPC to improve setting and early strength properties of low calcium fly ash geopolymer concrete cured at room temperature. Cem. Concr. Compos. 2014, 55, 205–214. [Google Scholar] [CrossRef] [Scilit]
- Provis, J.L. Alkali-activated materials. Cem. Concr. Res. 2018, 114, 40–48. [Google Scholar] [CrossRef] [Scilit]
- Provis, J.L.; Bernal, S.A. Geopolymers and Related Alkali-Activated Materials. Annu. Rev. Mater. Res. 2014, 44, 299–327. [Google Scholar] [CrossRef] [Scilit]
- van Deventer, J.S.J.; Duxson, P.; Brice, D.G. Chemical Research and Climate Change as Drivers in the Commercial Adoption of Alkali Activated Materials. Waste Biomass Valor. 2010, 1, 145–155. [Google Scholar] [CrossRef] [Scilit]
- Ding, Y.; Dai, J.G.; Shi, C.-J. Mechanical Properties of Alkali-Activated Concrete: A State-of-the-Art Review. Constr. Build. Mater. 2016, 127, 68–79. [Google Scholar] [CrossRef] [Scilit]
- Topcu, T.U.I.B.; Toprak, M.U. Durability and microstructure characteristics of alkali activated coal bottom ash geopolymer cement. J. Clean. Prod. 2014, 81, 211–217. [Google Scholar] [CrossRef] [Scilit]
- Douiri, H.; Louati, S.; Baklouti, S.; Arous, M.; Fakhfakh, Z. Structural, thermal and dielectric properties of phosphoric acid-based geopolymers with different amounts of H3PO4. Mater. Lett. 2014, 116, 9–12. [Google Scholar] [CrossRef] [Scilit]
- Davidovits, J. Geopolymer Chemistry and Applications, 5th ed.; Institut Géopolymère: Saint-Quentin, France, 2020. [Google Scholar]
- Yasaswini, K.; Rao, A.V. Behaviour of geopolymer concrete at elevated temperature. Mater. Today Proc. 2020, 33, 239–244. [Google Scholar] [CrossRef] [Scilit]
- Almutairi, A.L.; Tayeh, B.A.; Adesina, A.; Isleem, H.F.; Zeyad, A.M. Potential applications of geopolymer concrete in construction: A review. Case Stud. Constr. Mater. 2021, 15, e00733. [Google Scholar] [CrossRef] [Scilit]
- Bernal, S.A.; Provis, J.L. Durability of Alkali-Activated Materials: Progress and Perspectives. J. Am. Ceram. Soc. 2014, 1008, 997–1008. [Google Scholar] [CrossRef] [Scilit]
- Wu, J.; Wong, H.S.; Zhang, H.; Yin, Q.; Jing, H.; Ma, D. Improvement of cemented rockfill by premixing low-alkalinity activator and fly ash for recycling gangue and partially replacing cement. Cem. Concr. Compos. 2024, 145, 105345. [Google Scholar] [CrossRef] [Scilit]
- Wu, J.; Yang, S.; Williamson, M.; Wong, H.S.; Bhudia, T.; Pu, H.; Yin, Q.; Ma, D.; Chen, W. Microscopic mechanism of cellulose nanofibers modified cemented gangue backfill materials. Adv. Compos. Hybrid. Mater. 2025, 8, 177. [Google Scholar] [CrossRef] [Scilit]
- Ma, D.; Gao, X.; Zhang, J. Co-exploitation of mine-derived geothermal energy: Recent advances and emerging perspectives. GeoEnergy Commun. 2025, 1, 12. [Google Scholar] [CrossRef] [Scilit]
- Kotwal, A.R.; Kim, Y.J.; Hu, J.; Sriraman, V. Characterization and Early Age Physical Properties of Ambient Cured Geopolymer Mortar Based on Class C Fly Ash. Int. J. Concr. Struct. Mater. 2015, 9, 35–43. [Google Scholar] [CrossRef] [Scilit]
- Pimraksa, K.; Chindaprasirt, P.; Rungchet, A.; Sagoe-crentsil, K.; Sato, T. Lightweight geopolymer made of highly porous siliceous materials with various. Mater. Sci. Eng. A 2011, 528, 6616–6623. [Google Scholar] [CrossRef] [Scilit]
- Nath, P.; Sarker, P.K. Effect of GGBFS on setting, workability and early strength properties of fly ash geopolymer concrete cured in ambient condition. Constr. Build. Mater. 2014, 66, 163–171. [Google Scholar] [CrossRef] [Scilit]
- Chithambaram, S.J.; Kumar, S.; Prasad, M.M. Thermo-mechanical characteristics of geopolymer mortar. Constr. Build. Mater. 2020, 213, 100–108. [Google Scholar] [CrossRef] [Scilit]
- Fang, G.; Ho, W.K.; Tu, W.; Zhang, M. Workability and mechanical properties of alkali-activated fly ash-slag concrete cured at ambient temperature. Constr. Build. Mater. 2018, 172, 476–487. [Google Scholar] [CrossRef] [Scilit]
- Ali, M.; Liebscher, M.; Hempel, S.; Yang, J.; Mechtcherine, V. Correlation of microstructural and mechanical properties of geopolymers produced from fly ash and slag at room temperature. Constr. Build. Mater. 2018, 191, 330–341. [Google Scholar] [CrossRef] [Scilit]
- Topark-Ngarm, P.; Chindaprasirt, P.; Sata, V. Setting Time, Strength, and Bond of High-Calcium Fly Ash Geopolymer Concrete. J. Mater. Civ. Eng. 2015, 27, 04014198. [Google Scholar] [CrossRef] [Scilit]
- Pratap, B.; Mondal, S.; Rao, B.H. Synthesis of alkali-activated mortar using phosphogypsum-neutralised bauxite residue. Environ. Geotech. 2025, 11, 753–764. [Google Scholar] [CrossRef] [Scilit]
- Assi, L.; Deaver, E.E.; Ziehl, P. Effect of source and particle size distribution on the mechanical and microstructural properties of fly ash-based geopolymer concrete. Constr. Build. Mater. 2018, 167, 372–380. [Google Scholar] [CrossRef] [Scilit]
- Soni, N.; Shukla, D.K. Analytical study on mechanical properties of concrete containing crushed recycled coarse aggregate as an alternative of natural sand. Constr. Build. Mater. 2021, 266, 120595. [Google Scholar] [CrossRef] [Scilit]
- Kaveh, A.; Gholipour, Y.; Rahami, H. Optimal Design of Transmission owers Using Genetic Algorithm and Neural Networks. Int. J. Sp. Struct. 2008, 23, 1–19. [Google Scholar] [CrossRef] [Scilit]
- Kumar, P.; Pratap, B. Feature engineering for predicting compressive strength of high—strength concrete with machine learning models. Asian J. Civ. Eng. 2024, 25, 723–736. [Google Scholar] [CrossRef] [Scilit]
- Raza, F.; Alshameri, B.; Jamil, S.M. Assessment of Triple Bottom Line of Sustainability for Geotechnical Projects. Environ. Dev. Sustain. 2021, 23, 4521–4558. [Google Scholar] [CrossRef] [Scilit]
- Ahmad, A.; Ostrowski, K.A.; Ma, M.; Farooq, F.; Mehmood, I. Comparative Study of Supervised Machine Learning Algorithms for Predicting the Compressive Strength of Concrete at High Temperature. Materials 2021, 14, 4222. [Google Scholar] [CrossRef] [Scilit] [PubMed]
- Nazar, S.; Yang, J.; Nasir, M.; Khan, K.; Ashraf, M.; Aslam, F.; Faisal, M.; Eldin, S.M. Machine learning interpretable-prediction models to evaluate the slump and strength of fly ash-based geopolymer. J. Mater. Res. Technol. 2023, 24, 100–124. [Google Scholar] [CrossRef] [Scilit]
- Dash, P.K.; Parhi, S.K.; Patro, S.K.; Panigrahi, R. Influence of chemical constituents of binder and activator in predicting compressive strength of fly ash-based geopolymer concrete using firefly-optimized hybrid ensemble machine learning model. Mater. Today Commun. 2023, 37, 107485. [Google Scholar] [CrossRef] [Scilit]
- Shen, J.; Li, Y.; Lin, H.; Li, H.; Lv, J.; Feng, S.; Ci, J. Prediction of compressive strength of alkali-activated construction demolition waste geopolymers using ensemble machine learning. Constr. Build. Mater. 2022, 360, 129600. [Google Scholar] [CrossRef] [Scilit]
- Amin, M.N.; Khan, K.; Ahmad, W.; Javed, M.F.; Qureshi, H.J.; Saleem, M.U.; Qadir, M.G.; Faraz, M.I. Compressive Strength Estimation of Geopolymer Composites Through Novel Computational Approaches. Polymers 2022, 14, 2128. [Google Scholar] [CrossRef] [Scilit] [PubMed]
- Beskopylny, A.N.; Stel’makh, S.A.; Shcherban’, E.M.; Mailyan, L.R.; Meskhi, B.; Razveeva, I.; Kozhakin, A.; Pembek, A.; Elshaeva, D.; Chernil’nik, A.; et al. Prediction of the Compressive Strength of Vibrocentrifuged Concrete Using Machine Learning Methods. Buildings 2024, 14, 377. [Google Scholar] [CrossRef] [Scilit]
- Pakzad, S.S.; Roshan, N.; Ghalehnovi, M. Comparison of various machine learning algorithms used for compressive strength prediction of steel fiber-reinforced concrete. Sci. Rep. 2023, 13, 3646. [Google Scholar] [CrossRef] [Scilit] [PubMed]
- Dai, L.; Wu, X.; Zhou, M.; Ahmad, W.; Ali, M.; Sabri, M.M.S.; Salmi, A.; Ewais, D.Y.Z. Using Machine Learning Algorithms to Estimate the Compressive Property of High Strength Fiber Reinforced Concrete. Materials 2022, 15, 4450. [Google Scholar] [CrossRef] [Scilit] [PubMed]
- Rathnayaka, M.; Karunasinghe, D.; Gunasekara, C.; Wijesundara, K.; Lokuge, W.; Law, D.W. Machine learning approaches to predict compressive strength of fly ash-based geopolymer concrete: A comprehensive review. Constr. Build. Mater. 2024, 419, 135519. [Google Scholar] [CrossRef] [Scilit]
- Le, Q.; Nguyen, D.; Sang-to, T.; Khatir, S.; Le-minh, H.; Gandomi, A.H.; Cuong-Le, T. Machine learning based models for predicting compressive strength of geopolymer concrete. Front. Struct. Civ. Eng. 2024, 18, 1028–1049. [Google Scholar] [CrossRef] [Scilit]
- Parhi, S.K.; Patro, S.K. Prediction of compressive strength of geopolymer concrete using a hybrid ensemble of grey wolf optimized machine learning estimators. J. Build. Eng. 2023, 71, 106521. [Google Scholar] [CrossRef] [Scilit]
- Huang, B.; Bahrami, A.; Javed, M.F.; Azim, I.; Iqbal, M.A. Evolutionary Algorithms for Strength Prediction of Geopolymer Concrete. Buildings 2024, 14, 1347. [Google Scholar] [CrossRef] [Scilit]
- Tran, N.T.; Nguyen, D.H.; Tran, Q.T.; Le, H.V.; Nguyen, D.L. Experimental and machine learning based study of compressive strength of geopolymer concrete. Mag. Concr. Res. 2024, 76, 723–737. [Google Scholar] [CrossRef] [Scilit]
- Sivakumar, P.P.; Villagrán-Zaccardi, Y.A.; Lapauw, T.; Gruyaert, E.; Matthys, S.; De Belie, N. Durability Performance of Hybrid Binder Concretes Containing Non-Ferrous Slag and Recycled Aggregates. Sustainability 2023, 15, 6338. [Google Scholar] [CrossRef] [Scilit]
- Duxson, P.; Fernandez-Jimenz, A.; Provis, J.L.; Lukey, G.C.; Palomo, A.; van Deventer, J.S.J. Geopolymer technology: The current state of the art. J. Mater. Sci. 2007, 42, 2917–2933. [Google Scholar] [CrossRef] [Scilit]
- Xu, H.; Van Deventer, J.S.J. The geopolymerisation of alumino-silicate minerals. Int. J. Miner. Process. 2000, 59, 247–266. [Google Scholar] [CrossRef] [Scilit]
- Palomo, A.; Grutzeck, M.W.; Blanco, M.T. Alkali-activated fly ashes A cement for the future. Cem. Concr. Res. 1999, 29, 1323–1329. [Google Scholar] [CrossRef] [Scilit]
- Bernal, S.A.; Mejía, R.; Gutiérrez, D.; Pedraza, A.L.; Provis, J.L.; Rodriguez, E.D.; Delvasto, S. Effect of binder content on the performance of alkali-activated slag concretes. Cem. Concr. Res. 2011, 41, 1–8. [Google Scholar] [CrossRef] [Scilit]
- Soundar Rajan, M.; AnuPriya, A. Development and Properties of Low-Calcium Fly Ash-Based Geo polymer Concrete. Int. J. Innov. Res. Adv. Eng. 2024, 11, 465–469. [Google Scholar] [CrossRef] [Scilit]
- Wang, S.D.; Pu, X.C.; Scrivener, K.L.; Pratt, P.L. Alkali-activated slag cement and concrete: A review of properties and problems. Adv. Cem. Res. 1995, 7, 93–102. [Google Scholar] [CrossRef] [Scilit]
- Humad, A.M.; Kothari, A.; Provis, J.L.; Cwirzen, A. The effect of blast furnace slag/fly ash ratio on setting, strength, and shrinkage of alkali-activated pastes and concretes. Front. Mater. 2019, 6, 425458. [Google Scholar] [CrossRef] [Scilit]
- Padha, K.; Lalotra, S.; Bhardwaj, S. Experimental Study on the Properties of Concrete using Alkali Activated Fly Ash and GGBS as a Binder. Int. J. Res. Appl. Sci. Eng. Technol. 2020, 8, 442–450. [Google Scholar] [CrossRef] [Scilit]
- IS 4031; Methods of Physical Tests for Hydraulic Cement. Bureau of Indian Standards: New Delhi, India, 1988.
- IS 516; Methods of Tests for Strength of Concrete. Bureau of Indian Standards: New Delhi, India, 1959.
- ASTM C642-21; Standard Test Method for Density, Absorption, and Voids in Hardened Concrete. ASTM International: West Conshohocken, PA, USA, 2023; pp. 8–10. [CrossRef] [Scilit]
- Ali, A.A.; Al-attar, T.S.; Abbas, W.A. Mechanical Performance of Blended Fly Ash-based Geopolymer Concrete with GGBS and Metakaolin. Eng. Technol. J. 2022, 40, 819–831. [Google Scholar] [CrossRef] [Scilit]
- Ma, Z.; Dan, H.; Tan, J.; Li, M.; Li, S. Optimization Design of MK-GGBS Based Geopolymer Repairing Mortar Based on Response Surface Methodology. Materials 2023, 16, 1889. [Google Scholar] [CrossRef] [Scilit] [PubMed]
- Satyanarayana, G.V.V.; Greeshma, K. Investigation on alkali activated fly ash and slag concrete using neutral grade water glass as activator. E3S Web Conf. 2021, 309, 01195. [Google Scholar] [CrossRef] [Scilit]
- Wu, C.; Xia, D.; Li, B. A comprehensive study on alkali-activated slag-based concrete: Mechanical properties and sustainability evaluation. Constr. Build. Mater. 2025, 489, 142374. [Google Scholar] [CrossRef] [Scilit]
- Al-Majidi, M.H.; Lampropoulos, A.; Cundy, A. Effect of alkaline activator, water, Superplsticiser and slag contents on the compressive strength and workability of slag fly based geopolymer mortar cured under ambient temperature. Int. J. Civ. Eng. Constr. 2016, 10, 308–312. [Google Scholar]
- Mostafa, N.T.; Taleshi, M. Prediction of pull-out behavior of timber glued-in glass fiber reinforced polymer and steel rods under various environmental conditions based on ANN and GEP models. Case Stud. Constr. Mater. 2024, 20, e02842. [Google Scholar] [CrossRef] [Scilit]
- Mahmoudian, A.; Tajik, N.; Mohammadzadeh, M.; Shakiba, M. Ensemble machine learning-based approach with genetic algorithm optimization for predicting bond strength and failure mode in concrete-GFRP mat anchorage interface. Structures 2023, 57, 105173. [Google Scholar] [CrossRef] [Scilit]
- Breiman, L. Random Forests. Mach. Learn. 2001, 45, 5–32. [Google Scholar] [CrossRef] [Scilit]
- Mutanga, O.; Adam, E.; Azong, M. High density biomass estimation for wetland vegetation using WorldView-2 imagery and random forest regression algorithm. Int. J. Appl. Earth Obs. Geoinf. 2012, 18, 399–406. [Google Scholar] [CrossRef] [Scilit]
- Gupta, G.K.; Sharma, D.K. A Review of Overfitting Solutions in Smart Depression Detection Models. In Proceedings of the 2022 9th International Conference on Computing for Sustainable Global Development (INDIACom), New Delhi, India, 23–25 March 2022. [Google Scholar] [CrossRef] [Scilit]
- Wang, Q.; Zhou, Y.U.N.; Ding, W.; Zhang, Z.; Muhammad, K. Random Forest with Self-paced Bootstrap Learning in Lung Cancer Prognosis. ACM Trans. Multim. Comput. Commun. Appl. 2020, 16, 1–12. [Google Scholar] [CrossRef] [Scilit]
- Han, Q.; Gui, C.; Xu, J.; Lacidogna, G. A generalized method to predict the compressive strength of high- performance concrete by improved random forest algorithm. Constr. Build. Mater. 2019, 226, 734–742. [Google Scholar] [CrossRef] [Scilit]
- Liaw, A.; Wiener, M. Classification and Regression by randomForest. R News 2002, 2, 18–22. [Google Scholar]
- Friedman, J.H. Greedy function approximation: A gradient boosting machine. Ann. Stat. 2001, 29, 1189–1232. [Google Scholar] [CrossRef] [Scilit]
- Islam, S.; Amin, S.H. Prediction of probable backorder scenarios in the supply chain using Distributed Random Forest and Gradient Boosting Machine learning techniques. J. Big Data 2020, 7, 65. [Google Scholar] [CrossRef] [Scilit]
- Van Rossum, G.; Python Development Team. Python Tutorial, Release 3.10.0; Python Software Foundation: Wilmington, DE, USA, 2021. [Google Scholar]
- Chen, T.; Guestrin, C. XGBoost: A Scalable Tree Boosting System. In Proceedings of the 22nd ACM SIGKDD International Conference on Knowledge Discovery and Data Mining (KDD’16), San Francisco, CA, USA, 13–17 August 2016. [Google Scholar] [CrossRef] [Scilit]
- Bakouregui, A.S.; Mohamed, H.M.; Yahia, A.; Benmokrane, B. Explainable extreme gradient boosting tree-based prediction of load-carrying capacity of FRP-RC columns. Eng. Struct. 2021, 245, 112836. [Google Scholar] [CrossRef] [Scilit]
- Kavzoglu, T.; Teke, A. Advanced hyperparameter optimization for improved spatial prediction of shallow landslides using extreme gradient boosting (XGBoost). Bull. Eng. Geol. Environ. 2022, 81, 201. [Google Scholar] [CrossRef] [Scilit]
- Zhang, L.; Zhan, C. Machine Learning in Rock Facies Classification: An Application of XGBoost. In Proceedings of the International Geophysical Conference, Qingdao, China, 17–20 April 2017. [Google Scholar] [CrossRef] [Scilit]
- Rzychon, M.; Róg, A.Z.; Rog, L. SHAP-based Interpretation of an XGBoost Model in the Prediction of Grindability of Coals and Their Blends. Int. J. Coal Prep. Util. 2021, 42, 3348–3368. [Google Scholar] [CrossRef] [Scilit]
- Hengl, T.; Leenaars, J.G.B.; Shepherd, K.D.; Walsh, M.G.; Heuvelink, G.B.M.; Mamo, T.; Tilahun, H.; Berkhout, E.; Cooper, M.; Fegraus, E.; et al. Soil nutrient maps of Sub-Saharan Africa: Assessment of soil nutrient content at 250 m spatial resolution using machine learning. Nutr. Cycl. Agroecosystems 2017, 109, 77–102. [Google Scholar] [CrossRef] [Scilit] [PubMed]
- Zhang, D.; Qian, L.; Mao, B.; Huang, C.A.N.; Huang, B.I.N. A Data-Driven Design for Fault Detection of Wind Turbines Using Random Forests and XGboost. IEEE Access 2018, 6, 21020–21031. [Google Scholar] [CrossRef] [Scilit]
- Ma, J.; Yu, Z.; Qu, Y.; Cao, Y. Application of the XGBoost Machine Learning Method in PM 2. 5 Prediction: A Case Study of Shanghai. Aerosol Air Qual. Res. 2020, 20, 128–138. [Google Scholar] [CrossRef] [Scilit]
- Algorithms, L.; Liang, W.; Luo, S.; Zhao, G. Predicting Hard Rock Pillar Stability Using GBDT, XGBoost, and LightGBM Algorithms. Mathematics 2020, 8, 765. [Google Scholar] [CrossRef] [Scilit]
- Ke, G.; Meng, Q.; Finley, T.; Wang, T.; Chen, W.; Ma, W.; Ye, Q.; Liu, T.-Y. LightGBM: A Highly Efficient Gradient Boosting Decision Tree. In Proceedings of the 31st Conference on Neural Information Processing Systems (NeurIPS 2017), Long Beach, CA, USA, 4–9 December 2017; pp. 3146–3154. Available online: https://github.com/Microsoft/LightGBM (accessed on 24 March 2026).
- Zeng, H.; Yang, C.; Zhang, H.; Wu, Z.; Zhang, J.; Dai, G.; Babiloni, F.; Kong, W. A LightGBM-Based EEG Analysis Method for Driver Mental States Classification. Comput. Intell. Neurosci. 2019, 2019, 3761203. [Google Scholar] [CrossRef] [Scilit] [PubMed]
- Ma, M.; Zhao, G.; He, B.; Li, Q.; Dong, H.; Wang, S.; Wang, Z. XGBoost-based method for flash flood risk assessment. J. Hydrol. 2021, 598, 126382. [Google Scholar] [CrossRef] [Scilit]
- Mohammadi, M.; Hadavimoghaddam, F.; Pourmahdi, M. Modeling Hydrogen Solubility in Hydrocarbons Using Extreme Gradient Boosting and Equations of State. Sci. Rep. 2021, 11, 17911. [Google Scholar] [CrossRef] [Scilit] [PubMed]
- Li, F.; Zhang, L.; Chen, B.; Gao, D.; Cheng, Y.; Zhang, X.; Yang, Y.; Gao, K.; Huang, Z.; Peng, J. A Light Gradient Boosting Machine for Remainning Useful Life Estimation of Aircraft Engines. In Proceedings of the 2018 21st International Conference on Intelligent Transportation Systems (ITSC), Maui, HI, USA, 4–7 November 2018; pp. 3562–3567. [Google Scholar] [CrossRef] [Scilit]
- Chun, P.; Izumi, S.; Yamane, T. Automatic detection method of cracks from concrete surface imagery using two-step light gradient boosting machine. Comput. Civ. Infrastruct. Eng. 2021, 36, 61–72. [Google Scholar] [CrossRef] [Scilit]
- Hancock, J.; Khoshgoftaar, T.M. Leveraging LightGBM for Categorical Big Data. In Proceedings of the 2021 IEEE Seventh International Conference on Big Data Computing Service and Applications (BigDataService), Virtual, 23–26 August 2021; pp. 149–154. [Google Scholar] [CrossRef] [Scilit]
- Nguyen, N.H.; Abellán-García, J.; Lee, S.; Garcia-Castano, E.; Vo, T.P. Efficient estimating compressive strength of ultra-high performance concrete using XGBoost model. J. Build. Eng. 2022, 52, 104302. [Google Scholar] [CrossRef] [Scilit]
- Belitz, K.; Stackelberg, P.E. Evaluation of six methods for correcting bias in estimates from ensemble tree machine learning regression models. Environ. Model. Softw. 2021, 139, 105006. [Google Scholar] [CrossRef] [Scilit]
- Mienye, I.D.; Sun, Y. A Survey of Ensemble Learning: Concepts, Algorithms, Applications, and Prospects. IEEE Access 2022, 10, 99129–99149. [Google Scholar] [CrossRef] [Scilit]
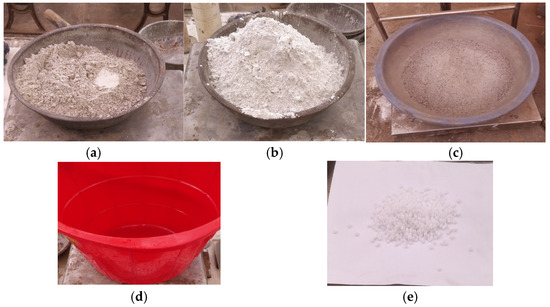
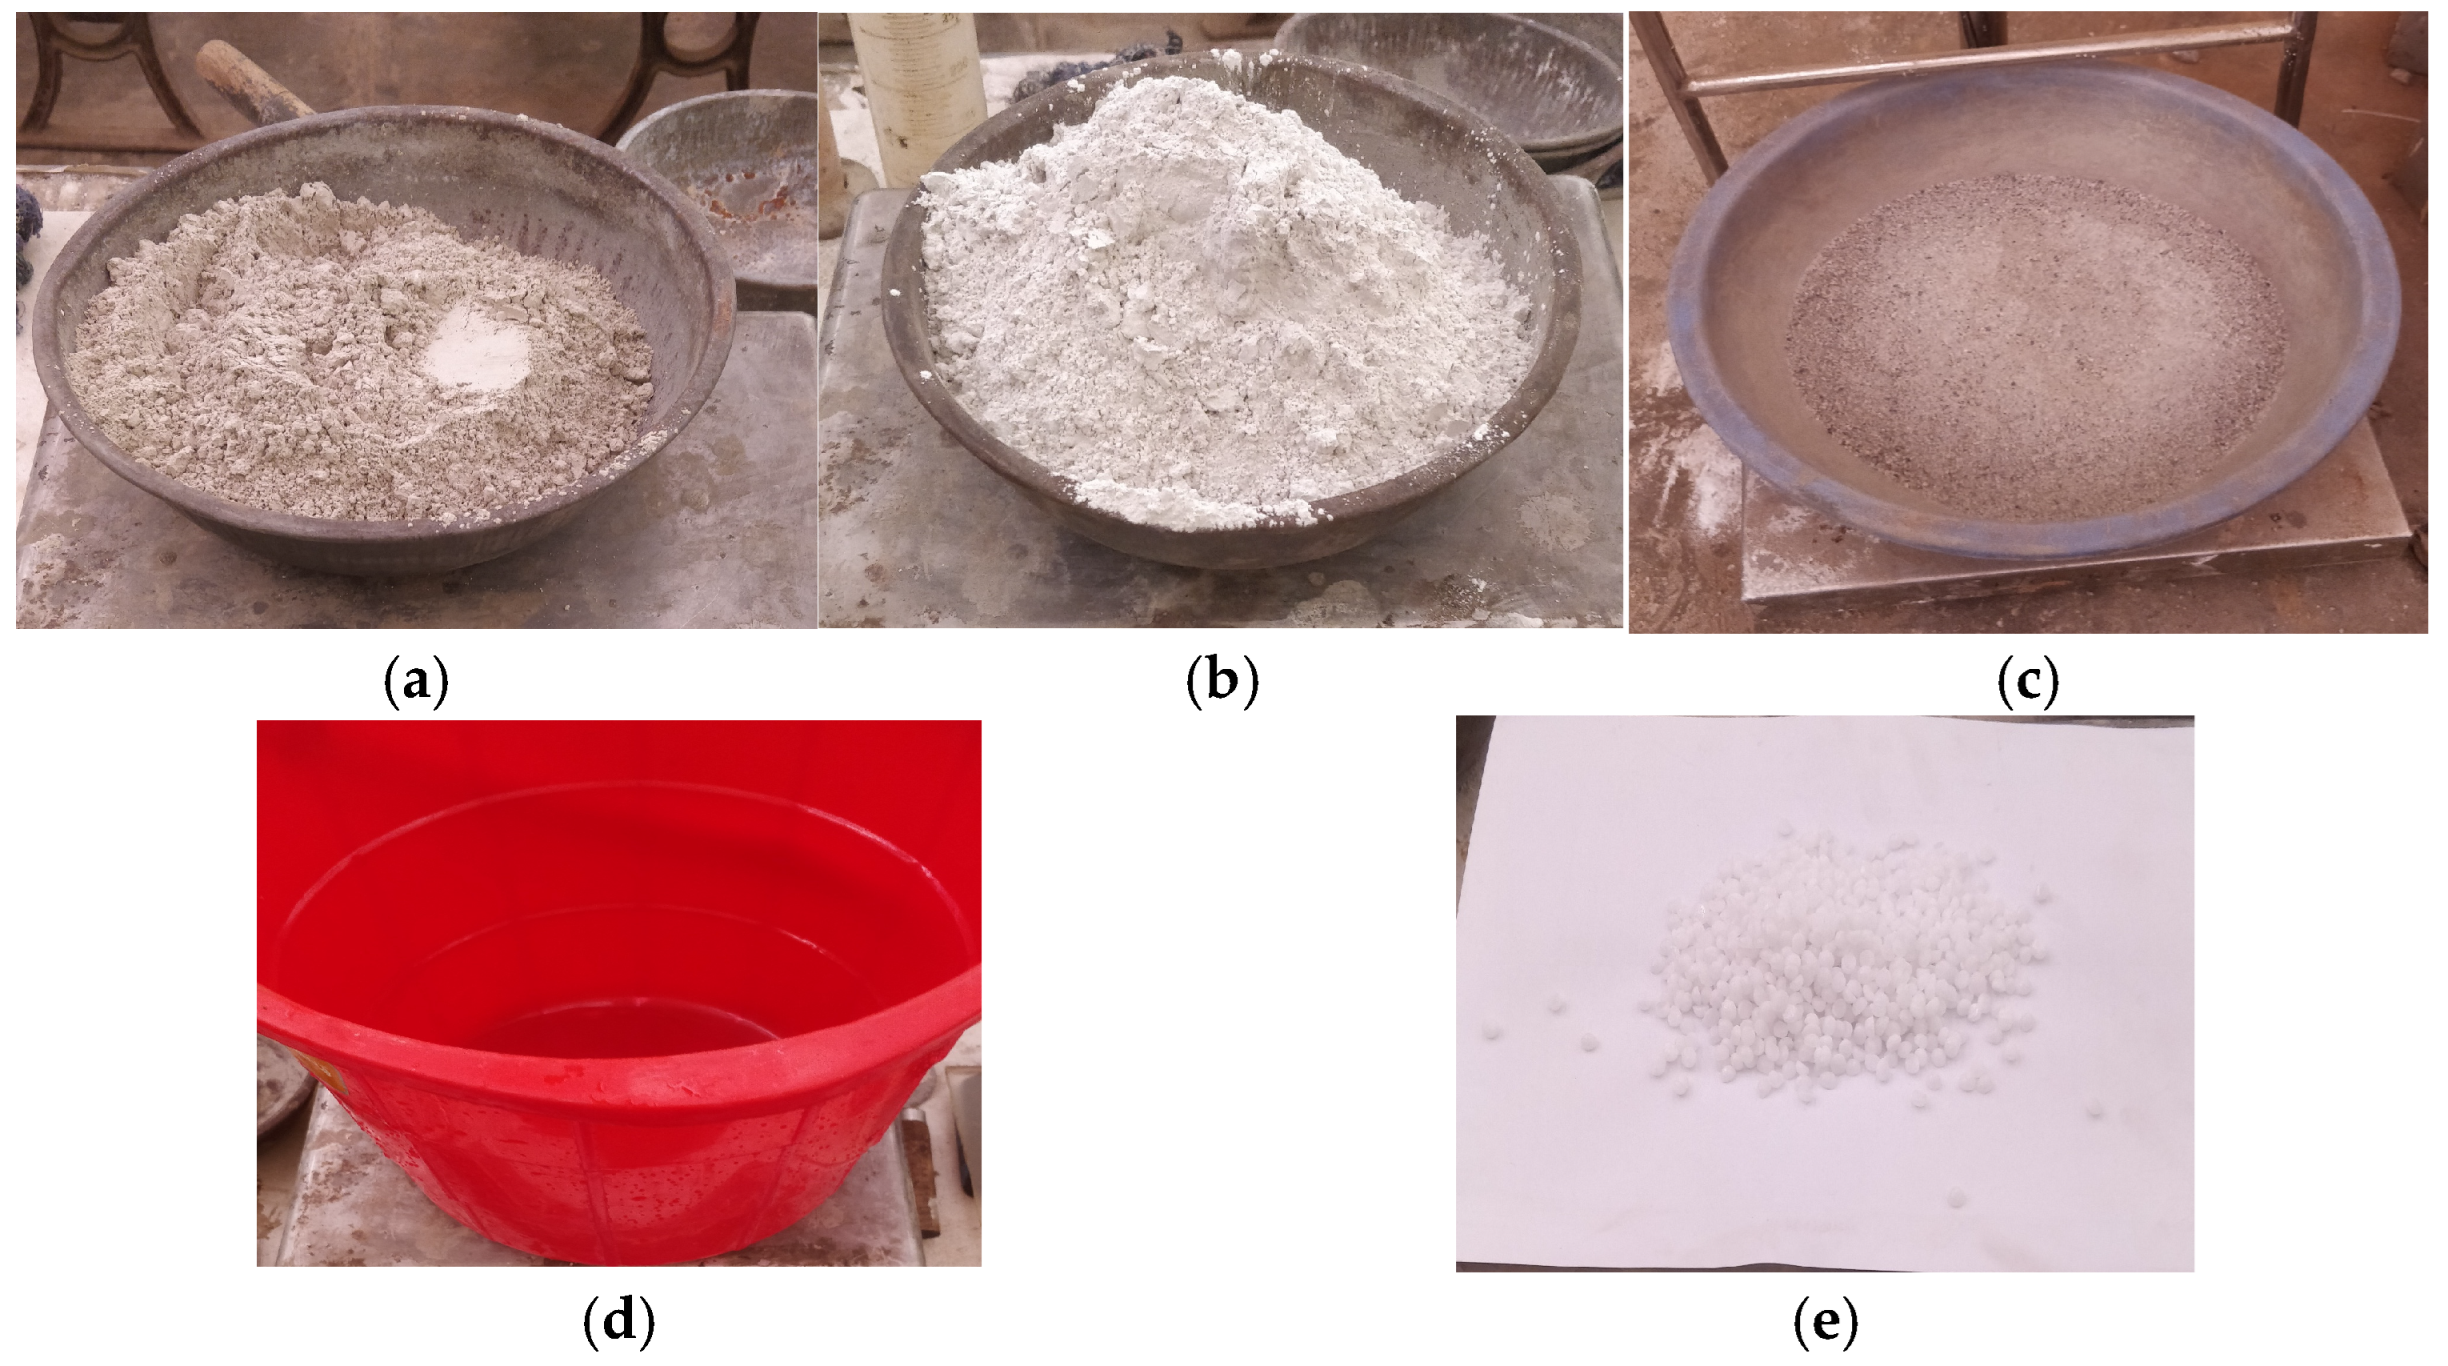
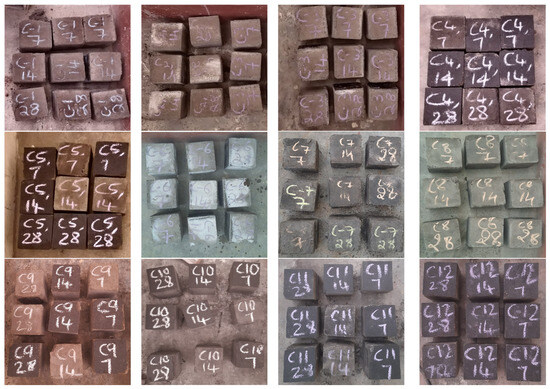
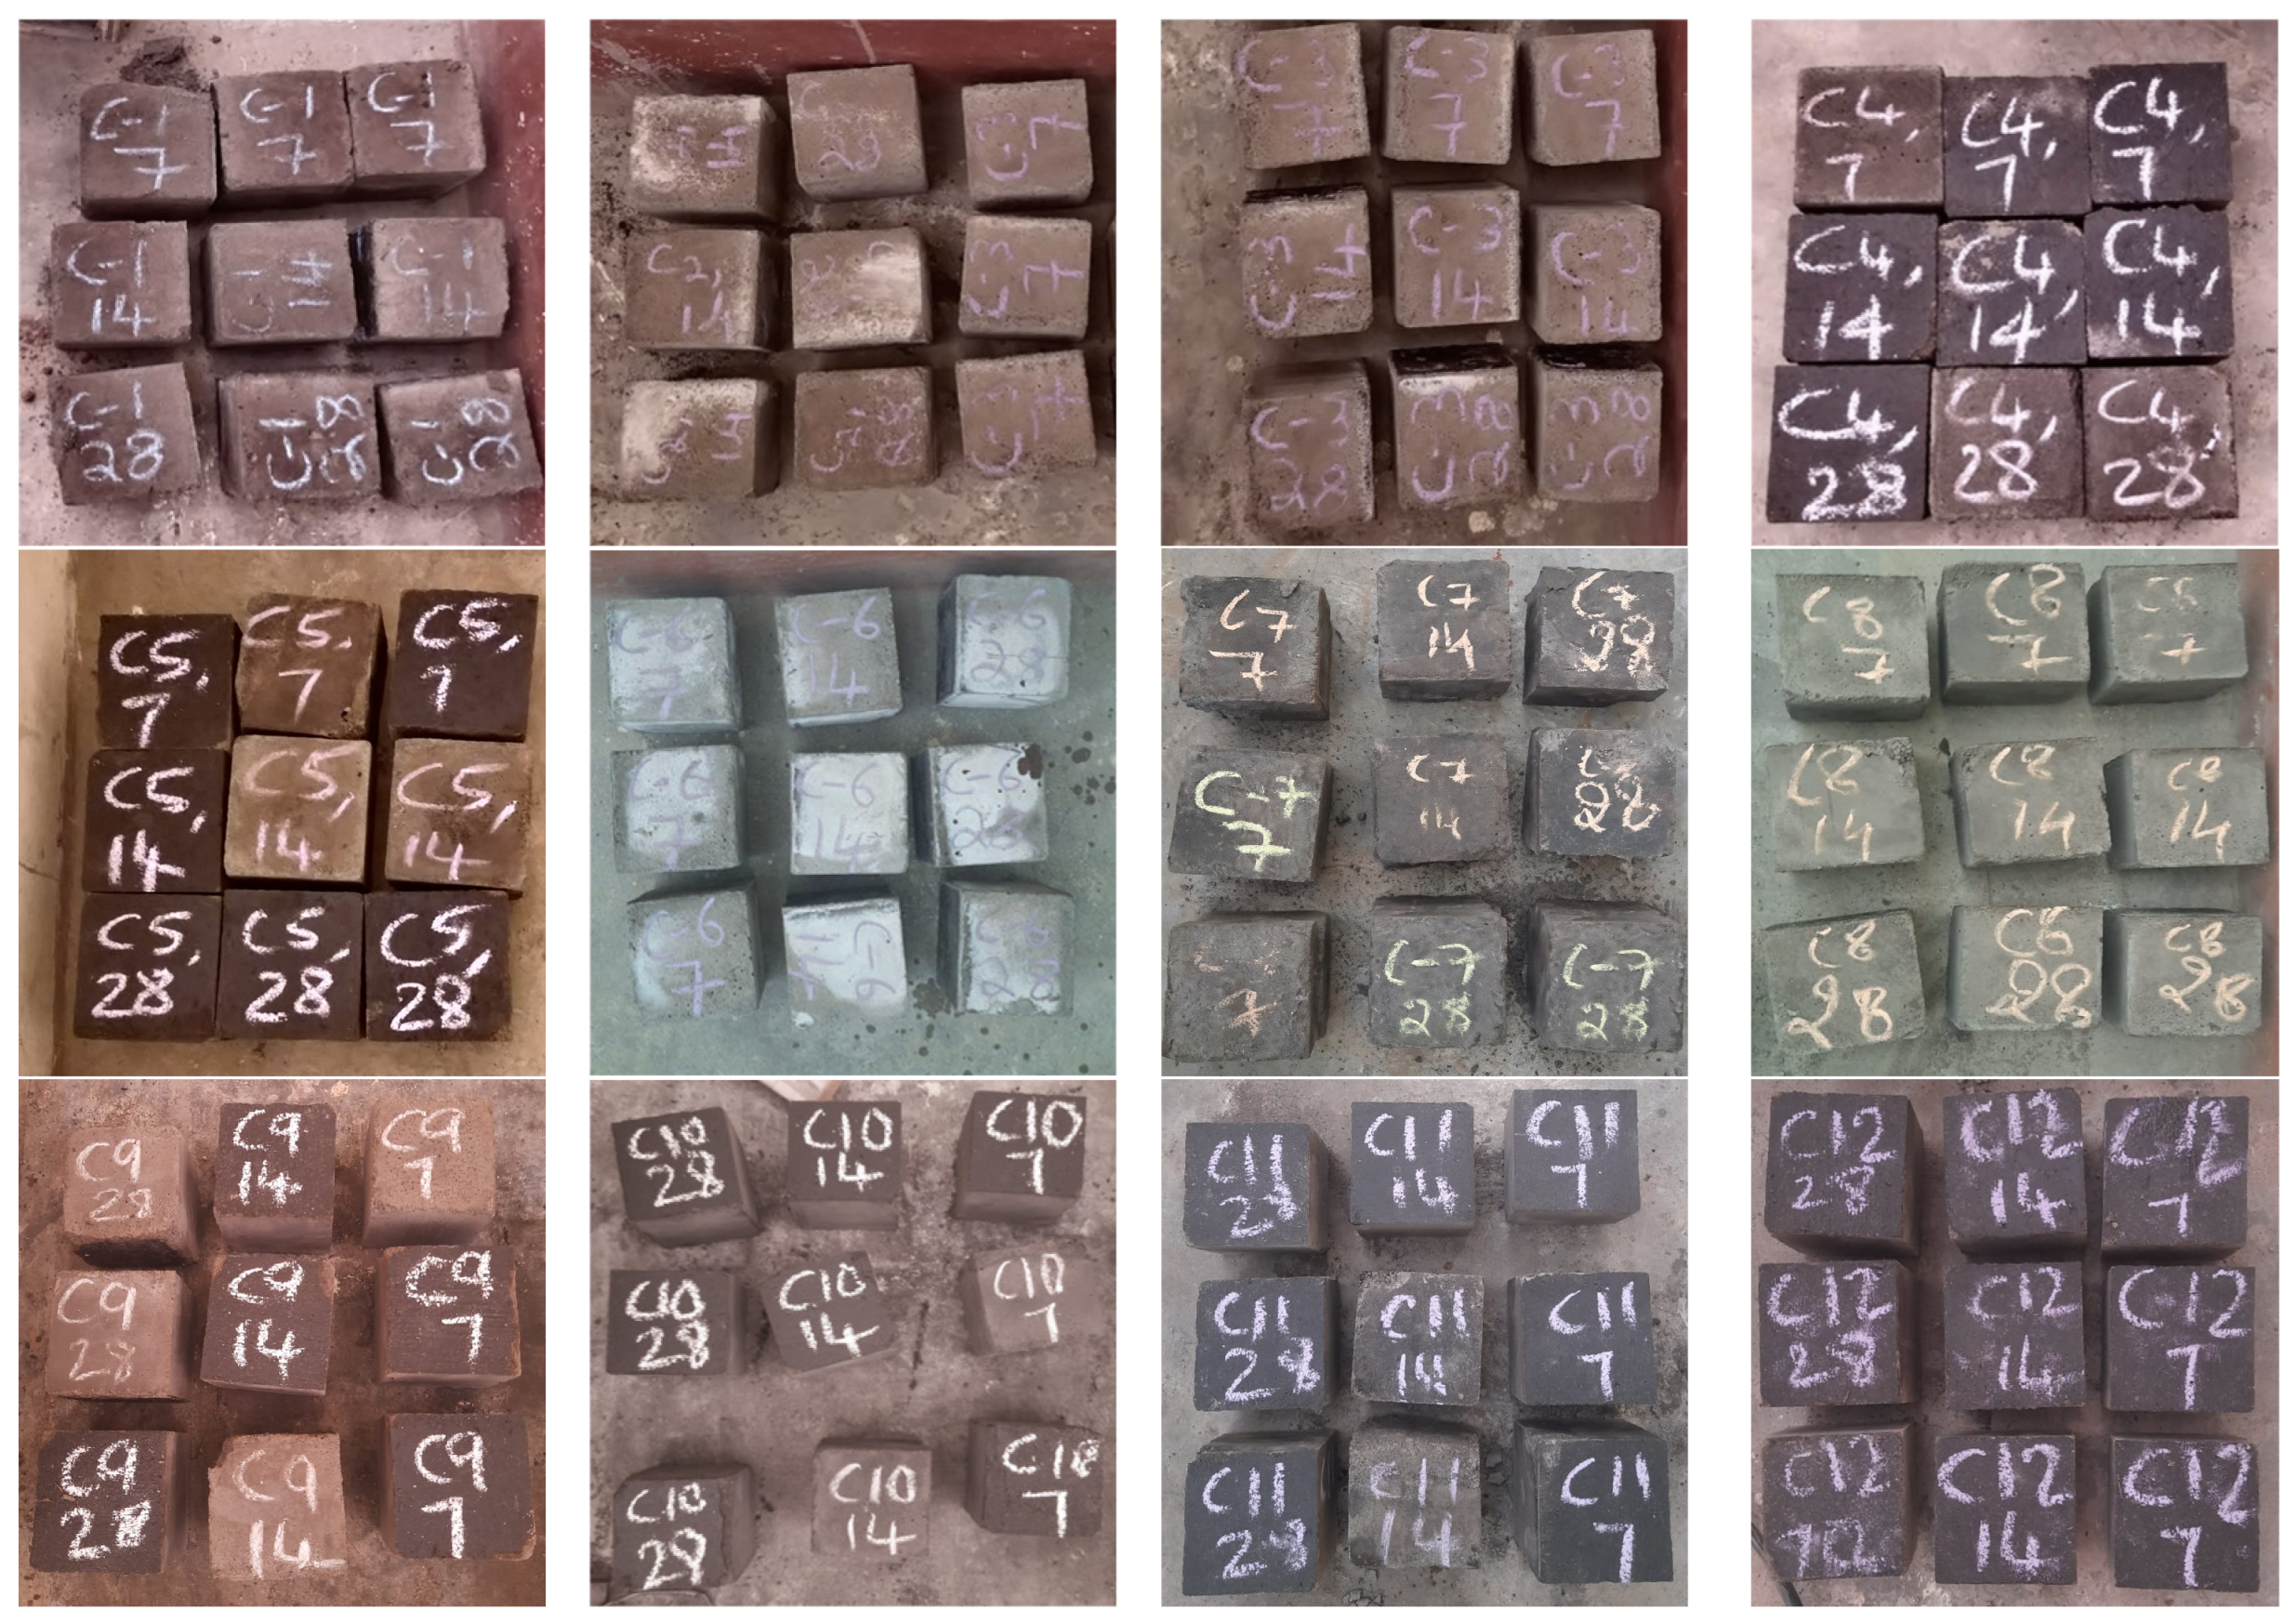
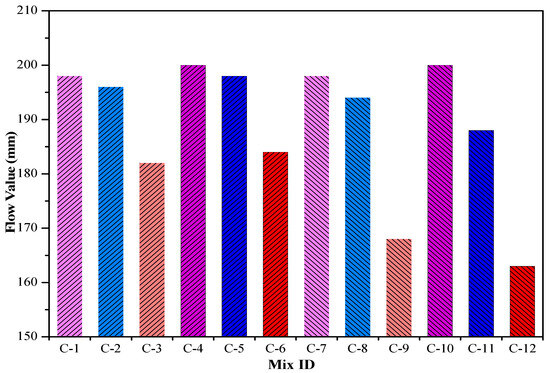
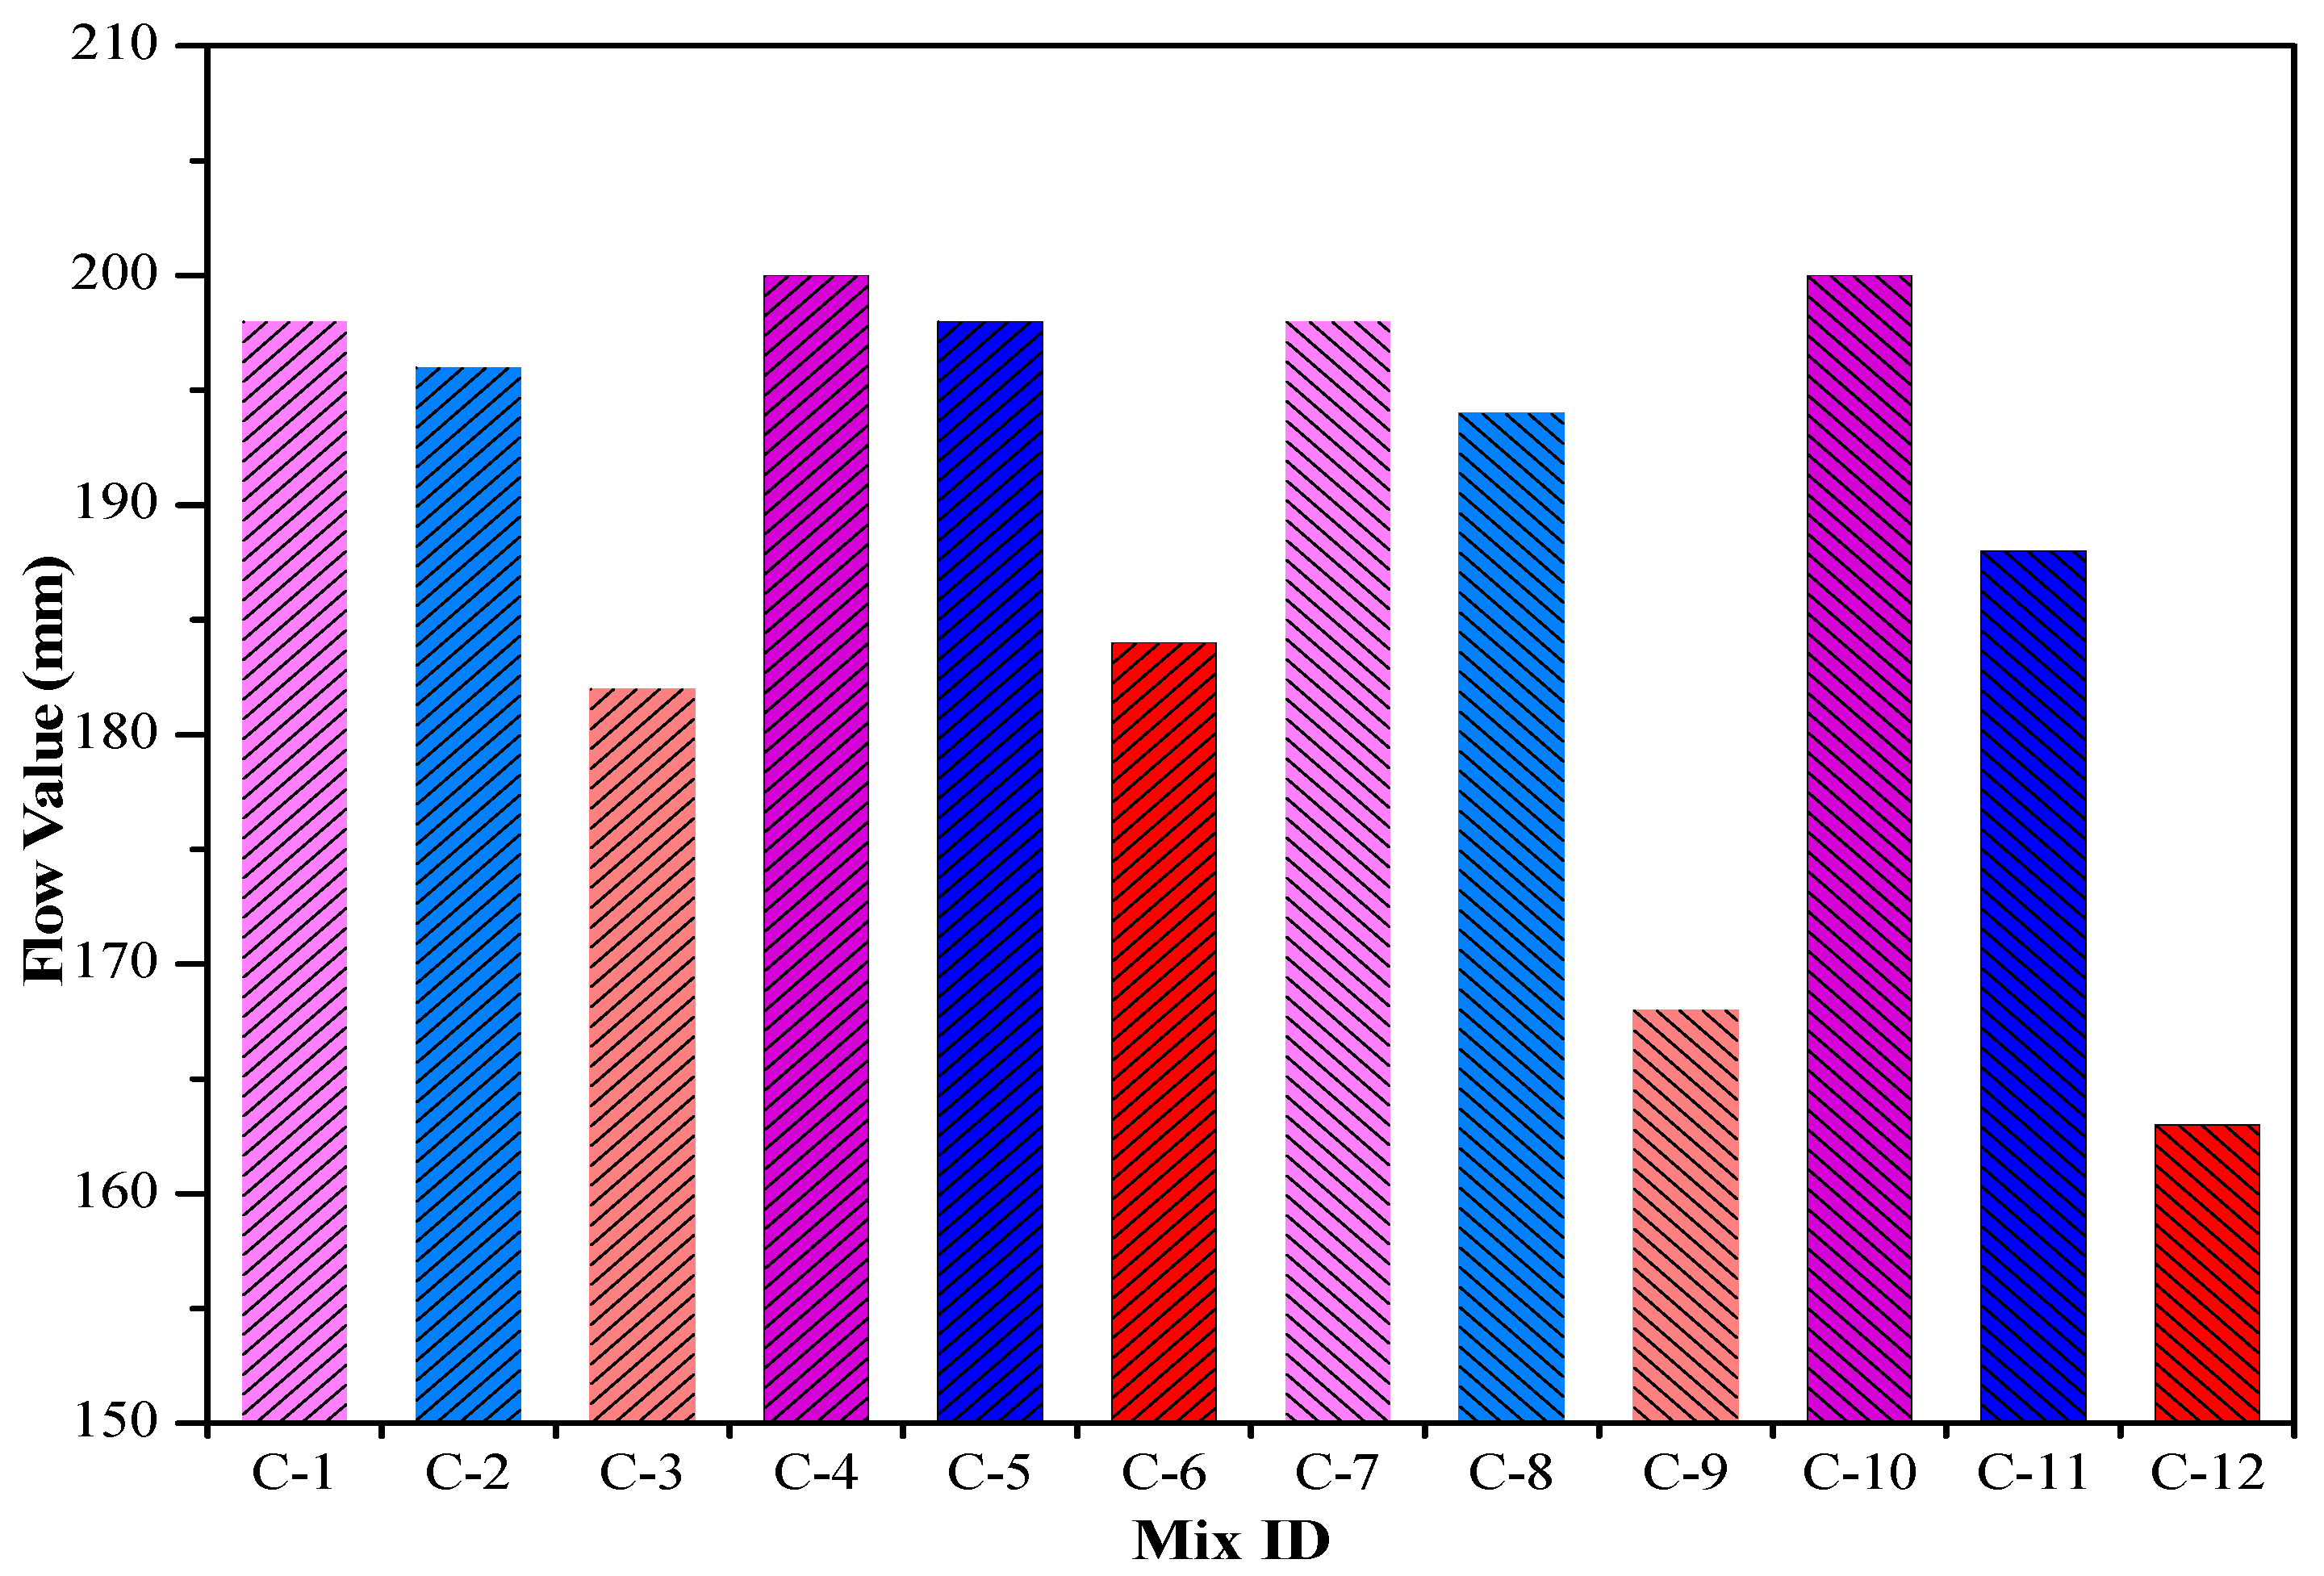
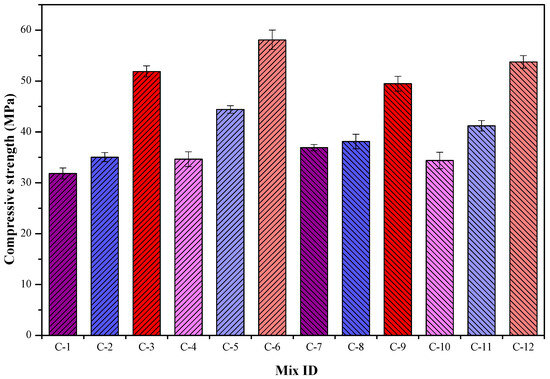
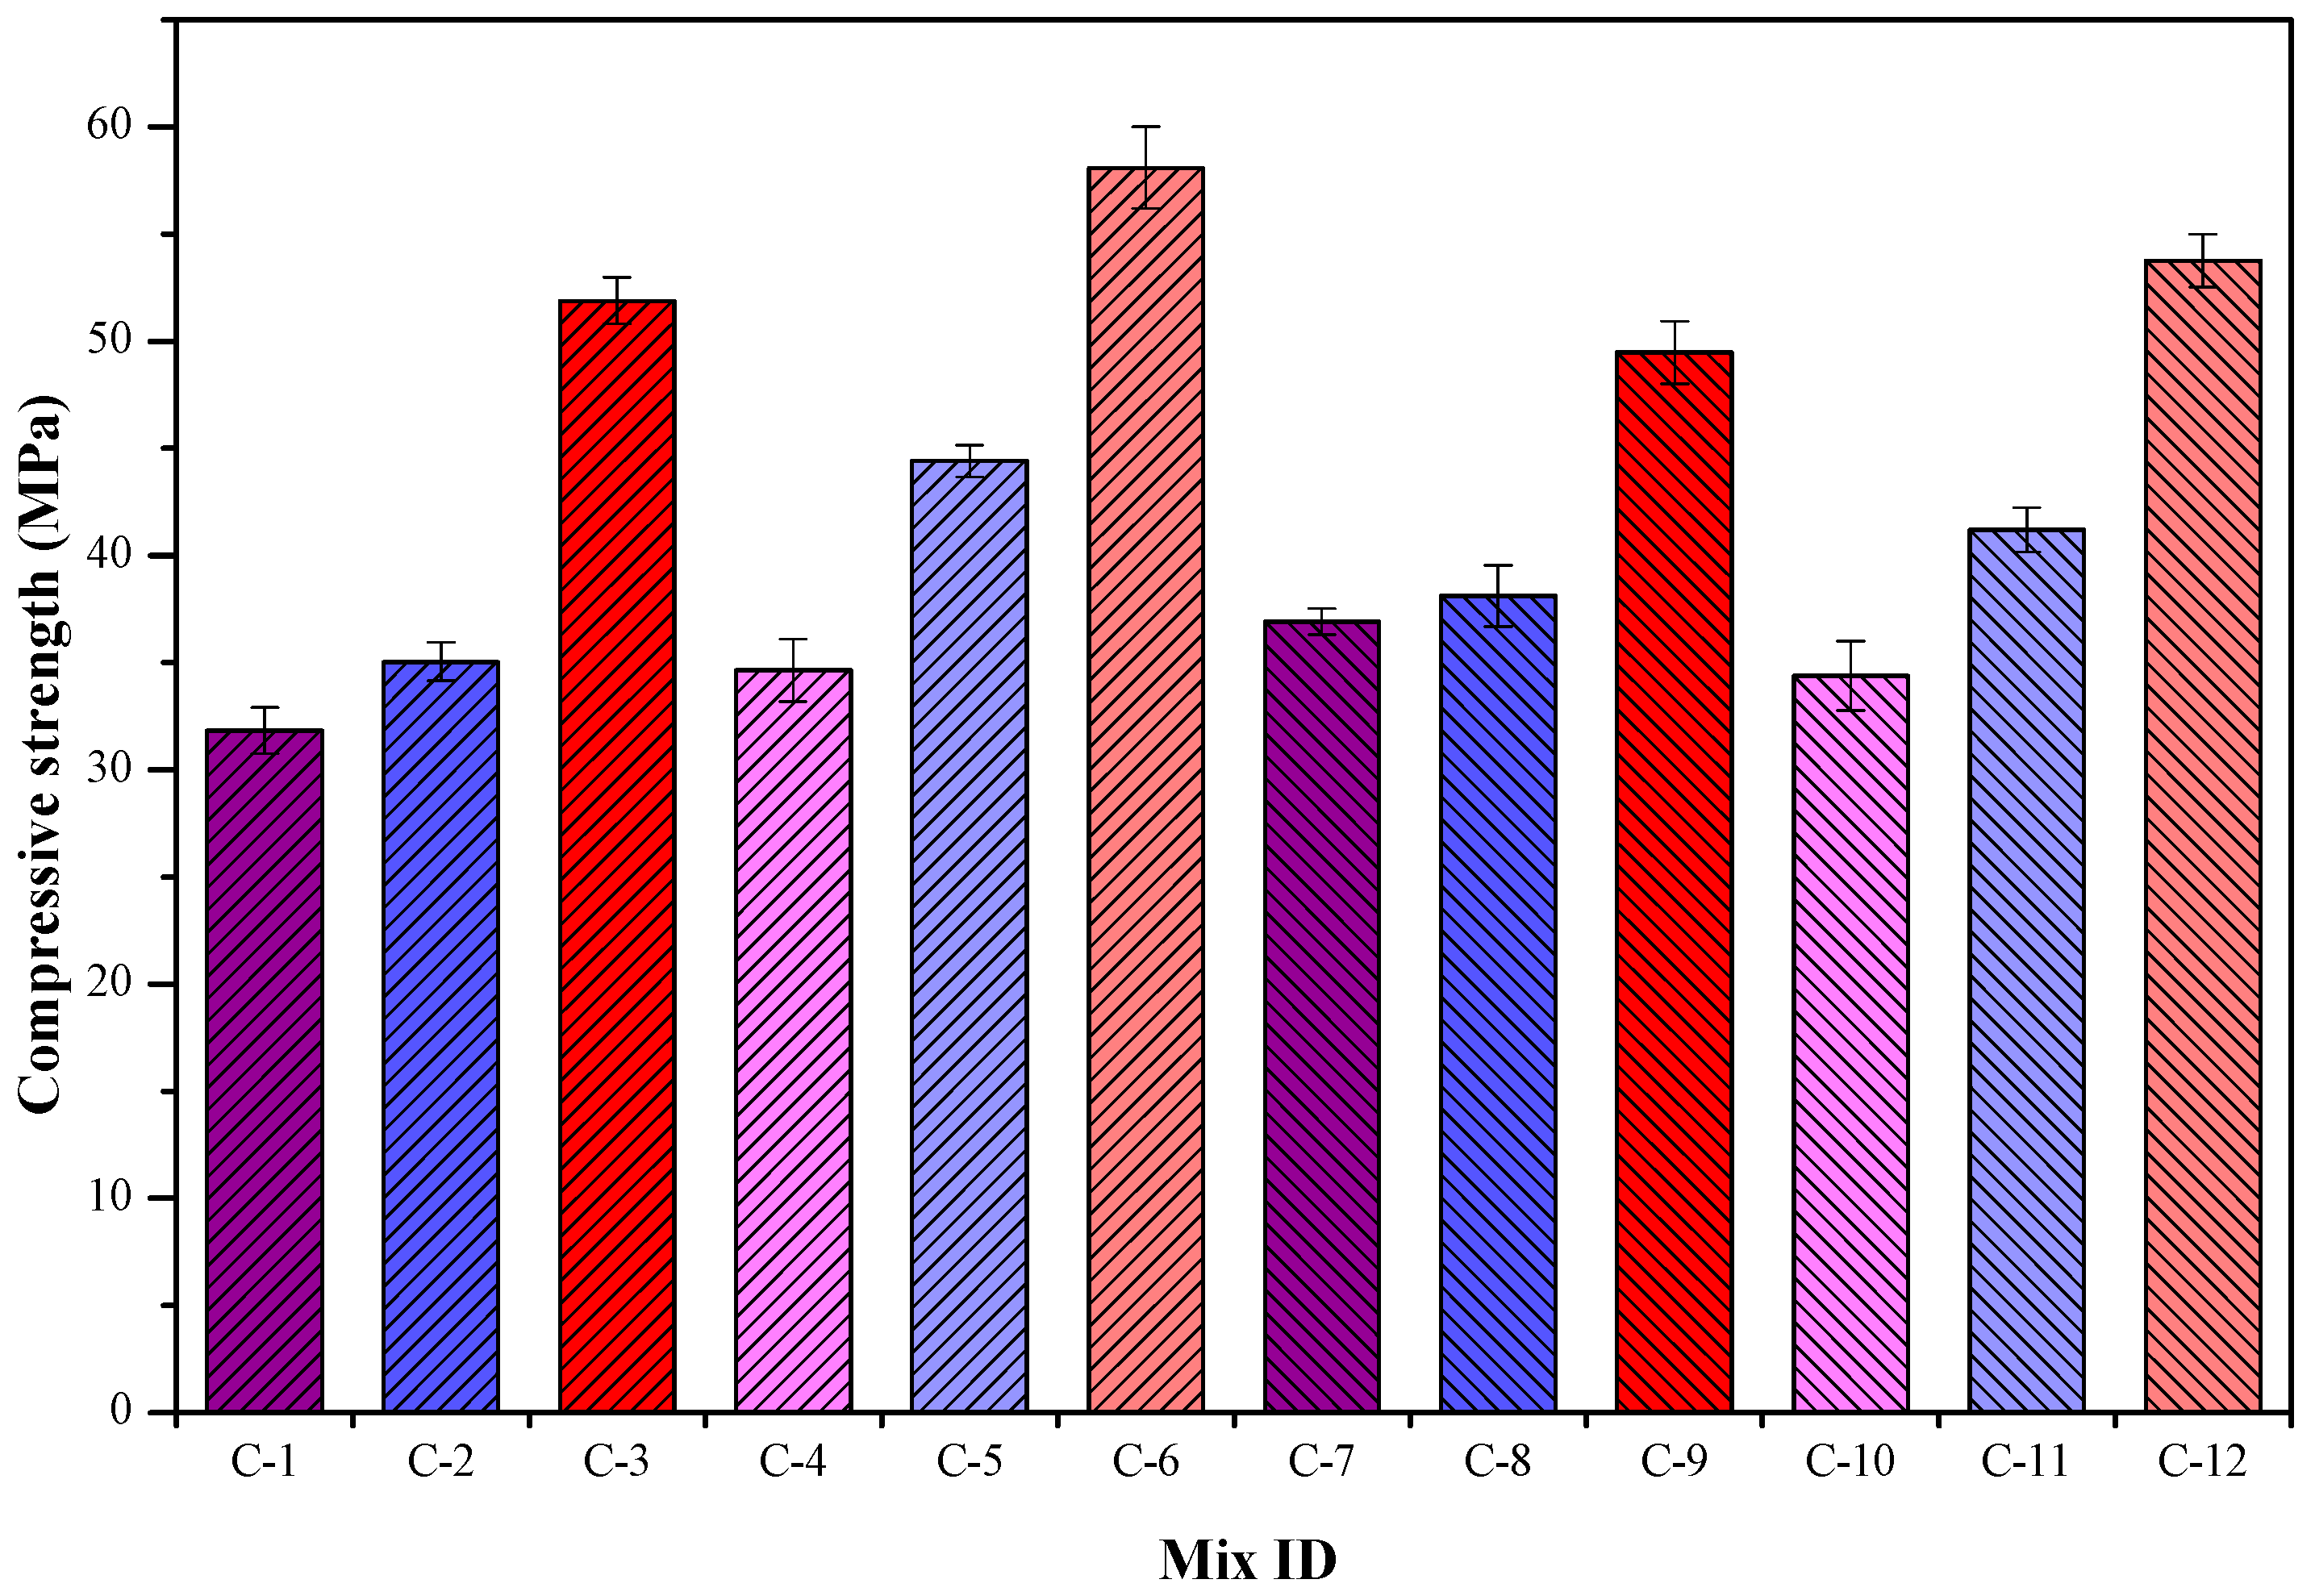
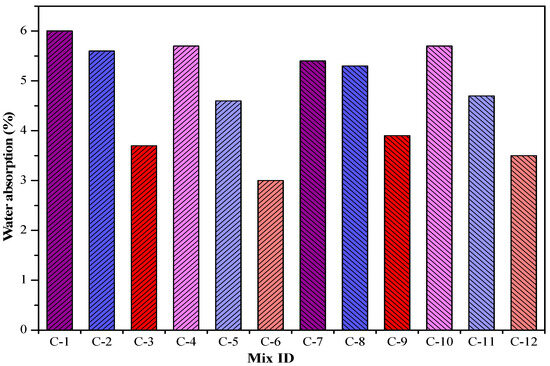
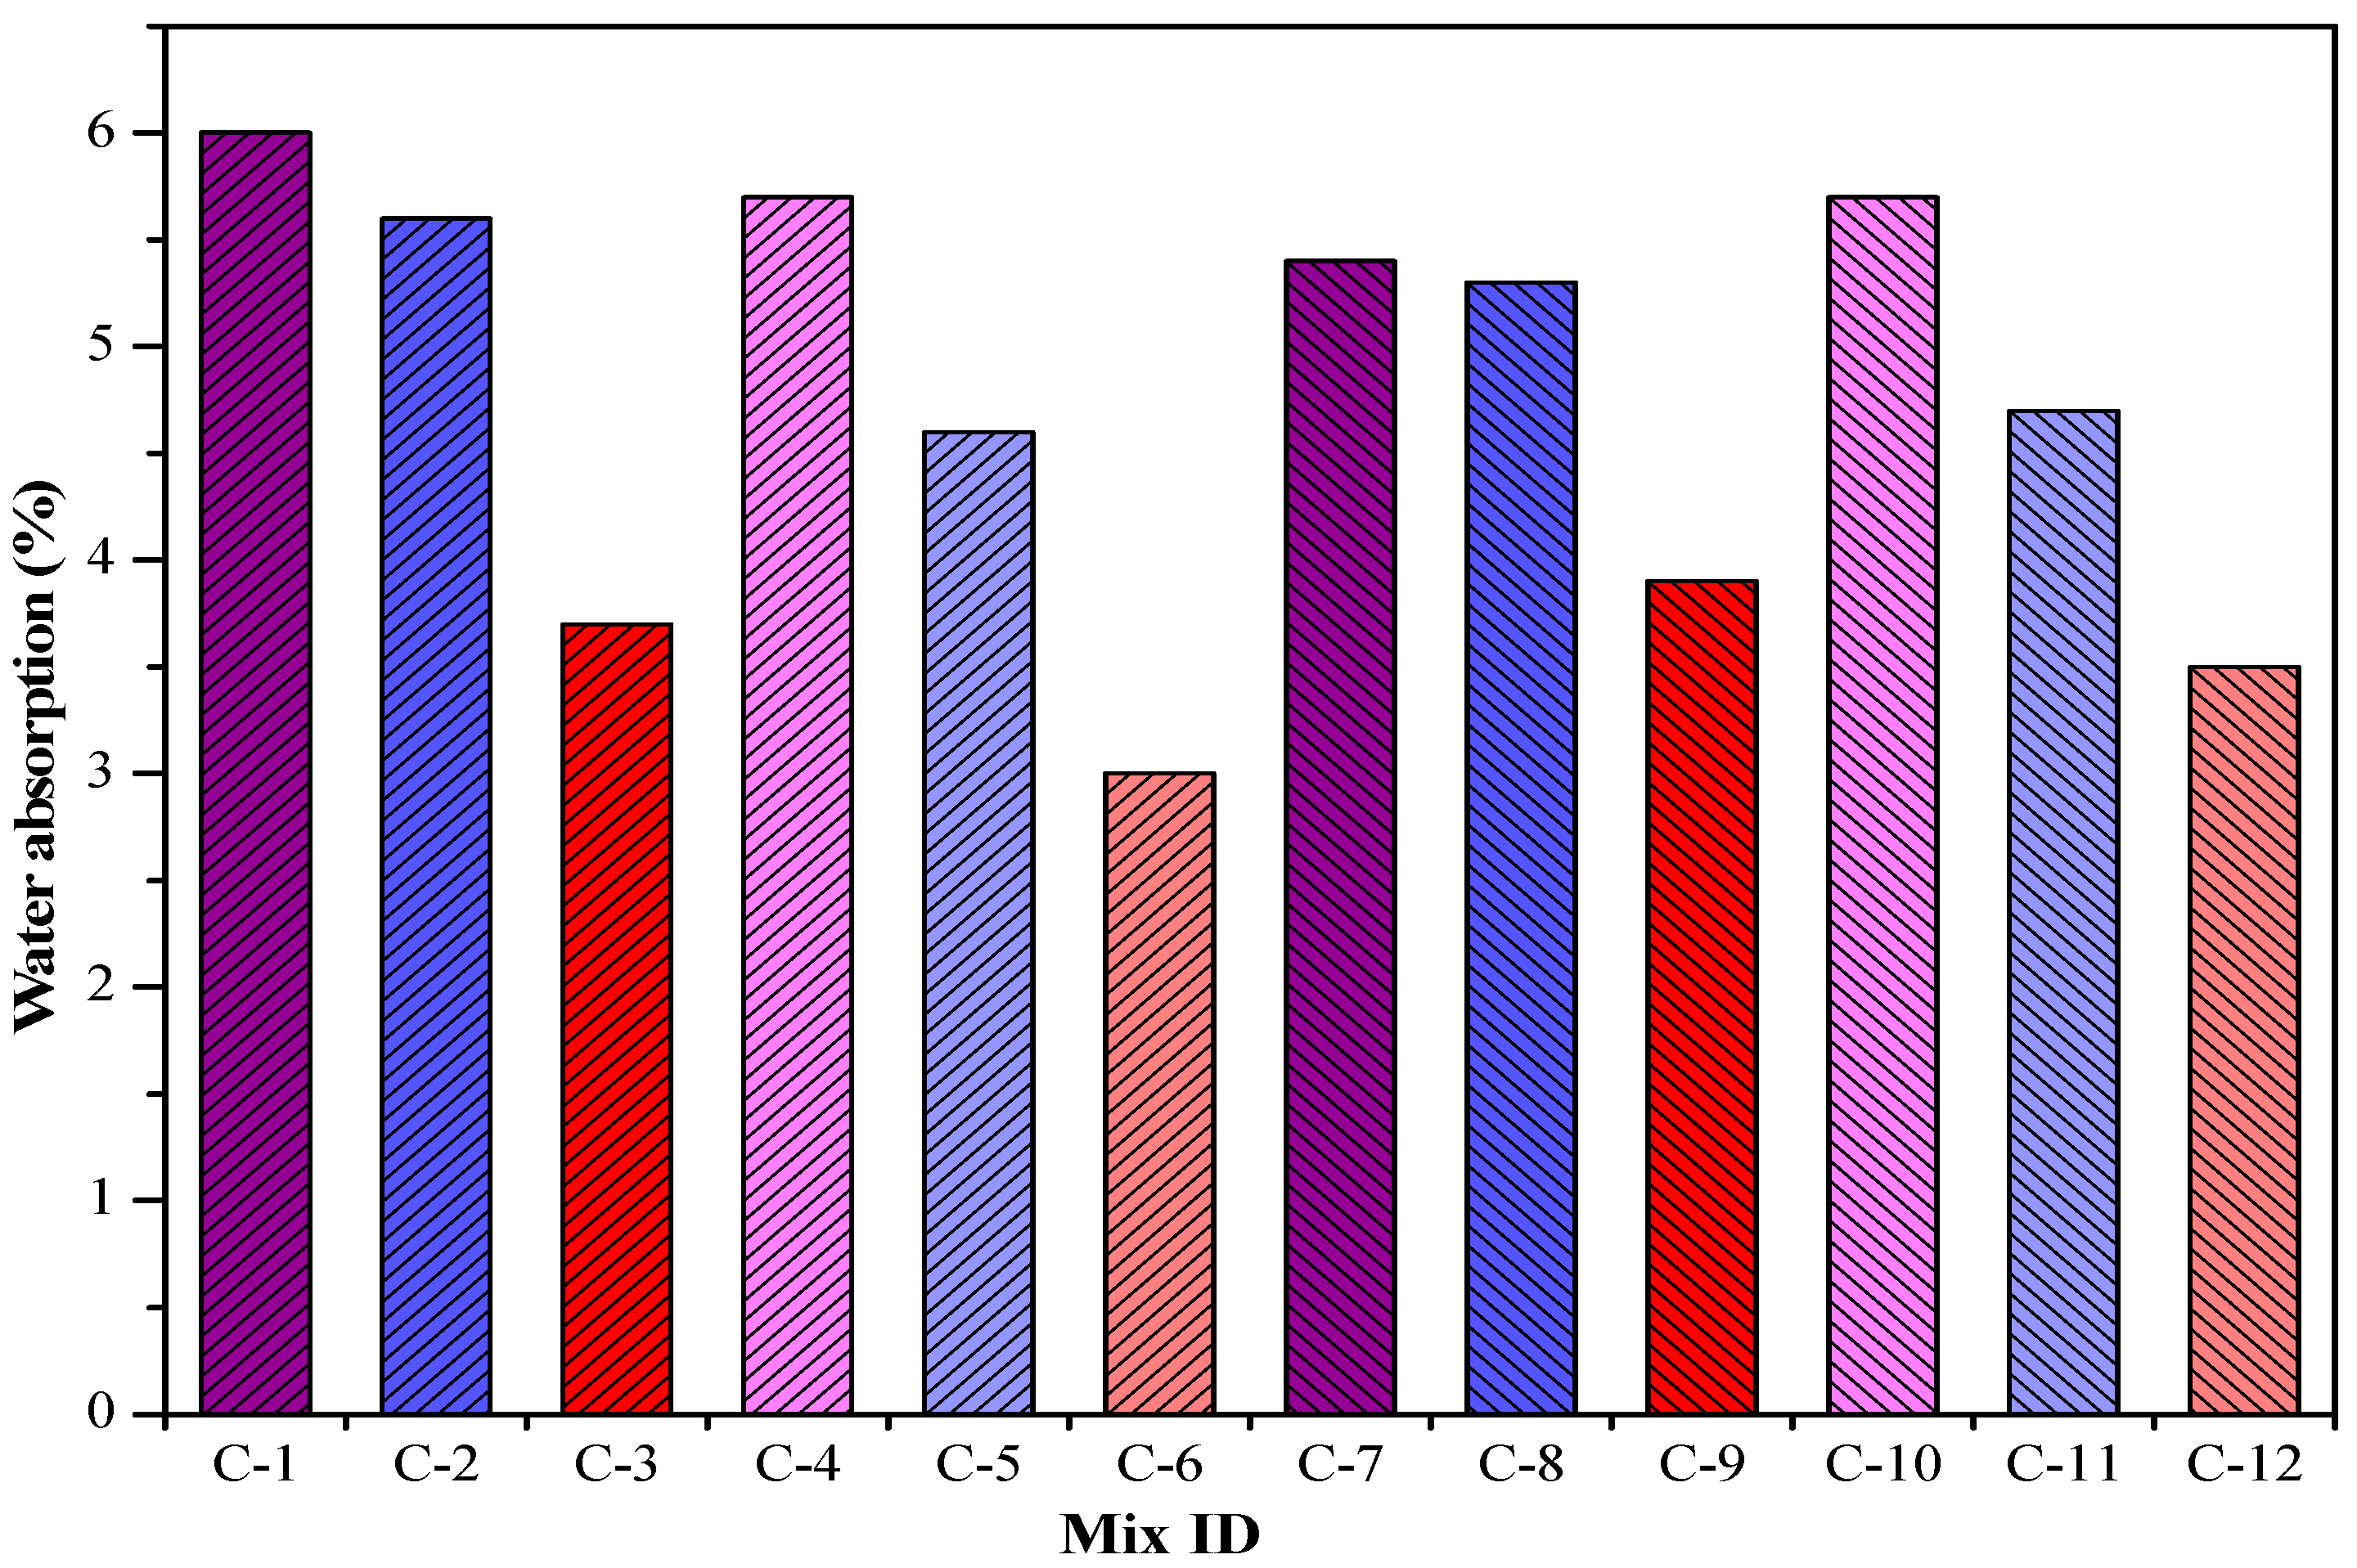
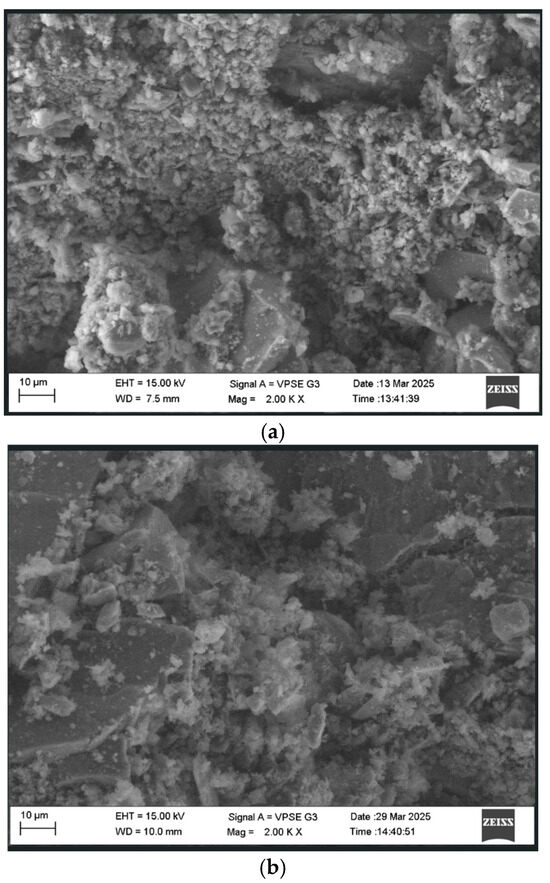
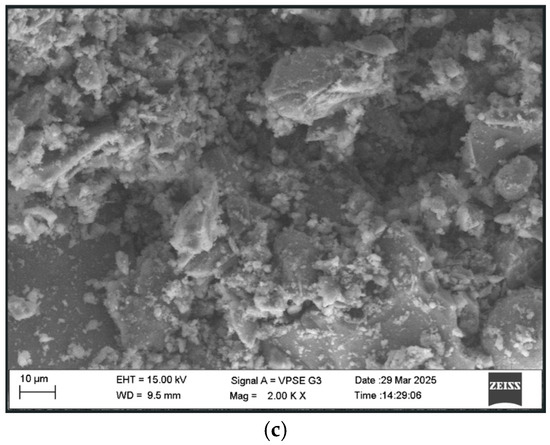
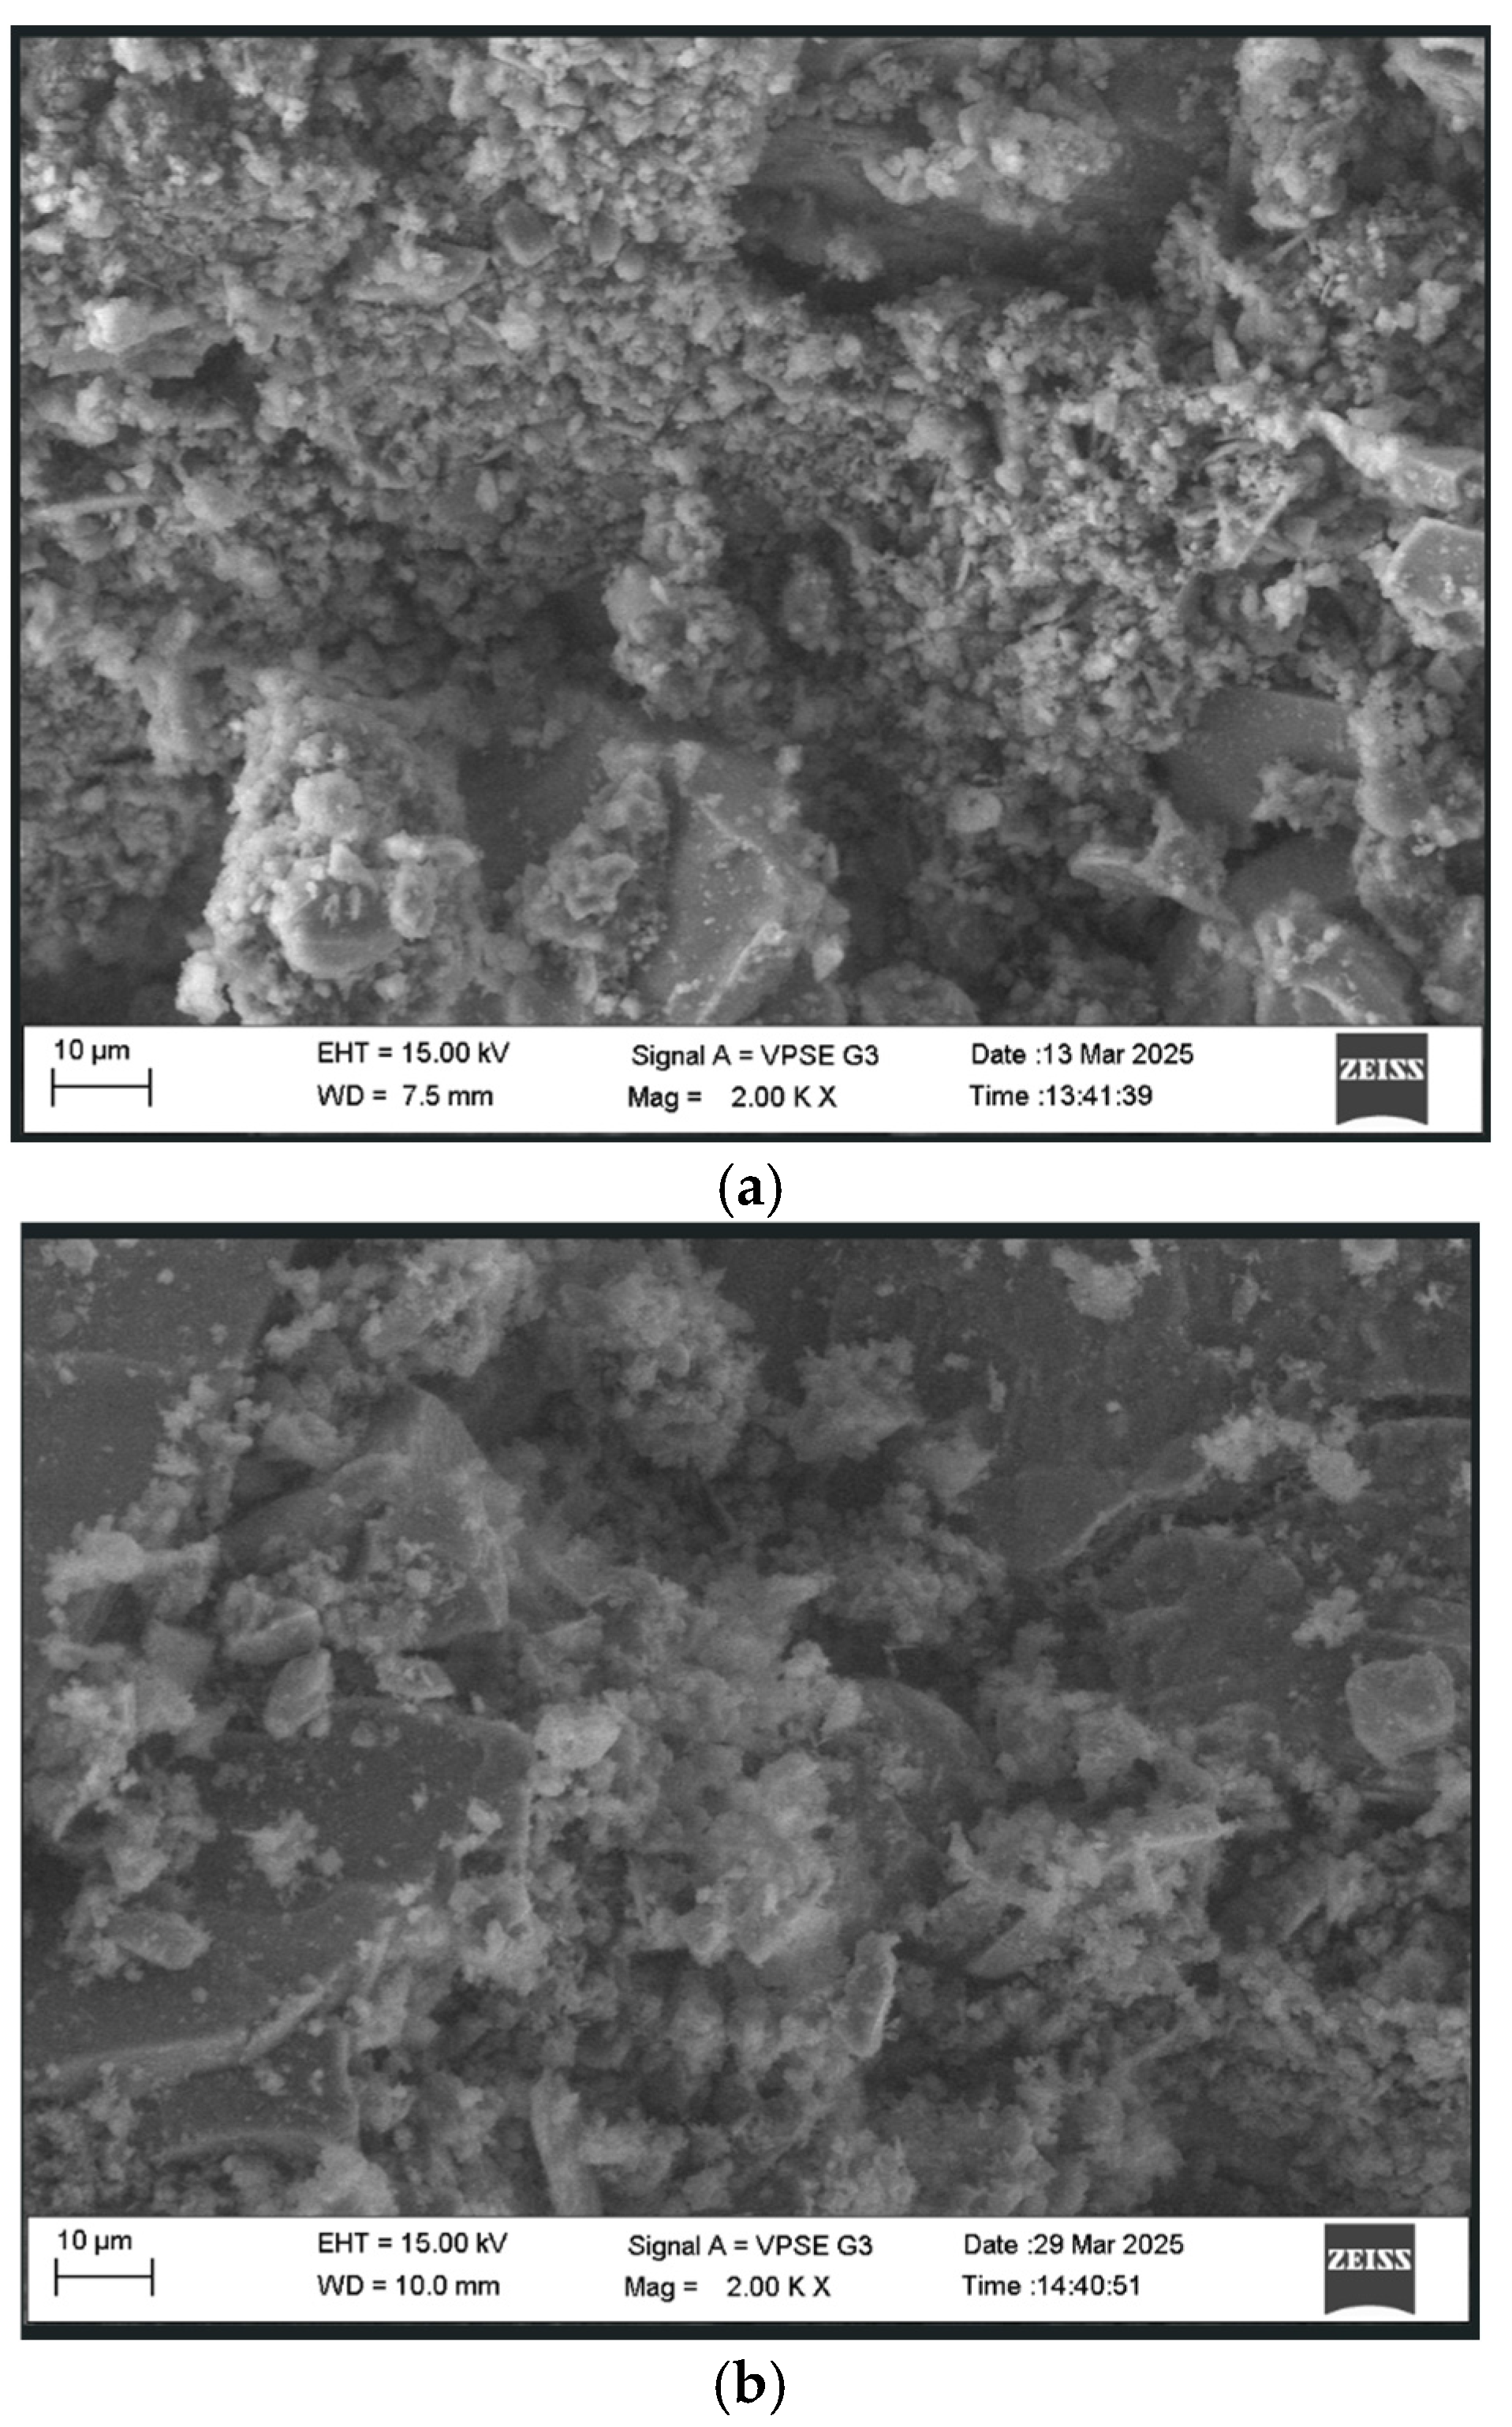
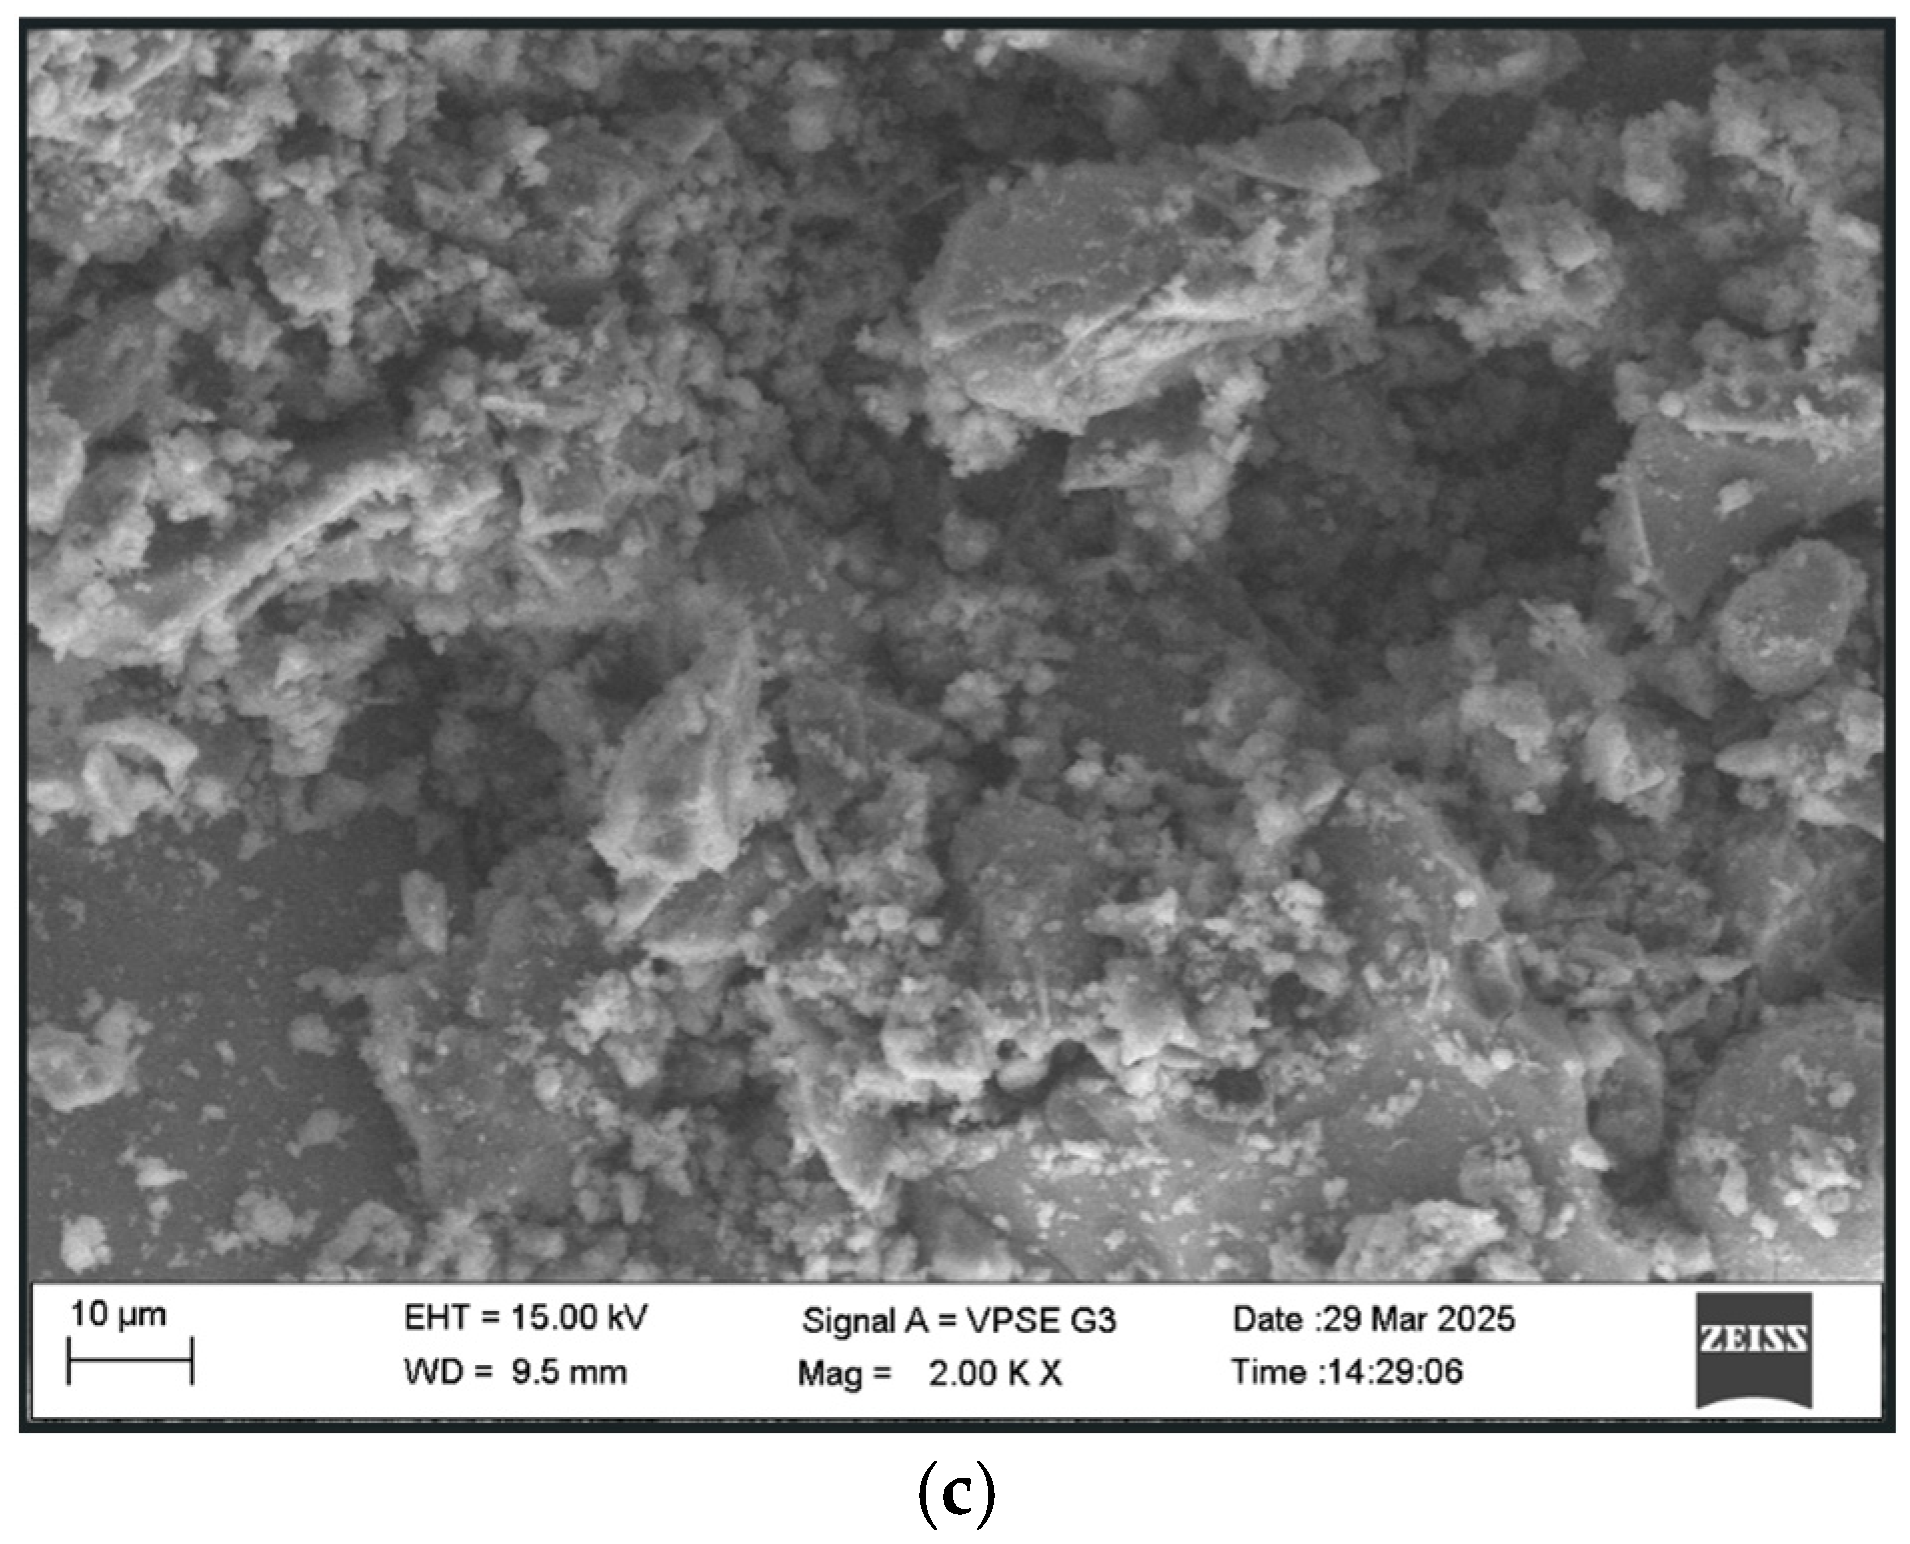
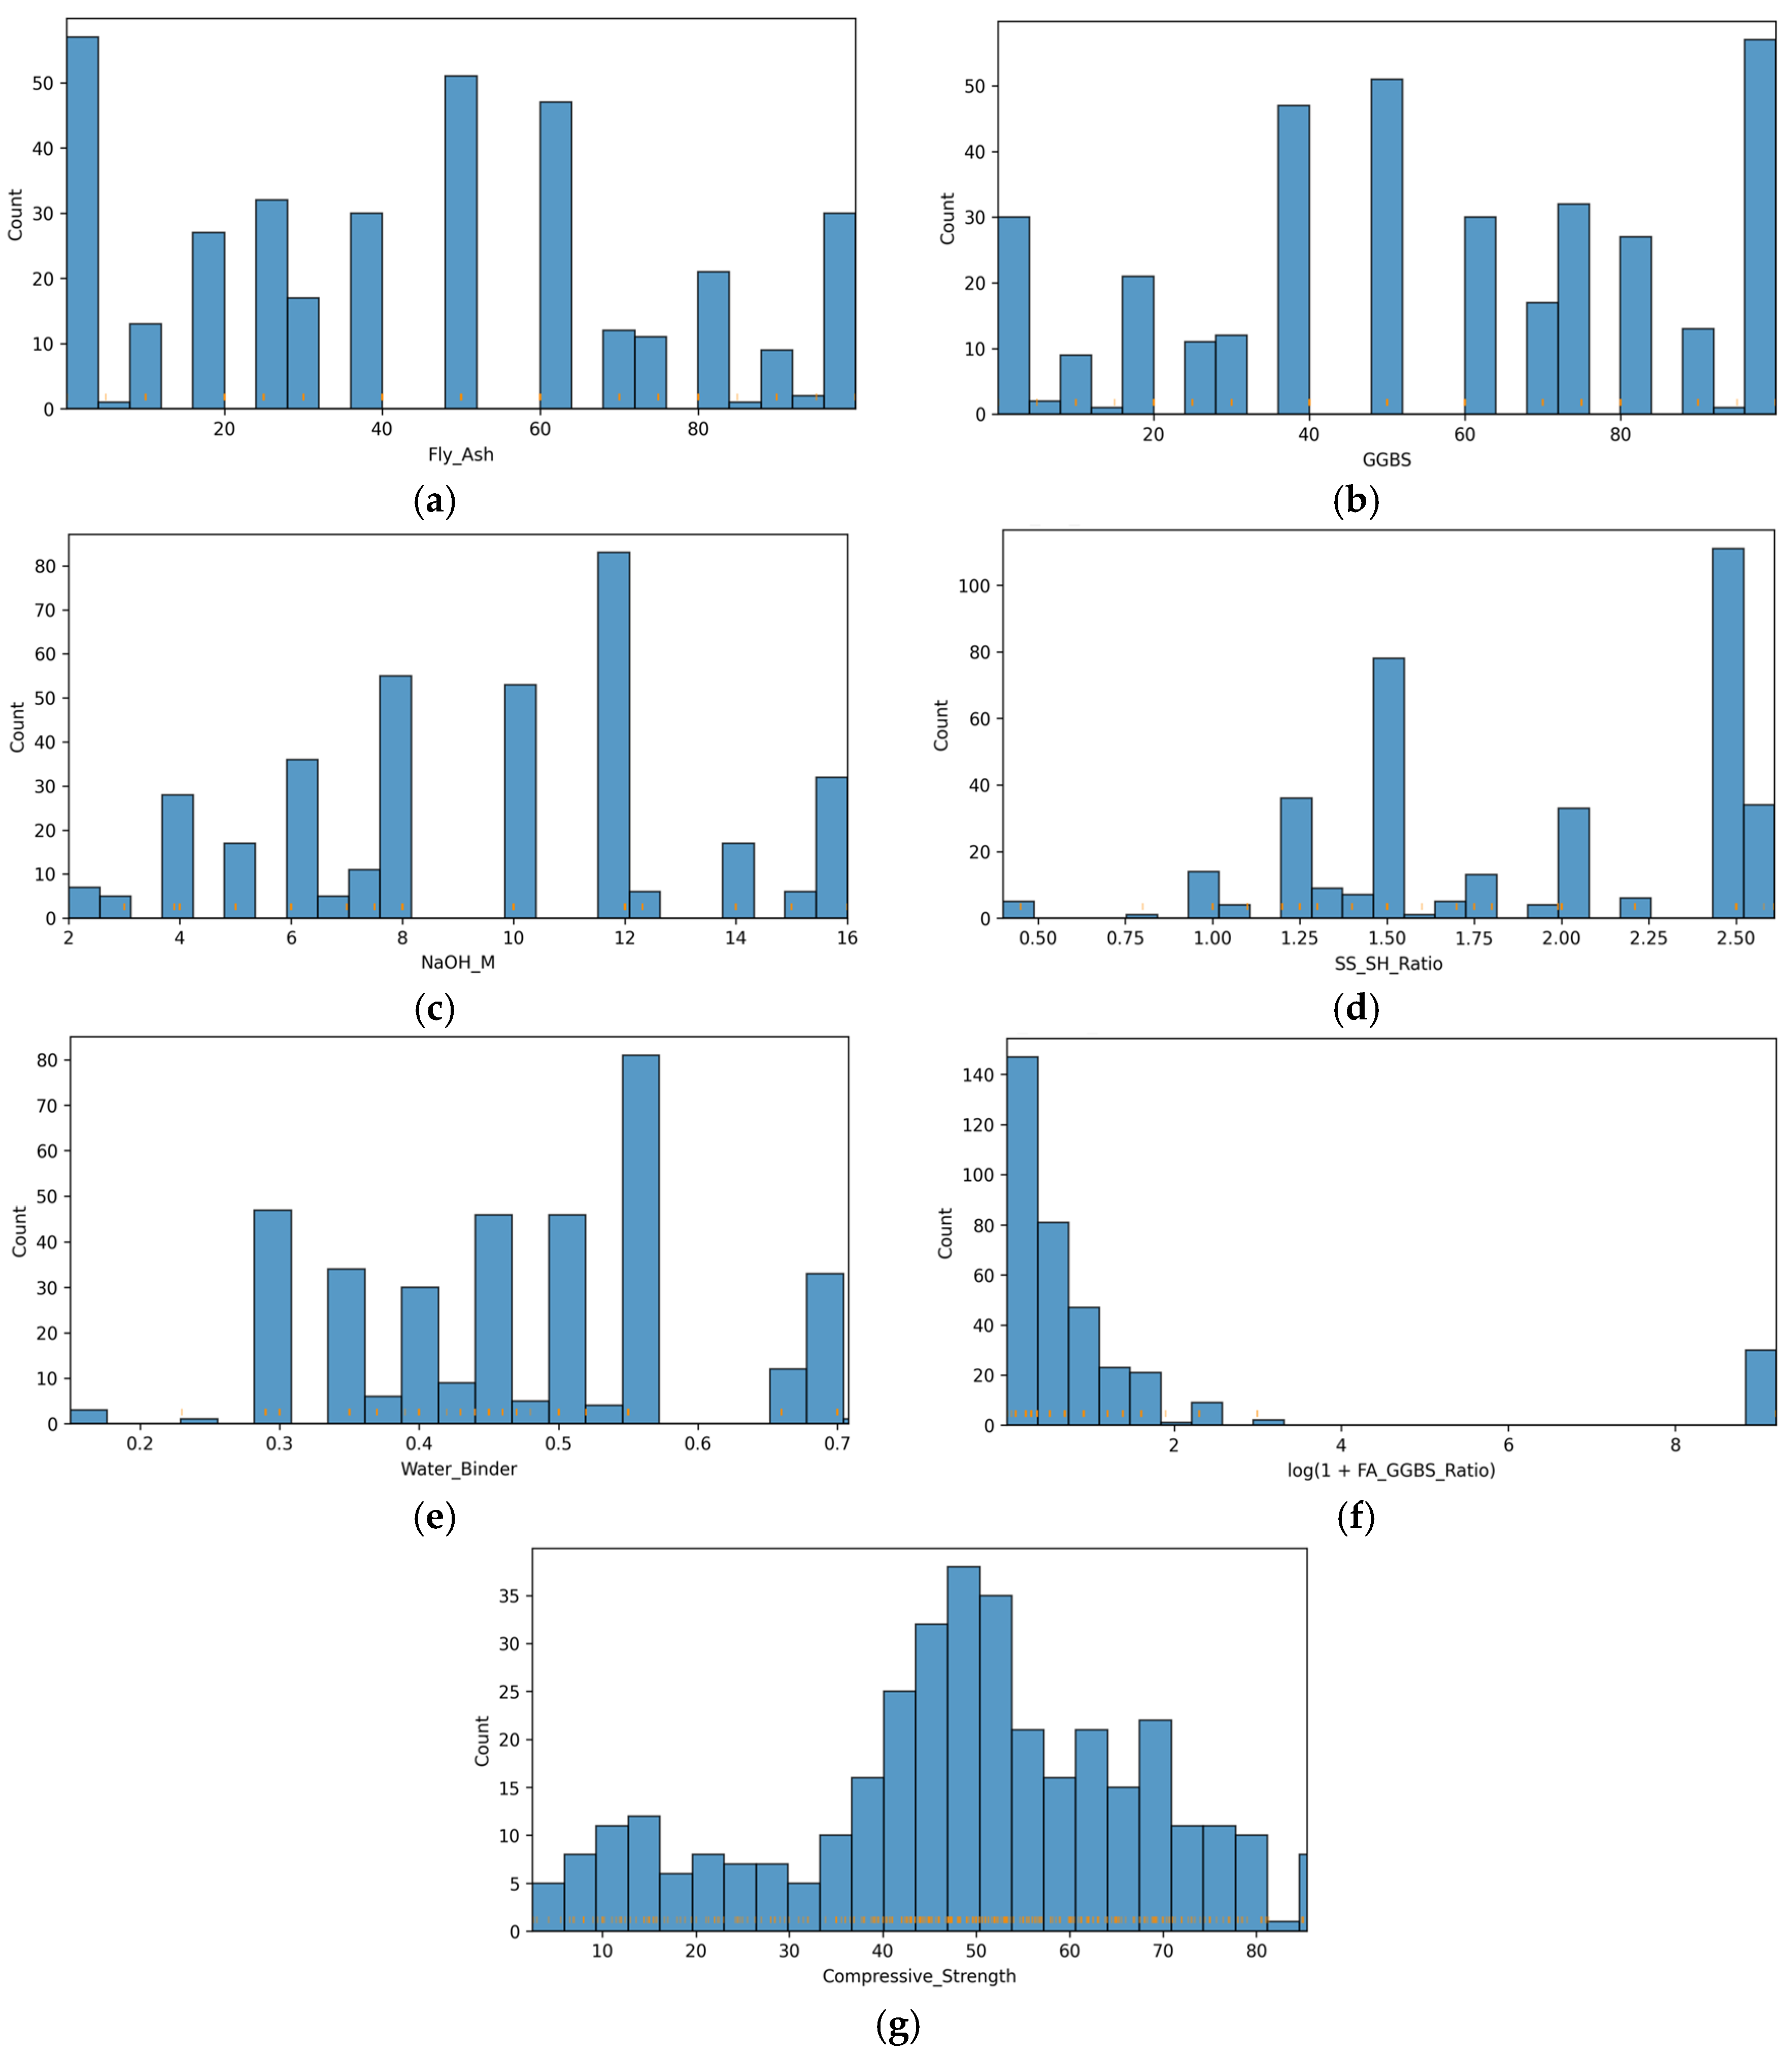
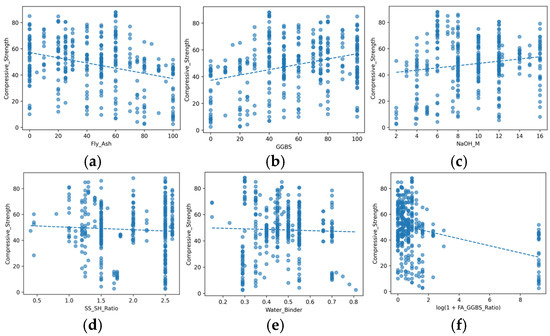
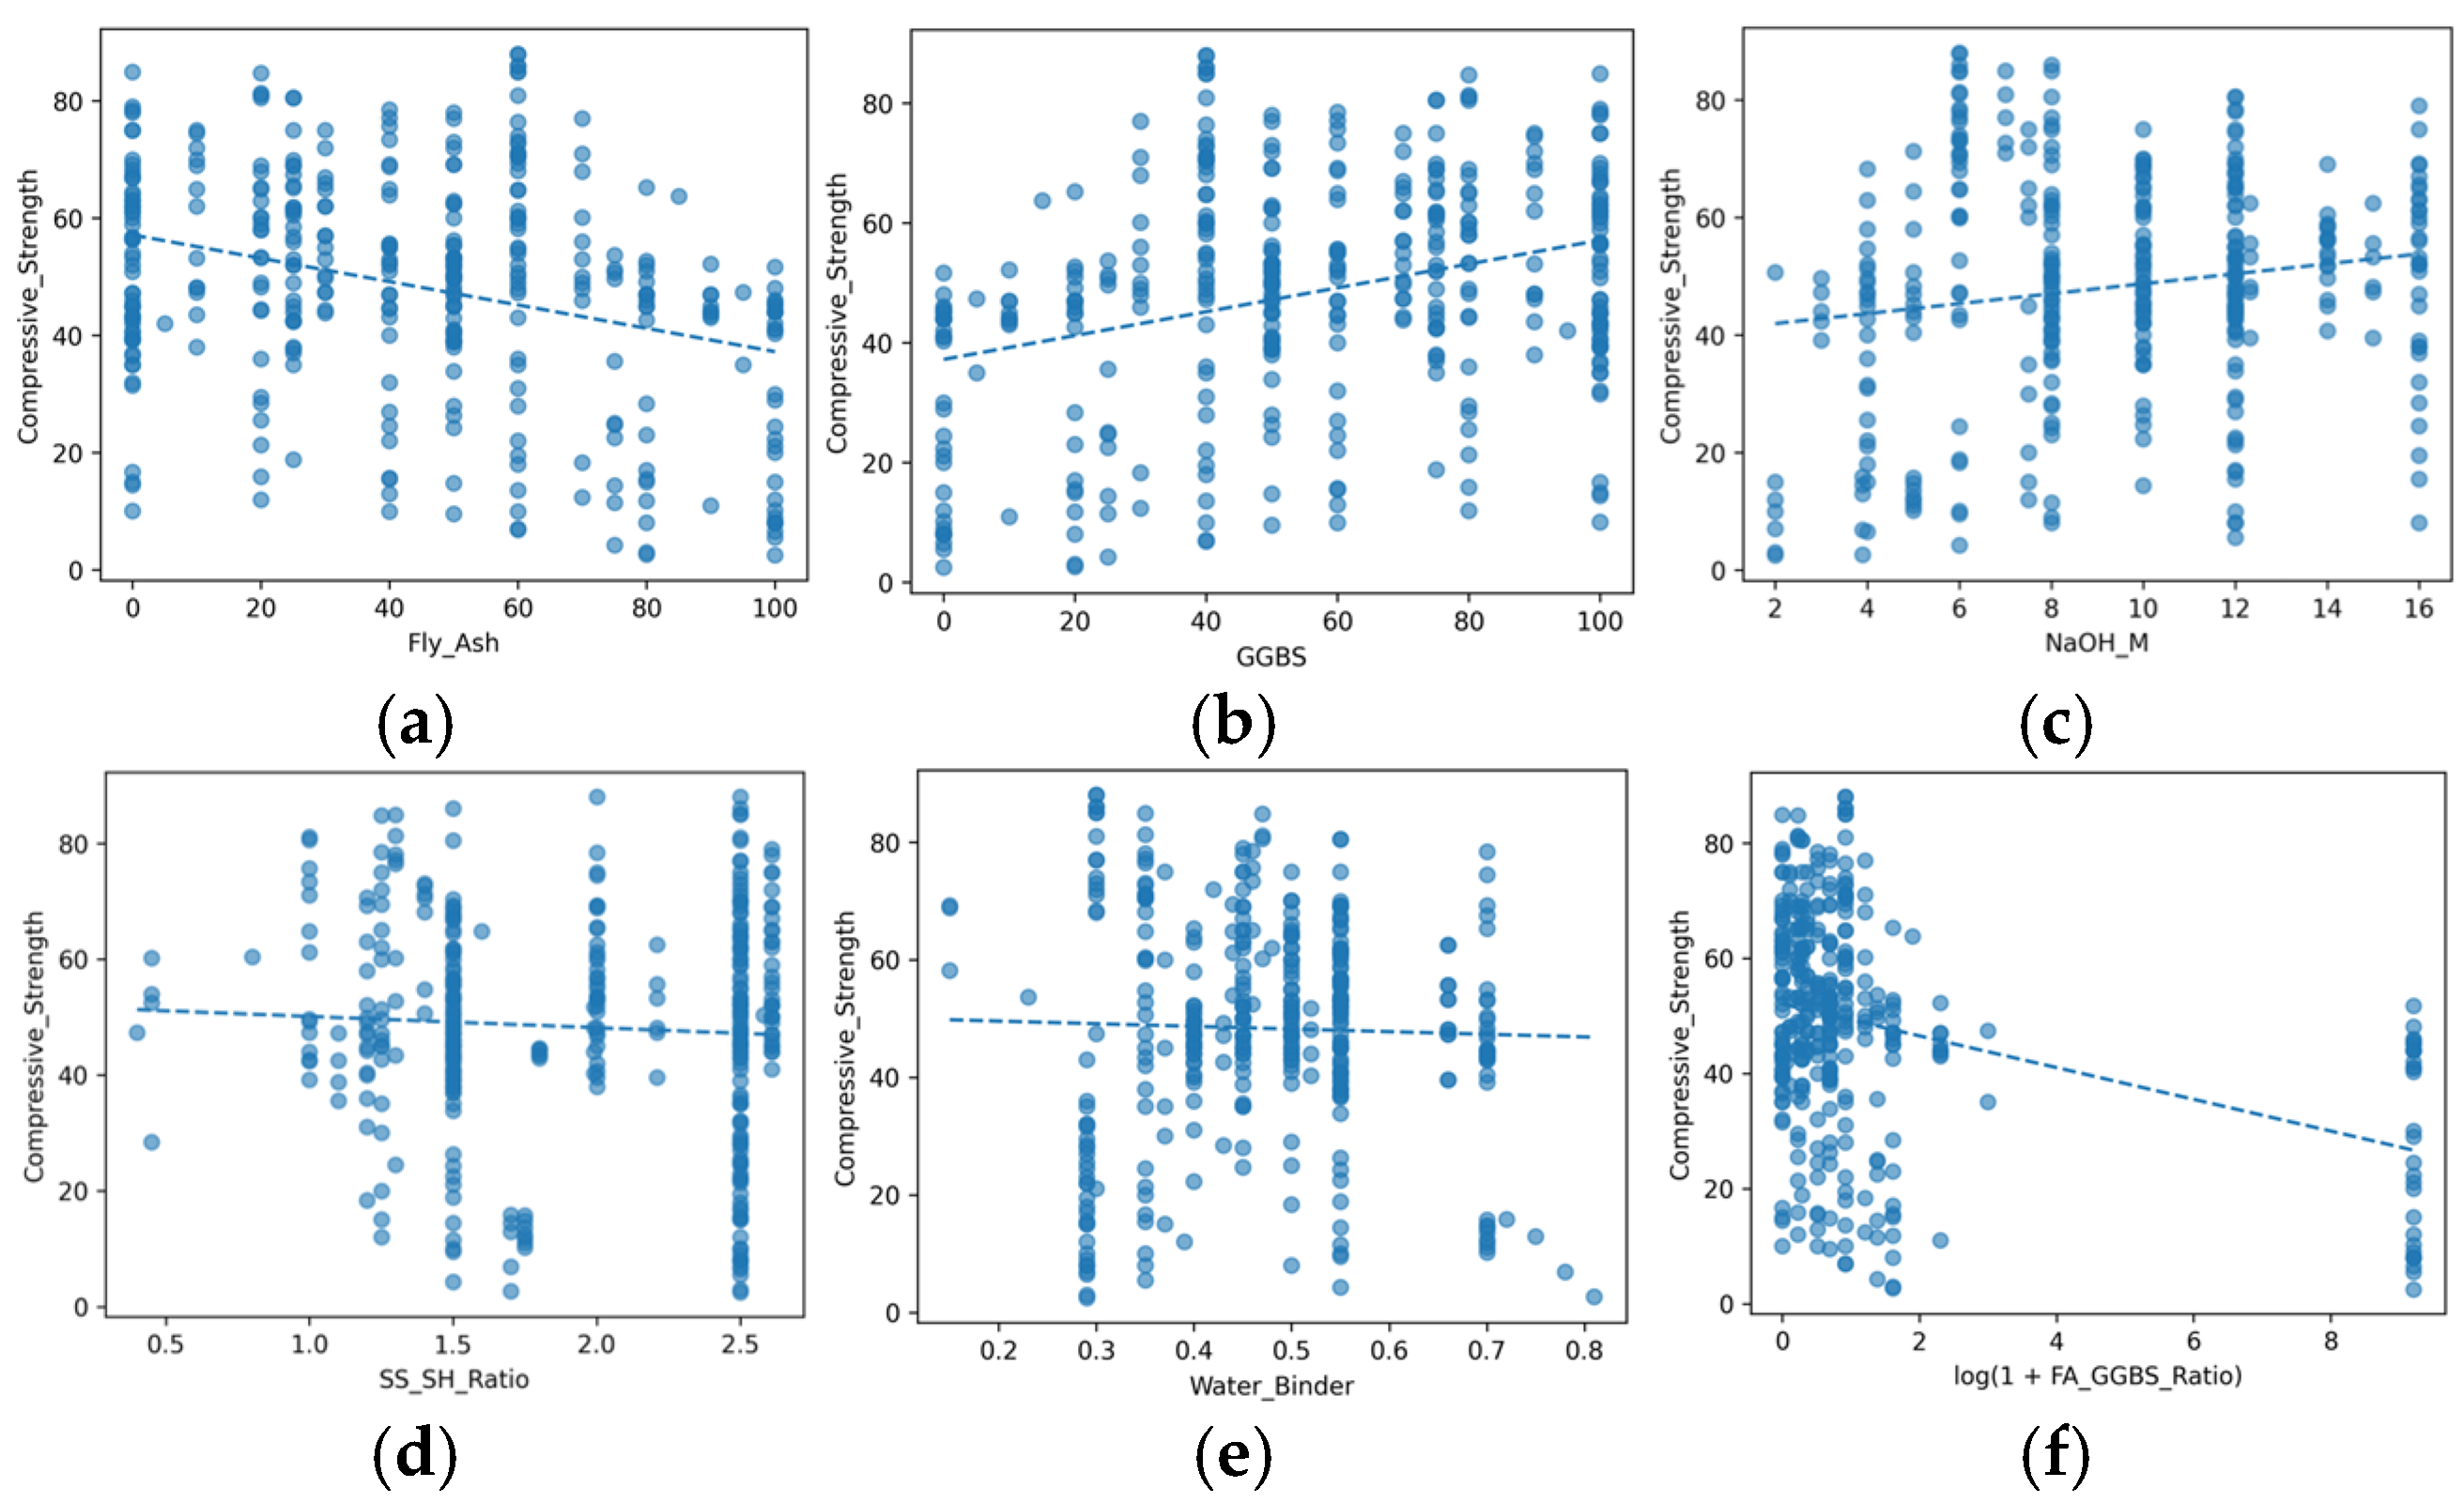
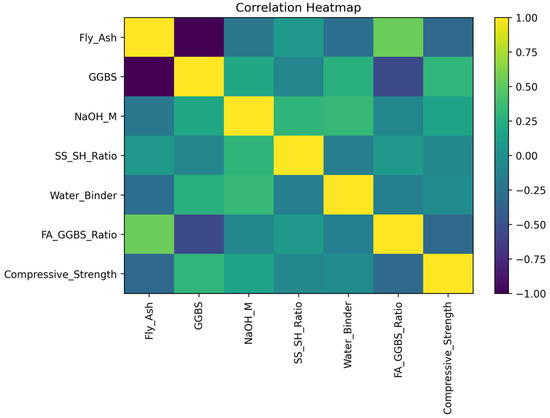
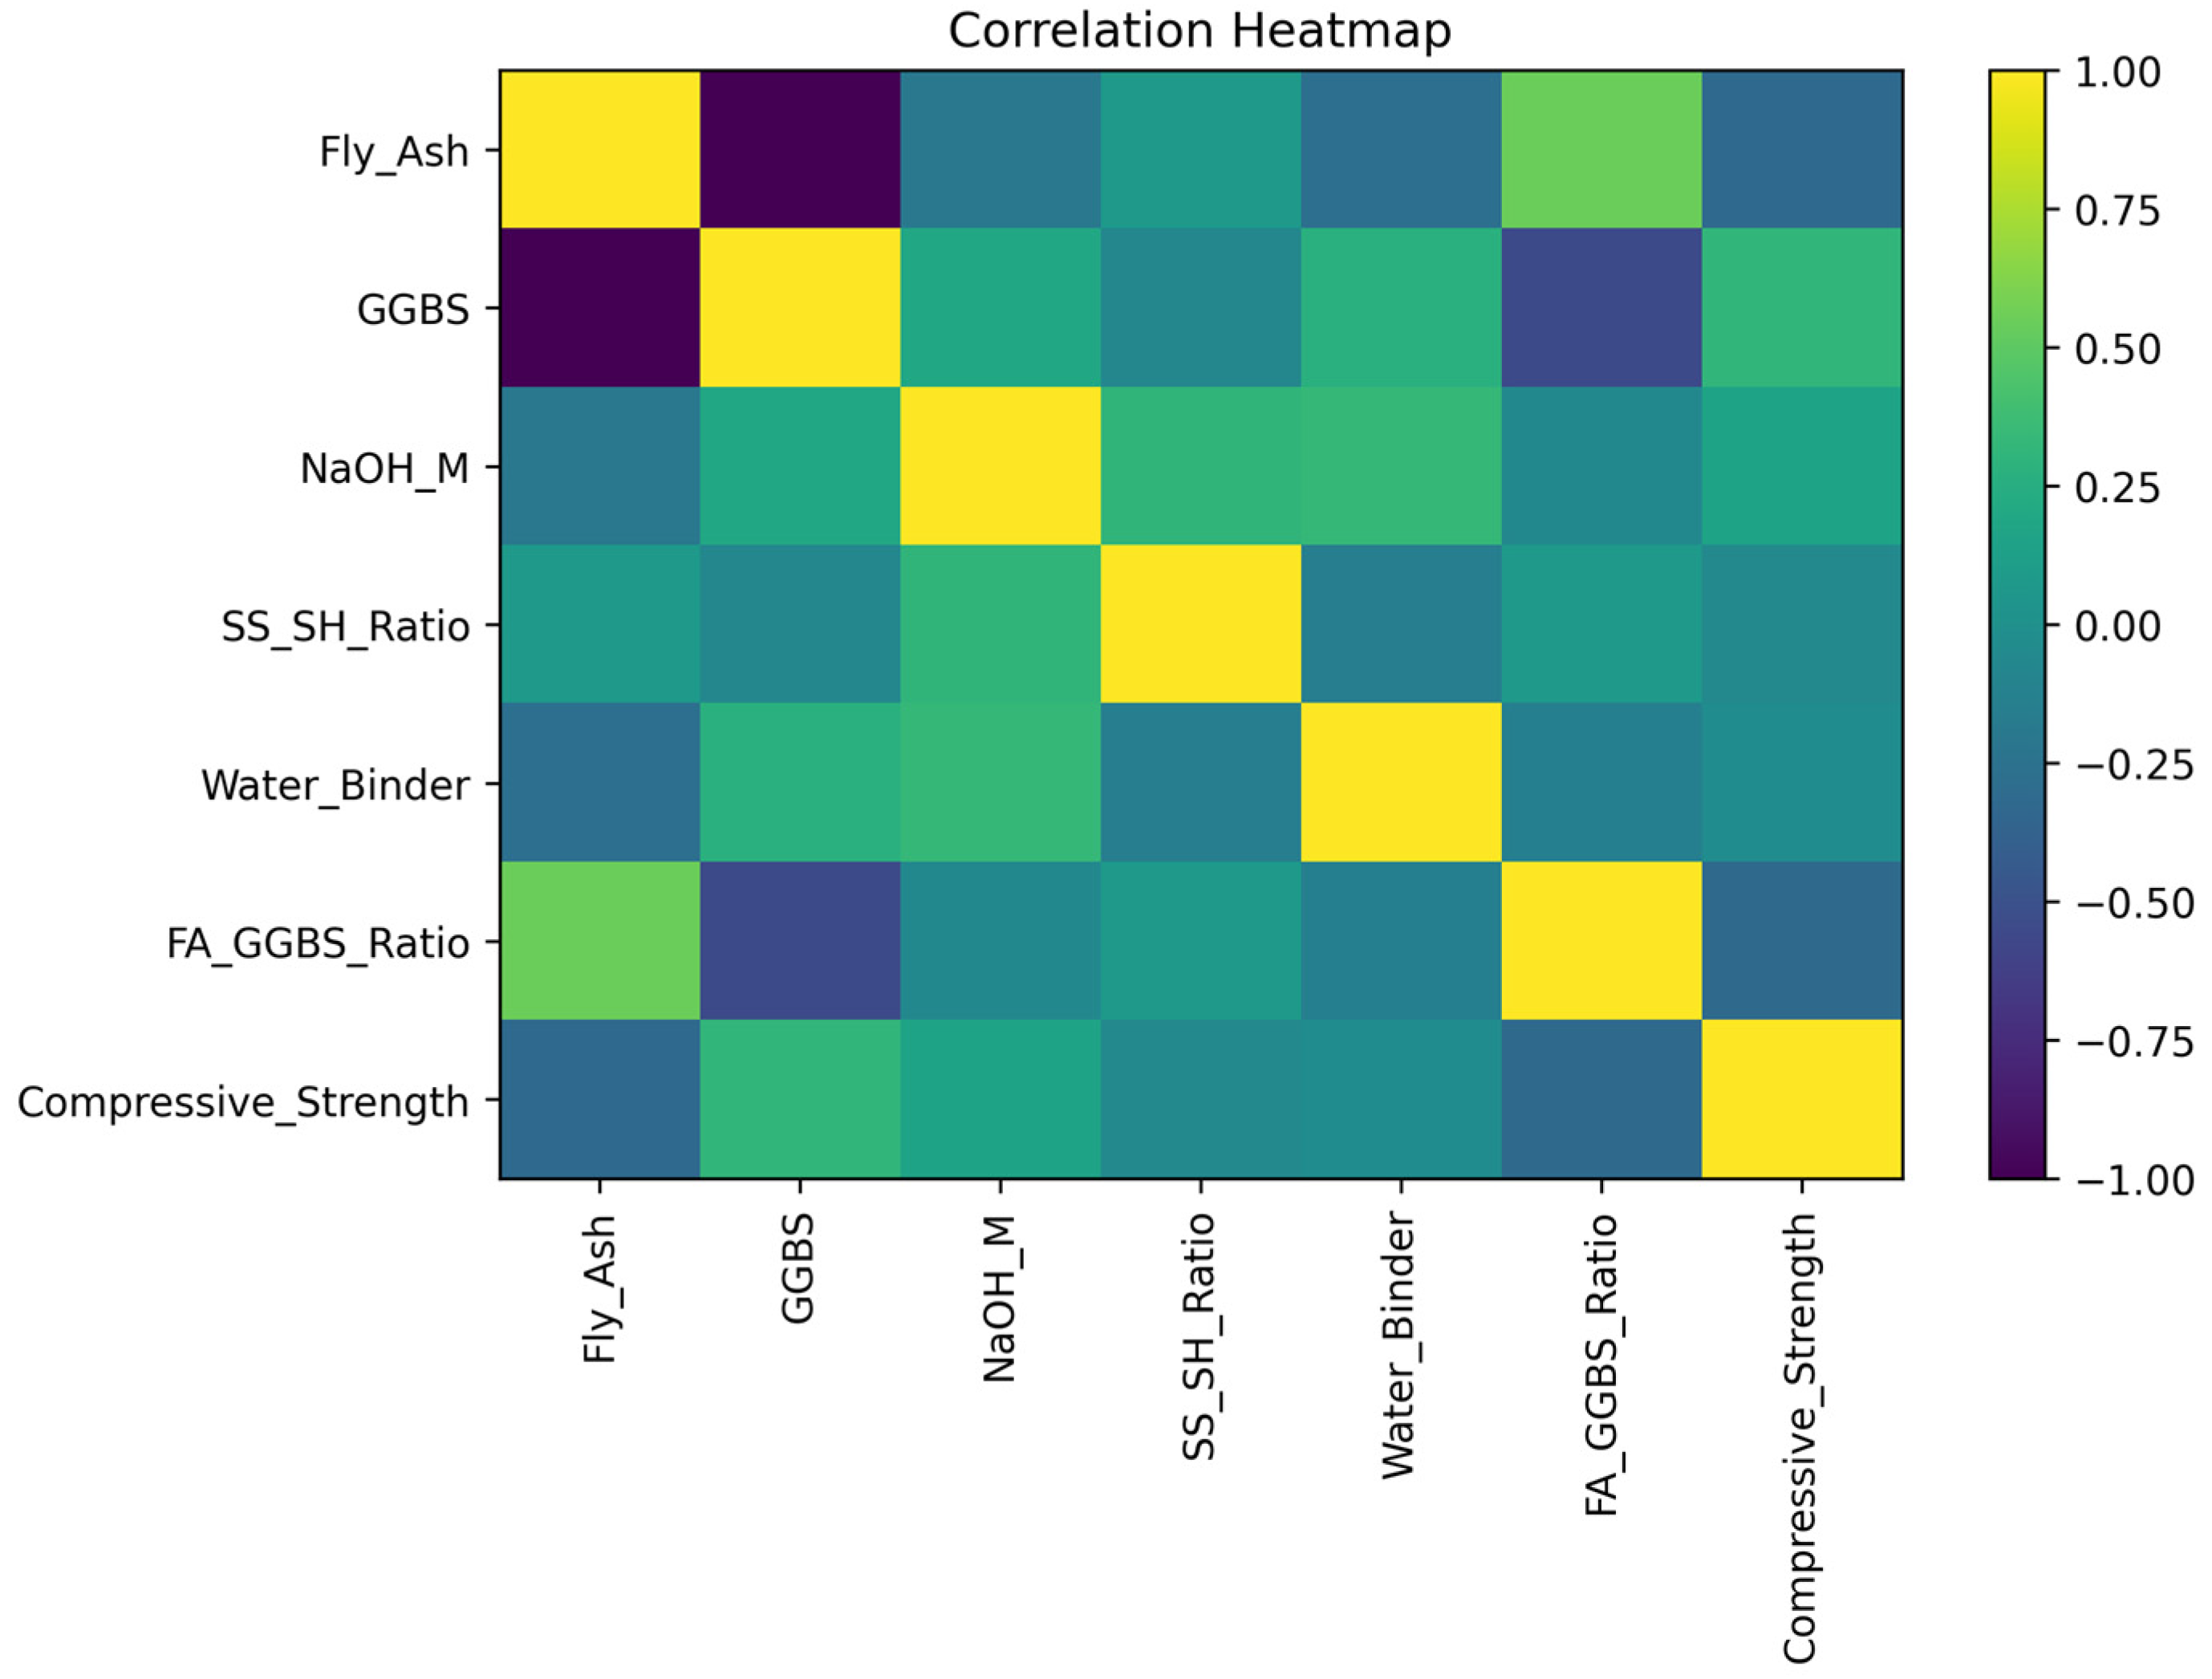
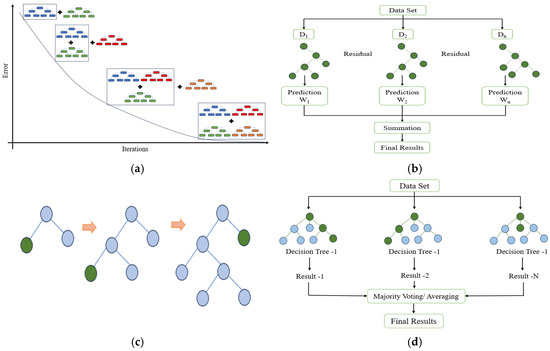
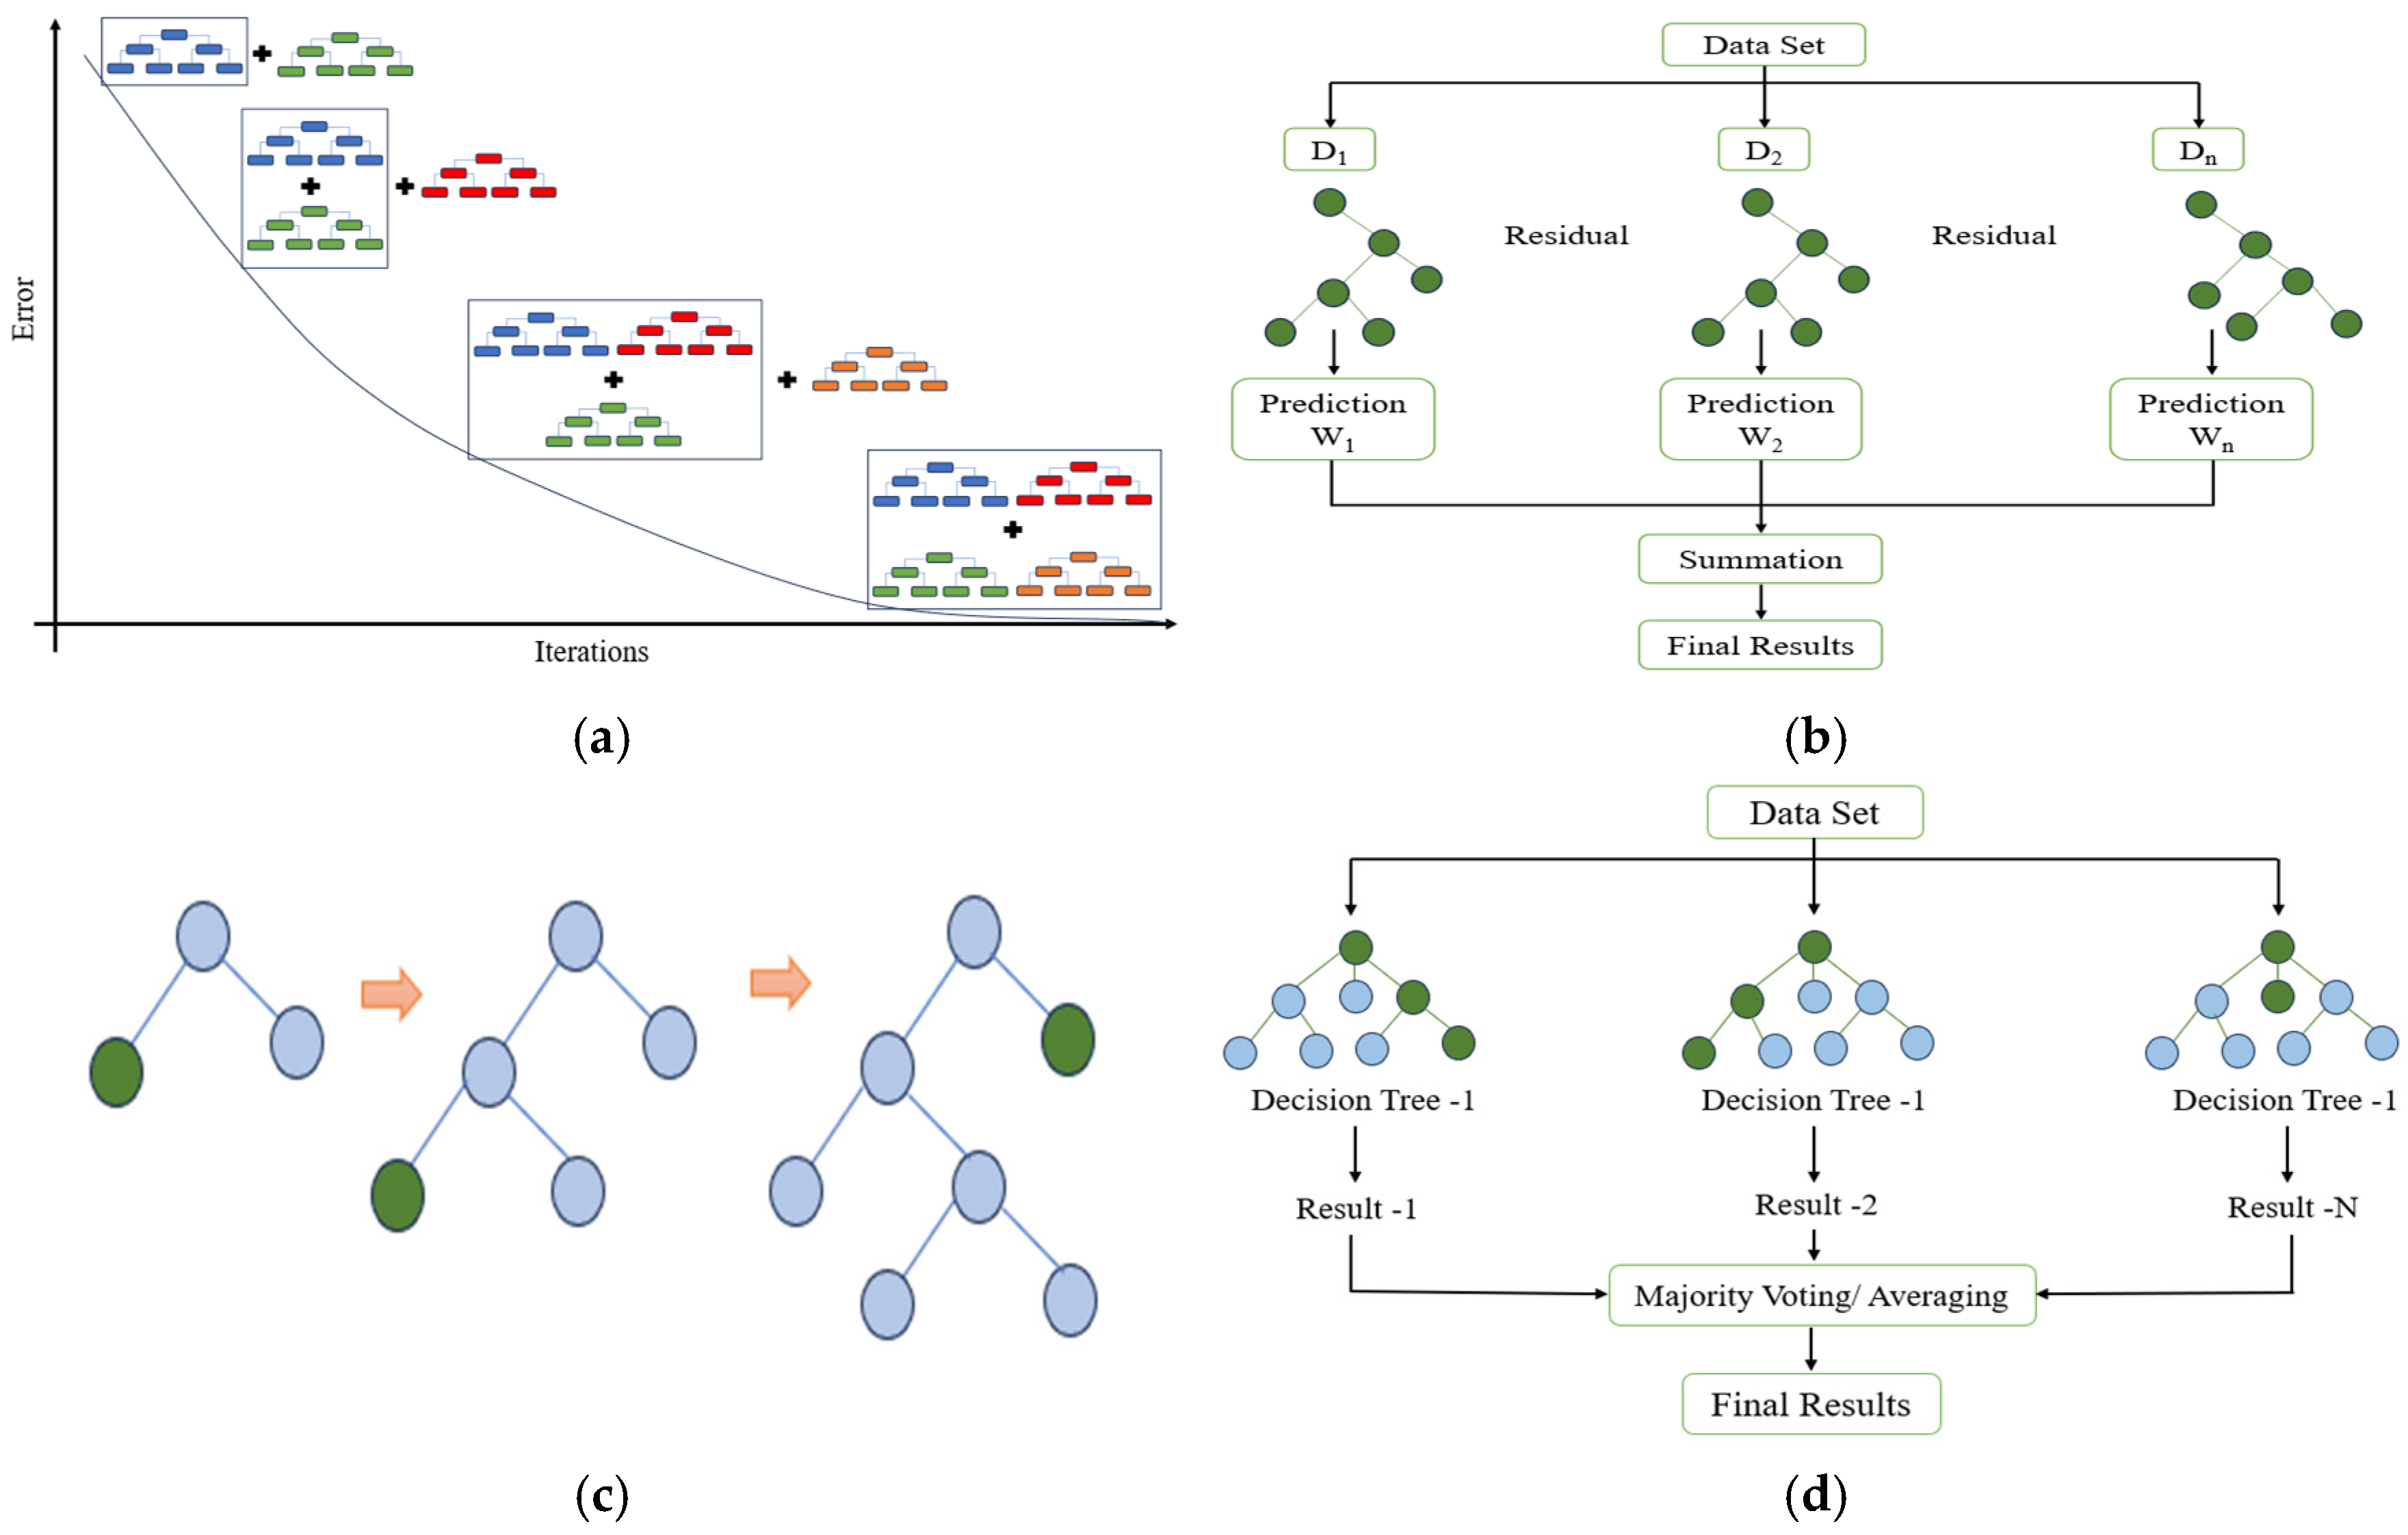
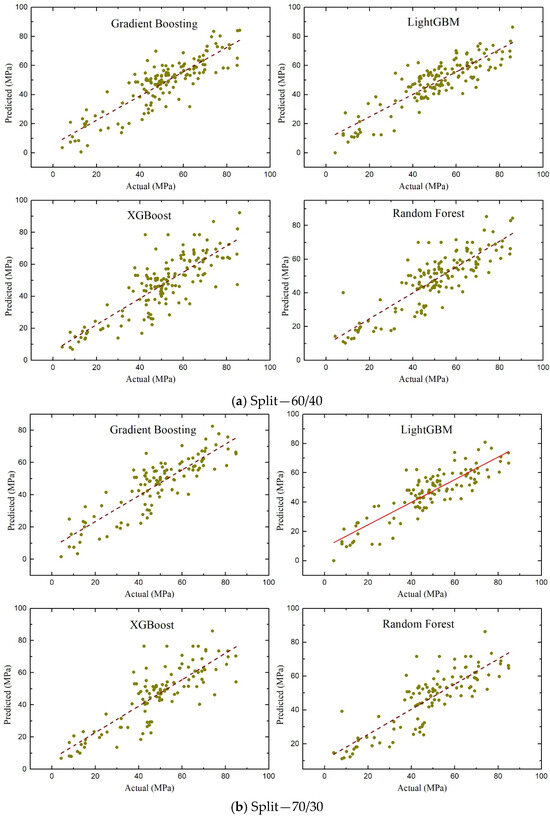
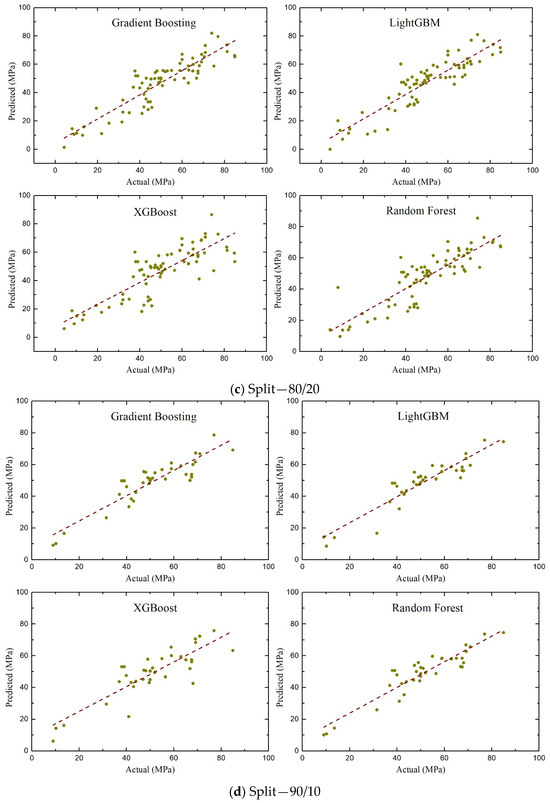
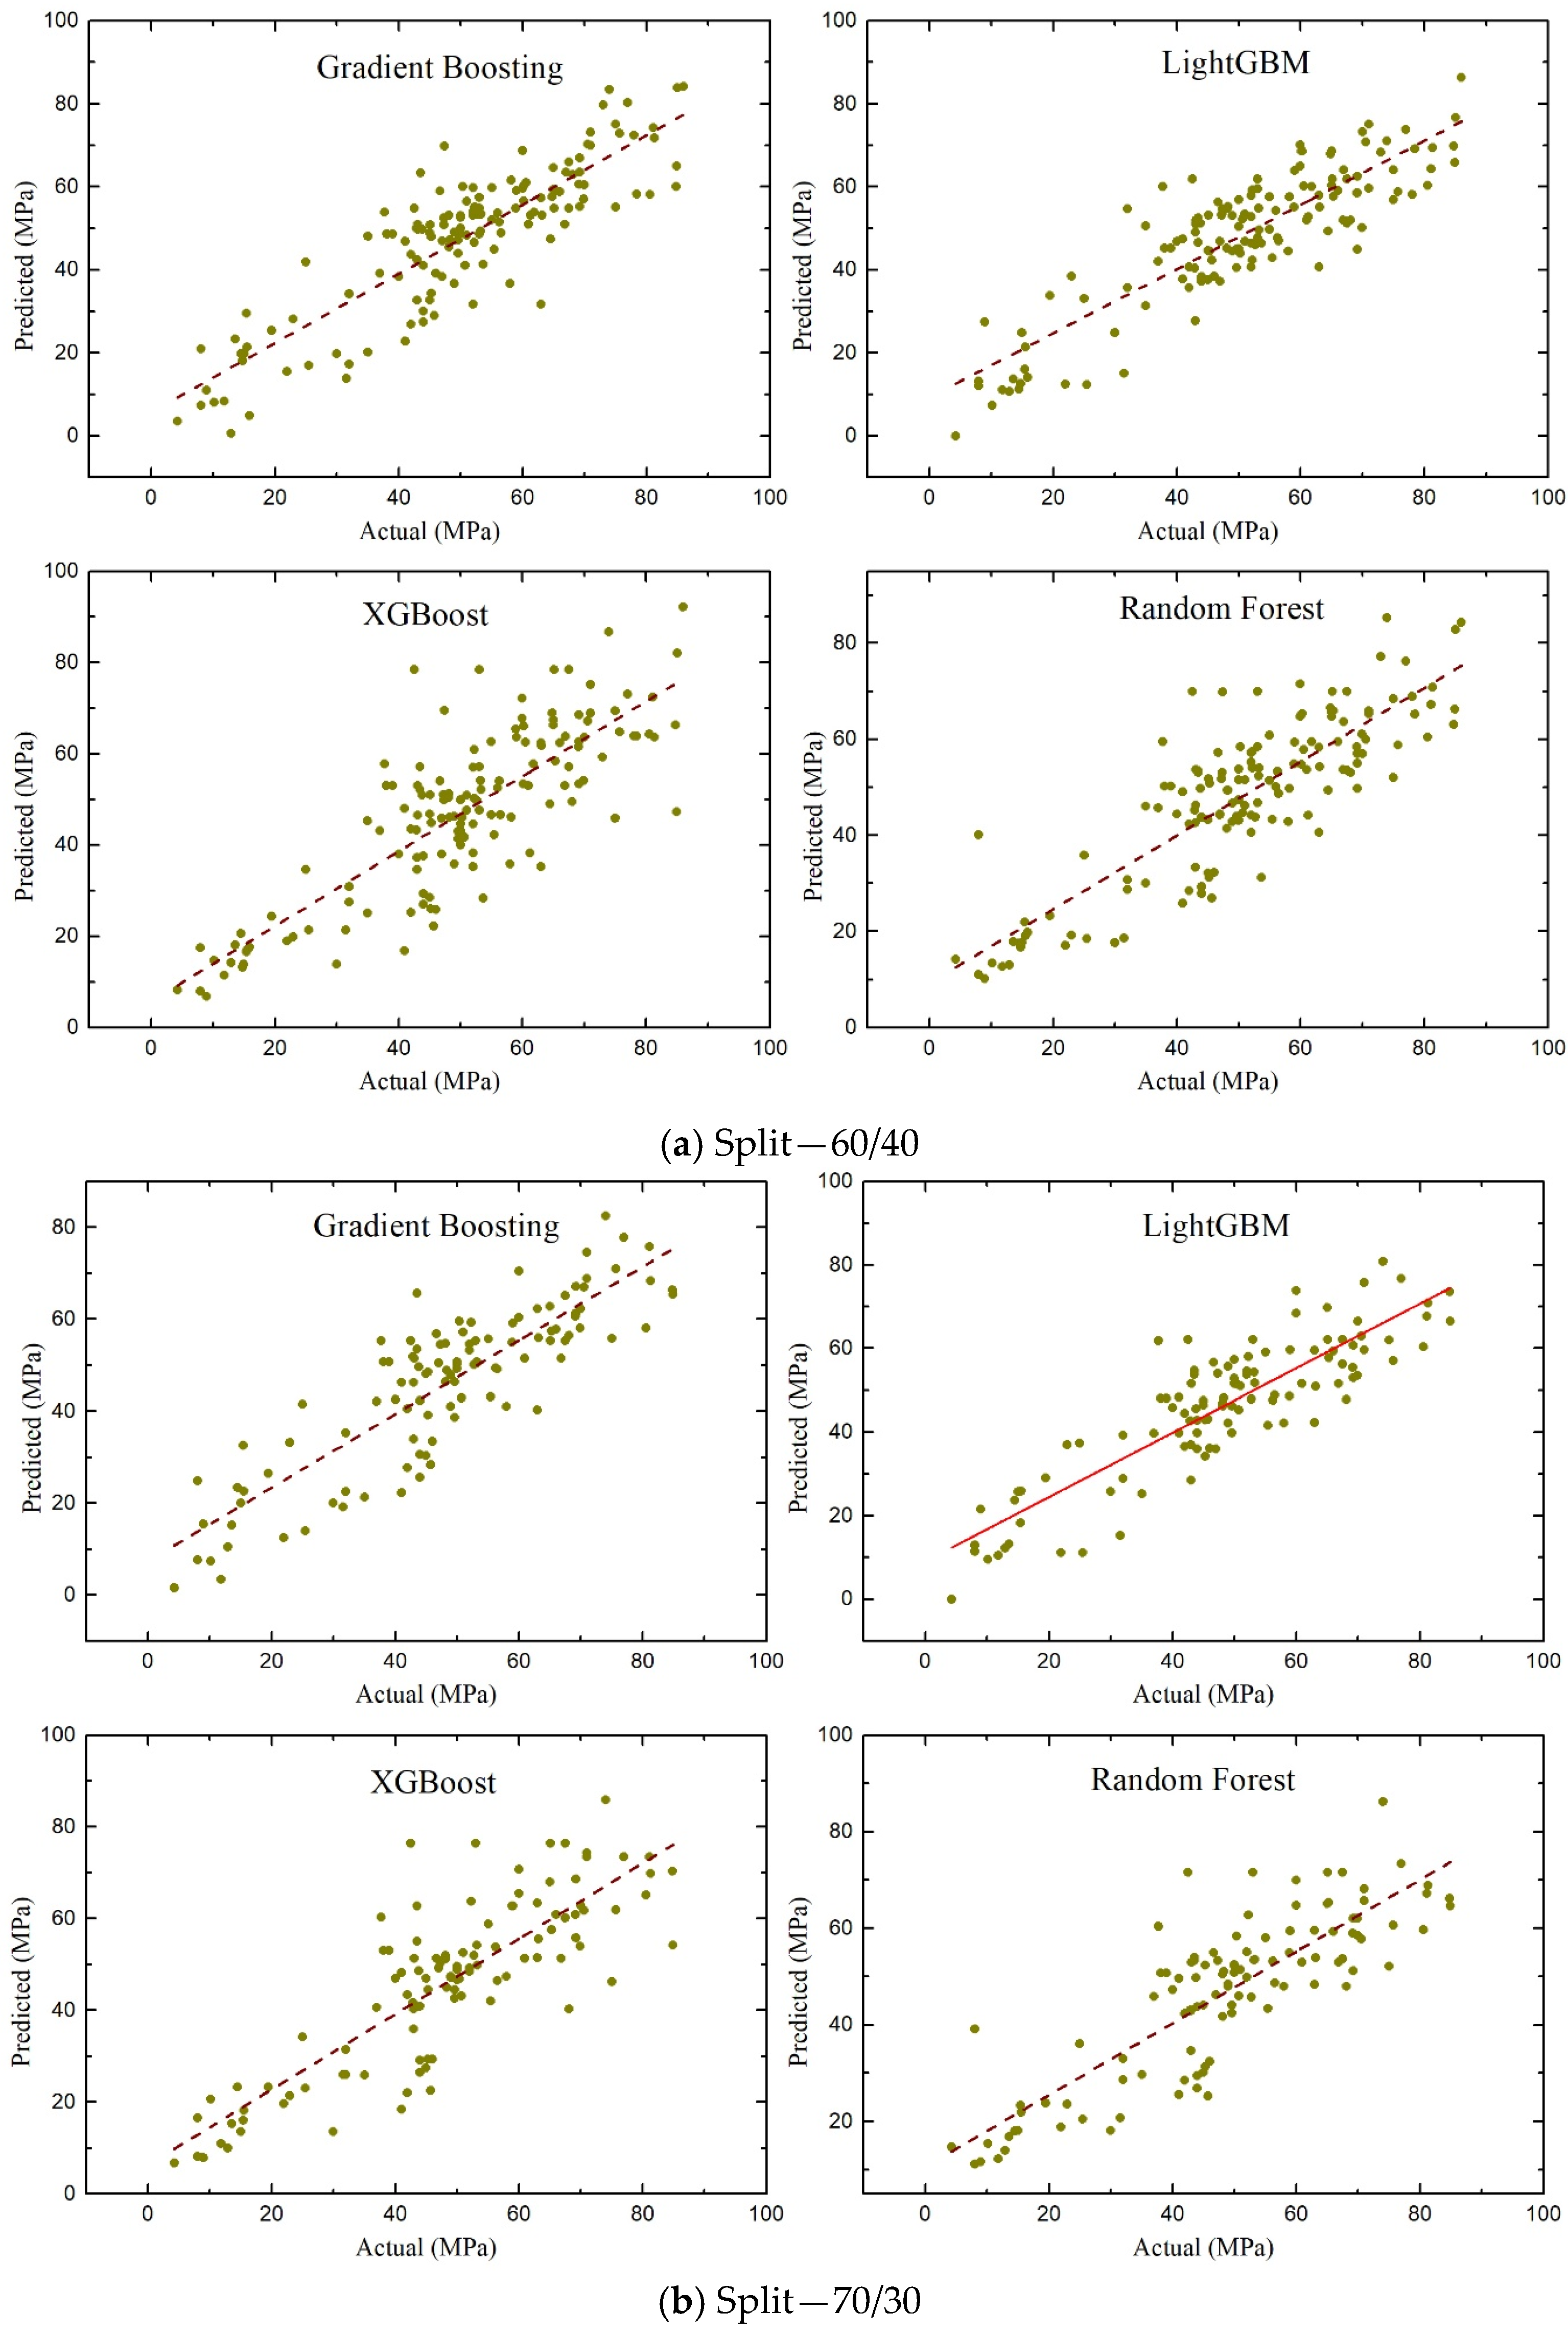
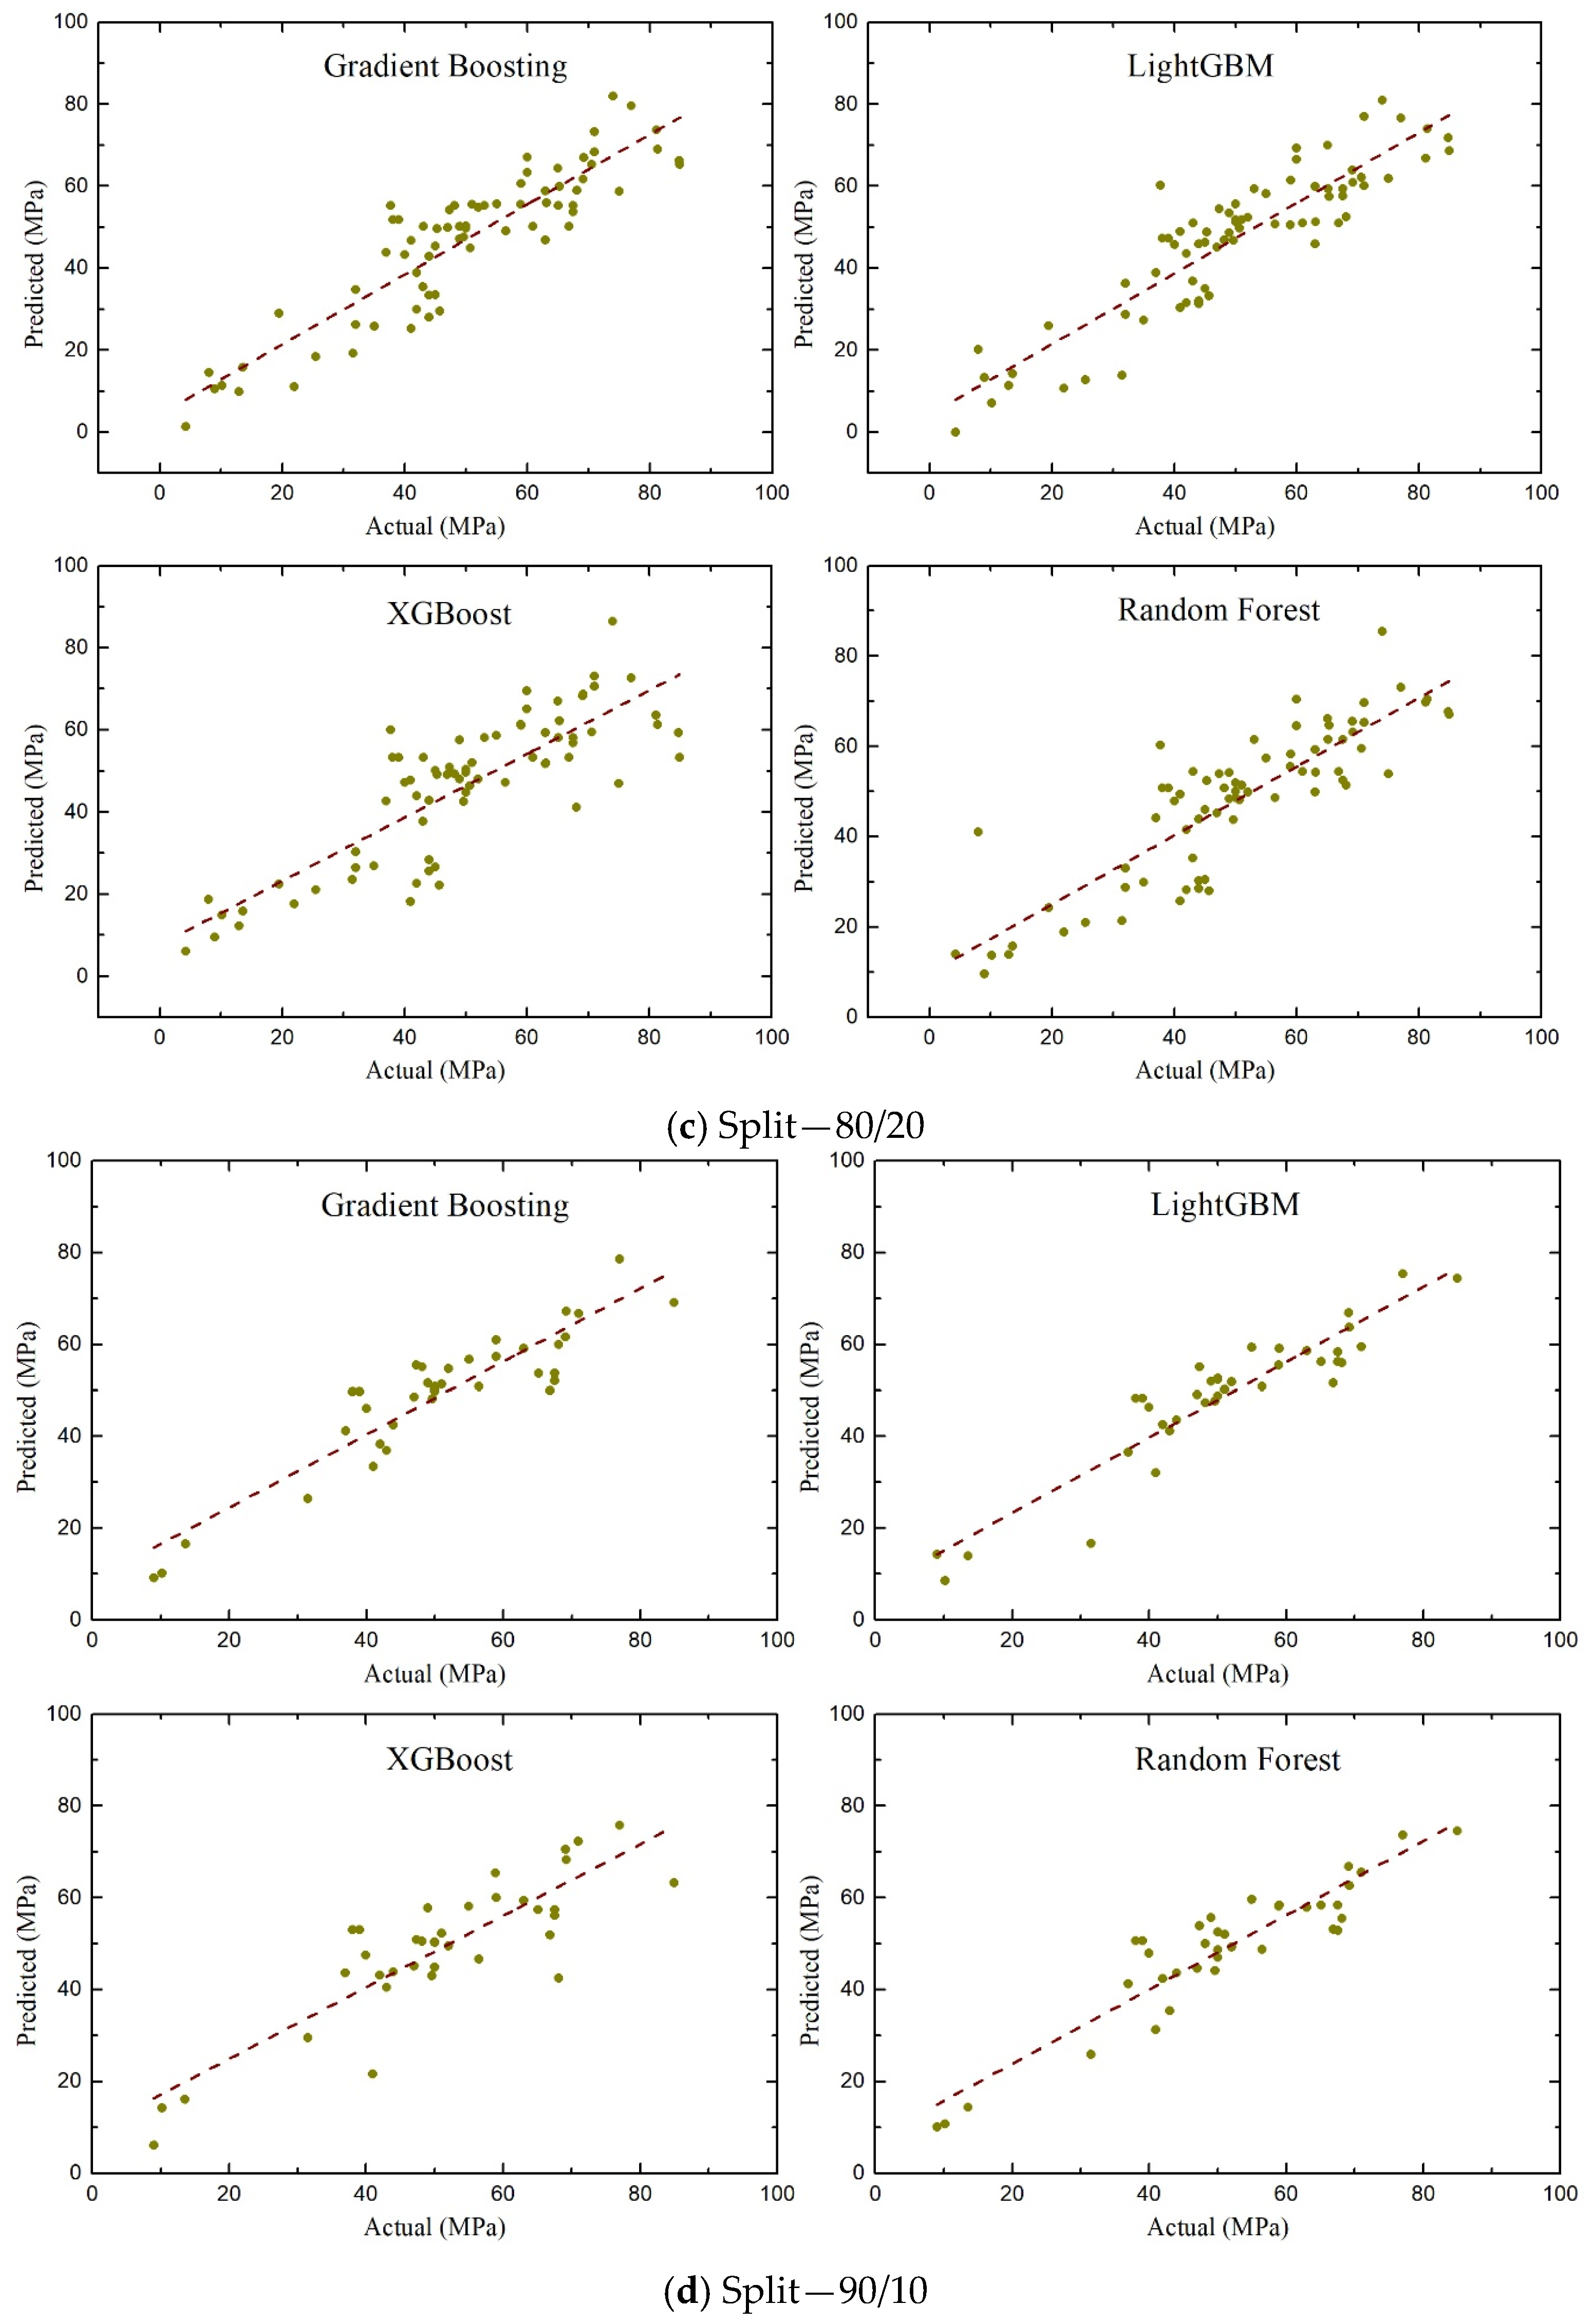
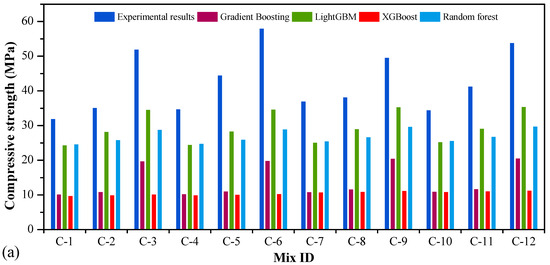
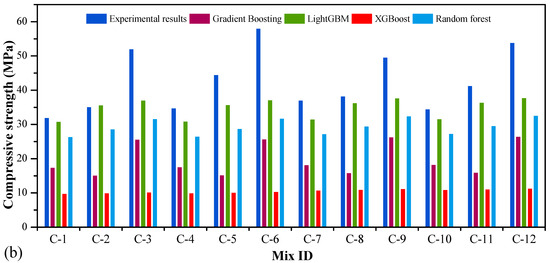
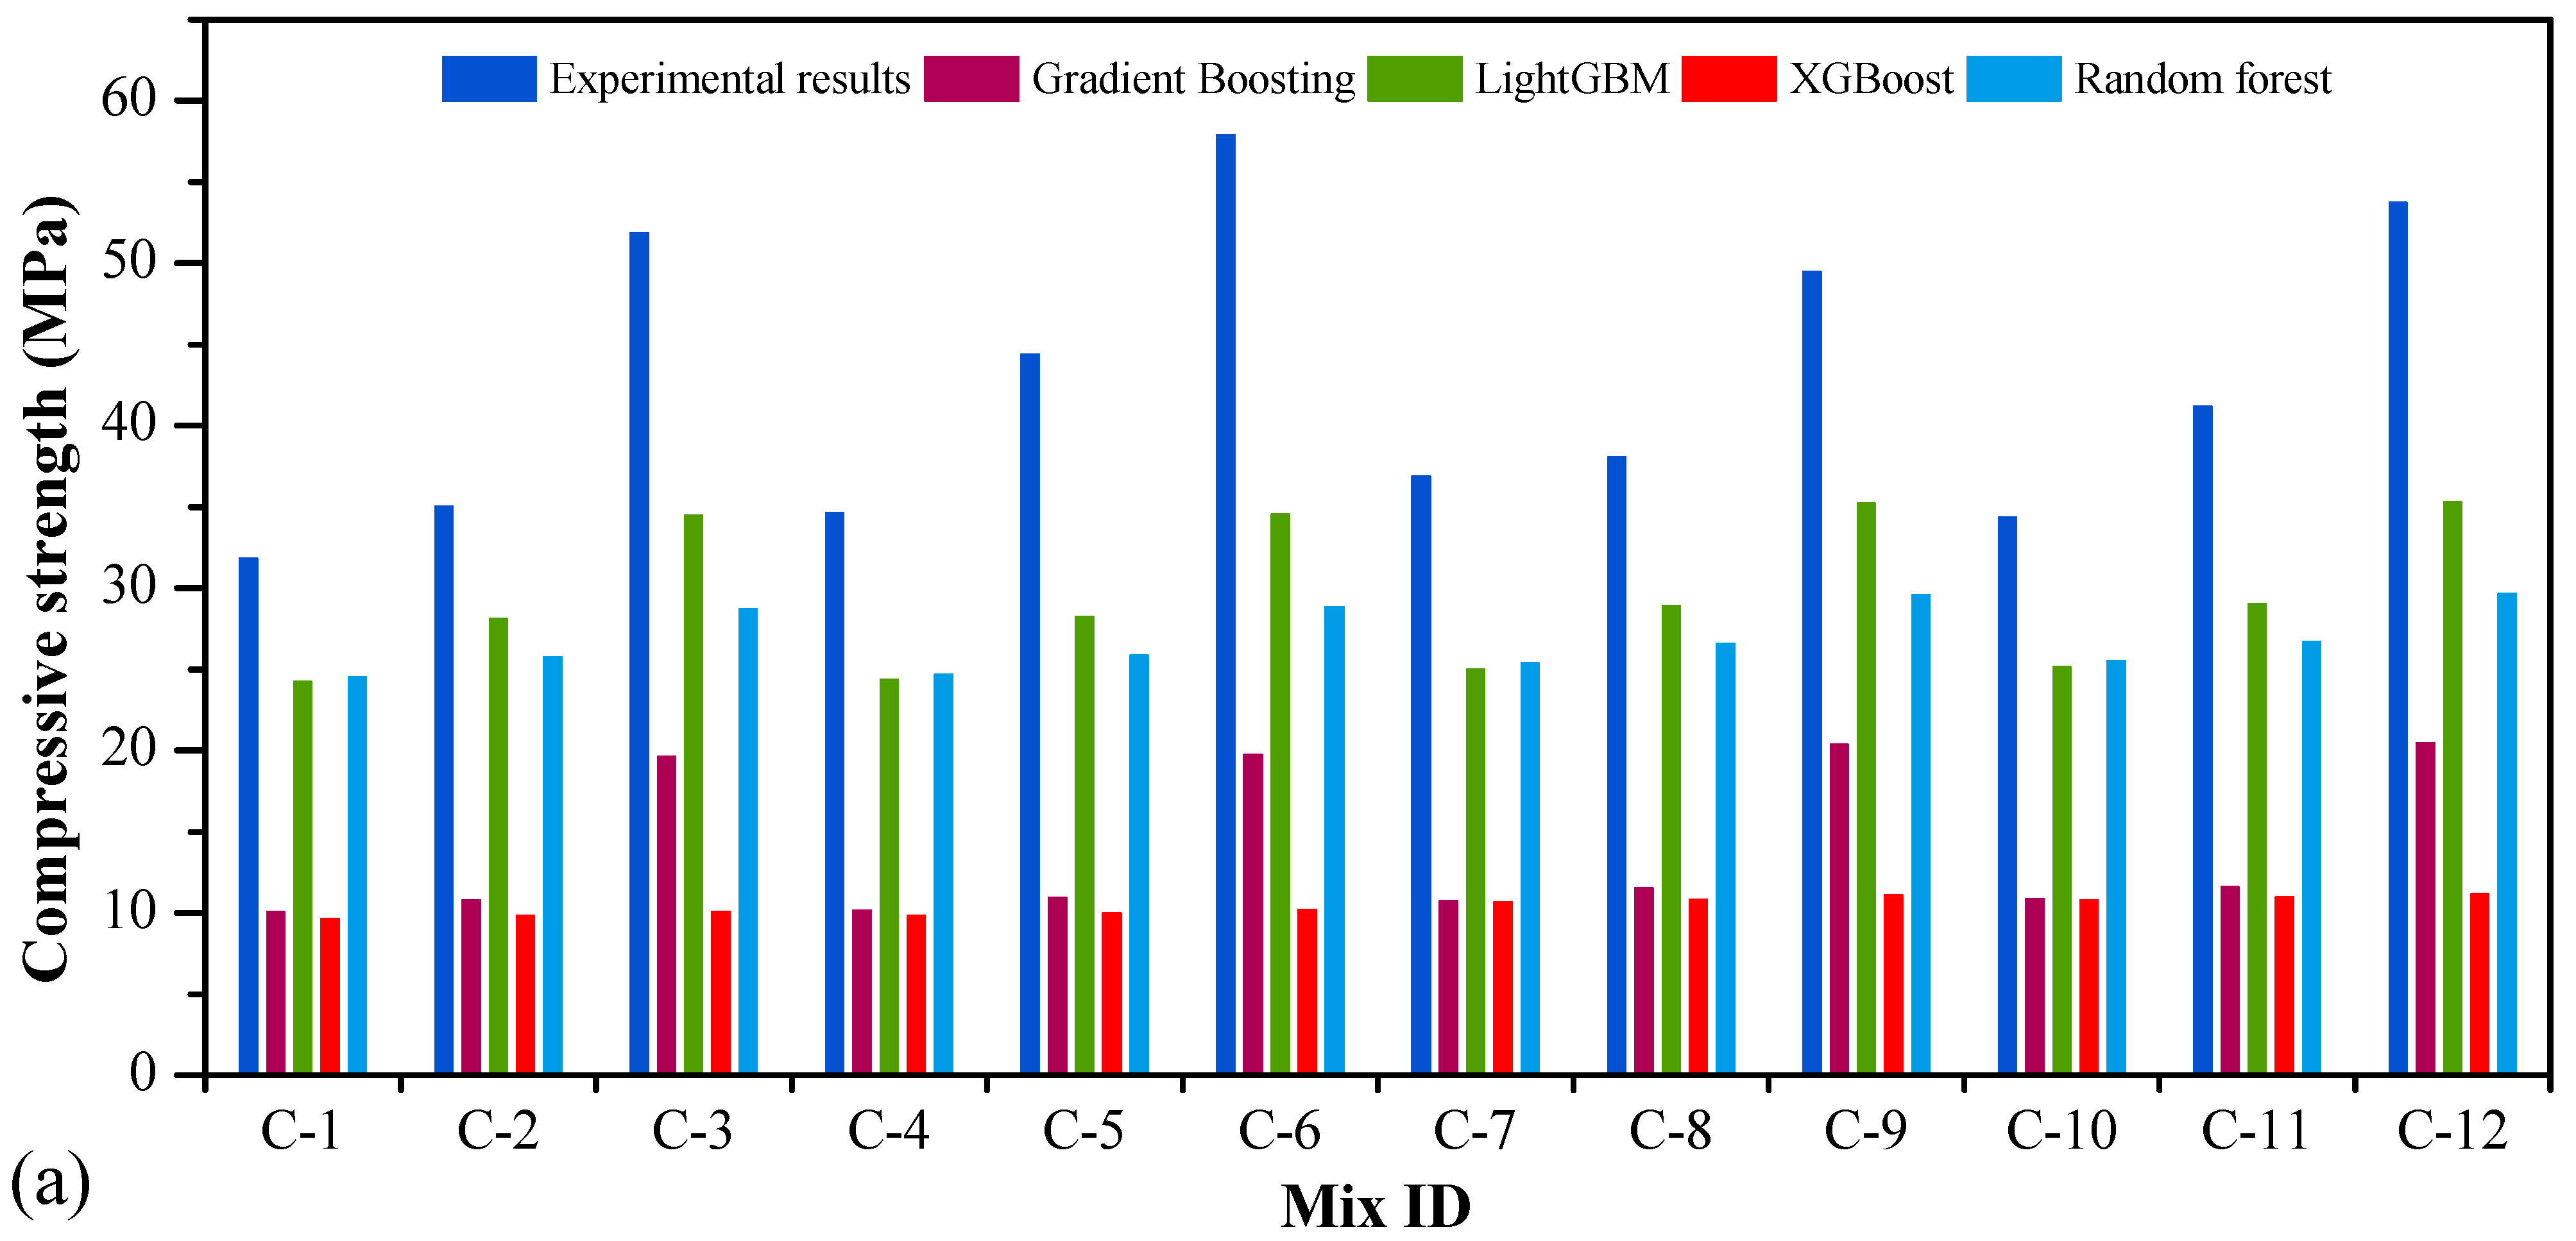
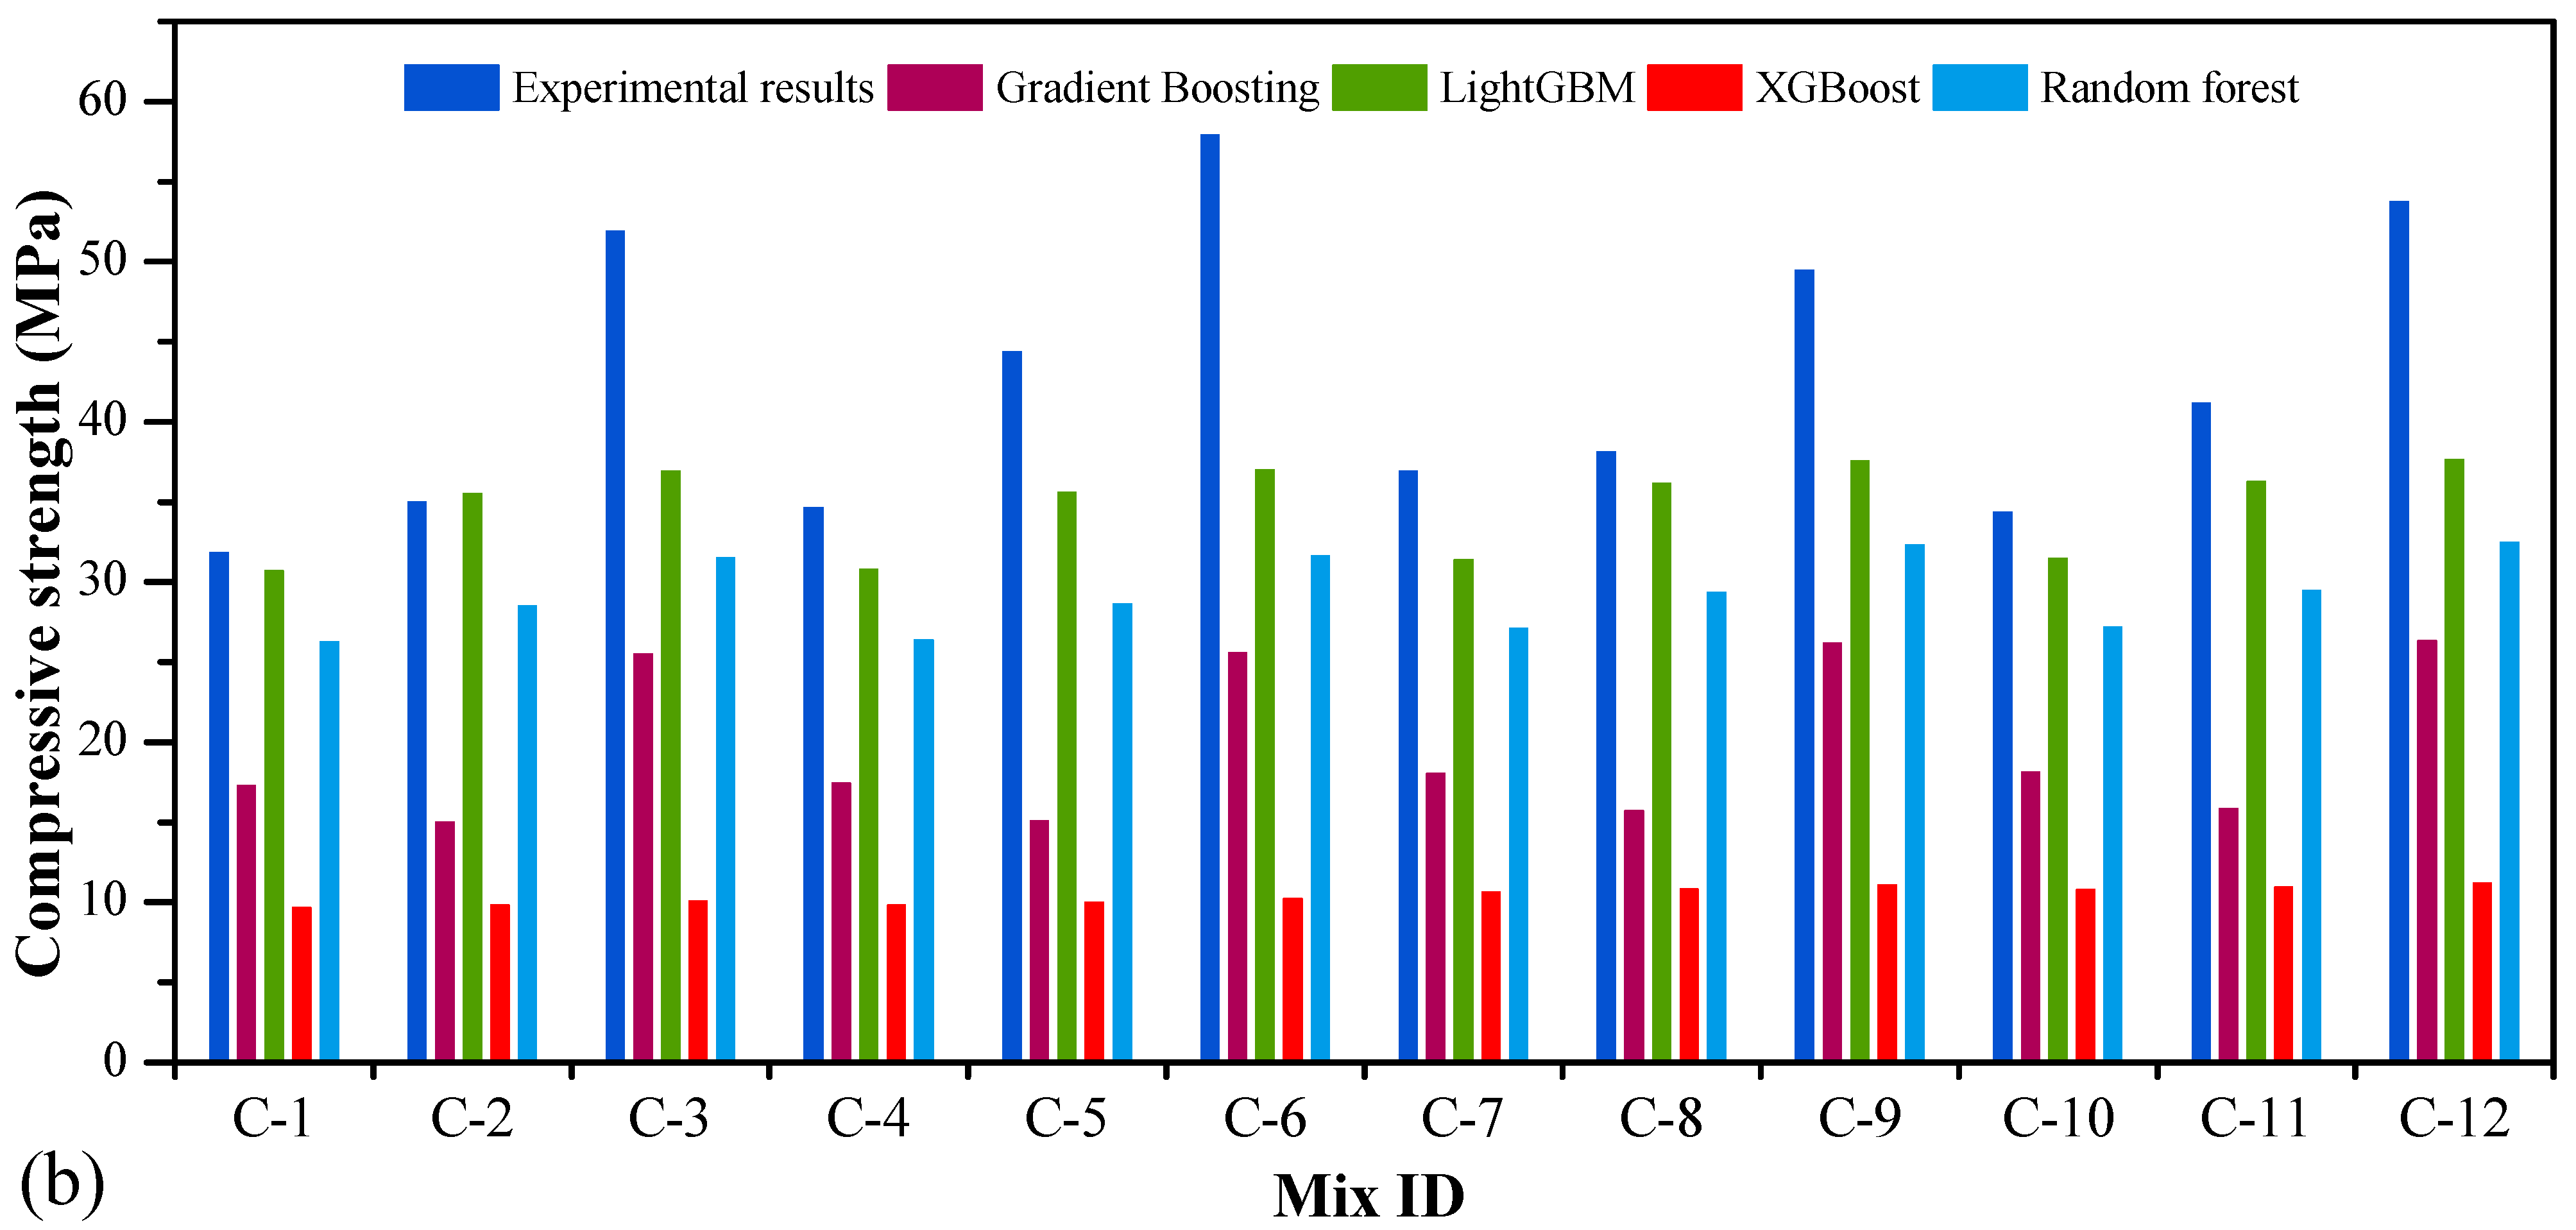

Disclaimer/Publisher’s Note: The statements, opinions and data contained in all publications are solely those of the individual author(s) and contributor(s) and not of MDPI and/or the editor(s). MDPI and/or the editor(s) disclaim responsibility for any injury to people or property resulting from any ideas, methods, instructions or products referred to in the content. |
© 2026 by the authors. Licensee MDPI, Basel, Switzerland. This article is an open access article distributed under the terms and conditions of the Creative Commons Attribution (CC BY) license.