Article

Non-Invasive ML-Enhanced Ultrasonic Sensing System for Refrigerant Flow Characterization in Building Heat Pump Systems

by
Marios Giouvanakis
*,
Theocharis Tsenis
and
Vassilios Kappatos
Hellenic Institute of Transport (H.I.T.), Centre for Research and Technology Hellas, 57001 Thessaloniki, Greece
*
Author to whom correspondence should be addressed.
Buildings 2026, 16(17), 3521; https://doi.org/10.3390/buildings16173521
Submission received: 28 July 2026 / Revised: 26 August 2026 / Accepted: 2 September 2026 / Published: 3 September 2026

Abstract

This paper introduces a non-invasive ultrasonic sensing system for two-phase refrigerant flow characterization in heat pump circuits used in building energy systems, validated through machine learning (ML)-based regression of the acquired signals. Heat pumps play a crucial role in energy-efficient buildings. However, the absence of a low-cost, non-invasive instrument capable of measuring mass flow rate, mixture density, and vapor quality without disrupting the thermodynamics of a refrigerant circuit remains a gap for smart HVAC systems. A carbon dioxide (CO2) refrigerant circuit was designed to calibrate such a sensing system under representative operating heat pump conditions. Ultrasonic measurements were conducted using piezoelectric transducers clamped onto the refrigerant pipeline. A calibration framework was structured with ground-truth flowmeter labels, establishing a thermodynamic envelope across 10–20 bar and down to −25 °C, and achieving R2 = 0.901 for flow rate, 0.997 for density, and 0.971 for quality, with an overall R2 = 0.956. The proposed measurement system is a plug-and-play kit enabling more efficient next-generation heat pumps, supporting building energy management and performance monitoring. The labeled dataset and calibration methodology provide a basis for training and validating ML regression models for real-time flow property inference in operational HVAC systems.

1. Introduction

Heat pumps are a central technology for decarbonizing heating and cooling and for improving building energy efficiency. They rely on closed refrigerant circuits whose efficiency depends on accurate knowledge of the fluid’s thermodynamic state. The real-time measurement of the mass flow rate, mixture density, and vapor quality in such circuits is essential for performance optimization, fault detection, and control. Conventional invasive instruments such as Coriolis flowmeters are usually expensive and require pipeline modifications, introducing potential pressure drops and disturbing the refrigerant thermodynamics. A non-invasive, low-cost measurement solution for simultaneous characterization of refrigerant two-phase flow has not yet been demonstrated under the specific thermodynamic constraints of heat pump refrigerant circuits.
Ultrasonic testing (UT) offers an appropriate solution for non-invasive refrigerant flow characterization. The non-invasive nature of ultrasonic techniques eliminates flow disturbance and pressure drop while allowing plug-and-play operability under normal operating conditions. The absence of physical contact with the fluid is particularly valuable to preserve the system’s thermodynamics. Ultrasonic methods utilize the wave propagation properties in different media, such as speed, attenuation, wave reflection, and scattering, to investigate fluid properties and detect anomalies. Wave energy is attenuated in liquids mainly through viscosity, whereas in gases it is dissipated through thermal relaxation, molecular vibrations, and scattering. In two-phase flow applications, ultrasonic waves interact with phase interfaces and bubbles, producing complex acoustic signals. Simple time-of-flight (TOF) or amplitude measurements often fail to capture their transient and non-stationary characteristics.
Ultrasonic methods have been extensively applied to two-phase flow measurements. In the gas–liquid flow analysis, Morala and Chang [1] applied pulse-echo UT to measure the interfacial area between gas–liquid phases. Bates et al. [2] used ultrasonic transit-time measurements with temperature and pressure compensation to determine binary gas mixture concentrations. Xing et al. [3] developed a model for ultrasonic transit-time flowmeters for stratified gas–liquid flows. Al-lababidi et al. [4] utilized 1 MHz transducers for gas void fraction in slug flow. Ren et al. [5] designed a mutually perpendicular sensor configuration for void fraction in oil–gas–water three-phase flow. Arellano et al. [6] characterized an ultrasonic flowmeter for liquid and dense CO2 under static conditions, noting that the gaseous-phase attenuation peak overlaps with typical flowmeter frequencies. A review by Afandi et al. [7] covered the development of ultrasonic sensors for non-invasive mass flow rate measurements. At the array level, Tan et al. [8] developed a dual-mode ultrasonic tomography system by fusing the attenuation and TOF data for multiphase flow imaging. In related leakage and concentration sensing, Mostafapour and Davoodi [9] applied acoustic emission (AE) sensors for pressurized gas leakage detection; Adnan et al. [10] demonstrated AE-based small leak detection in gas networks; and Jahanian et al. [11] proposed an acoustic sensor system for dynamic estimation of leak localization. Zhao et al. [12] applied a dual-frequency method for CO2/N2 concentration; Liang et al. [13] applied a virtual phased-array system for gas leak localization; and Aprea et al. [14] compared a clamp-on ultrasonic flowmeter against a reference Coriolis meter for non-invasive refrigerant flow rate measurement in a direct expansion system.
Machine learning approaches have also been used to strengthen the flow characterization with ultrasonics. Roxas II et al. [15] compared traditional ML and neural network (NN) classifiers for ultrasonic flow regime identification. Abbagoni and Yeung [16] demonstrated a clamp-on ultrasonic Doppler sensor for non-invasive classification of gas–liquid flow regimes with an NN, an approach that was later extended by Kuang et al. [17], applying convolutional recurrent NNs to non-intrusive Doppler data in an s-shaped riser. At the sensor-array level, Liu et al. [18] proposed an ML-based ultrasound array for autonomous identification of gas–liquid flow patterns, and Bowler et al. [19] reviewed ML-based sensing methods for industrial monitoring applications. Under high gas-content conditions, i.e., 20%, the increased scattering and attenuation limit the ultrasonic accuracy and penetration depth. For such conditions, Mao et al. [20] proposed a convolutional neural network (CNN) for real-time identification of gas–liquid flow sub-regimes, achieving over 91.5% accuracy, while Fang et al. [21] combined ultrasonic phased arrays with k-nearest-neighbor classification for two-phase flow identification, reaching an accuracy of 99.35%.
CO2 presents strong ultrasonic attenuation, making it one of the most acoustically challenging fluids to measure. Zevnik et al. [22] investigated the ultrasound speed and absorption near the CO2 critical region, while Lin and Trusler [23] highlighted the difficulty in measuring pure CO2 at high frequencies (≥5 MHz) due to vibrational relaxation absorption. Below 100 kHz, resolution is insufficient to detect vapor bubbles and interfacial structures, while above 500 kHz, attenuation and scattering degrade the signal-to-noise ratio. The existing ultrasonic systems are largely fluid-specific, designed for single working media under ambient conditions, and require complex multi-channel architectures that limit the scalability and cost-effectiveness. Ultrasonic sensor arrays have not been validated for flow characterization in heat pump refrigerants under their specific thermodynamic constraints.
Accurate knowledge of the refrigerant’s flow properties links directly to the heat pump’s coefficient of performance (COP), which is sensitive to the medium’s deviations and two-phase flow distribution, or to the vapor superheat at the compressor inlet. Thus, undetected changes in parameters like the flow rate, density, and vapor quality can lead to efficiency losses and increased energy consumption. A non-invasive sensing system for monitoring these quantities without disrupting the refrigerant circuit can enable early fault detection and dynamic optimization of the heat pump operation. Moreover, such accurate flow information could also support the coordinated control of the compressor and electronic expansion valve to optimize CO2 heat pump performance [24]. The aim of the proposed system is to be deployed directly on the heat pump’s refrigerant circuit, relying on a calibration procedure and a multichannel piezoelectric transducer (PZT) sensor approach, to deliver simultaneous flow characterization.
The present paper covers the dedicated sensing hardware and the reference-based calibration methodology, along with a representative ML-based validation result. The main contributions, which, to the best knowledge of the authors, have not been previously demonstrated for two-phase refrigerant flow characterization, are as follows. First, the development of a novel clamp-on ultrasonic sensing system with commercially available transducers in a scalable sensor assembly, validated within a specifically designed CO2 circuit. Second, the measurement system has been designed as a direct plug-and-play unit, without any modifications to the commercial thermodynamic circuits. Third, the measurement system is robust across a wide operational envelope, based on the nature of the piezoelectric sensors but, most importantly, on the ability to easily scale the number of sensors to cover the entire range. At the same time, the assembly remains compact so that it can be installed in confined heat pump enclosures. Furthermore, the intuitive calibration methodology per medium with a reference flowmeter, along with a scalable ML regressor for refrigerant variants, enables a quick and cost-effective market deployment. The trained ML models are then intended for application to the target installation so that only the ultrasonic hardware is required for real-time monitoring in heat pumps.

2. Methodology

2.1. Measurement Principle

Propane is a widely used heat pump refrigerant, but it is highly flammable, classified as A3 under ASHRAE Standard 34 [25]. CO2 is a natural, non-flammable refrigerant of safety class A1. It therefore allows the extended calibration campaign required at this stage, with many repeated two-phase states, to be carried out safely in a laboratory setting. The two fluids also have almost identical molar masses: 44.0 g·mol−1 for CO2 and 44.1 g·mol−1 for propane [26,27]. Sound speeds in the two fluids are of comparable order, so the TOF window and signal-processing chain for CO2 remain applicable to propane. However, phase densities differ, so the acoustic impedances are not equal, and the calibration itself is not transferable between the fluids without a dedicated per-medium procedure. The sensor system operates in through-transmission mode, with the transmitter generating ultrasonic pulses that propagate through the CO2 medium and are received by an array of sensors. The received time-domain waveforms contain information on the acoustic attenuation, scattering, and velocity changes produced by the two-phase flow, which simple TOF or amplitude metrics alone cannot capture for such non-stationary events.
A dedicated CO2 refrigerant circuit has been designed for controlled experimental operations, as depicted in Figure 1. It comprises hydraulic components along stainless-steel pipelines, providing dimensional stability under cryogenic conditions and corrosion resistance. The system is constructed using ½” × 1.2 mm 316L seamless stainless-steel pipeline with double-ferrule mechanical fittings rated for pressures exceeding 350 bar [28]. The refrigerant’s thermodynamic state influences the acoustic propagation that is captured by the ultrasonic sensing system within a controlled laboratory environment. All experiments have been conducted in an enclosed area with adequate ventilation and continuous CO2 concentration monitoring using gas detection equipment.

2.2. CO2 Circuit Design and Instrumentation

The experimental unit is designed for safe CO2 operation across variable pressure and temperature ranges as an industrial-grade system. The system is supplied by vertically mounted, adequately restrained CO2 cylinders with 50 L nominal capacity each, containing approximately 37.5 kg CO2 in liquid-vapor equilibrium. Safety considerations address potential release scenarios, including component failures, relief valve discharge, accidental vent valve opening, connection failures, and pressure-regulating device malfunctions.
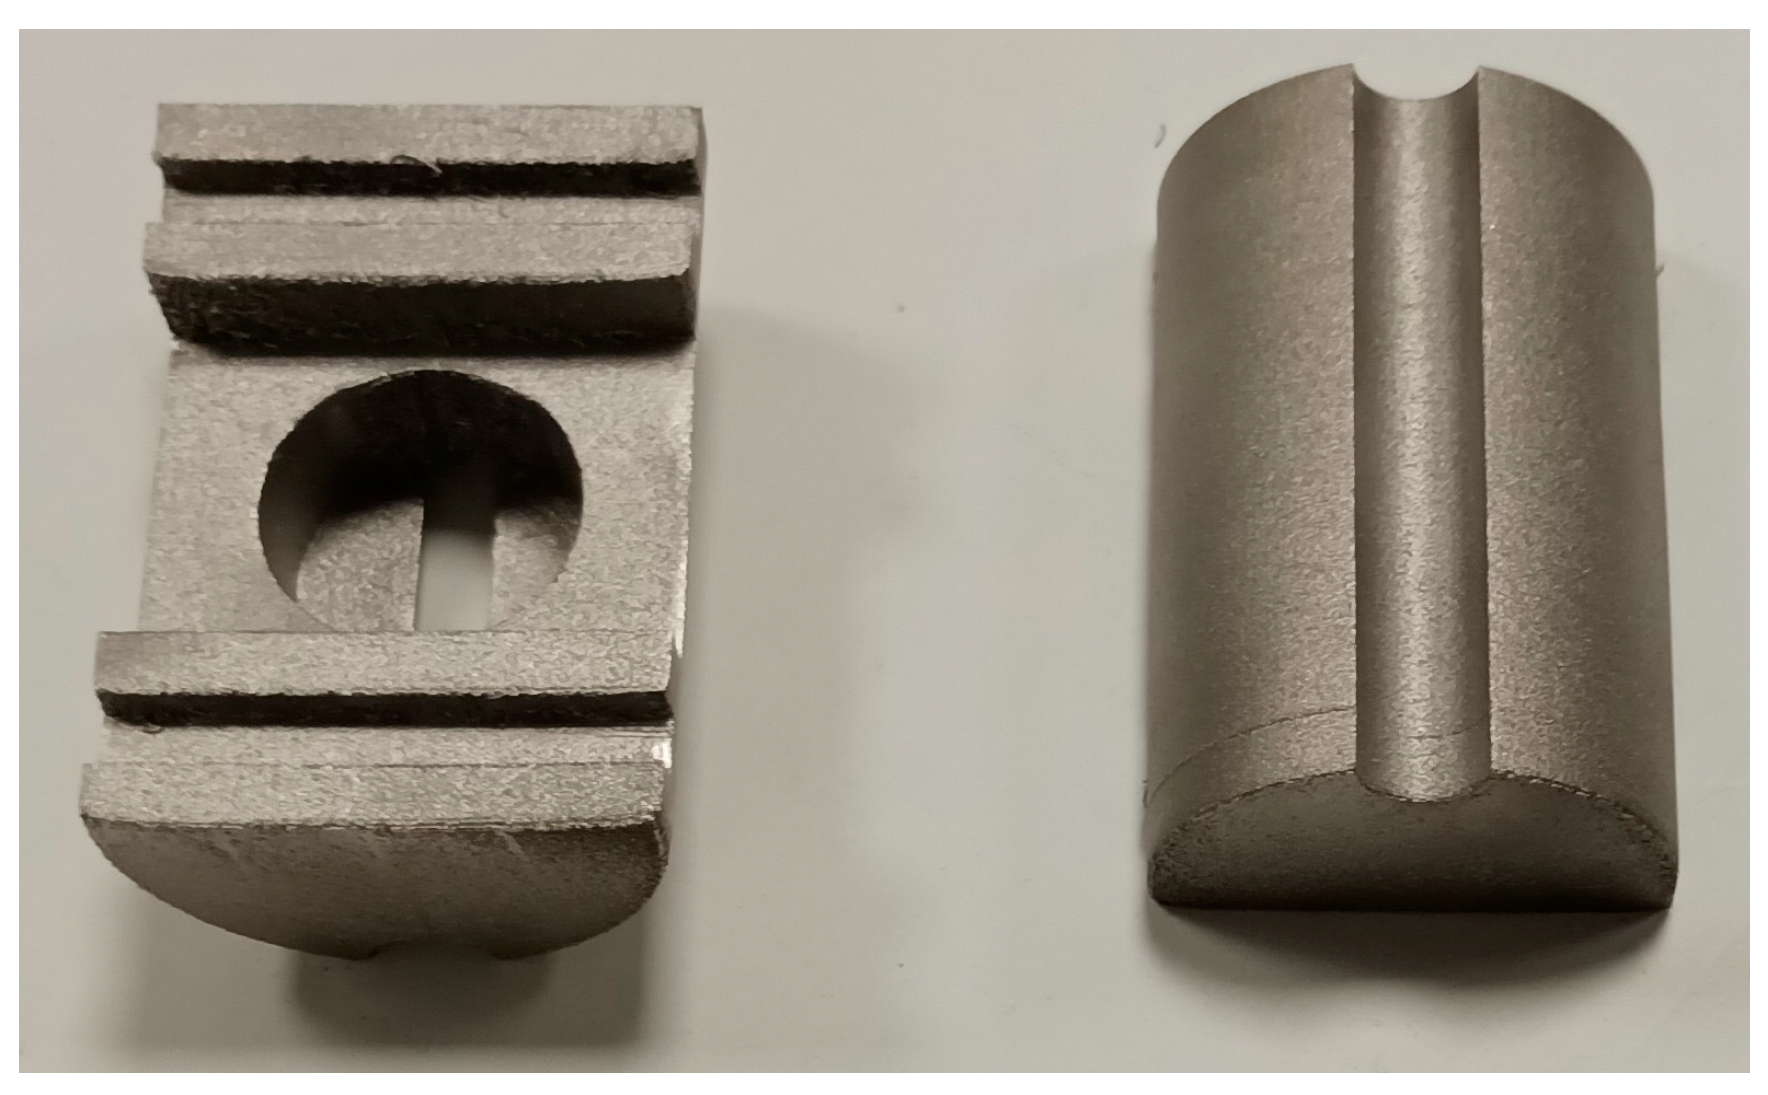
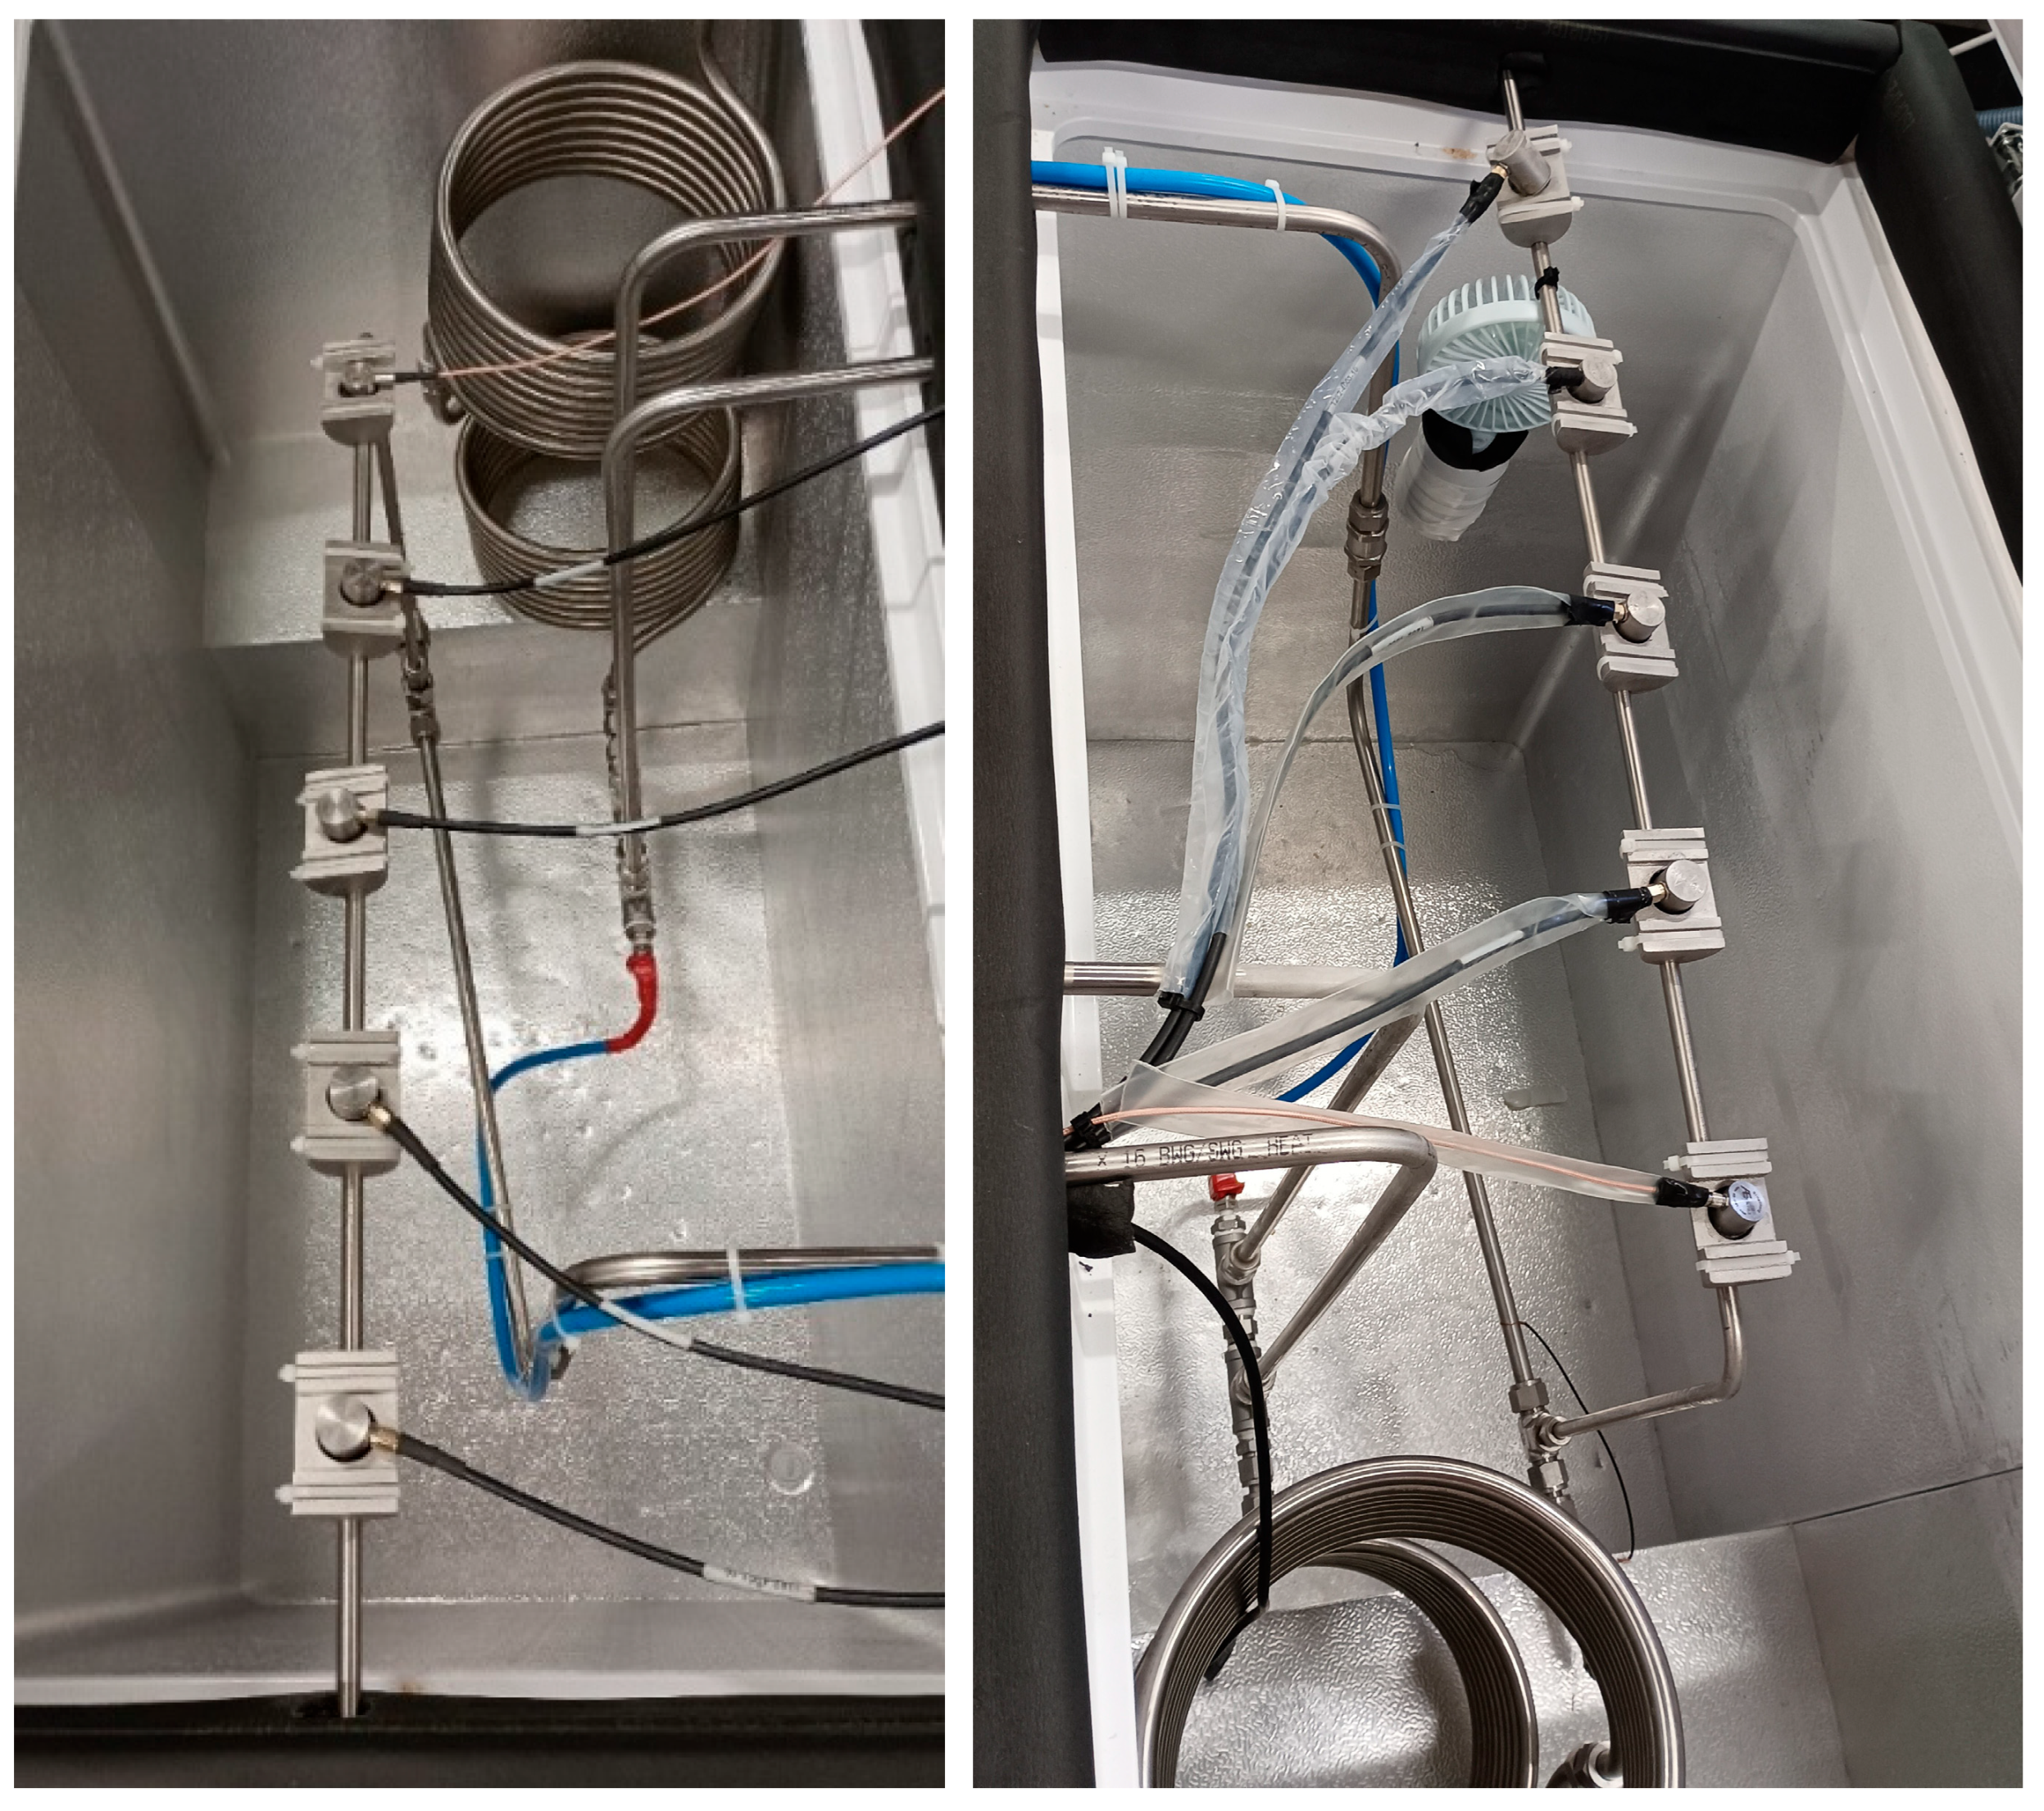
The ultrasonic data acquisition system comprises the Micro-SHM multi-channel AE system operated with the ‘AEwin’ software (SWAE4, version: 4.12.42.136) for acquisition parameter control [29]. As a transmitter, a Qawrums G150 narrow-band resonant sensor at 150 kHz is utilized, in conjunction with the SCAL2 handheld AE calibrator as the ultrasonic source. The latter delivers pulsed sinusoidal excitation at 100, 150, and 200 kHz, with an amplitude of 80 dB relative to 1 μV. Four Physical Acoustics PK15I sensors, resonant at 150 kHz, are utilized as receivers. The sensors are mounted on custom-designed 3D-printed metal sensor bases as depicted in Figure 2, ensuring firm contact with the pipeline and coupled using general-purpose grease for signal transmission with minimum loss. All transducers and sensors are mounted externally on the pipeline in a transverse configuration to capture signals from the internal CO2 mixture while minimizing interference from pipe-wall reflections. The CO2 circuit incorporates a Badger Meter RCT1000 Coriolis flowmeter for direct mass flow rate and density measurements. An analog flow meter is installed in series at the circuit terminus, providing independent measurement verification and error mitigation. A Danfoss MBS3000 digital pressure transmitter with a PR Electronics 5714A programmable LED display provides pressure monitoring. A Jumo VIBROtemp series screw-in Pt1000 RTD temperature sensor with a Quantrol LC100 LED display monitors the temperature. The displays are installed outside the freezer to provide continuous real-time readings. The array is mounted on a 700 mm section of the pipeline, with a center-to-center spacing of 150 mm between adjacent sensors. The received signals are recorded with the Micro-SHM system at 2 × 10⁶ samples/s, corresponding to 10 samples per period at the highest excitation frequency of 200 kHz.

2.3. Operating Conditions and Data Acquisition

CO2 delivery initiates through a single-stage pressure regulator at the supply bottle outlet (Pin: 200 bar, Pout: 0–60 bar), which reduces the inlet pressure to a controlled outlet range. A double-layer flexible hose (PN 450 bar) connects the regulator outlet to facilitate cylinder replacement. Primary isolation is achieved via ball valves, thus enabling the safe shutdown and maintenance of the system. The downstream pressure control is refined through an in-line pressure regulator with Pin: 50 bar and Pout: 0–30 bar, providing additional pressure reduction, adjustment, and stabilization before the refrigeration section. Multiple safety and control devices are integrated throughout the circuit, including a safety relief valve at 35 bar for overpressure protection, analog pressure gauges (P1: 0–60 bar), needle valves for fine flow rate and pressure adjustment, and check valves for backflow prevention. Following the pressure regulation, CO2 is directed through a 12 m stainless steel condensing coil inside a temperature-controlled refrigeration unit with adjustable sub-zero operating temperatures from −15 °C to −25 °C, enabling controlled cooling before measurement. A second analog pressure gauge (P2) provides real-time monitoring of the system conditions. The calculated pressure drop along the circuit is maintained below 1 bar, ensuring pressure stability during the measurements [30].
The ultrasonic test section follows a plug-and-play design integrated into a separate pipeline branch with the bases, requiring no modifications to the main refrigerant transport system. The measurement section is equipped with an additional pressure gauge (P3) and a safety relief valve at 40 bar for monitoring and safe operation. The circuit represents a closed, well-instrumented CO2 handling system incorporating multiple pressure control points, safety protection, and multi-point measurement capability under low-temperature conditions.
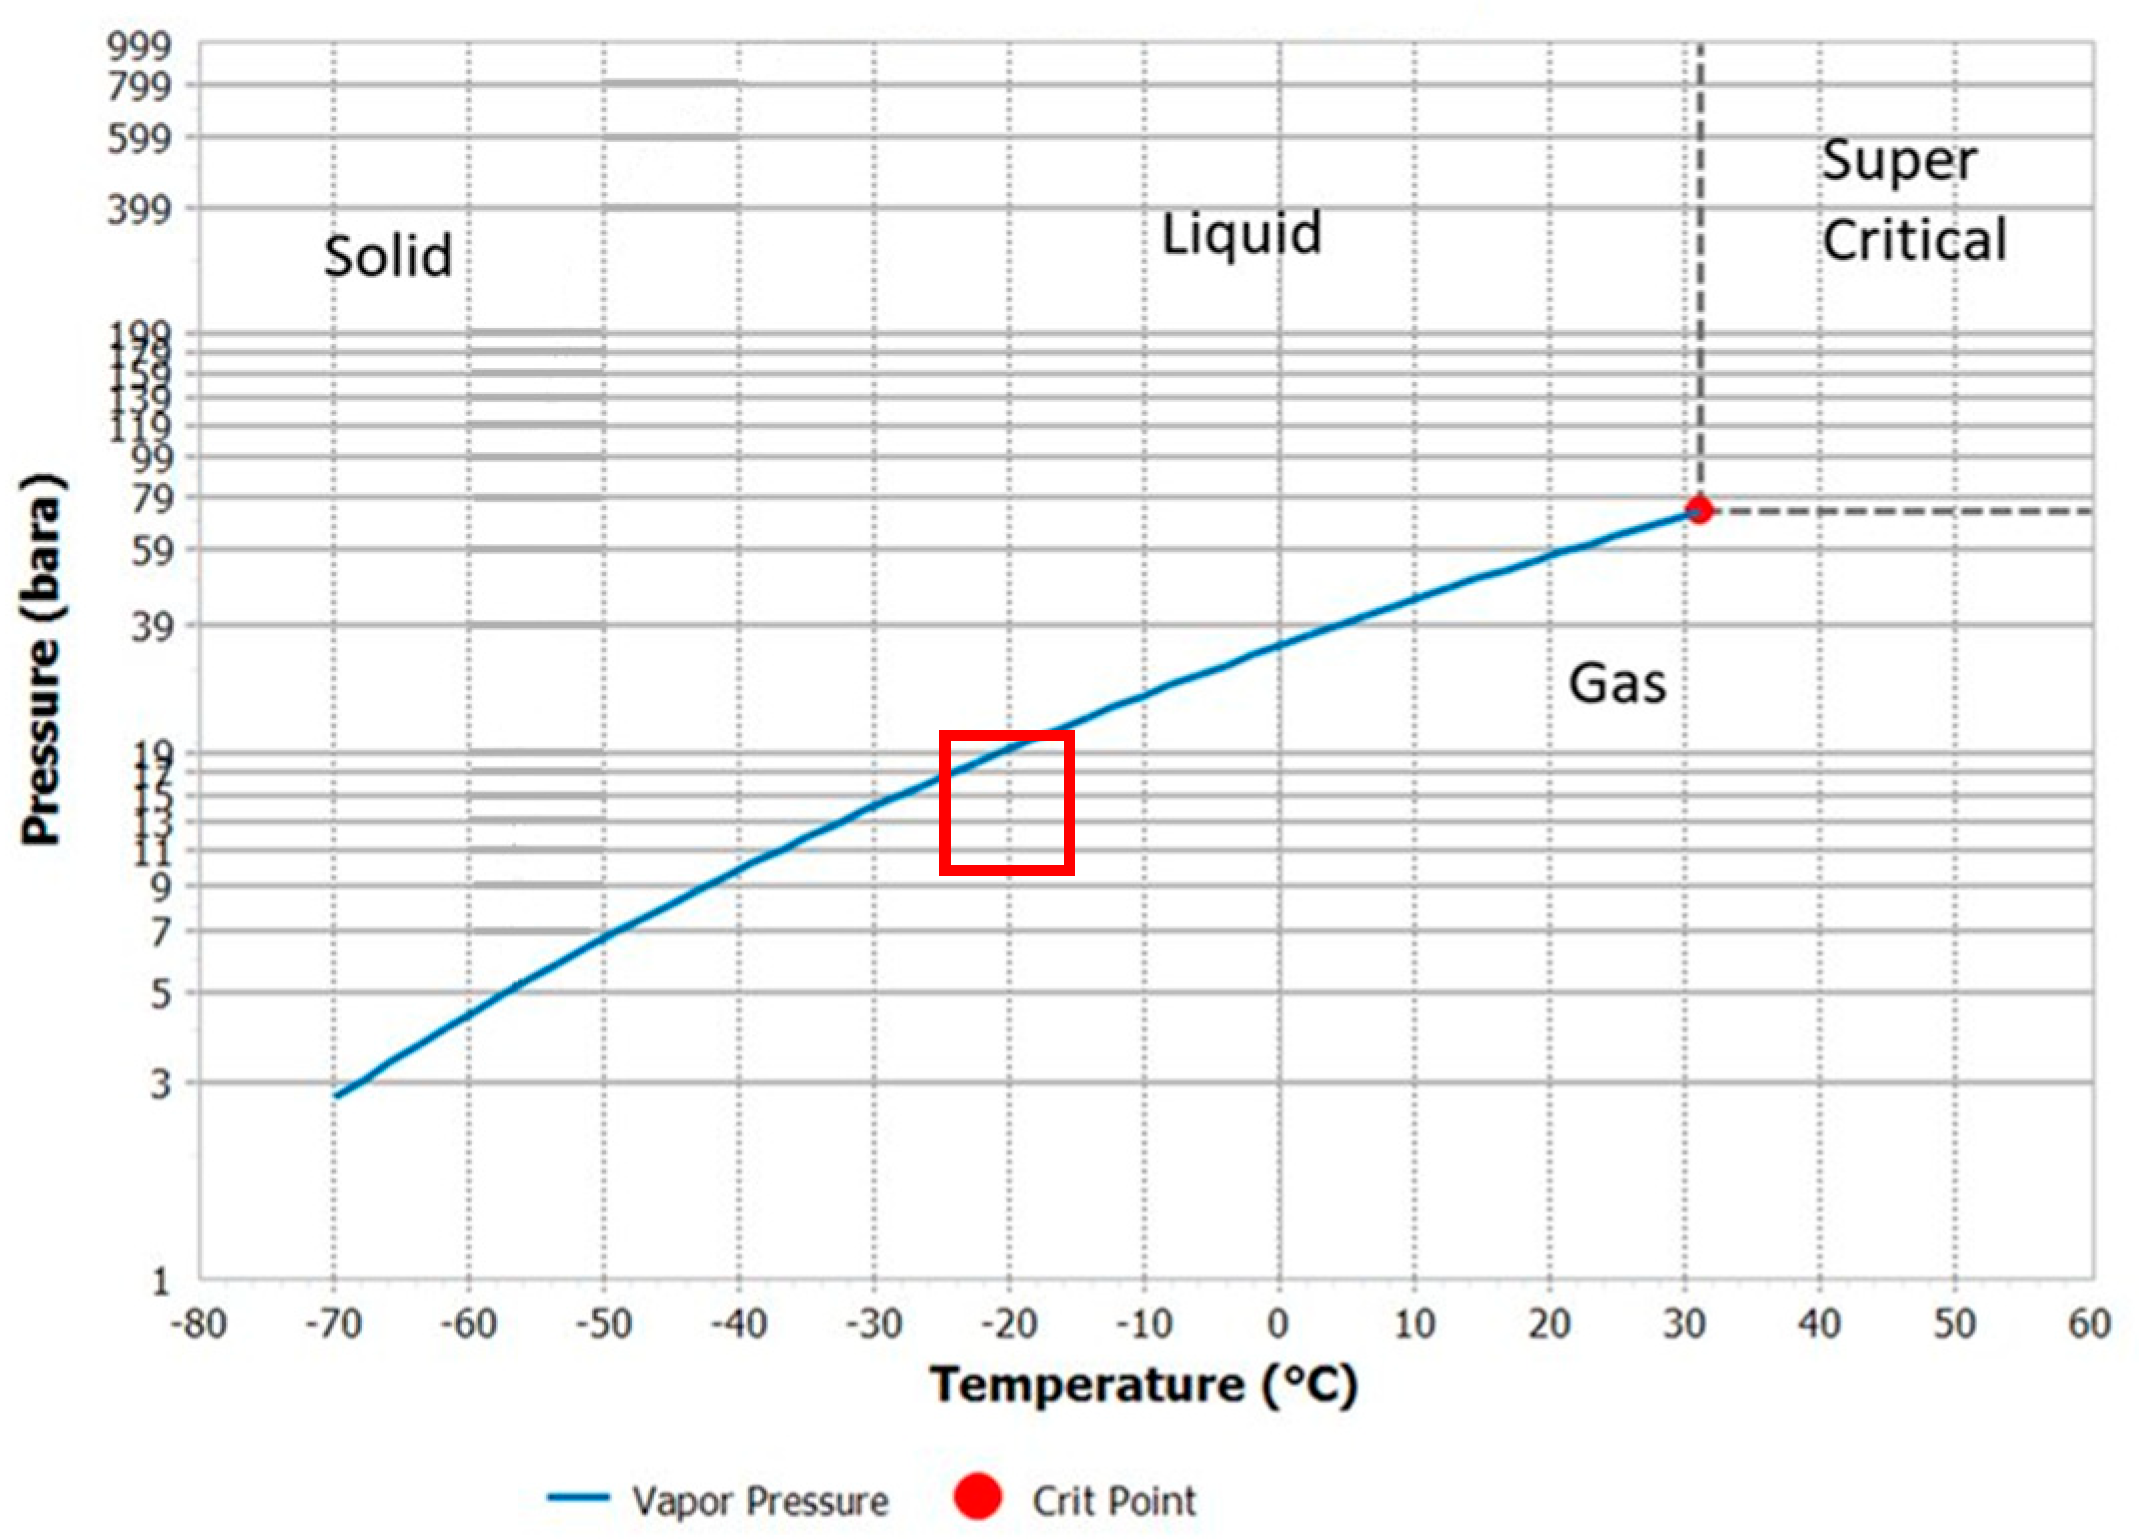
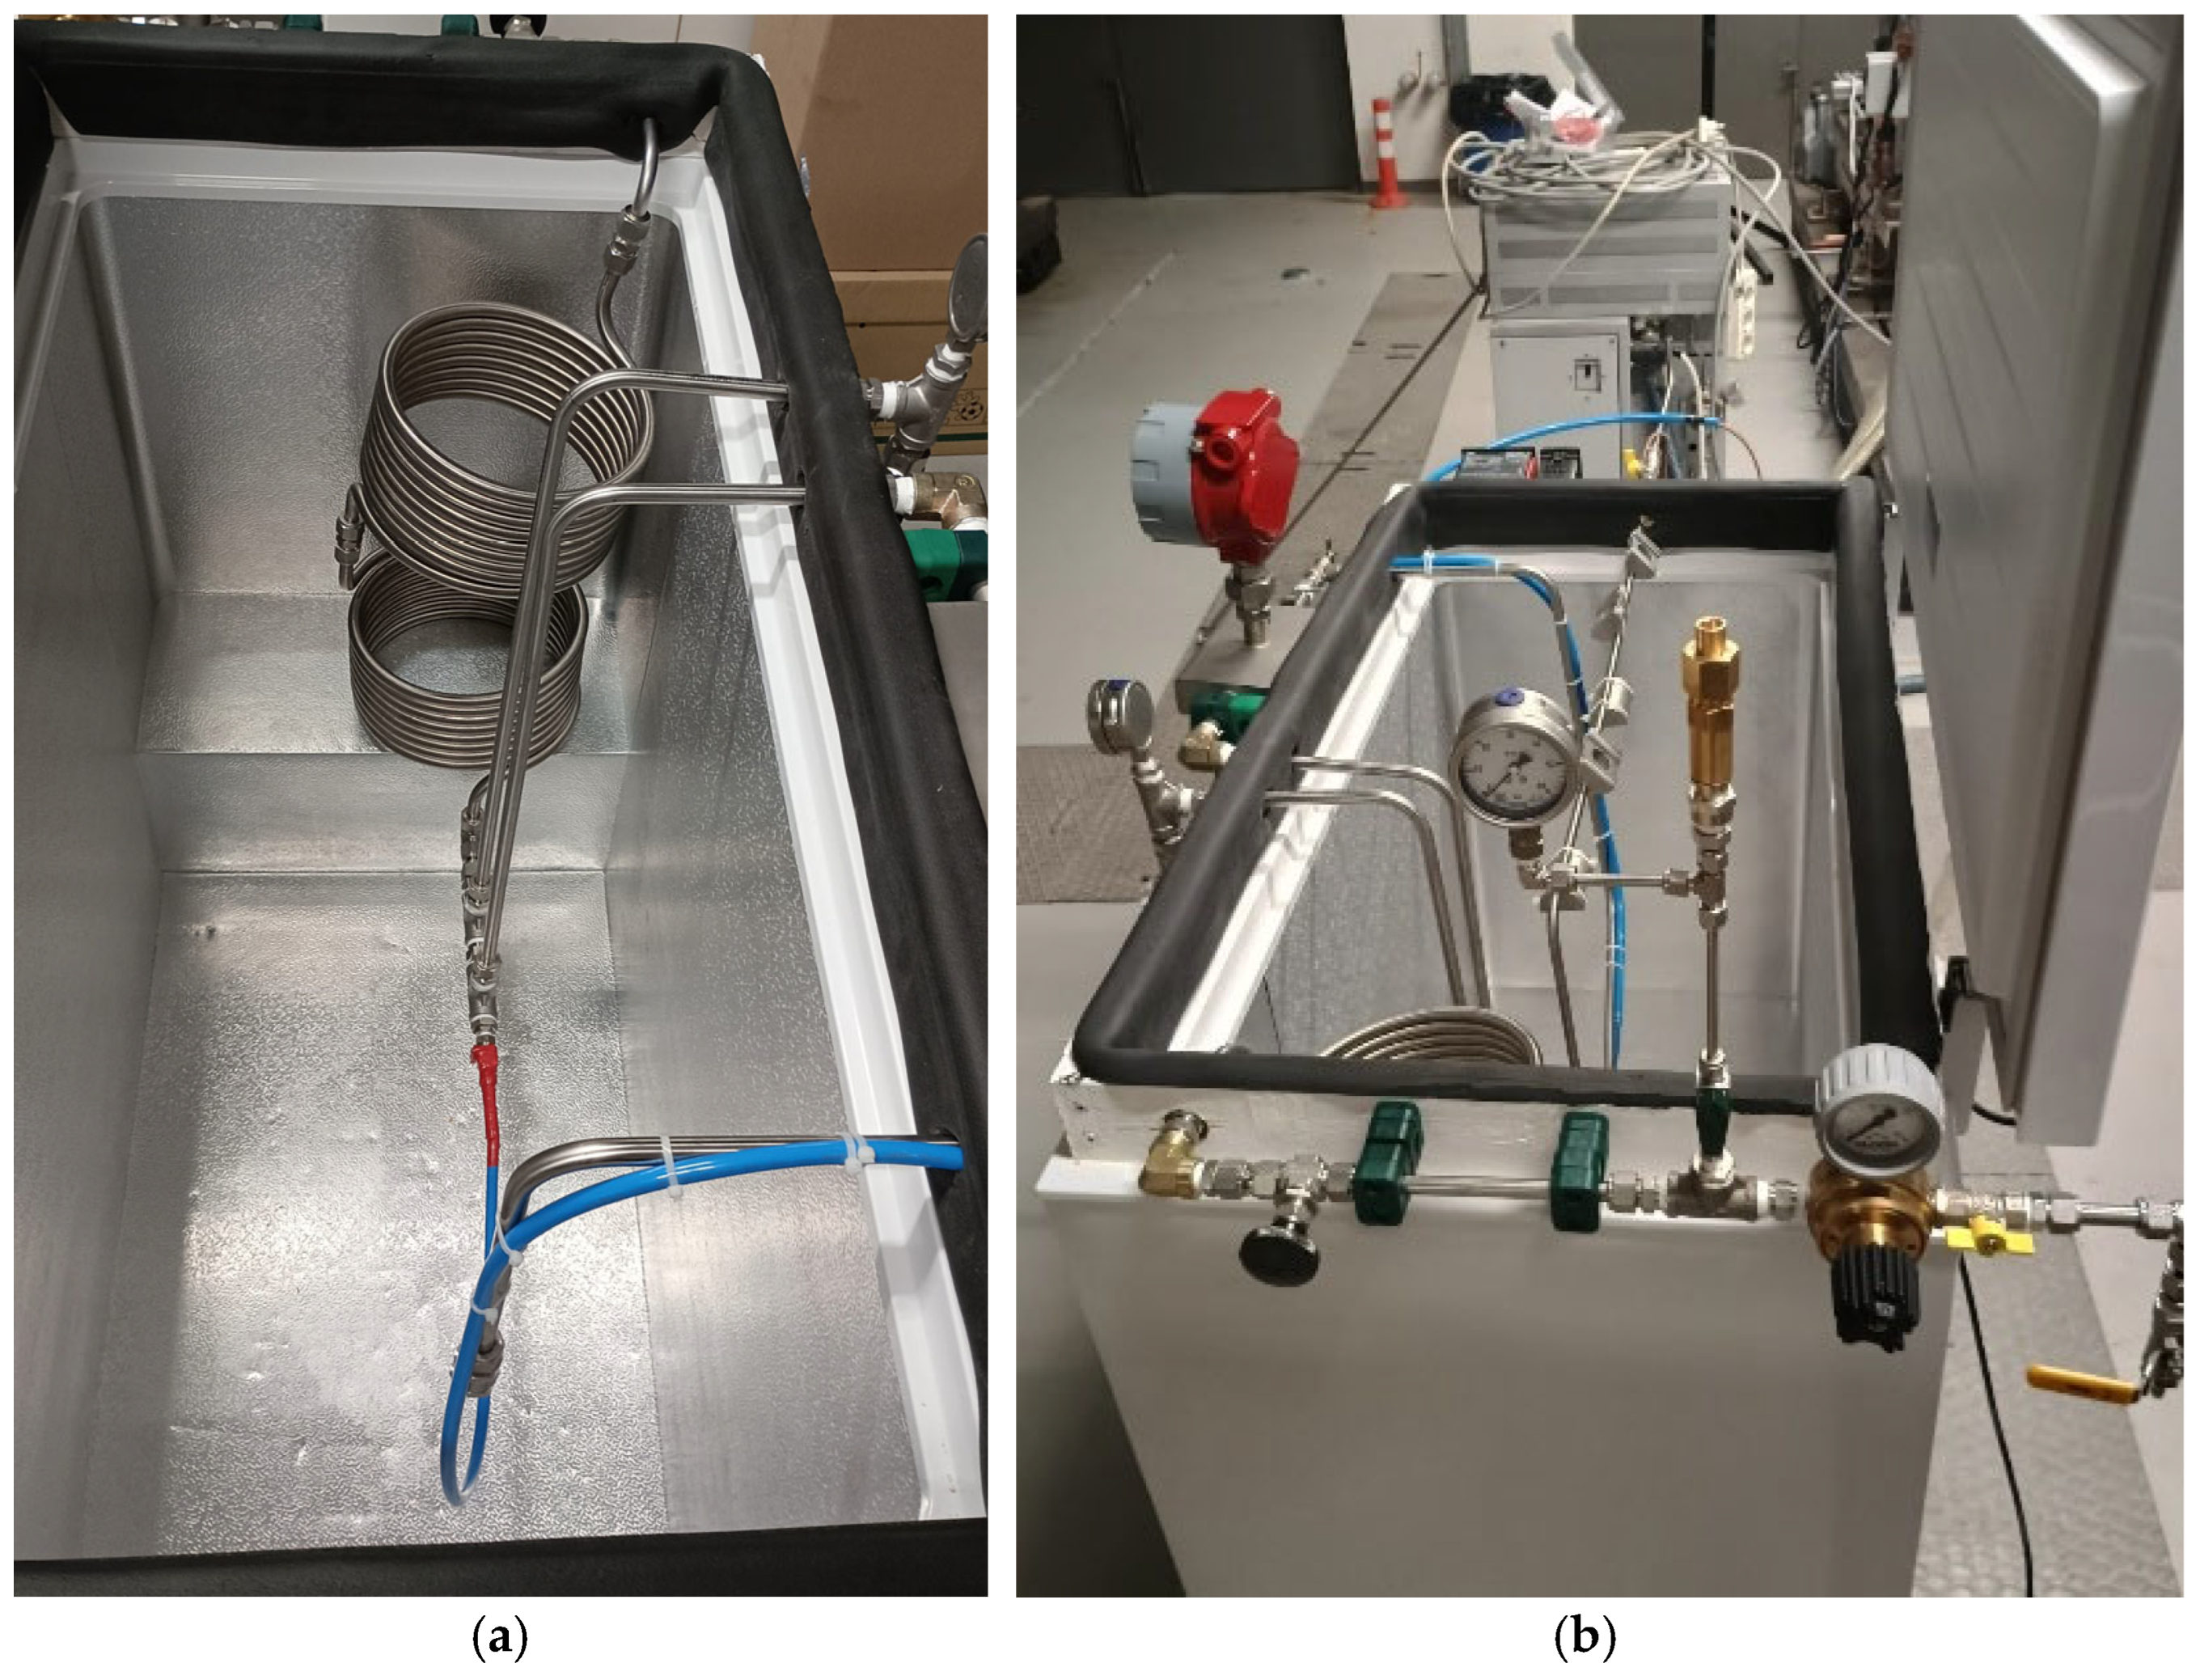
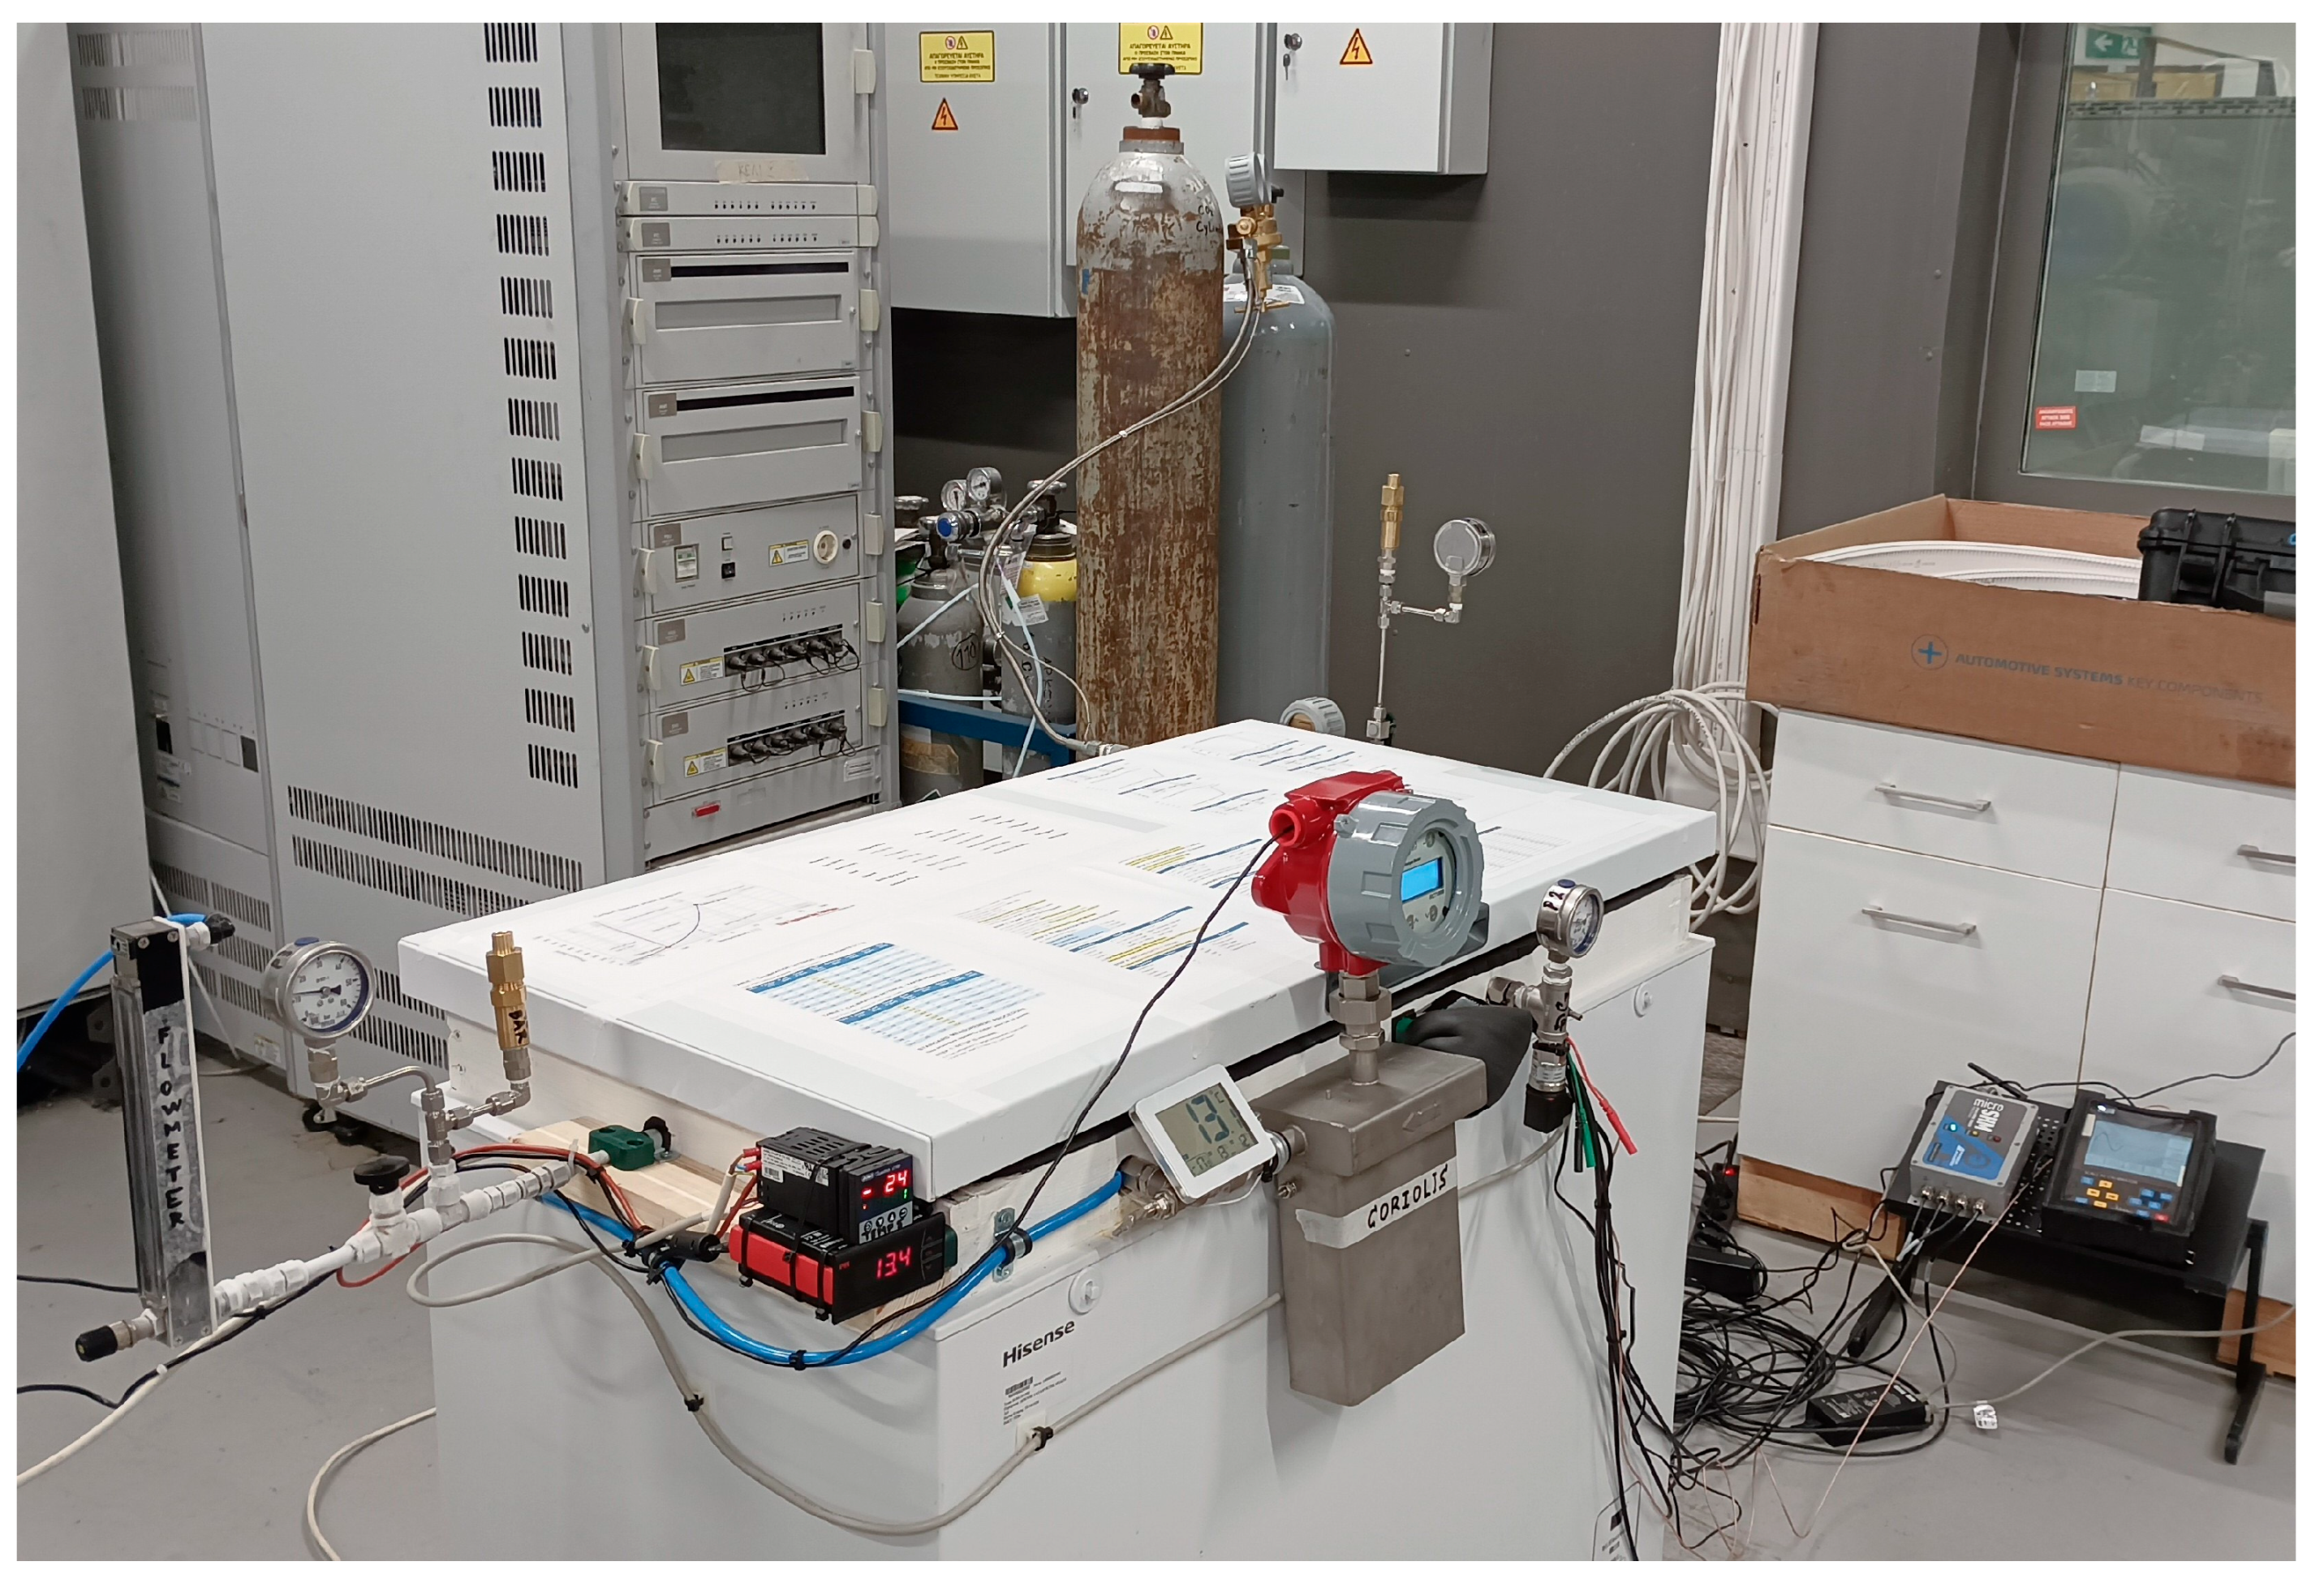
In Figure 3, the CO2 phase diagram identifies regions corresponding to gaseous, liquid, and supercritical states, as well as the saturation area around the curve. The rectangular box corresponds to the measurement area, which concerns mainly the gaseous and saturated region between the gas and liquid phases. In this region, the density changes rapidly, and the transition from one phase to another is highly non-linear. When CO2 flow enters the saturation phase, it consists of a mixture of liquid and vapor. Under such conditions, a well-defined density may be replaced by an apparent density, and the flow measurement becomes more complex due to the phase slip and variations in vapor quality. The operating area is at the edge of the phase-change curve, where thermophysical properties are highly sensitive to small variations in pressure and temperature. Figure 4 and Figure 5 illustrate the modified refrigerator unit with the CO2 supply, including the 12 m condensing coil. The flow circuit is equipped with an inline pressure regulator, safety and isolation valves, and pressure gauges. The ultrasonic sensors are attached directly to the pipeline with the appropriate clamping fitting and are covered in silicone tape for low-temperature protection, as shown in Figure 6.
The experiments combined states of temperature and pressure to output the CO2 flow rate, density, and quality. Sinusoidal waves at 100, 150, and 200 kHz are considered appropriate as they provide a good balance between penetration depth and sensitivity to phase interfaces. Data were collected across pressure levels from 10 to 20 bar and 1 °C increments from −15 °C to −25 °C, as seen in Table 1. Measurements were concentrated around the saturation region and primarily within the gaseous phase. For each state, five 6 s recordings were taken to extract raw waveform files.

3. Refrigerant Calibration and System Validation

3.1. Calibration Procedure

The CO2 two-phase flow calibration procedure is essential to obtain reference measurements for states in the saturation area, at points corresponding to 1 °C increments across the temperature range. The Coriolis meter serves as the reference instrument for accurate indications of mass flow rate and density at each operating state. This way, the sensing system becomes a quality meter that can determine the gas percentage in mixed flows.
The mixture’s quality x = m v a p m is obtained from its average specific volume υ = V m = V l i q m + V v a p m [31] (Equation 3.2, p. 108), where V = V l i q + V v a p and υ = 1 ρ , with ρ the density. Since the liquid phase is a saturated liquid and the vapor phase is a saturated vapor:
V l i q = m l i q υ f
V v a p = m v a p υ g
and noting that m l i q m = 1 x , the above expression becomes:
υ = ( 1 x ) υ f + x υ g = υ f + x ( υ g υ f )
Therefore, the quality in terms of density is given as
x = 1 ρ m e a s 1 ρ l i q 1 ρ v a p 1 ρ l i q
where ρ m e a s is the obtained Coriolis-referenced density for each state, while ρ l i q and ρ v a p result from the quadratic regression fits.
Ideally, in the pure liquid phase, the quality approaches 0, while for pure vapor, it tends to 1. As it is an experimental circuit for the heat pumps’ refrigerant flow simulation, the ideal density values for the two phases cannot be achieved. To ensure the ultrasonic sensing system is validated within its actual operational domain, the temperature-density calibration curves are derived from the measured densities to reflect the true system response across the thermodynamic states in the two-phase experimental envelope.
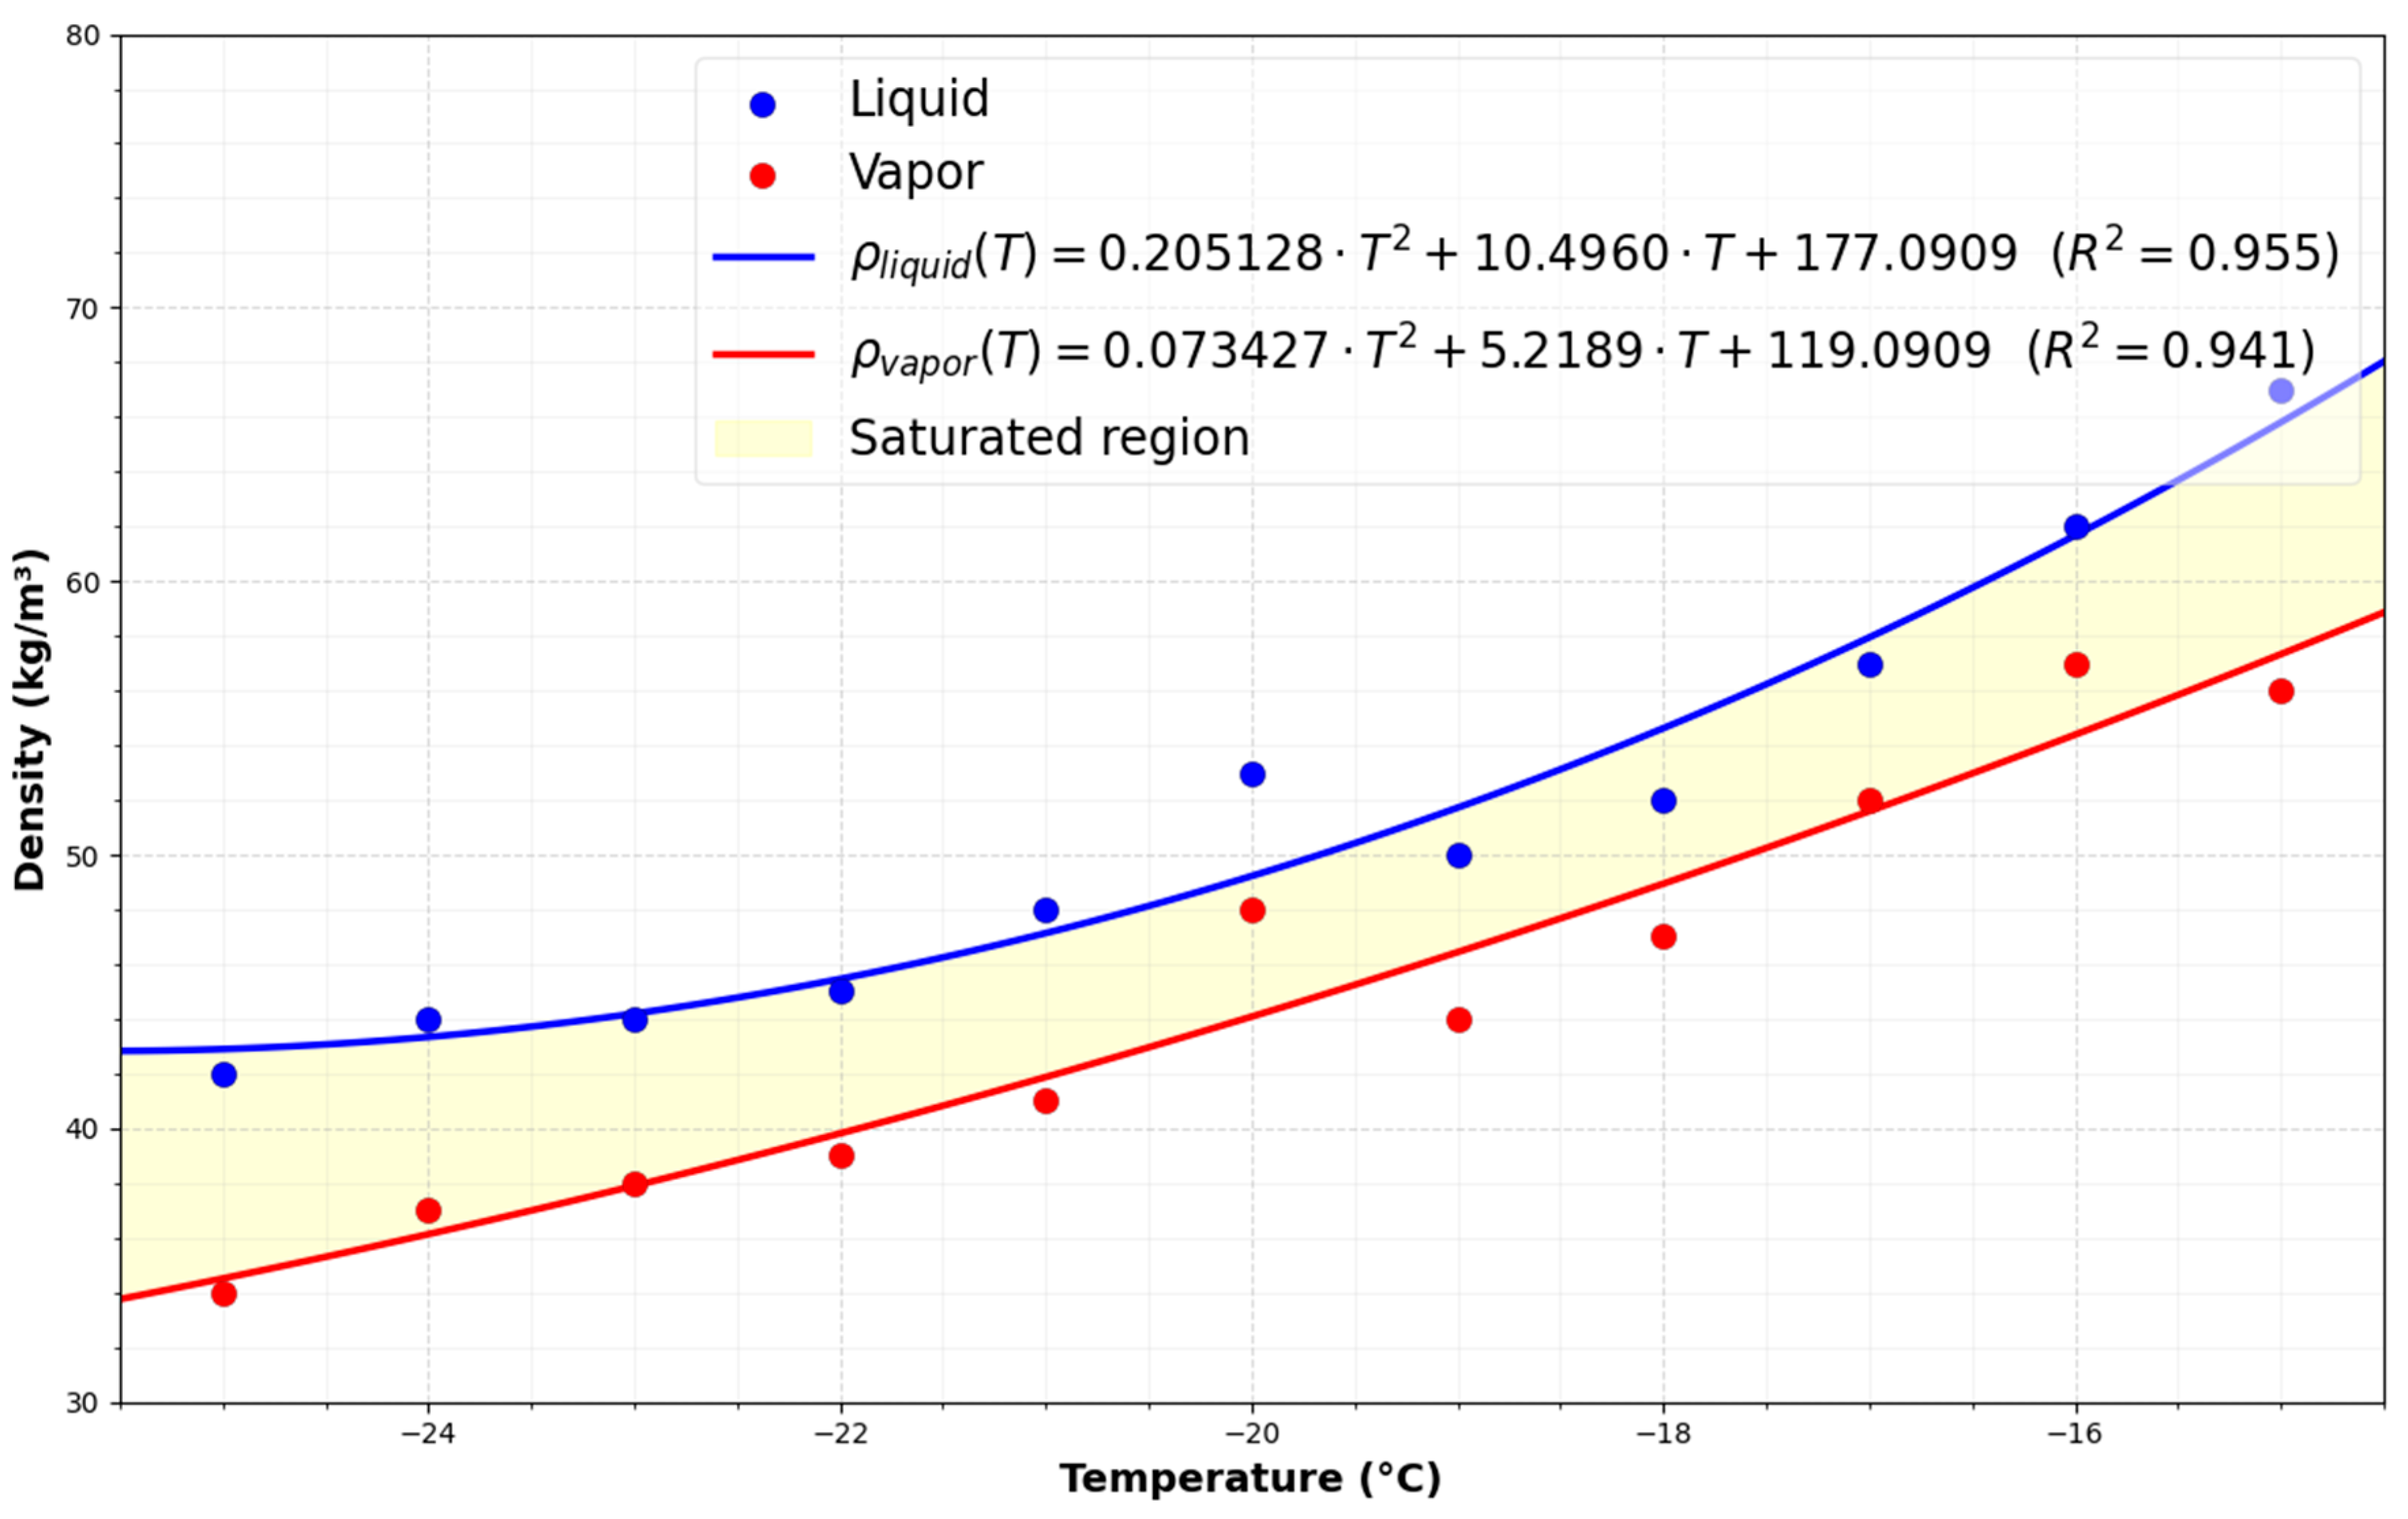
For liquid points, the refrigerant is regulated at a subcooled state with the pressure target set to be 2 bar above the saturation pressure at each temperature, while for vapor points, it is set approximately 0.5 bar below the saturation pressure. The primary needle valve is slowly opened to reach the target pressure, and in parallel, the system’s terminal needle valve adjusts the desired back pressure accordingly. For each temperature step in the range of −25 °C to −15 °C, the corresponding densities were recorded for the targeted saturated pressure at both states, which are essentially the values of the saturated region limits. Second-order polynomial fits were then extracted to represent the calibration curves of the two phases, as depicted in Figure 7, with the coefficients of determination R2 = 0.955 and R2 = 0.941, respectively, to indicate a good fit to the reference data across the tested range. At each stage, at least 20–30’ waiting time is required for the system to stabilize.
For each excitation frequency, 36 operating states are measured with five repeated 6 s recordings, giving 540 multi-channel recordings. The reference-measured densities are in the range 30–60 k g / m 3 , as shown in Table 2, and the quality of the mixture is calculated via Equation (4) for each state. The density values deviate considerably from the nominal single-phase benchmarks that are typically employed for quality assurance in refrigerant flow systems. In those benchmarks, pure liquid CO2 densities are met in values higher than 100   k g / m 3 , while pure vapor densities are expected to be less than 70   k g / m 3 [32]. These deviations are attributed to a combination of thermophysical and experimental factors. The phase transition between the two states is rapid and through the saturation phase. At this intermediate phase, the gas proportion is higher than the liquid because the test section employs a small-diameter pipeline operating at low-mass flow rates of around 10   k g / h .
At the operating temperatures with moderate pressures, the CO2 thermodynamic state is in the proximity of, marginally, around the saturation zone. In this area, even the slightest thermal or pressure changes are capable of initiating a partial vaporization or liquefaction. It should be noted that at these saturated conditions, CO2 exhibits a comparatively small density differential, e.g., ρ l i q 49.2   k g / m 3 and ρ v a p 44.1   k g / m 3 at −20 °C. By contrast, in conventional refrigerants the liquid-vapor density gap is substantially wider, and the phase transition is more distinct. The experimental states are given in Table 2 with the measured and extracted quantities. The extracted quality values lie mostly in the vapor range (x ≈ 0.70–0.99), which is physically consistent with the predominantly gaseous and near-saturation states tested. At each fixed temperature, quality decreases as the pressure increases and the measured density approaches the liquid region.

3.2. ML-Based Validation

As part of this project, the operability of the ultrasonic system beyond the calibration procedure was verified. The acquired ultrasonic waveforms were processed into Continuous Wavelet Transform (CWT) scalograms. These, along with temperature and pressure readings, were utilized to train regression models against the labels from the Coriolis reference flowmeter via a multi-channel scalogram fusion methodology [33]. The scalograms for each PZT receiving channel were depth-stacked as separate image layers along with additional temperature and pressure layers. These formed the multi-channel inputs to the regression models for the three outputs. The schematic of the signal-processing and ML workflow is shown in Figure 8.
Regression architectures were evaluated on the same scalogram inputs, such as a Support Vector Regressor (SVR) and a convolutional neural network (CNN) regression model. The 540 recordings were pooled and randomly shuffled into training, validation, and test subsets in a 70/20/10 ratio, with each recording assigned to a single subset. The validation subset was used during model development, and all reported values come from the test subset. The best-performing configuration, an SVR-based approach, achieved an overall coefficient of determination, R2 = 0.956, across the three predicted outputs, against R2 = 0.900 for the best convolutional benchmark, ResNet-50, measured on the same test subset. The per-target prediction of the best-performing model reached 0.997 for mixture density, 0.971 for vapor quality, and 0.901 for mass flow rate. The deep CNNs did not surpass the SVR due to the limited number of operating states, so the dataset could not train large neural networks. Simpler models performed better, as they generalize more reliably with limited data.
This work confirmed that the waveforms from the non-invasive ultrasonic measurements carry sufficient physical information to characterize the CO2 flow state. The multi-channel representation preserves both the sensor and thermodynamic contexts, enabling the model to learn patterns that are tied to the physics of acoustic propagation. Therefore, this methodology turns the sensing system into a scalable ML-based metering tool for industrial multiphase flow.

3.3. Uncertainty Analysis

The labels used for calibration and training are bounded by the accuracy of the reference instrumentation. For the Badger Meter RCT1000 Coriolis flowmeter with the RCS018 sensor, the manufacturer specifies ±0.2% of reading plus ±0.05% of full scale for the mass flow rate and ±0.002 g·cm−3 for the density [34]. With a full scale of 544 kg/h, the mass flow specification evaluates to 0.29 kg/h at the tested flow rates. This comes from the full-scale contribution of 0.05% of 544 kg/h, or 0.272 kg/h, and the reading contribution at the tested flow rates of about 10 kg/h, giving 0.2%, or 0.02 kg/h. As the circuit operates at a small fraction of the instrument’s range, i.e., ~2%, the full-scale term accounts for over 90% of the resulting value of 0.29 kg/h, which is why it dominates the flow uncertainty rather than the reading term. These specifications refer to single-phase liquid operation; therefore, two-phase flow adds a contribution that the datasheet does not cover. Moreover, the density specification is a fixed value intended for liquid service, which becomes larger at the low mixture densities in the near-saturation region.
The pressure and temperature sensors describe the thermodynamic state but do not affect the labels directly. The Coriolis meter is the main source of uncertainty, as Equation (4) works directly on its density readings. Near saturation, the liquid and vapor calibration curves are close together, with a gap of about 5 kg·m−3 at −20 °C, and the quality is simply where the measured density sits between them, so even a small density error would have a large effect on the quality calculation. However, all three densities are measured from the same flowmeter and at the same temperature steps, shifting together any error, so this sensitivity is mitigated and the ratio barely changes. This bond is intrinsic to CO2 near saturation rather than to the ultrasonic method. Refrigerants with wider phase-density gaps would yield proportionally lower quality uncertainty. The remainder is the small variation from one reading to the next, as taken from the five repeated recordings at each state, and it is this variation that sets the precision of the labels. The latter is therefore constrained by the reference instrument rather than by the ultrasonic measurement.
According to Table 2, the reported coefficients of determination correspond to root-mean-square errors (RMSE) of 0.286 kg/h for the mass flow rate, 0.42 kg·m−3 for the density, and 0.017 for the quality, or 2.9%, 0.9%, and 2.1% of the mean measured value of the respective quantity. The mass flow error is of the same size as the uncertainty of the labeled Coriolis readings, so the prediction is limited by the instrument’s accuracy. These target results follow the physical sensitivity of the acoustic signal, since the density governs propagation and attenuation and the phase composition dominates scattering. Lastly, as the quality is derived from the density, the targets are not statistically independent, and the R2 values express accuracy over the discrete set of tested states rather than a continuous operating range.

4. Discussion

A new ultrasonic sensing system for real-time CO2 two-phase flow characterization in heat pumps has been developed and validated with a representative ML-based result through controlled laboratory experiments. Ultrasonic transducers are utilized to capture the acoustic patterns from refrigerant mixtures through propagating ultrasonic waves. The primary aim was to develop a practical and affordable measurement system capable of accurately predicting the mass flow rate, mixture density, and vapor quality. The system operates in a plug-and-play configuration over commercial thermodynamic circuits, requiring no modifications to the main refrigerant pipeline, and is designed with inherent scalability, as the measurement section can be extended with additional ultrasonic transducers.
The system demonstrated robustness under demanding conditions, operating reliably at temperatures down to −25 °C within the CO2 saturation region, where thermophysical properties are highly sensitive to small variations in pressure and temperature. It should be noted that CO2 was employed as a safe, non-flammable surrogate for propane, which is the actual heat pump refrigerant.
A structured calibration methodology was developed using a Coriolis flowmeter for ground-truth labeled data space across the thermodynamic envelope of the saturation region. The calibration procedure is the most demanding phase, as it requires systematic coverage of the full operating thermodynamic envelope. The measurements were conducted across many temperature and pressure levels. Each state required a waiting time for stabilization before data acquisition due to the inherent tendency of CO2 to undergo rapid phase transitions near the saturation zone. The narrow density differential between the two phases at these conditions demands precise pressure regulation and stable thermal control to achieve reproducible readings from the reference flowmeter. Despite these challenges, the calibration campaign is performed only once per refrigerant medium. Once completed, the trained models can be applied to the same installation using only the ultrasonic, temperature, and pressure sensors for inference, without further involvement of reference instruments.
The physical installation of the proposed ultrasonic sensing system is designed for plug-and-play deployment, with the clamp-on transducer assembly requiring no pipeline modifications, as has been demonstrated on the experimental CO2 circuit. The calibration on a reference medium and transfer with ML-trained models to operational heat pump installations is proposed as the intended deployment concept. Once calibrated for a given refrigerant and pipe configuration, the system is intended to operate with only the clamp-on transducers and temperature and pressure sensors. Extending the trained models to a different installation or refrigerant was outside the scope of this study and remains to be validated. In the inference mode with scalable ML regressors, the system is intended to operate independently from the heat pump without any circuit interference.
It should be noted that the received ultrasonic waveforms also depend on the installation, not only on the refrigerant. The pipe diameter, the wall material and thickness, the way the transducers are coupled, and their position all affect the recorded signal. A model trained on one circuit would see different waveforms on another, even at the same thermodynamic states, and its predictions would drift accordingly. Transfer to a new installation will thus require either a closely matched circuit or a set of measured reference operating points to adapt the model. This requirement is not assumed to be negligible and will be quantified in future installation trials.
The present experimental work is bounded by the temperature and pressure range, CO2 as the working medium, and the low mass flow rates. Conditions outside these ranges require a dedicated recalibration campaign. Also, the narrow liquid–vapor density differential of CO2 under the tested conditions limits the vapor quality resolution compared to conventional refrigerants with wider phase density gaps. Experimental validation across different refrigerant media constitutes future work, as well as the system’s validation as a self-diagnostic tool under various out-of-envelope conditions.
Moreover, a potential deployment strategy for the diagnostics in an operational heat pump is a two-point placement with sensors at both the evaporator and condenser sides to enable independent flow properties estimation at each location. This may support superheat detection and regulation on the evaporator and subcooling control on the condenser side. Any discrepancies between the two flow readings could reveal charge-related faults, which are otherwise invisible from a single location. Combining both readings with the local thermodynamic state could further enable a real-time COP estimation. Such diagnostics are important to building energy management systems that seek to optimize HVAC performance through reduced energy consumption.

5. Conclusions

This work presents an innovative solution that utilizes simple ultrasonic equipment. It is an important step towards intelligent and cost-effective refrigerant monitoring in next-generation heat pumps for energy-efficient buildings. The sensing system for CO2 two-phase flow characterization achieves an overall R2 of 0.956 for the mass flow rate, mixture density, and vapor quality prediction, operating reliably down to very low temperatures. The proposed method enables the use of the same hardware platform for various refrigerants and installations, as each new medium only needs its specific calibration campaign without additional hardware modifications.
The modular architecture extends the capabilities of the sensing system to support new operating ranges, diagnostic features, and control integrations in the future. Based on this system’s scalability and easy deployment nature, it can be used over large thermodynamic circuits. Such ultrasonic sensor arrays can be industrially deployed in dominant thermodynamic circuits, like oil and gas pipelines for multiphase flow metering and leak detection. Within the building sector, the same sensing framework can support energy management systems and smart HVAC networks. A common sensing framework is adapted to each circuit’s conditions, based on simple ultrasonic measurements.

Author Contributions

Conceptualization, T.T. and M.G.; methodology, M.G. and T.T.; software, T.T.; validation, M.G. and T.T.; formal analysis, T.T. and M.G.; investigation, M.G.; resources, V.K.; data curation, M.G.; writing—original draft preparation, M.G.; writing—review and editing, M.G., T.T. and V.K.; visualization, M.G.; supervision, V.K.; project administration, V.K.; funding acquisition, V.K. All authors have read and agreed to the published version of the manuscript.

Funding

This research was funded by the European Union under the Horizon Europe research and innovation programme, project Smart-Pumps (“Sustainable Multi-Functional and Recyclable Heat Pumps”), grant agreement No. 101147440.

Institutional Review Board Statement

Not applicable.

Informed Consent Statement

Not applicable.

Data Availability Statement

The data generated during this study are not currently publicly available due to ongoing exploitation activities within the Smart-Pumps project and are expected to be made available upon its completion and in accordance with the Data Management Plan. Derived calibration data supporting the findings of this study are included within the article. Until then, access to the raw dataset may be considered upon request to the corresponding author, subject to a consortium agreement.

Conflicts of Interest

The authors declare no conflicts of interest.

Abbreviations

The following abbreviations are used in this manuscript:
AEAcoustic emission
CNNConvolutional neural network
CWTContinuous Wavelet Transform
COPCoefficient of performance
MLMachine learning
NNNeural network
PZTPiezoelectric transducer
RMSERoot Mean Square Error
SVRSupport Vector Regressor
TOFTime-of-flight
UTUltrasonic testing

References

  1. Morala, E.C.; Chang, J.S. Measurement of Interfacial Area and Geometry in Gas-Liquid Two-Phase Flow by an Ultrasonic Pulse Echo Technique. In Physicochemical Hydrodynamics; NATO ASI Series; Springer: Boston, MA, USA, 1988; Volume 174. [Google Scholar] [CrossRef] [Scilit]
  2. Bates, R.; Battistin, M.; Berry, S.; Bitadze, A.; Bonneau, P.; Bousson, N.; Boyd, G.; Bozza, G.; Crespo-Lopez, O.; Da Riva, E.; et al. Implementation of Ultrasonic Sensing for High Resolution Measurement of Binary Gas Mixture Fractions. Sensors 2014, 14, 11260–11276. [Google Scholar] [CrossRef] [Scilit] [PubMed]
  3. Xing, L.; Hua, C.; Zhu, H.; Drahm, W. Flow Measurement Model of Ultrasonic Flowmeter for Gas–Liquid Two-Phase Stratified and Annular Flows. Adv. Mech. Eng. 2014, 6, 144–151. [Google Scholar] [CrossRef] [Scilit]
  4. Al-lababidi, S.; Addali, A.; Yeung, H.; Mba, D.; Khan, F. Gas Void Fraction Measurement in Two-Phase Gas/Liquid Slug Flow Using Acoustic Emission Technology. J. Vib. Acoust. 2009, 131, 064501. [Google Scholar] [CrossRef] [Scilit]
  5. Ren, W.; Zhao, A.; Jin, N. Void Fraction Measurement of Oil–Gas–Water Three-Phase Flow Using Mutually Perpendicular Ultrasonic Sensor. Sensors 2020, 20, 481. [Google Scholar] [CrossRef] [Scilit] [PubMed]
  6. Arellano, P.Y.; Mollo, N.; Løvseth, S.W.; Stang, H.G.J.; Bottino, G. Characterization of an Ultrasonic Flowmeter for Liquid and Dense Phase Carbon Dioxide Under Static Conditions. IEEE Sens. J. 2022, 22, 14601–14609. [Google Scholar] [CrossRef] [Scilit]
  7. Afandi, A.; Khasani; Deendarlianto, D.; Catrawedarma, I.G.N.B.; Wijayanta, S. The development of the ultrasonic flowmeter sensors for mass flow rate measurement: A comprehensive review. Flow Meas. Instrum. 2024, 97, 102614. [Google Scholar] [CrossRef] [Scilit]
  8. Tan, C.; Li, X.; Liu, H.; Dong, F. An ultrasonic transmission/reflection tomography system for industrial multiphase flow imaging. IEEE Trans. Ind. Electron. 2019, 66, 9539–9548. [Google Scholar] [CrossRef] [Scilit]
  9. Mostafapour, A.; Davoodi, M. Leakage Locating in Underground High Pressure Gas Pipe by Acoustic Emission Method. J. Nondestruct. Eval. 2013, 32, 113–123. [Google Scholar] [CrossRef] [Scilit]
  10. Adnan, N.F.; Ghazali, M.F.; Amin, M.M.; Hamat, A.M.A. Leak Detection in Gas Pipeline by Acoustic and Signal Processing—A Review. IOP Conf. Ser. Mater. Sci. Eng. 2015, 100, 012013. [Google Scholar] [CrossRef] [Scilit]
  11. Jahanian, M.; Ramezani, A.; Moarefianpour, A.; Aliari, S.M. Gas pipeline leakage detection in the presence of parameter uncertainty using robust extended Kalman filter. Trans. Inst. Meas. Control 2021, 43, 2044–2057. [Google Scholar] [CrossRef] [Scilit]
  12. Zhao, W.; Lou, W.; Xu, Y. Concentration measurement of carbon dioxide based on ultrasonic principle. Meas. Sens. 2021, 15, 100040. [Google Scholar] [CrossRef] [Scilit]
  13. Liang, M.; Yang, K.; Feng, M.; Mu, K.; Jiao, M.; Li, L. Acoustic Imaging Method for Gas Leak Detection and Localization Using Virtual Ultrasonic Sensor Array. Sensors 2024, 24, 1366. [Google Scholar] [CrossRef] [Scilit] [PubMed]
  14. Aprea, C.; Canale, L.; Dell’Isola, M.; Ficco, G.; Frattolillo, A.; Maiorino, A.; Petruzziello, F. On the Use of Ultrasonic Flowmeters for Cooling Energy Metering and Sub-Metering in Direct Expansion Systems. Energies 2023, 16, 4775. [Google Scholar] [CrossRef] [Scilit]
  15. Roxas, R., II; Evangelista, M.A.; Sombillo, J.A.; Nnabuife, S.G.; Pilario, K.E.S. Machine Learning Based Flow Regime Identification using Ultrasonic Doppler Data and Feature Relevance Determination. Digit. Chem. Eng. 2022, 3, 100024. [Google Scholar] [CrossRef] [Scilit]
  16. Abbagoni, B.M.; Yeung, H. Non-invasive classification of gas–liquid two-phase horizontal flow regimes using an ultrasonic Doppler sensor and a neural network. Meas. Sci. Technol. 2016, 27, 084002. [Google Scholar] [CrossRef] [Scilit]
  17. Kuang, B.; Nnabuife, S.G.; Sun, S.; Whidborne, J.F.; Rana, Z.A. Gas-liquid flow regimes identification using non-intrusive Doppler ultrasonic sensor and convolutional recurrent neural networks in an s-shaped riser. Digit. Chem. Eng. 2022, 2, 100012. [Google Scholar] [CrossRef] [Scilit]
  18. Liu, H.; Fan, J.; Lin, X.; Lin, K.; Wang, S.; Liu, S.; Wang, F.; Song, J. Identification of gas-liquid two-phase flow patterns based on flexible ultrasound array and machine learning. npj Flex. Electron. 2024, 8, 67. [Google Scholar] [CrossRef] [Scilit]
  19. Bowler, A.L.; Pound, M.P.; Watson, N.J. A review of ultrasonic sensing and machine learning methods to monitor industrial processes. Ultrasonics 2022, 124, 106776. [Google Scholar] [CrossRef] [Scilit] [PubMed]
  20. Mao, N.; Azman, A.N.; Ding, G.; Jin, Y.; Kang, C.; Kim, H.-B. Black-box real-time identification of sub-regime of gas-liquid flow using Ultrasound Doppler Velocimetry with deep learning. Energy 2022, 239, 122319. [Google Scholar] [CrossRef] [Scilit]
  21. Fang, L.; Zeng, Q.; Wang, F.; Faraj, Y.; Zhao, Y.; Lang, Y.; Wei, Z. Identification of two-phase flow regime using ultrasonic phased array. Flow Meas. Instrum. 2020, 72, 101726. [Google Scholar] [CrossRef] [Scilit]
  22. Zevnik, L.; Babič, M.; Levec, J. Ultrasound speed and absorption study in near-critical CO2: A sensor for high-pressure application. J. Supercrit. Fluids 2006, 36, 245–253. [Google Scholar] [CrossRef] [Scilit]
  23. Lin, C.W.; Trusler, J.P.M. Speed of Sound in (Carbon Dioxide + Propane) and Derived Sound Speed of Pure Carbon Dioxide at Temperatures between (248 and 373) K and at Pressures up to 200 MPa. J. Chem. Eng. Data 2014, 59, 4099–4109. [Google Scholar] [CrossRef] [Scilit]
  24. Guo, Y.; Liu, W.; Xu, Z.; Chen, Y.; Wang, Y.; Du, C. Experimental study on optimizing control strategy of compressor and EEV to improve carbon dioxide heat pump performance. Sustain. Energy Technol. Assess. 2026, 90, 105043. [Google Scholar] [CrossRef] [Scilit]
  25. ASHRAE. ASHRAE Refrigerant Designations; American Society of Heating, Refrigerating and Air-Conditioning Engineers: Atlanta, GA, USA, 2022; Available online: https://www.ashrae.org/technical-resources/standards-and-guidelines/ashrae-refrigerant-designations (accessed on 21 August 2026).
  26. Anwar, S.; Caroll, J.J. Carbon Dioxide Thermodynamic Properties Handbook: Covering Temperatures from −20 to 250 °C and Pressures up to 1000 Bar; John Wiley & Sons: Hoboken, NJ, USA; Scrivener Publishing: Beverly, MA, USA, 2011. [Google Scholar]
  27. Kim, M.H.; Pettersen, J.; Bullard, C.W. Fundamental Process and System Design Issues in CO2 Vapor Compression Systems. Prog. Energy Combust. Sci. 2004, 30, 119–174. [Google Scholar] [CrossRef] [Scilit]
  28. Perry, R.H.; Green, D.W.; Southard, M.Z. Perry’s Chemical Engineers’ Handbook, 9th ed.; McGraw-Hill Education: New York, NY, USA, 2018. [Google Scholar]
  29. Mistras Group Inc. Micro-SHM System User’s Manual; Mistras Group Inc.: Princeton Junction, NJ, USA, 2017. [Google Scholar]
  30. ISO 5167-1:2022; Measurement of Fluid Flow by Means of Pressure Differential Devices Inserted in Circular Cross-Section Conduits Running Full—Part 1: General Principles and Requirements. International Organization for Standardization: Geneva, Switzerland, 2022.
  31. Moran, M.J.; Shapiro, H.N.; Boettner, D.D.; Bailey, M.B. Fundamentals of Engineering Thermodynamics, 8th ed.; John Wiley & Sons: Hoboken, NJ, USA, 2014. [Google Scholar]
  32. The Engineering ToolBox. Carbon Dioxide—Density and Specific Weight vs. Temperature and Pressure. Available online: https://www.engineeringtoolbox.com/carbon-dioxide-density-specific-weight-temperature-pressure-d_2018.html (accessed on 11 February 2026).
  33. Tsenis, T.; Giouvanakis, M.; Kappatos, V. Multi-channel AE scalogram imaging with ML regression for non-invasive refrigerant flow characterization. In Proceedings of the 1st International Online Conference on Non-Destructive Testing, 1–3 July 2026; MDPI: Basel, Switzerland, 2026. [Google Scholar]
  34. Badger Meter, Inc. RCT1000 Coriolis Mass Flow Meter with RCS018–300 Sensors; Product Data Sheet CRL-DS-01572-EN-07; Badger Meter: Milwaukee, WI, USA, 2019. [Google Scholar]
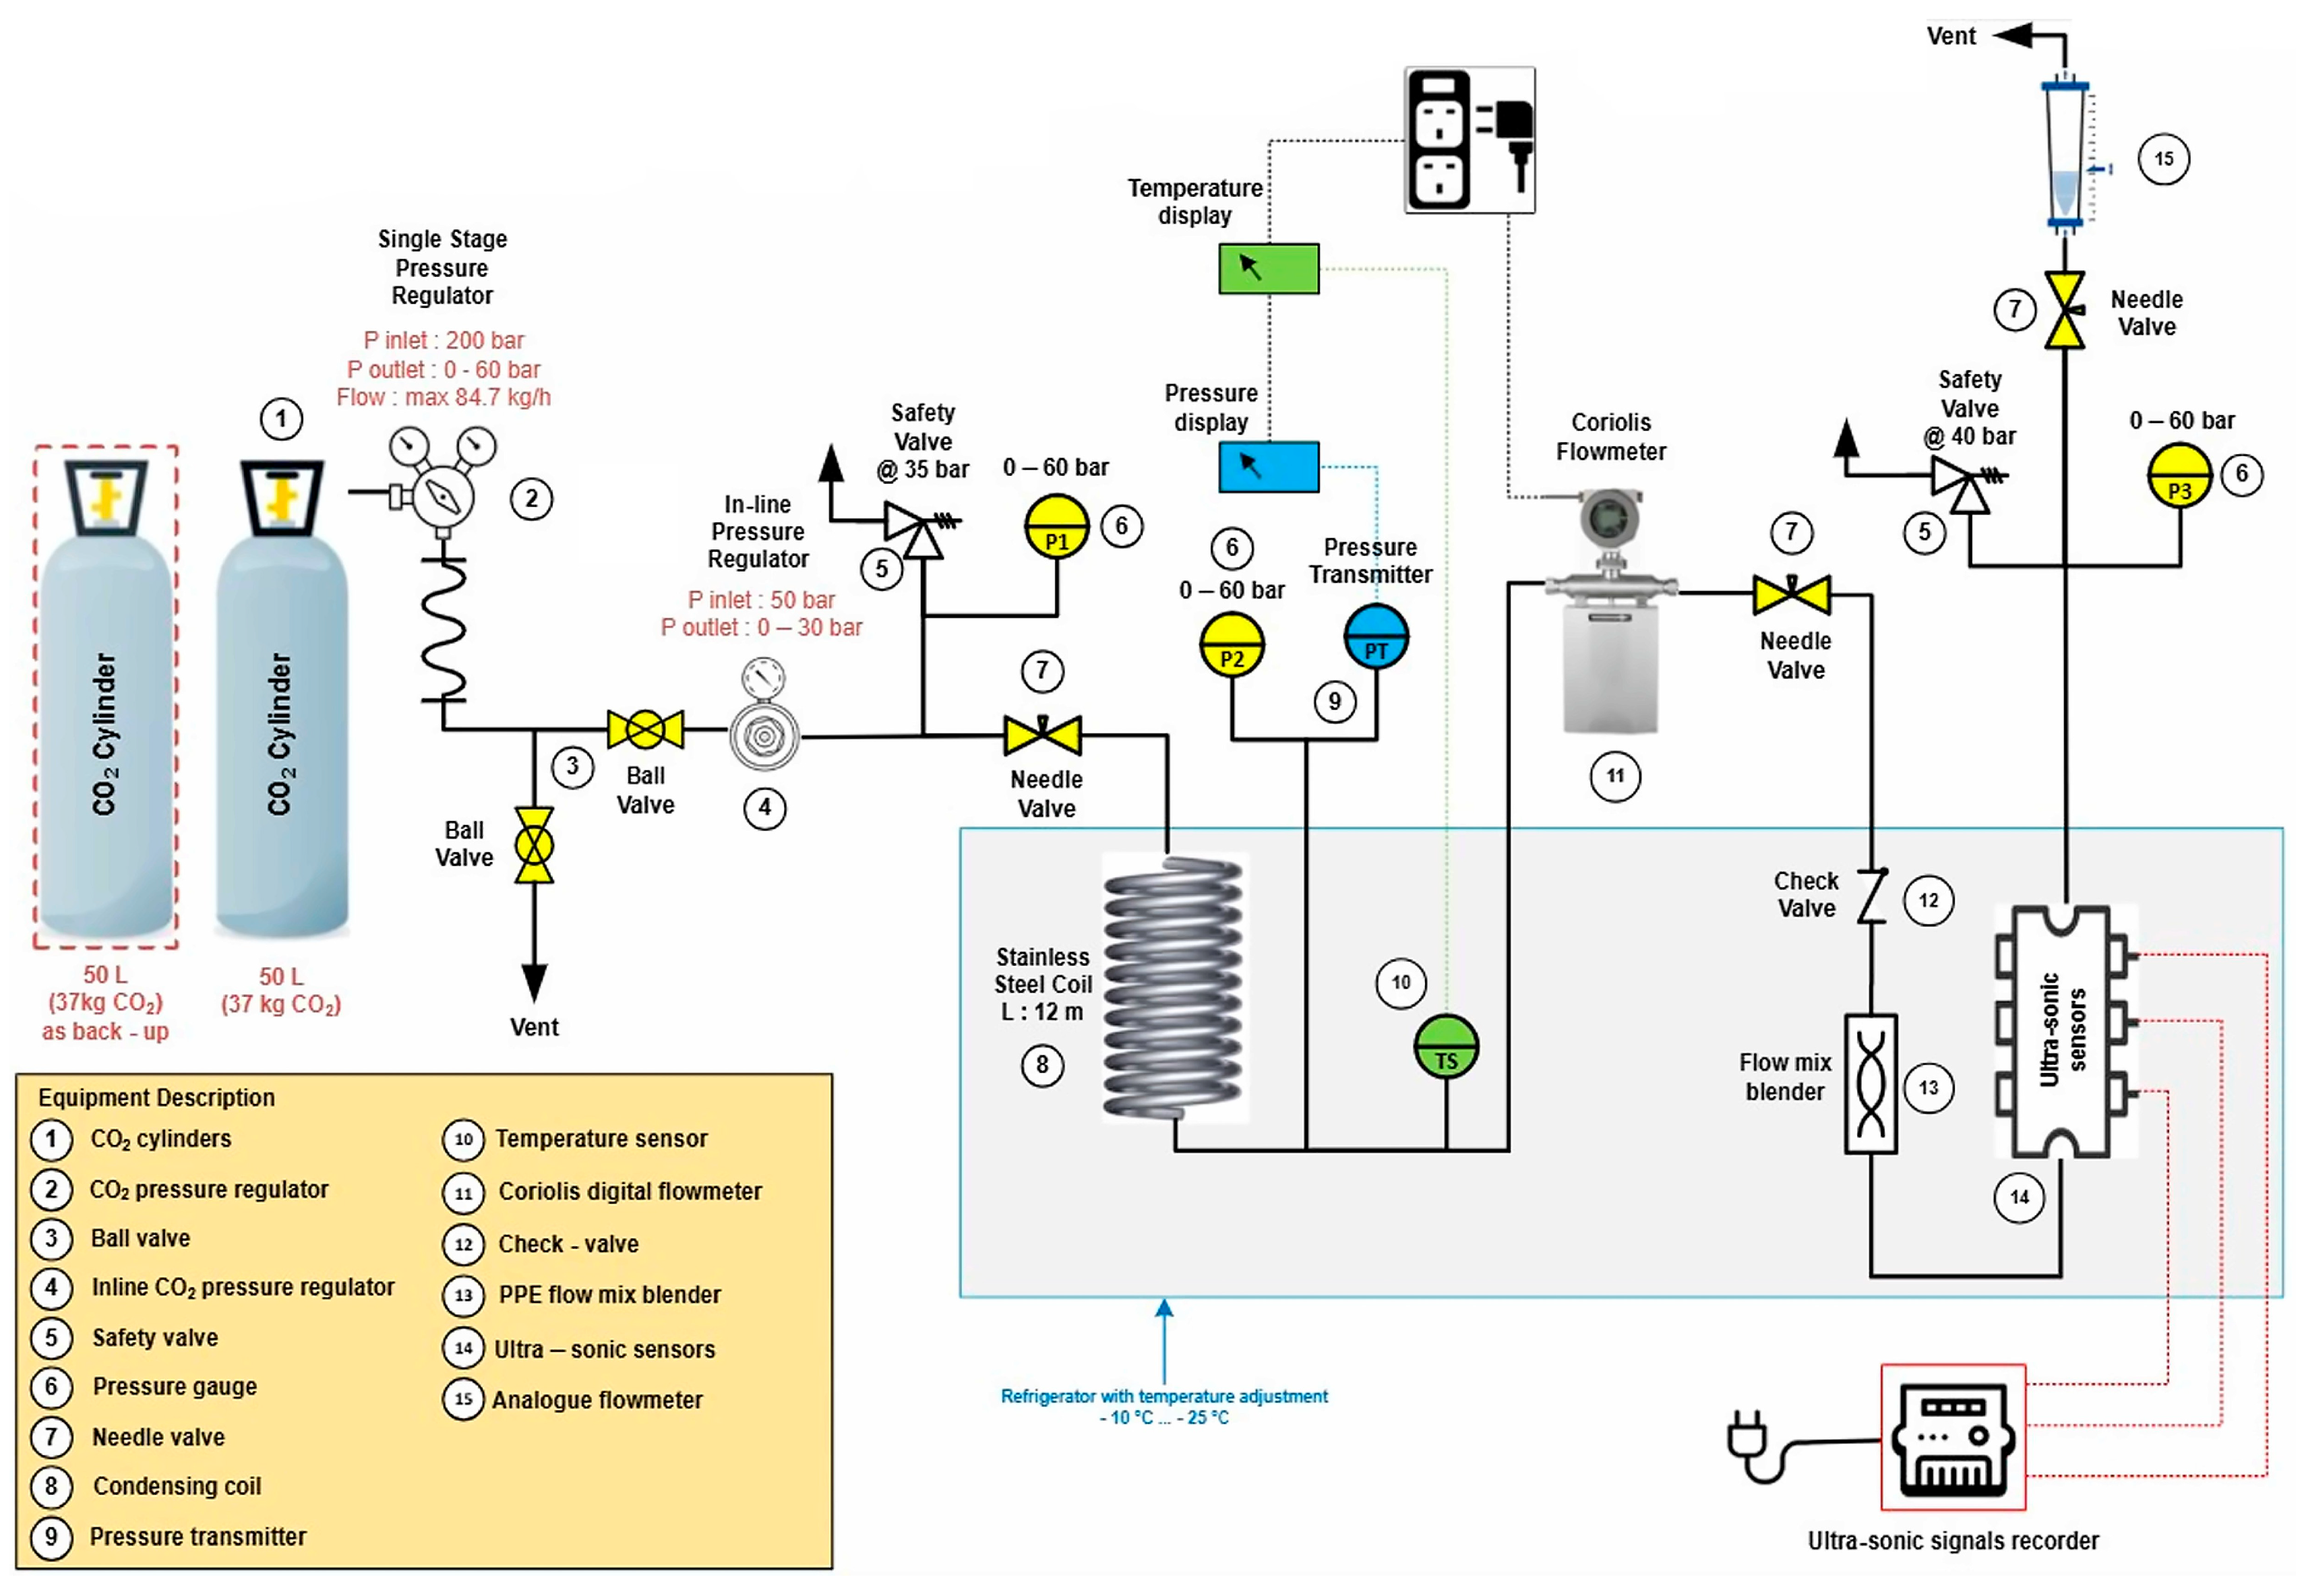
Figure 1. CO2 circuit layout.
Buildings 16 03521 g001
Figure 2. Ultrasonic sensor bases.
Buildings 16 03521 g002
Figure 3. CO2 phase diagram.
Buildings 16 03521 g003
Figure 4. (a) Condensing coil of 12 m length; (b) CO2 flow circuit with its components.
Buildings 16 03521 g004
Figure 5. Modified refrigerator unit with CO2 supply and the whole assembly under operation.
Buildings 16 03521 g005
Figure 6. Ultrasonic sensors in the test circuit.
Buildings 16 03521 g006
Figure 7. CO2 calibration points with the quadratic regression curves.
Buildings 16 03521 g007
Figure 8. Ultrasonic acquisition signal-processing and ML workflow for regression.
Buildings 16 03521 g008
Table 1. Experimental conditions.
Frequencies (kHz)100, 150, 200
Temperatures (°C)−15 to −25
Pressures (bar)10–20
Table 2. Experimental states with density and quality extraction.
StateP (bar)T (°C)Flow Rate (kg/h) ρ m e a s ρ l i q ρ v a p Quality x
113−15957.4065.8057.330.9905
215−15958.1365.8057.330.8931
317−15958.8765.8057.330.7968
419−15959.6365.8057.330.7004
511−161155.3761.6754.390.8499
613−171051.6557.9451.590.9894
717−171152.4857.9451.590.8453
819−1710.553.3457.9451.590.7006
910−189.748.9954.6248.940.9902
1017−181049.4954.6248.940.8931
1119−1811.550.0054.6248.940.7961
1220−181150.5254.6248.940.6993
1318−199.747.1651.7246.440.8505
1412−20844.1349.2244.080.9892
1514−208.544.4049.2244.080.9317
1615−208.544.6749.2244.080.8735
1716−201144.9549.2244.080.8147
1817−2011.345.2349.2244.080.7565
1919−2011.245.5149.2244.080.6991
2010−211041.9247.1441.880.9914
2114−211142.6147.1441.880.8464
2217−2110.543.3347.1441.880.6994
2311−22939.8645.4639.810.9913
2415−221040.3545.4639.810.8933
2517−228.840.8545.4639.810.7963
2619−221141.3545.4639.810.7006
2712−231037.9544.2037.900.9908
2816−231039.5944.2037.900.7004
2913−241037.0643.3436.130.8492
3013−25934.5842.9034.510.9896
3115−25935.2542.9034.510.8927
3217−251035.9442.9034.510.7966
3319−251036.6642.9034.510.7001
3413−261031.1245.2229.490.8494
3514−269.533.0343.2431.710.8501
3615−26934.2142.8633.040.8507
Disclaimer/Publisher’s Note: The statements, opinions and data contained in all publications are solely those of the individual author(s) and contributor(s) and not of MDPI and/or the editor(s). MDPI and/or the editor(s) disclaim responsibility for any injury to people or property resulting from any ideas, methods, instructions or products referred to in the content.