


Abstract
Natural ventilation (NV) is an effective passive strategy for reducing building cooling demand, yet its performance varies substantially with climate and may not increase proportionally with larger openings. This study examines the nonlinear cooling benefits of NV in detached residential buildings under different climatic conditions in Japan using dynamic building energy simulation. Eight representative cities were selected to evaluate how regional temperature and humidity influence NV availability, indoor thermal response, and cooling-energy demand under multiple window-opening scenarios. The results reveal strong climate dependence. In temperate regions, NV provides the greatest cooling benefits by enhancing nighttime heat dissipation and reducing multi-day indoor heat accumulation. In cold regions, cooling demand is relatively low, resulting in limited or negligible net cooling-energy benefits from NV. In warm-humid regions, high moisture conditions significantly weaken the cooling effect of larger openings. Across all climates, the relationship between window opening area and cooling-energy savings is nonlinear and not universally monotonic. In seven of the eight cities, the 5% opening scenario provides the best annual cooling-energy performance among the examined non-zero opening conditions. These findings indicate that NV design should be climate-responsive rather than based on uniform opening assumptions and provide practical guidance for region-specific residential cooling strategies.
1. Introduction
Building energy consumption is a major contributor to global energy use and greenhouse gas emissions, with a considerable portion attributed to indoor air-conditioning and ventilation systems [1,2,3]. To address climate change and the energy crisis, energy-efficient building design has become a key focus in both research and practice. In recent years, natural ventilation has been regarded as one of the critical strategies for achieving building energy conservation and improving indoor environmental quality due to its characteristics of low energy consumption, low cost, and sustainability [4,5]. Natural ventilation drives airflow exchange through indoor–outdoor pressure differences, achieving cooling and air renewal without relying on mechanical systems, thereby effectively reducing building operational energy consumption and enhancing indoor thermal comfort [6].
A substantial body of research has demonstrated that natural ventilation exhibits significant energy-saving potential across various climatic conditions, building types, and urban scales. Xie et al. [7], by integrating the Surface Urban Energy and Water Balance Scheme (SUEWS) with EnergyPlus, conducted simulations for three representative urban communities across five climate zones in China, elucidating the influence of urban density differences on natural ventilation potential (NVP) and building cooling energy-saving performance. This study emphasizes that accurate assessment of NVP requires consideration of both urban-scale and neighborhood-scale climatic conditions and further demonstrates a method for improving the accuracy of EnergyPlus in predicting regional NVP through multi-scale meteorological inputs. Furthermore, Lin et al. [8] investigated the impact of outdoor fine particulate matter (PM2.5) pollution on the applicability of natural ventilation in office buildings, revealing that when PM2.5 constraints are incorporated, the feasible hours for natural ventilation significantly decrease to ranges of 15–55% (mild pollution) and 28–67% (moderate pollution), indicating that air quality has become one of the key factors affecting the energy-saving potential.
In the context of climate change, the adaptability of natural ventilation and mixed-mode ventilation strategies has also received increasing attention. Bamdad et al. [9], based on future scenarios, evaluated mixed-mode (MM) ventilation strategies and found that their energy-saving performance may exhibit diverse trends—decreasing, increasing, or remaining essentially unchanged—depending on the climate zone, and that the use of ceiling fans (CFs) does not alter their overall sensitivity characteristics. Tong et al. [10], incorporating multidimensional factors such as weather conditions, ambient air quality, building configurations, and additional office floor area, systematically estimated the energy-saving potential of natural ventilation in major Chinese cities, indicating that natural ventilation can reduce cooling-energy consumption by 8–78% at the urban scale [11].
In addition to energy-saving benefits, building geometric characteristics, ventilation organization, and urban morphology have also been shown to exert significant influence on natural ventilation performance. Wang et al. [12] conducted pollutant dispersion analyses in apartment corridors with different structural designs and found a pronounced negative correlation between wind speed and pollutant concentration, with the degree of correlation varying across temporal and spatial scales; window ventilation driven by natural wind also markedly reduced the total volatile organic compounds (TVOC) concentration on the first floor. Liu et al. [13] investigated the effects of natural and mechanical ventilation on indoor formaldehyde concentrations under varying seasonal conditions, further highlighting the importance of ventilation strategies for indoor environmental quality. Additional studies have pointed out that building orientation and floor-height differences directly affect indoor wind distribution and thermal comfort, with upper floors of high-rise residential buildings often achieving better airflow and comfort [14,15,16]. Moreover, the optimization of opening types and window-to-wall ratios is an important design approach for improving ventilation efficiency; however, while increasing the window-to-wall ratio can enhance ventilation volume, it may also exacerbate heat transfer losses through the building envelope, thus requiring a reasonable balance between energy efficiency and comfort [17,18,19]. Furthermore, variations in external wind speed, surrounding building density, and terrain conditions can significantly alter ventilation paths and pressure-difference distributions, and overly dense urban forms or complex terrain may weaken natural ventilation driving forces, thereby reducing its overall energy-saving potential [20,21].
In terms of quantitative assessment, relevant methodological systems have also continued to evolve. Germano et al. [22] proposed a natural ventilation potential evaluation method that comprehensively considers driving forces (e.g., wind pressure and stack effect) and limiting factors (e.g., noise and air pollution), using ordinal qualitative scales to weight multiple factors. Zhang et al. [23] coupled the Monin–Obukhov Similarity Theory (MOST) with a Surface Energy Balance (SEB) model to construct a vertical distribution model of natural ventilation potential, providing a physically based framework for meteorological driving analyses of ventilation potential in multi-story buildings. Luo et al. [24] further developed a revised model applicable to buildings in China by incorporating thermal comfort and indoor air quality into the natural ventilation potential evaluation system, making NVP more consistent with actual building operation scenarios. On this basis, Germano M [25] proposed a more universally applicable concept of NVP, laying the theoretical foundation for the subsequent development of multi-criteria assessment methods [25], climate adaptability assessment methods [26], and the effective pressure-difference method [27]. These methodologies can comprehensively account for the coupled relationships among meteorological conditions, building layouts, and ventilation paths, thereby providing systematic approaches for evaluating natural ventilation across multiple scales and building types.
With the growing demand for real-time building operation, new ventilation control strategies have also attracted increasing attention [28]. Simões et al. [29] proposed and validated a new method that supports advanced real-time natural ventilation control, which does not require expensive airflow measurements or high-cost CFD computations, making it suitable for practical scenarios in smart buildings. In assessing the applicability of natural ventilation, Axley and Emmerich [30] adopted the Comfort Hour Method to determine the time windows throughout the year during which natural ventilation is suitable, while recent studies have introduced indicators such as the Energy Saving Time Fraction (ESTF) and the Cooling Load Reduction Rate (CLRR) for cross-regional comparisons [31,32], further enhancing the applicability of methods for quantifying natural ventilation potential. Meanwhile, research on mixed-mode ventilation systems has also continued to deepen. Niyadi and Elnabawi [33] evaluated the energy-saving and carbon-reduction performance of mixed-mode ventilation in Dubai’s hot and arid climate using a dual-path methodology, demonstrating that integrating natural ventilation in high cooling-load scenarios can significantly improve system performance. Tognon et al. [34] employed a co-simulation framework to analyze two representative cases of residential and educational buildings, showing that different control strategies can lead to substantial differences in annual energy demand and ventilation risk mitigation, thereby further revealing the operational advantages and limitations of mixed-mode ventilation systems under multiple scenarios.
Although existing studies have extensively investigated natural ventilation (NV) from the perspectives of climatic conditions, air quality, building morphology, and control strategies, the current body of knowledge remains largely fragmented in terms of process representation and mechanism interpretation. In particular, a unified, quantitative, and process-resolved framework that explicitly links climatic constraints, indoor thermal dynamics, and cooling-energy demand across multiple climate zones is still lacking.
Three key limitations can be identified. First, the applicability of NV is commonly determined using fixed empirical thresholds of outdoor temperature and humidity, which inadequately represent the coupled heat–moisture effects governing ventilation feasibility and fail to capture regional differences in constraint dominance (e.g., low temperature, high humidity, or their interaction). Second, climatic suitability, indoor thermal response, and cooling-energy demand are typically evaluated as separate components, resulting in a lack of a continuous analytical chain that can reveal how outdoor boundary conditions propagate through building thermal inertia to shape energy demand. As a result, the underlying mechanisms linking climate forcing and energy-saving outcomes remain insufficiently quantified. Third, the influence of window-opening configurations on NV performance is often assessed under simplified or scenario-specific assumptions, with limited attention to the nonlinear and climate-dependent nature of marginal energy-saving benefits, as well as their temporal characteristics such as peak effectiveness and operational windows.
These limitations indicate that the current research paradigm remains predominantly descriptive and threshold-based, rather than mechanism-oriented, thereby constraining the ability to develop transferable and climate-adaptive NV design principles.
To address these limitations, this study develops an integrated, process-based evaluation framework that explicitly couples climatic constraints, indoor thermal response, and cooling-energy demand, and applies it to eight representative cities across major climate zones in Japan. The framework uses operational temperature–humidity screening criteria informed by thermal comfort considerations to identify NV feasibility under varying climatic conditions, thereby enabling consistent comparison of region-specific constraint structures.
Through hourly classification of meteorological conditions, this study quantitatively identifies the dominant roles of low temperature, high temperature, high humidity, and heat–moisture coupling as limiting factors across climate zones. Building simulations are then used to resolve the dynamic response of indoor thermal conditions to NV operation, allowing the analysis of key processes such as thermal storage effects, diurnal heat exchange, and nighttime cooling limitations. By linking these processes to cooling-energy demand, this study provides a mechanism-oriented interpretation of NV performance rather than a purely outcome-based evaluation.
Furthermore, the relationship between window opening area and cooling-energy demand is systematically quantified across climate zones, revealing a nonlinear and climate-dependent response pattern. Instead of assuming monotonic improvement with increased opening area, the results demonstrate differentiated sensitivity regimes governed by climatic constraints and building thermal dynamics. Based on this analysis, the best-performing opening scenarios among the examined cases are identified for each climate zone, and their associated energy-saving characteristics—including seasonal effectiveness and sensitivity—are comparatively evaluated.
By establishing a continuous linkage from climatic forcing to indoor thermal processes and ultimately to energy demand, this study advances a more physically interpretable and quantitatively robust framework for cross-climate NV assessment, providing a foundation for climate-adaptive ventilation design and strategy development.
Accordingly, this study has three specific objectives: (1) to quantify the climatic availability of natural ventilation and identify the dominant temperature–humidity constraints across different climate zones; (2) to clarify how natural ventilation modifies indoor thermal dynamics and subsequently affects cooling-energy demand; and (3) to characterize the nonlinear relationship between window opening area and cooling-energy savings, including its climate-dependent sensitivity and non-monotonic response characteristics. Through these objectives, this study seeks to establish a continuous analytical linkage from climatic forcing to indoor thermal response and ultimately to cooling-energy performance, thereby providing a quantitative basis for climate-adaptive natural ventilation design.
2. Materials and Methods
2.1. Study Area and Building Model
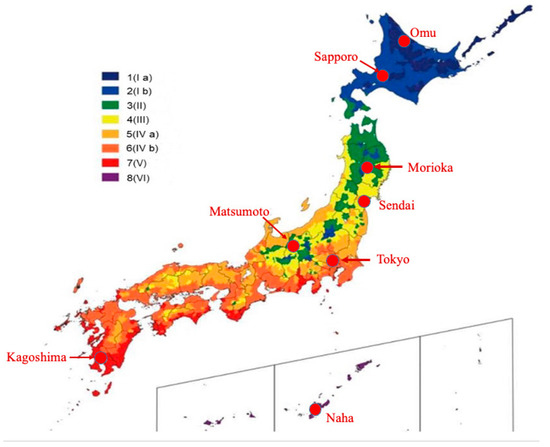
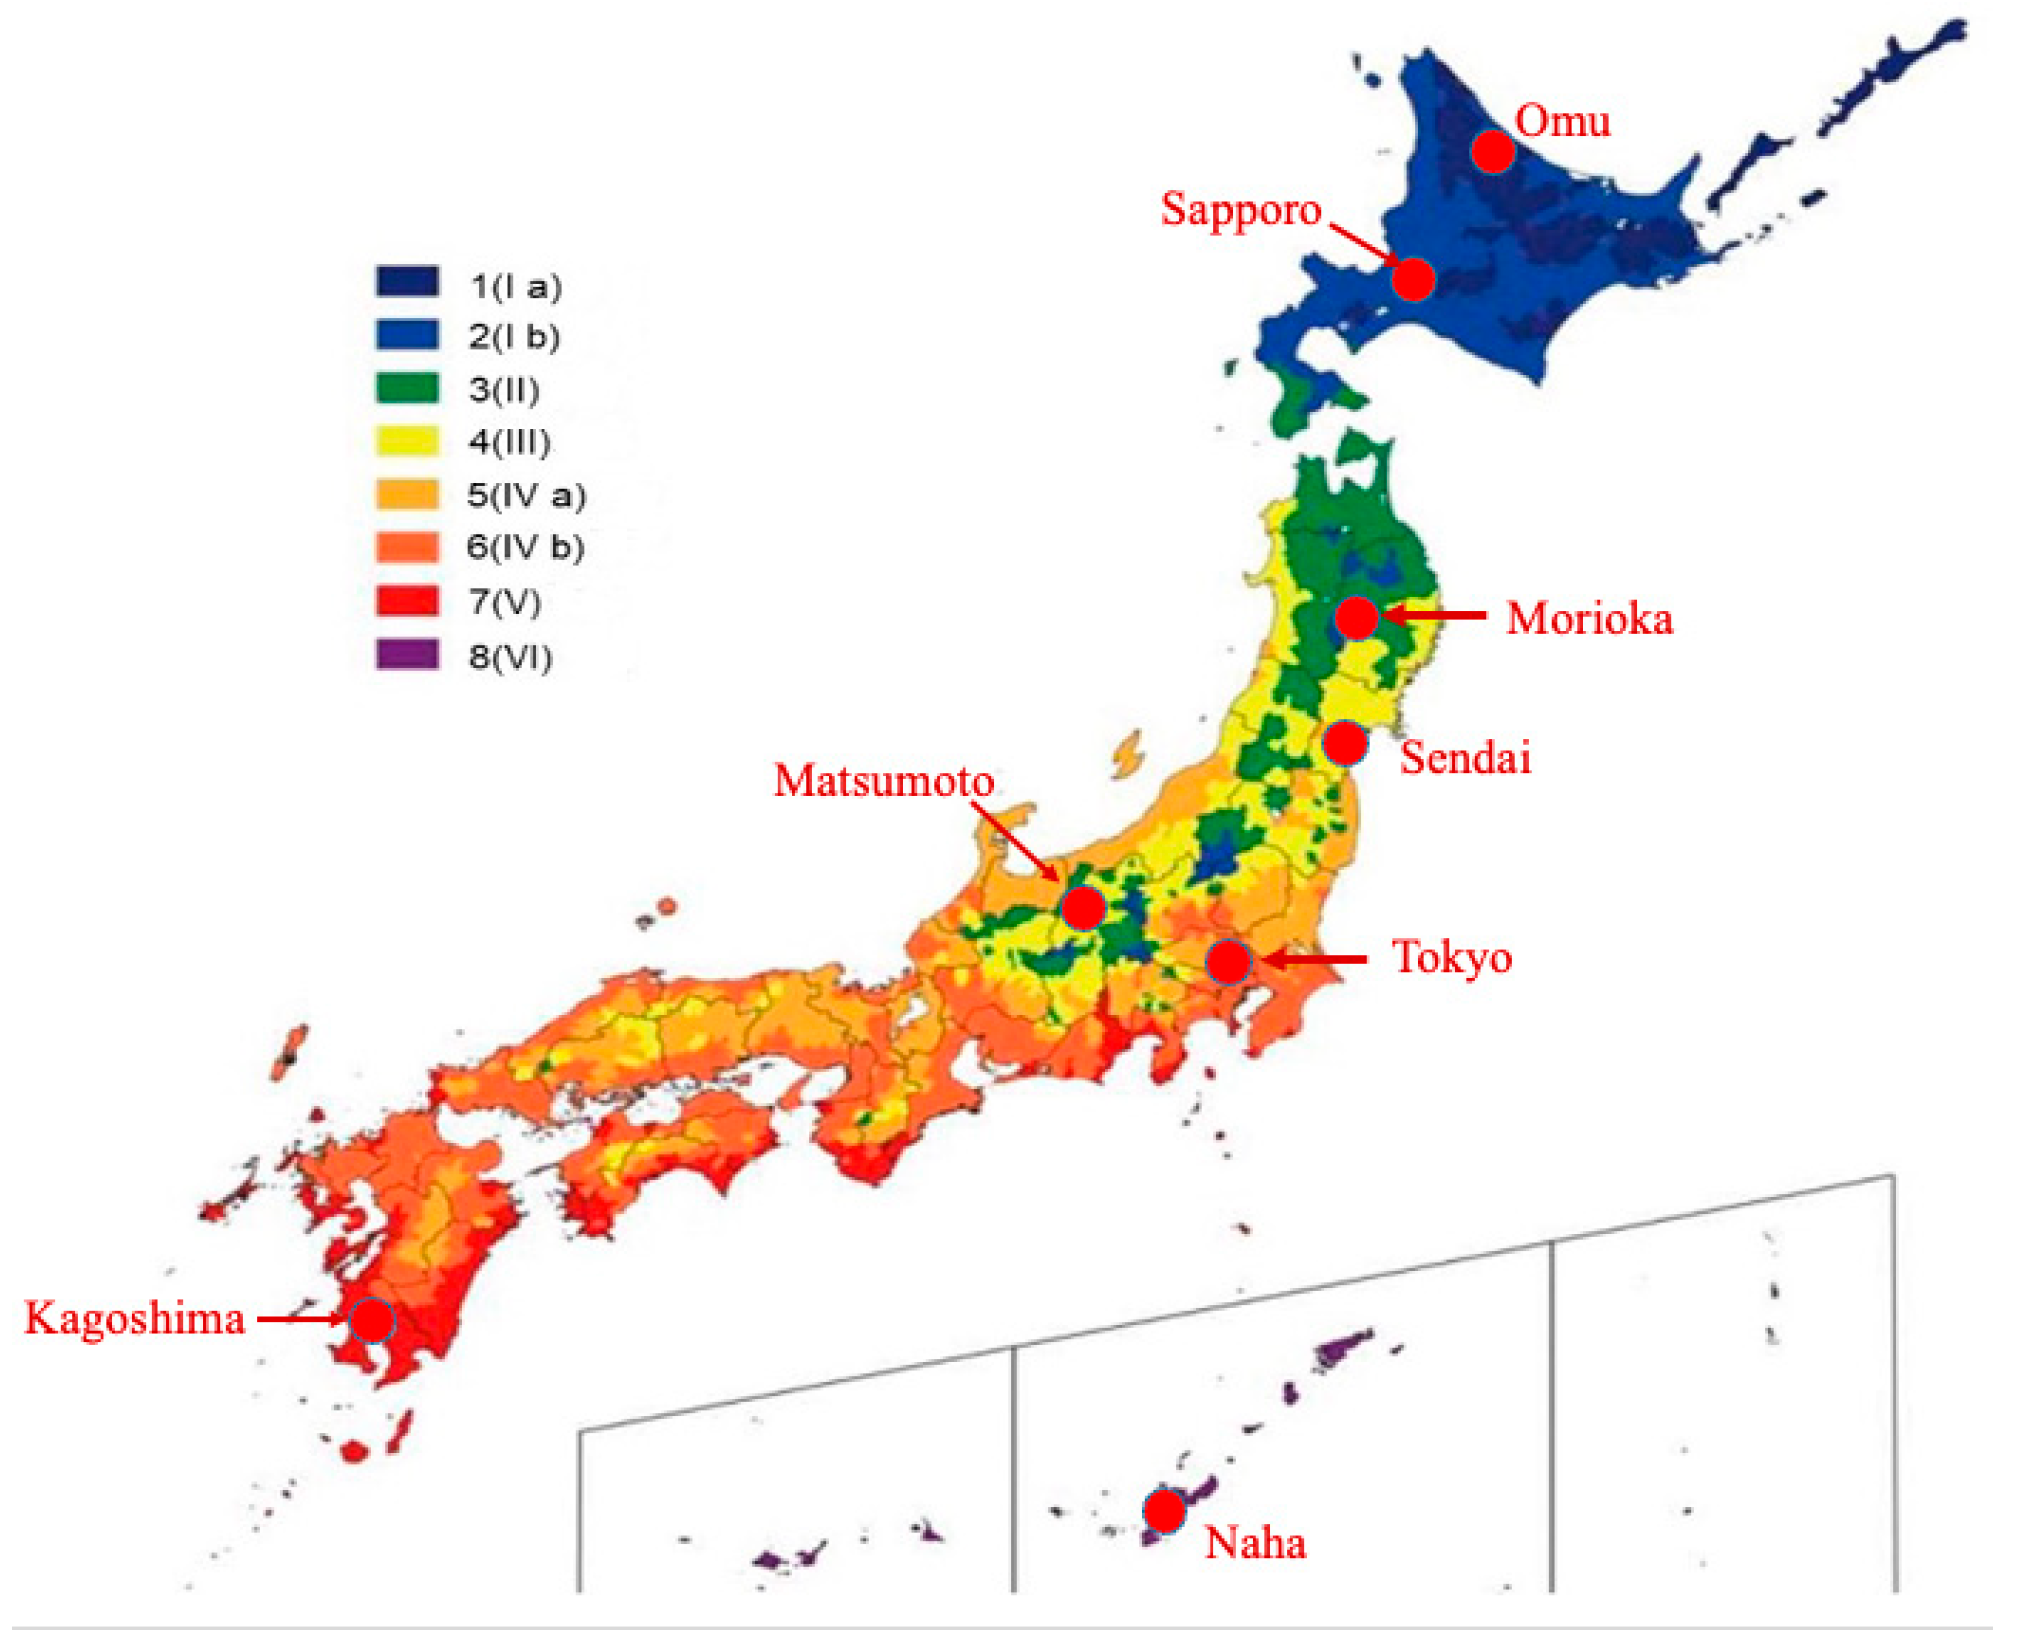
This study focuses on detached houses located in different climate zones across Japan, aiming to systematically evaluate the effects of natural ventilation on residential building energy consumption and indoor thermal comfort under multiple climatic conditions. Japan spans a wide latitudinal range (from north to south), with its climate transitioning from subarctic conditions in the northern regions to subtropical conditions in the southern regions and exhibiting significant variations in temperature, humidity, and seasonal patterns. To ensure the representativeness and general applicability of the analysis results, eight representative cities were selected for simulation based on the climatic zoning defined in Japan’s residential building energy conservation design standards. These cities include Omu, Sapporo, Morioka, Matsumoto, Sendai, Tokyo, Kagoshima, and Naha. Covering Climate Zones 1 through 8, these cities reflect climatic characteristics ranging from cold regions to hot and humid regions (Figure 1).
Figure 1.
Geographical map of research sites.
The building energy simulation in this study employs The BEST Program (Building Energy Simulation Tool; Institute for Building Environment and Energy Conservation, Tokyo, Japan), a dynamic building energy simulation platform. This software can perform high-precision calculations of building thermal loads, indoor temperature variations, and energy consumption distribution based on 8760 h annual hourly meteorological data, and can output key thermal environmental parameters, including operative temperature (OT), and heating and cooling loads for each room. To ensure the representativeness and comparability of the research results, this study selects Japan’s most representative residential type—a two-story detached wooden house—as the simulation model to realistically reflect the energy consumption characteristics and natural ventilation performance of typical residential buildings under different climatic conditions. The BEST Program has been evaluated through BESTEST-based benchmarking of building thermal and HVAC system calculations, providing an established validation basis for its application in building energy simulation.
The building has a total floor area of approximately 120 m2, with floor heights of 2.9 m for the first floor and 2.7 m for the second floor. The building is equipped with four split-type air-conditioning units, a gas latent-heat-recovery hot water system, a floor heating system, a 4 m2 solar thermal collector, and a 3-kW photovoltaic system, as well as an energy-recovery-type ventilation device. The thermal transmittance and airtightness of the building envelope comply with the minimum energy efficiency standards for newly constructed residential buildings in Japan, ensuring that the model possesses is both representative of actual residential buildings and compliant with energy-saving regulations. The parameters of the standard residential building model used in this study are shown in Table 1. To isolate the effects of climatic conditions and window-opening scenarios, all other building and operational conditions, including internal heat gains, occupant schedules, baseline infiltration settings, air-conditioning control settings, and equipment performance, were kept identical across all cities.
Table 1.
Details of the standard residential building model.
2.2. Data and Methodology
The meteorological data used in this study were obtained from the Typical Meteorological Year (TMY) database embedded in The BEST Program. This database contains 8760 h of hourly meteorological information for a year, including parameters such as air temperature, relative humidity, solar radiation, cloud cover, wind speed, and wind direction, enabling an accurate representation of long-term climatic characteristics and seasonal variations in each region.
To make the analytical procedure and the relationship between the different methodological stages more explicit, the research process was organized into four sequential stages, each producing the inputs required for the subsequent analysis. First, hourly meteorological data were used to characterize regional temperature–humidity conditions and identify the feasible periods and dominant climatic constraints for natural ventilation. These outputs form the basis of the cross-climate analysis presented in Section 3.1. Second, natural-ventilation scenarios were constructed by varying window-opening configurations while maintaining the building geometry, envelope characteristics, internal loads, and other non-climatic parameters consistently across cities. Third, annual dynamic simulations were conducted using The BEST Program to obtain hourly indoor thermal conditions and cooling-energy demand under the different ventilation scenarios, which support the analyses in Section 3.2 and Section 3.3. Finally, the simulated cooling-energy responses were compared across opening areas and climate zones to quantify relative energy savings, marginal changes, and saturation characteristics, forming the basis for the nonlinear response analysis in Section 3.4.
Second, in the ventilation scenario construction stage, multiple natural-ventilation scenarios were generated by varying the window opening area ratio, defined as the effective natural-ventilation opening area divided by the corresponding room floor area. Six non-zero opening scenarios were considered, with A = 5%, 10%, 15%, 20%, 25%, and 30% (equivalent to 0.05–0.30 m2/m2), while building geometry, envelope performance, internal loads, and other non-climatic parameters were kept constant. The window opening area was directly specified as an input parameter for the ventilation scenarios in The BEST Program rather than being converted to a prescribed air-change rate through an external empirical relationship. The resulting ventilation effects and their interactions with the building thermal balance were calculated within the simulation framework of The BEST Program. No additional author-defined control was introduced to disable or bypass the energy-recovery ventilation system in response to window opening.
Subsequently, in the annual energy simulation stage, The BEST Program platform was used to perform hourly calculations for each scenario, yielding annual (8760-h) data on indoor air temperature, operative temperature (OT), and heating/cooling loads of the air-conditioning system. These outputs enabled a quantitative assessment of the dynamic responses of building energy consumption and indoor thermal environment to natural ventilation. Finally, in the result analysis and strategy extraction stage, differences in temperature variations and air-conditioning energy consumption between natural ventilation and closed conditions were compared to calculate the temperature reduction rate and energy-saving rate induced by ventilation. Combined with the characteristics of different climate zones, the study further revealed the variation patterns of natural ventilation performance across climate regions. Based on these findings, the climate-dependent characteristics of natural-ventilation performance and the sensitivity of cooling-energy savings to window opening area were summarized, thereby providing a quantitative basis for climate-adaptive natural-ventilation design. Based on these results, the best-performing window-opening scenario among the examined cases was identified for each climate zone, and its seasonal cooling-energy performance was further evaluated.
It should be noted that the 18–26 °C and RH < 90% criteria used in Section 3.1 are applied only to the climatic screening of NV suitability and are not used as an idealized hourly controller for switching between NV and mechanical cooling. In the building simulations, 18 °C was adopted as the lower outdoor-temperature limit for enabling natural ventilation, while the cooling-energy analysis retained the air-conditioning system and compared different window-opening scenarios with the no-NV baseline. No additional author-defined control criterion based on the indoor–outdoor temperature difference was imposed in the simulation scenarios.
3. Results and Discussion
3.1. Analysis of Natural Ventilation Potential Across Climate Zones
To evaluate natural ventilation (NV) feasibility across different climatic regions, this study adopts an operational definition of NV suitability based on coupled outdoor thermal and moisture conditions. Rather than directly applying indoor adaptive comfort criteria, outdoor air temperature and relative humidity are used as proxy indicators to determine whether outdoor air can contribute to acceptable indoor thermal conditions without inducing excessive latent loads.
Specifically, an outdoor temperature range of 18–26 °C is used as an operational thermal screening range, while RH < 90% is applied to exclude extremely humid outdoor conditions. These temperature and humidity thresholds are intended to provide a consistent basis for cross-climate comparison rather than to define universal thermal comfort limits. The 90% RH threshold should therefore not be interpreted as an upper limit for indoor thermal comfort or as indicating that all conditions below 90% RH are favorable for natural ventilation.
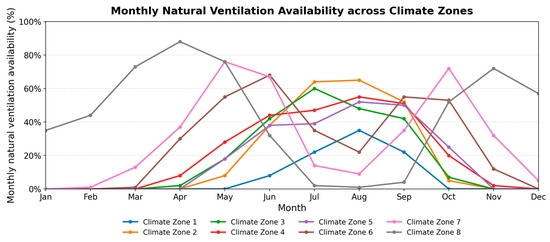
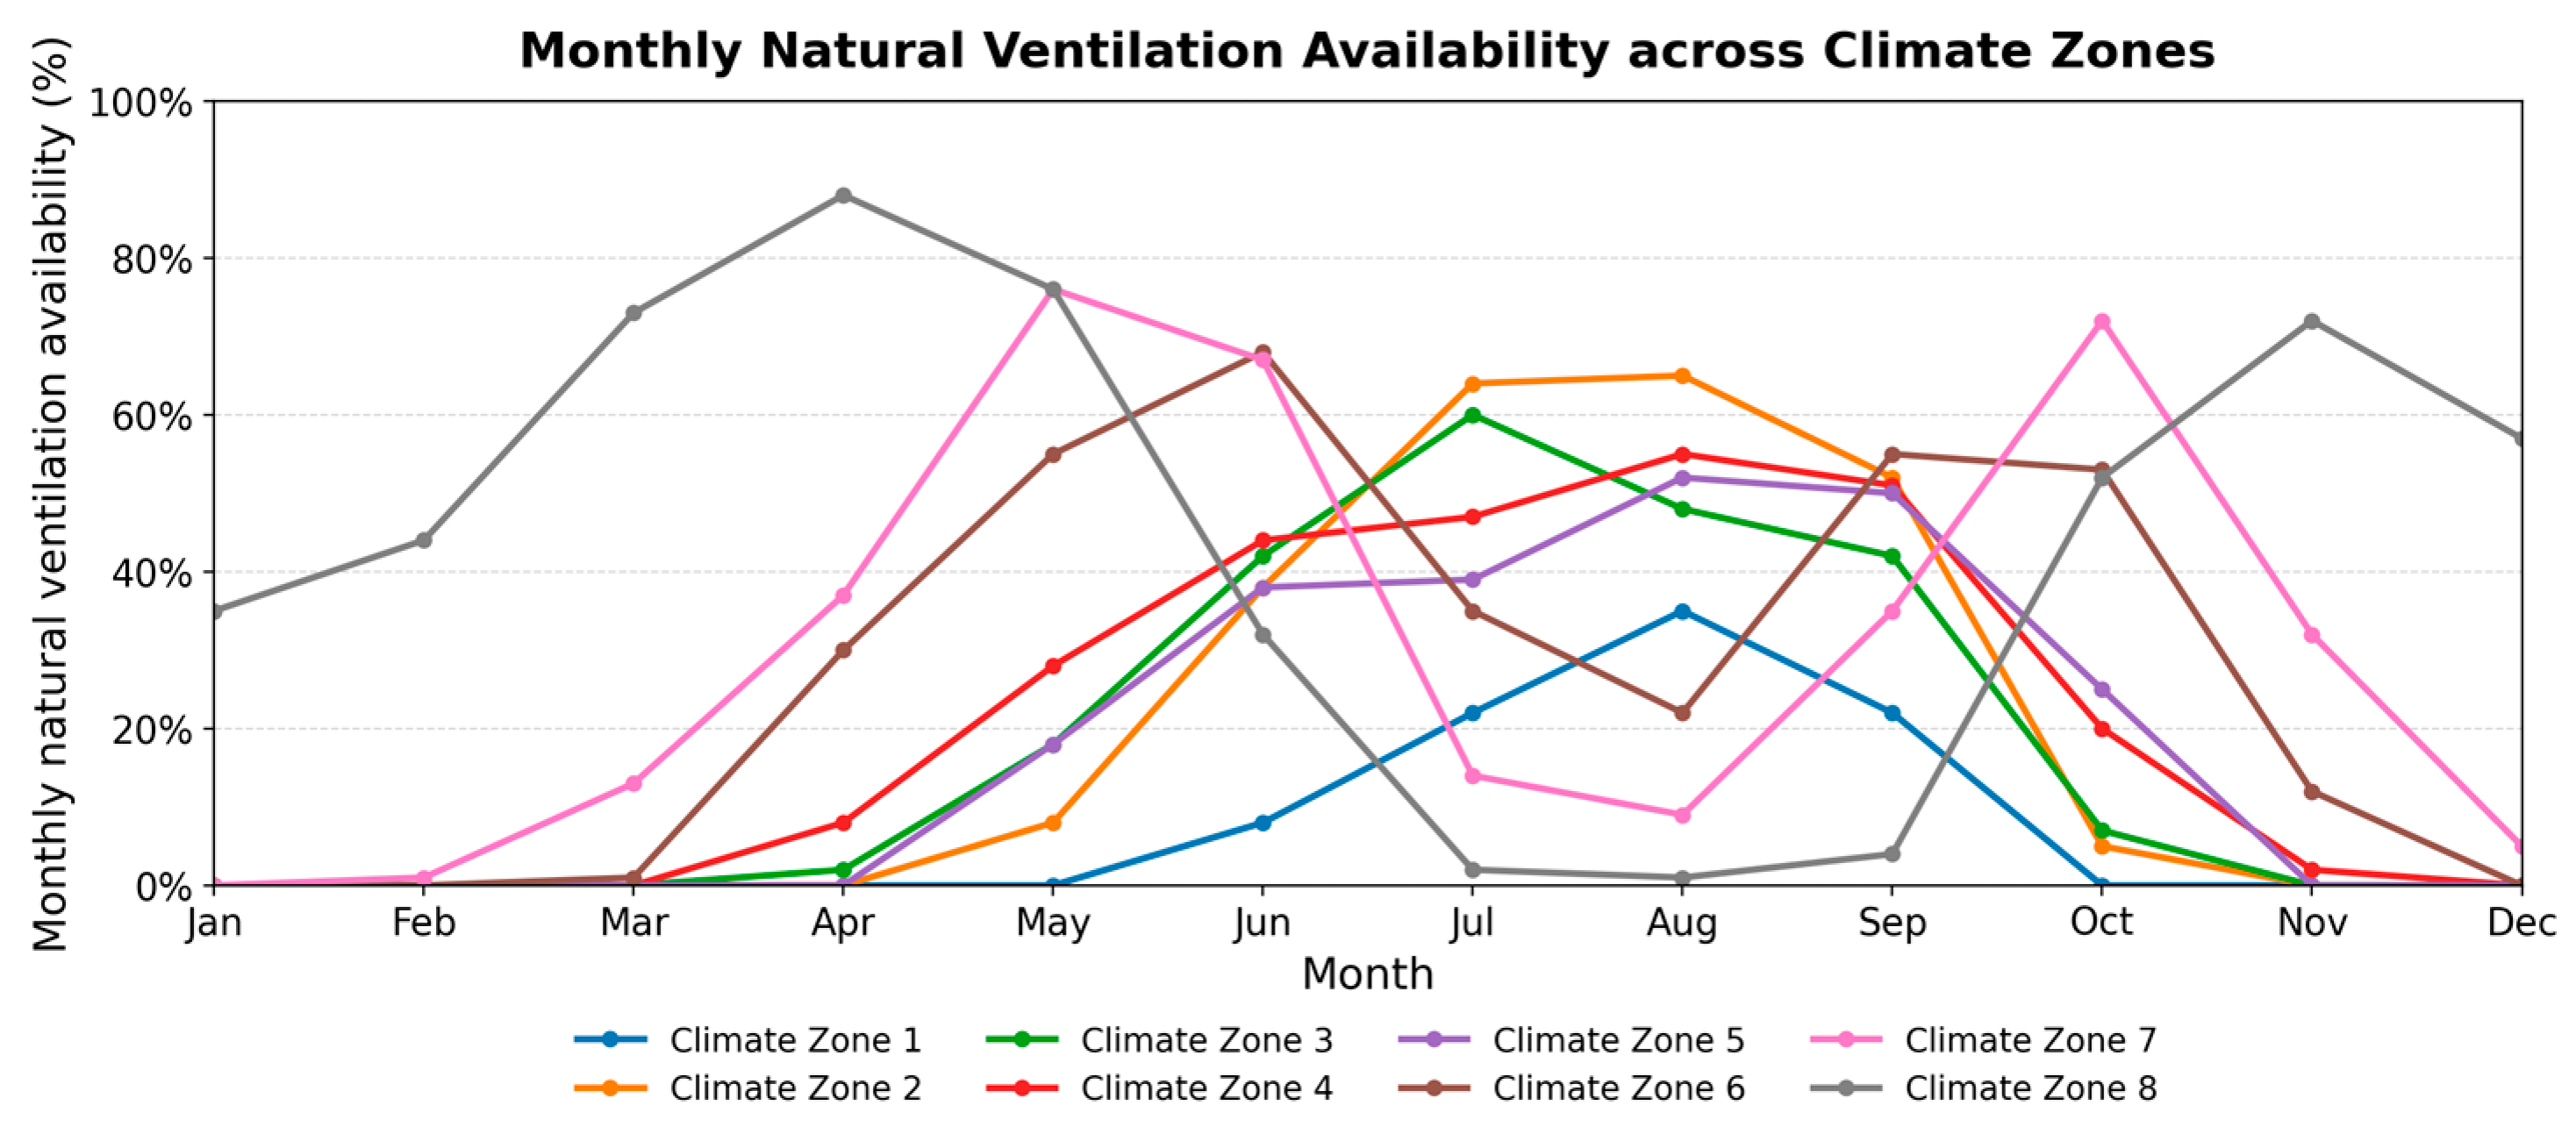
Hourly Typical Meteorological Year (TMY) data (8760 h) for eight representative cities across major Japanese climate zones (Omu, Sapporo, Morioka, Matsumoto, Sendai, Tokyo, Kagoshima, and Naha) were analyzed. For each location, the number of hours satisfying the defined NV criteria was calculated, and monthly NV feasibility ratios were derived to characterize seasonal variability and regional differences (Figure 2).
Figure 2.
The effective hours and percentages of natural ventilation for each month in different regions.
Figure 2 presents the monthly distribution of NV feasibility across the eight climate zones. While all regions exhibit pronounced seasonality, the results reveal systematic differences in the structure of NV availability, including the position of peak periods, the width of effective ventilation windows, and the extent of summer suppression. In cold and cool-temperate regions (e.g., Sapporo, Morioka, Matsumoto), NV feasibility is concentrated within a relatively continuous period from late spring to early autumn, with peak values typically exceeding 50% in June and July. The near absence of feasible hours in winter indicates that low outdoor temperature is the dominant constraint in these regions, resulting in a seasonally bounded NV pattern.
In contrast, warm and humid regions (e.g., Tokyo, Kagoshima) exhibit a bimodal distribution, with NV feasibility occurring primarily in spring and autumn. The sharp decline during summer reflects the combined influence of high temperature and high humidity, leading to a “seasonally interrupted” NV pattern. In subtropical marine climates such as Naha, NV feasibility is further constrained, forming a narrow window pattern characterized by short and fragmented periods of suitability.
These distinct patterns indicate that NV availability is governed not only by seasonal temperature variation but also by the interaction between thermal and moisture conditions, which progressively shifts the limiting mechanism from temperature-dominated to coupled heat–humidity constraints along the north–south climatic gradient.
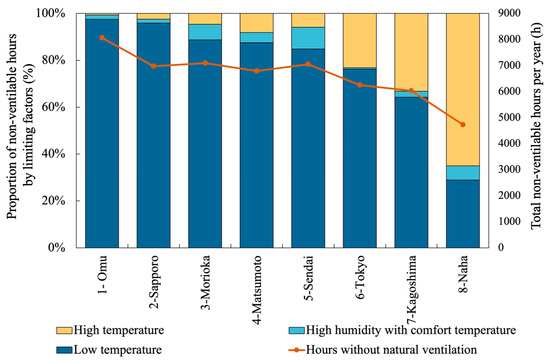
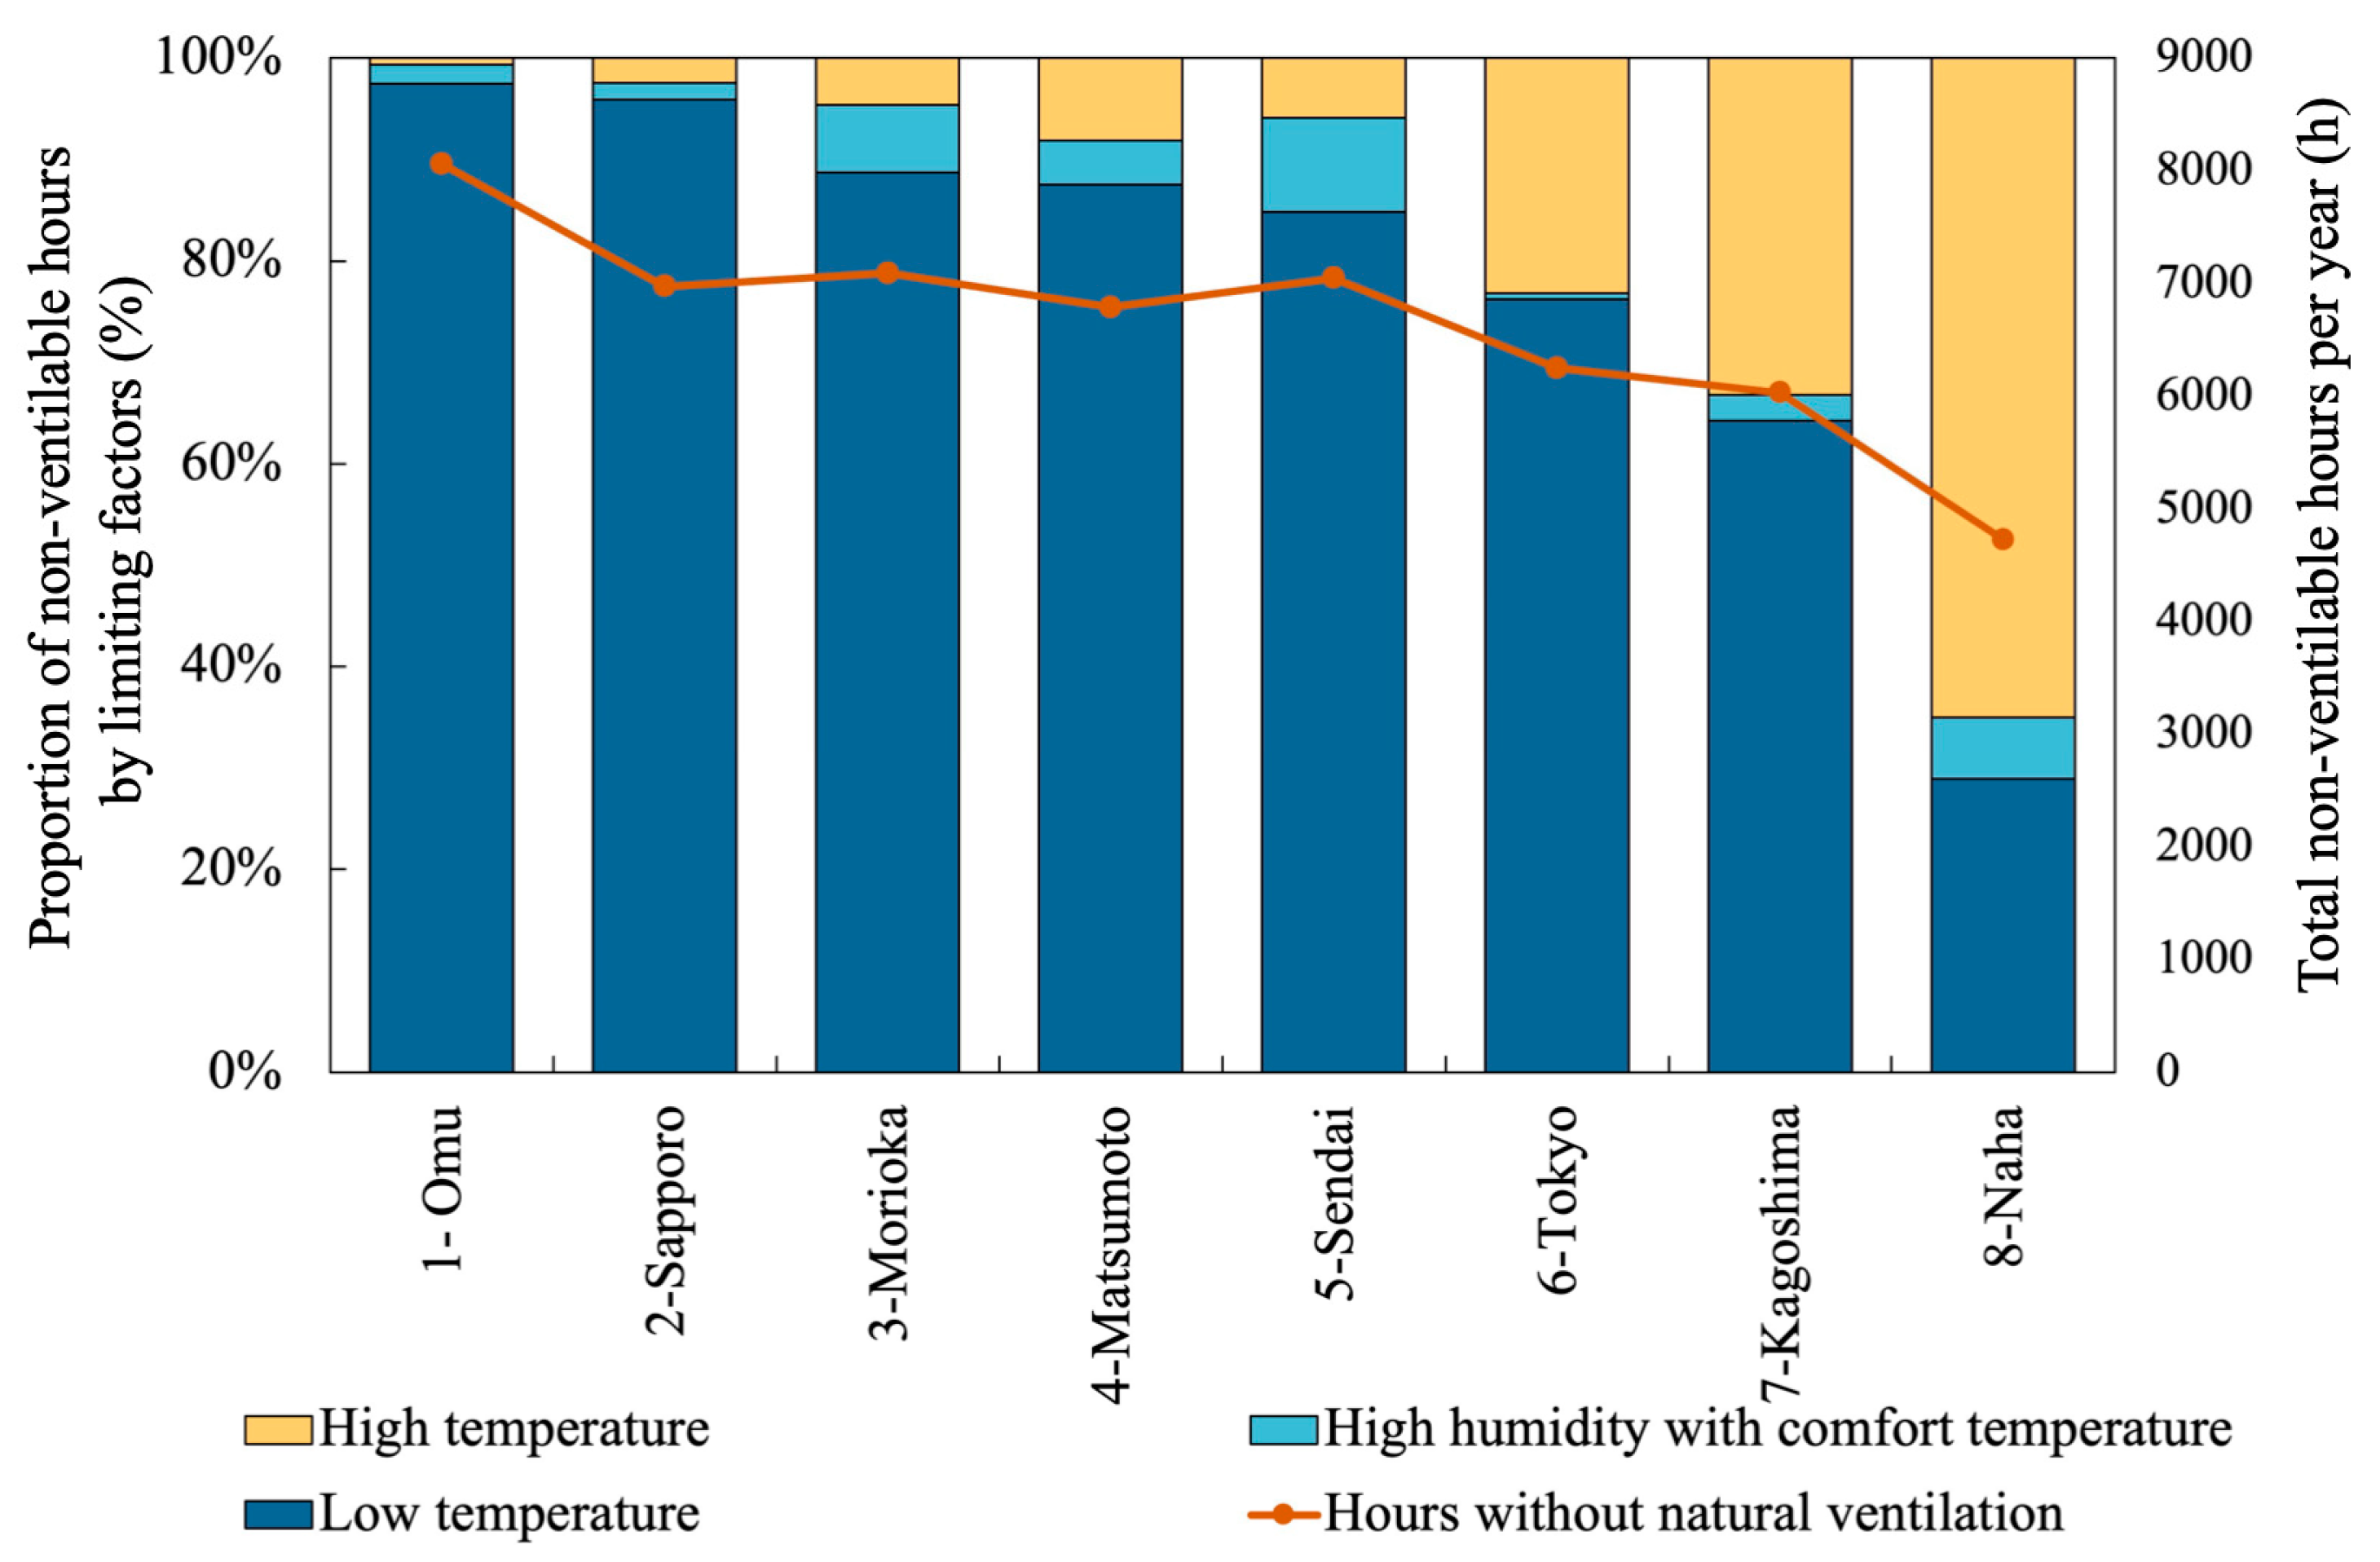
To further quantify the mechanisms limiting NV feasibility, all non-ventilable hours were classified into four mutually exclusive categories based on the violation of the defined criteria: (i) low temperature (T < 18 °C), (ii) high temperature (T > 26 °C), (iii) high humidity (RH ≥ 90% with 18 °C ≤ T ≤ 26 °C), and (iv) combined high temperature and high humidity (T > 26 °C and RH ≥ 90%). For each climate zone, the proportion of hours corresponding to each limiting factor was calculated (Figure 3), providing a quantitative decomposition of NV constraints.
Figure 3.
Factors influencing natural ventilation across different regions.
The results reveal a clear regional transition in constraint dominance. In northern regions (Omu, Sapporo, Morioka), low temperature accounts for more than 80% of non-ventilable hours, indicating that NV infeasibility is almost entirely governed by insufficient thermal conditions. In mid-latitude regions (Matsumoto, Sendai, Tokyo), the contributions of high temperature and high humidity increase substantially, leading to a mixed constraint regime where both winter cold and summer heat–humidity conditions restrict NV operation.
In southern and subtropical regions (Kagoshima, Naha), the dominant limiting factors shift toward high temperature and combined heat–humidity conditions. In particular, the high proportion of simultaneous temperature and humidity exceedance in Naha indicates that latent and sensible constraints act concurrently, forming a strongly coupled limitation mechanism. Under such conditions, even when temperature approaches the acceptable range, excessive humidity may still prevent effective NV operation.
Importantly, although the total number of non-ventilable hours decreases from north to south, this does not imply improved NV potential. Instead, it reflects a transition from persistent low-temperature constraints to seasonally concentrated heat–humidity constraints. This shift highlights that NV feasibility is governed by fundamentally different physical mechanisms across climate zones, which cannot be captured by a single temperature-based indicator.
3.2. Cooling Effect of Natural Ventilation on Indoor Environments
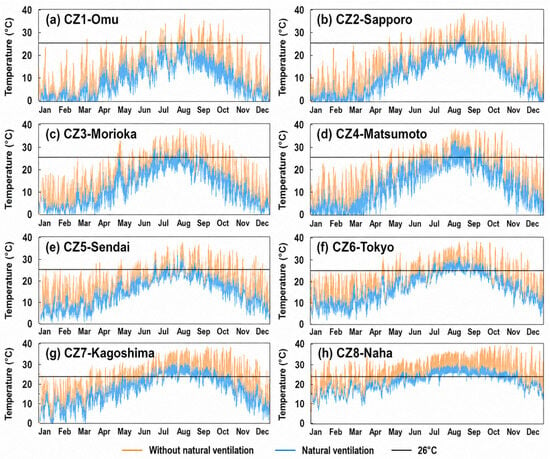
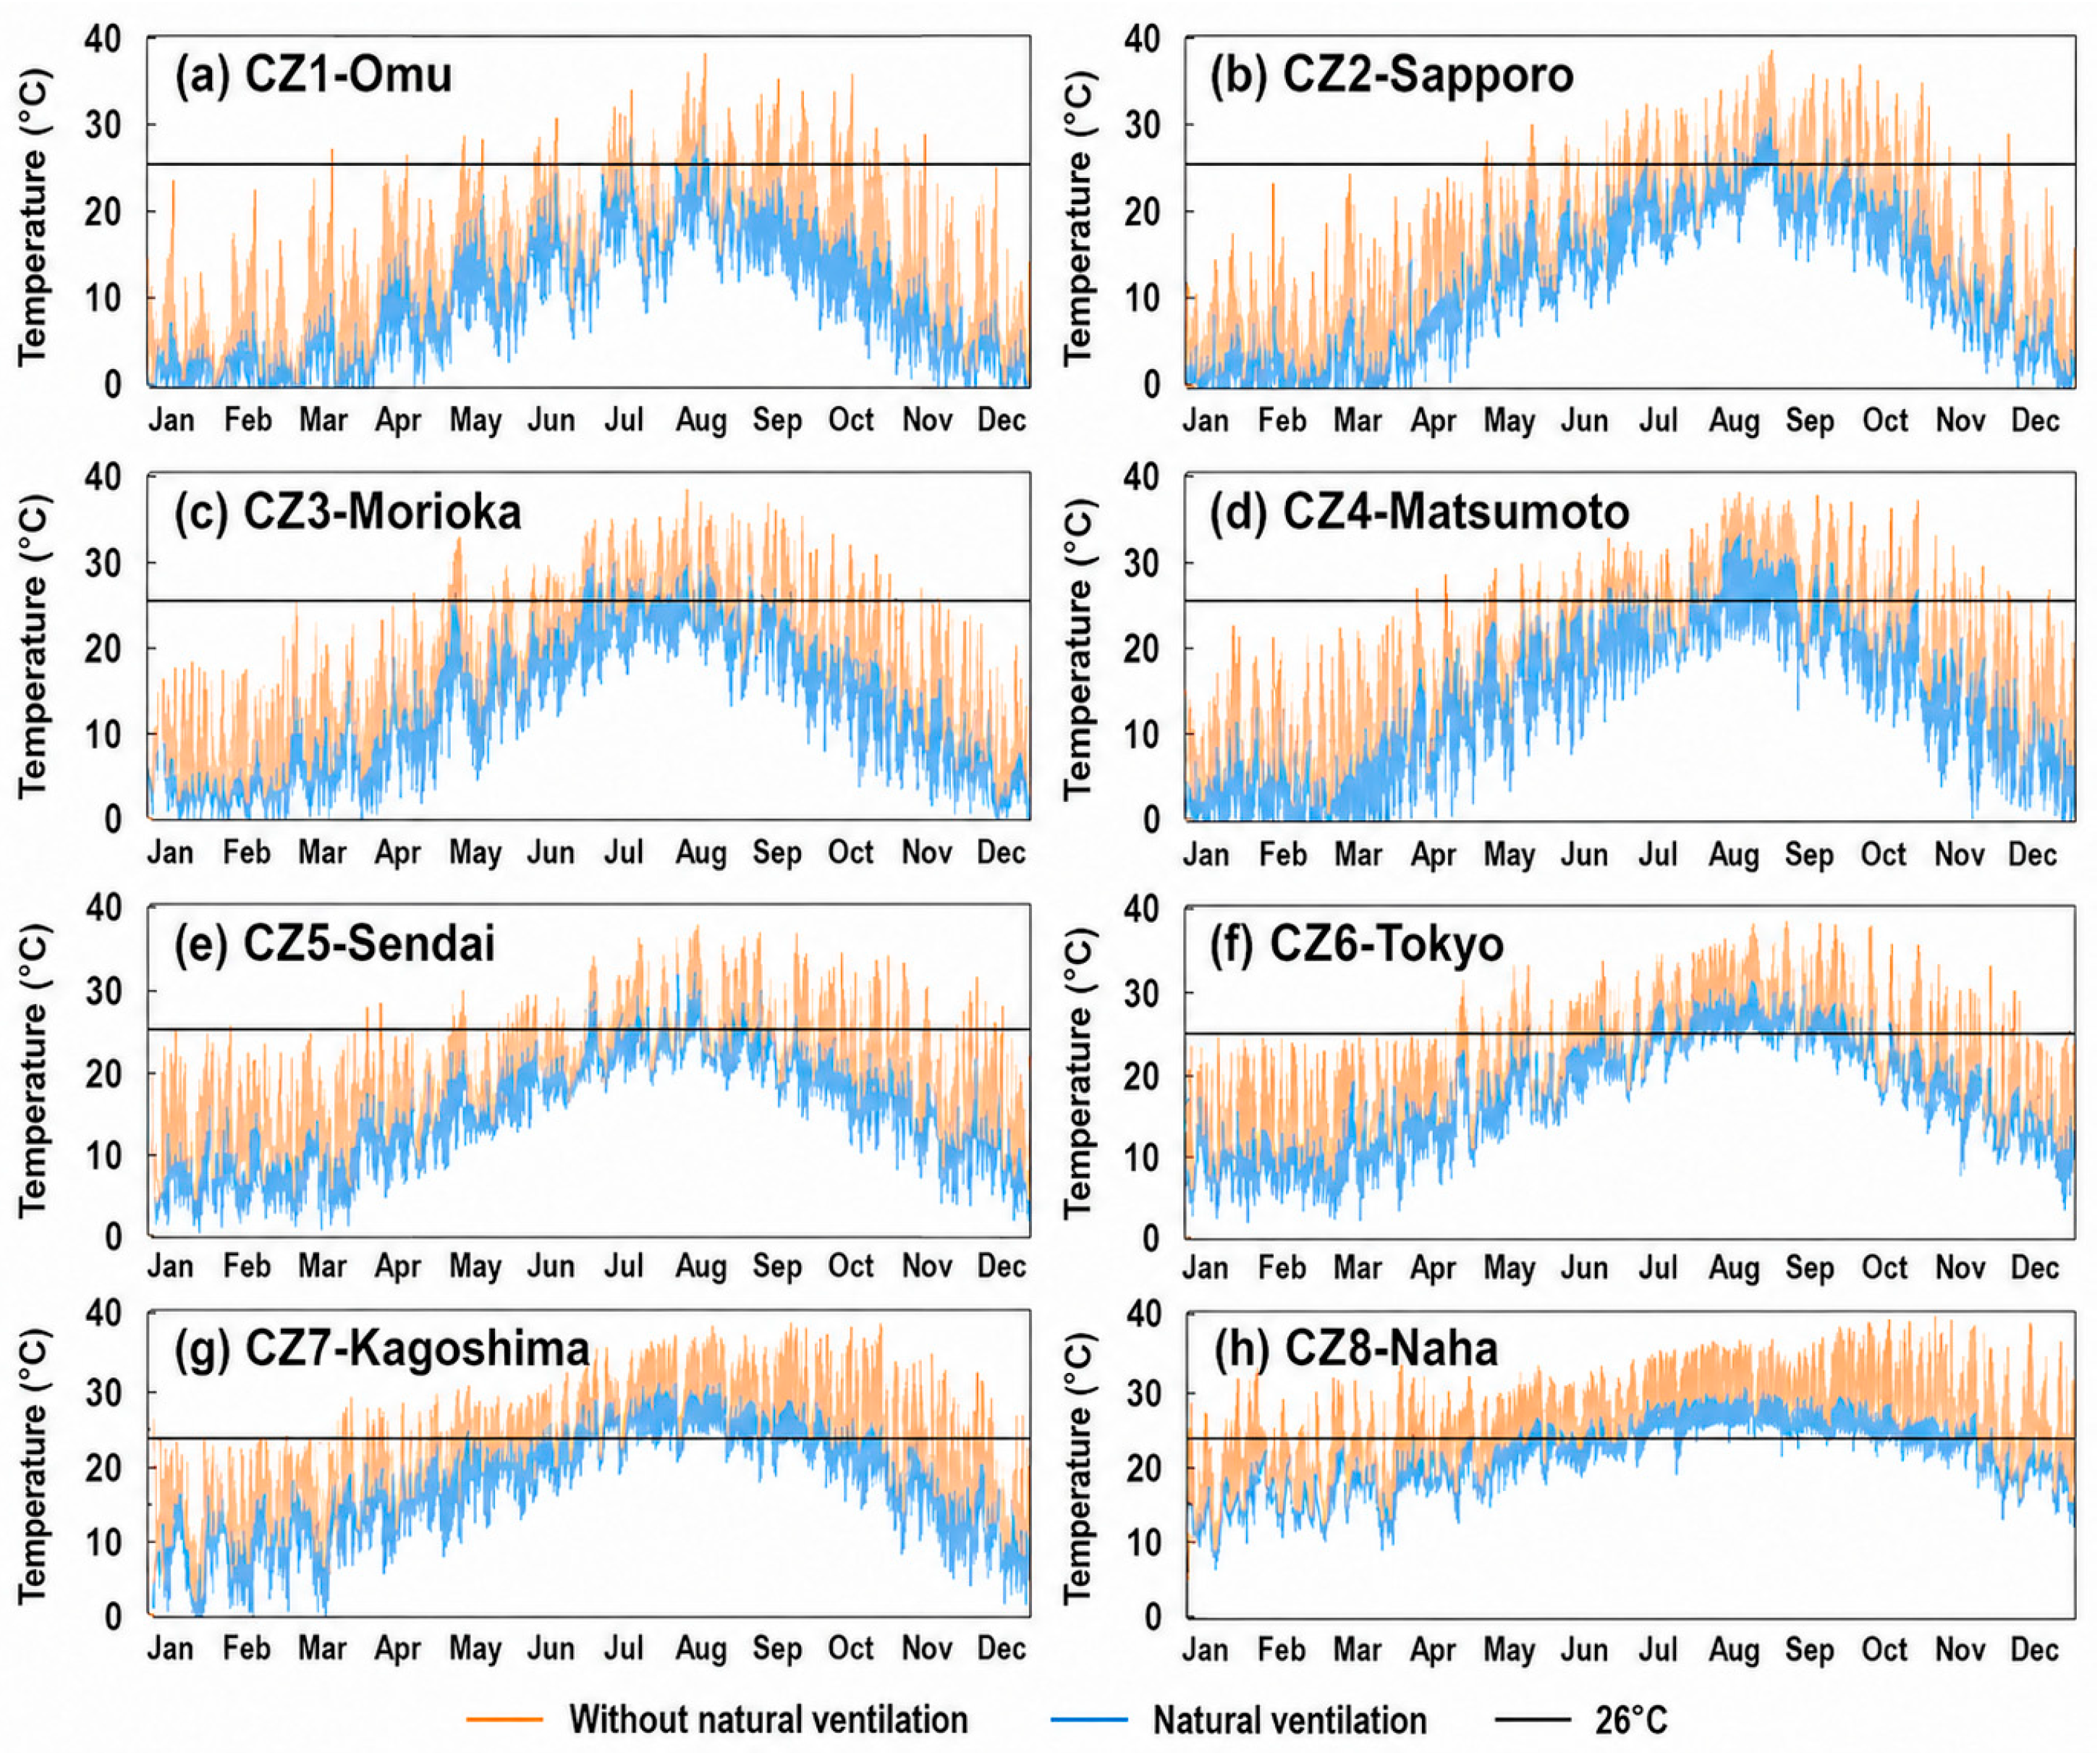
To evaluate the intrinsic cooling potential of natural ventilation (NV) from a building physics perspective, the baseline indoor thermal response without air conditioning and ventilation was first analyzed across the eight representative climate zones. This configuration isolates the effect of climatic forcing and building thermal inertia, providing a reference for subsequent NV-induced cooling analysis (Figure 4).
Figure 4.
Indoor and outdoor temperature change without natural ventilation.
Figure 4 presents the hourly indoor temperature evolution in relation to outdoor temperature for each climate zone. While all regions exhibit clear seasonal cycles, substantial differences are observed in the amplitude, persistence, and diurnal variability of indoor temperature, reflecting distinct thermal response regimes governed by climate–building interactions.
In cold regions (Omu, Sapporo, and Morioka), indoor temperature closely follows outdoor temperature variations, with limited attenuation and minimal phase shift. This indicates that the building envelope exhibits weak thermal buffering under persistently low-temperature conditions, resulting in a climate-dominated response regime. Indoor temperatures remain below 20 °C for extended periods, suggesting that cooling demand is negligible while heating demand dominates.
In temperate regions (Matsumoto, Sendai, Tokyo), a different response pattern emerges. During summer, indoor temperatures exhibit reduced diurnal amplitude but increased persistence at elevated levels, forming sustained high-temperature periods. This behavior indicates the presence of significant thermal inertia, whereby heat accumulated during daytime is gradually released, leading to a delayed and smoothed response relative to outdoor fluctuations. Such a regime reflects an imbalance between heat storage and dissipation, which is critical for understanding NV effectiveness.
In warm-humid and subtropical regions (Kagoshima, Naha), indoor temperatures remain consistently high throughout the year, with further attenuation of diurnal variation. The reduced day–night temperature difference, combined with high humidity, limits nighttime heat dissipation, resulting in a quasi-steady high-temperature state. This regime suggests that both sensible and latent environmental constraints suppress effective heat release, making passive cooling more challenging.
From a cross-regional perspective, three distinct thermal response regimes can be identified: (i) climate-dominated response in cold regions, characterized by strong indoor–outdoor coupling; (ii) thermal inertia-dominated response in temperate regions, characterized by heat accumulation and delayed cooling; and (iii) heat–moisture constrained response in warm-humid regions, characterized by suppressed diurnal recovery. These regimes provide a physical basis for interpreting the climate-dependent performance of NV.
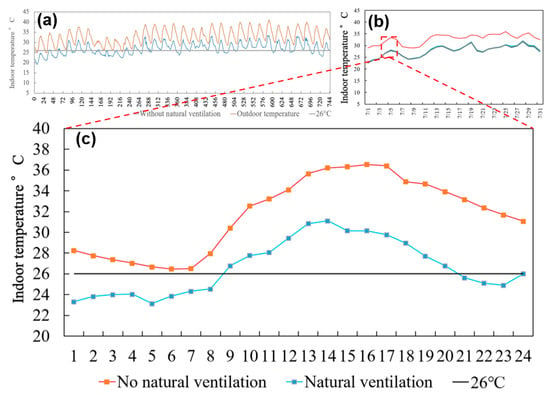
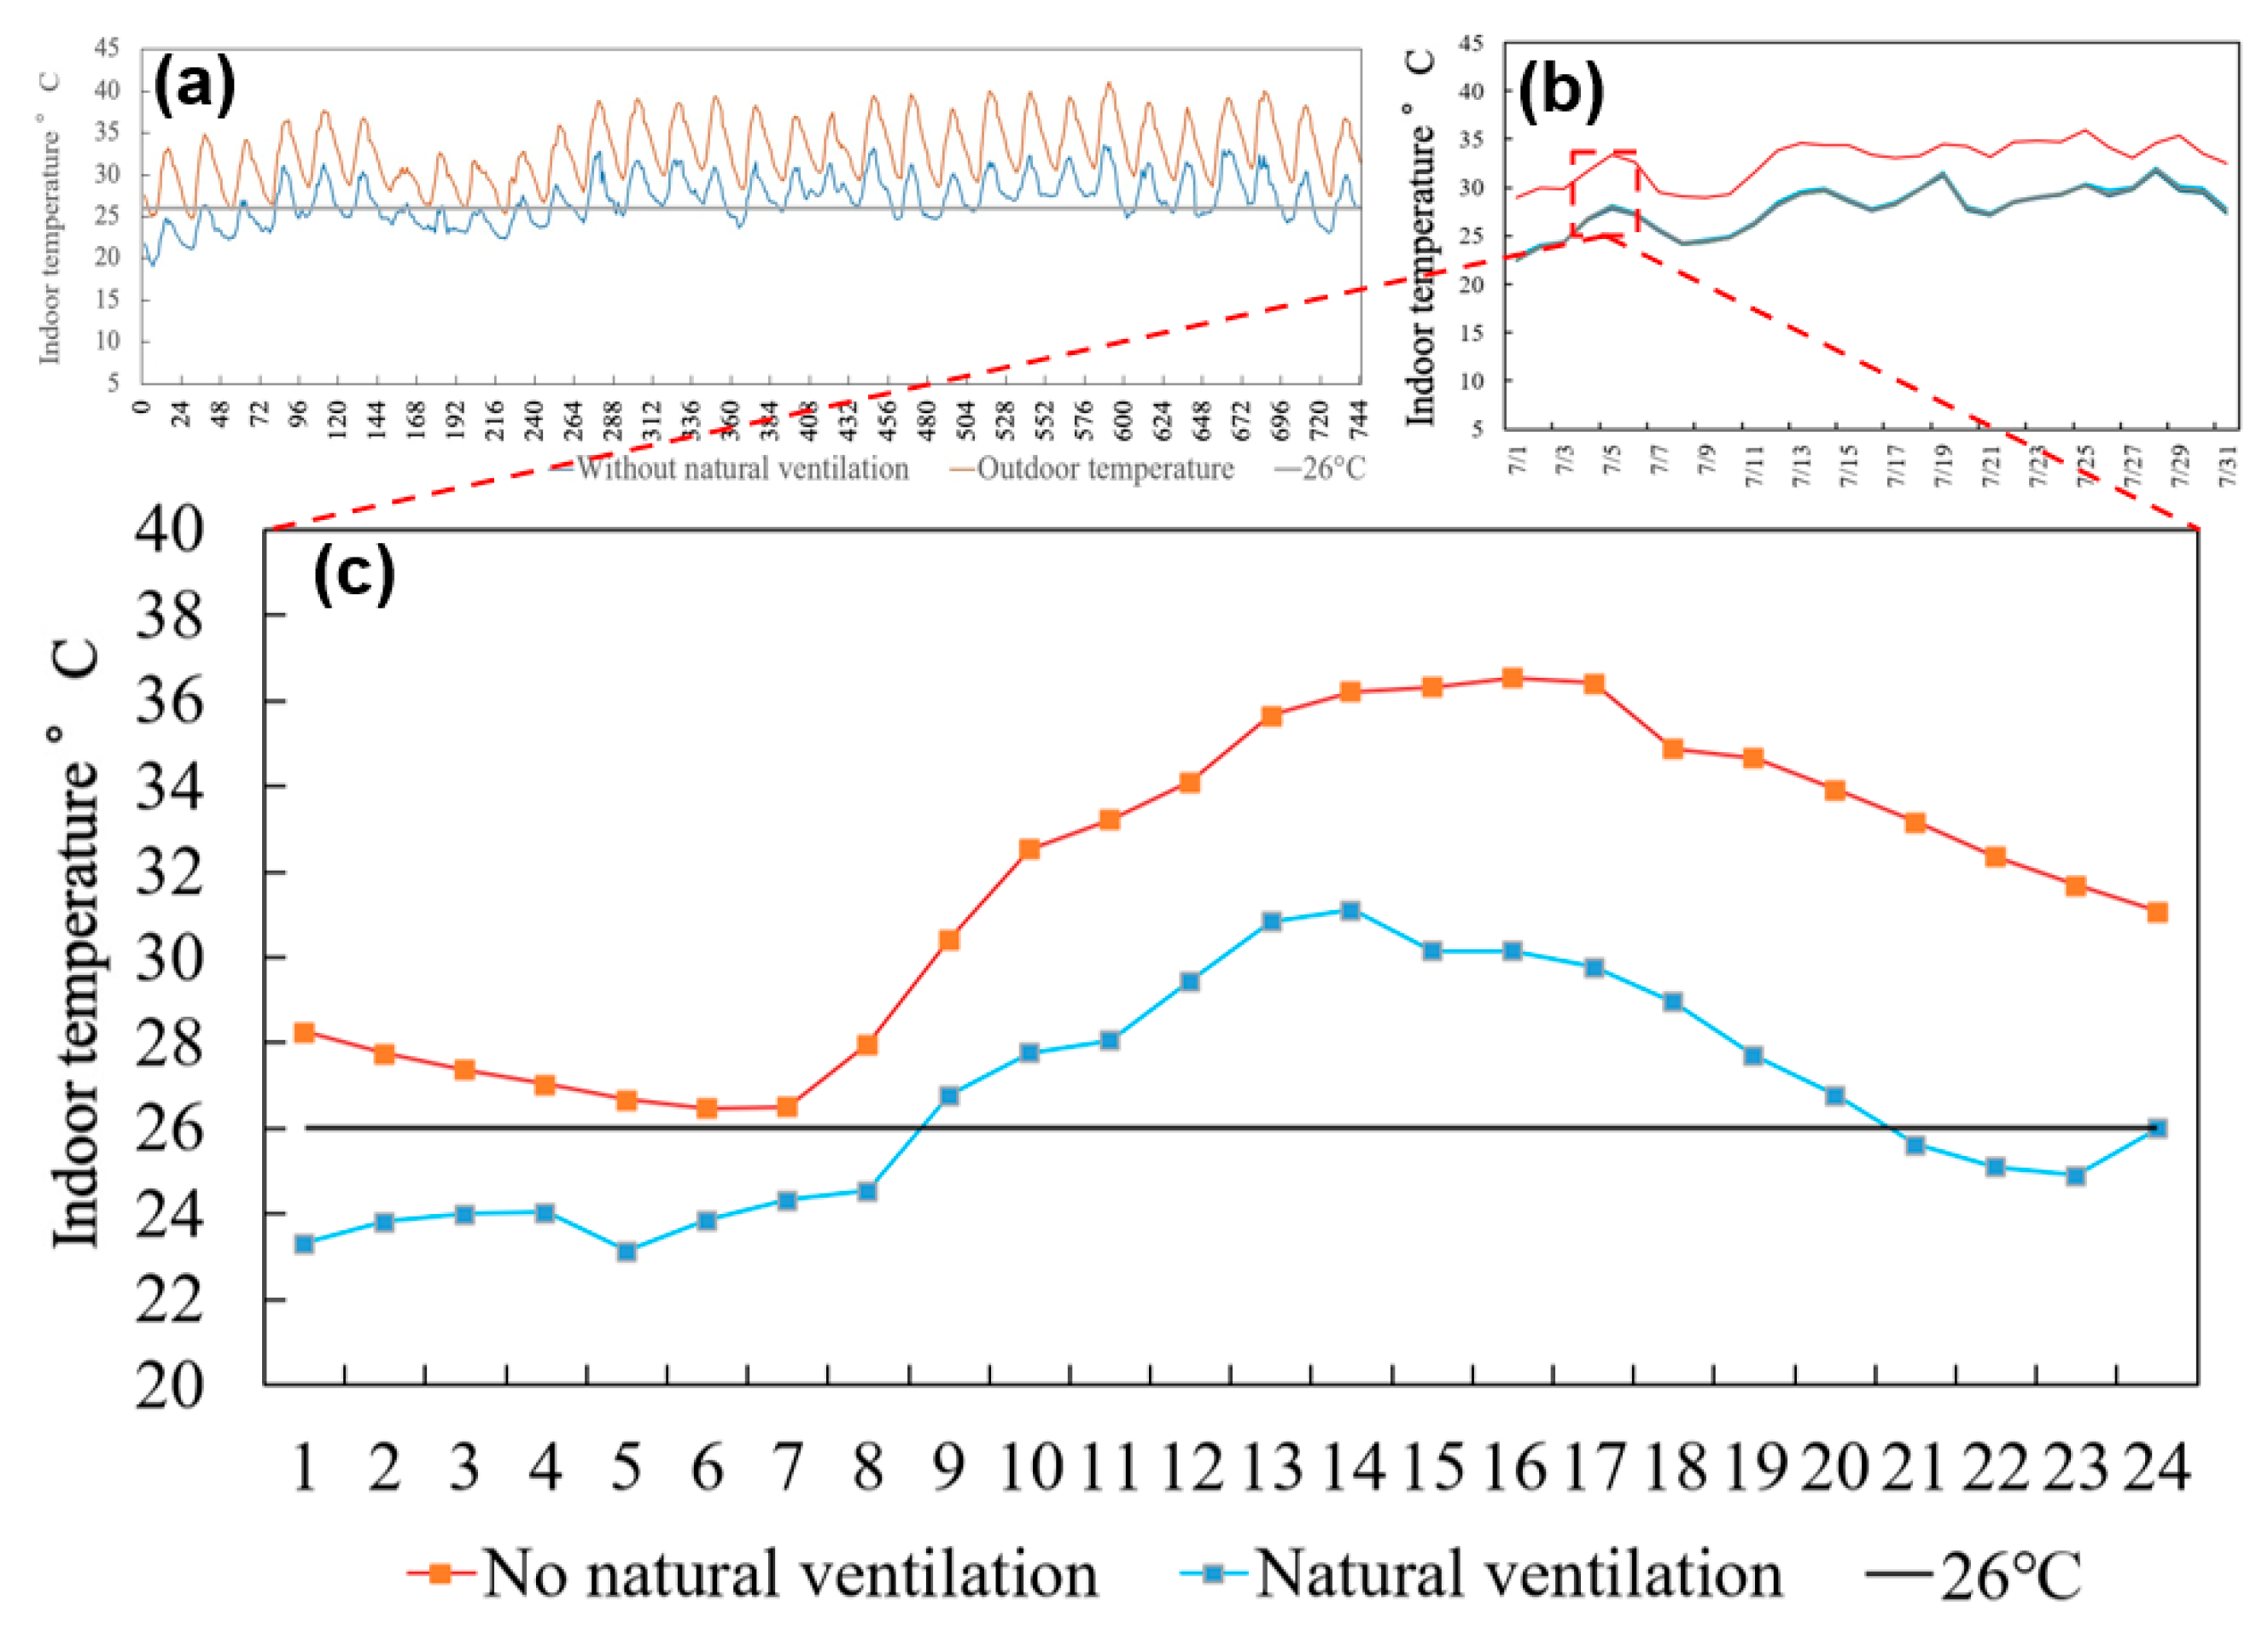
To further quantify the cooling effect of NV, Tokyo was selected as a representative temperate city, and the indoor thermal response under different ventilation conditions was analyzed at multiple temporal scales for a typical summer period (July). A comparative analysis of outdoor and indoor temperature variations is shown in Figure 5.
Figure 5.
Hourly outdoor and indoor temperature variations in July: (a) monthly variations in outdoor and indoor temperatures; (b) enlarged view of the selected period in panel (a); (c) 24-h comparison of indoor temperatures with and without natural ventilation.
Figure 5a compares the monthly indoor and outdoor temperature variations. Without NV, indoor temperature exhibits both an upward shift and a reduction in diurnal amplitude relative to outdoor conditions, indicating progressive heat accumulation and limited heat dissipation. With NV, the indoor temperature more closely follows the outdoor diurnal cycle, particularly during nighttime, suggesting enhanced convective heat exchange between indoor and outdoor environments.
At the multi-day scale (Figure 5b), the cumulative effect of heat storage becomes more evident. Without NV, indoor temperature continues to rise over consecutive hot days, forming a persistent high-temperature plateau even when outdoor temperature temporarily decreases. In contrast, NV interrupts this accumulation process by enabling periodic heat release, thereby limiting the growth of indoor temperature over time. At the diurnal scale (Figure 5c), the cooling mechanisms of NV can be further interpreted. NV reduces peak indoor temperature during daytime and lowers residual temperature during nighttime, effectively enlarging the diurnal temperature swing. This behavior indicates two complementary processes: (i) peak suppression through reduced heat accumulation during daytime, and (ii) nighttime recovery through enhanced heat dissipation.
To quantify this effect, the reduction in peak temperature and the increase in diurnal temperature difference can be interpreted as indicators of NV cooling effectiveness. The results show that NV not only decreases the duration of overheating conditions (e.g., indoor temperature exceeding 30 °C) but also increases the frequency at which indoor temperature returns to near-comfort levels. This demonstrates that NV operates as a dynamic regulator of indoor thermal conditions, rather than merely shifting temperature levels.
3.3. Impact of Natural Ventilation on Cooling-Energy Consumption
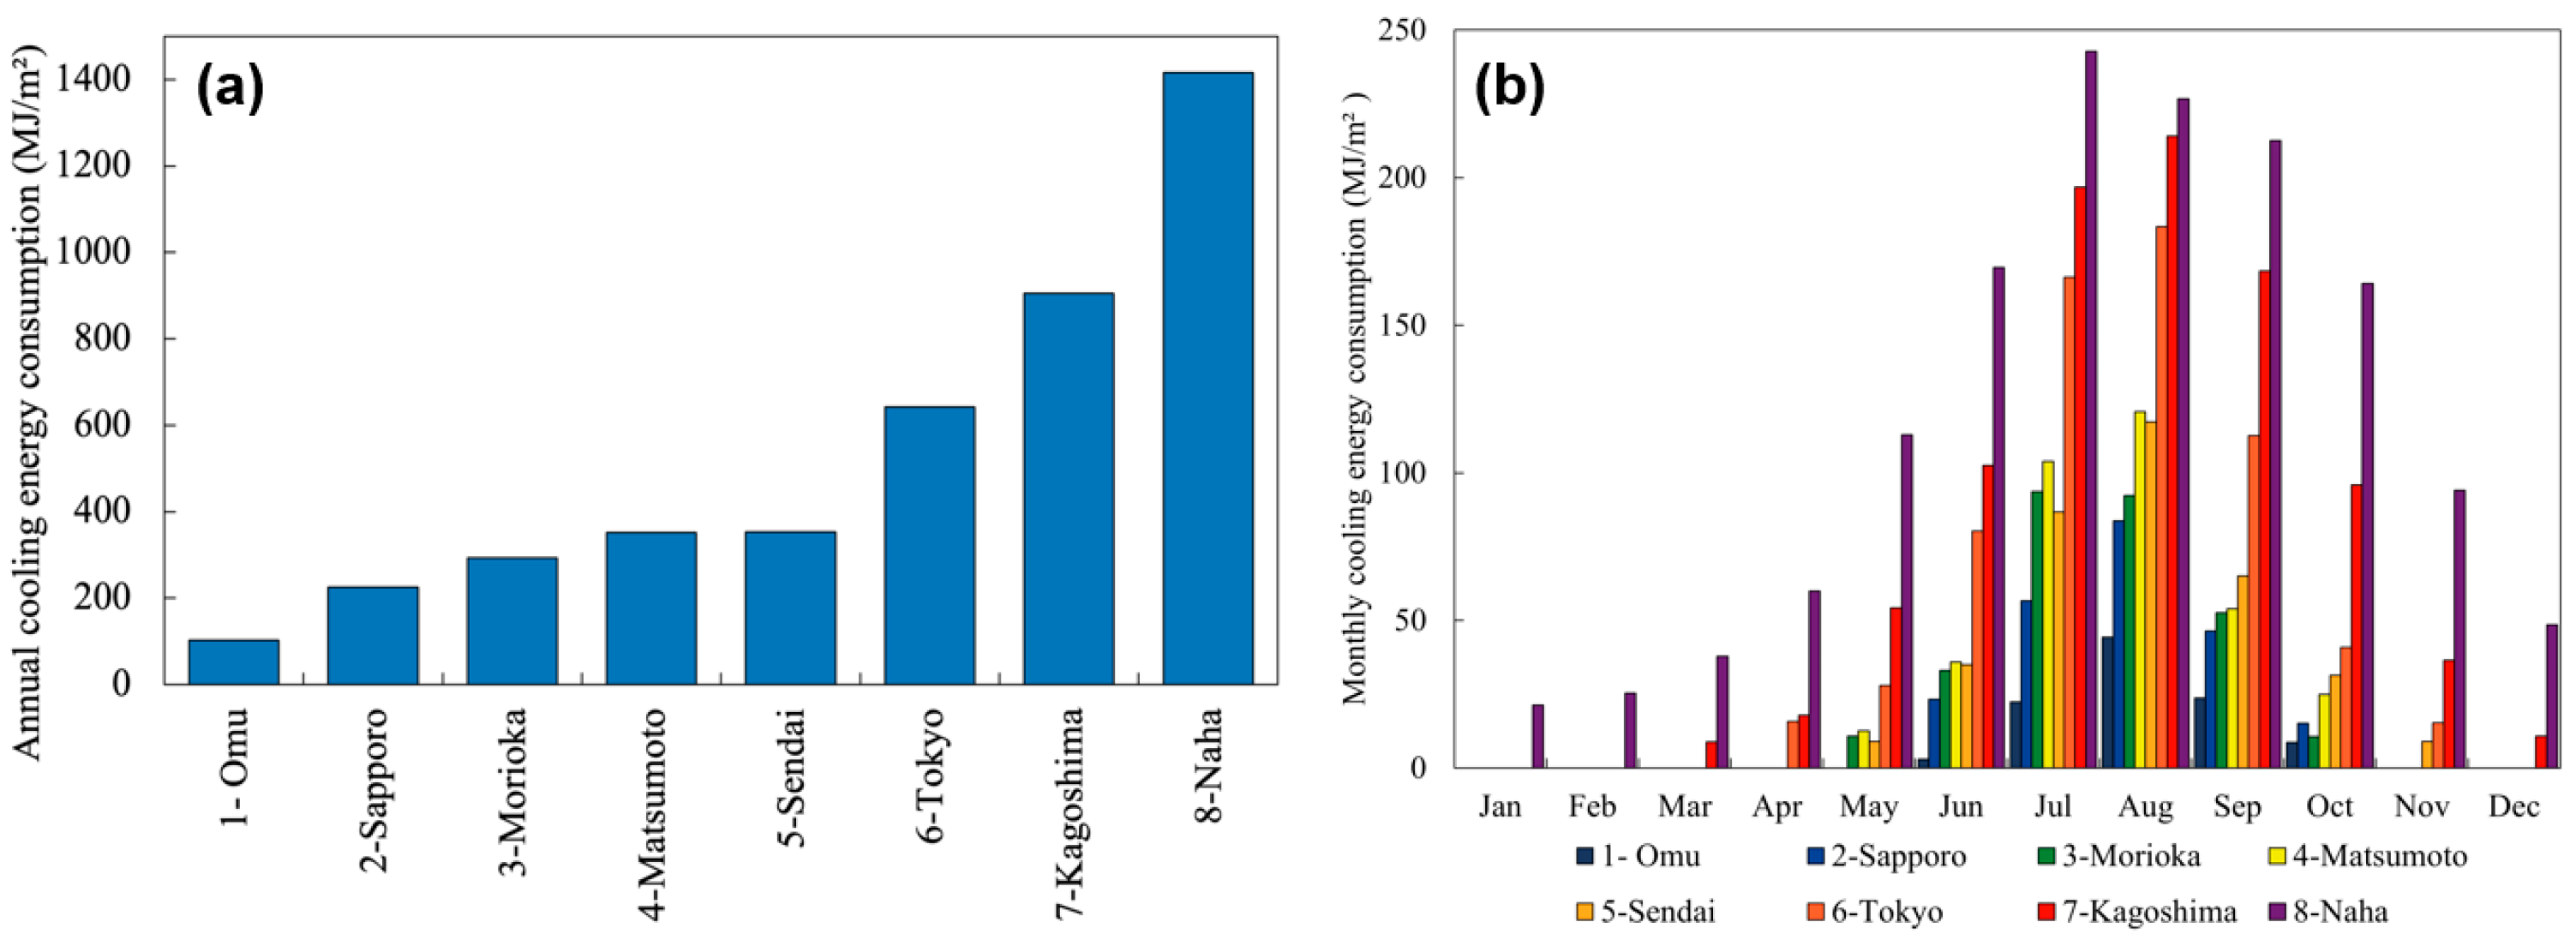
Under the baseline condition without natural ventilation (NV), cooling-energy demand across the eight climate zones in Japan exhibits a pronounced spatial gradient, reflecting the combined influence of climatic forcing and building thermal response. Figure 6 presents both annual and monthly cooling-energy demand for each region.
Figure 6.
Monthly and annual cooling-energy consumption across different climatic regions without natural ventilation: (a) annual cooling-energy consumption; (b) monthly cooling-energy consumption.
At the annual scale (Figure 6a), cooling demand increases systematically from cold regions (e.g., Omu, Sapporo), where values are generally below 300 MJ/m2, to warm-humid regions such as Kagoshima and Naha, where annual demand exceeds 1400 MJ/m2. This nearly fivefold difference indicates that cooling demand is strongly governed by the intensity and duration of unfavorable outdoor temperature–humidity conditions, particularly in the absence of passive heat dissipation mechanisms. At the monthly scale (Figure 6b), distinct temporal structures of cooling demand emerge across climate zones. In cold regions, cooling demand is confined to a short summer period (July–August), with limited duration and relatively low peak intensity. This indicates that cooling demand is primarily event-driven, associated with transient high-temperature episodes.
In temperate regions, the cooling period extends from early summer to early autumn, accompanied by higher peak values and longer durations. This extended cooling window suggests that cooling demand is not only driven by peak outdoor temperatures but also influenced by the persistence of elevated temperatures and the accumulation of heat within the building. In warm-humid and subtropical regions, cooling demand exhibits a high-persistence pattern, characterized by both a high magnitude and an extended duration from late spring to early autumn. This indicates that indoor heat cannot be effectively dissipated during nighttime, leading to sustained cooling requirements.
These results suggest that cooling-energy demand is governed not only by outdoor temperature levels but also by the persistence of thermal conditions and the building’s ability to dissipate heat, which varies significantly across climate zones.
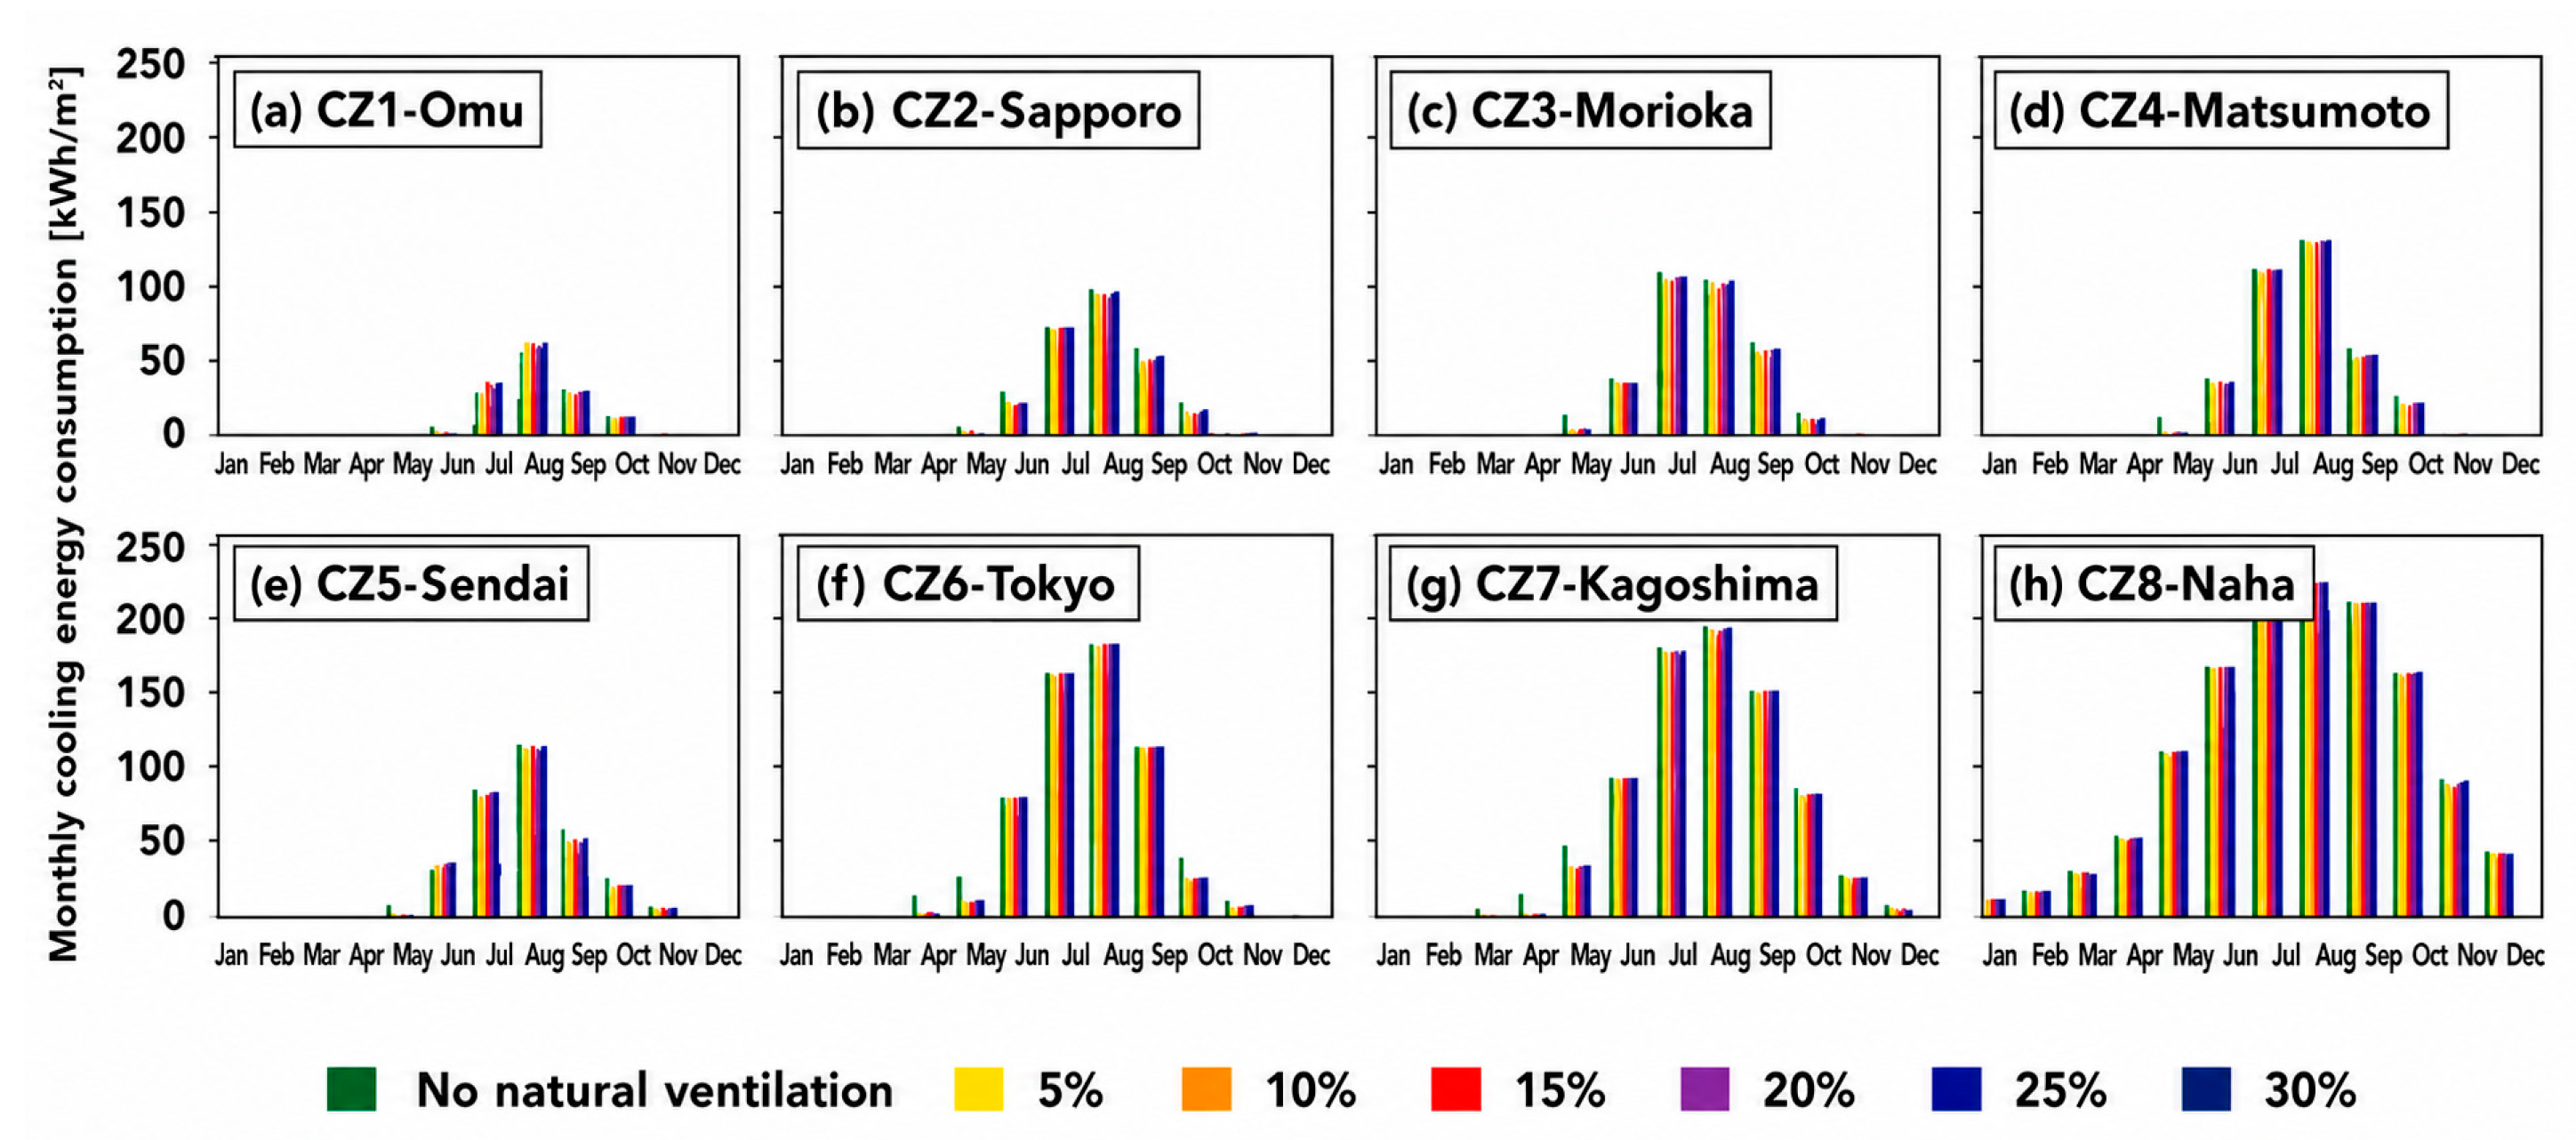
To further investigate the role of natural ventilation, the sensitivity of cooling-energy demand to window opening area was analyzed across all climate zones (Figure 7). Cooling demand generally decreases under NV in most regions; however, the response to increasing opening area is not uniformly monotonic, and Omu does not exhibit a net cooling-energy reduction relative to the no-NV baseline.
Figure 7.
Monthly energy consumption for different window openings.
The response to opening area differs substantially across climate zones. Among the six non-zero opening scenarios, the 5% opening condition yields the lowest annual cooling-energy demand in Sapporo, Morioka, Matsumoto, Sendai, Tokyo, Kagoshima, and Naha, whereas Omu shows its lowest value at 30%. Therefore, increasing opening area does not necessarily lead to greater annual cooling-energy savings, indicating a nonlinear and climate-dependent response.
These results indicate that the cooling effectiveness of NV cannot be inferred solely from opening size but is governed by the interaction between climatic conditions and building thermal response. More importantly, the observed regional differences indicate that climate affects not only the magnitude of cooling-energy savings but also the way in which additional ventilation capacity is converted into cooling benefits. Therefore, the same increase in opening area may yield substantially different marginal benefits across climate zones.
Based on the observed regional differences, three characteristic response patterns can be identified in terms of how cooling demand responds to increased ventilation potential.
First, in cold regions, cooling demand exhibits a temperature-dominated response, in which ventilation primarily enhances sensible heat removal during short periods of high outdoor temperature. Second, in temperate regions, cooling demand is strongly influenced by thermal accumulation processes, and ventilation effectiveness is associated with its ability to enhance diurnal heat dissipation and reduce multi-day heat buildup. Third, in warm-humid regions, cooling demand becomes constrained by heat–moisture interactions, in which high humidity limits the effectiveness of ventilation-driven cooling, resulting in reduced sensitivity to increased opening area.
It should be noted that these response patterns are not strictly discrete categories but rather represent dominant tendencies along a climatic gradient. The results highlight that the same ventilation strategy can produce fundamentally different energy outcomes depending on regional climatic conditions and building thermal behavior.
3.4. Nonlinear Response of Cooling-Energy Savings to Window Opening Area
To quantitatively evaluate the impact of window opening area on cooling-energy demand, the no-natural-ventilation condition (A = 0) is adopted as a unified baseline, representing a fully mechanically conditioned scenario without a passive cooling contribution. This baseline allows the relative cooling performance of natural ventilation (NV) to be consistently assessed across climate zones.
For each climate zone i, the annual cooling-energy demand under a given window opening area A is denoted as , while represents the baseline condition. The absolute energy reduction is defined as Equation (1).
To enable cross-regional comparison under substantially different baseline energy levels, a relative energy-saving rate is further defined as Equation (2). This normalization allows the sensitivity of cooling demand to window opening area to be compared independently of absolute climatic differences.
To characterize the variation trend of the energy-saving rate with increasing window opening area, a low-order polynomial was used as a descriptive fitting function for each climate zone (Equation (3)). The fitting is intended only to provide a smooth representation of the simulated response within the examined opening-area range, rather than to establish a physically derived functional relationship.
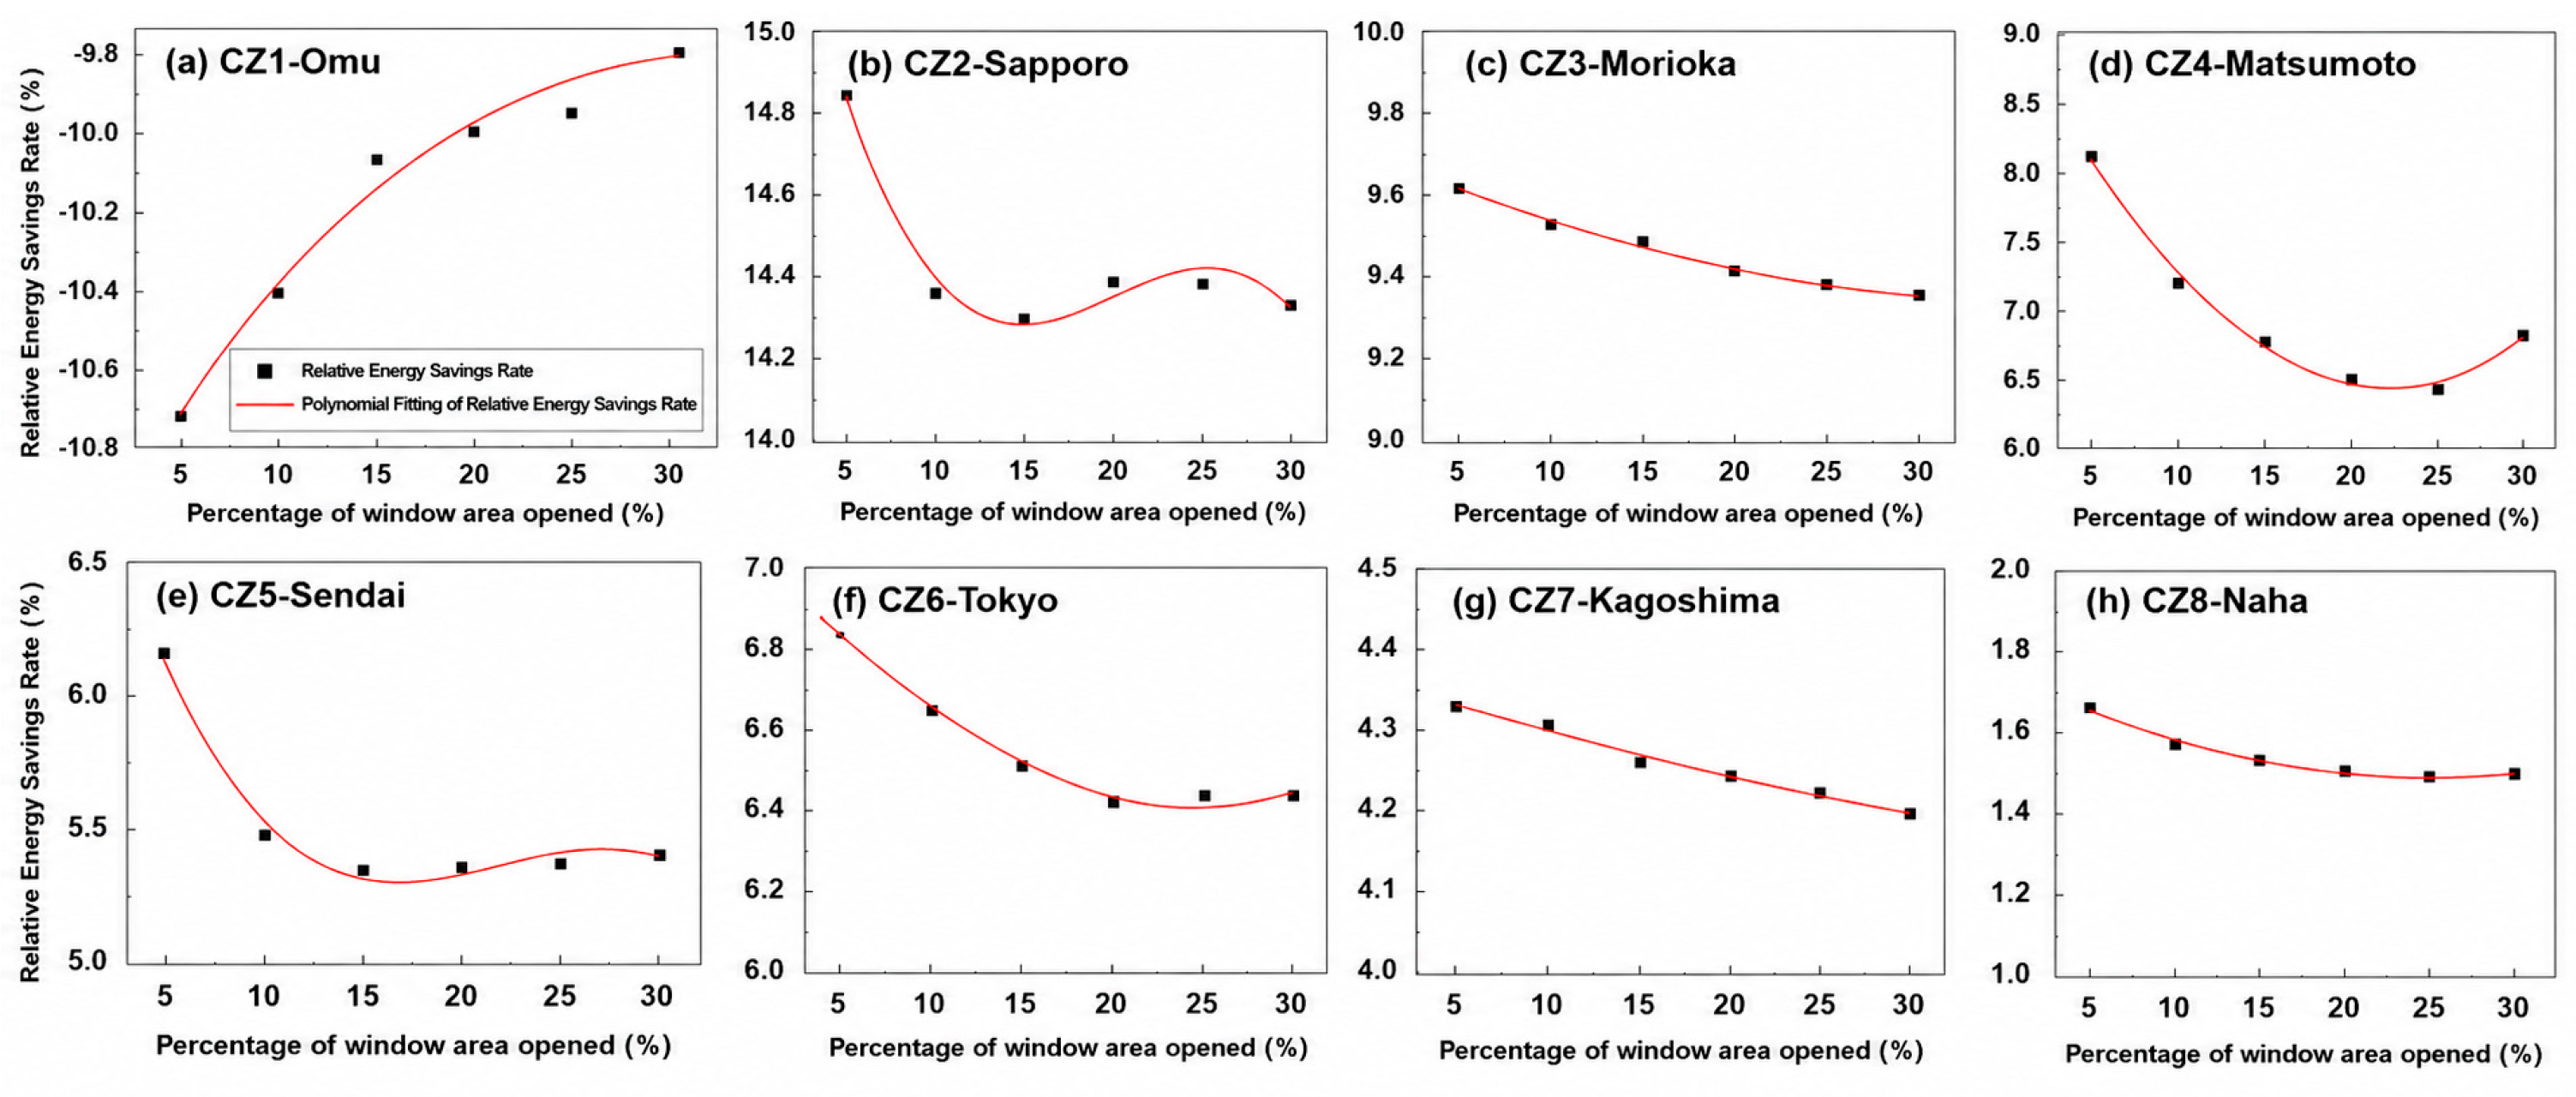
The six simulated opening scenarios constitute the primary basis for interpreting the opening-area response. The polynomial curves in Figure 8 are included only as descriptive guides to visualize the response within the examined range and are not used as evidence of an underlying physical or predictive relationship.
Figure 8.
Relative energy-saving rates across different regions and their fitting results.
The fitting was performed only for the non-zero opening scenarios (A = 5–30%), whereas A = 0 was used solely as the baseline for calculating the relative energy-saving rate in Equation (2). Therefore, the fitted intercept ai should not be interpreted as the energy-saving rate at A = 0, and the fitted curves are not intended for extrapolation outside the simulated opening-area range.
The parameters ai, bi, ci, and di represent the fitted coefficients, and the results are summarized in Table 2. The polynomial order was selected according to the curvature required to describe the simulated response within the examined range. For cases where the cubic term was not required, di was set to zero and Equation (3) consequently reduced to a quadratic form. The coefficients and R2 values in Table 2 are reported only to document the descriptive curves shown in Figure 8 and are not used for statistical inference or model validation.
Table 2.
Parameters of the fitted polynomial for relative energy savings across different regions.
Despite similar overall nonlinear trends, the response patterns differ substantially across climate zones. The cold-region cases do not exhibit a uniform response. In Omu, the relative energy-saving rate remains negative within the examined opening-area range, indicating that NV does not provide a net annual cooling-energy benefit under the adopted simulation conditions. In contrast, Sapporo and Morioka maintain positive energy-saving rates, although the additional benefit associated with increasing opening area remains limited. This distinction indicates that very low baseline cooling demand can substantially alter the relative effectiveness of NV in the coldest climate conditions. For Omu, the low baseline cooling demand amplifies the relative magnitude of the observed difference but does not account for its negative sign; the negative value represents the net outcome of the simulated ventilation scenario relative to the no-NV baseline.
In temperate regions (Matsumoto, Sendai, and Tokyo), the response curve exhibits a more gradual increase followed by a clear saturation trend. The stronger curvature indicates that the effectiveness of increasing opening area is influenced by the interplay between daytime heat accumulation and nighttime heat dissipation, resulting in a progressively reduced marginal benefit. In warm-humid and subtropical regions (Kagoshima, Naha), the response is characterized by weak sensitivity and early saturation. Increasing the opening area yields only limited additional energy savings, indicating that ventilation effectiveness is constrained under high humidity conditions, where increased airflow does not proportionally enhance cooling performance.
These results demonstrate that the relationship between window opening area and cooling-energy demand is strongly climate-dependent and inherently nonlinear.
Despite the overall nonlinear response, the patterns differ substantially across climate zones. In Omu, the relative energy-saving rate remains negative throughout the examined opening-area range, although 30% represents the best-performing non-zero scenario. In the other seven cities, positive annual energy savings are observed, with the highest saving rate occurring at the 5% opening condition among the examined non-zero scenarios. Further increases in opening area do not result in higher annual savings. These results indicate that the opening-area response is nonlinear and climate-dependent rather than universally increasing toward saturation.
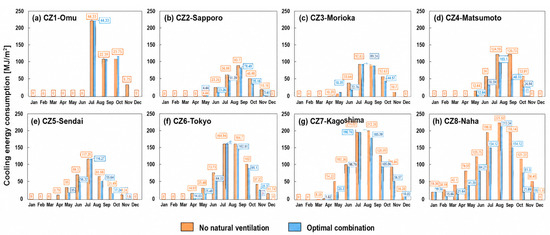
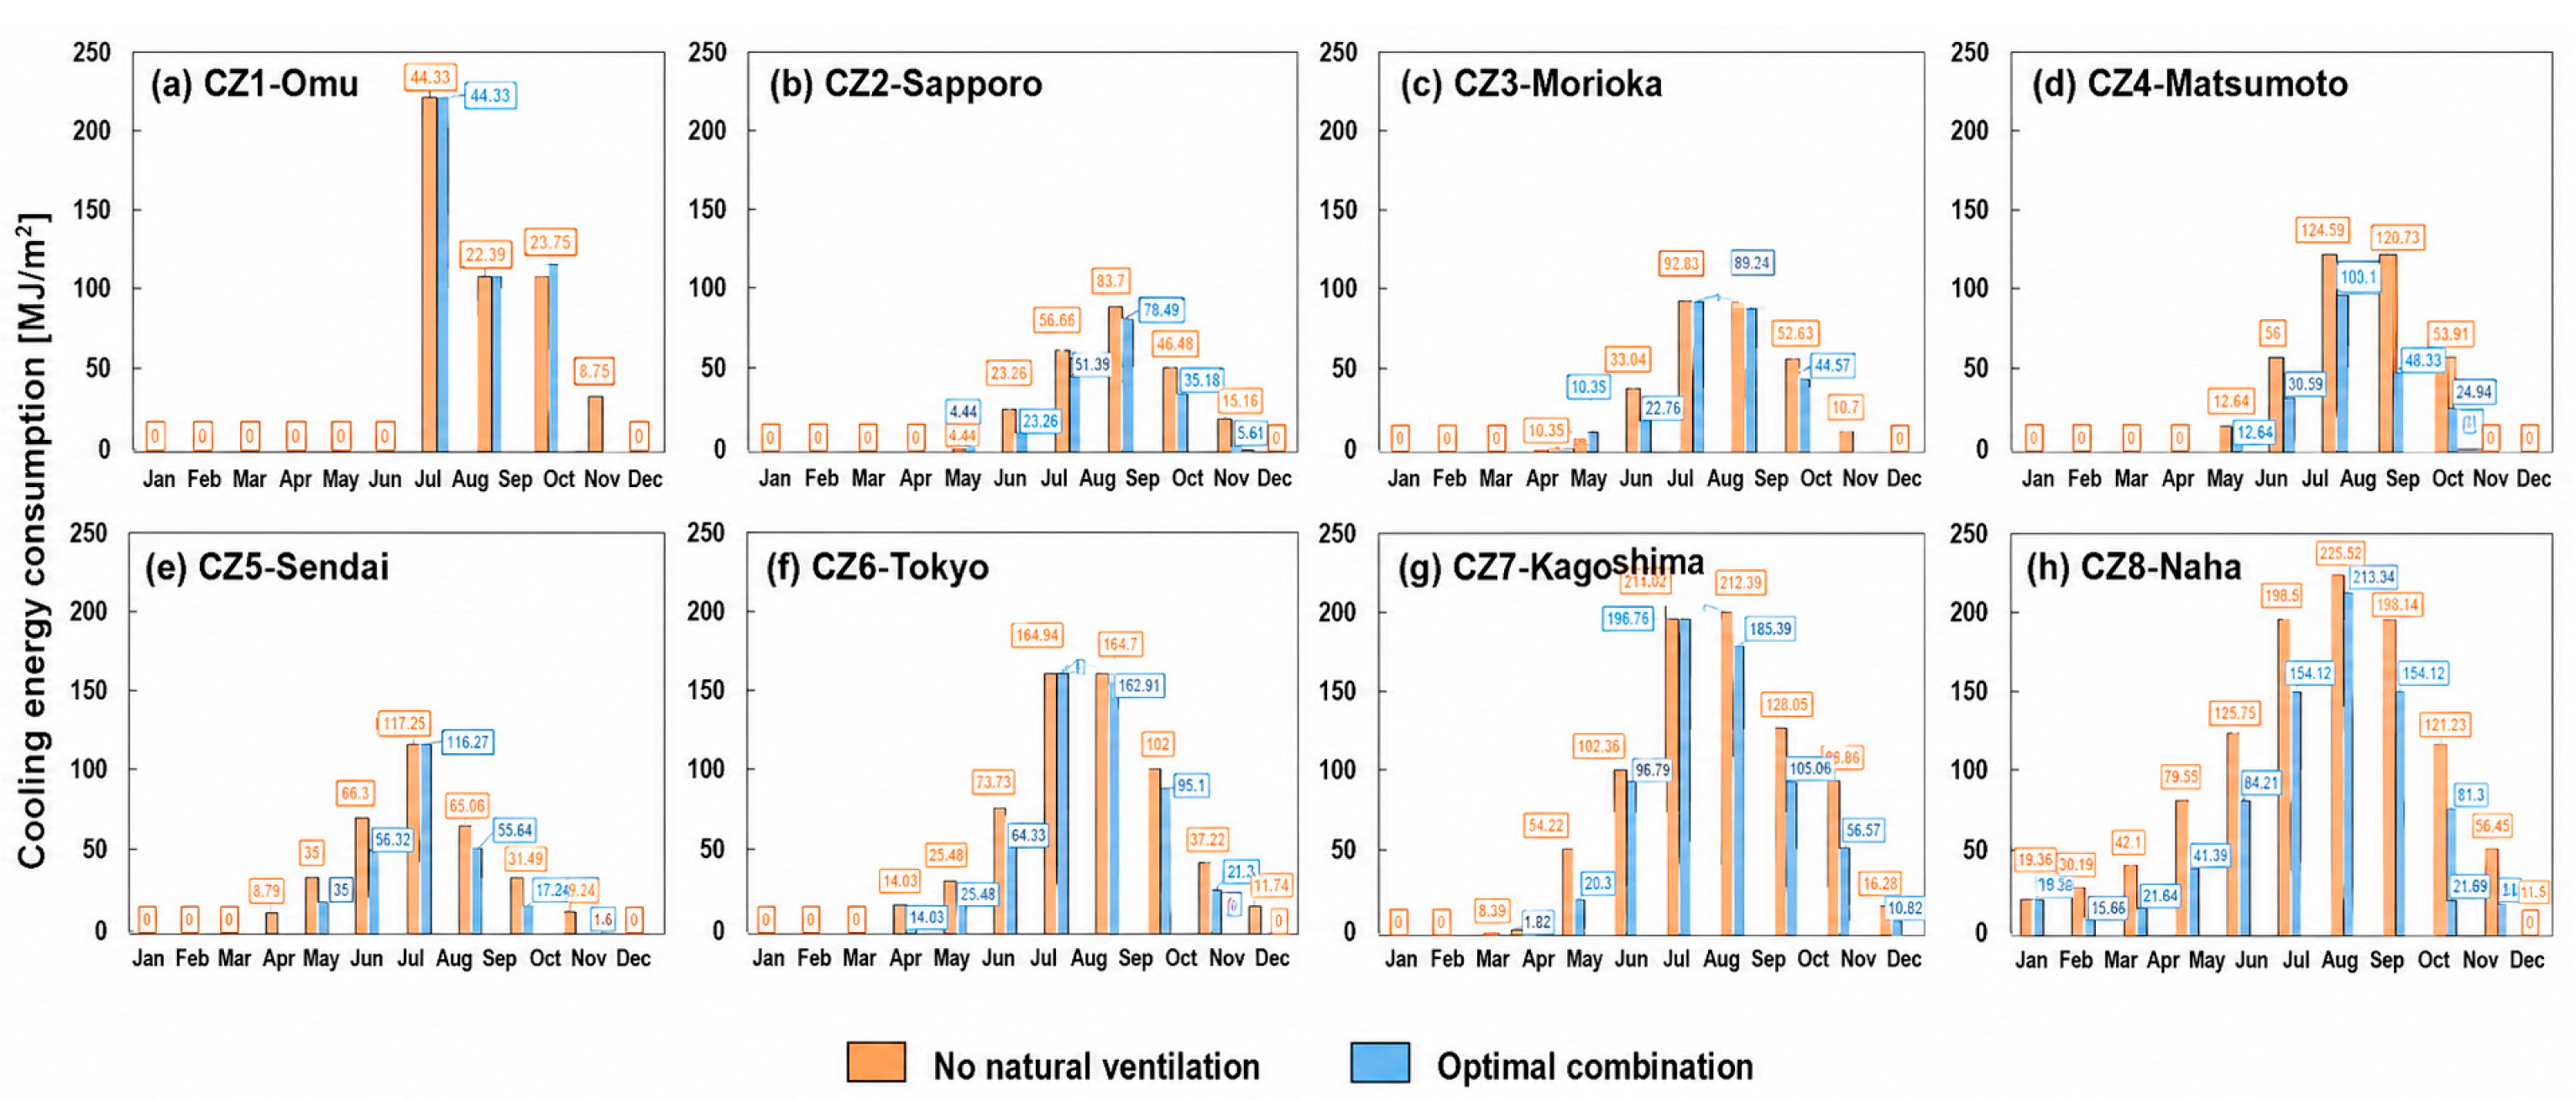
To further examine the seasonal characteristics of the most favorable simulated ventilation scenario, the best-performing opening condition was identified separately for each city from the six non-zero opening scenarios (5%, 10%, 15%, 20%, 25%, and 30%). The selected scenario was defined as the opening condition yielding the lowest annual cooling-energy demand, equivalently, the highest annual relative energy-saving rate among the simulated cases. Based on this criterion, the selected opening ratios were 30% for Omu and 5% for Sapporo, Morioka, Matsumoto, Sendai, Tokyo, Kagoshima, and Naha. Figure 9 compares the monthly cooling-energy demand under these selected scenarios with the corresponding no-NV baseline.
Figure 9.
Monthly cooling-energy demand under the no-NV baseline and the best-performing simulated opening scenario in each region.
In cold regions, energy savings are concentrated within a short summer period (July–August), forming a narrow and pronounced peak. This indicates that NV effectiveness is limited by the short duration of favorable climatic conditions but achieves relatively high efficiency during these periods. In temperate regions, the energy-saving window extends over a longer period (June–September), with broader peaks and sustained contributions. This reflects the role of NV in mitigating cumulative heat buildup over extended warm periods. In warm-humid and subtropical regions, energy savings persist over a much longer duration (May–October), forming a wide plateau structure. Despite lower marginal effectiveness, the high baseline cooling demand results in substantial total energy savings.
From a cross-regional perspective, three characteristic response behaviors can be identified: (1) in cold regions, NV effectiveness is primarily associated with direct temperature-driven cooling during short favorable periods; (2) in temperate regions, NV effectiveness is linked to its ability to modulate thermal accumulation through enhanced diurnal heat exchange; (3) in warm-humid regions, NV effectiveness is constrained by environmental conditions that limit heat dissipation, leading to reduced sensitivity to increased opening area. These behaviors should be interpreted as dominant tendencies rather than discrete categories, reflecting the continuous variation of climatic and building-response conditions across regions.
Taken together, these results extend the analysis from a conventional comparison of NV availability or total energy-saving potential to the response process between climatic constraints, indoor thermal dynamics, and cooling-energy reduction. The main contribution is therefore not merely the identification of regional differences in NV performance, but the demonstration that climatic conditions also regulate the sensitivity and saturation characteristics of the opening-area–energy-saving relationship.
4. Conclusions
This study develops a process-oriented evaluation framework to analyze natural ventilation (NV) performance across multiple climate zones and applies it to eight representative regions in Japan. By linking climatic suitability, indoor thermal response, and cooling-energy demand, the results provide a consistent basis for examining how NV effectiveness varies under different climatic conditions.
The cross-climate analysis reveals that the effectiveness of NV is not governed by a single meteorological parameter, but is associated with the combined influence of outdoor temperature–humidity conditions, building thermal response, and diurnal heat exchange processes. The results show that the limiting factors for NV feasibility exhibit a gradual transition across climate zones, shifting from predominantly low-temperature constraints in cold regions to coupled heat–humidity constraints in warm-humid regions.
The analysis of indoor thermal response further indicates that NV influences building cooling performance through its interaction with thermal dynamics rather than through instantaneous air exchange alone. In particular, NV contributes to reducing peak indoor temperatures and facilitating nighttime heat dissipation, thereby modifying the temporal evolution of indoor temperature under summer conditions. These effects are more pronounced in regions where thermal accumulation plays a significant role in shaping indoor thermal conditions.
In addition, the relationship between window opening area and cooling-energy demand is nonlinear, climate-dependent, and not universally monotonic. In seven of the eight cities, the 5% opening condition provides the best annual cooling-energy performance among the examined non-zero scenarios. These results indicate that larger openings do not necessarily produce greater annual cooling-energy savings.
From a design perspective, the results imply that NV strategies should be adapted to regional climatic conditions. In cold regions, where NV feasibility is limited to short periods, strategies focusing on effective use of favorable conditions may provide the most benefit. In temperate regions, where thermal accumulation is more pronounced, enhancing nighttime ventilation may help reduce cooling demand. In warm-humid regions, where NV effectiveness is constrained, additional measures such as humidity control or hybrid ventilation strategies may be required to achieve meaningful energy savings.
The scope and limitations of this study should also be acknowledged. The analysis is based on eight representative Japanese climatic locations, a standardized detached residential building, Typical Meteorological Year data, and predefined temperature–humidity criteria; therefore, the quantitative findings should be interpreted within these conditions, without explicitly accounting for interannual climate variability, occupant-driven window operation, or other environmental constraints. Because the present analysis represents typical climatic conditions, the identified nonlinear relationships may shift under warmer or more humid future climates, particularly through changes in NV-suitable periods and the sensitivity of cooling-energy savings to opening area. Future studies could therefore extend the framework to different building types, operational behaviors, and projected climatic conditions to further evaluate the generalizability and robustness of the identified nonlinear response.
In addition, a fixed building orientation and surrounding-condition assumption was adopted across locations; therefore, city-specific differences in prevailing wind direction, terrain, and urban roughness, which may influence wind-driven natural ventilation, were not explicitly represented.
Author Contributions
Conceptualization, formal analysis, investigation, visualization, and writing—original draft preparation, Y.R.; methodology, software, data curation, validation, and writing—review and editing, X.K.; conceptualization, supervision, project administration, and writing—review and editing, T.W.; data curation, validation, and investigation, Q.Z.; resources, supervision, project administration, and funding acquisition, W.G.; methodology, validation, and writing—review and editing, Y.L. All authors have read and agreed to the published version of the manuscript.
Funding
The authors gratefully acknowledge the support of the China Scholarship Council (Grant No. 202508050053) and the JSPS KAKENHI Grant-in-Aid for Research Activity Start- up (Grant Number: 24K23002).
Data Availability Statement
Restrictions apply to the availability of the meteorological data used in this study. These data were obtained through The University of Kitakyushu and are available from the authors with the permission of The University of Kitakyushu. The simulation results generated in this study are available from the corresponding author upon reasonable request.
Conflicts of Interest
The authors declare no conflicts of interest. The funders had no role in the design of the study; in the collection, analyses or interpretation of data; in the writing of the manuscript; or in the decision to publish the results.
References
- Kim, J.T.; Yu, C.W.F. Sustainable development and requirements for energy efficiency in buildings—The Korean perspectives. Indoor Built Environ. 2018, 27, 734–751. [Google Scholar] [CrossRef] [Scilit]
- Gupta, A.K.; Thamida, S.K. Designing a compact thermal air steriliser with recirculation for improved indoor environmental quality: Experimentation, modelling and simulation. Indoor Built Environ. 2026, 35, 664–676. [Google Scholar] [CrossRef] [Scilit]
- Dakyen, M.M.; Özdenefe, M.; Dağbaşı, M. A multi-stage multi-objective optimization method for balancing the impacts of energy efficiency strategies on buildings. Indoor Built Environ. 2025, 35, 383–409. [Google Scholar] [CrossRef] [Scilit]
- Khdair, A.I.; Aburumman, G.A.; Tahmasbi, F.; Tahmasebi, M.; Kalbasi, R.; Afrand, M. Advancing natural ventilation in sustainable architecture: Mechanisms, innovations, and climate-responsive design for energy-efficient buildings. Renew. Sustain. Energy Rev. 2026, 226, 116314. [Google Scholar] [CrossRef] [Scilit]
- Montgomery, J.F.; Storey, S.; Bartlett, K. Comparison of the indoor air quality in an office operating with natural or mechanical ventilation using short-term intensive pollutant monitoring. Indoor Built Environ. 2015, 24, 777–787. [Google Scholar] [CrossRef] [Scilit]
- Safdari, M.; Dennis, K.; Gharabaghi, B.; Siddiqui, K.; Aliabadi, A.A. Implications of latent and sensible building energy loads using natural ventilation. J. Build. Eng. 2024, 96, 110447. [Google Scholar] [CrossRef] [Scilit]
- Xie, X.; Luo, Z.; Grimmond, S.; Sun, T. Impact of building density on natural ventilation potential and cooling energy saving across Chinese climate zones. Build. Environ. 2023, 244, 110621. [Google Scholar] [CrossRef] [Scilit]
- Lin, Y.; Yuan, X.; Yang, W.; Chan, M.; Tian, L. Impact of outdoor particulate matter 2.5 pollution on natural ventilation energy saving potential in office buildings in China. J. Build. Eng. 2023, 76, 107425. [Google Scholar] [CrossRef] [Scilit]
- Bamdad, K.; Matour, S.; Izadyar, N.; Omrani, S. Impact of climate change on energy saving potentials of natural ventilation and ceiling fans in mixed-mode buildings. Build. Environ. 2022, 209, 108662. [Google Scholar] [CrossRef] [Scilit]
- Tong, Z.; Chen, Y.; Malkawi, A.; Liu, Z.; Freeman, R.B. Energy saving potential of natural ventilation in China: The impact of ambient air pollution. Appl. Energy 2016, 179, 660–668. [Google Scholar] [CrossRef] [Scilit]
- Myroniuk, K.; Zhelykh, V.; Furdas, Y.; Jesson, M.; Mitoulis, S.-A. Energy-saving of passive ventilation systems in thermally modernized residential buildings—A review. Energy Build. 2026, 350, 116681. [Google Scholar] [CrossRef] [Scilit]
- Wang, X.; Lv, Y.; Tang, L. Spatial-temporal dispersion of environmental pollutants in high-rise corridor-style apartment buildings: Influence of wind speed and structural variability under natural ventilation. Urban Clim. 2025, 64, 102710. [Google Scholar] [CrossRef] [Scilit]
- Liu, W.; Liang, Q.; Wang, X.; Ji, J.; Yao, C.; Li, L.; Jiang, G.P.; Luo, Y.; Huang, Y. Effect of natural and mechanical ventilation on indoor formaldehyde concentration under varying seasonal conditions. J. Build. Eng. 2025, 116, 114615. [Google Scholar] [CrossRef] [Scilit]
- Rabani, M.; Petersen, A.J.; Steneng, C.; Utstøl, S.; Halla, H.; Liaøy, A.R. Quantifying greenhouse gas emissions from HVAC—A case study of natural, hybrid and mechanical ventilation strategies. J. Build. Eng. 2025, 112, 113642. [Google Scholar] [CrossRef] [Scilit]
- López Plazas, F.; Sáenz de Tejada, C. Natural ventilation to improve indoor air quality (IAQ) in existing homes: The development of health-based and context-specific user guidelines. Energy Build. 2024, 314, 114248. [Google Scholar] [CrossRef] [Scilit]
- Lin, P.; Qin, H.; Lau, S.S.Y.; Wei, Q. Impact of unit type and configuration on indoor natural ventilation performance of high-rise, high-density residential buildings in Hong Kong. Build. Environ. 2025, 269, 112444. [Google Scholar] [CrossRef] [Scilit]
- Teng, X.; Oo, M.L.; Ge, J.; Wong, N.H.; Fan, Y. The improvement of wind comfort and natural ventilation in high-rise building vertical gardens with adjustable louver angles. Build. Environ. 2025, 285, 113638. [Google Scholar] [CrossRef] [Scilit]
- Sarna, I.; Ferdyn-Grygierek, J. Natural ventilation for thermal comfort: A simulation-based comparison of manual and automated window control strategies in temperate climate housing. Build. Environ. 2025, 285, 113551. [Google Scholar] [CrossRef] [Scilit]
- Yin, X.; Muhieldeen, M.W.; Razman, R.; Ee, J.Y.C.; Chiong, M.C. The potential effects of window configuration and interior layout on natural ventilation buildings: A comprehensive review. Clean. Eng. Technol. 2024, 23, 100830. [Google Scholar] [CrossRef] [Scilit]
- Chen, Y.; Ozaki, A.; Yang, X.; Arima, Y.; Li, Z.; Choi, Y. Adaptive model-based advanced natural ventilation control strategy for mixed-mode residential buildings in Japan. Build. Environ. 2025, 273, 112718. [Google Scholar] [CrossRef] [Scilit]
- Liu, H.; Lee, S.; Kim, M.; Shi, H.; Kim, J.T.; Yoo, C. Finding the optimal set points of a thermal and ventilation control system under changing outdoor weather conditions. Indoor Built Environ. 2014, 23, 118–132. [Google Scholar] [CrossRef] [Scilit]
- Germano, M.; Roulet, C.A. Multicriteria assessment of natural ventilation potential. Sol. Energy 2006, 80, 393–401. [Google Scholar] [CrossRef] [Scilit]
- Zhang, Y.; Zhai, Z.; Ding, Y.; Xiang, X.; Liu, J.; Li, J. Evolution of natural ventilation potential under urbanization: A method based on Monin-Obukhov similarity theory and surface energy balance model. Build. Environ. 2025, 284, 113470. [Google Scholar] [CrossRef] [Scilit]
- Luo, Z.; Zhao, J.; Gao, J.; He, L. Estimating natural-ventilation potential considering both thermal comfort and IAQ issues. Build. Environ. 2007, 42, 2289–2298. [Google Scholar] [CrossRef] [Scilit]
- Germano, M. Assessing the natural ventilation potential of the Basel region. Energy Build. 2007, 39, 1159–1166. [Google Scholar] [CrossRef] [Scilit]
- Yang, Q.; Lu, W.-Z.; Xu, F.; Luo, X.; Wen, B. A passive strategy for energy-saving retrofitting of courtyard dwellings and its climatic adaptability. Energy Build. 2025, 352, 116811. [Google Scholar] [CrossRef] [Scilit]
- Jiang, Z.; Kobayashi, T.; Yamanaka, T.; Sandberg, M.; Kobayashi, N.; Choi, N.; Sano, K. Validity of Orifice equation and impact of building parameters on wind-induced natural ventilation rates with minute mean wind pressure difference. Build. Environ. 2022, 219, 109248. [Google Scholar] [CrossRef] [Scilit]
- Jiang, Y.; Liu, J.; Qiu, B.; Zhang, X. Optimization of ventilation parameters for improved air distribution in residential apartments. Indoor Built Environ. 2026, 35, 277–304. [Google Scholar] [CrossRef] [Scilit]
- Simões, J.C.; Carrilho da Graça, G. Experimental validation of neural network-based prediction of natural ventilation bulk airflow rate. Energy Build. 2025, 342, 115871. [Google Scholar] [CrossRef] [Scilit]
- Emmerich, S.J.; Polidoro, B.; Axley, J.W. Impact of adaptive thermal comfort on climatic suitability of natural ventilation in office buildings. Energy Build. 2011, 43, 2101–2107. [Google Scholar] [CrossRef] [Scilit]
- Chen, X.; Zhang, Q.; Zhai, Z. Energy saving potential of a ventilation system with a latent heat thermal energy storage unit under different climatic conditions. Energy Build. 2016, 118, 339–349. [Google Scholar] [CrossRef] [Scilit]
- Li, M.; Shen, X.; Wu, W.; Cetin, K.; McIntyre, F.; Wang, L.; Ding, L.; Bishop, D.; Bellamy, L.; Liu, M. Cooling demand reduction with nighttime natural ventilation to cool internal thermal mass under harmonic design-day weather conditions. Appl. Energy 2025, 379, 124947. [Google Scholar] [CrossRef] [Scilit]
- Niyadi, S.A.; Elnabawi, M.H. Optimizing hybrid ventilation in arid Climates: A systematic review and Dubai case study. City Environ. Interact. 2025, 26, 100191. [Google Scholar] [CrossRef] [Scilit]
- Tognon, G.; Marigo, M.; De Carli, M.; Zarrella, A. Mechanical, natural and hybrid ventilation systems in different building types: Energy and indoor air quality analysis. J. Build. Eng. 2023, 76, 107060. [Google Scholar] [CrossRef] [Scilit]

Disclaimer/Publisher’s Note: The statements, opinions and data contained in all publications are solely those of the individual author(s) and contributor(s) and not of MDPI and/or the editor(s). MDPI and/or the editor(s) disclaim responsibility for any injury to people or property resulting from any ideas, methods, instructions or products referred to in the content. |
© 2026 by the authors. Licensee MDPI, Basel, Switzerland. This article is an open access article distributed under the terms and conditions of the Creative Commons Attribution (CC BY) license.