


Abstract
Against the backdrop of global sustainable development, university campuses are typical high-energy-consuming entities and important carriers for practicing green and low-carbon concepts. However, China’s unified assessment standard for green campus (GB/T 51356-2019) lacks hot-humid specific indicators, limiting scientific guidance for South China. Adopting a multilevel framework and comparative analysis approach, this study analyzes four standards issued by China, Singapore, and India regarding their frameworks, categories, weights, and scoring methods, focusing on adaptability to hot and humid environments. Results reveal significant disparities: Singapore emphasizes energy efficiency (47% weight) with streamlined certification; Taiwan of China focuses on operational performance and practical feasibility of indicators; India attaches greater importance to process verification and quantitative evaluation rationality; the assessment standard for green campus shows cumbersome procedures and low-energy weight (11.2%) and lacks hot-humid indicators. The study recommends streamlining certification, establishing incentives, increasing energy efficiency weight, and supplementing hot-humid adaptive indicators such as sponge campus construction, building orientation design, and natural ventilation optimization. The research results can provide theoretical support for the revision of the assessment standard for green campus and the formulation of regional evaluation frameworks and offer a reference for sustainable campus development in hot-humid areas worldwide.
1. Introduction
With the rapid development of society and economy, environmental and energy issues have become increasingly severe. It has been proposed that ecologically sustainable development can achieve a balance between human needs and constraints. The goal of developing a sustainable society has gradually become an essential and urgent challenge facing our world [1,2,3].
China ranks first in total energy consumption and first in total greenhouse gas emissions worldwide [4,5]. To improve ecological environmental quality, the Opinions on Promoting High-Quality Urban Development issued by the Chinese government in 2025 elevates green and low-carbon development to a core principle, mandating that the concepts of green, sustainable, and low-carbon development be integrated throughout the entire process of urban planning, construction, and governance [6].
Over the past two decades, the scale of higher education has expanded rapidly. According to 2025 statistics, China had 2919 regular higher education institutions (HEIs), with 38,912,600 enrolled students (data do not cover Taiwan, China) [7]. Against the background of socioeconomic structural adjustment and the transformation of industrial production structures, the proportion of energy consumption by Chinese universities to the country’s total energy consumption is continuously increasing, which has attracted widespread attention from society [8]. Meanwhile, HEIs are micro-autonomous cities with their own governance systems, economic systems, and sociocultural systems [9]. These institutions serve as real-time laboratories for cultivating future citizens [10]. They occupy a unique position in society and possess the potential to promote and encourage societal responses to sustainability challenges faced by communities worldwide through the interaction of thousands of people on campus and contact with millions of people [11]. Therefore, governments and society are increasingly recognizing the critical role of HEIs in promoting sustainable development [12].
In 1972, the concept of “green campus” was first proposed at the United Nations Conference on the Human Environment in Stockholm, pointing out that “environmental education is needed from primary school through adult stages” [13]. After nearly 50 years of development, developed countries have continuously deepened and explored their green campus evaluation systems [14]. As a necessary approach to addressing sustainable development issues in the higher education sector, green campus construction has become an essential topic in the field of green buildings [15], and how to quantitatively evaluate related procedures in the higher education sector is a crucial issue in the process of green campus construction [16,17]. Many scholars have attempted to conduct quantitative assessments of various campus levels in terms of green campus buildings, sustainable transportation, energy consumption, resource utilization, waste disposal, and sustainable education [18,19]. For example, Amir Hajrasouliha proposed an indicator—the “Campus Score”—incorporating three potential variables: urbanization, greenness, and campus life—to explore the relationship between scores and university student satisfaction, safety, and campus sustainability, thereby enabling campus planners to select better campus design methods to create an improved physical environment [20]. Chen Shuqin reviewed the advantages and disadvantages of domestic and foreign universities’ sustainable development evaluation tools and, based on the characteristics of China’s green campus development, established a sustainable campus development evaluation system encompassing five aspects: organizational management, energy-saving resources, environmental friendliness, campus culture, and social outreach, selecting a pilot university campus for evaluation to verify the feasibility of the tool [21]. Meanwhile, governments or nongovernmental organizations (NGOs) in many countries have formulated one or more sets of assessment standards for green campuses in colleges and universities suited to their national characteristics, such as the LEED for Schools and STARS evaluation systems in the United States, BREEAM Education in the United Kingdom, the Greenmetric World University Rankings in Indonesia, and Singapore’s Green Mark for Existing Schools V2.0 [22,23]. Some developed countries have gradually shifted from early qualitative evaluation to quantitative evaluation, generally evolving from single indices to refined and classified multifaceted comprehensive index evaluations. In contrast, most developing countries’ evaluation standards remain at the stage of gradual improvement, resulting in relatively more exploration and research on evaluation systems.
Scholars are attempting to optimize green campus assessment standards to achieve greater accuracy and pertinence [24,25,26]. Foo (2013) reviewed the implementation of green campus and sustainable development projects in Malaysia, providing frameworks and guidelines for constructing green universities that other universities can learn from, along with the results of their application [27]. NikhatParvez evaluated the sustainability-related performance of India’s HEIs based on indicators and indicators listed under the United States’ Sustainability Tracking, Assessment & Rating System (STARS) and Indonesia’s University of Indonesia GreenMetric World University Ranking (UI GreenMetric WUR). It was found that Indian HEIs demonstrated greater compliance with UI green indicators, and five recommendations were provided for achieving sustainable development in Indian higher education, which would facilitate India’s targeted development of a more contextualized evaluation system [28,29].
Regarding China, given its vast territory covering several different climate types, existing evaluation standards lack precise indicators targeting specific regional climatic characteristics [30]. Existing research on green campus evaluation has evolved along two well-documented strands. The first strand focuses on the development and global diffusion of assessment frameworks. Since the concept of green campus was formally introduced at the 1972 Stockholm Conference, evaluation systems have gradually shifted from early qualitative compliance assessments to refined quantitative multi-index frameworks. Representative systems, such as LEED for Schools and BREEAM Education, developed primarily in temperate climate zones, have formed a globally recognized basic evaluation logic. However, their indicator weights and technical thresholds are calibrated for temperate climatic conditions, and their direct applicability to hot-humid regions with high cooling demand remains insufficiently discussed.
The second strand comprises comparative studies of evaluation systems. Most existing comparative studies adopt a cross-climatic-zone paradigm, benchmarking China’s national standard against mature European and American systems to identify gaps in framework design and management mechanisms. While these studies provide valuable general guidance for overall framework optimization, they lack targeted analysis of climate-adaptive indicators tailored to hot-humid conditions, where cooling energy consumption, outdoor thermal comfort, and stormwater management present distinct challenges. Furthermore, existing regional studies mostly focus on single-indicator dimensions such as building energy efficiency, with few systematic multilevel comparative analyses of mature certification systems within the same climatic zone. This gap results in optimization recommendations that lack quantitative weight evidence and operable indicator schemes.
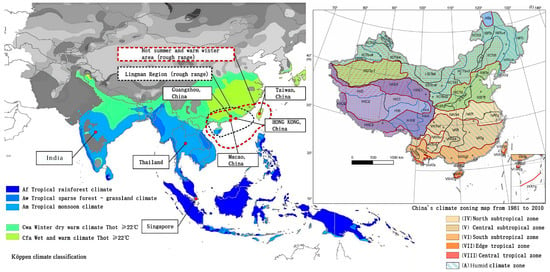
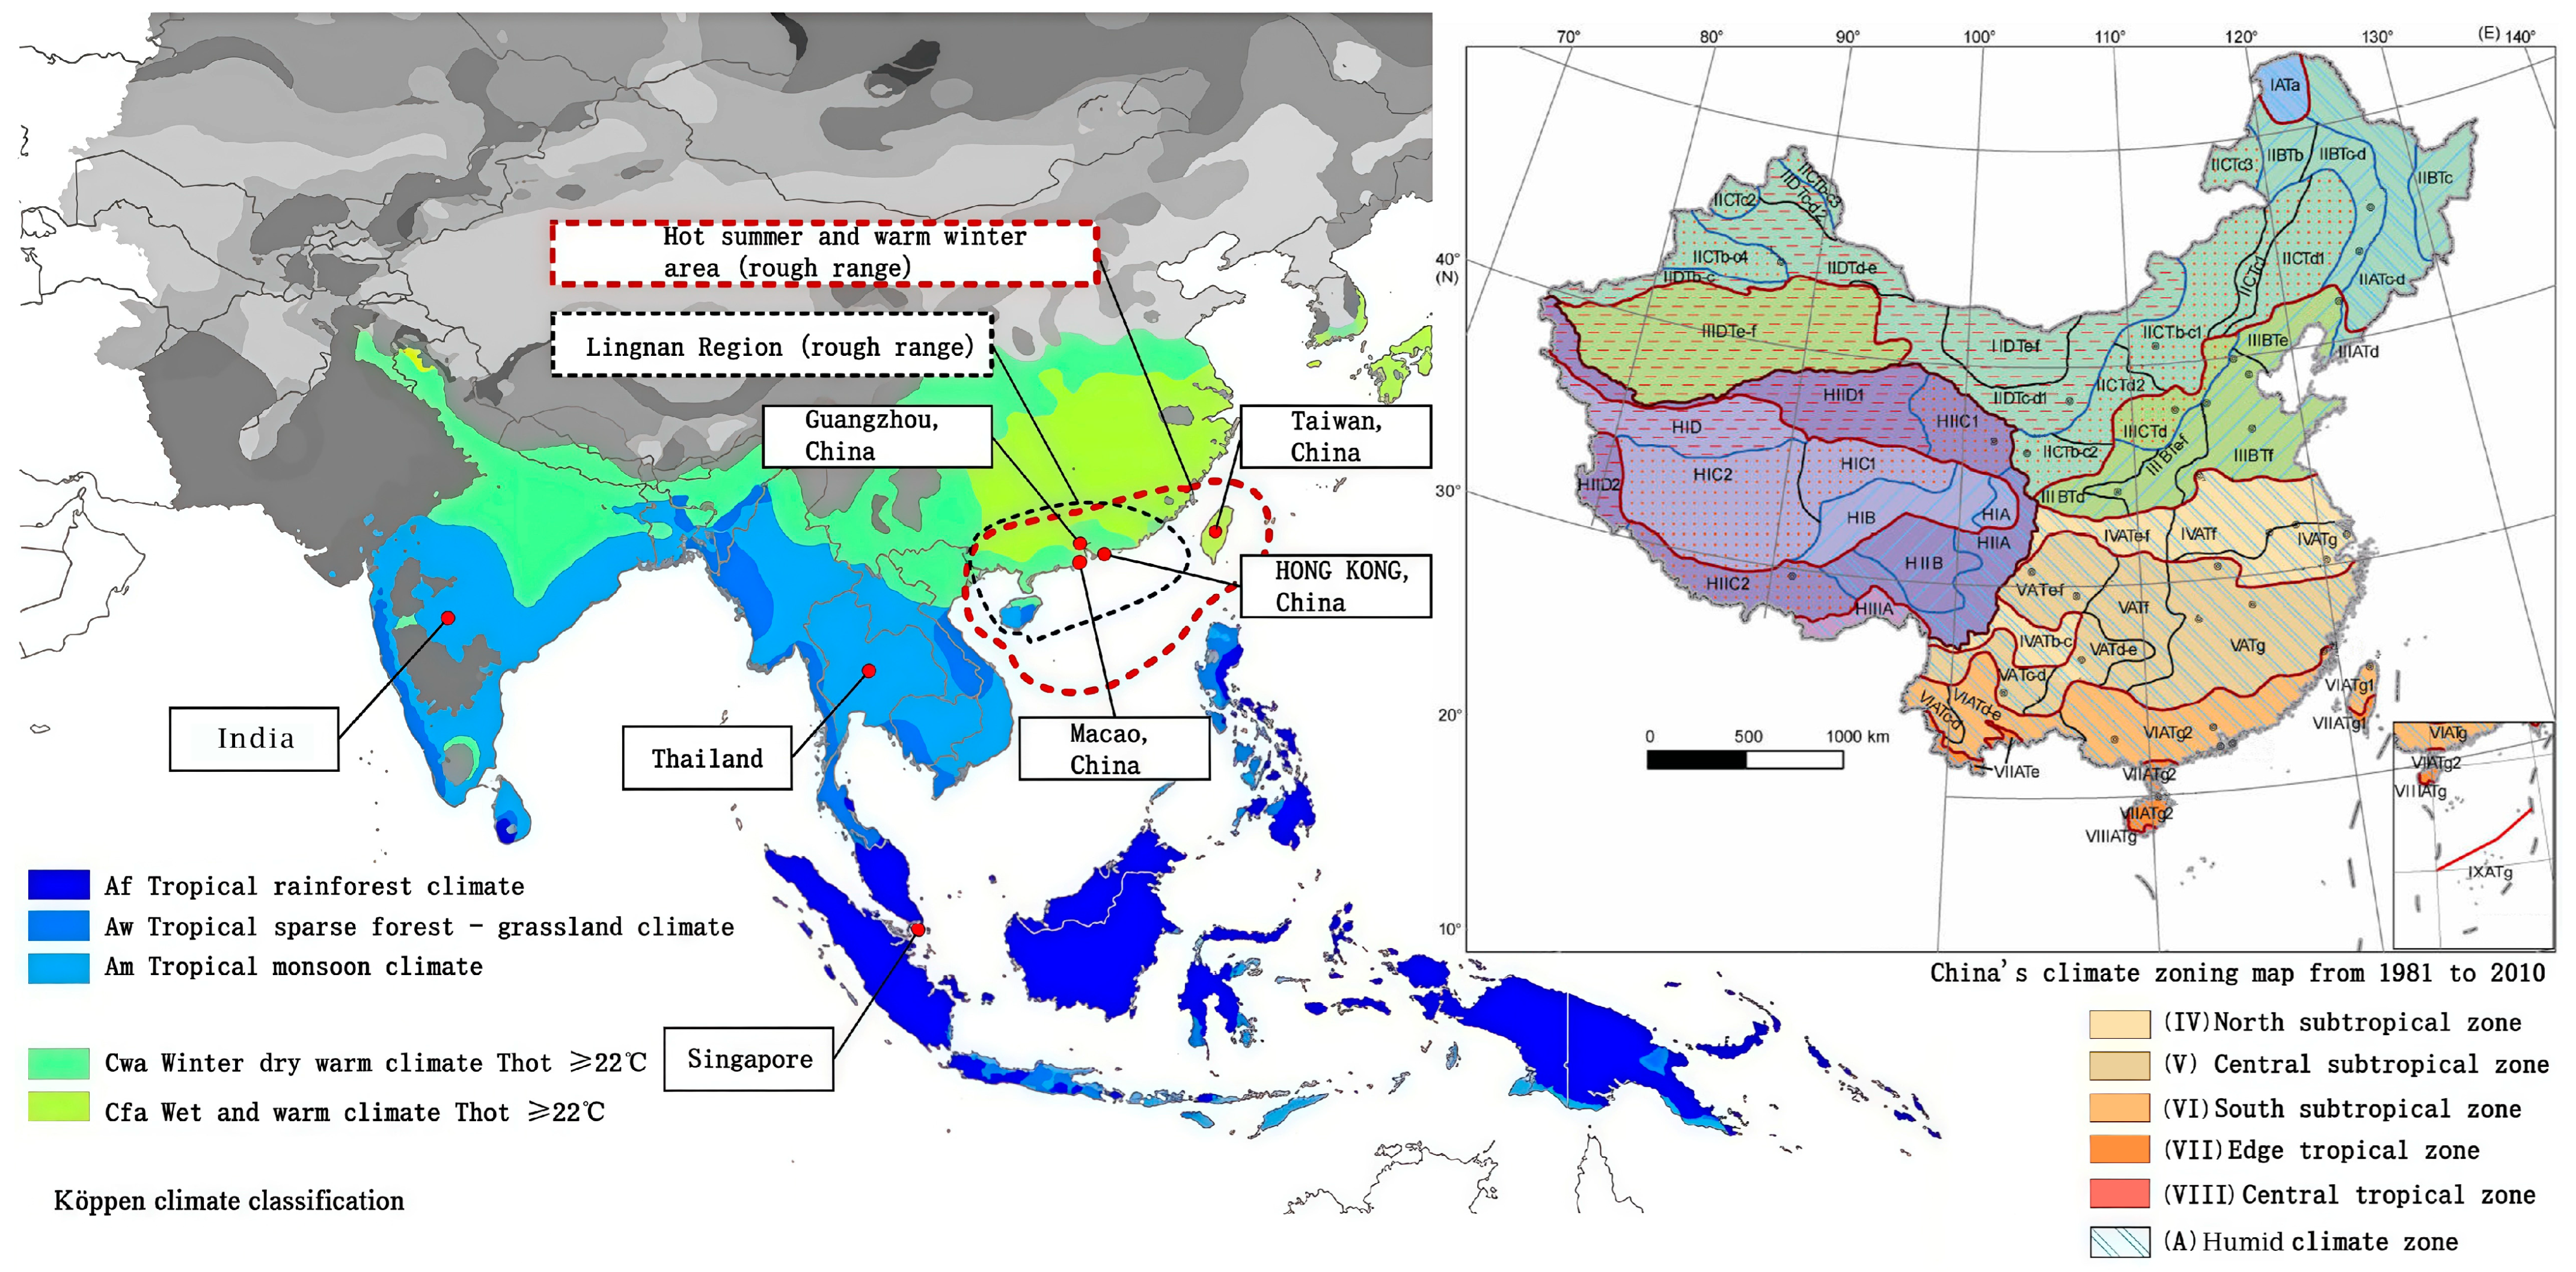
To address this research gap, this study selects four representative evaluation systems with distinct governance models from tropical and subtropical hot-humid zones and conducts a four-level comparative analysis spanning general framework, category structure, core dimensions, and specific indicators. Unlike existing cross-climatic-zone comparative studies, this work exclusively focuses on hot-humid climatic zones for four-dimensional benchmarking. Theoretically, it constructs a climate-adaptive comparative analytical framework for green campus evaluation systems; practically, it provides targeted quantitative evidence for the revision of regional adaptive green campus standards in South China and offers transferable insights for sustainable campus development in similar climate regions worldwide (Figure 1).
Figure 1.
Schematic diagram of the range of hot-humid areas [31].
2. Method
2.1. Study Scope and Sample Selection
Variations in climate characteristics, political systems, and economic conditions lead to differences in the orientation and implementation degree of evaluation criteria. Determining how to improve and assess the implementation level of “green campus” initiatives in higher education institutions represents a critical issue in the construction of sustainable universities. In green building assessment methodologies, researchers frequently employ comparative analysis approaches to systematically examine the commonalities, divergences, strengths, and weaknesses of different evaluation methods, thereby facilitating the revision and enhancement of existing assessment systems [32].
This study defines its research scope as hot-humid climatic zones in accordance with the Köppen climate classification system, covering tropical rainforest (Af), tropical savanna (Aw), tropical monsoon (Am), and humid subtropical (Cfa) climate zones. These zones share core climatic characteristics critical to green campus planning and design: high annual temperature, high humidity, strong solar radiation, and abundant rainfall. These commonalities drive similar campus energy consumption structures (dominated by space cooling) and comparable demands for outdoor thermal comfort and rainwater management, forming the climatic basis for cross-system comparison of climate-adaptive indicators. It should be noted that internal heterogeneity exists within this broad category: for example, Singapore (Af) exhibits smaller annual temperature fluctuations and higher humidity, while southern China (Cfa) features more distinct seasonal temperature variations. This study focuses on the shared climate-adaptive demands across these zones, while acknowledging that region-specific calibration is required when applying the findings to specific subclimates.
Four representative evaluation systems were selected based on three predefined criteria: (1) officially released by authoritative agencies with wide certification coverage and practical application; (2) widely implemented in typical hot-humid climate zones; and (3) equipped with a complete indicator framework and standardized scoring mechanism. The selected systems include Mainland China’s Assessment Standard for Green Campus (the Standard), Singapore’s BCA Green Mark for Existing Schools (Green Mark ES), India’s GRIHA for Existing Day Schools (GRIHA-EDS), and the latest edition of Taiwan, China’s Green Building Evaluation Manual for ECO-Community (EEWH-EC). Other assessment systems for hot-humid climatic zones were excluded for the following reasons. First, Malaysia’s GBI for Schools has limited certified campus cases and outdated public scoring details, insufficient for systematic weight decomposition. Second, Indonesia’s UI GreenMetric is a global university ranking system rather than a third-party certification standard, relying primarily on self-reported data without on-site verification, which differs fundamentally from the certification attribute of China’s national standard. The four selected systems, covering East Asia, Southeast Asia, and South Asia, represent four typical modes (unified national standard, community-compatible mode, resource-constrained efficiency mode, and developing process mode), offering sufficient representativeness for comparative analysis.
2.2. Multilevel Comparative Framework and Indicator Mapping Rules
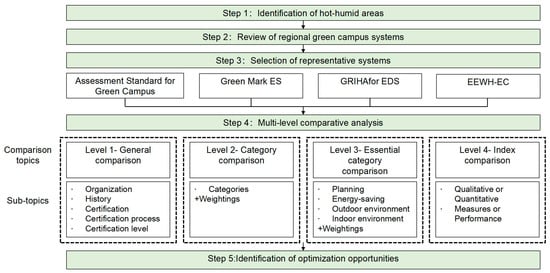
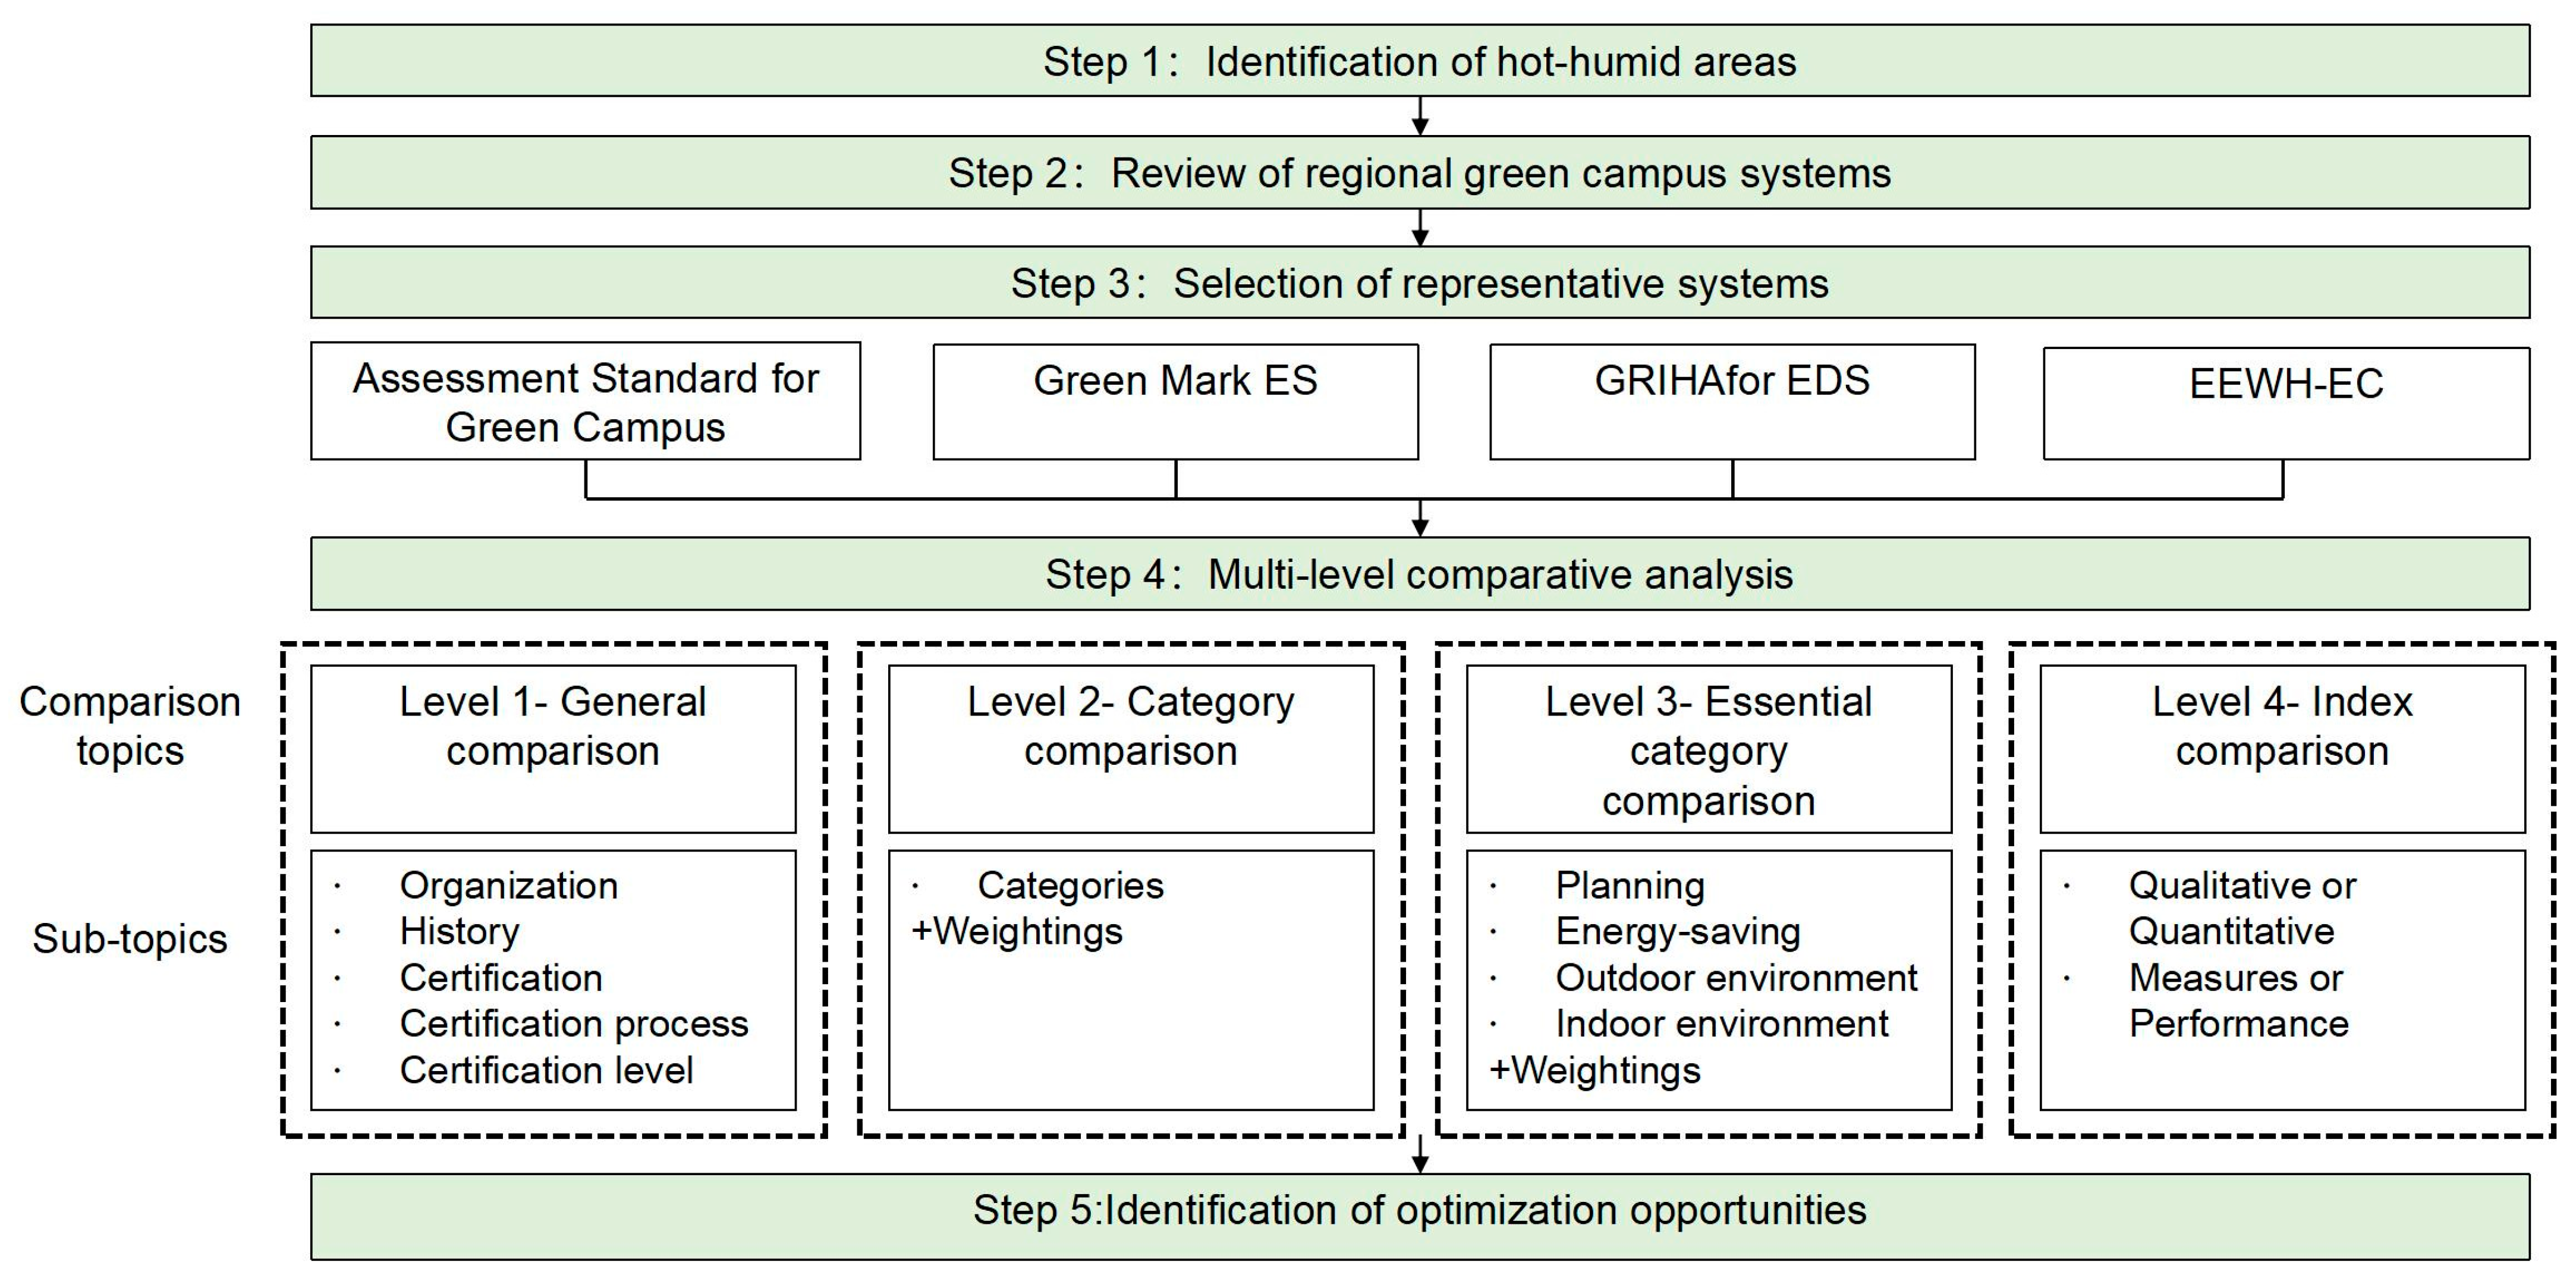
The comparative analysis is conducted across four hierarchical levels: general comparison, category comparison, essential category comparison, and index comparison (Figure 2). The general comparison encompasses the organizational structure, developmental history, certification procedures, and certification levels of the evaluation systems. The organizational structure refers to the institutions responsible for developing, operating, and updating these assessment methodologies; the developmental history delineates the publication years and evolution of existing methods; the certification procedures describe the complete procedure for obtaining evaluation and recognition levels; the certification levels indicate the hierarchical classification or assessment results based on the total score achieved.
Figure 2.
Research methodology.
Category comparison is based on the categories assigned according to the evaluation standards and the relative weights of each category. The scope of green campus evaluation systems is further subdivided into planning, ecology, energy, water resources, environmental quality, health, and operational management. The comparison of categories is based on the categories assigned according to the evaluation standards and each category’s relative weight [33].
Regarding essential category comparison, since the categories of different evaluation systems cannot be mapped one-to-one, this study focuses on planning and construction of green campus evaluation systems, energy conservation, outdoor environment, and indoor environment indicators—categories closely related to hot-humid climatic conditions across the four evaluation systems—to identify corresponding standards for each essential category. The weights of all standards listed under these key categories are compared to determine their relative importance. (The index calculation logic of Taiwan of China’s EEWH-EC system involves multidimensional complex formulas and independent axis scoring, and the single index weight cannot be directly decomposed and quantified; only the other three evaluation systems are compared here; furthermore, the weight calculation excludes prerequisite items and bonus items, calculating only the proportion of the score corresponding to the standard relative to the total score of the scoring items.)
At the index comparison level, all disaggregated indicators are coded and statistically analyzed from two independent dimensions to reveal the scientific rigor and evaluation orientation of each system. Clear classification rules are established uniformly across all systems: quantitative indicators are evaluated based on measurable numerical thresholds with standardized calculation formulas (e.g., energy use intensity and green space ratio). Qualitative indicators are judged based on compliance descriptions without uniform numerical scoring standards. Mixed indicators containing both requirements are counted as 0.5 in each category; measure-oriented indicators evaluate whether specific technical measures or procedural requirements are adopted, focusing on process compliance. Performance-oriented indicators evaluate actual operational effects and final outcomes, focusing on output performance. All indicators were independently coded by two researchers with expertise in green building assessment. Inter-coder reliability was tested with a Cohen’s kappa coefficient of 0.89, meeting academic research reliability standards. Discrepancies were resolved through group consensus. The final proportion is calculated based on the count of the lowest-level operational indicators.
The research data are derived from the official full text of each evaluation standard, official implementation guidelines, and existing academic research literature. This study adopts text content analysis and index statistical sorting to carry out quantitative weight calculation and qualitative comparative interpretation of each system’s framework, category, and index connotation.
3. Result
3.1. General Comparison
3.1.1. Organization Comparison
Compared with typical green campus evaluation systems worldwide—which generally involve three types of governing institutions, namely scientific research organizations, nongovernmental organizations, and government agencies [34]—the systems examined in this study (those of China, Singapore, and India) are all government-initiated and implemented, albeit with distinct operational mechanisms. In China, the standard is led by the Ministry of Housing and Urban-Rural Development (MOHURD). The Chinese Society for Urban Studies (CSUS) serves as the entrusted research and development institution, while actual evaluations are conducted by an expert evaluation committee. The EEWH system operates under the leadership of the Ministry of the Interior. Although research and development are conducted by the Architecture and Building Research Institute (ABRI)—a government-affiliated research body—all evaluation work is entirely delegated to Taiwan of China’s Architecture and Building Center (TABC). Singapore’s Green Mark system is developed and administered by the Building and Construction Authority (BCA). The BCA Academy, functioning as the training arm of the Authority, is responsible for certifying “Green Mark Professional Assessors” and “Green Mark Project Managers,” who become qualified to conduct evaluations upon passing the required examinations. In India, the GRIHA system is developed and operated by the GRIHA Council. It operates with the endorsement and support of the Ministry of New and Renewable Energy (MNRE) and sustainable building experts, having been established by The Energy and Resources Institute (TERI) as an independent platform.
Based on the above analysis, the green campus evaluation systems in China, Singapore, and India are all government-led, exhibiting distinct top-down management and promotion mechanisms, albeit with varying degrees of governmental intervention. In the case of the Chinese mainland, government agencies function primarily as administrators rather than active promoters. The absence of comprehensive implementation and promotion strategies during the Standard rollout phase has limited the practical adoption of the evaluation system. Conversely, Taiwan of China, Singapore, and India have established direct government oversight through dedicated research institutes, accompanied by robust promotional initiatives. Examples include Singapore’s “Back to School” program, Taiwan of China’s “Sustainable Campus Reconstruction Project,” and the Sarva Shiksha Abhiyan sustainable school initiative in Gujarat, India (Govt. of Gujarat). Furthermore, to stimulate green building and campus development, the governments of Singapore and India provide economic incentives—such as public research grants and financial awards—to balance the investment burden on developers and campus management teams, specifically targeting certified projects. In contrast, both the mainland and Taiwan of China rely predominantly on voluntary participation principles, lacking sufficient incentive and reward mechanisms. Consequently, formal participation in green campus evaluations remains limited in China.
3.1.2. Certification Process Comparison
The certification process under the Standard is broadly bifurcated into design and operational phases. Each phase comprises five sequential stages: application, preliminary review, expert evaluation, result announcement, and certification issuance, with distinct Green Design Labels and Green Operation Labels awarded, respectively. Projects that remain uncompleted or have been operational for less than one year must undergo the design-phase evaluation prior to operational-phase assessment. The overall procedure is notably cumbersome and time-consuming.
Singapore’s Green Mark certification follows a streamlined four-step workflow: application, pre-assessment, formal evaluation, and certification. Upon obtaining the designation, campuses undergo triennial reviews to ensure continued compliance with Green Mark requirements.
India’s GRIHA-EDS rating process encompasses six stages: online registration, orientation workshops, documentation submission, site visits, final review by the GRIHA Council, and rating conferral. The alternating sequence of documentation review and on-site inspections enhances evaluation authenticity.
Taiwan of China’s EEWH-EC employs a two-tiered certification system: the “Candidate Green Building Certificate” for projects from the design phase through construction permit application and the “Green Building Label” for projects that have secured permits or reached completion. Educational institutions must submit requisite documentation to school authorities; upon document review and fee payment, the evaluation proceeds through preliminary assessment, committee review, on-site inspection, and final approval by the Ministry of the Interior, which issues certificates to approved projects.
Comparative analysis reveals that while all four systems generally follow an application-evaluation-certification workflow, significant procedural divergences exist. Both the mainland and Taiwan of China require governmental agency review following evaluation by certification bodies before certificate issuance. Conversely, Singapore’s Green Mark operates more efficiently because evaluators are directly affiliated with the Building and Construction Authority, thereby eliminating separate governmental validation. This streamlined verification facilitates broader evaluation participation. Meanwhile, India’s GRIHA system enhances scientific rigor and data authenticity through its iterative approach, alternating between documentation submission and on-site inspections.
3.1.3. Comparison of Evaluation Methods
The Standard establishes three components: prerequisite (control) items, scoring items, and bonus points. Serving as mandatory prerequisites for certification, control items must be fully satisfied before projects can proceed to subsequent grading phases. Scores for both scoring and bonus items are determined based on the specific content of each evaluation indicator and its corresponding requirements, with the total score calculation methodology detailed in Table 1. Both Green Mark and GRIHA-EDS incorporate explicit weight settings for different evaluation categories when assigning scores; consequently, total scores are obtained through simple accumulation of individual scores, streamlining the evaluation process considerably. In contrast, the EEWH-EC scoring process is comparatively cumbersome. Each evaluation item involves complex calculation formulas, with distinct weight coefficients applied to each axis (dimension), ensuring that scores for each axis remain within the 0–100 range. Upon obtaining results, evaluated entities can visualize performance across each axis through radar charts, which is relatively intuitive. However, as the weight of individual indicators cannot be directly determined, direct comparison of index weights with the other three systems is not feasible (Table 2).
Table 1.
“Assessment standard for green campus” score conversion.
Table 2.
EEWH-EC campus evaluation system score conversion.
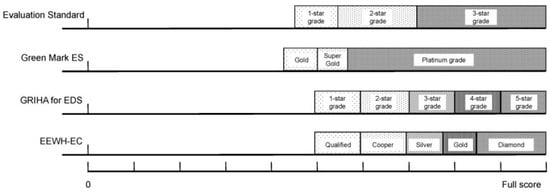
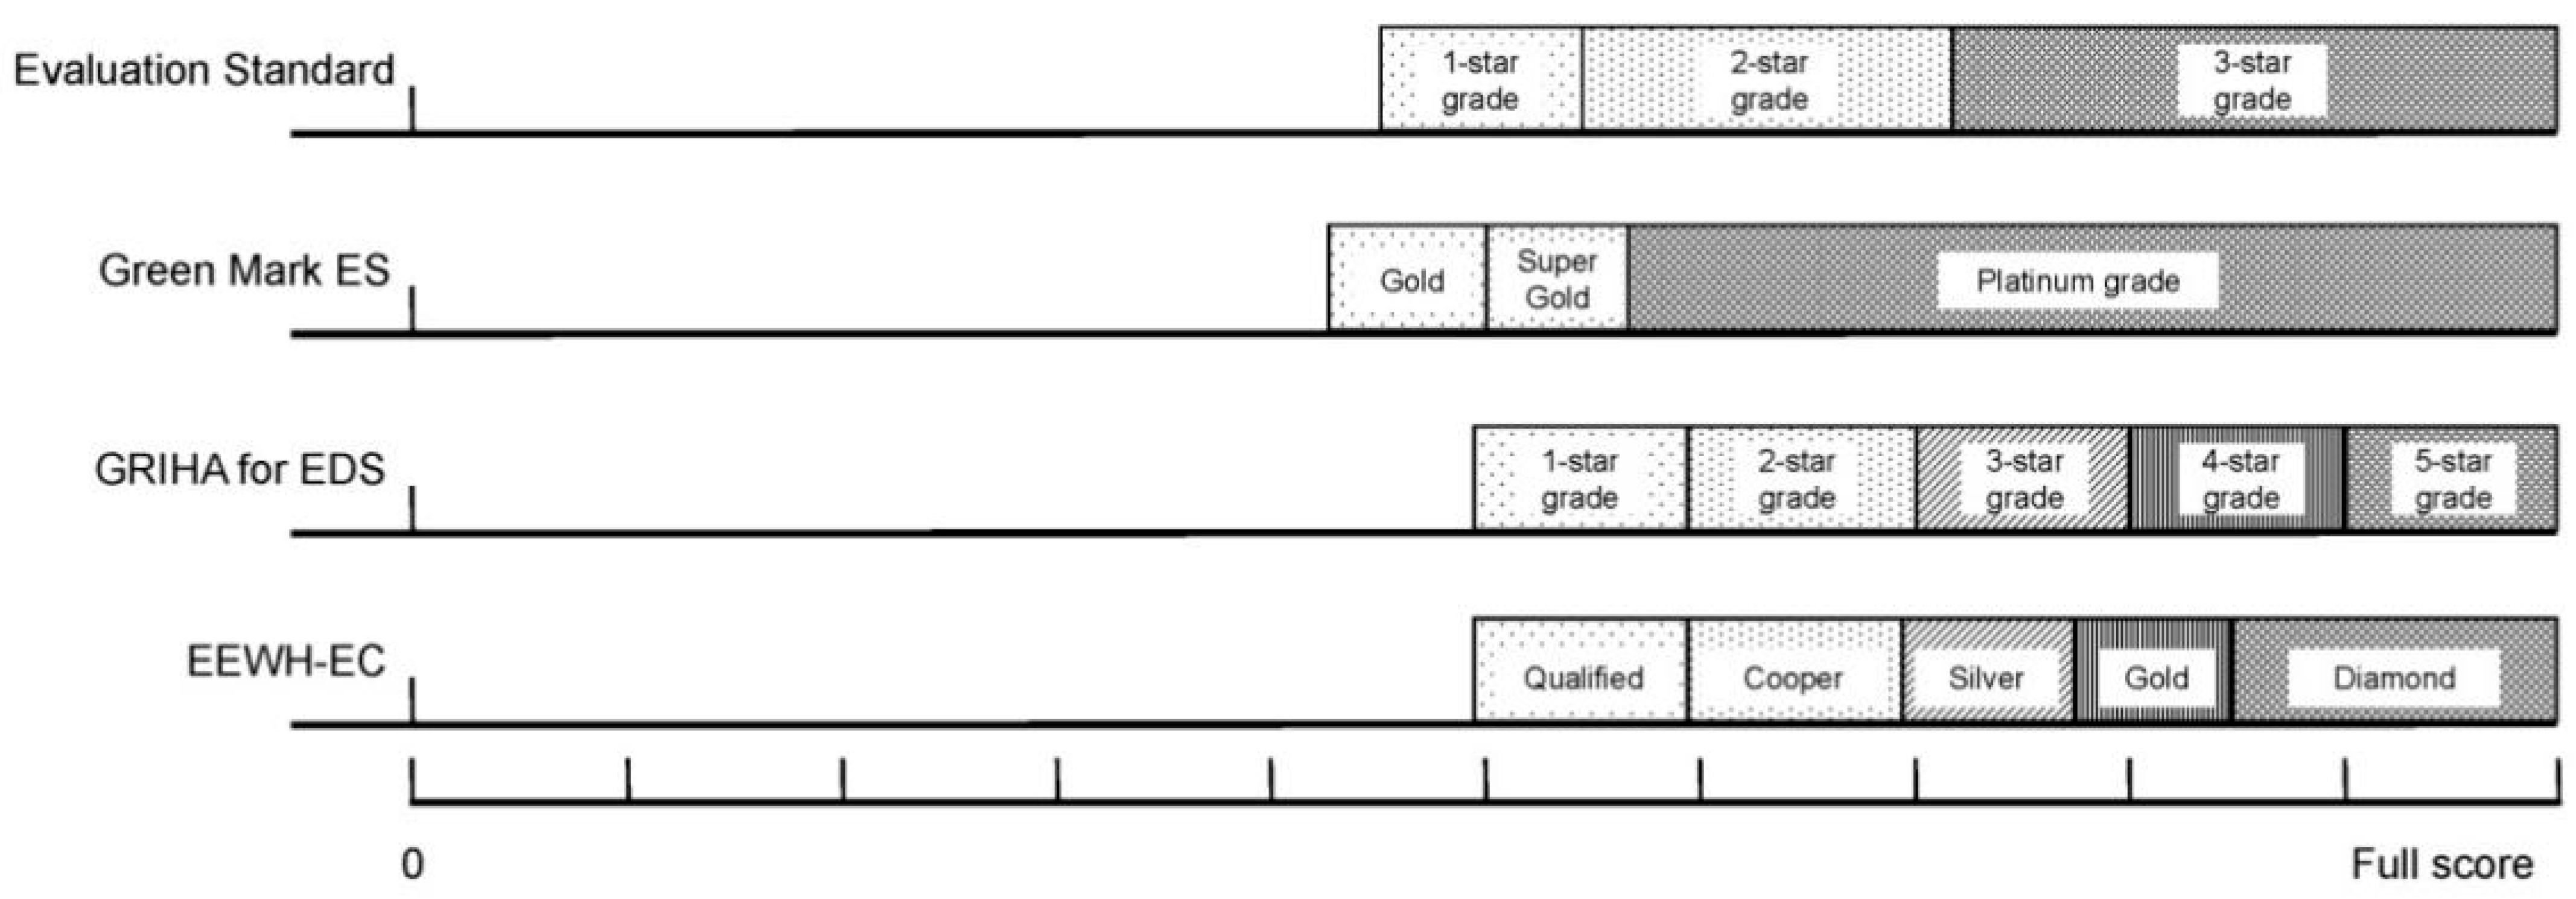
A comparison of certification levels across the four systems—the Standard, Green Mark ES, GRIHA-EDS, and EEWH-EC—reveals classifications into 3, 3, 5, and 5 tiers, respectively (Figure 3). All four systems require approximately half of the total possible score as the minimum certification threshold. The EEWH-EC system features a more granular classification scheme with relatively uniform intervals between levels; its calculation method is scientifically rigorous yet comparatively complex. The Green Mark ES evaluation method is the most intuitive and concise, setting progressively higher requirements for advanced certification levels. In comparison with these international benchmarks regarding requirements and thresholds, the Standard requires further refinement and enhancement (Figure 3).
Figure 3.
Comparison of the classification of green campus evaluation systems.
3.2. Category Comparison
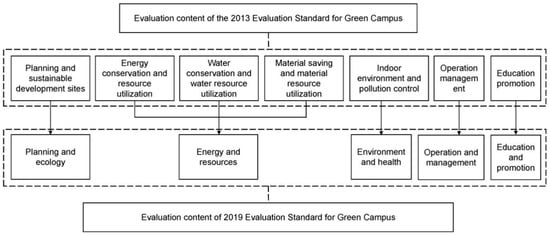
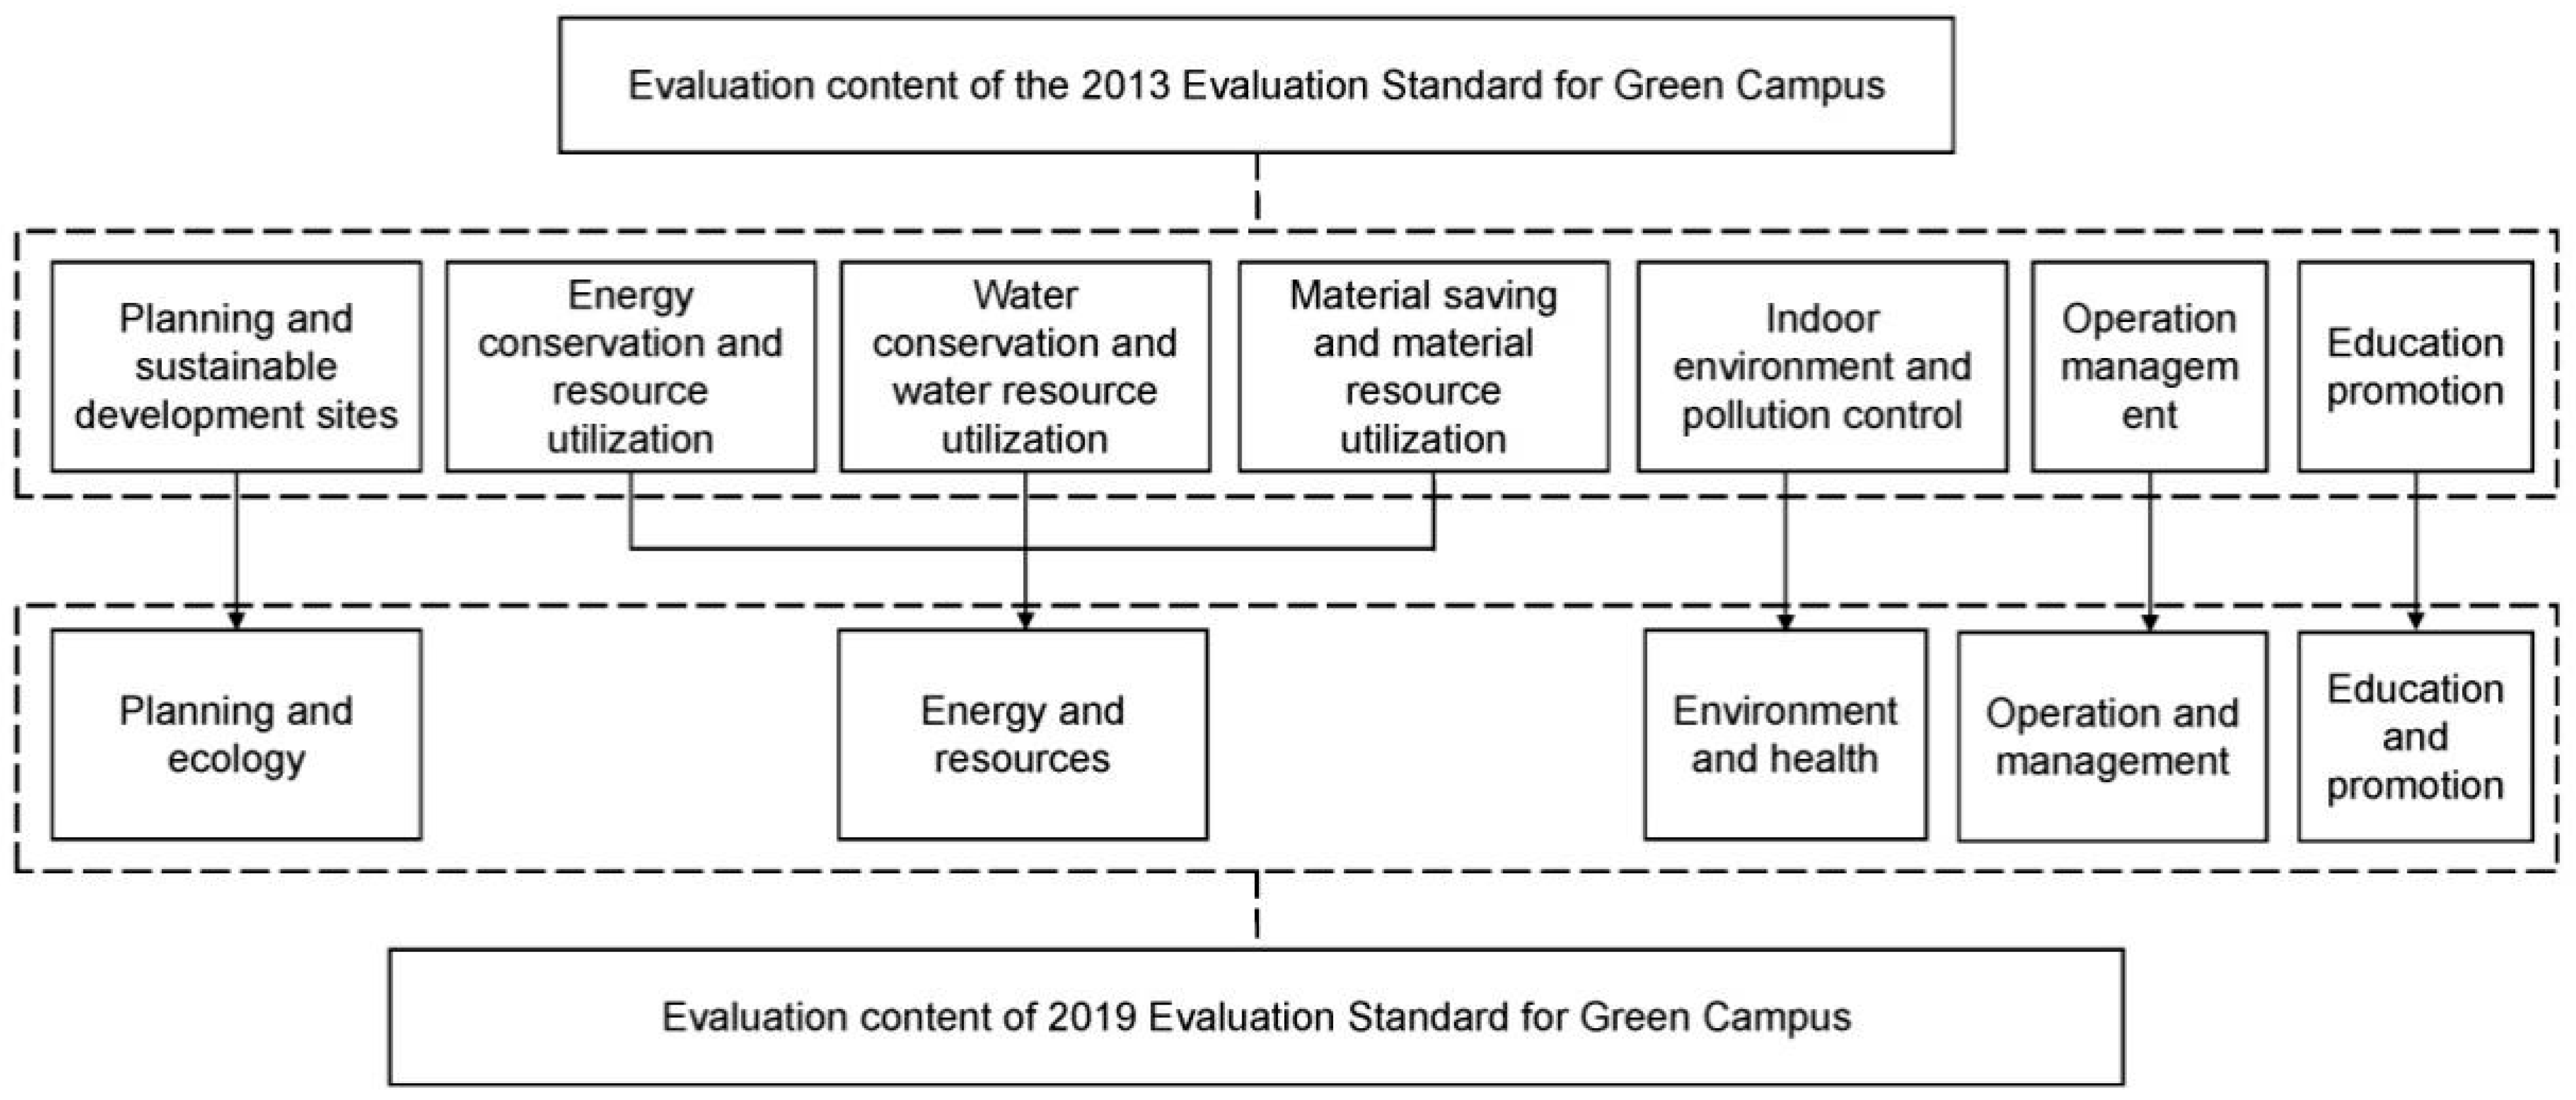
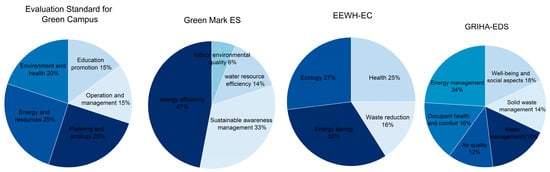
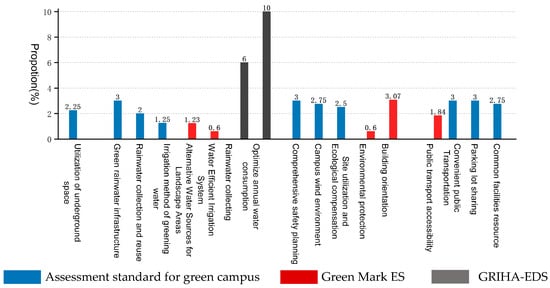
By comparing index weights across the four systems—the Standard, Green Mark ES, GRIHA-EDS, and EEWH-EC—distinct thematic priorities emerge in green campus assessment. The latest iteration of the Standard reorganizes the seven categories from its 2013 version into five evaluation dimensions: planning and ecology, energy and resources, environment and health, operation and management, and education and promotion (Figure 4). Analysis of the weight distribution reveals a predominant emphasis on energy and resources, followed closely by planning and ecology.
Figure 4.
Indicator change chart in two versions of “assessment standard for green campus.”
Green Mark ES employs four evaluation categories: energy efficiency, water resource efficiency, sustainable development awareness and management, and indoor environmental quality. Owing to Singapore’s limited land area and severe resource constraints, Green Mark ES imposes the most stringent requirements on energy consumption, with energy efficiency indicators commanding 47% of the total weight—the highest proportion among all systems examined.
GRIHA-EDS utilizes six evaluation categories: energy management, occupant health and comfort, air quality, water resource management, solid waste management, and welfare and society. These categories demonstrate relatively balanced weights, with energy management comprising the largest share at 24%. It should be clarified that the 24% weight corresponds to the broad “Energy and Resources” category, which covers building energy efficiency, renewable energy application, waste recycling, and water resource conservation. After disaggregating this composite category, pure building energy efficiency-related indicators account for 11.2% of the total effective score, which is significantly lower than the 47% energy efficiency weight in Green Mark ES.
In contrast, EEWH-EC maintains a roughly equitable distribution across its indicator categories, with the health-related component occupying a comparatively modest proportion (Figure 5).
Figure 5.
Distribution of index weights of the green campus evaluation systems.
3.3. Comparison of Key Categories
Owing to marked heterogeneity in the categorical frameworks of the four indicator systems, precluding direct one-to-one comparison, this study reaggregates the indicators into five cross-cutting themes—planning, energy conservation, outdoor environment, indoor environment, and regional climate adaptation—which are subsequently mapped against the most closely correlated evaluation categories for analysis.
3.3.1. Planning Indicators
Planning indicators are categorized into four thematic domains: land use, water conservation measures, planning layout, and transportation facilities. Among the four standards, only the Standard includes provisions for underground space utilization, whereas the remaining systems lack specific land-use criteria. Regarding water conservation strategies, the Standard emphasizes the implementation of measures such as rainwater infiltration, reuse, bioretention, and flood storage facilities, employing performance metrics including total annual rainwater runoff control. GRIHA-EDS primarily focuses on rainwater recycling to reduce annual campus water demand. EEWH-EC details various water conservation strategies in its evaluation manual, but ultimately employs water conservation and flood storage indices as operational performance indicators.
In terms of planning and layout, the Green Mark ES system specifies strict requirements for building orientation and shading, mandating that building façades must not face east-west and that windows on east-west façades must incorporate shading devices. Conversely, the Standard omits these requirements but encompasses indicators such as campus wind environment, site utilization, and campus safety. All four systems establish specific criteria for transportation facilities. Both the Standard and EEWH-EC establish quantitative thresholds for distances from the site to public transit stations and nearby transit lines. For internal campus circulation, EEWH-EC provides detailed requirements for bicycle usage, parking facilities, and transit accessibility. Green Mark ES merely requires convenient access to public transportation stations but specifies circulation route requirements, including covered walkways to accommodate its hot and rainy climate (Table 3).
Table 3.
Comparison of planning index contents of the green campus evaluation systems.
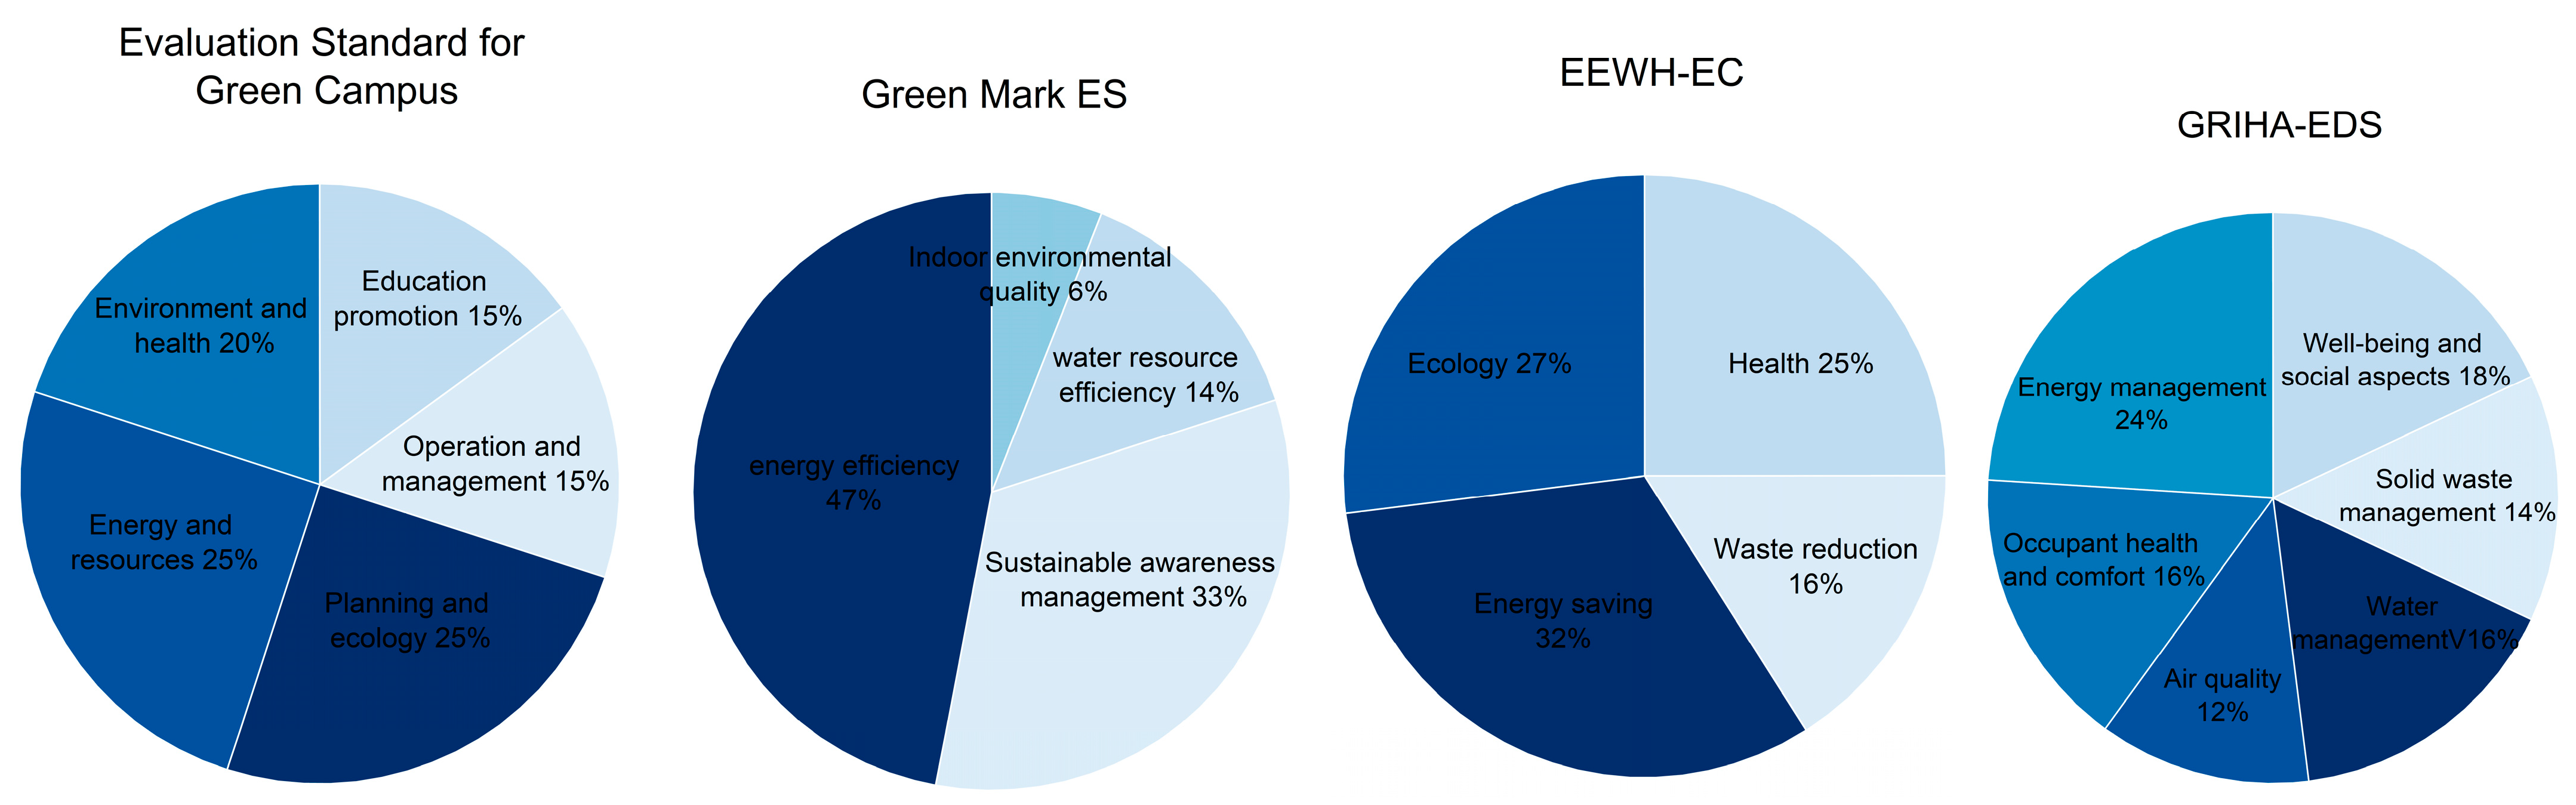
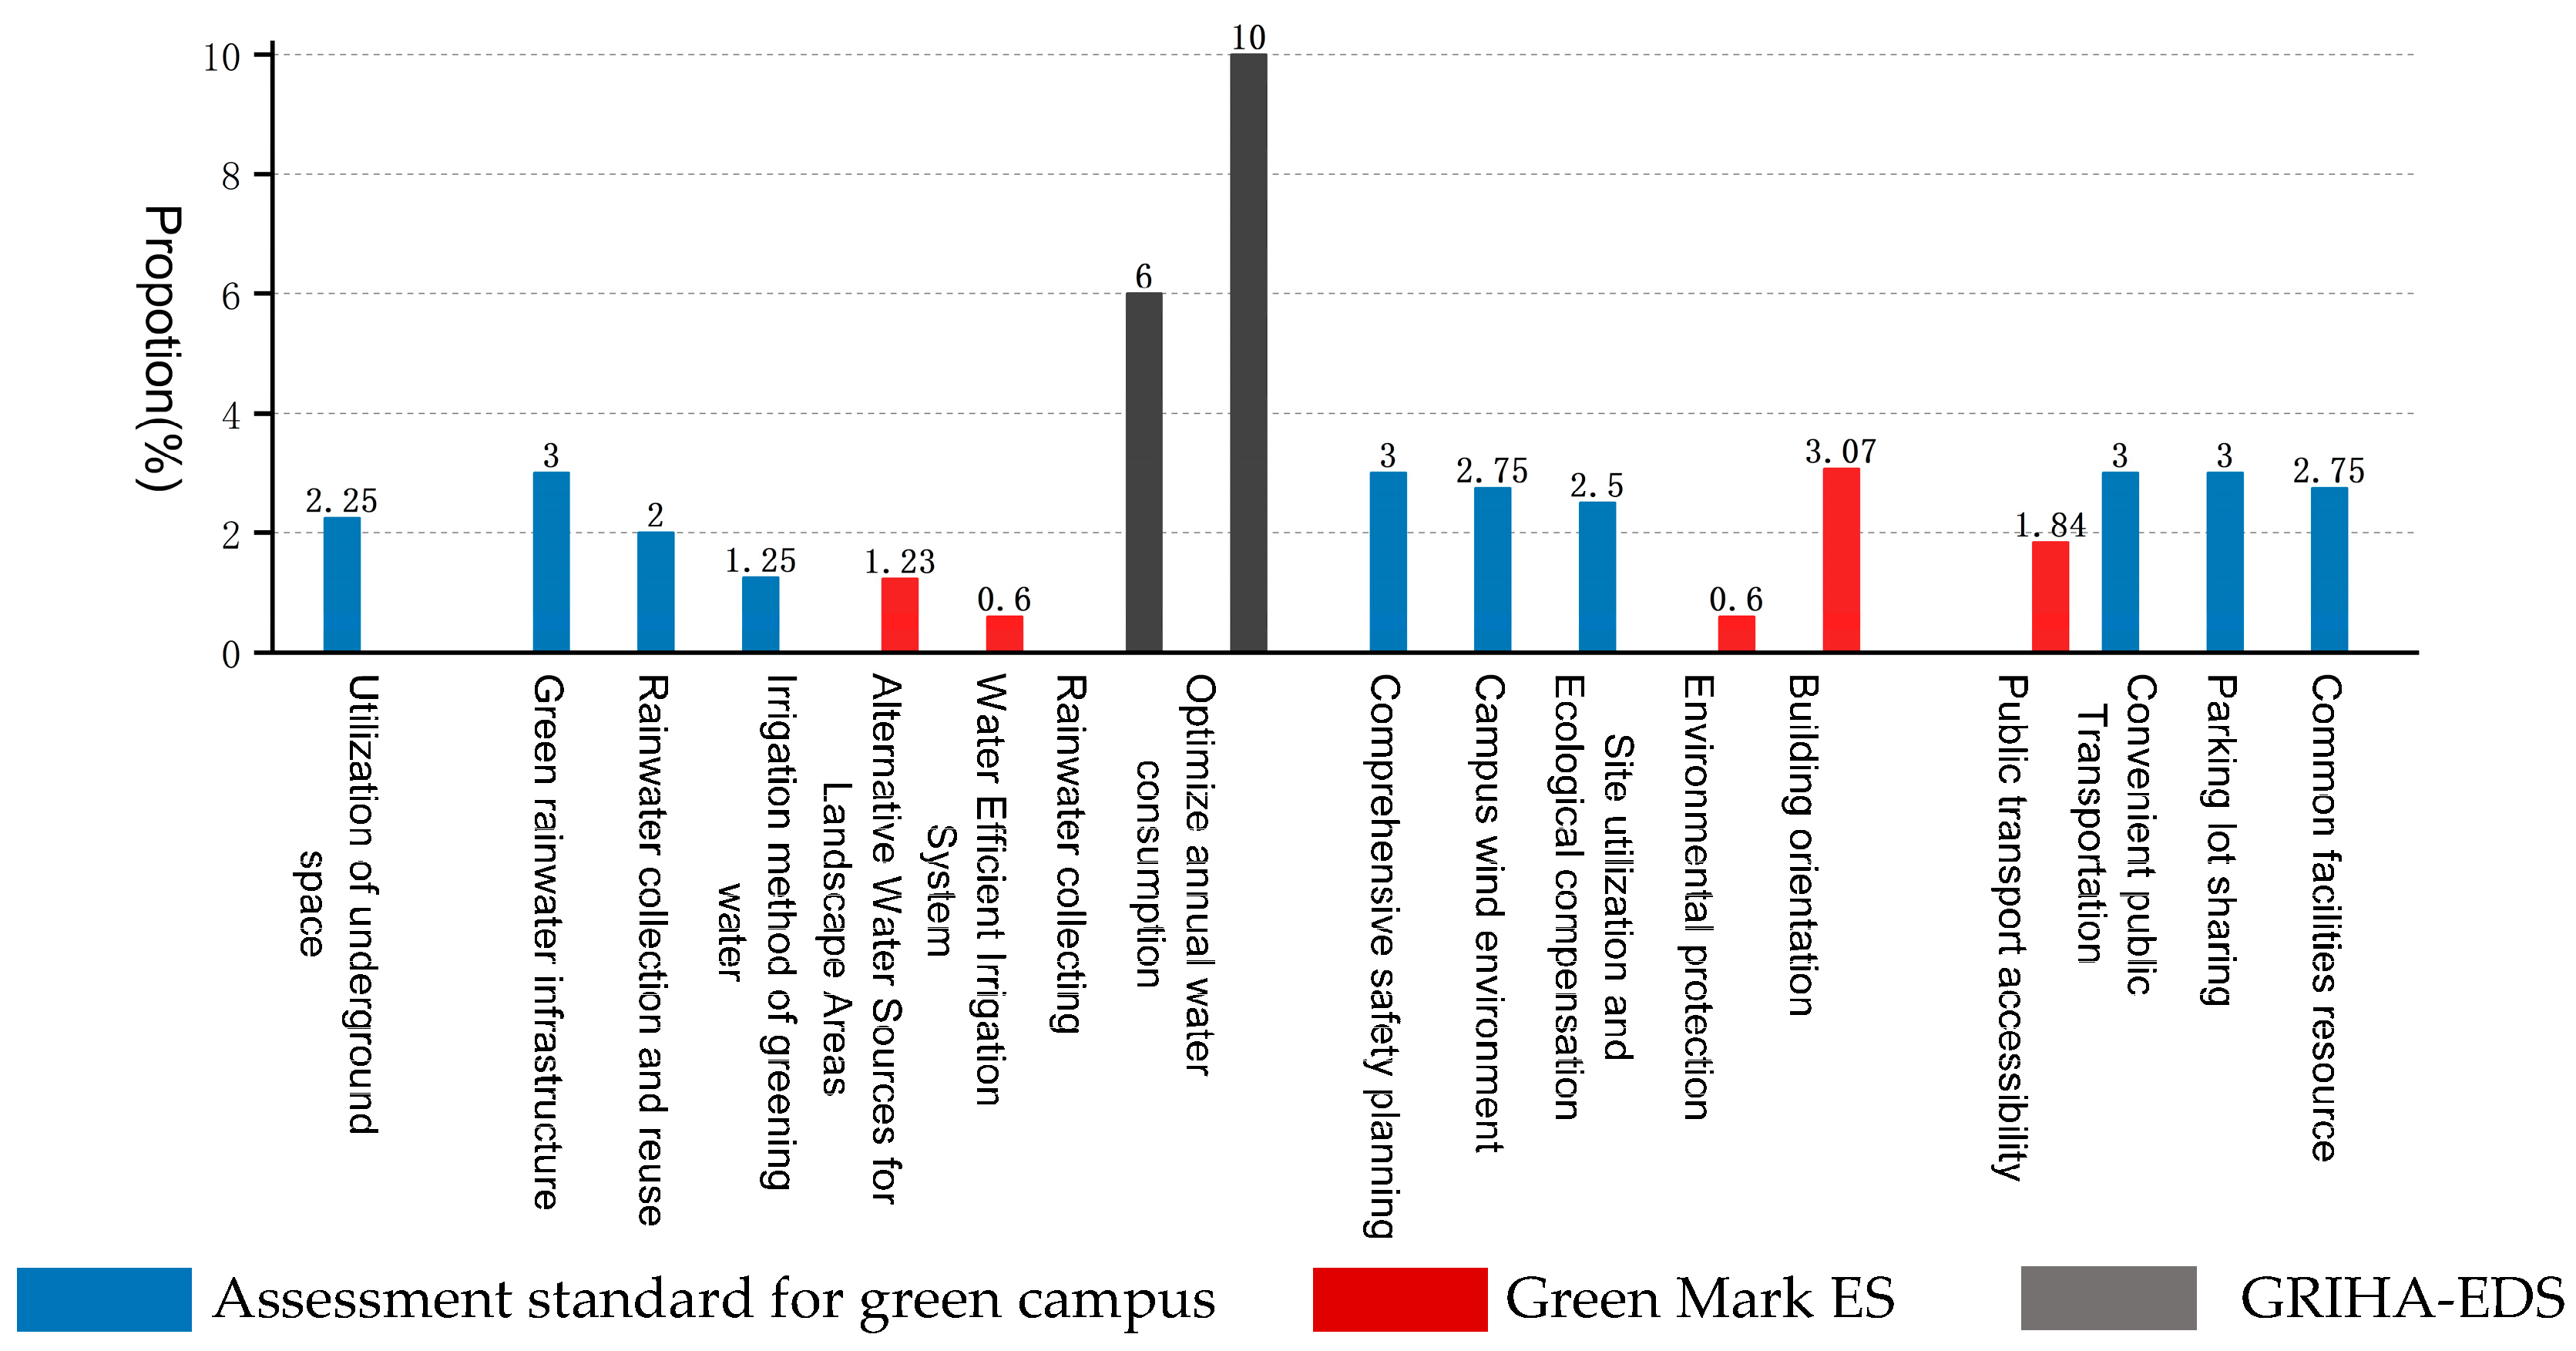
Within the Standard, planning indicators comprise 10 subindicators distributed across the planning and ecology categories, offering comprehensive coverage with a combined weight of 25.5%. Individual indicators are relatively balanced, though specific metrics such as green space irrigation methods carry lower weights (1.25%). Green Mark ES maintains relatively limited coverage of planning indicators, focusing primarily on water resources, building orientation, and public transportation, with a combined weight of 7.32%. Although GRIHA-EDS addresses only water conservation within the planning category, this dimension accounts for 16% of the total weight—an allocation reflecting India’s relative water scarcity. EEWH-EC primarily emphasizes water conservation and transportation indicators, with particularly detailed specifications for transportation metrics (Figure 6).
Figure 6.
Comparison of planning index weights of the green campus evaluation systems.
3.3.2. Energy Indicators
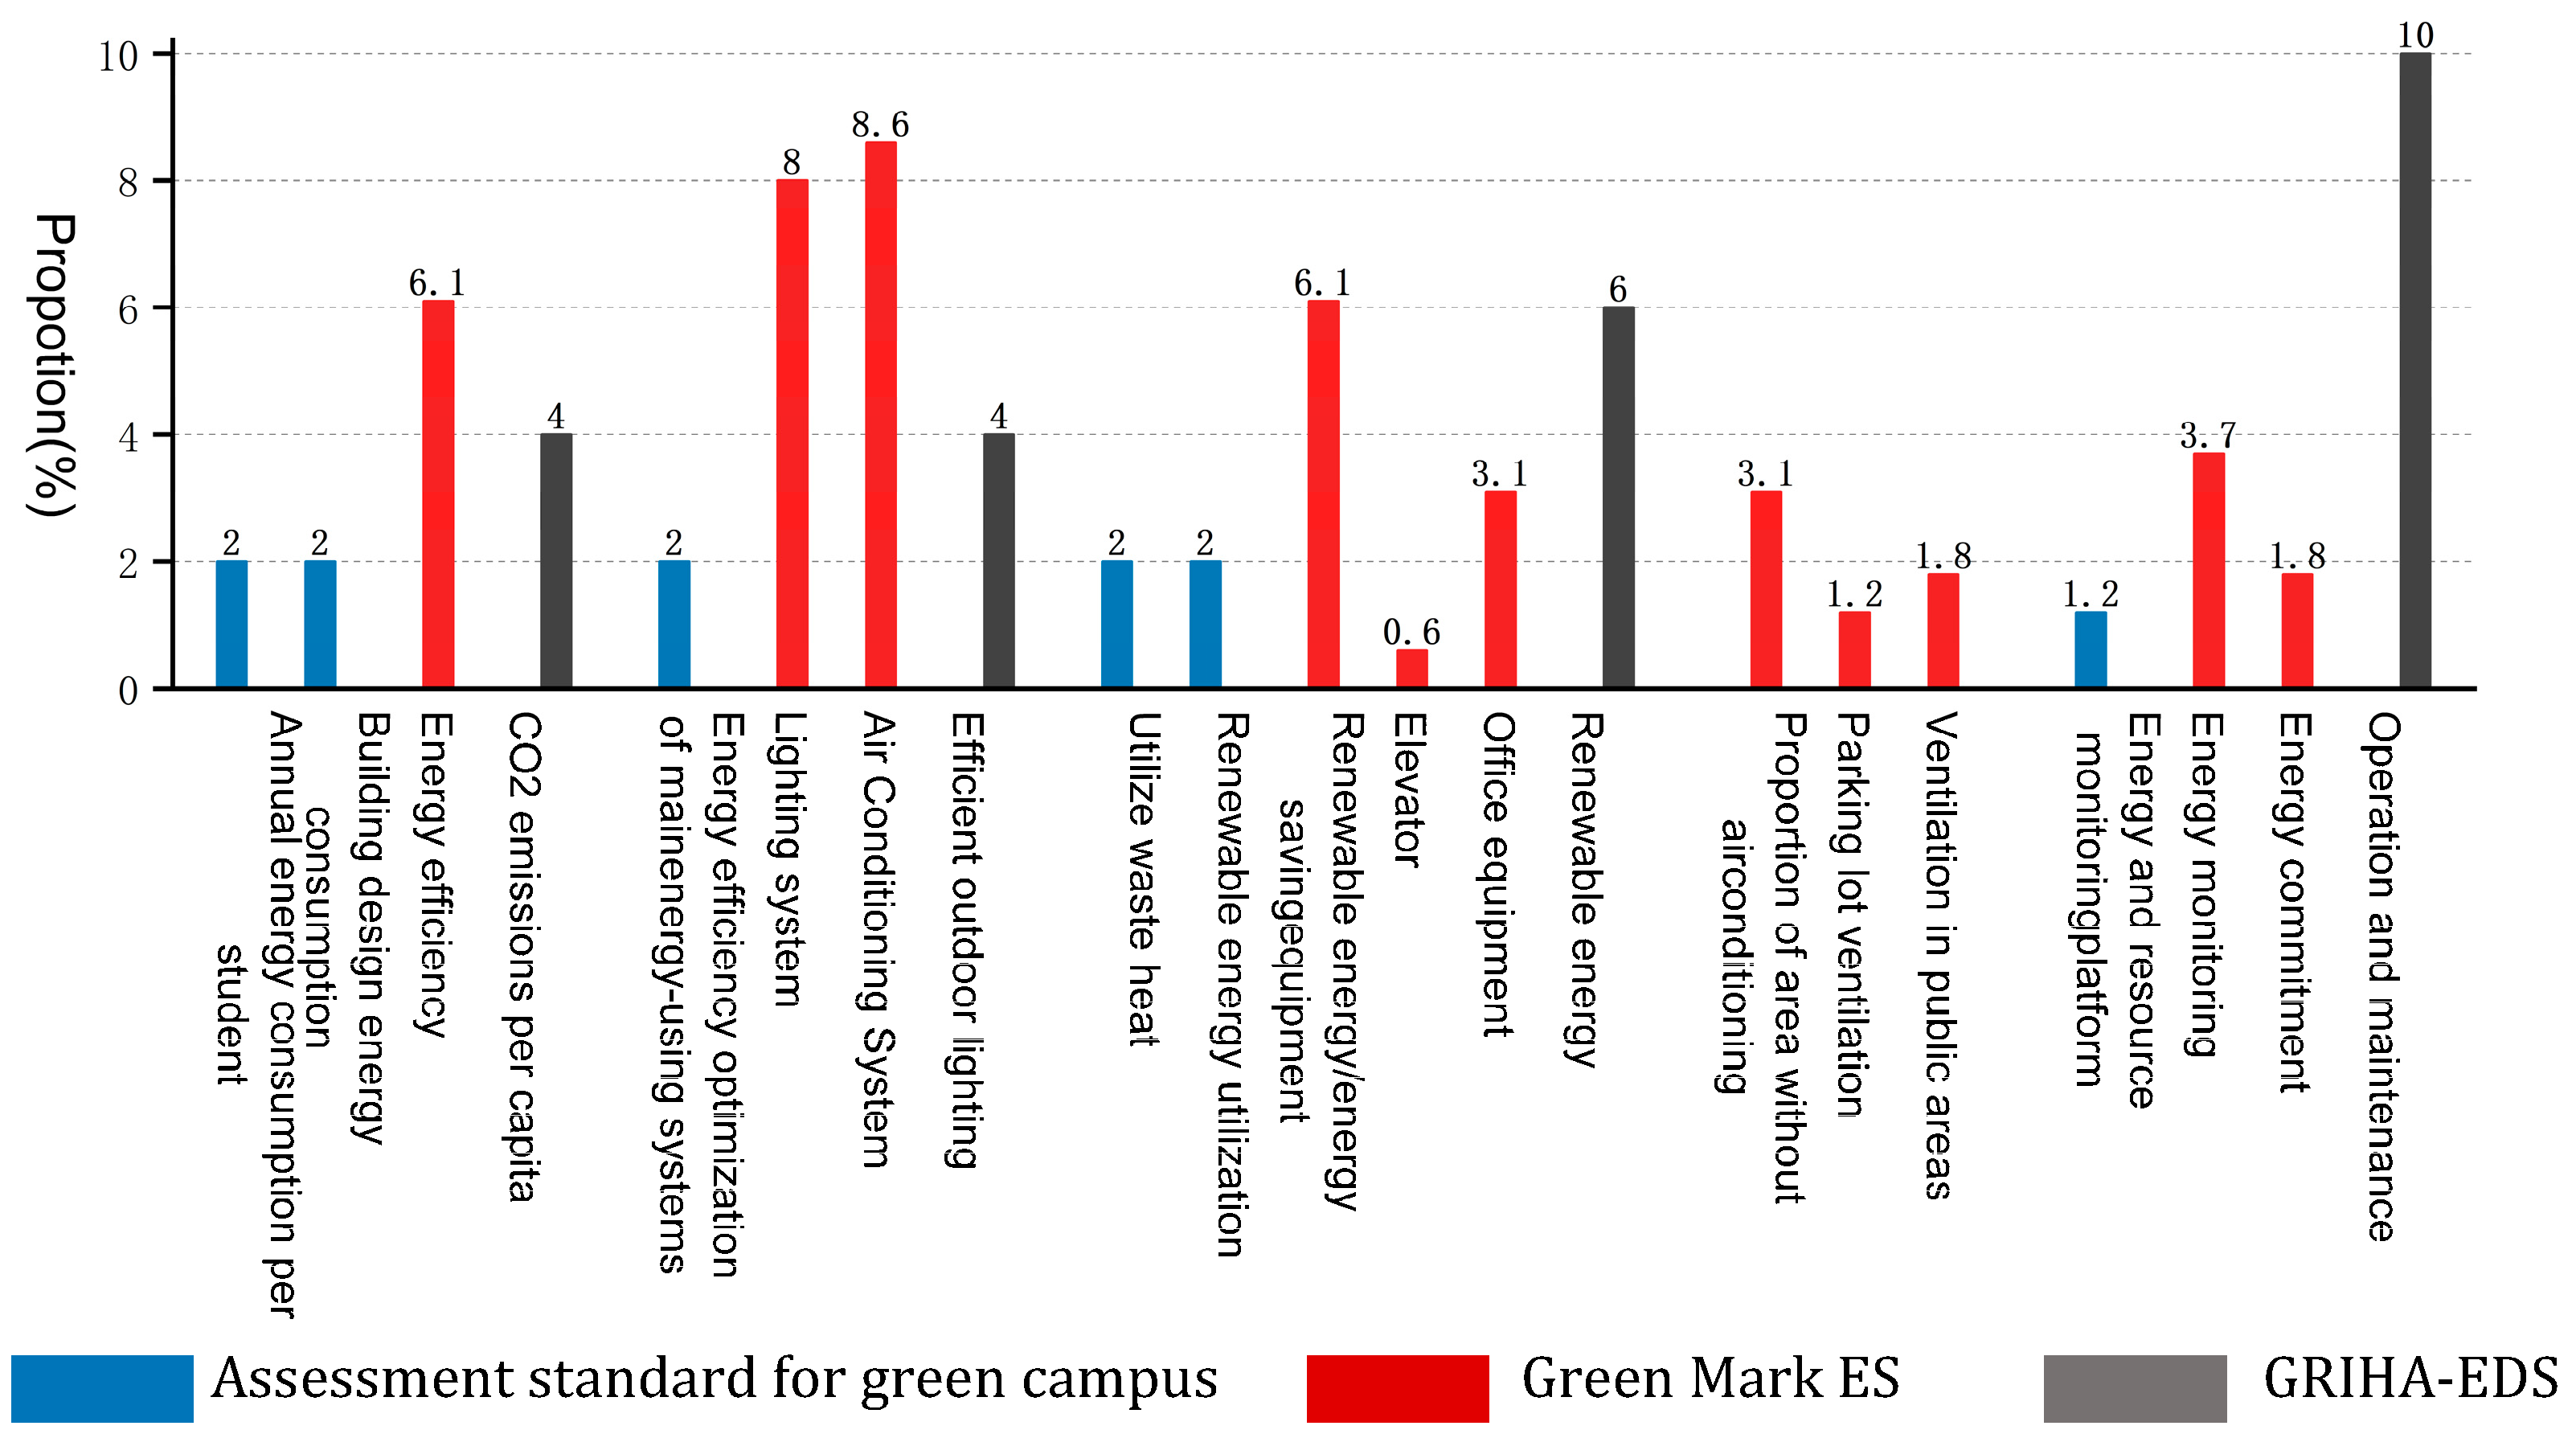
Energy indicators encompass five dimensions: energy performance, energy efficiency optimization, equipment energy conservation, energy-saving measures, and energy management. Regarding energy performance, the Standard employs two metrics: annual energy consumption per student and building design energy consumption. However, the per-student metric presents implementation challenges due to multiple confounding factors in practical applications. Green Mark ES utilizes the energy utilization index (EUI, kW/m2/year) and energy index (EI, kW/person/year), established through extensive primary data collection and analysis, with specific quantitative thresholds calibrated to different campus typologies and consumption levels. GRIHA-EDS emphasizes carbon emission control, whereas EEWH-EC evaluates aggregate energy performance through green building prevalence and electricity consumption benchmarks.
For energy efficiency optimization and equipment conservation, Green Mark ES establishes rigorous standards targeting Singapore’s principal campus energy loads—air-conditioning and lighting—regulating air-conditioning system efficiency (kW/ton) and lighting power density, while scoring based on renewable energy’s proportion of total building consumption. In contrast, the Standard merely mandates optimization of major energy-consuming systems (air-conditioning, hot water, and lighting) without prescribing specific measures or evaluation criteria. EEWH-EC focuses on lighting efficiency requirements for outdoor illumination, emphasizing appropriate lighting levels for roads, parking facilities, and landscapes to address excessive street lighting standards and mitigate ecological habitat disruption. Regarding energy-saving measures, Green Mark ES specifies requirements for public areas, parking garage ventilation, and non-air-conditioned spaces, promoting natural ventilation in parking structures and common areas to enhance thermal comfort while reducing mechanical cooling demands (Table 4).
Table 4.
Comparison of energy-saving indicators of the green campus evaluation systems.
While the four systems demonstrate conceptual similarities in energy performance, efficiency optimization, and equipment conservation, their emphases diverge significantly. Green Mark ES assigns substantial weight to energy indicators (43.3%), adopting a comprehensive, results-oriented framework that incorporates both performance outcomes and implementation measures. The Standard maintains a results-oriented approach focusing on consumption performance across building systems, but lacks specificity in prescriptive measures. GRIHA-EDS allocates 24% to energy metrics, concentrating primarily on outdoor lighting and renewable energy utilization, albeit with fewer detailed subcriteria (Figure 7).
Figure 7.
Comparison of energy-saving index weights of the green campus evaluation systems.
3.3.3. Outdoor Environmental Indicators
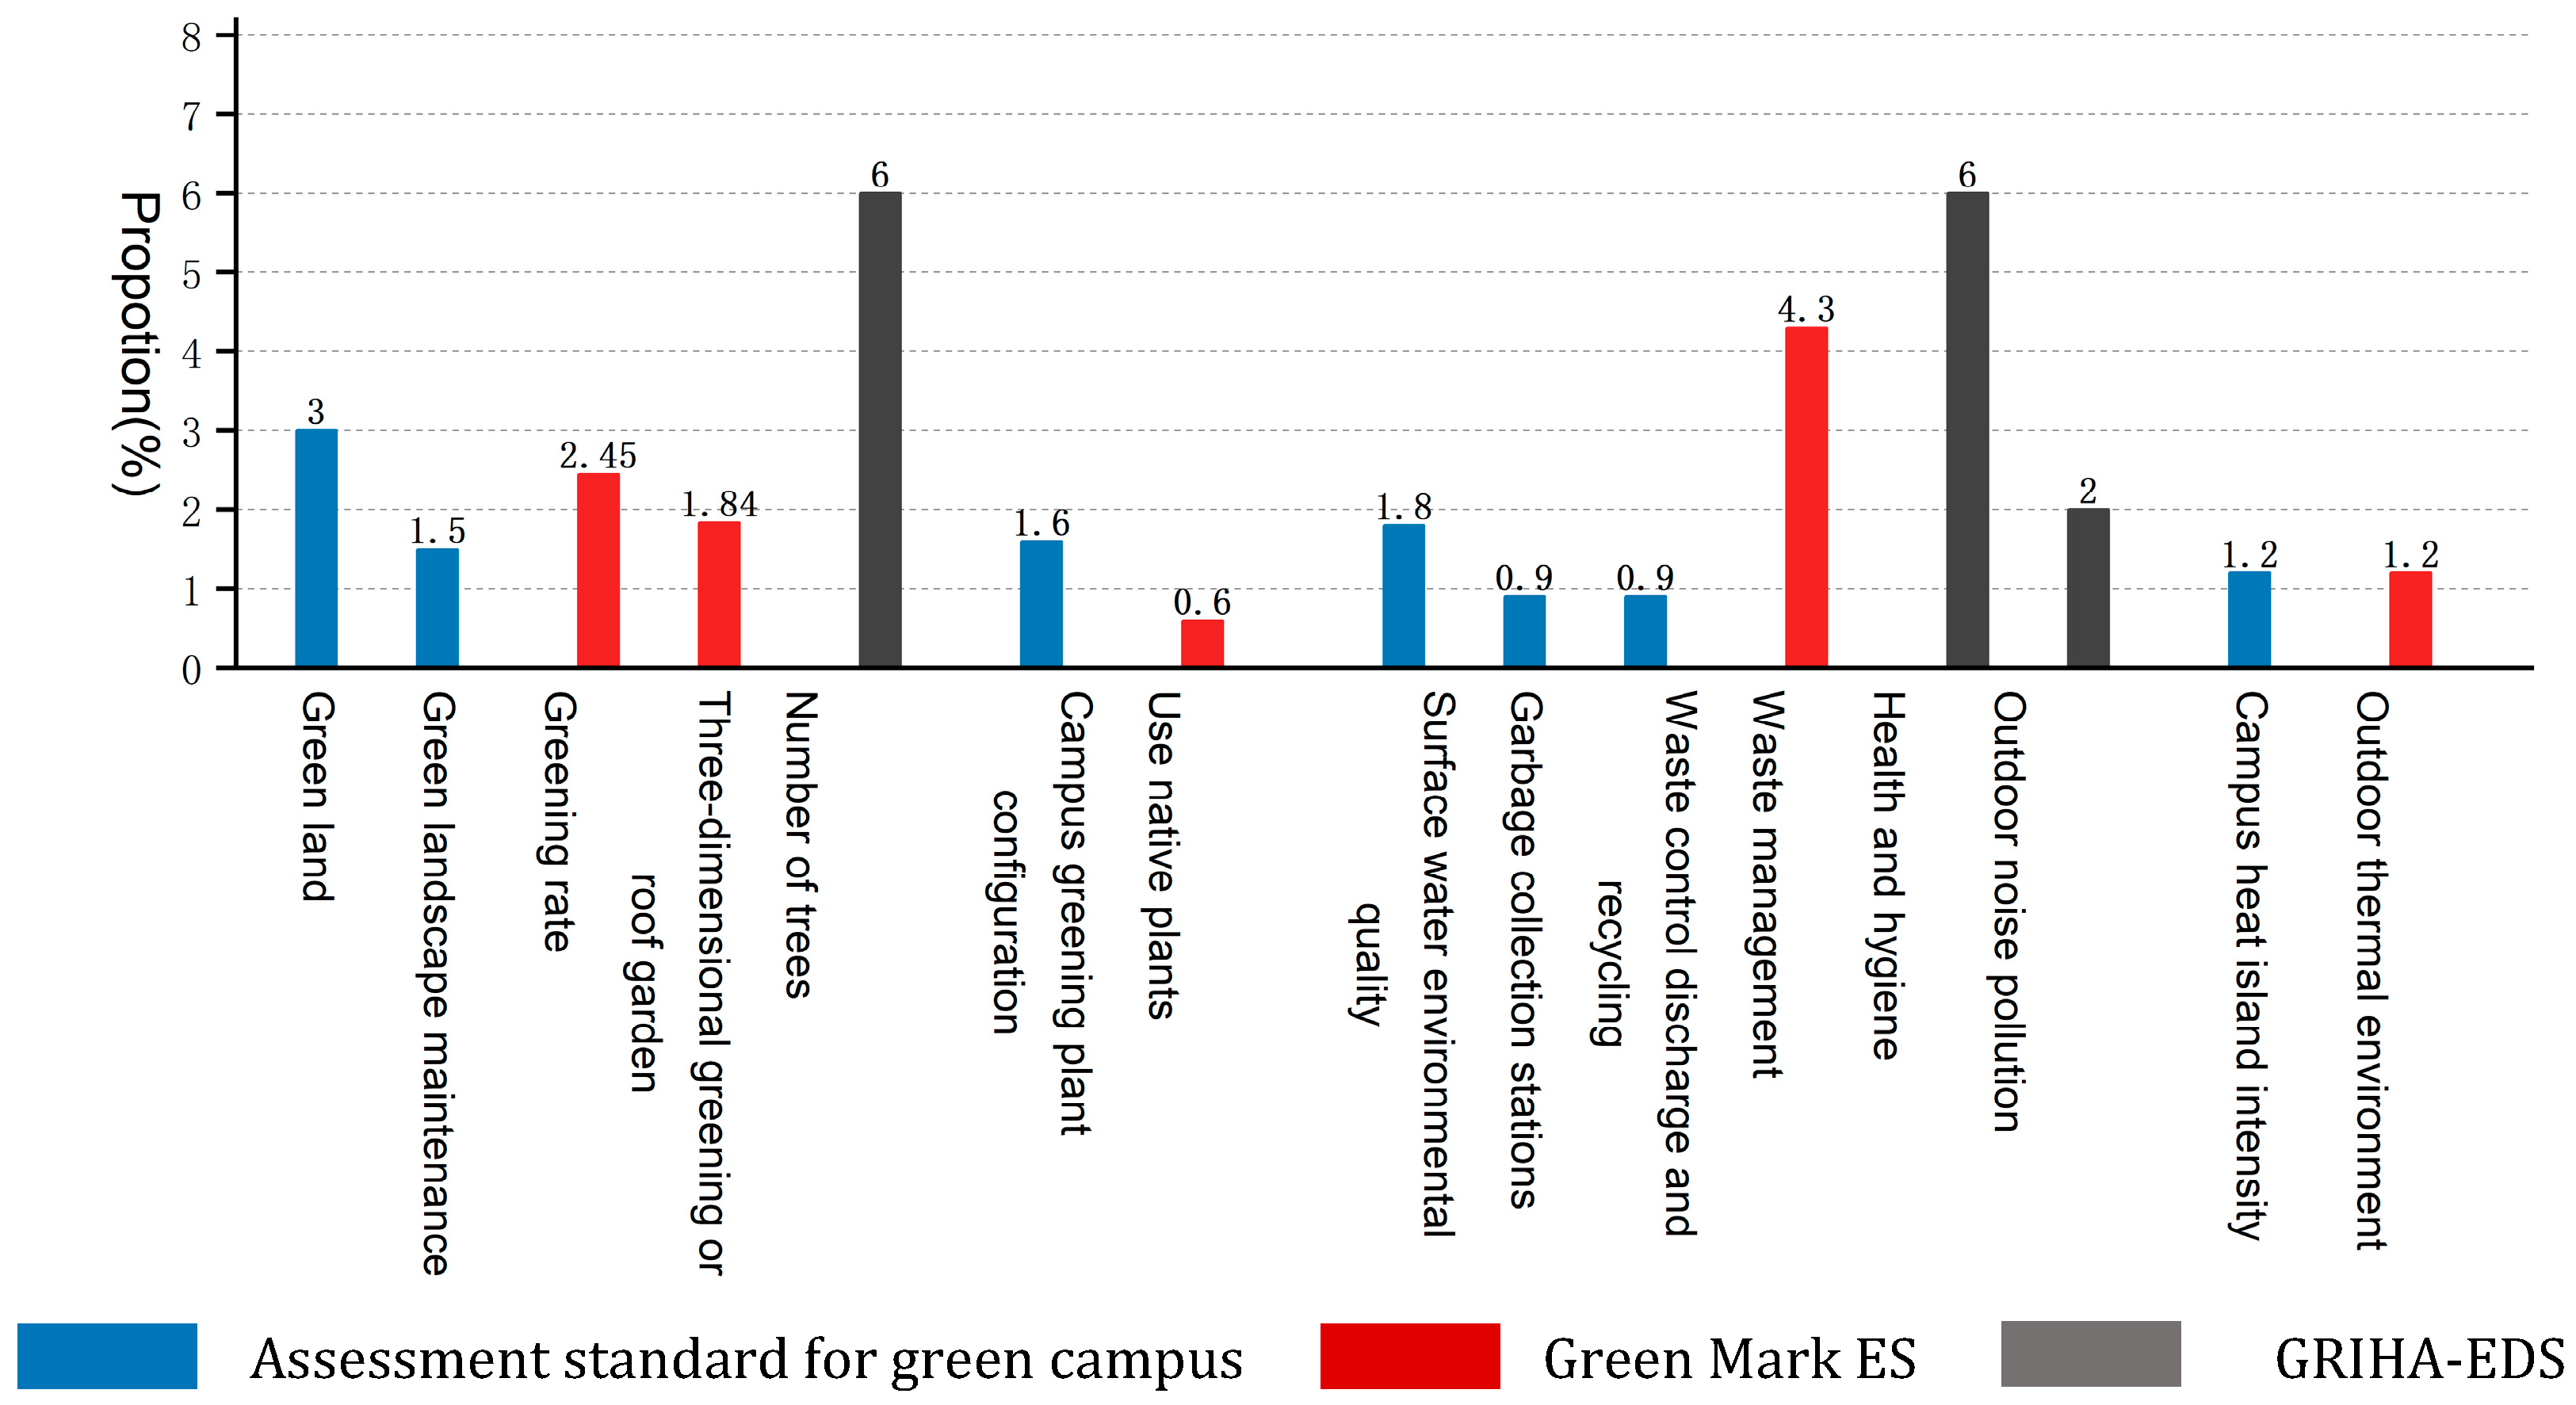
The outdoor environment evaluation encompasses five primary dimensions: campus greening, biodiversity conservation, pollution control, outdoor thermal comfort, and related aspects. Regarding campus greening, the four systems employ distinct quantitative methodologies. Green Mark ES promotes the expansion of green areas through diverse strategies such as rooftop gardens and vertical greening, with particular emphasis on native plant species. In contrast, the Standard primarily measures greening coverage through the green space ratio and per capita public green space area. GRIHA-EDS utilizes tree count as its primary indicator, offering limited assessment granularity. All four standards address waste management and pollution control; notably, EEWH-EC additionally incorporates light pollution control requirements. The systems diverge significantly in their treatment of outdoor thermal comfort. The Standard regulates shading device coverage areas and the solar reflectance indices of road pavements and building roofs. Green Mark ES targets the solar reflectance of ground surfaces, roofs, and exterior walls. EEWH-EC provides the most comprehensive framework, encompassing shading provisions, heat-reflective measures, outdoor ventilation design, and evaporative cooling through ground surfaces, with detailed evaluation protocols established for each parameter. GRIHA-EDS notably lacks specific assessment criteria for the outdoor thermal environment (Table 5).
Table 5.
Comparison of outdoor environment indicators of the green campus evaluation systems.
Among the four systems, the Standard, EEWH-EC, and Green Mark ES demonstrate substantial emphasis on outdoor environmental quality. The Standard and Green Mark ES exhibit considerable similarity in both indicator typologies and weight distributions. EEWH-EC particularly emphasizes the educational significance of ecological principles in its greening and biodiversity criteria. Conversely, GRIHA-EDS allocates relatively limited attention to biodiversity and thermal comfort, concentrating primarily on vegetation coverage and pollution control, with outdoor environment indicators comprising merely 16% of the total evaluation weight (Figure 8).
Figure 8.
Comparison of outdoor environment index weights of the green campus evaluation systems.
3.3.4. Indoor Environment Indicators
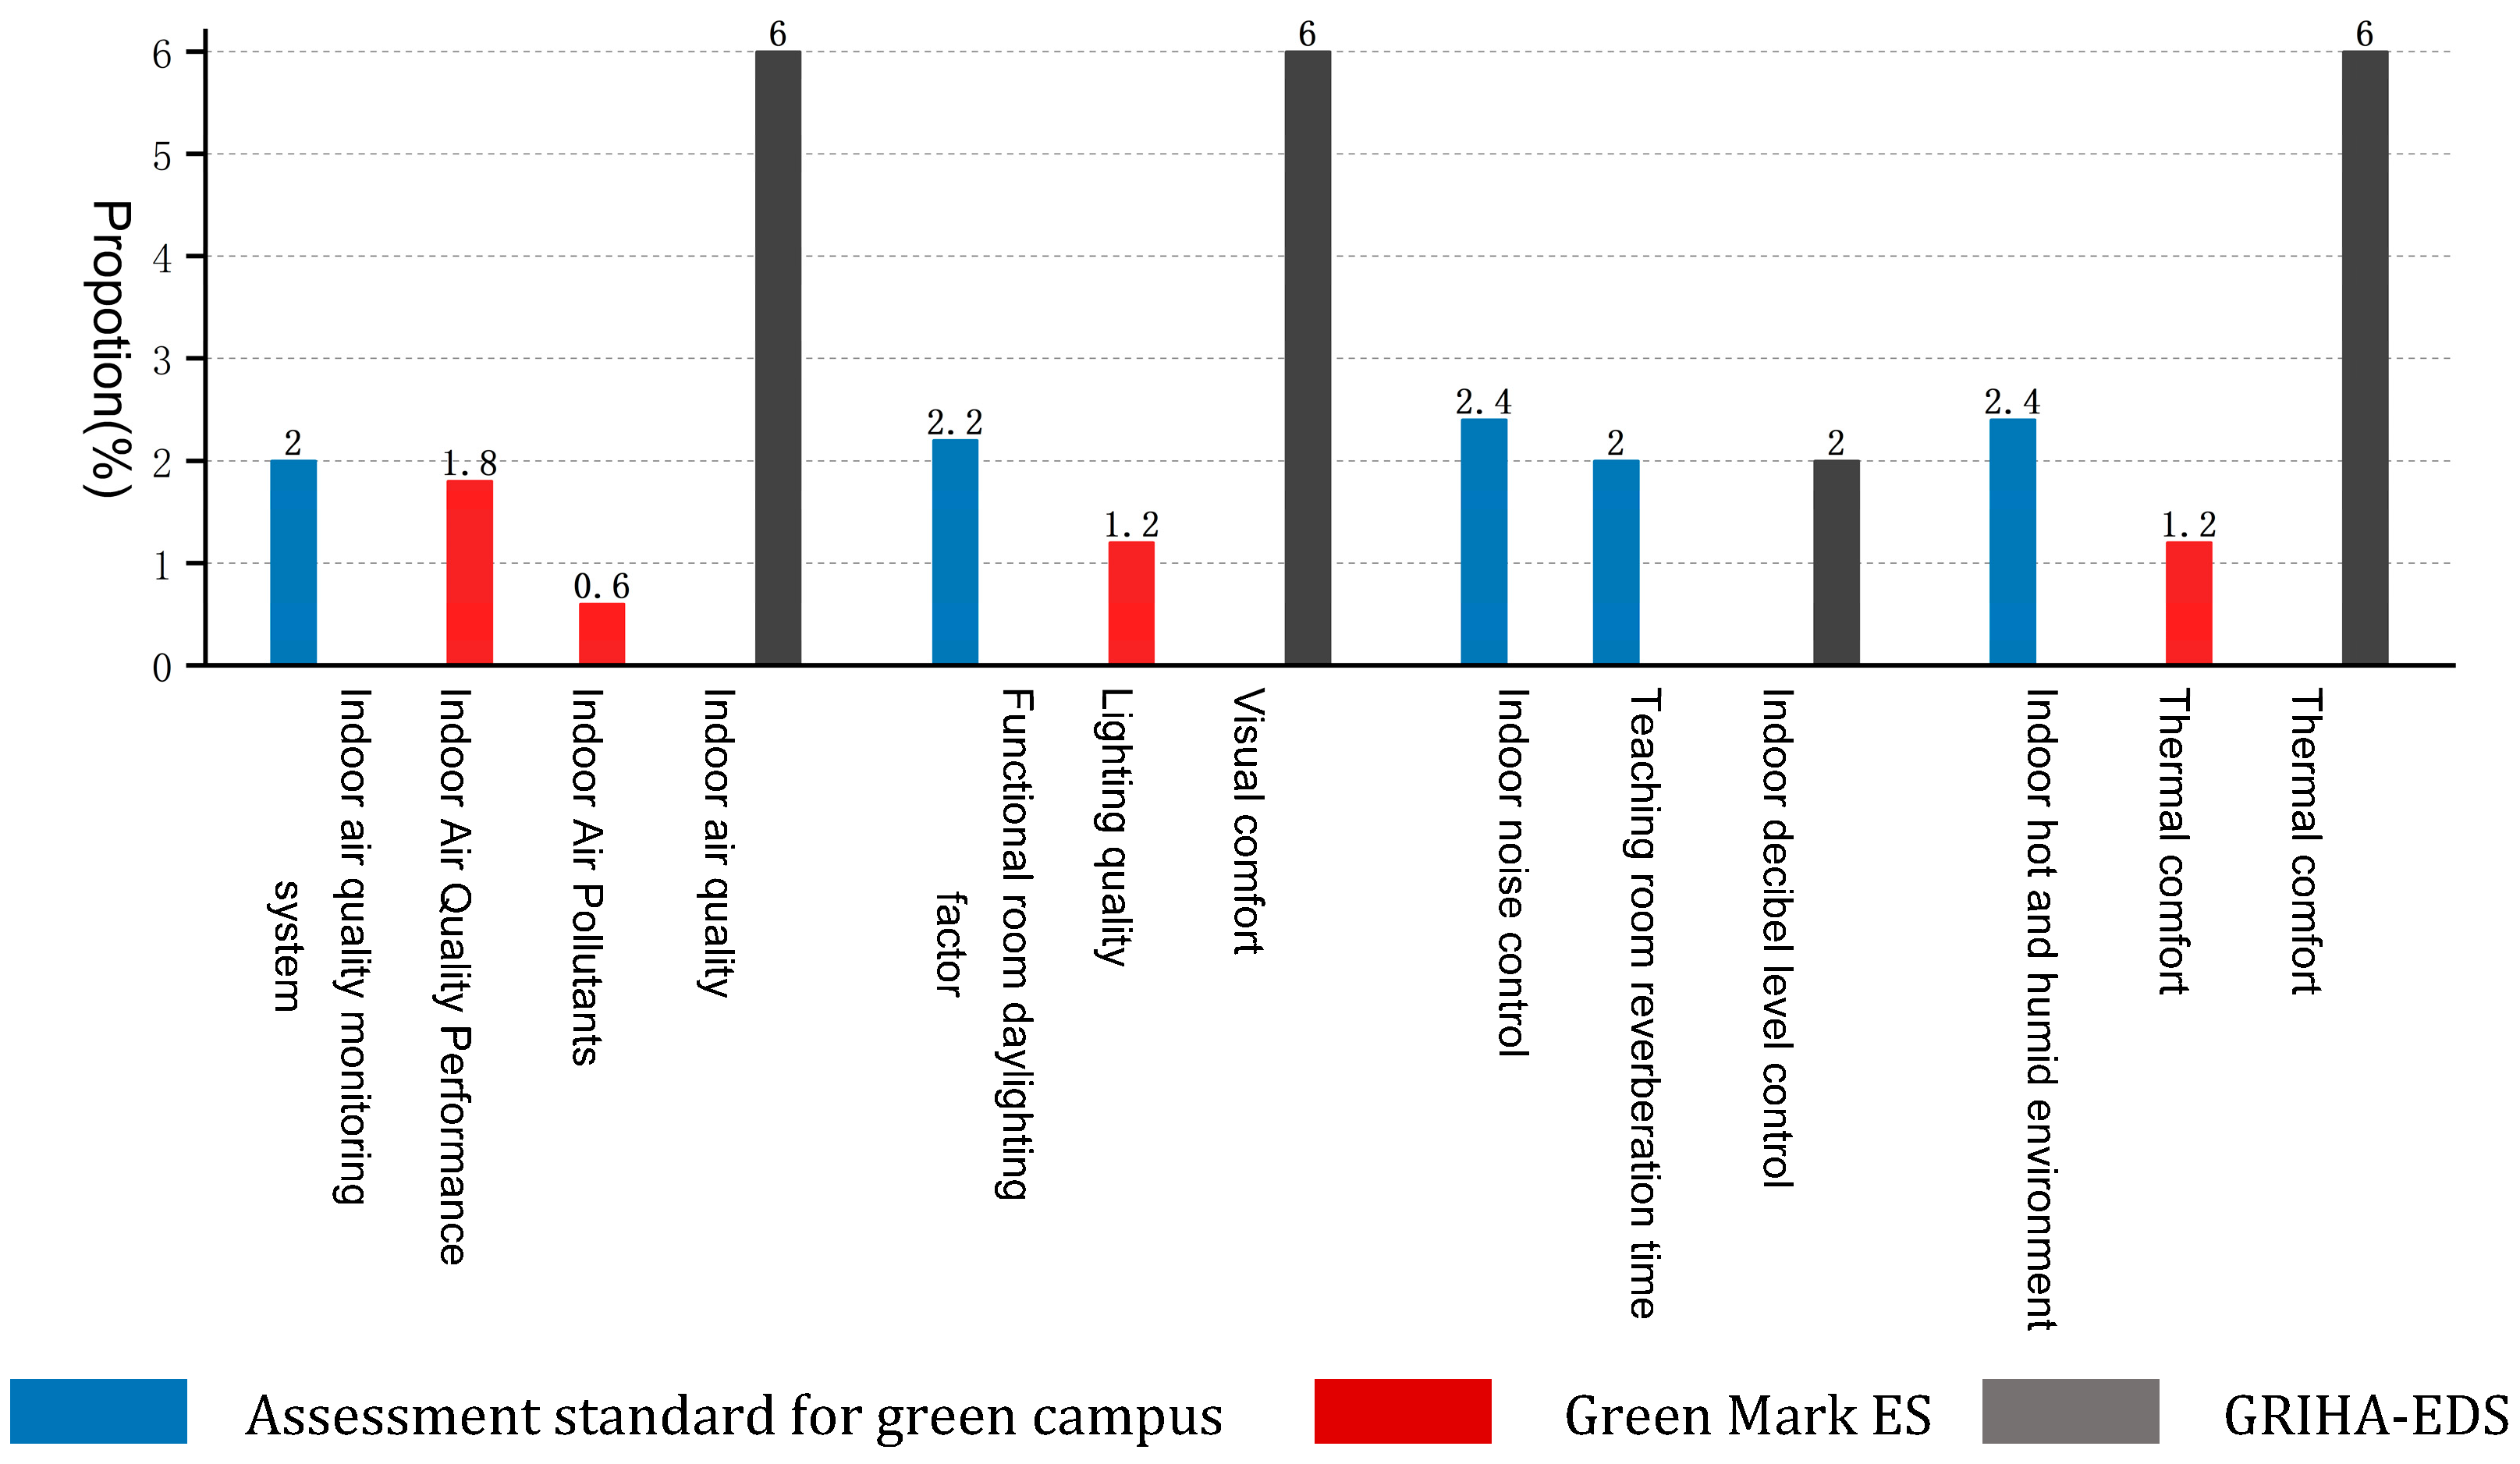
The indoor environment is divided into indoor air quality, indoor light environment, indoor acoustic environment, indoor thermal environment, etc. Green Mark ES and GRIHA-EDS focus on controlling pollutant sources to reduce air pollution sources. The Standard advocates real-time monitoring through an indoor air quality monitoring system and linkage with the ventilation system. The Standard uses daylighting measured by the coefficient; Green Mark ES uses the illuminance value to ensure adequate light environment comfort through natural lighting. GRIHA-EDS evaluates the indoor visual comfort through the total lighting area and the illuminance value of the living area, and its proportion is the highest of the three evaluation systems, up to 6%. The Standard and GRIHA-EDS put forward indoor noise control requirements, with a proportion of about 2%. The Standard also requires the reverberation time of teaching rooms to ensure an excellent indoor acoustic environment; Green Mark ES specifies the thermal comfort through temperature and humidity of air-conditioned rooms under comfortable conditions. The Standard is based on the “Evaluation standard for indoor thermal environment in civil buildings” to understand personnel’s satisfaction with the environment. GRIHA-EDS adopts “Post-Use Evaluation (POE)” to survey users’ satisfaction, which meanwhile uses multiple passive/active design strategies to evaluate indoor thermal comfort (Table 6).
Table 6.
Comparison of indoor environment indicators of the green campus evaluation systems.
In these four evaluation systems, except for the EEWH-EC system, which focuses on the overall environmental performance of the campus or community when it is established, it does not require indoor indicators. The rest are comprehensive evaluations of the indoor environment of campus buildings. The total weight of the Standard is close to GRIHA-EDS, at 11% and 13%, respectively; meanwhile, the corresponding proportion of Green Mark ES is relatively low, at 4.8% (Figure 9).
Figure 9.
Comparison of indoor environment index weights of the green campus evaluation systems.
3.4. Comparison of Indicators
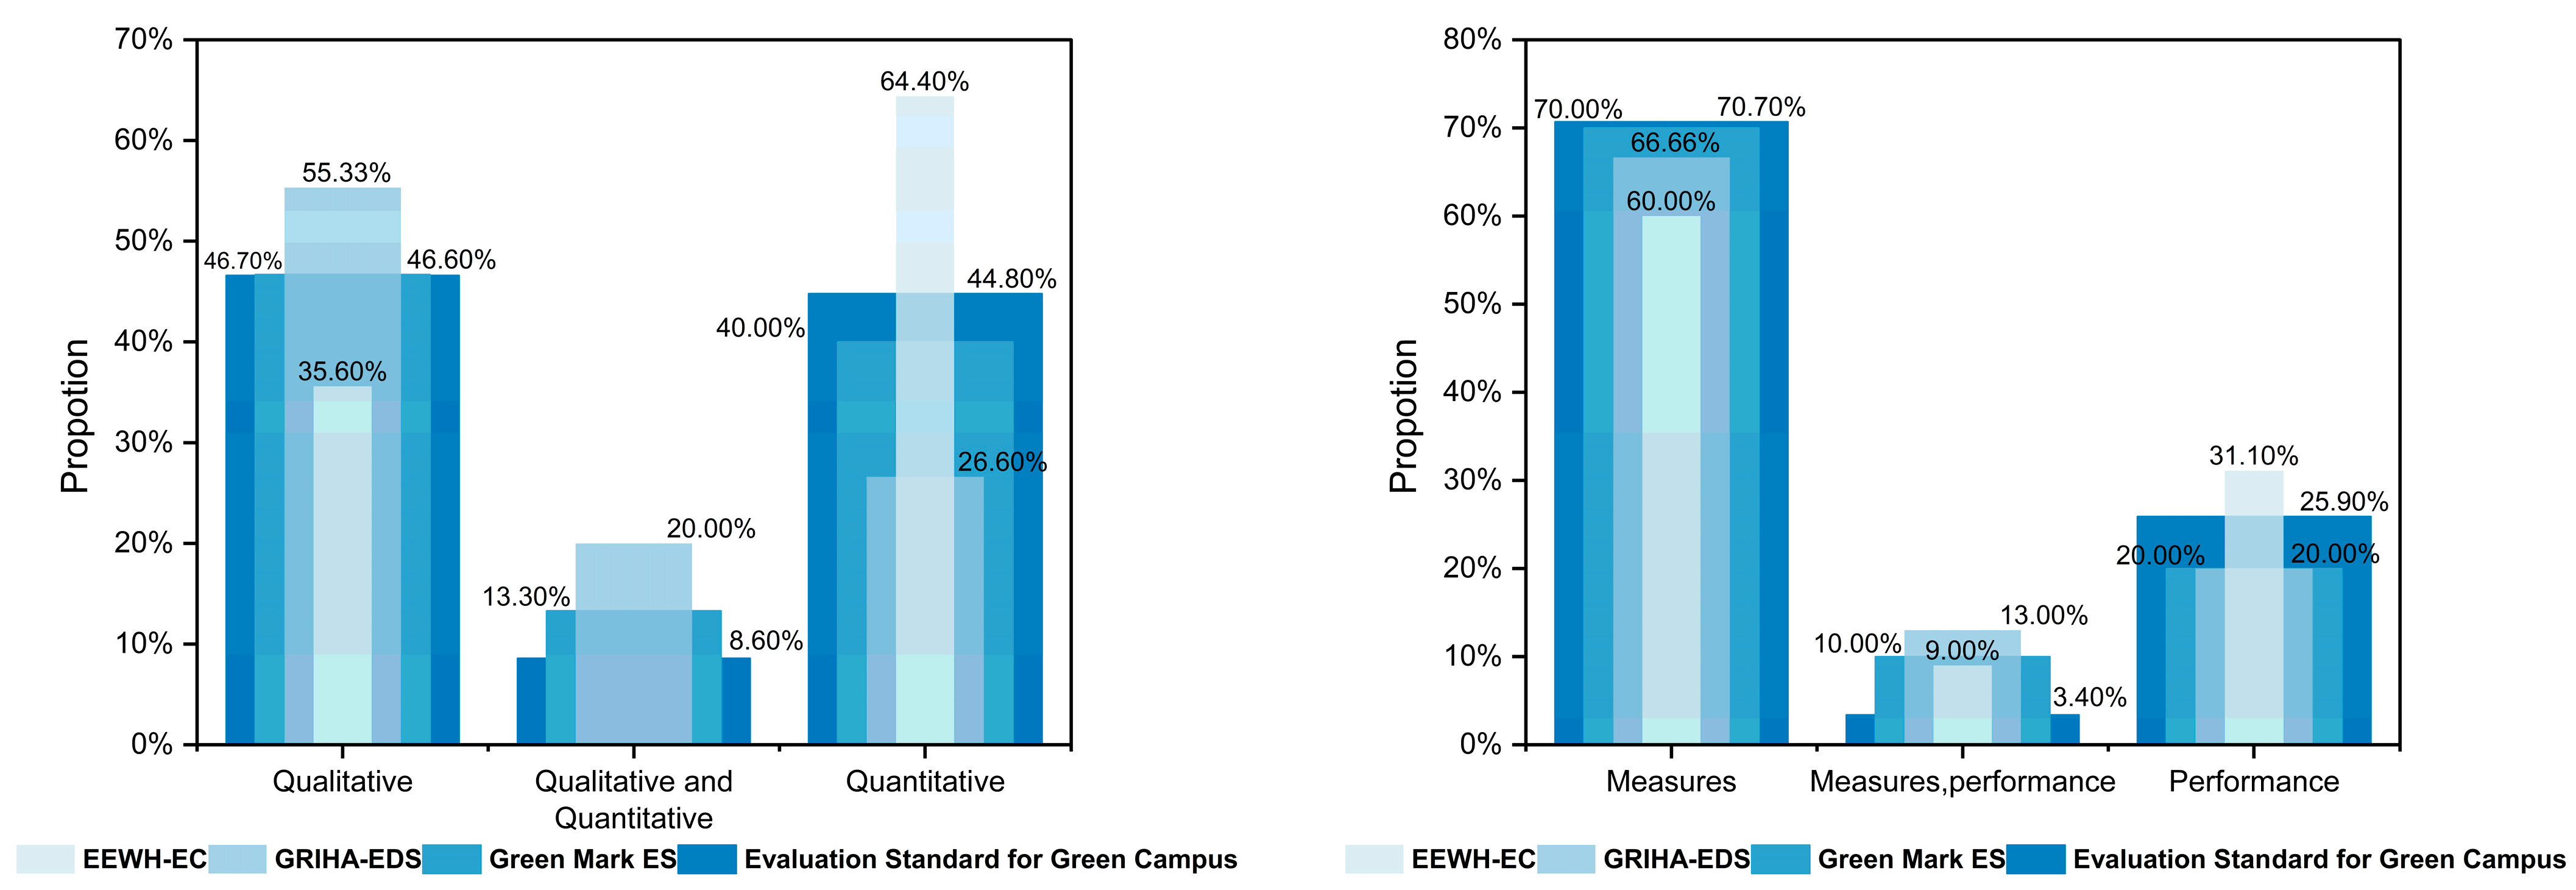
The Standard encompasses significantly more indicators than the other three systems, with broader thematic coverage. While its qualitative and quantitative indicators are roughly balanced in number, approximately 70.7% focus on technical measures and procedural compliance, with relatively limited emphasis on actual performance outcomes. This lack of streamlining and integration increases evaluation complexity and hinders practical implementation.
Green Mark ES adopts a more balanced approach: 13.3% of its indicators incorporate both qualitative and quantitative dimensions, while 10% evaluate both implementation measures and performance outcomes. Compared to the alternatives, its framework is more streamlined yet remains comprehensive in scope.
GRIHA-EDS predominantly employs qualitative, process-oriented indicators with limited quantitative metrics, indicating a need for enhanced precision and measurability. EEWH-EC differs fundamentally as it targets both campuses and ecological communities, emphasizing outdoor thermal environments and urban heat island mitigation while excluding indoor environmental assessment. Its indicator composition comprises 35.6% qualitative and 64.4% quantitative metrics, with performance-based evaluation accounting for 31.1% of the total, rendering it more operationally robust and scientifically rigorous than the other systems (Figure 10).
Figure 10.
Comparison of indicator attribute proportions across the four evaluation systems. Note: Proportions are calculated based on the count of disaggregated indicators, not on indicator weight shares.
4. Discussion
4.1. Interpretation of Core Findings
The multilevel comparison reveals three core differences between the four systems. These findings both align with the general consensus of existing comparative research and provide targeted, climate-specific supplementary evidence for green campus evaluation in hot-humid climatic zones.
First, the operational mechanism divergence reflects different policy logics. Previous cross-national studies on green building assessment systems have widely documented that governance models—ranging from government-led incentive schemes to voluntary participation mechanisms—are a core factor shaping the promotion effectiveness and adoption rate of certification systems [32]. This pattern has also been observed in campus-level sustainability assessment frameworks [24]. This study further verifies this general pattern at the campus-specific scale within a unified hot-humid climatic context. Specifically, Singapore and India adopt government-led incentive models, where financial subsidies and public grants directly drive campus participation, while mainland China and Taiwan, China follow voluntary participation mechanisms relying on institutional awareness. This explains why the Standard has lower adoption rates despite its more comprehensive indicator system. Different from prior cross-climatic-zone studies that focus on general framework differences, this within-zone comparison further reveals that in regions with high cooling energy pressure, the absence of targeted economic incentives poses a more prominent barrier to advancing green campus transition.
Second, the significant gap in energy indicator weight reflects different priorities in green campus evaluation. Existing comparative studies have noted that the weight allocation of energy-related indicators varies greatly across national evaluation systems, which is closely associated with regional climatic conditions and national energy development strategies [33]. For China’s unified national assessment standard, its applicability across different climatic zones has also been widely discussed in existing research [30]. This study further clarifies the discrepancy in scope and disaggregation granularity between broad energy-resource composite categories and pure building energy efficiency indicators and quantifies the specific weight gap in hot-humid scenarios. The Standard balances multiple goals, including planning, ecology, education, and management, which aligns with China’s comprehensive green campus development concept. However, the low proportion of pure energy efficiency indicators (11.2%) is not conducive to guiding campuses in hot-humid climatic zones to address their largest energy consumption source: space cooling. In contrast, Singapore’s Green Mark ES, with 47% weight on energy efficiency, forms a strong performance-oriented guidance, which is particularly suitable for tropical regions with year-round cooling demand. Unlike previous cross-climatic-zone benchmarking that provides only general reference, this quantitative weight comparison within the same climatic zone offers more targeted evidence for the regional adjustment of China’s unified national standard.
Third, the shift from measure-oriented to performance-oriented evaluation represents the development trend of green certification systems. The academic community has reached a basic consensus that performance-based evaluation can better guarantee actual environmental benefits and avoid the “form over substance” problem of purely compliance-based assessment [25,26]. This evolutionary trend has been fully verified in the field of commercial and residential green building evaluation, but relevant empirical evidence targeting campus-specific evaluation systems remains limited. This study provides empirical evidence for this evolutionary trend in the campus evaluation field, based on indicator statistics from four representative systems in hot-humid zones. The Standard’s 70.7% measure-oriented indicators ensure evaluation convenience and compliance clarity, but may lead to the risk of “form over substance” where campuses complete required measures without achieving actual environmental performance. The higher proportion of performance-oriented indicators in EEWH-EC and Green Mark ES reflects a more mature evaluation philosophy that focuses on actual outcomes rather than procedural compliance. In particular, for hot-humid regions where cooling energy consumption and indoor-outdoor thermal comfort are highly dependent on actual operational effects, the shift to performance-oriented evaluation has more prominent practical value for improving the real benefits of green campus construction—a point that has not been fully discussed in previous regional studies.
4.2. Research Contributions and Novelty
This study makes two main contributions to the field of green campus evaluation, directly addressing the research gaps identified in the introduction.
Theoretically, it breaks through the traditional cross-climatic-zone comparison paradigm that dominates existing research and constructs a four-level comparative framework specifically tailored to hot-humid climatic zones. By focusing on climate-adaptive indicators and establishing a standardized indicator mapping protocol, this framework improves the pertinence of evaluation standard comparative research and provides a replicable methodological reference for regional standard benchmarking studies.
Practically, this study quantifies the weight differences of climate-adaptive indicators across four mature systems and clarifies the specific gaps of China’s unified national standard in terms of energy indicator proportion, planning climate adaptability, and evaluation orientation. The proposed optimization path, covering procedural streamlining, weight structure adjustment, and climate-adaptive indicator supplementation, provides operable quantitative evidence and technical support for the revision of regional green campus evaluation standards in South China.
4.3. Methodological Limitations and Robustness
Several methodological limitations should be acknowledged when interpreting the findings. First, the sample size is limited to four systems. Although they represent the most mature systems in hot-humid zones, excluding systems from Malaysia, Thailand, and other Southeast Asian countries may limit the comprehensiveness of the comparison. However, the core conclusion regarding the insufficient climate adaptability of the Standard remains robust, as it is supported by comparison with three benchmark systems with different institutional backgrounds.
Second, the weight comparison has certain constraints. The exclusion of prerequisite items may slightly underestimate the importance of basic mandatory indicators in actual certification practice. In addition, the inability to decompose individual indicator weights for EEWH-EC limits the depth of fine-grained subindicator comparison. Nevertheless, this does not affect the core conclusion that the Standard has insufficient energy weight and lacks targeted hot-humid adaptive indicators, as this finding is consistently supported by quantitative comparison with Green Mark ES and GRIHA-EDS. It should be further clarified that EEWH-EC was not originally developed for higher education campuses, and its indicator system lacks campus-specific dimensions such as education promotion and scientific research facility management. Therefore, this study only conducts comparative analysis on three general built environment dimensions—planning, energy conservation, and outdoor environment—and does not extend the comparison to campus-specific functional dimensions.
Third, this study is primarily based on textual comparative analysis of official standard documents and has not conducted empirical validation of the proposed optimization framework through actual campus case studies or expert consultation. The current findings focus on structural differences in indicator systems and weight allocation logic, while the practical applicability, scoring rationality, and implementation effects of the optimized framework in real campus scenarios remain to be further verified.
This limitation is bounded by the research scope and objectives of the present work. The core purpose of this study is to identify climate adaptability gaps in China’s current standard through systematic cross-system benchmarking and to propose a directional optimization framework and indicator adjustment scheme. The theoretical comparative analysis provides a necessary methodological basis and reference system for subsequent empirical research. Future work will carry out multi-case empirical validation and expert Delphi consultation to calibrate indicator weights and thresholds and further improve the operability and scientific validity of the regional evaluation system.
4.4. International Relevance
Although this study takes China’s national standard as the primary optimization object, its findings have broader reference value for sustainable campus development in global hot-humid climatic zones. First, the proposed multilevel comparative framework can be extended to Southeast Asia, Central Africa, and South America, providing a methodological template for regional green campus standard formulation.
Second, the climate-adaptive indicator optimization directions—including sponge campus construction, natural ventilation performance evaluation, building orientation assessment, and outdoor heat island mitigation—are common demands for all hot-humid zones. These indicator schemes can be adapted and adopted by countries at different development stages to improve the regional adaptability of their evaluation systems.
Third, the comparative analysis of different governance models (incentive-driven vs. voluntary) provides policy insights for governments in different regions. For developing countries with limited institutional awareness, establishing appropriate economic incentives may be more effective than purely voluntary certification mechanisms in promoting green campus construction.
5. Recommendations
Targeting three core gaps identified through the multilevel comparative analysis—insufficient incentive-driven governance mechanisms, mismatched energy indicator weights, and a measure-dominated evaluation orientation with weak climate adaptability—this section proposes targeted optimization suggestions for regional green campus evaluation standards in hot-humid climatic zones of China.
5.1. Streamline the Certification Process
In response to the cumbersome administrative review links and low operational efficiency of the current certification system, careful calibration is essential: excessive complexity may deter stakeholder participation, whereas oversimplified processes risk compromising the credibility of outcomes. For green campus evaluation systems in hot-humid areas, it is advisable to establish professional certification bodies to oversee the entire evaluation workflow, thereby circumventing protracted administrative coordination between certifying agencies and governmental authorities. To enhance operational efficiency, a streamlined approach integrating online application submission, designated expert review, and governmental record filing is recommended. Specifically, permanent indicators such as site planning and spatial layout can be directly inherited from the design phase in the operation phase evaluation, reducing repeated verification work.
5.2. Strengthen Application Promotion
Consistent with the finding that voluntary participation models are associated with lower adoption rates, the current evaluation system in mainland China currently lacks operational mechanisms with broad stakeholder engagement, and green building assessments on most campuses remain confined to individual buildings, with limited institutional adoption of the holistic campus-level standard. Consequently, when establishing green campus evaluation frameworks for hot-humid areas, stakeholders should collaborate with educational institutions and governmental bodies to develop regional promotional campaigns and incentive structures. Fiscal subsidies, award recognition, and policy preference can be adopted to actively engage faculty, students, and campus managers in green campus development and certification processes, drawing on the successful incentive models of Singapore and India.
5.3. Optimizing Indicator Weights
In view of the significant gap in pure building energy efficiency indicator weight between the Standard and benchmark systems in hot-humid zones, the weight structure should be adjusted to match the actual energy consumption characteristics of campuses in hot-humid regions. Within the Standard, the broad “Energy and Resources” category accounts for 25% of the total weight, but pure building energy efficiency indicators only account for 11.2% after disaggregation, which is far lower than the 47% energy efficiency weight of Singapore’s Green Mark ES. Given that cooling energy consumption accounts for the largest proportion of campus energy use in hot-humid areas, it is recommended to appropriately increase the weight of energy-saving indicators, particularly those related to passive cooling design and air-conditioning system efficiency. It is suggested to raise the proportion of pure energy efficiency indicators to 20–25% to strengthen performance-oriented guidance.
5.4. Improve Indicator Content
Given China’s vast territory spanning diverse climatic zones, the unified evaluation standard exhibits limited regional adaptability. When establishing green campus evaluation systems for hot-humid areas, it is imperative to integrate local climatic factors with proven evaluation methodologies from comparable climatic contexts to refine indicator specifications.
First, the abundant precipitation in hot-humid areas provides favorable conditions for sponge campus implementation. It is recommended that sponge campus development—encompassing rainwater infrastructure, stormwater recycling, and flood mitigation—be incorporated as a scored element to comprehensively assess campus water management. Regarding site planning, the framework should adopt methodologies assessing building orientation and spacing, while covered pedestrian corridors should be added to circulation indicators to address intense solar radiation and high temperatures.
Second, for energy-related indicators, both content scope and weights should be expanded. Given that energy consumption in these regions concentrates primarily in summer air-conditioning, the system should emphasize natural ventilation strategies, assess the proportion of non-air-conditioned spaces, and prioritize the integration of passive and active technologies.
Third, within outdoor environmental indicators, the assessment of green space systems warrants optimization. The favorable growing conditions should be leveraged by placing greater emphasis on vertical greening, rooftop gardens, and other vegetated interfaces to enhance outdoor thermal comfort.
Finally, given extensive reliance on air-conditioning, indoor air quality and thermal comfort are significantly impacted by mechanical systems. Therefore, evaluation criteria should incorporate physical environment monitoring and post-occupancy evaluation, with particular focus on occupant health and thermal satisfaction, to shift from measure-based compliance to actual performance verification.
6. Conclusions
Against the background of insufficient climate adaptability of China’s unified green campus evaluation standard in hot-humid regions, this study selects four representative evaluation systems with distinct governance models from tropical and subtropical hot-humid climatic zones and conducts a systematic four-level comparative analysis covering general framework, category structure, core dimensions, and indicator attributes.
Three core findings are identified. First, operational mechanisms differ substantially across systems: government-led incentive models demonstrate stronger promotion effectiveness, while voluntary participation models are associated with relatively lower adoption motivation. Second, the weight allocation of energy efficiency indicators in the Standard is significantly imbalanced, and the system lacks targeted hot-humid adaptive indicators in dimensions such as building orientation assessment, natural ventilation performance, and sponge campus construction. Third, the evaluation philosophy of the Standard is still dominated by measure-oriented qualitative assessment, while benchmark systems represented by EEWH-EC have shifted more toward performance-oriented quantitative evaluation, exhibiting stronger scientific rigor and result guidance.
On the whole, this study provides quantitative evidence and a systematic analytical framework for the climate-adaptive optimization of regional green campus evaluation standards. Future research will expand the sample of regional evaluation systems, introduce multi-case empirical calibration and expert Delphi consultation to verify the operability of the optimized framework, and further improve the indicator system and weight setting suitable for hot-humid areas in China.
Author Contributions
Conceptualization, supervision, project administration, writing—review and editing, X.W.; Writing—original draft, writing—review and editing, Y.H. (Yiwei He); Visualization, writing—review and editing, Y.H. (Yuping Huang); Project administration, validation, W.G.; Data curation, methodology, formal analysis, S.Y.; Resources, visualization, G.Z.; Writing—review and editing, visualization, L.W.; Project administration, writing—review and editing, X.L. All authors have read and agreed to the published version of the manuscript.
Funding
This research was funded by the Guangdong Provincial Planning Project for Philosophy and Social Science (Grant No. GD25YYS38); the Guangzhou Philosophy and Social Science Planning 2026 Annual Project (Grant No. 2026GZYB44); the Jiangmen Philosophy and Social Science Planning 2026 Annual Project (Grant No. JM2026B15); the Fundamental Research Funds for the Central Universities (Grant No. QNZD2603); Project Commissioned by Enterprises and Institutions, South China University of Technology (Grant No. x2jzD8197120); and the State Key Laboratory of Subtropical Building and Urban Science, South China University of Technology (Grant No. 2024ZB06).
Data Availability Statement
The original contributions presented in this study are included in the article. Further inquiries can be directed to the corresponding author.
Conflicts of Interest
Authors Yuping Huang and Weihong Guo were employed by the company Architectural Design & Research Institute Co., Ltd. The remaining authors declare that the research was conducted in the absence of any commercial or financial relationships that could be construed as a potential conflict of interest.
References
- Zainul Abidin, N. Investigating the Awareness and Application of Sustainable Construction Concept by Malaysian Developers. Habitat Int. 2010, 34, 421–426. [Google Scholar] [CrossRef] [Scilit]
- Liu, X.; Li, Z.; He, B.-J. Synergistic risks of summertime extreme heat and air pollution: Evidence from a suburban area in Shanghai, China. Urban Clim. 2026, 68, 103081. [Google Scholar] [CrossRef] [Scilit]
- Liu, X.; He, J.; Xiong, K.; Liu, S.; He, B.-J. Identification of factors affecting public willingness to pay for heat mitigation and adaptation: Evidence from Guangzhou, China. Urban Clim. 2023, 48, 101405. [Google Scholar] [CrossRef] [Scilit]
- Crippa, M.; Guizzardi, D.; Pagani, F.; Banja, M.; Muntean, M.; Schaaf, E.; Quadrelli, R.; Martin, A.R.; Taghavi-Moharamli, P.; Köykkä, J.; et al. (Eds.) GHG Emissions of All World Countries: 2025; Publications Office: Luxembourg, 2025; ISBN 978-92-68-31425-8. [Google Scholar]
- U.S. Energy Information Administration (EIA). Available online: https://www.eia.gov/international/rankings/country/ESH?pid=44&aid=2&f=A&y=01%2F01%2F2024&u=0&v=none&pa=44 (accessed on 8 April 2026).
- Li, Y.; Chen, H.; Yu, P.; Yang, L. Development and Challenges of Low-Carbon Cities in China: Current Situation, Influencing Factors, and Sustainability Strategies. Buildings 2025, 15, 350. [Google Scholar] [CrossRef] [Scilit]
- Ministry of Education of the People’s Republic of China. Number of Students in Higher Education Institutions. Available online: http://www.moe.gov.cn/jyb_sjzl/moe_560/2023/quanguo/202501/t20250120_1176256.html (accessed on 7 April 2026).
- Tan, H.; Chen, S.; Shi, Q.; Wang, L. Development of Green Campus in China. J. Clean. Prod. 2014, 64, 646–653. [Google Scholar] [CrossRef] [Scilit]
- Alshuwaikhat, H.M.; Abubakar, I. An Integrated Approach to Achieving Campus Sustainability: Assessment of the Current Campus Environmental Management Practices. J. Clean. Prod. 2008, 16, 1777–1785. [Google Scholar] [CrossRef] [Scilit]
- Velazquez, L.; Munguia, N.; Platt, A.; Taddei, J. Sustainable University: What Can Be the Matter? J. Clean. Prod. 2006, 14, 810–819. [Google Scholar] [CrossRef] [Scilit]
- Stephens, J.C.; Hernandez, M.E.; Román, M.; Graham, A.C.; Scholz, R.W. Higher Education as a Change Agent for Sustainability in Different Cultures and Contexts. Int. J. Sustain. High. Educ. 2008, 9, 317–338. [Google Scholar] [CrossRef] [Scilit]
- Yuan, X.; Zuo, J.; Huisingh, D. Green Universities in China—What Matters? J. Clean. Prod. 2013, 61, 36–45. [Google Scholar] [CrossRef] [Scilit]
- Haiying, Z.; Liyun, L.; Hongfei, G. Brief Analysis of the Construction of Green Campus in Universities in the New Era. High. Educ. Res. 2023, 8, 92–95. [Google Scholar] [CrossRef] [Scilit]
- Sugiarto, A.; Lee, C.-W.; Huruta, A.D. A Systematic Review of the Sustainable Campus Concept. Behav. Sci. 2022, 12, 130. [Google Scholar] [CrossRef] [Scilit] [PubMed]
- Wang, Y.; Shi, H.; Sun, M.; Huisingh, D.; Hansson, L.; Wang, R. Moving towards an Ecologically Sound Society? Starting from Green Universities and Environmental Higher Education. J. Clean. Prod. 2013, 61, 1–5. [Google Scholar] [CrossRef] [Scilit]
- Ankareddy, S.; Dorfleitner, G.; Zhang, L.; Ok, Y.S. Embedding Sustainability in Higher Education Institutions: A Review of Practices and Challenges. Clean. Environ. Syst. 2025, 17, 100279. [Google Scholar] [CrossRef] [Scilit]
- Oliveira, M.C.; Proença, J. Sustainable Campus Operations in Higher Education Institutions: A Systematic Literature Review. Sustainability 2025, 17, 607. [Google Scholar] [CrossRef] [Scilit]
- Genta, C.; Favaro, S.; Sonetti, G.; Fracastoro, G.V.; Lombardi, P. Quantitative Assessment of Environmental Impacts at the Urban Scale: The Ecological Footprint of a University Campus. Environ. Dev. Sustain. 2022, 24, 5826–5845. [Google Scholar] [CrossRef] [Scilit]
- Qiu, Y.; Dong, Y. Life Cycle Assessment of Campuses: A Systematic Review. Energy Build. 2024, 319, 114455. [Google Scholar] [CrossRef] [Scilit]
- Hajrasouliha, A. Campus Score: Measuring University Campus Qualities. Landsc. Urban Plan. 2017, 158, 166–176. [Google Scholar] [CrossRef] [Scilit]
- Shuqin, C.; Minyan, L.; Hongwei, T.; Xiaoyu, L.; Jian, G. Assessing Sustainability on Chinese University Campuses: Development of a Campus Sustainability Evaluation System and Its Application with a Case Study. J. Build. Eng. 2019, 24, 100747. [Google Scholar] [CrossRef] [Scilit]
- Zhu, B. A Comparative Study on Campus Evaluation Standards for Green Campus Construction. Ph.D. Thesis, The University Of Kitakyushu, Kitakyushu, Japan, 2021. [Google Scholar]
- Higher-Education-Sustainability-Assessment-Frameworks-Compared. Available online: https://stars.aashe.org/wp-content/uploads/2020/07/Higher-Education-Sustainability-Assessment-Frameworks-Compared.pdf (accessed on 1 April 2026).
- Dawodu, A.; Dai, H.; Zou, T.; Zhou, H.; Lian, W.; Oladejo, J.; Osebor, F. Campus Sustainability Research: Indicators and Dimensions to Consider for the Design and Assessment of a Sustainable Campus. Heliyon 2022, 8, e11864. [Google Scholar] [CrossRef] [Scilit] [PubMed]
- Basheer, N.; Ahmed, V.; Bahroun, Z.; Anane, C. Exploring Sustainability Assessment Practices in Higher Education: A Comprehensive Review through Content and Bibliometric Analyses. Sustainability 2024, 16, 5799. [Google Scholar] [CrossRef] [Scilit]
- Alghamdi, N.; den Heijer, A.; de Jonge, H. Assessment Tools’ Indicators for Sustainability in Universities: An Analytical Overview. Int. J. Sustain. High. Educ. 2017, 18, 84–115. [Google Scholar] [CrossRef] [Scilit]
- Foo, K.Y. A Vision on the Role of Environmental Higher Education Contributing to the Sustainable Development in Malaysia. J. Clean. Prod. 2013, 61, 6–12. [Google Scholar] [CrossRef] [Scilit]
- Parvez, N.; Agrawal, A. Assessment of Sustainable Development in Technical Higher Education Institutes of India. J. Clean. Prod. 2019, 214, 975–994. [Google Scholar] [CrossRef] [Scilit]
- de Castro, R.; Jabbour, C.J.C. Evaluating Sustainability of an Indian University. J. Clean. Prod. 2013, 61, 54–58. [Google Scholar] [CrossRef] [Scilit]
- Dong, C.; Liu, P. Analysis of the Development of Green Building Assessment Systems and Their Applicability in China. Manag. Sci. Eng. 2025, 14, 693–704. [Google Scholar]
- Liu, L. Study on the Holistic Design Strategy of GreenUniversity Campus in Hot and Humid Areas. Ph.D. Thesis, South China University of Technology, Guangzhou, China, 2017. [Google Scholar]
- Li, Y.; Chen, X.; Wang, X.; Xu, Y.; Chen, P.-H. A Review of Studies on Green Building Assessment Methods by Comparative Analysis. Energy Build. 2017, 146, 152–159. [Google Scholar] [CrossRef] [Scilit]
- Varma, C.R.S.; Palaniappan, S. Comparision of Green Building Rating Schemes Used in North America, Europe and Asia. Habitat Int. 2019, 89, 101989. [Google Scholar] [CrossRef] [Scilit]
- Yang, S. Comparative Study on Green Campus Evaluation Systemsin Areas of Hot Summer and Warm Winter. Master’s Thesis, South China University of Technology, Guangzhou, China, 2018. [Google Scholar]

Disclaimer/Publisher’s Note: The statements, opinions and data contained in all publications are solely those of the individual author(s) and contributor(s) and not of MDPI and/or the editor(s). MDPI and/or the editor(s) disclaim responsibility for any injury to people or property resulting from any ideas, methods, instructions or products referred to in the content. |
© 2026 by the authors. Licensee MDPI, Basel, Switzerland. This article is an open access article distributed under the terms and conditions of the Creative Commons Attribution (CC BY) license.